Embed Size (px)
Citation preview
Horizons Cisco IBSG
Cisco Public Cisco IBSG © 2013 Cisco and/or its affiliates. All rights reserved. Internet Business Solutions Group 1
Horizons Cisco IBSG
The Financial Impact of BYOD A Model of BYOD’s Benefits to Global Companies May 2013
Horizons Cisco IBSG
Cisco Public Cisco IBSG © 2013 Cisco and/or its affiliates. All rights reserved. Internet Business Solutions Group 2
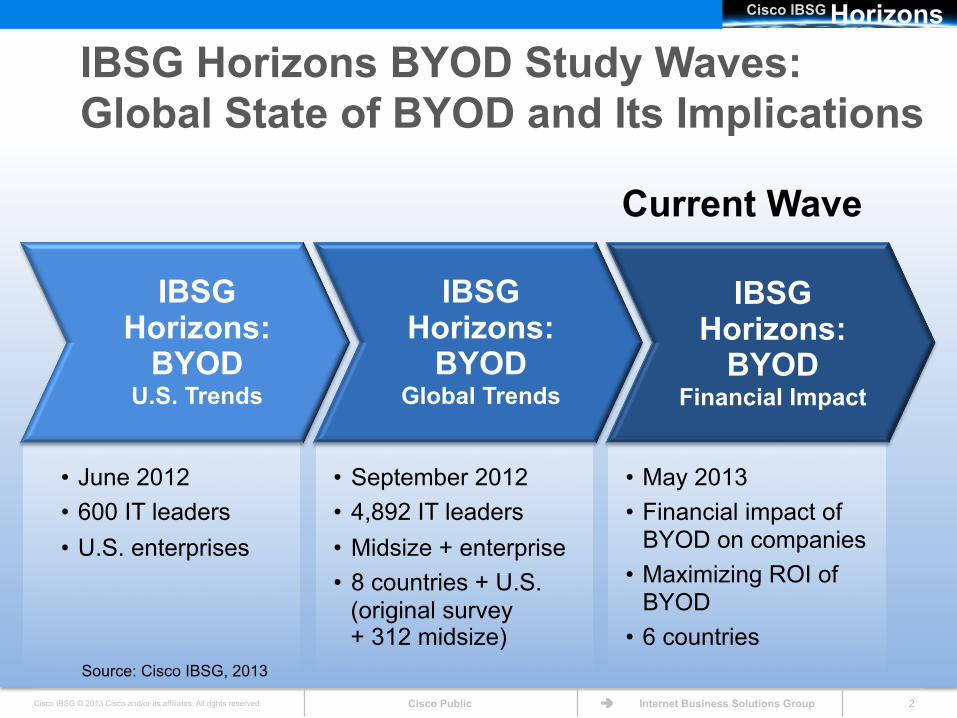
IBSG Horizons BYOD Study Waves: Global State of BYOD and Its Implications
Current Wave
• September 2012 • 4,892 IT leaders • Midsize + enterprise • 8 countries + U.S.
(original survey + 312 midsize)
IBSG Horizons:
BYOD Global Trends
• May 2013 • Financial impact of
BYOD on companies • Maximizing ROI of
BYOD • 6 countries
IBSG Horizons:
BYOD Financial Impact
• June 2012 • 600 IT leaders • U.S. enterprises
IBSG Horizons:
BYOD U.S. Trends
Source: Cisco IBSG, 2013
Horizons Cisco IBSG
Cisco Public Cisco IBSG © 2013 Cisco and/or its affiliates. All rights reserved. Internet Business Solutions Group 3
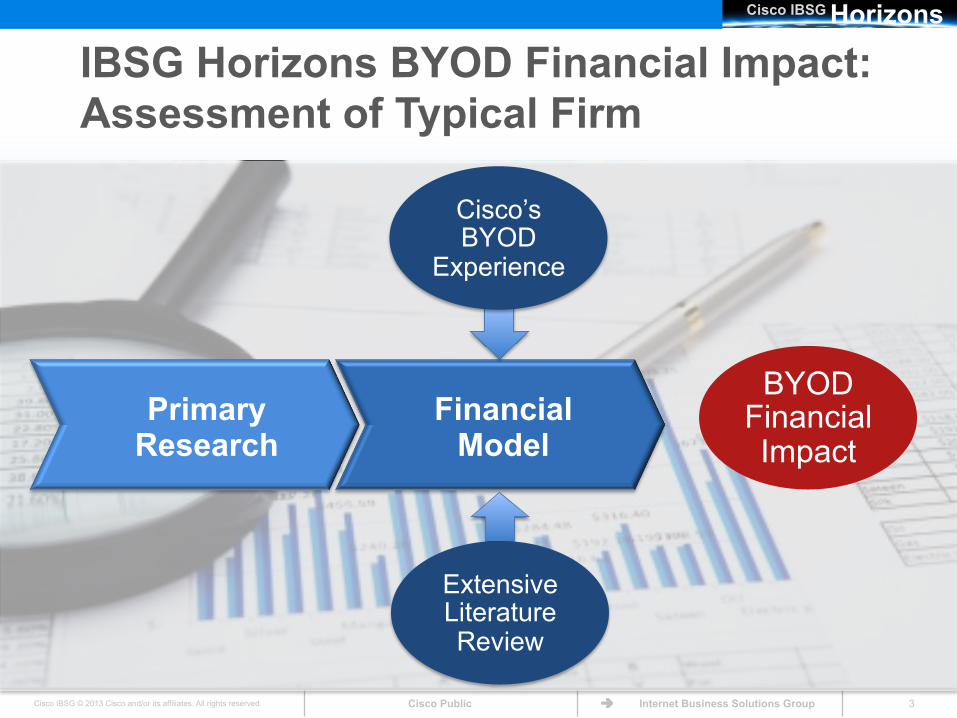
Financial Model
Primary Research
IBSG Horizons BYOD Financial Impact: Assessment of Typical Firm
BYOD Financial Impact
Cisco’s BYOD
Experience
Extensive Literature Review
Horizons Cisco IBSG
Cisco Public Cisco IBSG © 2013 Cisco and/or its affiliates. All rights reserved. Internet Business Solutions Group 4
Horizons Cisco IBSG
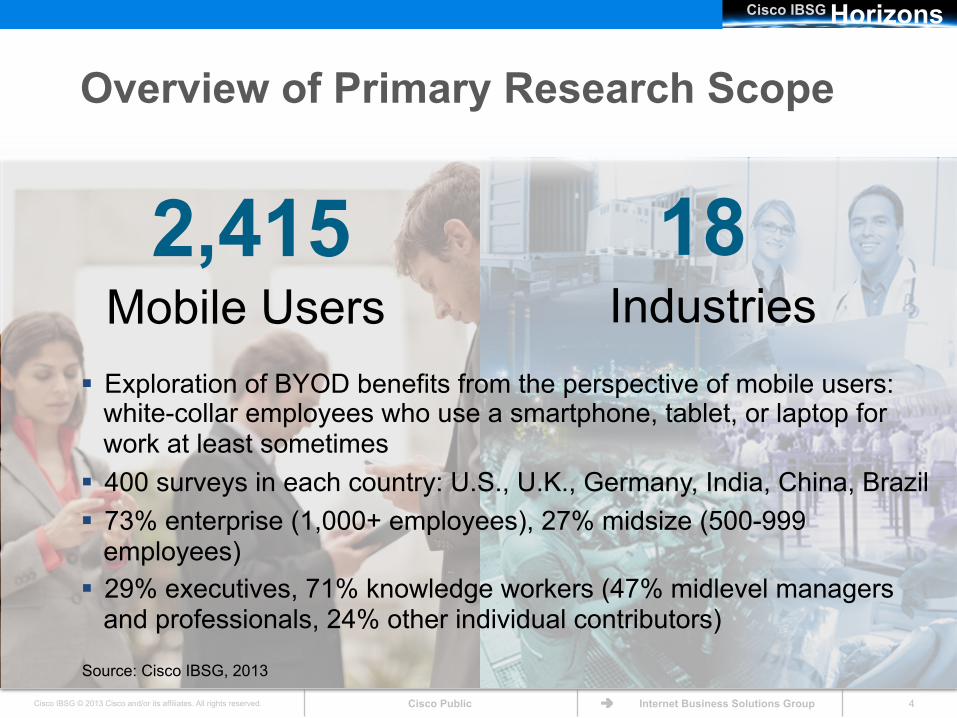
Overview of Primary Research Scope
2,415 18 Mobile Users Industries
Source: Cisco IBSG, 2013
Exploration of BYOD benefits from the perspective of mobile users: white-collar employees who use a smartphone, tablet, or laptop for work at least sometimes
400 surveys in each country: U.S., U.K., Germany, India, China, Brazil 73% enterprise (1,000+ employees), 27% midsize (500-999
employees) 29% executives, 71% knowledge workers (47% midlevel managers
and professionals, 24% other individual contributors)
Horizons Cisco IBSG
Cisco Public Cisco IBSG © 2013 Cisco and/or its affiliates. All rights reserved. Internet Business Solutions Group 5
Horizons Cisco IBSG
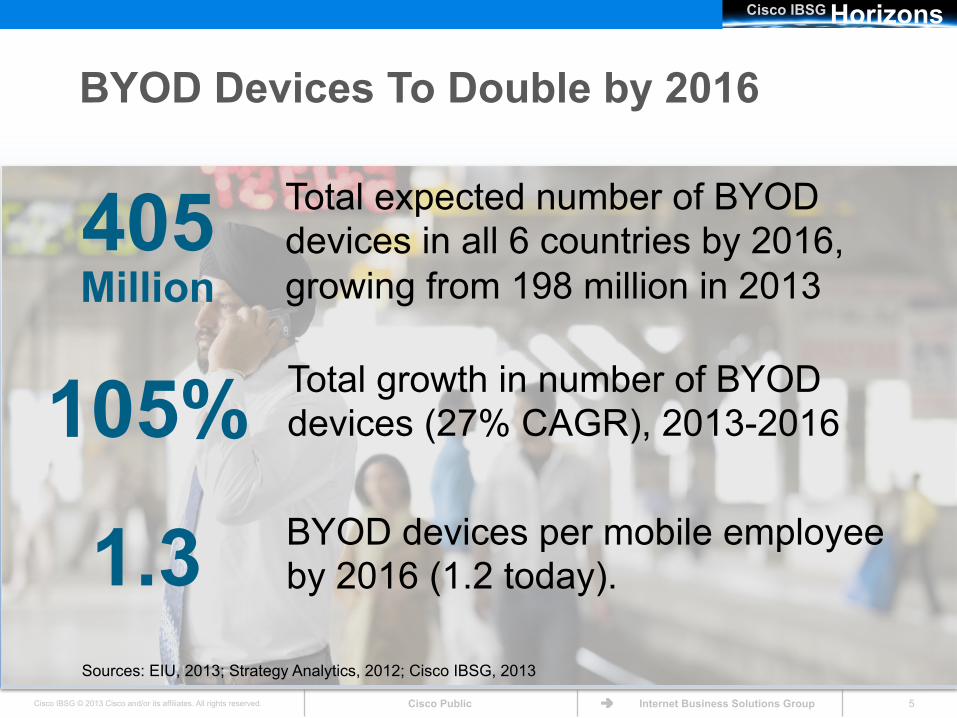
BYOD Devices To Double by 2016
405 Million
Total expected number of BYOD devices in all 6 countries by 2016, growing from 198 million in 2013
105% Total growth in number of BYOD devices (27% CAGR), 2013-2016
1.3 BYOD devices per mobile employee by 2016 (1.2 today).
Sources: EIU, 2013; Strategy Analytics, 2012; Cisco IBSG, 2013
Horizons Cisco IBSG
Cisco Public Cisco IBSG © 2013 Cisco and/or its affiliates. All rights reserved. Internet Business Solutions Group 6
63 71
32 12 11 8
166
108
76
25 18 12
China U.S. India Brazil Germany U.K. 0
25
50
75
100
125
150
175
2013 2016
Horizons Cisco IBSG
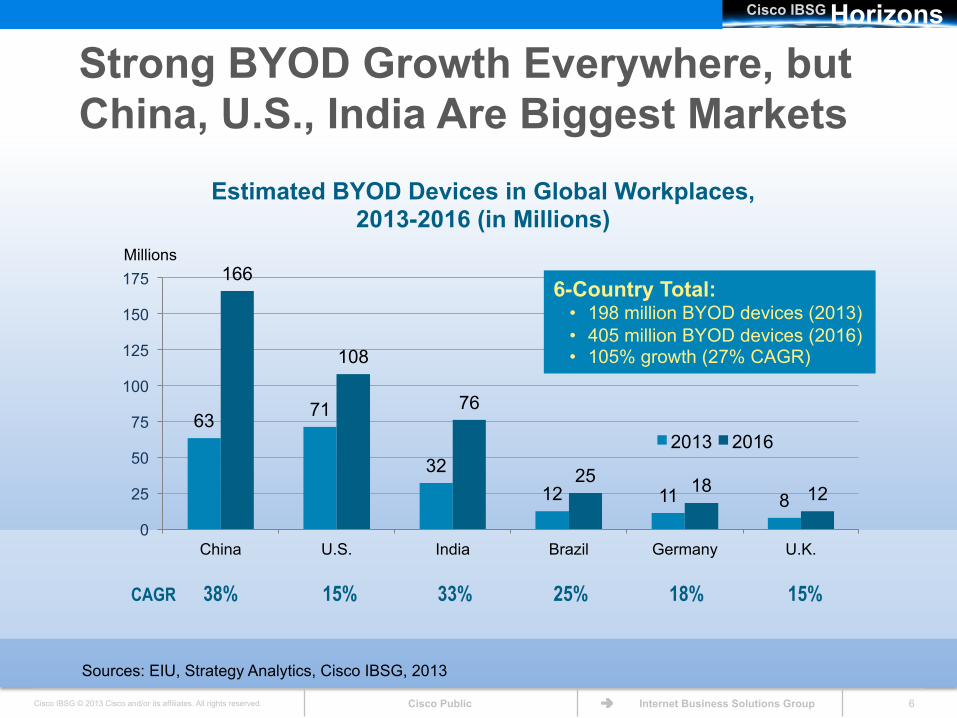
Strong BYOD Growth Everywhere, but China, U.S., India Are Biggest Markets
Sources: EIU, Strategy Analytics, Cisco IBSG, 2013
Estimated BYOD Devices in Global Workplaces, 2013-2016 (in Millions)
CAGR 38% 15% 33% 25% 18% 15%
Millions
6-Country Total: • 198 million BYOD devices (2013) • 405 million BYOD devices (2016) • 105% growth (27% CAGR)
Horizons Cisco IBSG
Cisco Public Cisco IBSG © 2013 Cisco and/or its affiliates. All rights reserved. Internet Business Solutions Group 7
Horizons Cisco IBSG
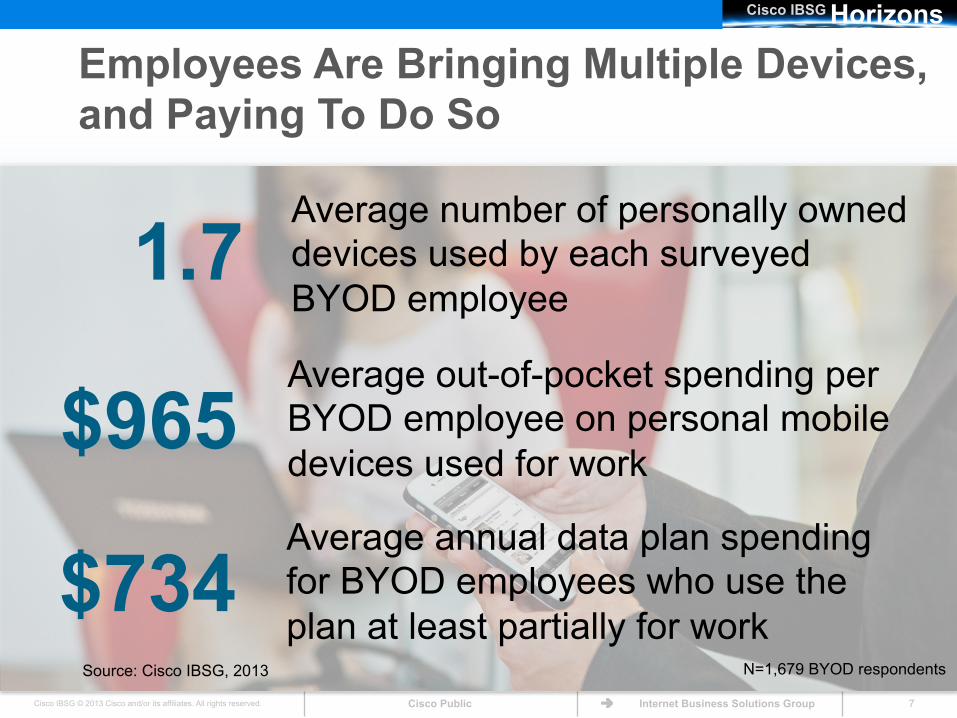
Employees Are Bringing Multiple Devices, and Paying To Do So
1.7 Average number of personally owned devices used by each surveyed BYOD employee
$965 Average out-of-pocket spending per BYOD employee on personal mobile devices used for work
Source: Cisco IBSG, 2013 N=1,679 BYOD respondents
$734 Average annual data plan spending for BYOD employees who use the plan at least partially for work
Horizons Cisco IBSG
Cisco Public Cisco IBSG © 2013 Cisco and/or its affiliates. All rights reserved. Internet Business Solutions Group 8
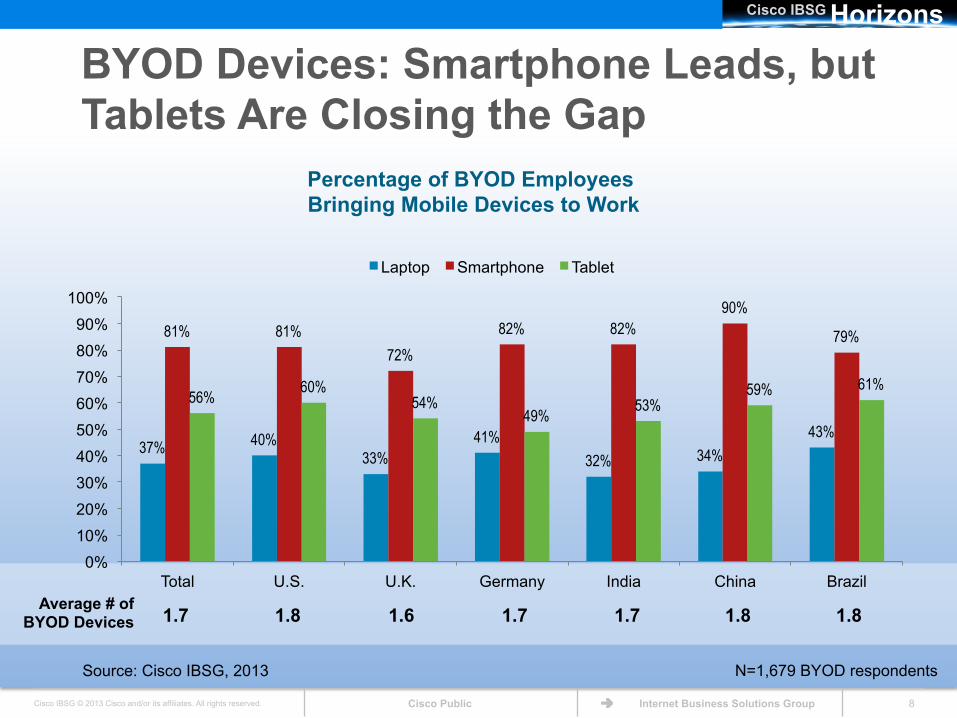
BYOD Devices: Smartphone Leads, but Tablets Are Closing the Gap
Source: Cisco IBSG, 2013
Average # of BYOD Devices
N=1,679 BYOD respondents
Percentage of BYOD Employees Bringing Mobile Devices to Work
1.7 1.8 1.6 1.7 1.7 1.8 1.8
37% 40% 33%
41% 32% 34%
43%
81% 81% 72%
82% 82% 90%
79%
56% 60% 54%
49% 53% 59% 61%
0% 10% 20% 30% 40% 50% 60% 70% 80% 90%
100%
Total U.S. U.K. Germany India China Brazil
Laptop Smartphone Tablet
Horizons Cisco IBSG
Cisco Public Cisco IBSG © 2013 Cisco and/or its affiliates. All rights reserved. Internet Business Solutions Group 9
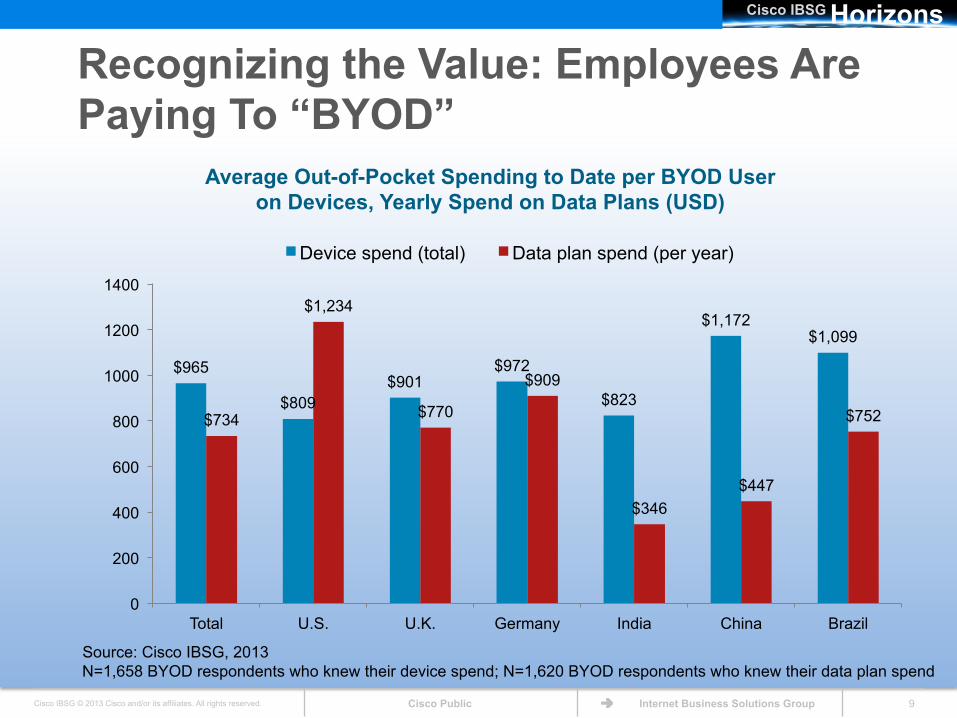
N=1,658 BYOD respondents who knew their device spend; N=1,620 BYOD respondents who knew their data plan spend
Recognizing the Value: Employees Are Paying To “BYOD”
Source: Cisco IBSG, 2013
$965
$809 $901
$972
$823
$1,172 $1,099
$734
$1,234
$770
$909
$346 $447
$752
0
200
400
600
800
1000
1200
1400
Total U.S. U.K. Germany India China Brazil
Device spend (total) Data plan spend (per year)
Average Out-of-Pocket Spending to Date per BYOD User on Devices, Yearly Spend on Data Plans (USD)
Horizons Cisco IBSG
Cisco Public Cisco IBSG © 2013 Cisco and/or its affiliates. All rights reserved. Internet Business Solutions Group 10
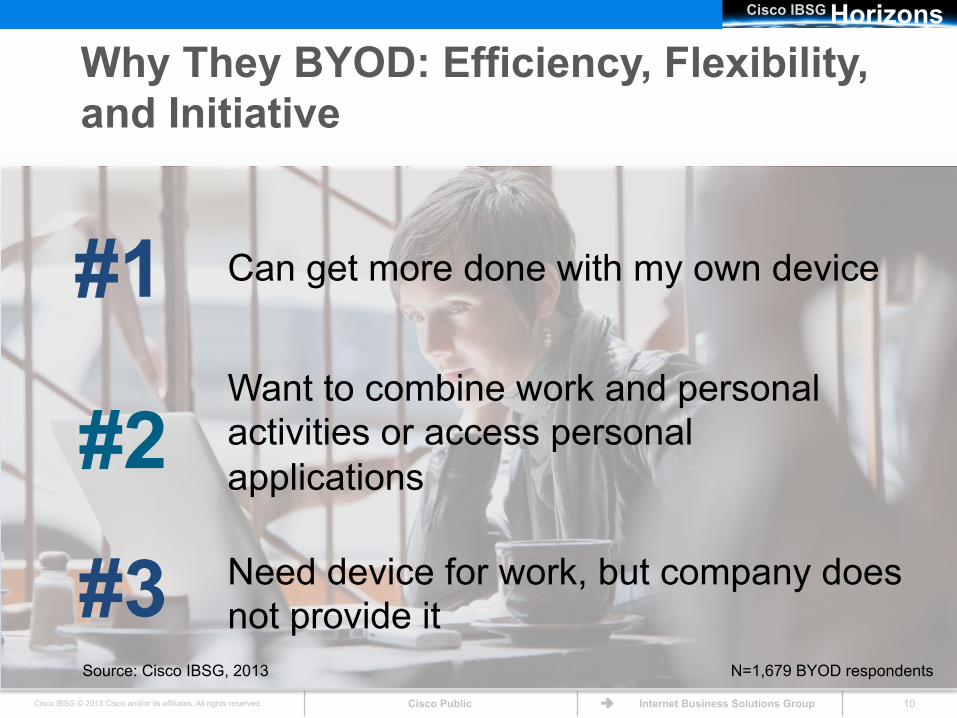
Why They BYOD: Efficiency, Flexibility, and Initiative
Horizons Cisco IBSG
#2 Want to combine work and personal activities or access personal applications
#3 Need device for work, but company does not provide it
#1 Can get more done with my own device
Source: Cisco IBSG, 2013 N=1,679 BYOD respondents
Horizons Cisco IBSG
Cisco Public Cisco IBSG © 2013 Cisco and/or its affiliates. All rights reserved. Internet Business Solutions Group 11
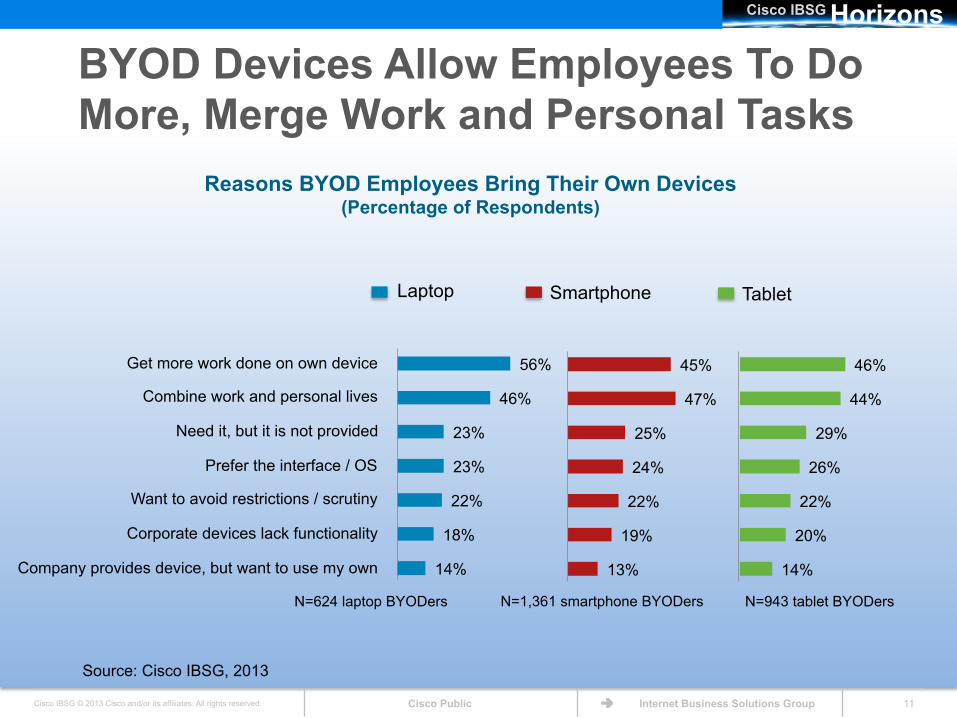
45%
47%
25%
24%
22%
19%
13%
56%
46%
23%
23%
22%
18%
14%
46%
44%
29%
26%
22%
20%
14%
N=624 laptop BYODers
BYOD Devices Allow Employees To Do More, Merge Work and Personal Tasks
Source: Cisco IBSG, 2013
Reasons BYOD Employees Bring Their Own Devices (Percentage of Respondents)
N=1,361 smartphone BYODers N=943 tablet BYODers
Get more work done on own device
Combine work and personal lives
Need it, but it is not provided
Prefer the interface / OS
Want to avoid restrictions / scrutiny
Corporate devices lack functionality
Company provides device, but want to use my own
Laptop Smartphone Tablet
Horizons Cisco IBSG
Cisco Public Cisco IBSG © 2013 Cisco and/or its affiliates. All rights reserved. Internet Business Solutions Group 12
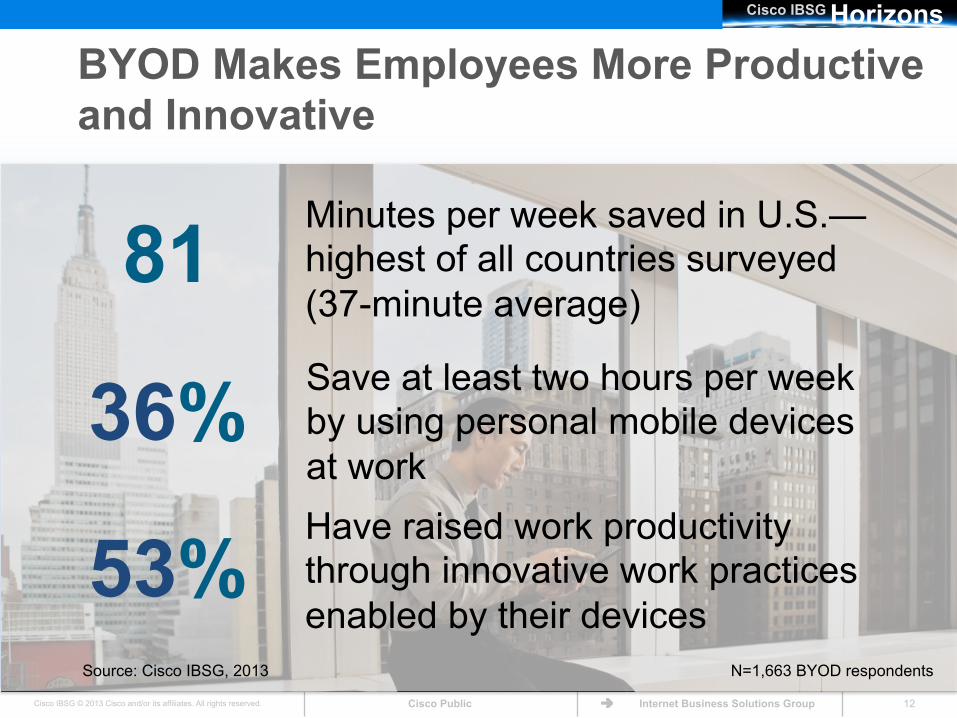
BYOD Makes Employees More Productive and Innovative
Horizons Cisco IBSG
81 Minutes per week saved in U.S.— highest of all countries surveyed (37-minute average)
53% Have raised work productivity through innovative work practices enabled by their devices
36% Save at least two hours per week by using personal mobile devices at work
Source: Cisco IBSG, 2013 N=1,663 BYOD respondents
Horizons Cisco IBSG
Cisco Public Cisco IBSG © 2013 Cisco and/or its affiliates. All rights reserved. Internet Business Solutions Group 13
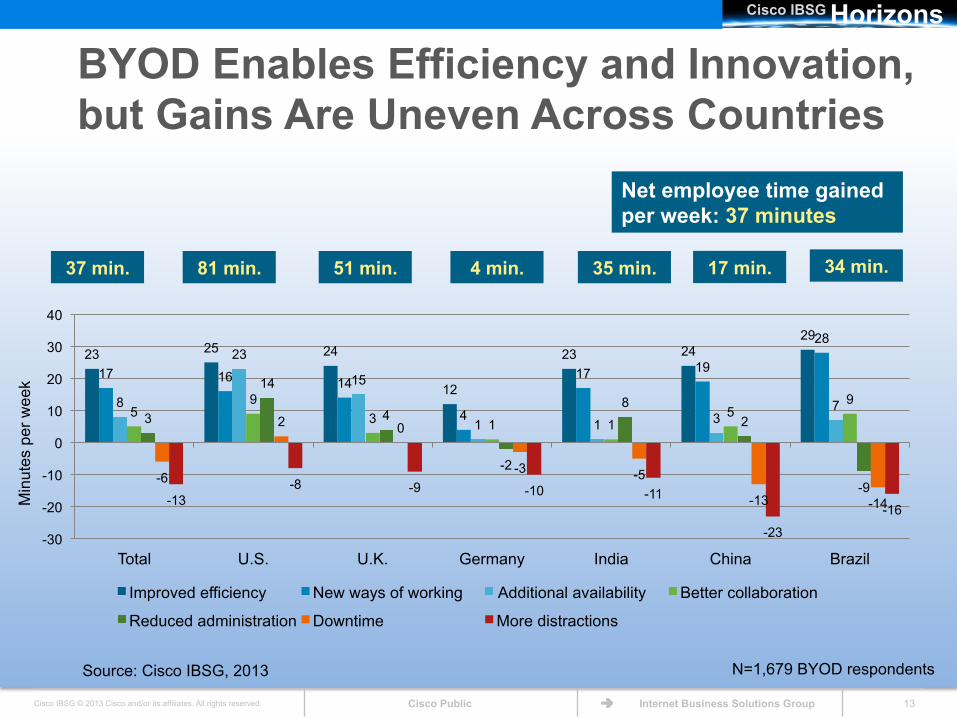
BYOD Enables Efficiency and Innovation, but Gains Are Uneven Across Countries
Net employee time gained per week: 37 minutes
Source: Cisco IBSG, 2013 N=1,679 BYOD respondents
37 min. 81 min. 51 min. 4 min. 35 min. 17 min. 34 min.
23 25 24
12
23 24 29
17 16 14
4
17 19
28
8
23
15
1 1 3 7 5
9 3 1 1
5 9
3
14
4
-2
8 2
-9 -6
2 0
-3 -5
-13 -14 -13 -8 -9 -10 -11
-23
-16
-30
-20
-10
0
10
20
30
40
Total U.S. U.K. Germany India China Brazil
Improved efficiency New ways of working Additional availability Better collaboration
Reduced administration Downtime More distractions
Min
utes
per
wee
k
Horizons Cisco IBSG
Cisco Public Cisco IBSG © 2013 Cisco and/or its affiliates. All rights reserved. Internet Business Solutions Group 14
Horizons Cisco IBSG
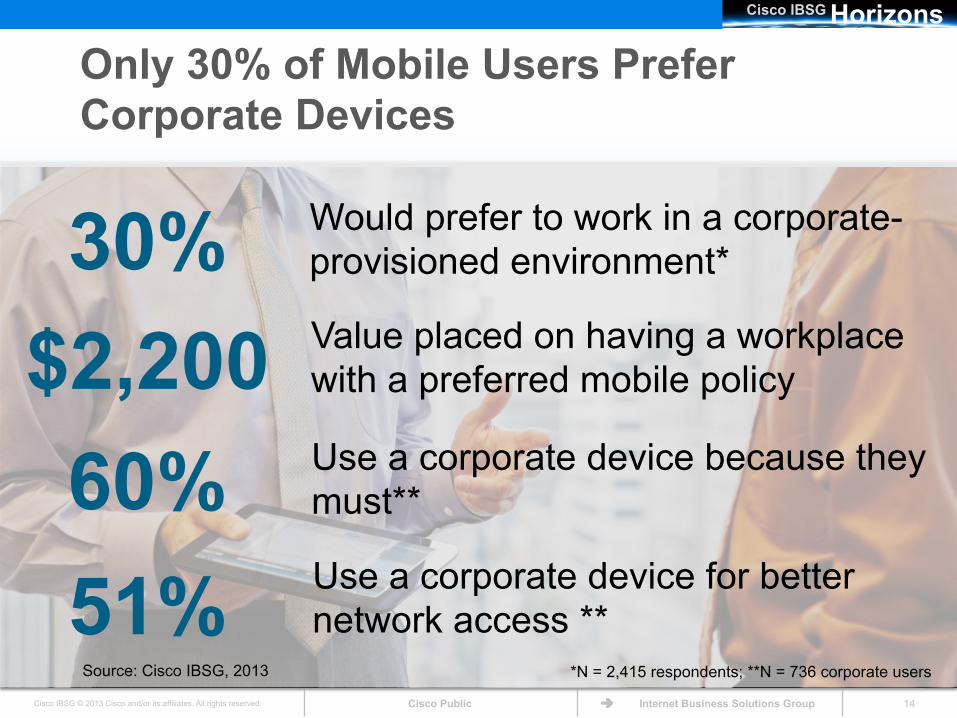
Only 30% of Mobile Users Prefer Corporate Devices
60% Use a corporate device because they must**
30% Would prefer to work in a corporate-provisioned environment*
Source: Cisco IBSG, 2013 *N = 2,415 respondents; **N = 736 corporate users
51% Use a corporate device for better network access **
$2,200 Value placed on having a workplace with a preferred mobile policy
Horizons Cisco IBSG
Cisco Public Cisco IBSG © 2013 Cisco and/or its affiliates. All rights reserved. Internet Business Solutions Group 15
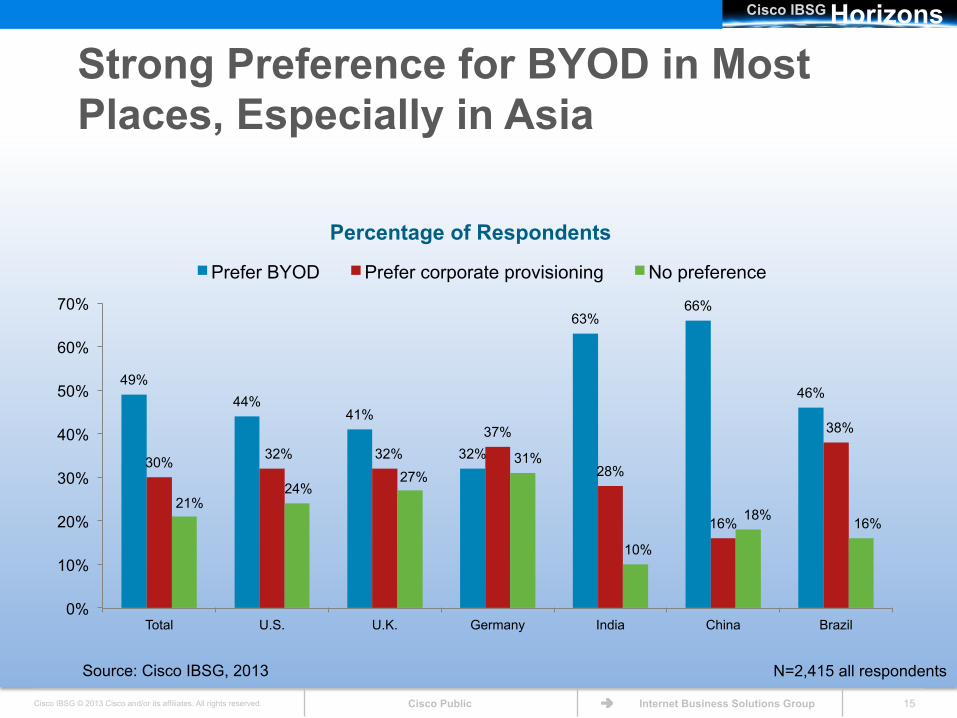
Strong Preference for BYOD in Most Places, Especially in Asia
Source: Cisco IBSG, 2013
Percentage of Respondents
49% 44%
41%
32%
63% 66%
46%
30% 32% 32% 37%
28%
16%
38%
21% 24%
27% 31%
10%
18% 16%
0%
10%
20%
30%
40%
50%
60%
70%
Total U.S. U.K. Germany India China Brazil
Prefer BYOD Prefer corporate provisioning No preference
N=2,415 all respondents
Horizons Cisco IBSG
Cisco Public Cisco IBSG © 2013 Cisco and/or its affiliates. All rights reserved. Internet Business Solutions Group 16
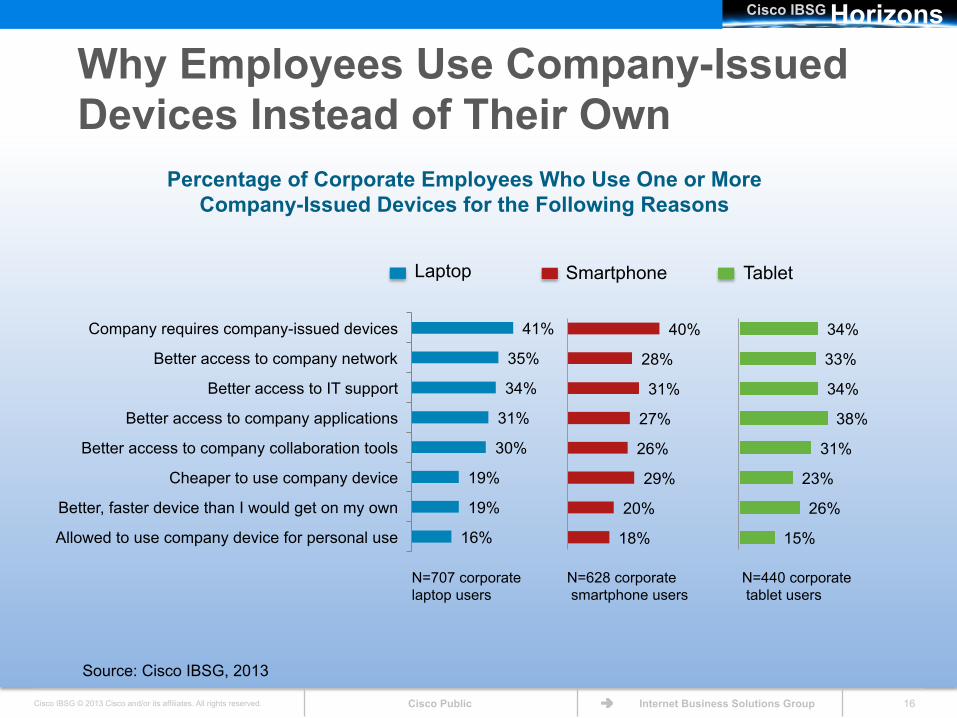
41%
35%
34%
31%
30%
19%
19%
16%
Company requires company-issued devices
Better access to company network
Better access to IT support
Better access to company applications
Better access to company collaboration tools
Cheaper to use company device
Better, faster device than I would get on my own
Allowed to use company device for personal use
34%
33%
34%
38%
31%
23%
26%
15%
40%
28%
31%
27%
26%
29%
20%
18%
Why Employees Use Company-Issued Devices Instead of Their Own
Source: Cisco IBSG, 2013
Percentage of Corporate Employees Who Use One or More Company-Issued Devices for the Following Reasons
N=707 corporate laptop users
N=628 corporate smartphone users
N=440 corporate tablet users
Laptop Smartphone Tablet
Horizons Cisco IBSG
Cisco Public Cisco IBSG © 2013 Cisco and/or its affiliates. All rights reserved. Internet Business Solutions Group 17
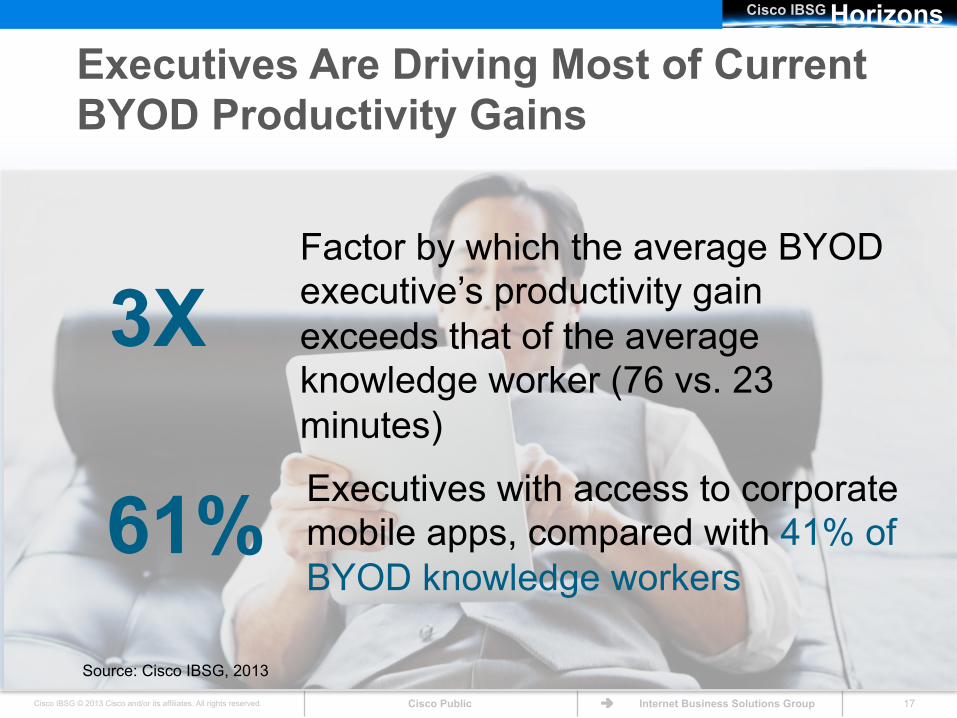
Executives Are Driving Most of Current BYOD Productivity Gains
Source: Cisco IBSG, 2013
3X Factor by which the average BYOD executive’s productivity gain exceeds that of the average knowledge worker (76 vs. 23 minutes)
61% Executives with access to corporate mobile apps, compared with 41% of BYOD knowledge workers
Horizons Cisco IBSG
Cisco Public Cisco IBSG © 2013 Cisco and/or its affiliates. All rights reserved. Internet Business Solutions Group 18
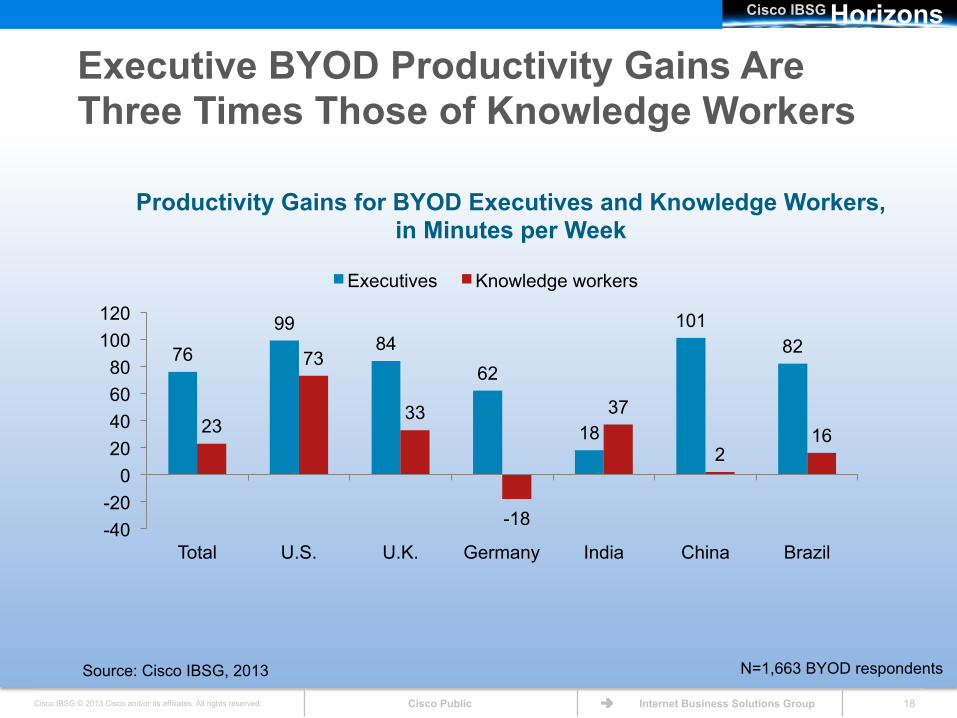
Executive BYOD Productivity Gains Are Three Times Those of Knowledge Workers
Productivity Gains for BYOD Executives and Knowledge Workers, in Minutes per Week
Source: Cisco IBSG, 2013 N=1,663 BYOD respondents
76
99 84
62
18
101 82
23
73
33
-18
37
2 16
-40 -20
0 20 40 60 80
100 120
Total U.S. U.K. Germany India China Brazil
Executives Knowledge workers
Horizons Cisco IBSG
Cisco Public Cisco IBSG © 2013 Cisco and/or its affiliates. All rights reserved. Internet Business Solutions Group 19
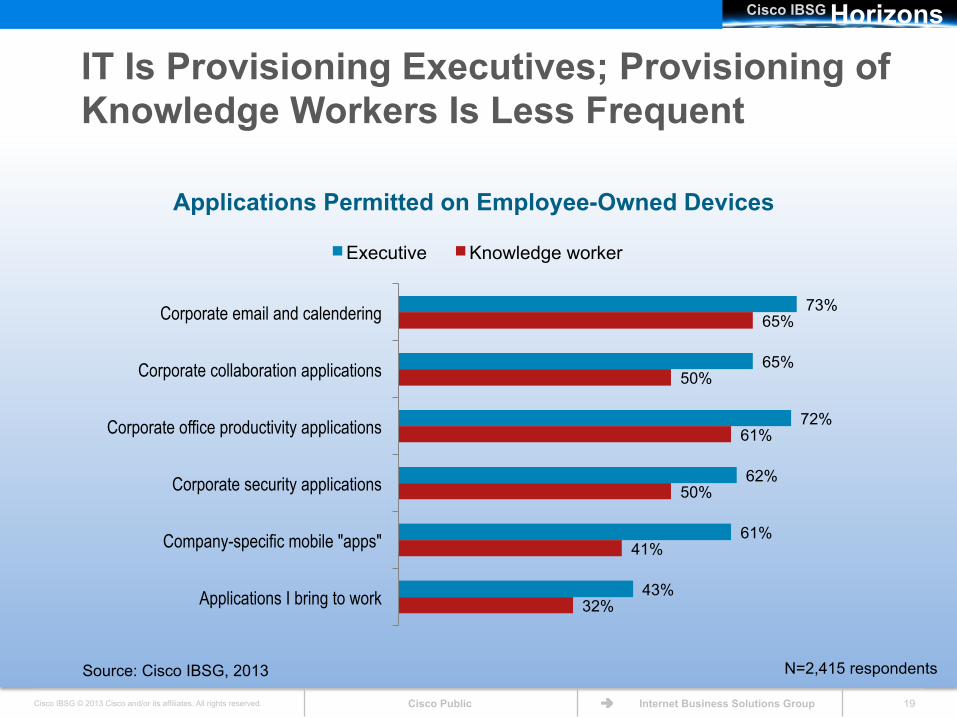
IT Is Provisioning Executives; Provisioning of Knowledge Workers Is Less Frequent
73%
65%
72%
62%
61%
43%
65%
50%
61%
50%
41%
32%
Corporate email and calendering
Corporate collaboration applications
Corporate office productivity applications
Corporate security applications
Company-specific mobile "apps"
Applications I bring to work
Executive Knowledge worker
Applications Permitted on Employee-Owned Devices
Source: Cisco IBSG, 2013 N=2,415 respondents
Horizons Cisco IBSG
Cisco Public Cisco IBSG © 2013 Cisco and/or its affiliates. All rights reserved. Internet Business Solutions Group 20
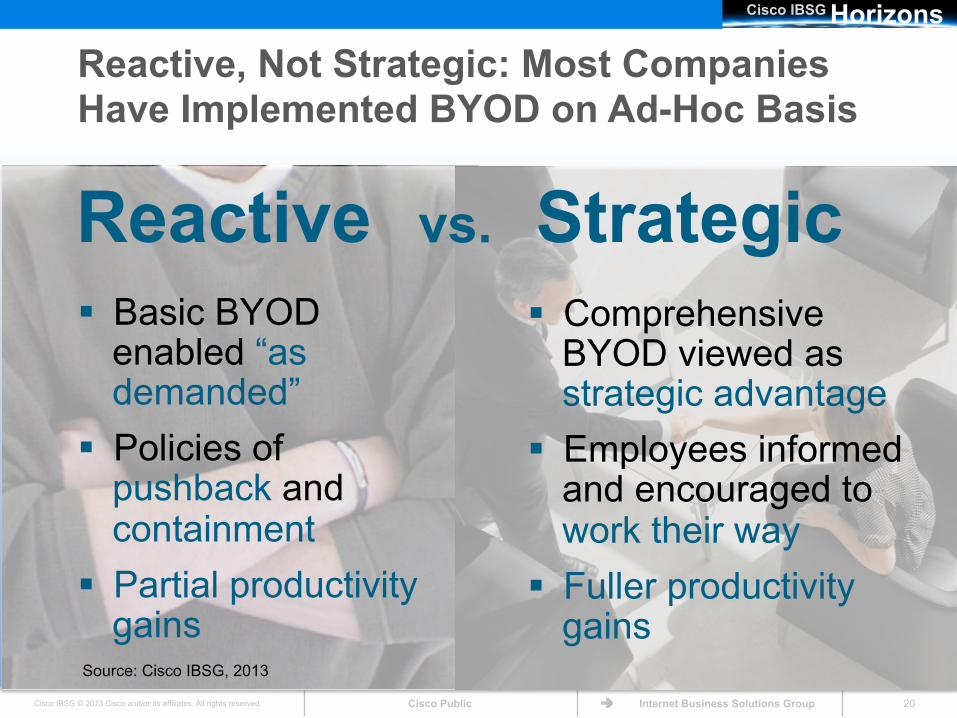
Reactive, Not Strategic: Most Companies Have Implemented BYOD on Ad-Hoc Basis
Reactive Strategic Basic BYOD
enabled “as demanded”
Policies of pushback and containment
Partial productivity gains
Comprehensive BYOD viewed as strategic advantage
Employees informed and encouraged to work their way
Fuller productivity gains
vs.
Source: Cisco IBSG, 2013
Horizons Cisco IBSG
Cisco Public Cisco IBSG © 2013 Cisco and/or its affiliates. All rights reserved. Internet Business Solutions Group 21
Horizons Cisco IBSG
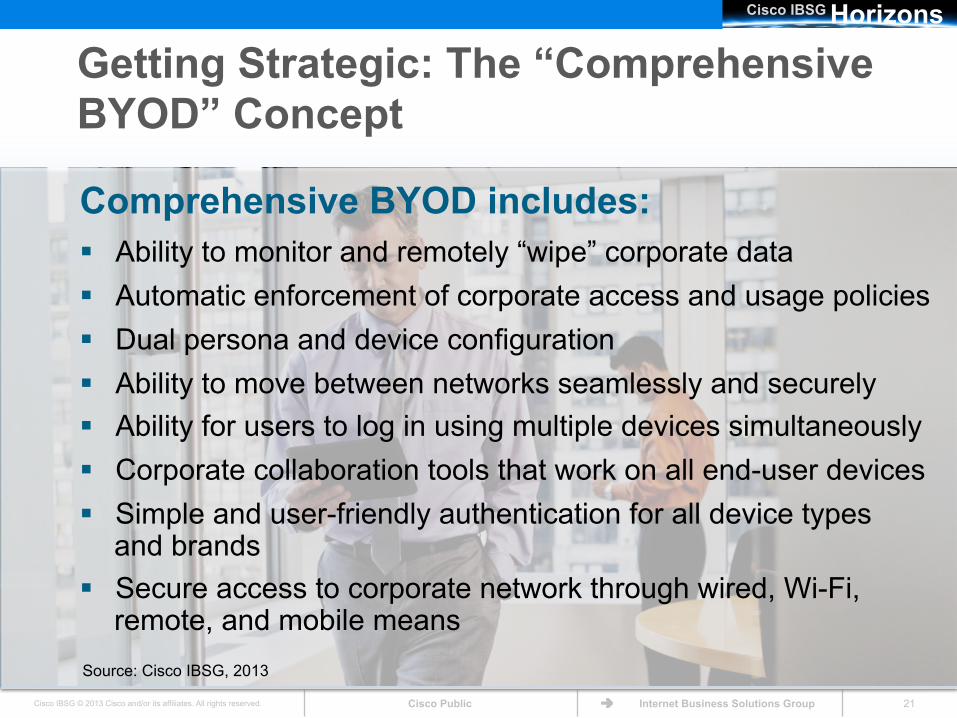
Getting Strategic: The “Comprehensive BYOD” Concept
Source: Cisco IBSG, 2013
Comprehensive BYOD includes: Ability to monitor and remotely “wipe” corporate data Automatic enforcement of corporate access and usage policies Dual persona and device configuration Ability to move between networks seamlessly and securely Ability for users to log in using multiple devices simultaneously Corporate collaboration tools that work on all end-user devices Simple and user-friendly authentication for all device types
and brands Secure access to corporate network through wired, Wi-Fi,
remote, and mobile means
Horizons Cisco IBSG
Cisco Public Cisco IBSG © 2013 Cisco and/or its affiliates. All rights reserved. Internet Business Solutions Group 22
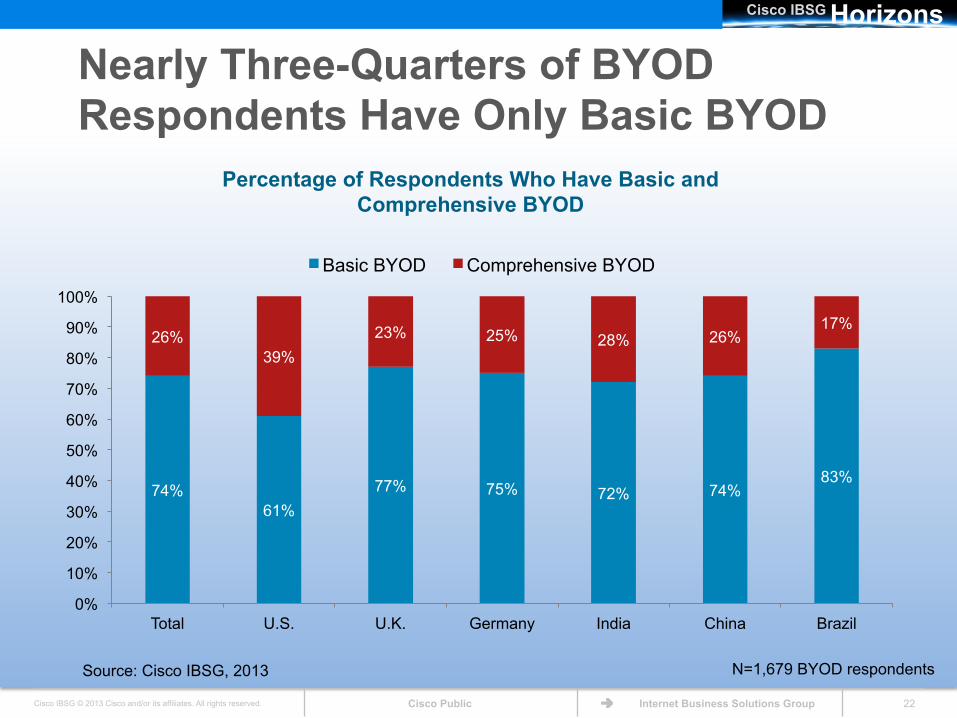
Nearly Three-Quarters of BYOD Respondents Have Only Basic BYOD
74% 61%
77% 75% 72% 74% 83%
26% 39%
23% 25% 28% 26% 17%
0%
10%
20%
30%
40%
50%
60%
70%
80%
90%
100%
Total U.S. U.K. Germany India China Brazil
Basic BYOD Comprehensive BYOD
N=1,679 BYOD respondents
Percentage of Respondents Who Have Basic and Comprehensive BYOD
Source: Cisco IBSG, 2013
Horizons Cisco IBSG
Cisco Public Cisco IBSG © 2013 Cisco and/or its affiliates. All rights reserved. Internet Business Solutions Group 23
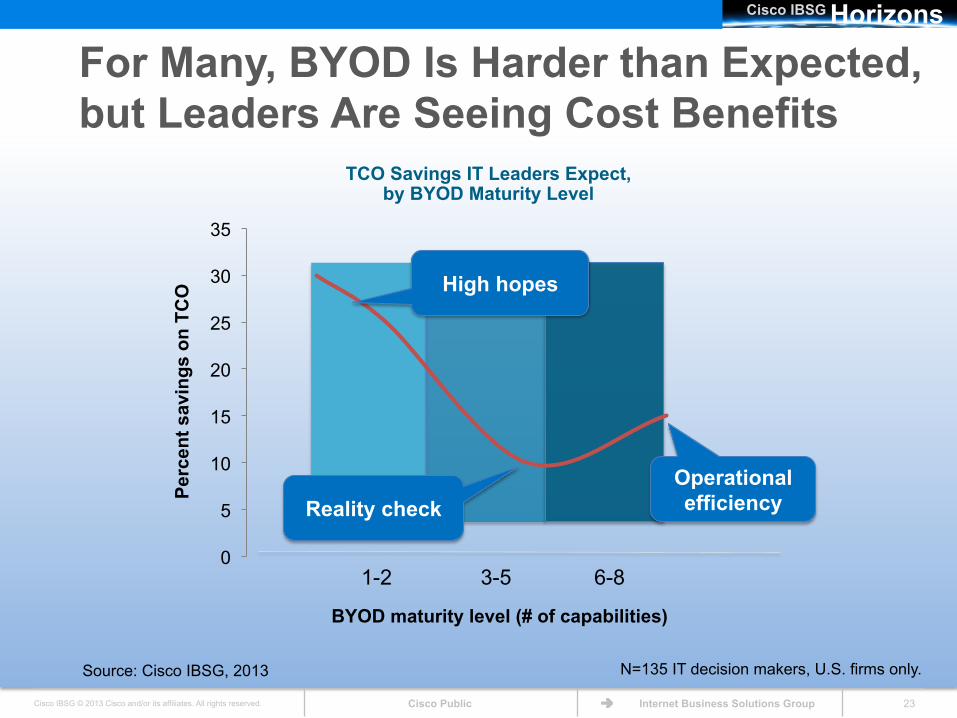
For Many, BYOD Is Harder than Expected, but Leaders Are Seeing Cost Benefits
Source: Cisco IBSG, 2013 N=135 IT decision makers, U.S. firms only.
0
5
10
15
20
25
30
35
TCO Savings IT Leaders Expect, by BYOD Maturity Level
1-2 3-5 6-8
Perc
ent s
avin
gs o
n TC
O
BYOD maturity level (# of capabilities)
High hopes
Reality check Operational efficiency
Horizons Cisco IBSG
Cisco Public Cisco IBSG © 2013 Cisco and/or its affiliates. All rights reserved. Internet Business Solutions Group 24
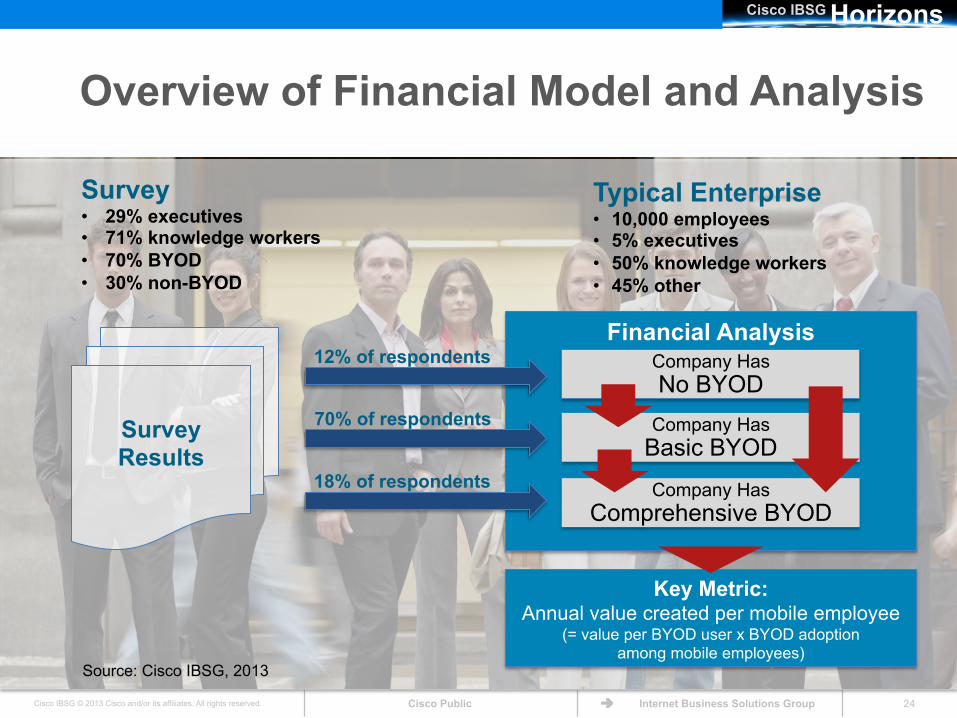
Overview of Financial Model and Analysis
Survey Results
Financial Analysis
Company Has Basic BYOD
Company Has Comprehensive BYOD
Company Has No BYOD
Survey • 29% executives • 71% knowledge workers • 70% BYOD • 30% non-BYOD
Typical Enterprise • 10,000 employees • 5% executives • 50% knowledge workers • 45% other
18% of respondents
12% of respondents
70% of respondents
Key Metric: Annual value created per mobile employee
(= value per BYOD user x BYOD adoption among mobile employees)
Source: Cisco IBSG, 2013
Horizons Cisco IBSG
Cisco Public Cisco IBSG © 2013 Cisco and/or its affiliates. All rights reserved. Internet Business Solutions Group 25
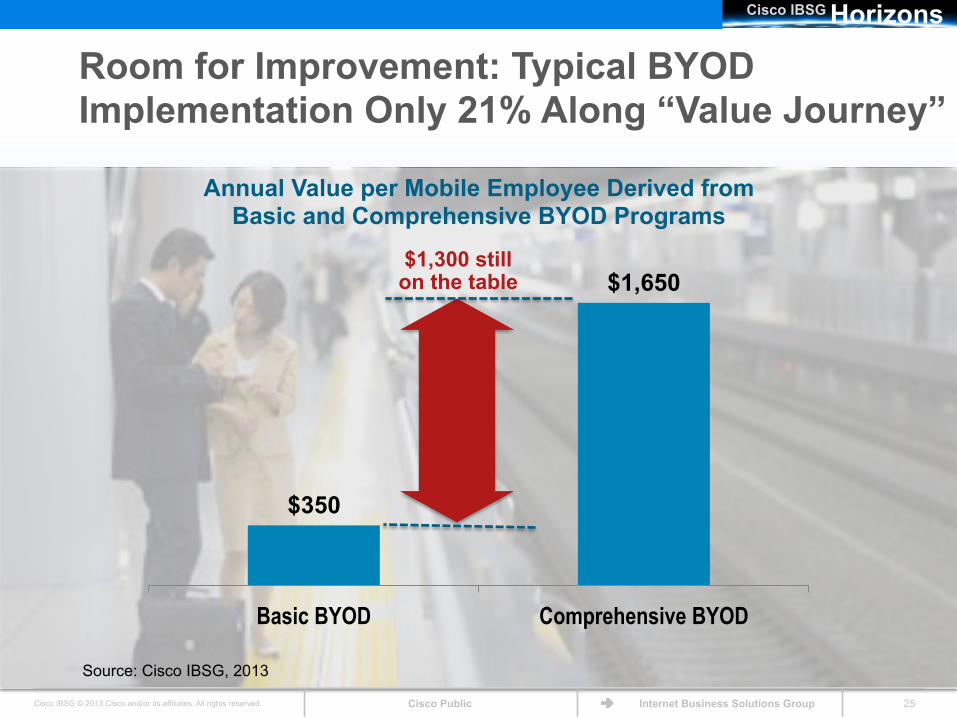
$350
$1,650
Basic BYOD Comprehensive BYOD
Horizons Cisco IBSG
Room for Improvement: Typical BYOD Implementation Only 21% Along “Value Journey”
Source: Cisco IBSG, 2013
$1,300 still on the table
Annual Value per Mobile Employee Derived from Basic and Comprehensive BYOD Programs
Horizons Cisco IBSG
Cisco Public Cisco IBSG © 2013 Cisco and/or its affiliates. All rights reserved. Internet Business Solutions Group 26
Horizons Cisco IBSG
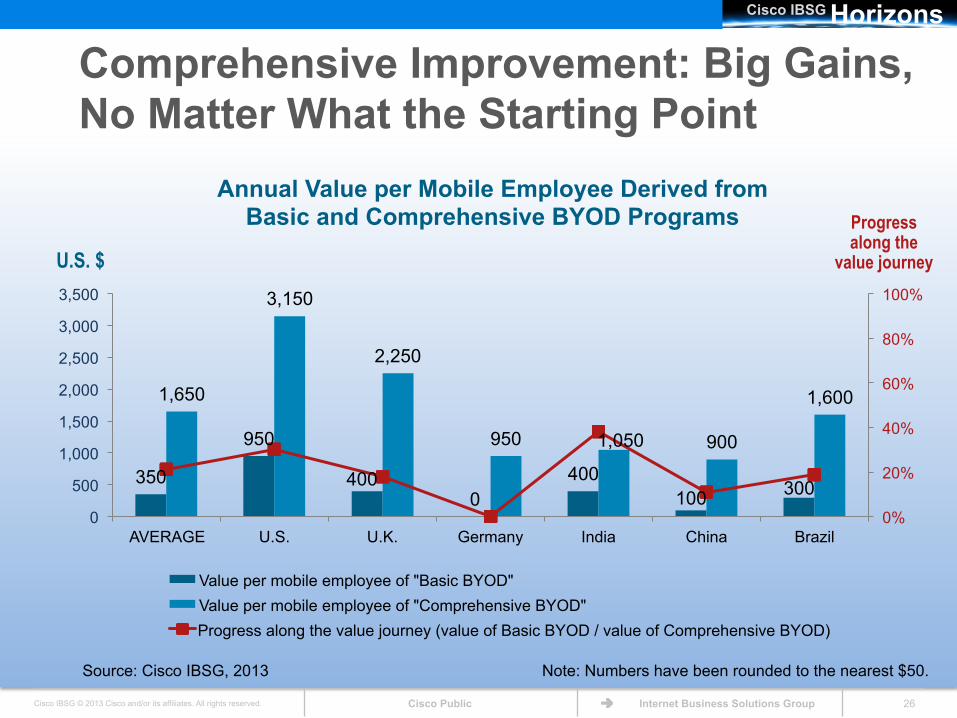
Comprehensive Improvement: Big Gains, No Matter What the Starting Point
Source: Cisco IBSG, 2013
Annual Value per Mobile Employee Derived from Basic and Comprehensive BYOD Programs
350
950
400 0
400 100 300
1,650
3,150
2,250
950 1,050 900
1,600
0%
20%
40%
60%
80%
100%
AVERAGE U.S. U.K. Germany India China Brazil 0
500
1,000
1,500
2,000
2,500
3,000
3,500
Value per mobile employee of "Basic BYOD" Value per mobile employee of "Comprehensive BYOD" Progress along the value journey (value of Basic BYOD / value of Comprehensive BYOD)
Progress along the
value journey U.S. $
Note: Numbers have been rounded to the nearest $50.
Horizons Cisco IBSG
Cisco Public Cisco IBSG © 2013 Cisco and/or its affiliates. All rights reserved. Internet Business Solutions Group 27
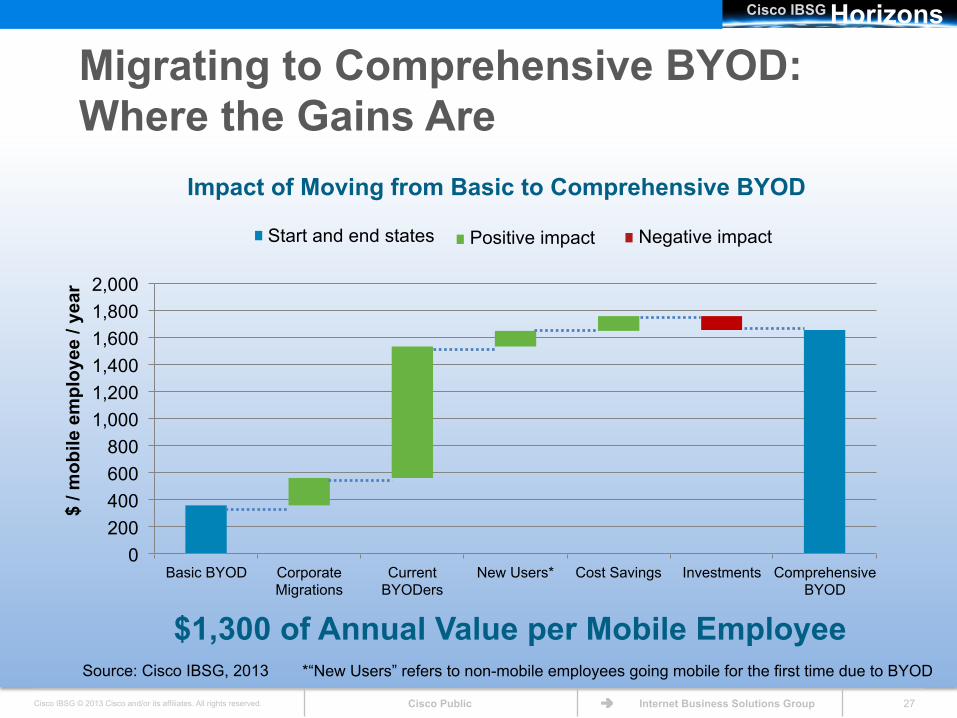
Migrating to Comprehensive BYOD: Where the Gains Are
Source: Cisco IBSG, 2013
$1,300 of Annual Value per Mobile Employee
Impact of Moving from Basic to Comprehensive BYOD
0 200 400 600 800
1,000 1,200 1,400 1,600 1,800 2,000
Basic BYOD Corporate Migrations
Current BYODers
New Users* Cost Savings Investments Comprehensive BYOD
$ / m
obile
em
ploy
ee /
year
Start and end states Positive impact Negative impact
*“New Users” refers to non-mobile employees going mobile for the first time due to BYOD
Horizons Cisco IBSG
Cisco Public Cisco IBSG © 2013 Cisco and/or its affiliates. All rights reserved. Internet Business Solutions Group 28
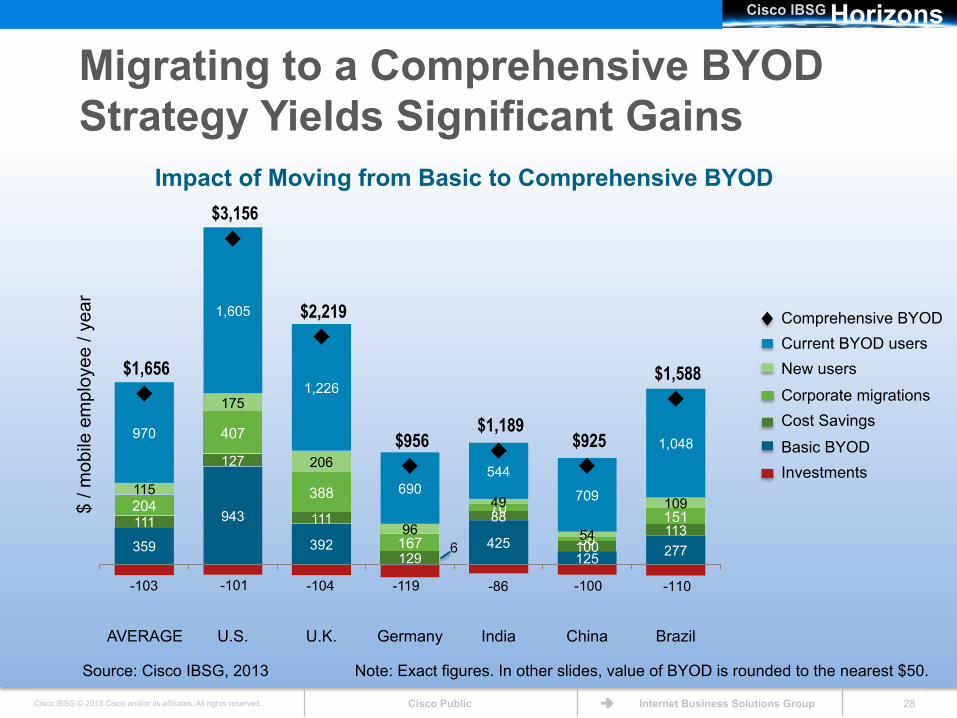
Migrating to a Comprehensive BYOD Strategy Yields Significant Gains
Source: Cisco IBSG, 2013
$ / m
obile
em
ploy
ee /
year
359
943
392 425 125 277
111
127
111
129
88
100 113
204
407
388
167
70
38 151
115
175
206
96
49
54
109
970
1,605
1,226
690 544
709
1,048
$1,656
$3,156
$2,219
$956 $1,189
$925
$1,588
AVERAGE U.S. U.K. Germany India China Brazil
-86
6
-100 -110
Impact of Moving from Basic to Comprehensive BYOD
-103 -101 -104 -119
Comprehensive BYOD Current BYOD users New users
Corporate migrations Cost Savings
Basic BYOD Investments
Note: Exact figures. In other slides, value of BYOD is rounded to the nearest $50.
Horizons Cisco IBSG
Cisco Public Cisco IBSG © 2013 Cisco and/or its affiliates. All rights reserved. Internet Business Solutions Group 29
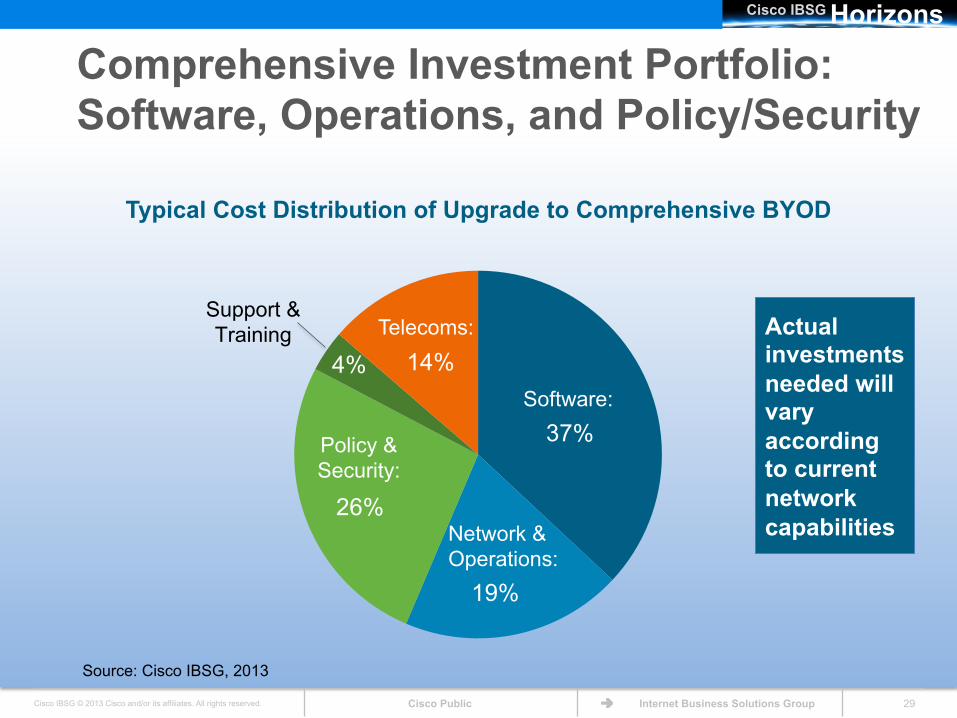
37%
19%
26%
4% 14%
Typical Cost Distribution of Upgrade to Comprehensive BYOD
Policy & Security:
Support & Training
Comprehensive Investment Portfolio: Software, Operations, and Policy/Security
Actual investments needed will vary according to current network capabilities
Source: Cisco IBSG, 2013
Software:
Telecoms:
Network & Operations:
Horizons Cisco IBSG
Cisco Public Cisco IBSG © 2013 Cisco and/or its affiliates. All rights reserved. Internet Business Solutions Group 30
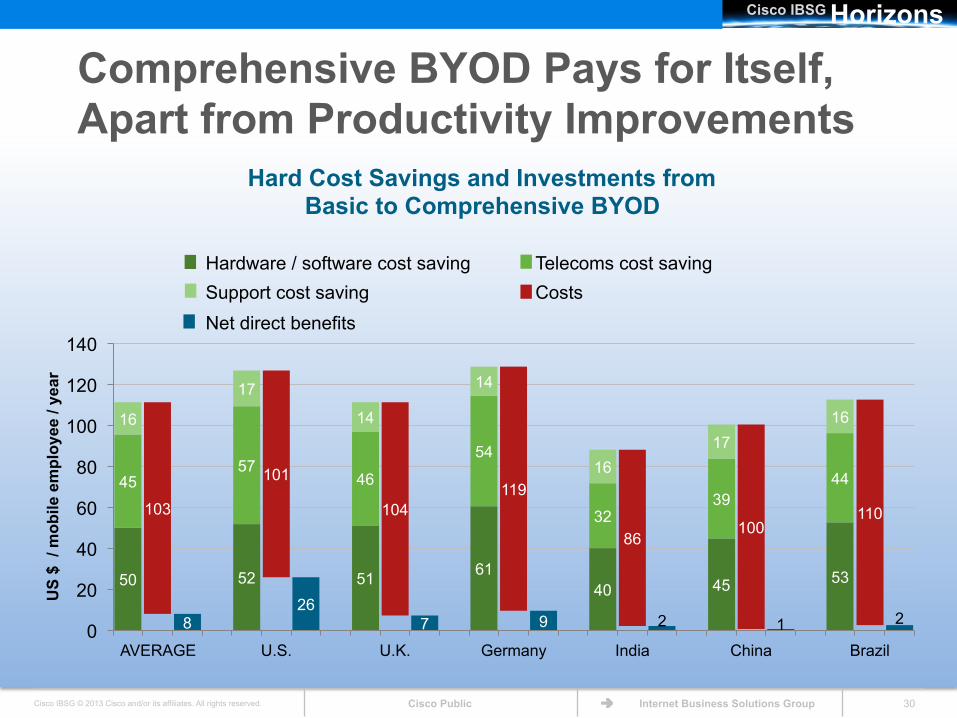
Comprehensive BYOD Pays for Itself, Apart from Productivity Improvements
50 52 51 61 40 45 53
45 57
46
54
32 39
44
16
17
14
14
16 17
16
103
101
104 119
86 100
110
8 26
7 9 2 1 2 0
20
40
60
80
100
120
140
AVERAGE U.S. U.K. Germany India China Brazil
US
$ /
mob
ile e
mpl
oyee
/ ye
ar
Hard Cost Savings and Investments from Basic to Comprehensive BYOD
Hardware / software cost saving Support cost saving Net direct benefits
Telecoms cost saving Costs
Horizons Cisco IBSG
Cisco Public Cisco IBSG © 2013 Cisco and/or its affiliates. All rights reserved. Internet Business Solutions Group 31
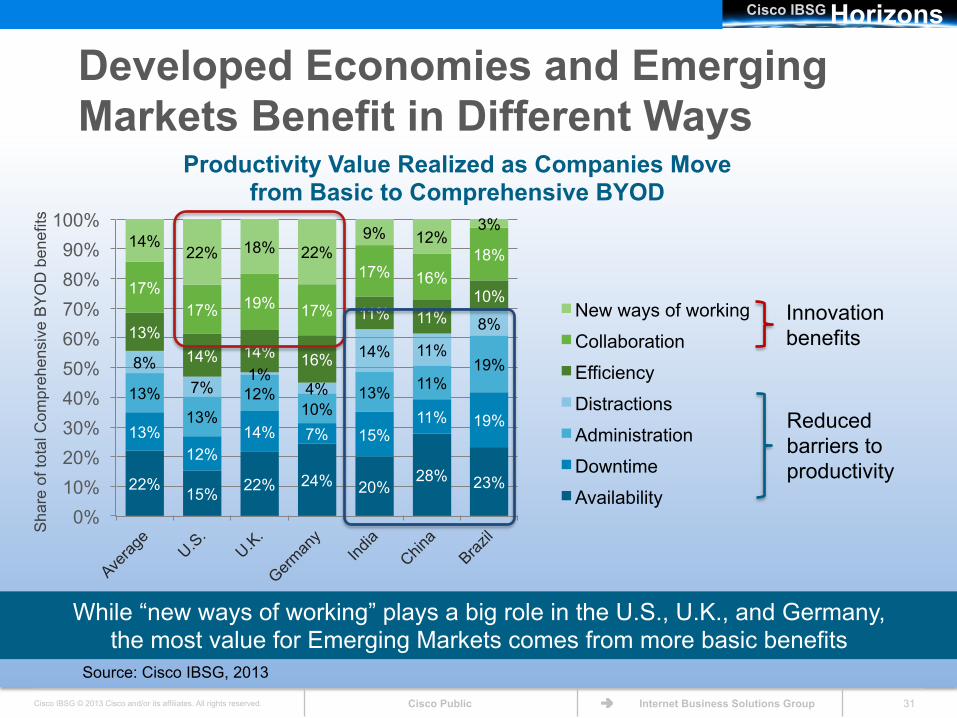
22% 15% 22% 24% 20% 28% 23%
13% 12%
14% 7% 15% 11% 19%
13% 13%
12% 10%
13% 11% 19% 8%
7% 1%
4%
14% 11% 8% 13%
14% 14% 16%
11% 11% 10% 17%
17% 19% 17%
17% 16% 18%
14% 22% 18% 22%
9% 12% 3%
0% 10% 20% 30% 40% 50% 60% 70% 80% 90%
100%
Sha
re o
f tot
al C
ompr
ehen
sive
BY
OD
ben
efits
Productivity Value Realized as Companies Move from Basic to Comprehensive BYOD
New ways of working
Collaboration
Efficiency
Distractions
Administration
Downtime
Availability
Horizons Cisco IBSG
Developed Economies and Emerging Markets Benefit in Different Ways
Source: Cisco IBSG, 2013
Innovation benefits
Reduced barriers to productivity
While “new ways of working” plays a big role in the U.S., U.K., and Germany, the most value for Emerging Markets comes from more basic benefits
Horizons Cisco IBSG
Cisco Public Cisco IBSG © 2013 Cisco and/or its affiliates. All rights reserved. Internet Business Solutions Group 32
Horizons Cisco IBSG
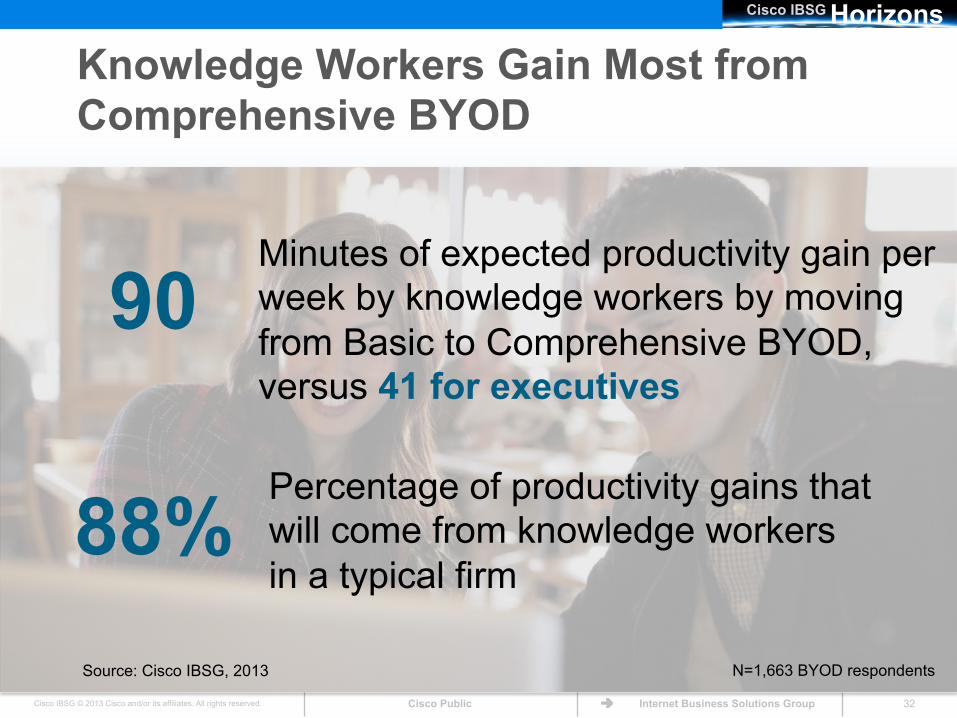
88% Percentage of productivity gains that will come from knowledge workers in a typical firm
90 Minutes of expected productivity gain per week by knowledge workers by moving from Basic to Comprehensive BYOD, versus 41 for executives
Knowledge Workers Gain Most from Comprehensive BYOD
Source: Cisco IBSG, 2013 N=1,663 BYOD respondents
Horizons Cisco IBSG
Cisco Public Cisco IBSG © 2013 Cisco and/or its affiliates. All rights reserved. Internet Business Solutions Group 33
Comprehensive BYOD: Improved Efficiency, Innovation, Availability
Source: Cisco IBSG, 2013 N=1,663 BYOD respondents
Min
utes
/ w
eek
18
108
59
184
23
115
-24
62 51
119
-6
79
4
89
-100
-50
0
50
100
150
200
Basic Comp. Basic Comp. Basic Comp. Basic Comp. Basic Comp. Basic Comp. Basic Comp.
AVERAGE U.S. U.K. Germany India China Brazil
Productivity Impact Sources for Knowledge Workers in Basic and Comprehensive BYOD
Efficiency New ways of working Availability Collaboration Administration Downtime Distractions Total
Horizons Cisco IBSG
Cisco Public Cisco IBSG © 2013 Cisco and/or its affiliates. All rights reserved. Internet Business Solutions Group 34
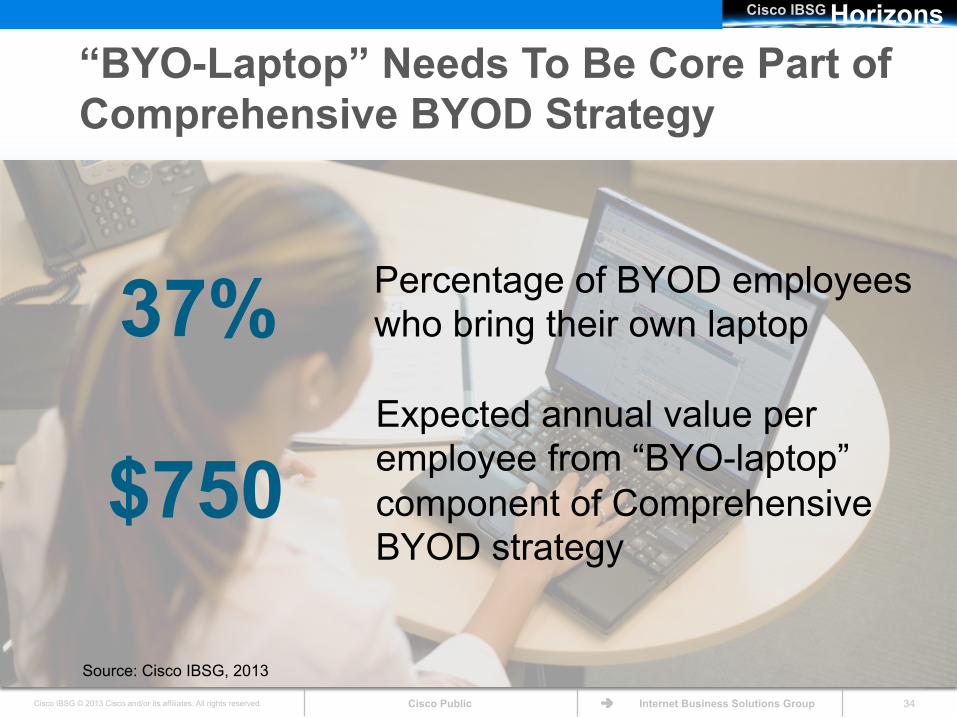
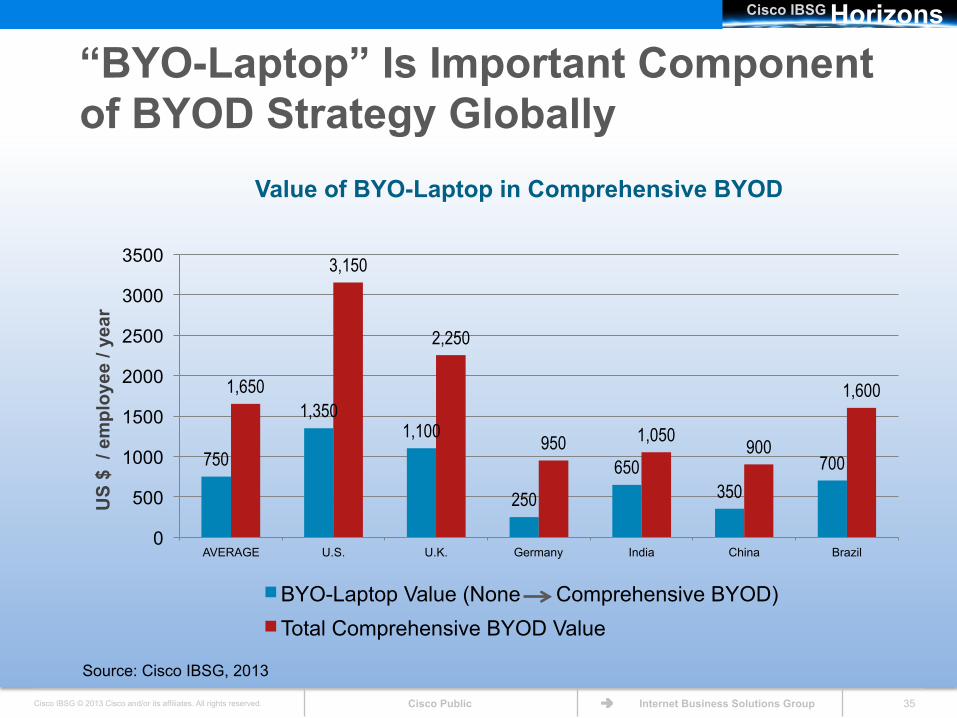
“BYO-Laptop” Needs To Be Core Part of Comprehensive BYOD Strategy
Horizons Cisco IBSG
37% Percentage of BYOD employees who bring their own laptop
Source: Cisco IBSG, 2013
$750 Expected annual value per employee from “BYO-laptop” component of Comprehensive BYOD strategy
Horizons Cisco IBSG
Cisco Public Cisco IBSG © 2013 Cisco and/or its affiliates. All rights reserved. Internet Business Solutions Group 35
750
1,350 1,100
250 650
350 700
1,650
3,150
2,250
950 1,050 900
1,600
0
500
1000
1500
2000
2500
3000
3500
AVERAGE U.S. U.K. Germany India China Brazil
Value of BYO-Laptop in Comprehensive BYOD
BYO-Laptop Value (None Comprehensive BYOD) Total Comprehensive BYOD Value
Horizons Cisco IBSG
“BYO-Laptop” Is Important Component of BYOD Strategy Globally
US
$ /
empl
oyee
/ ye
ar
Source: Cisco IBSG, 2013
Horizons Cisco IBSG
Cisco Public Cisco IBSG © 2013 Cisco and/or its affiliates. All rights reserved. Internet Business Solutions Group 36
IBSG Horizons “Economics of BYOD” Study: Top Findings
Employees are just getting started bringing their own devices to work. By 2016, nearly a half-billion BYOD devices will be in use in across the six countries surveyed.
Less than one-third of respondents prefer corporate devices. Forty-nine percent chose a fully self-provisioned work environment.
Mobile users are willing to invest in BYOD. BYOD users have spent an average of $965 on BYOD devices, plus $734 annually on voice and data plans used at least in part for work.
BYOD is delivering productivity gains around the world. Even with the limitations of current BYOD deployments, employees save an average of 37 minutes per week of productive work time—but gains are uneven across countries.
Most companies have been reactive, rather than strategic, in enabling BYOD, reacting to employee demands with a patchwork of BYOD.
Source: Cisco IBSG, 2013
Horizons Cisco IBSG
Cisco Public Cisco IBSG © 2013 Cisco and/or its affiliates. All rights reserved. Internet Business Solutions Group 37
IBSG Horizons “Economics of BYOD” Study: Top Findings Companies can gain an additional $1,300 annually per mobile user as they
move from Basic to Comprehensive BYOD.
Moving from Basic to Comprehensive BYOD sparks employee-led innovation in developed countries, and reduces productivity losses in emerging markets.
Comprehensive BYOD pays for itself. Hard-cost savings are posted in hardware, service, and telecom.
More choice, better network access could convert corporate device users to BYOD. 36% of corporate device users would rather BYOD. The top reasons corporate users do not BYOD already is that they are not permitted to do so (51%) and because of limited network access and support for BYOD devices (49%).
“BYO-Laptop” should be a core part of a Comprehensive BYOD strategy. IBSG estimates that laptops contribute nearly half of the estimated $1,650 of potential value per mobile user.
Source: Cisco IBSG, 2013
Horizons Cisco IBSG
Cisco Public Cisco IBSG © 2013 Cisco and/or its affiliates. All rights reserved. Internet Business Solutions Group 38
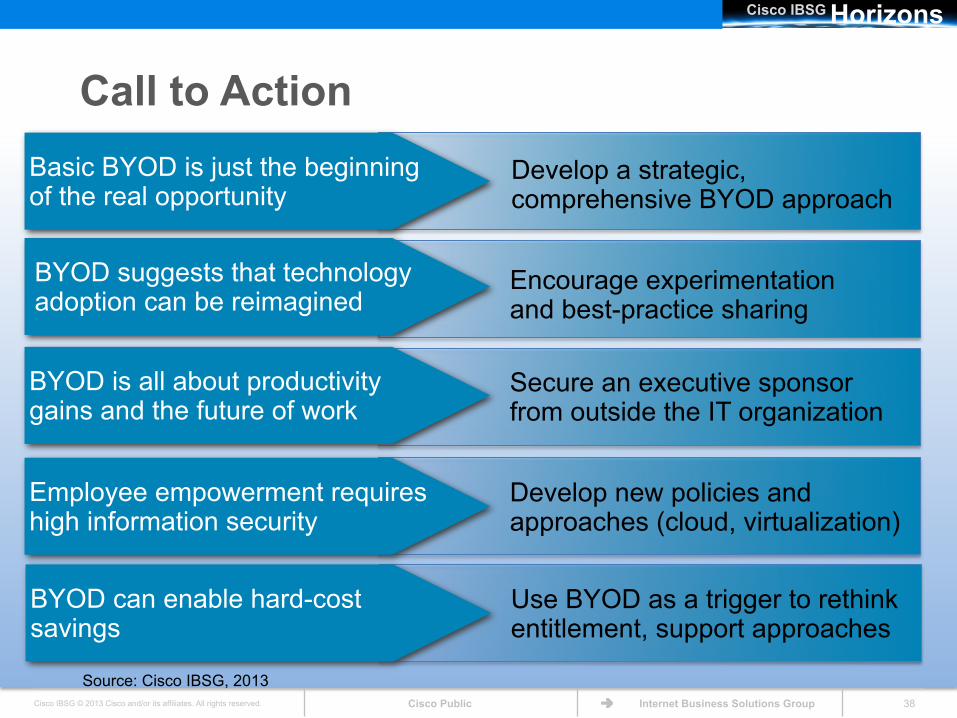
Call to Action
Source: Cisco IBSG, 2013
Develop a strategic, comprehensive BYOD approach
Encourage experimentation and best-practice sharing
Employee empowerment requires high information security
Develop new policies and approaches (cloud, virtualization)
Secure an executive sponsor from outside the IT organization
BYOD is all about productivity gains and the future of work
BYOD suggests that technology adoption can be reimagined
Basic BYOD is just the beginning of the real opportunity
BYOD can enable hard-cost savings
Use BYOD as a trigger to rethink entitlement, support approaches

Horizons Cisco IBSG
Cisco Public Cisco IBSG © 2013 Cisco and/or its affiliates. All rights reserved. Internet Business Solutions Group 39
Horizons Cisco IBSG
For More Information…
Jeff Loucks [email protected]
Richard Medcalf [email protected]
Lauren Buckalew [email protected]
Fabio Faria [email protected]
…Contact Cisco’s Internet Business Solutions Group