Embed Size (px)
Citation preview

Revista Empresarial Inter Metro / Inter Metro Business Journal Fall 2008 / Vol. 4 No. 2 / p. 23
THE FINANCIAL FACTORS INFLUENCING CASH DIVIDEND POLICY:
A SAMPLE OF U.S. MANUFACTURING COMPANIES
by
Ahmad H. Juma'h
Professor of Finance
School of Economics
Metropolitan Campus
Inter American University of Puerto Rico
San Juan, Puerto Rico
Carlos J. Olivares Pacheco
Associate Professor
Department of Management
Bayamón Campus
Inter American University of Puerto Rico
Bayamón, Puerto Rico
Abstract
The decision to adopt cash dividend policy is influenced by the environment of and
the context of such decision. On average, companies that pay cash dividends are
associated with higher liquidity ratios, higher profitability ratios, larger sized and
higher research and developments than companies that do not pay dividends. Also, it
is found that some companies with financial difficulties still paying cash dividends.
Also, there are solid financial companies that do not pay cash dividends at all. It
seems that managerial and behavioral issues are important factors to determine a
company’s cash dividend policy
INTRODUCTION
The decision to establish a stable cash dividend is, as any other decision making,
influenced by the environment of and the context of such decision. The tendencies in cash
dividend policy are not only influenced by internal factors such as investment opportunity,
profitability and liquidity of companies, but also, influenced by external factors (Jensen &
Revista Empresarial Inter Metro / Inter Metro Business Journal Fall 2008 / Vol. 4 No. 2 / p. 24
Johnson, 1995; Jensen & Smith, 1984; Lintner, 1956). The uncertainty with respect to the world-
wide policy, growth, macroeconomic problems, stability, technology and changes in consumers
tastes influences managers’ decision making (Roberto, 2002). Available information in the
financial markets reduces the uncertainty and leads to better decisions about the company’s
performance.
Cash dividends studies are related to behavioral theories such as "Agency Theory" and
"Signaling Theory" (Baker & Powell, 1999), or financial theories related to the performance,
investment, and financing opportunities (Fama, 1974, 2001). This article is mainly concerned
with the financial factors influenced and related to cash dividend policy. In differentiating
between companies that adopt cash dividend policy and companies that do not adopt such policy,
this article is organized as follows: the following section discusses the theoretical and empirical
issues related to cash dividends. The data and methodology is described in section three. The
data interpretation and results are given in section four. In section five, the main conclusions are
presented.
Theoretical Background
Controversies among empirical studies related to cash dividend policy exist. Although the
cash dividends decision affect the structure of capital (Gordon, 1959), the relation between cash
dividend announcements and share prices is not obvious (Bernstein, 1996; Black, 1976;
Dempsey, Laber & Rozeff, 1993; Holder, Langrehr & Hexter, 1998; Litzenberger &
Ramaswamy, 1982; Miller, 1986; Brigham & Gapenski, 2002; Brealey & Myers, 2002; Van
Horne, 2001).
Through cash dividend policy managers reduce principle-agent relationship costs (Ross,
1973; Jensen & Meckling, 1976; Rozeff, 1982; Easterbrook, 1984; Jensen, 1986; Alli, Khan &
Revista Empresarial Inter Metro / Inter Metro Business Journal Fall 2008 / Vol. 4 No. 2 / p. 25
Ramirez, 1993; Holder et. al., 1998). The announcements of cash dividends signal information to
investors that include the company’s efficiency such as the profitability, liquidity and investment
opportunity (Hansen, Kumar & Shome, 1994; Miller, 1999; Black, Ketcham & Schweitzer,
1995; DeAngelo & DeAngelo, 1990; Alli et. al., 1993). According to Gonedes (1978) and Watts
(1973, 1976), unexpected dividends do not influence the stock markets. Managers usually
establish a stable cash dividend policy to avoid sending negative information to investors
(Dewenter & Warther, 1998; Nadler, 1977; Escherich, 2000). Companies with an unstable cash
flow pay a greater proportion of cash dividends than companies with stable cash flow (Bradley,
Capozza & Sequin, 1998).
Asymmetry of information exists on the future of the company’s profits and the effects of
the announcement of cash dividend policy (Miller & Rock, 1985). The investors’ reaction to
changes in cash dividends influences companies to be caution to increase cash dividends except
that the increase will remain for longer term (Dyl & Weigand, 1998; Holder et. al., 1998;
Kallberg, Liu & Srinivasan, 2003; Lintner, 1956; Benartzi et. al., 1997; Fama & Babiak, 1968).
It is assumed that companies with unstable profits pay little cash dividends to maintain cash
dividends constant, to minimize the cost of external financing and to signal positive information
to investors (Howe & Gronewoller, 1990; Kalay, 1980; Moh'd, Perry & Rimbey, 1995; Baker &
Wurgler, 2002; Lipson et. al., 1998; Pan, 2001; Baker, Farrelly & Edelman, 1985; Baker &
Powell, 1999). In this sense, it is expected to observe no significant change in cash dividends
trends.
The theory of residual dividend suggests that a company will pay dividends only when
generated gains that are not used for investment (e.g., Alli et. al., 1993; Keown et. al., 2002).
Companies that are experimenting higher rate of growth will need to maintain minimum

Revista Empresarial Inter Metro / Inter Metro Business Journal Fall 2008 / Vol. 4 No. 2 / p. 26
payments of dividends to avoid external financing costs (Holder et. al., 1998; Rozeff, 1982).
Easterbrook (1984) and Jensen (1986) state that investment opportunities an important factor
affecting dividends policy. Ross (1977) and Bhattacharya (1979) argue that companies with
profitable projects are able to pay higher dividends to be differentiated of those organizations
with less profitable projects.
The relation between share price and dividends announcements depends on how much
information is contained in the announcements and how much the information influences the
investors’ expectations (Black et. al., 1995). For the vast majority of public companies, cash
dividend announcement is an important factor to maximize the value of shareholders (Escherich,
2000; Keown et. al., 2002). However, considerable judgmental and empirical studies suggest that
the dividend policy is irrelevant (Black, 1976; Black & Scholes, 1974; Jose & Stevens, 1989;
Miller & Scholes, 1978) where others expose that it affects the value of the company (Baker et.
al., 1985; Baker & Powell, 1999; Litzenberger & Ramaswamy, 1979; Long, 1978; Sterk &
Vanderberg, 1990; Goshen, 1995; Keown et. al., 2002).
Fama and French (2001) suggest three characteristics that affect the decision to pay
dividends: the yield, the investment opportunity and the company’s size. They studied the
incidence of the companies that pay dividends during the period from the year 1926 to the year
1999, with special interest in the period (1972-1999). The proportion of companies that paid
dividends diminished greatly after the year 1978, of 6.5% to 2.08% in the year 1999. The
proportion of companies that pay dividends diminished partly because of the changing
characteristics of the corporations that are quoted publicly. The population of these companies
tends to be of smaller size, low yield and with investment opportunities. All these characteristics
Revista Empresarial Inter Metro / Inter Metro Business Journal Fall 2008 / Vol. 4 No. 2 / p. 27
are typical in companies that never have paid dividends. Fama and French (2001) argue that
companies have become less motivated to pay dividends independently of its characteristics.
The announcement of cash dividends reflects the companies’ investment plans. When a
company has investment opportunities then there is no need to pay cash dividends, and the
announcement of cash dividends may reflects that the company has less investment opportunities
(Baker, 1989; Brook et. al.,1998; Baker & Wurgler, 2002; Pan, 2001). Financial risk is another
factor that influence companies not adopt cash dividends (Ofek, 1993; Dyl & Weigand, 1998).
DeAngelo and DeAngelo (1990) found that one third part of the companies studied that showing
financial risk does not reduce dividends. These companies confront transaction costs and require
other sources of financing to replace money assigned for cash dividends (Holder et. al., 1998).
The size of the company is an important factor to explain cash dividends. Larger-sized
companies tend to have an easier access to capital markets. This is by reducing the dependency
on funds generated internally and allows payment of higher rate of dividends (Holder et. al.,
1998; Lloyd, Jahera & Page, 1985; Vogt, 1994). A controversy about the relation between the
company’s size and cash dividend announcements exists. Mozes and Rapaccioli (1995) argue
that the company’s size is independent of the decision of dividends payments. However, Bajaj
and Vijh (1990) argue that the effects in the share price due to changes in dividends are more
significant for smaller sized companies. According to Gaver and Gaver (1993), the yield and
payment of dividends is positively related to the size of the company. Dyl and Weigand (1998)
found that the company’s risk is significantly smaller immediately after the declaration of initial
dividends. The change in risk is more pronouncing in larger sized companies than in smaller
sized companies.

Revista Empresarial Inter Metro / Inter Metro Business Journal Fall 2008 / Vol. 4 No. 2 / p. 28
The theory of tax-preference explains why investors prefer dividends for contributing
reasons since the capital gains in the U.S. contribute less than normal profit. This implies that
companies maintain a lower rate of dividends payments to maximize share prices (Fama &
French, 1998). Investors in low taxation levels prefer shares that pay high dividends when it
compares to investors in high taxation levels (Brennan, 1970; DeAngelo & Masulis, 1980; Elton
& Gruber, 1970; Litzenberger & Ramaswamy, 1979; Long, 1978).
Data and Methodology
The sample consists of 132 US manufacturing companies. The main source of data is from
the SEC’ 10K report of US manufacturing companies during the period started in the year 1994
and ended in the year 2003. About 60% of companies in the sample pertain to the industrial
classification 35 that includes establishments engaged in manufacturing industrial and
commercial machinery and equipment and computers. The remaining companies pertain to
industrial classification 37 that includes establishments engaged in manufacturing equipment for
transportation of passengers and cargo by land, air, and water.
The main objective of this article is to verify whether companies that adopt cash dividends
policy and companies that do not adopt such policy have, on average, different financial
characteristics. For this aim, we used several financial variables consist of, first, profitability
ratios, second, liquidity ratios third, expansion and investment, fourth investors perceptions, fifth
companies risk, and sixth, companies’ size (see Table 1). The t-test were used to verify if the
financial variables averages are the same between companies that pay dividends (CD) and
companies that do not pay dividends (NCD).

Revista Empresarial Inter Metro / Inter Metro Business Journal Fall 2008 / Vol. 4 No. 2 / p. 29
Similar to Aivazian, Booth and Cleary (2001) and Fama and French (2001), the regression
model ( itijtjiit XD ) is used. Where (i = 1, 2 … N; t = 1, 2 … T; N = 132; T is
number of variables). The dependent variable itD is continuous and reflects the dividend paid by
company "i" in year "t". i is the intercept andijtX is the independent variable "j" for company
"i" in year "t". Different ’s are the coefficients for the independent variables and it is the error
term. Several tests were used to validate the regression model. First, we apply ordinary
regression to all observations [N x T (146 x 10)]. Durbin Watson test were used to verify the
model. The variable coefficient of this regression were used to calculate the regression residuals
( ti, ) and to obtain )...,,3,2(ˆ2
1,
1,Tt
ti
tiit
i . After the transformation, the regression
model is as follows:
Where,
,ˆ1,
*
tiiitit DDD
,ˆ1,
*
ti
i
itit TA
OI
TA
OI
TA
OI,ˆ
1,
*
ti
i
itit CL
CA
CL
CA
CL
CA
,lnˆlnln 1,
*
tiiitit MVEMVEMVE
,&
ˆ&&
1,
*
ti
i
itit NS
DR
NS
DR
NS
DR
,ˆ1,
*
tiiitit ManufManufManuf
,ˆ1,
*
tiiitit MultinMultinMultin
,ˆ1,
*
tiiititu
(i = 1, 2, …, N; t = 2, 3, …, T).
The residuals *ˆitu were used to estimate the variance of *ˆ
itu to minimize the problem of
heteroskedasticity.
**
6
*
5
*
4
*
3
*
2
*
1
* &)ln(
ititit
it
it
itit
uMultinManufNS
DRMVE
CL
CA
TA
OIDit

Revista Empresarial Inter Metro / Inter Metro Business Journal Fall 2008 / Vol. 4 No. 2 / p. 30
T
t
itui uKT
s2
2*2 ˆ1
1 (i = 1, 2, …, N; T = 10; K = 6).
The second transformation is used to obtain the following model:
****
6
**
5
**
4
**
3
**
2
**
1
** &)ln(
ititit
it
it
itit
uMultinManufNS
DRMVE
CL
CA
TA
OIDit
Where,
ui
it
itS
DD
*
**
,
*
**
ui
it
it S
TA
OI
TA
OI
,
*
**
ui
it
it S
CL
CA
CL
CA
,ln
ln
*
**
ui
it
itS
MVEMVE
,
&
&
*
**
ui
it
it S
NS
DR
NS
DR
,*
**
ui
it
itS
ManufManuf
,*
**
ui
it
itS
MultinMultin
,*
**
ui
it
itS
uu
(i = 1, 2, …, N; t = 2, 3, …, T).
Data Interpretation and Results
From the data, companies that have paid cash dividends represents about one third of the
total companies in the sample. In the year 2000, the number of companies that have paid cash
dividends increased to 48 and then decreased to reach 44 companies in year 2002 and 2003. It is
assumed that the 9-11 event affected cash dividends trend as well as the profitability of
Revista Empresarial Inter Metro / Inter Metro Business Journal Fall 2008 / Vol. 4 No. 2 / p. 31
companies, but the data do not confirm that manufacturing companies, on average, are
significantly changing the dividend trend. This contradicts the Fama and French (2001) argument
that the number of companies paying dividends is decreasing significantly regardless of the
characteristics of companies.
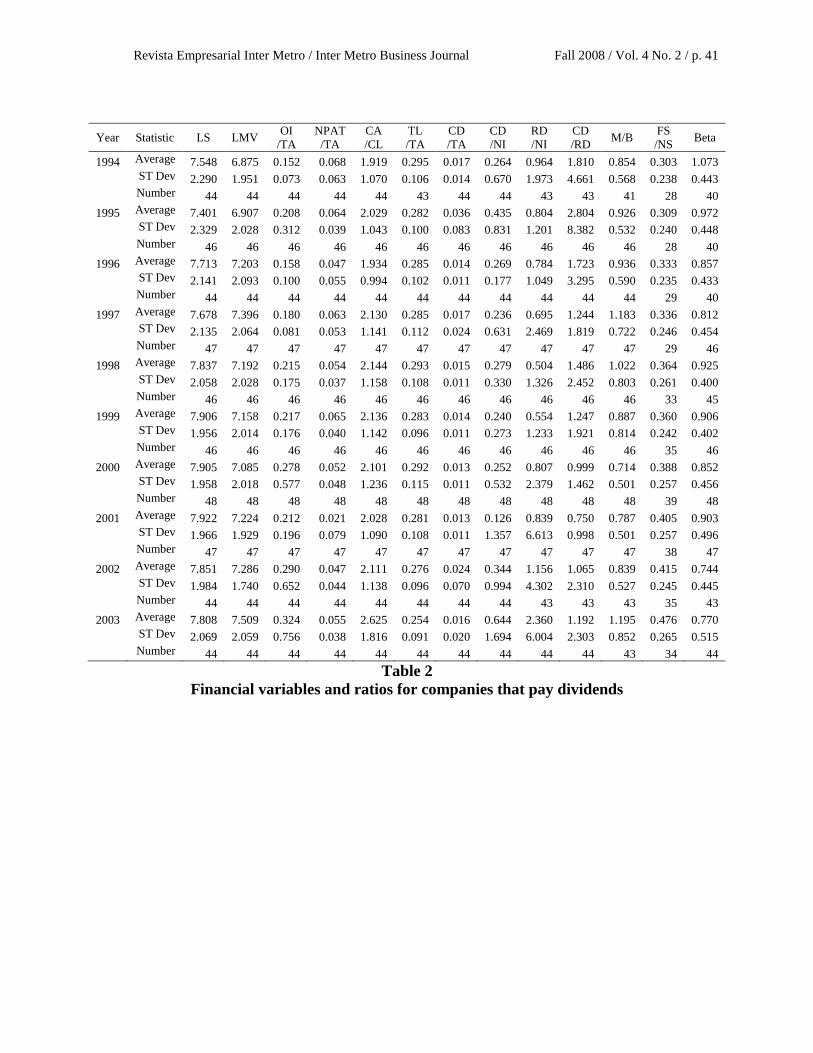
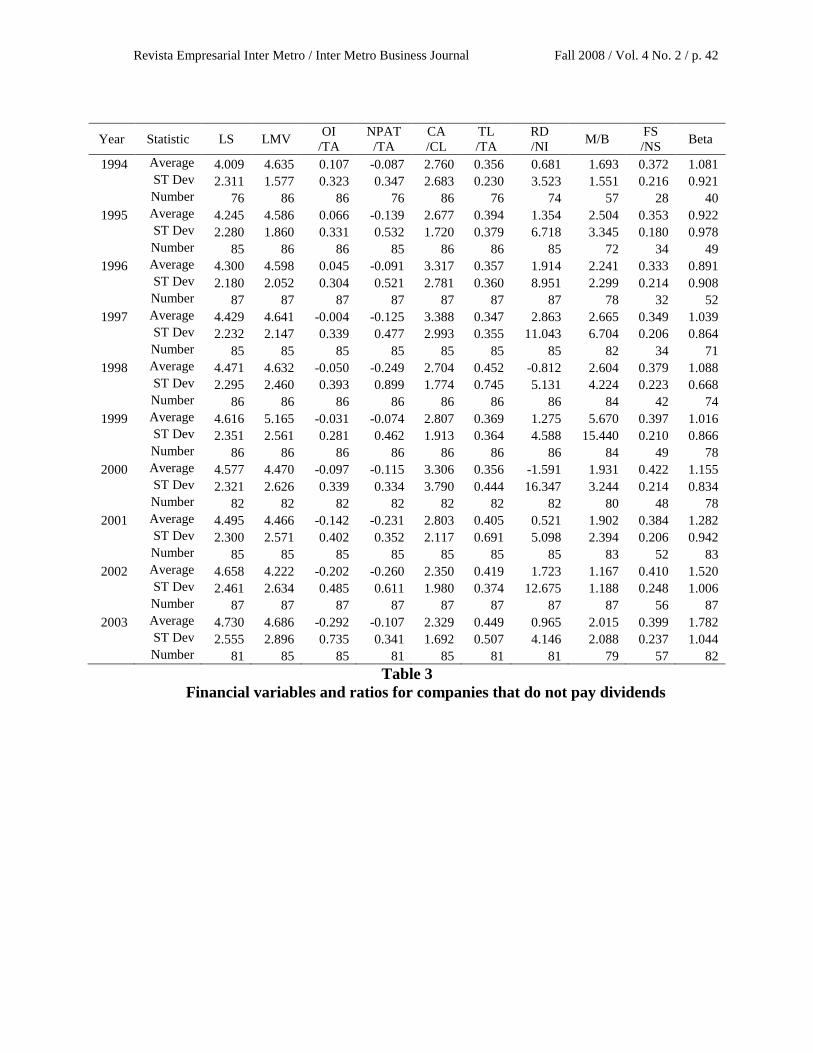
Not surprisingly, on average all companies reflect a decrease in operating profit and net
income after the year 2000. In the period from the year 1994 to the year 2003, Operating income
to total assets (OI/TA) average is 22.23% for companies that pay dividends and - 6% for
companies that do not pay dividends. OI/TA average turned to negative after the year 1997 for
companies that do not pay dividends. The net profit after tax to total assets (NPAT/TA) sign
during all the period is negative and is decreasing after the year 2000 for companies that do not
pay dividends. However, for companies that pay dividends, OI/TA ratio shows a slight decrease
in the year 2001 and the trend is increasing in the whole period. The data shows that OI/TA ratio
average and NPAT/TA ratio average differ between companies that do not pay dividends and
companies that pay dividends (t-test is significant at the 1% level). This confirms the assertion
that the profitability of companies, on average, is an important determinant for cash dividend
decision.
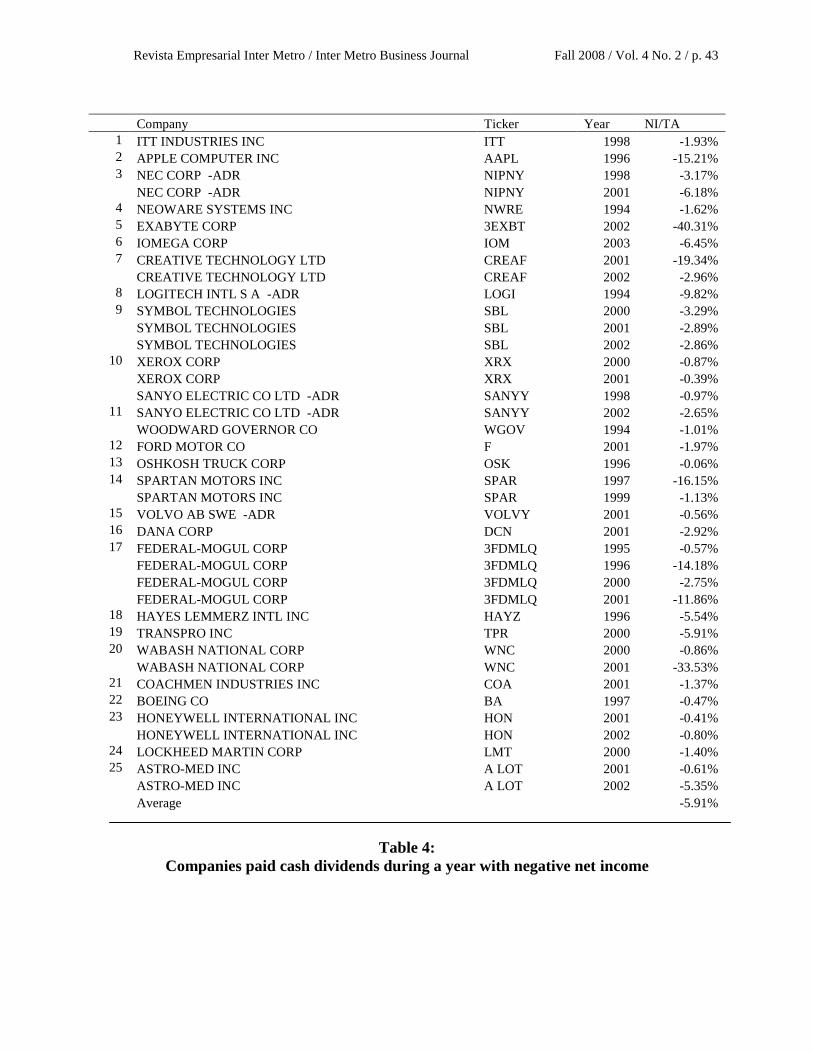
However, from 48 companies that declared cash dividends in the sample, 25 companies
were found with negative net income to total assets (NI/TA), at least, in one year where they
declared cash dividends (seven companies in two years, two companies in three years, and one
company in four years). For these particular companies cash dividends policy is stable and is not
correlated with net income. One possible explanation is that these companies expect to have
higher future cash flow and send a positive sign to investors about the companies’ future
performance and/or they are paying cash dividends from retained returns. Also, it is possible that
Revista Empresarial Inter Metro / Inter Metro Business Journal Fall 2008 / Vol. 4 No. 2 / p. 32
despite the negative expectations of net profit managers still want to communicate positive news
to investors. This confirms the findings of DeAngelo and DeAngelo (1990).
The averages of current assets to current liabilities (CA/CL) are 48% for companies that
pay dividends (PD) and 35% for companies that do not pay dividends (NPD). Both groups show
a slightly increase in CA/CL in the year 2001. Total liabilities to total assets (TL/TA) averages in
the sample are 28% for PD and 39% for NPD. The trend for companies that PD is ranged
between 27% and 29%, but it is increasing for NPD and it ranges between 29% and 42%. This is
consistent with the argument that the liquidity of companies is an important determinant for cash
dividend decision.
The average for the measures of cash dividends to total assets (CD/TA) is 2% for PD. The
average of cash dividends to net income (CD/NI) is 31%. The research and development (R&D)
to net income (RD/NI) averages are 95% for PD and 89% for NPD. The RD/NI averages
fluctuate from 50% to 234% for PD and from -159% to 286% for NPD. The cash dividend to
R&D (CD/RD) average is 1.43% for PD. These results are consistent with the assumptions that
companies that invest larger amounts in R&D have a trend to pay more dividends.
The market to book (M/B) averages are 93% for PD and 244% for NPD. The M/B average
fluctuates from 71% to 119% for PD and from 169% to 267% for NPD. This confirms the
assertion that investors perceive companies that do not pay dividends with higher opportunities
of expansions and investments.
Beta averages are 88% for PD and 118% for NPD. Beta averages fluctuates from 74% to
107% for PD and from 89% to 178% for NPD. Therefore, investors consider companies that pay
cash dividends are less risky than companies that do not pay cash dividends.
Revista Empresarial Inter Metro / Inter Metro Business Journal Fall 2008 / Vol. 4 No. 2 / p. 33
The natural logarithm of sales (LS) average is 7.76 for PD and 4.45 for NPD. The natural
logarithm of market value (LMV) average is 7.18 for PD and 4.61 for NPD. The data shows that
The LS average and The LMV average differ between companies that do not pay cash dividends
and companies that pay cash dividends and t-test is significant at the 1% level. This confirms the
assertion that larger sized companies, on average, pay more cash dividends than smaller sized
companies.
To verify the previous results of the liquidity, profitability, and companies’ size, regression
model were used. The following is the obtained adjusted regression model:
ititit
it
it
itit
it MultinManufNS
DRMVE
CL
CA
TA
OID 6,5,
4,
3,
2,1,
62.1518.53&
04.6)ln(40.2166.499.6
The R2 and the adjusted R
2 are 74.4% and 74.2, respectively.
The variable OI/TA is correlated positively with dividend payment (β = 6.987, ρ < .01).
this is consistent with Benartzi et al. (1997), DeAngelo, DeAngelo y Skinner (1992), Fama y
Babiak (1968), Fama y French (1998) y Lintner (1956). The variable CA/CL has coefficient of
4.656 (p < .01). This is consistent with the importance of companies’ liquidity to dividend
decision Holder et al. (1998). MVE is a proxy for the company’s size and it is significant at the
1% level (β = 21.395, ρ < .01). This is en accordance with Fama y French (2001), Holder et al.
(1998), Lloyd et al. (1985) y Vogt (1994). Similar to Allí, Khan y Ramírez (1993) and Baker et
al. (2001), R&D is negatively correlated with dividend payment and it is significant at the 1%
level.
Conclusions
Internal and external factors influence the decision of pay cash dividends. The objective of
this article is to verify whether, on average, different financial characteristics exist between
companies that pay cash dividends and companies that do not pay cash dividends. For this
Revista Empresarial Inter Metro / Inter Metro Business Journal Fall 2008 / Vol. 4 No. 2 / p. 34
objective, the financial variables or ratios used are related to profitability ratios, liquidity ratios,
expansion and investment, investors' perceptions, companies' risk and companies' size.
The data confirms the assertions that, on average, the profitability, liquidity and size of
companies are important determinants for cash dividend decision. The Beta examined revealed
that the investors consider companies that pay cash dividends are less risky than companies that
do not pay dividends. The companies that have paid cash dividends represents about one third of
the total companies in the sample. The data do not confirm that manufacturing companies on
average are significantly changing the dividend trend. These disagree with previous studies of
Fama y French (2001).
Managers’ judgments influence cash dividend policy. From the total data, 48 companies
were found that paid cash dividends, and 25 were found with negative net income at least in one
year. This is an indication that managers may try to send a positive signal to investors despite
that their companies are associated with net loss.
References
Alli, K. L., Khan, A. Q. & Ramirez, G. G. (1993). Determinants of corporate dividend policy: a
factorial analysis. The Financial Review, 28 (4), 523-547.
Bajaj, M. & Vijh, A. (1990). Dividend clienteles and the information content of dividend
changes. Journal of Financial Economics, 26 (2), 193-201.
Baker, H. K. (1989). Why companies pay no dividends. Akron Business and Economic
Review, Summer, 48-61.
Baker, H. K., Farrelly, G. E. & Edelman, R. B. (1985). A survey of management views on
dividend policy. Financial Management, 14 (3), 78-84.
Baker, H. K. & Powell, G. E. (1999). How corporate managers view dividend policy?.
Quarterly Journal of Business and Economics, 38 (2), 17-27.

Revista Empresarial Inter Metro / Inter Metro Business Journal Fall 2008 / Vol. 4 No. 2 / p. 35
Baker, H. K., Veit, E. T. & Powell, G. E. (2001). Factors influencing dividend policy decisions
of Nasdaq firms. The Financial Review, 36 (3), 19-37.
Baker, M. & Wurgler, J. (2002). A catering theory of dividends. NBER, November 7, 1-61.
Benartzi, S., Michaely, R. & Thaler, R. (1997). Do changes in dividends signal the future or the
past. Journal of Finance, 52, 1007-1023.
Bernstein, P. L. (1996). Dividends: The puzzle. Journal of Applied Corporate Finance, 9 (1),
4-15.
Bhattacharya, S. (1979). Imperfect information, dividend policy and the 'bird in the hand' fallacy.
Bell Journal of Economics, 10 (1), 259-70.
Black, F. & Scholes, M. (1974). The effects of dividend yield and dividend policy on common
stock prices and returns. Journal of Financial Economics, 1 (1), 1-22.
Black, F. (1976). The dividend puzzle. Journal of Portfolio Management, 2 (2), 5-8.
Black, H. R., Ketcham, D. C. & Schweitzer, R. (1995). The direction of bank holding company
stock prices to dividend cuts or omissions. Mid-Atlantic Journal of Business, 31 (3),
217-231.
Bradley, M., Capozza, D. R. & Sequin, P. J. (1998). Dividend policy and cash-flow uncertainty.
Real Estate Economics, 26 (4), 555-572.
Brealey, R. A. & Myers, S. C. (2002). Principles of corporate finance, (7th
ed.), New York,
NY: McGraw-Hill.
Brennan, M. (1970). Taxes, market valuation, and corporate financial policy. National Tax
Journal, December, 417-427.
Brigham, E. F. & Gapenski, L. C. (2002). Financial management: Theory and practice, (10th
ed.). United States: Thomson Learning, Inc.
Brook, Y., Charlton, W. & Hendershott, R. (1998). Do firms use dividends to signal large future
cash flows?. Financial Management, 27, 46-57.
DeAngelo, H. & DeAngelo, L. (1990). Dividend policy and financial distress: An empirical
investigation of troubled NYSE firms. Journal of Finance, 45, 1415-1431.
DeAngelo, H. & Masulis, R. W. (1980). Optional capital structure under corporate and personal
taxation. Journal of Financial Economics, March, 134-147.
Revista Empresarial Inter Metro / Inter Metro Business Journal Fall 2008 / Vol. 4 No. 2 / p. 36
DeAngelo, H., DeAngelo, L. & Skinner, D. J. (1996). Reversal of fortune: Dividend signaling
and the disappearance of sustained earnings growth. Journal of Financial Economics,
40, 341-371.
Dempsey, S. J., Laber, G. & Rozeff, M. S. (1993). Dividend policies in practice: Is there and
industry effect?. Quarterly Journal of Business and Economics, 32 (4), 3-13.
Dewenter, K. L. & Warther, V. A. (1998). Dividends asymmetric information, and agency
conflicts: Evidence from a comparison of the dividend policies of Japanese and U.S.
firms. Journal of Finance, 53, 879-904.
Dyl, E. & Weigand, R. (1998). The information content of dividend initiations: Additional
evidence. Financial Management, 27, 27-35.
Easterbrook, F. H. (1984). Two agency-cost explanations of dividends. The American
Economic Review, 74 (3), 650-659.
Elton, E. & Gruber, M. (1970). Marginal stockholder tax rates and clientele effect. Review of
Economics and Statistics, 52 (February), 68-74.
Escherich, F. (2000). Deliberating on dividend policy. Directors & Boards, 25 (1), 33-38.
Fama, E. (1974). The empirical relationships between dividend and investment decisions of
firms. American Economic Review, June, 304-314.
Fama, E. & Babiak, H. (1968). Dividend policy: An empirical analysis. Journal of American
Statistical Association, December, 1132-1161.
Fama, E. F. & French, K. R. (1998). Taxes, financing decisions, and firm value. Journal of
Finance, 53, 819-829.
Fama, E. F. & French, K. R. (2001). Disappearing dividends: Changing firm characteristics or
lower propensity to pay. Journal of Financial Economics, 60, 3-43.
Farrelly, G. E. & Baker, H. K. (1989). Corporate dividends: Views of institutional investors.
Akron Business and Economic Review, 20 (2), 89-100.
Gaver, J. J. & Gaver, K. M. (1993). Additional evidence on the association between the
investment opportunity set and corporate financing, dividend and compensation policies.
Journal of Accounting and Economics, January/April/July, 125-160.
Gonedes, N. (1978). Corporate signaling, external accounting and capital market equilibrium:
Evidence on dividends income and extraordinary items. Journal of Accounting
Research, Spring, 26-38.
Revista Empresarial Inter Metro / Inter Metro Business Journal Fall 2008 / Vol. 4 No. 2 / p. 37
Gordon, M. J. (1959). Dividends, earnings, and stock prices. The Review of Economics and
Statistics, 99-105.
Goshen, Z. (1995). Shareholder dividend options. Yale Law Journal, 104 (4), 881-932.
Hansen, R. S., Kumar, R. & Shome, D. K. (1994). Dividend policy and corporate monitoring:
evidence from the regulated electric industry. Financial Management, 23 (1), 16-22.
Holder, M. E., Langrehr, F. W. & Hexter, L. (1998). Dividend policy determinants: an
investigation of the influences of stakeholder theory. Financial Management, 27 (3), 73-
85.
Howe, K. M. & Gronewoller, P. L. (1990). Issue costs in Fisher’s two-period model. The
Financial Review, 25 (2), 335-343.
Jensen, G. & Johnson, J. (1995). The dynamics of corporate dividend reductions. Financial
Management, 24 (4), 31-51.
Jensen, M. & Meckling, W. (1976). Theory of the firm: Management behavior, agency costs and
ownership structure. Journal of Financial Economics, October, 305-316.
Jensen, M. C. (1986). Agency costs of free cash flow, corporate finance, and takeovers.
American Economic Review, May, 659-665.
Jensen, M. C. & Smith, C. W. (1984). The theory of corporate finance: A historical overview.
New York, NY: McGraw-Hill.
Kalay, A. (1980). Signaling, information content, and the reluctant to cut dividends. Journal of
Financial and Quantitative Analysis, 15 (November), 855-863.
Kallberg, J. G., Liu, C.H. & Srinivasan, A. (2003). Dividend pricing models and REITs. Real
Estate Economics, 31 (3), 435-450.
Keown, A. J., Martin, J. D., Petty, J. W. & Scott, D. F. (2002). Financial management:
Principles and applications (9th
ed.). New York, NJ: Prentice Hall.
Lintner, J. (1956). Distribution of incomes of corporations among dividends, retained earnings
and taxes. American Economics Review, 46 (2), 97-113.
Lipson, M., Maquieira, C. P. & Megginson, W. (1998). Dividends initiations and earnings
surprises. Financial Management, 27 (3), 36-42.
Litzenberger, R. H. & Ramaswamy, K. (1982). The effects of dividends on common stock
prices. Journal of Finance, 37 (2), 429-443.
Revista Empresarial Inter Metro / Inter Metro Business Journal Fall 2008 / Vol. 4 No. 2 / p. 38
Litzenberger, R. H. & Ramaswamy, K. (1979). The effect of personal taxes and dividends on
capital asset prices. Journal of Financial Economics, 7 (2), 163-95.
Lloyd, W. P., Jahera, J. S. & Page, D. E. (1985). Agency costs and dividend-payout ratios.
Quarterly Journal of Business and Economics, Summer, 19-29.
Long, J. (1978). The market valuation of cash dividends: A case to consider. Journal of
Financial Economics, 6, 235-264.
Miller, M. H. & Rock, K. (1985). Dividend policy under asymmetric information. Journal of
Finance, 40 (4), 1031-1051.
Miller, M. H. & Scholes, M. S. (1978). Dividends and taxes. Journal of Financial Economics, 6
(4), 333-64.
Miller, M. H. & Scholes, M. S. (1982). Dividends and taxes: Some empirical evidence. Journal
of Political Economics, 90 (6), 1118-41.
Miller, M. H. (1986). Behavioral rationality in finance: The case of dividends. Journal of
Business, 59 (4), 451-473.
Miller, M. H. (1999). The history of finance. Journal of Portfolio Management, 25 (4), 95-101.
Mozes, H. & Rapaccioli, D. (1995). The relation among dividend policy, firm size, and the
information content of earnings announcements. Journal of Financial Research, 18 (1),
75-88.
Nadler, P. S. (1977). Banks confronted with dilemma in deciding dividend policy. American
Banker, November, 1-4.
Ofek, E. (1993). Capital structure and firm response to poor performance: An empirical analysis.
Journal of Financial Economics, 34, 3-15.
Pan, M. (2001). Aggregate dividend behavior and permanent earnings hypothesis. The Financial
Review, 36 (1), 23-38.
Roberto, M. A. (2002). Making difficult decisions in turbulent times: In their own way,
complexity and ambiguity tyrannize decision-making. What managers need are strategies
for making clear, accurate judgments under stressful conditions. Ivey Business Journal,
66 (3), 15-20.
Ross, S. A. (1973). The economic theory of agency: The principal’s problems. American
Economic Review, 62 (2), 134-148.
Rozeff, M. S. (1982). Growth, beta and agency costs as determinants of dividend-payout ratios.
Journal of Financial Research, Fall, 249-259.
Revista Empresarial Inter Metro / Inter Metro Business Journal Fall 2008 / Vol. 4 No. 2 / p. 39
Sterk, W. & Vandenberg, P. (1990). The market valuation of cash dividends and the tax
differential theory of dividend policy: A case revisited. The Financial Review, 25 (3),
441-455.
Van Horne, J. (2001). Financial management and policy (12th
ed.), New York, NY: Prentice
Hall.
Vogt, S. C. (1994). The cash flow/investment relationship: Evidence from U.S. manufacturing
firms. Financial Management, Summer, 3-16.
Watts, R. (1973). The information contents of dividends. Journal of Business, 46 (2), 191-211.
Watts, R. (1976). Comments on “on the information content of dividends”. Journal of Business,
46 (1), 81-85.

Revista Empresarial Inter Metro / Inter Metro Business Journal Fall 2008 / Vol. 4 No. 2 / p. 40
Definitions of the financial variables
Profitability ratios
Operating income to total assets (OI/TA)
Net profit after tax to total assets (NPAT/TA)
Liquidity ratios
Current assets to current liabilities (CA/CL)
Total liabilities to total assets (TL/TA)
Expansion and investment
Cash dividend to total assets (CD/TA)
Cash dividend to net income (CD/NI)
Research and development to net income (RD/NI)
Cash dividend to research and development (CD/RD)
Investors’ perceptions
Market to book ratio (M/B)
Companies’ risk
Beta
Companies’ size
Natural logarithm of sales (in thousands) (LS)
Natural logarithm of market value (in thousands) (LMV)
Table 1
Revista Empresarial Inter Metro / Inter Metro Business Journal Fall 2008 / Vol. 4 No. 2 / p. 41
Year Statistic LS LMV OI
/TA
NPAT
/TA
CA
/CL
TL
/TA
CD
/TA
CD
/NI
RD
/NI
CD
/RD M/B
FS
/NS Beta
1994 Average 7.548 6.875 0.152 0.068 1.919 0.295 0.017 0.264 0.964 1.810 0.854 0.303 1.073
ST Dev 2.290 1.951 0.073 0.063 1.070 0.106 0.014 0.670 1.973 4.661 0.568 0.238 0.443
Number 44 44 44 44 44 43 44 44 43 43 41 28 40
1995 Average 7.401 6.907 0.208 0.064 2.029 0.282 0.036 0.435 0.804 2.804 0.926 0.309 0.972
ST Dev 2.329 2.028 0.312 0.039 1.043 0.100 0.083 0.831 1.201 8.382 0.532 0.240 0.448
Number 46 46 46 46 46 46 46 46 46 46 46 28 40
1996 Average 7.713 7.203 0.158 0.047 1.934 0.285 0.014 0.269 0.784 1.723 0.936 0.333 0.857
ST Dev 2.141 2.093 0.100 0.055 0.994 0.102 0.011 0.177 1.049 3.295 0.590 0.235 0.433
Number 44 44 44 44 44 44 44 44 44 44 44 29 40
1997 Average 7.678 7.396 0.180 0.063 2.130 0.285 0.017 0.236 0.695 1.244 1.183 0.336 0.812
ST Dev 2.135 2.064 0.081 0.053 1.141 0.112 0.024 0.631 2.469 1.819 0.722 0.246 0.454
Number 47 47 47 47 47 47 47 47 47 47 47 29 46
1998 Average 7.837 7.192 0.215 0.054 2.144 0.293 0.015 0.279 0.504 1.486 1.022 0.364 0.925
ST Dev 2.058 2.028 0.175 0.037 1.158 0.108 0.011 0.330 1.326 2.452 0.803 0.261 0.400
Number 46 46 46 46 46 46 46 46 46 46 46 33 45
1999 Average 7.906 7.158 0.217 0.065 2.136 0.283 0.014 0.240 0.554 1.247 0.887 0.360 0.906
ST Dev 1.956 2.014 0.176 0.040 1.142 0.096 0.011 0.273 1.233 1.921 0.814 0.242 0.402
Number 46 46 46 46 46 46 46 46 46 46 46 35 46
2000 Average 7.905 7.085 0.278 0.052 2.101 0.292 0.013 0.252 0.807 0.999 0.714 0.388 0.852
ST Dev 1.958 2.018 0.577 0.048 1.236 0.115 0.011 0.532 2.379 1.462 0.501 0.257 0.456
Number 48 48 48 48 48 48 48 48 48 48 48 39 48
2001 Average 7.922 7.224 0.212 0.021 2.028 0.281 0.013 0.126 0.839 0.750 0.787 0.405 0.903
ST Dev 1.966 1.929 0.196 0.079 1.090 0.108 0.011 1.357 6.613 0.998 0.501 0.257 0.496
Number 47 47 47 47 47 47 47 47 47 47 47 38 47
2002 Average 7.851 7.286 0.290 0.047 2.111 0.276 0.024 0.344 1.156 1.065 0.839 0.415 0.744
ST Dev 1.984 1.740 0.652 0.044 1.138 0.096 0.070 0.994 4.302 2.310 0.527 0.245 0.445
Number 44 44 44 44 44 44 44 44 43 43 43 35 43
2003 Average 7.808 7.509 0.324 0.055 2.625 0.254 0.016 0.644 2.360 1.192 1.195 0.476 0.770
ST Dev 2.069 2.059 0.756 0.038 1.816 0.091 0.020 1.694 6.004 2.303 0.852 0.265 0.515
Number 44 44 44 44 44 44 44 44 44 44 43 34 44
Table 2
Financial variables and ratios for companies that pay dividends
Revista Empresarial Inter Metro / Inter Metro Business Journal Fall 2008 / Vol. 4 No. 2 / p. 42
Year Statistic LS LMV OI
/TA
NPAT
/TA
CA
/CL
TL
/TA
RD
/NI M/B
FS
/NS Beta
1994 Average 4.009 4.635 0.107 -0.087 2.760 0.356 0.681 1.693 0.372 1.081
ST Dev 2.311 1.577 0.323 0.347 2.683 0.230 3.523 1.551 0.216 0.921
Number 76 86 86 76 86 76 74 57 28 40
1995 Average 4.245 4.586 0.066 -0.139 2.677 0.394 1.354 2.504 0.353 0.922
ST Dev 2.280 1.860 0.331 0.532 1.720 0.379 6.718 3.345 0.180 0.978
Number 85 86 86 85 86 86 85 72 34 49
1996 Average 4.300 4.598 0.045 -0.091 3.317 0.357 1.914 2.241 0.333 0.891
ST Dev 2.180 2.052 0.304 0.521 2.781 0.360 8.951 2.299 0.214 0.908
Number 87 87 87 87 87 87 87 78 32 52
1997 Average 4.429 4.641 -0.004 -0.125 3.388 0.347 2.863 2.665 0.349 1.039
ST Dev 2.232 2.147 0.339 0.477 2.993 0.355 11.043 6.704 0.206 0.864
Number 85 85 85 85 85 85 85 82 34 71
1998 Average 4.471 4.632 -0.050 -0.249 2.704 0.452 -0.812 2.604 0.379 1.088
ST Dev 2.295 2.460 0.393 0.899 1.774 0.745 5.131 4.224 0.223 0.668
Number 86 86 86 86 86 86 86 84 42 74
1999 Average 4.616 5.165 -0.031 -0.074 2.807 0.369 1.275 5.670 0.397 1.016
ST Dev 2.351 2.561 0.281 0.462 1.913 0.364 4.588 15.440 0.210 0.866
Number 86 86 86 86 86 86 86 84 49 78
2000 Average 4.577 4.470 -0.097 -0.115 3.306 0.356 -1.591 1.931 0.422 1.155
ST Dev 2.321 2.626 0.339 0.334 3.790 0.444 16.347 3.244 0.214 0.834
Number 82 82 82 82 82 82 82 80 48 78
2001 Average 4.495 4.466 -0.142 -0.231 2.803 0.405 0.521 1.902 0.384 1.282
ST Dev 2.300 2.571 0.402 0.352 2.117 0.691 5.098 2.394 0.206 0.942
Number 85 85 85 85 85 85 85 83 52 83
2002 Average 4.658 4.222 -0.202 -0.260 2.350 0.419 1.723 1.167 0.410 1.520
ST Dev 2.461 2.634 0.485 0.611 1.980 0.374 12.675 1.188 0.248 1.006
Number 87 87 87 87 87 87 87 87 56 87
2003 Average 4.730 4.686 -0.292 -0.107 2.329 0.449 0.965 2.015 0.399 1.782
ST Dev 2.555 2.896 0.735 0.341 1.692 0.507 4.146 2.088 0.237 1.044
Number 81 85 85 81 85 81 81 79 57 82
Table 3
Financial variables and ratios for companies that do not pay dividends
Revista Empresarial Inter Metro / Inter Metro Business Journal Fall 2008 / Vol. 4 No. 2 / p. 43
Company Ticker Year NI/TA
1 ITT INDUSTRIES INC ITT 1998 -1.93%
2 APPLE COMPUTER INC AAPL 1996 -15.21%
3 NEC CORP -ADR NIPNY 1998 -3.17%
NEC CORP -ADR NIPNY 2001 -6.18%
4 NEOWARE SYSTEMS INC NWRE 1994 -1.62%
5 EXABYTE CORP 3EXBT 2002 -40.31%
6 IOMEGA CORP IOM 2003 -6.45%
7 CREATIVE TECHNOLOGY LTD CREAF 2001 -19.34%
CREATIVE TECHNOLOGY LTD CREAF 2002 -2.96%
8 LOGITECH INTL S A -ADR LOGI 1994 -9.82%
9 SYMBOL TECHNOLOGIES SBL 2000 -3.29%
SYMBOL TECHNOLOGIES SBL 2001 -2.89%
SYMBOL TECHNOLOGIES SBL 2002 -2.86%
10 XEROX CORP XRX 2000 -0.87%
XEROX CORP XRX 2001 -0.39%
SANYO ELECTRIC CO LTD -ADR SANYY 1998 -0.97%
11 SANYO ELECTRIC CO LTD -ADR SANYY 2002 -2.65%
WOODWARD GOVERNOR CO WGOV 1994 -1.01%
12 FORD MOTOR CO F 2001 -1.97%
13 OSHKOSH TRUCK CORP OSK 1996 -0.06%
14 SPARTAN MOTORS INC SPAR 1997 -16.15%
SPARTAN MOTORS INC SPAR 1999 -1.13%
15 VOLVO AB SWE -ADR VOLVY 2001 -0.56%
16 DANA CORP DCN 2001 -2.92%
17 FEDERAL-MOGUL CORP 3FDMLQ 1995 -0.57%
FEDERAL-MOGUL CORP 3FDMLQ 1996 -14.18%
FEDERAL-MOGUL CORP 3FDMLQ 2000 -2.75%
FEDERAL-MOGUL CORP 3FDMLQ 2001 -11.86%
18 HAYES LEMMERZ INTL INC HAYZ 1996 -5.54%
19 TRANSPRO INC TPR 2000 -5.91%
20 WABASH NATIONAL CORP WNC 2000 -0.86%
WABASH NATIONAL CORP WNC 2001 -33.53%
21 COACHMEN INDUSTRIES INC COA 2001 -1.37%
22 BOEING CO BA 1997 -0.47%
23 HONEYWELL INTERNATIONAL INC HON 2001 -0.41%
HONEYWELL INTERNATIONAL INC HON 2002 -0.80%
24 LOCKHEED MARTIN CORP LMT 2000 -1.40%
25 ASTRO-MED INC A LOT 2001 -0.61%
ASTRO-MED INC A LOT 2002 -5.35%
Average -5.91%
Table 4:
Companies paid cash dividends during a year with negative net income