Embed Size (px)
Citation preview
The Financial Crisis & the P/C Insurance Industry
Challenges Amid the Economic Storm
Robert P. Hartwig, Ph.D., CPCU, PresidentInsurance Information Institute ♦ 110 William Street ♦ New York, NY 10038
Tel: (212) 346-5520 ♦ Fax: (212) 732-1916 ♦ [email protected] ♦ www.iii.org
Central Massachusetts CPCU ChapterWorcester, MA
September 25, 2008
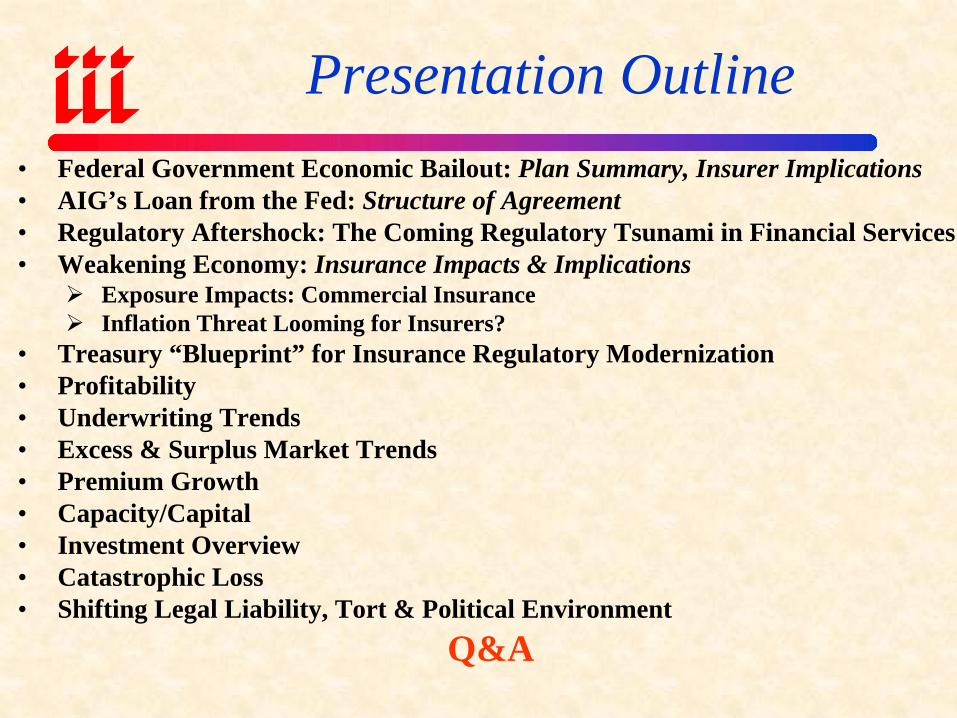
Presentation Outline• Federal Government Economic Bailout: Plan Summary, Insurer Implications• AIG’s Loan from the Fed: Structure of Agreement• Regulatory Aftershock: The Coming Regulatory Tsunami in Financial Services• Weakening Economy: Insurance Impacts & Implications
Exposure Impacts: Commercial InsuranceInflation Threat Looming for Insurers?
• Treasury “Blueprint” for Insurance Regulatory Modernization• Profitability• Underwriting Trends• Excess & Surplus Market Trends• Premium Growth• Capacity/Capital• Investment Overview• Catastrophic Loss• Shifting Legal Liability, Tort & Political Environment
Q&A
Troubled AssetRelief Program
(a.k.a. “The Bailout”)
Plan Details &Insurer Implications
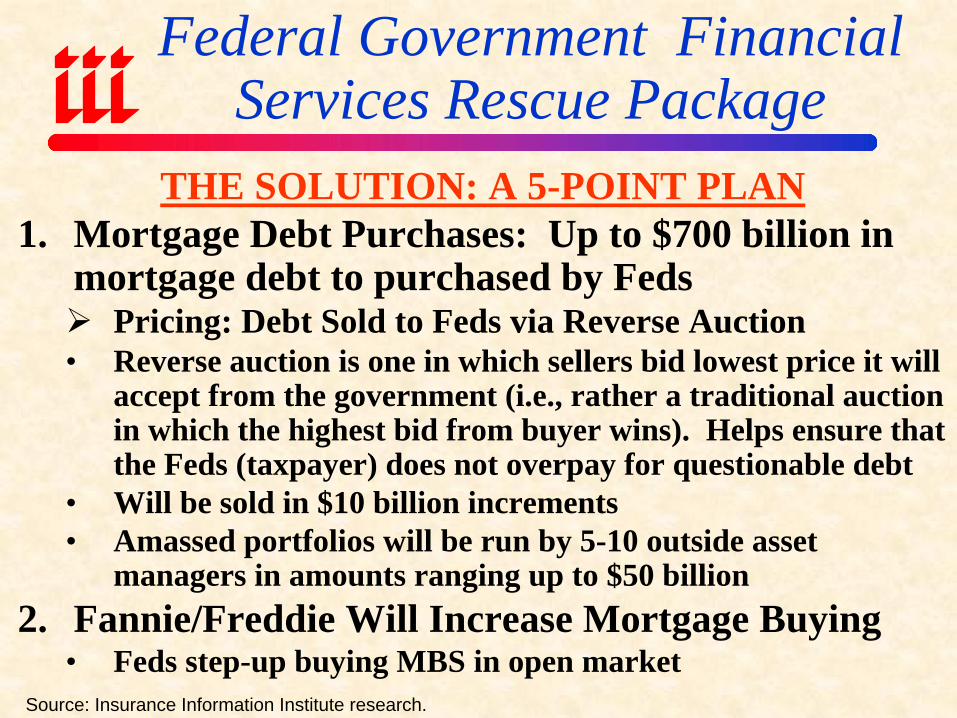
Federal Government FinancialServices Rescue Package
Source: Insurance Information Institute research.
THE SOLUTION: A 5-POINT PLAN1. Mortgage Debt Purchases: Up to $700 billion in
mortgage debt to purchased by FedsPricing: Debt Sold to Feds via Reverse Auction
• Reverse auction is one in which sellers bid lowest price it willaccept from the government (i.e., rather a traditional auction in which the highest bid from buyer wins). Helps ensure that the Feds (taxpayer) does not overpay for questionable debt
• Will be sold in $10 billion increments• Amassed portfolios will be run by 5-10 outside asset
managers in amounts ranging up to $50 billion2. Fannie/Freddie Will Increase Mortgage Buying
• Feds step-up buying MBS in open market
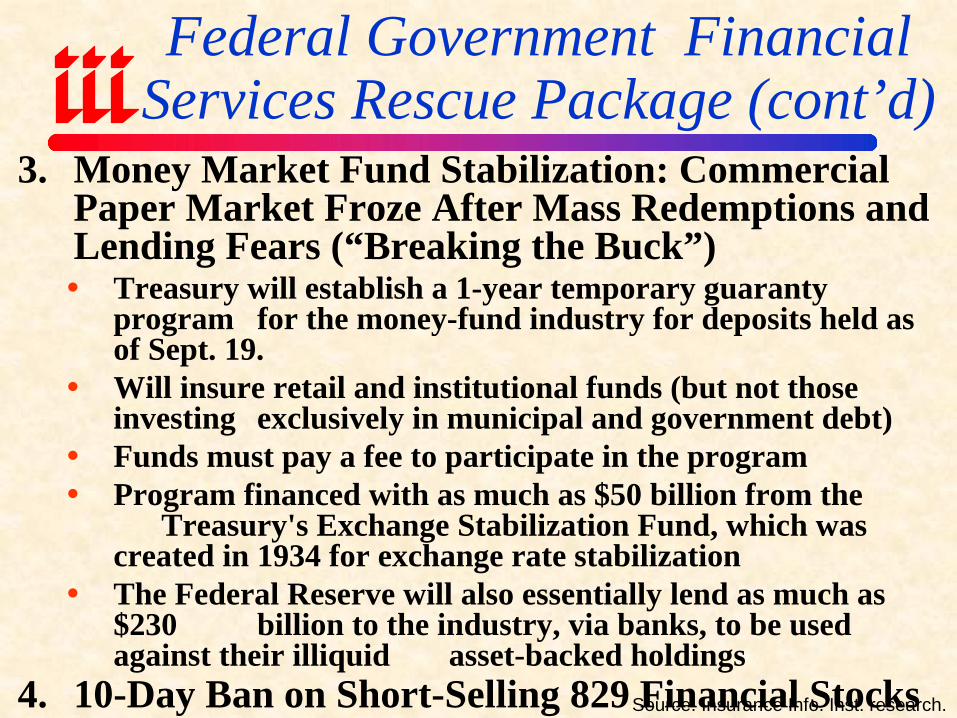
Federal Government FinancialServices Rescue Package (cont’d)
Source: Insurance Info. Inst. research.
3. Money Market Fund Stabilization: Commercial Paper Market Froze After Mass Redemptions and Lending Fears (“Breaking the Buck”)
Treasury will establish a 1-year temporary guaranty program for the money-fund industry for deposits held as of Sept. 19.Will insure retail and institutional funds (but not those investing exclusively in municipal and government debt)Funds must pay a fee to participate in the programProgram financed with as much as $50 billion from the
Treasury's Exchange Stabilization Fund, which was created in 1934 for exchange rate stabilizationThe Federal Reserve will also essentially lend as much as $230 billion to the industry, via banks, to be used against their illiquid asset-backed holdings
4. 10-Day Ban on Short-Selling 829 Financial Stocks

Federal Government FinancialServices Rescue Package (cont’d)
Source: Insurance Info. Inst. research.
5. Conversion of Last 2 Remaining Investment Banks (Goldman Sachs and Morgan Stanley) to Bank Holding Companies
Recognition that Wall Street as we have known it for decades is deadHigh leverage investment bank model no longer viable in
current market environmentNew entities will be subject to stringent federal regulation in exchange for more access to federal dollars/liquidity facilitiesCapital and liquidity requirements will be greatly enhancedReduced leverage means new entities will be less profitable
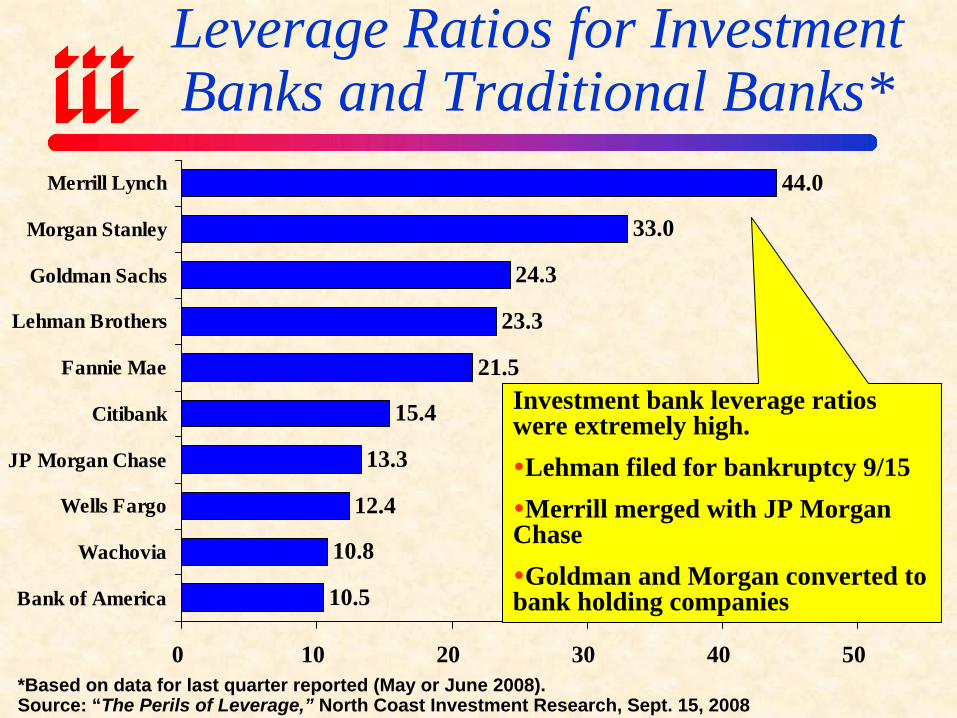
Leverage Ratios for InvestmentBanks and Traditional Banks*
33.0
24.3
23.3
21.5
15.4
13.3
12.4
10.8
10.5
44.0
0 10 20 30 40 50
Merrill Lynch
Morgan Stanley
Goldman Sachs
Lehman Brothers
Fannie Mae
Citibank
JP Morgan Chase
Wells Fargo
Wachovia
Bank of America
*Based on data for last quarter reported (May or June 2008).Source: “The Perils of Leverage,” North Coast Investment Research, Sept. 15, 2008
Investment bank leverage ratios were extremely high. Lehman filed for bankruptcy 9/15Merrill merged with JP Morgan
ChaseGoldman and Morgan converted to
bank holding companies
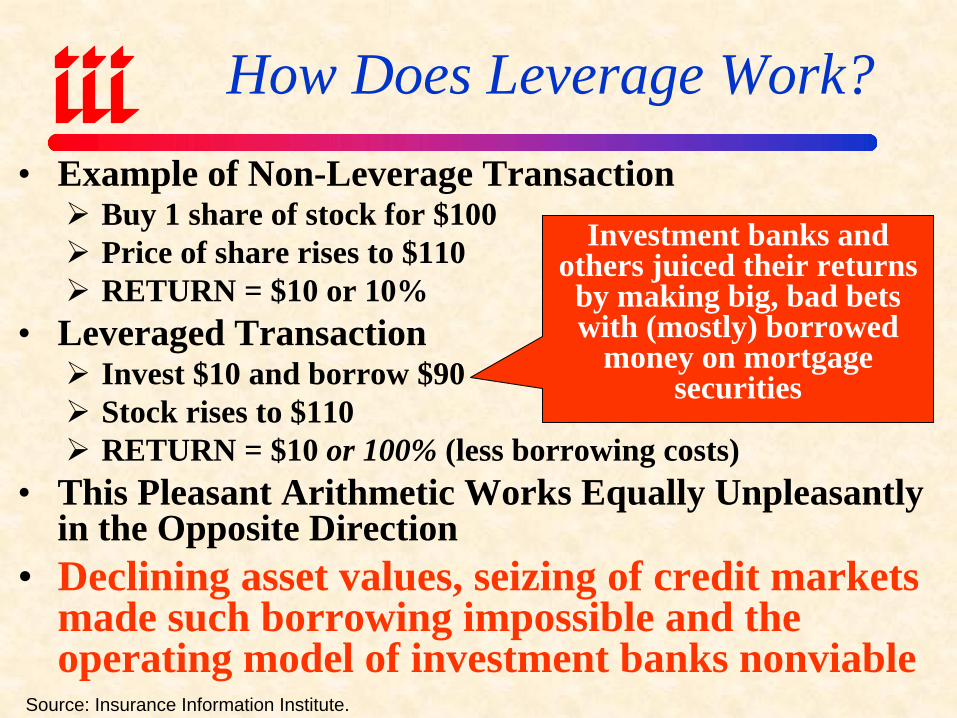
How Does Leverage Work?• Example of Non-Leverage Transaction
Buy 1 share of stock for $100Price of share rises to $110RETURN = $10 or 10%
• Leveraged TransactionInvest $10 and borrow $90Stock rises to $110RETURN = $10 or 100% (less borrowing costs)
• This Pleasant Arithmetic Works Equally Unpleasantly in the Opposite Direction
• Declining asset values, seizing of credit markets made such borrowing impossible and the operating model of investment banks nonviable
Source: Insurance Information Institute.
Investment banks and others juiced their returns
by making big, bad bets with (mostly) borrowed
money on mortgage securities
Government Rescue Package of AIG
Motivation &Structural Details
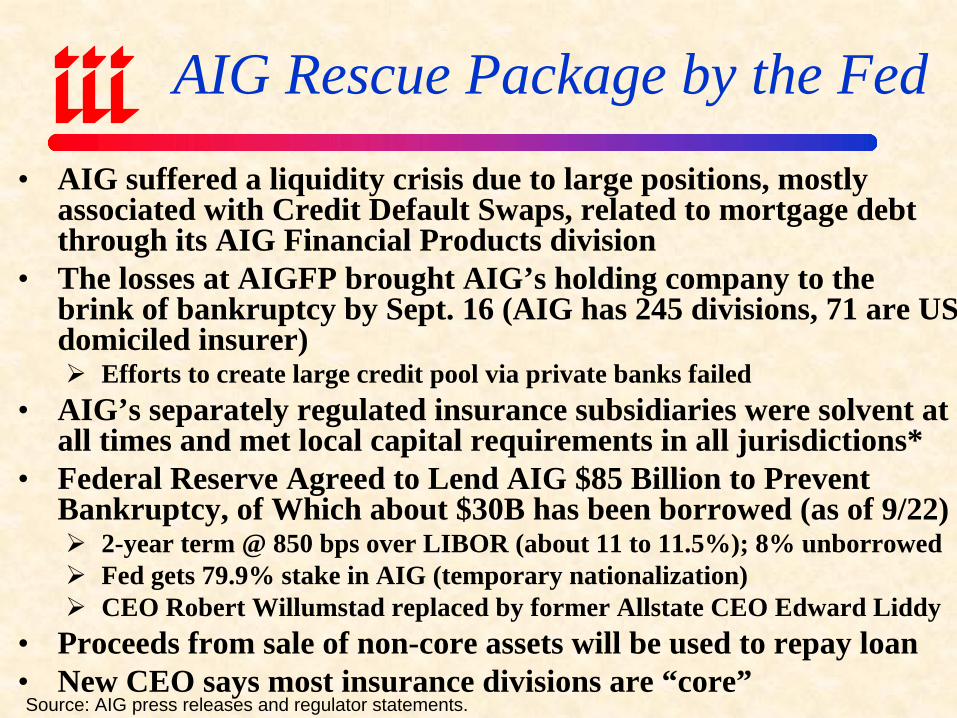
AIG Rescue Package by the Fed• AIG suffered a liquidity crisis due to large positions, mostly
associated with Credit Default Swaps, related to mortgage debt through its AIG Financial Products division
• The losses at AIGFP brought AIG’s holding company to the brink of bankruptcy by Sept. 16 (AIG has 245 divisions, 71 are USdomiciled insurer)
Efforts to create large credit pool via private banks failed• AIG’s separately regulated insurance subsidiaries were solvent at
all times and met local capital requirements in all jurisdictions*• Federal Reserve Agreed to Lend AIG $85 Billion to Prevent
Bankruptcy, of Which about $30B has been borrowed (as of 9/22)2-year term @ 850 bps over LIBOR (about 11 to 11.5%); 8% unborrowedFed gets 79.9% stake in AIG (temporary nationalization)CEO Robert Willumstad replaced by former Allstate CEO Edward Liddy
• Proceeds from sale of non-core assets will be used to repay loan• New CEO says most insurance divisions are “core”Source: AIG press releases and regulator statements.
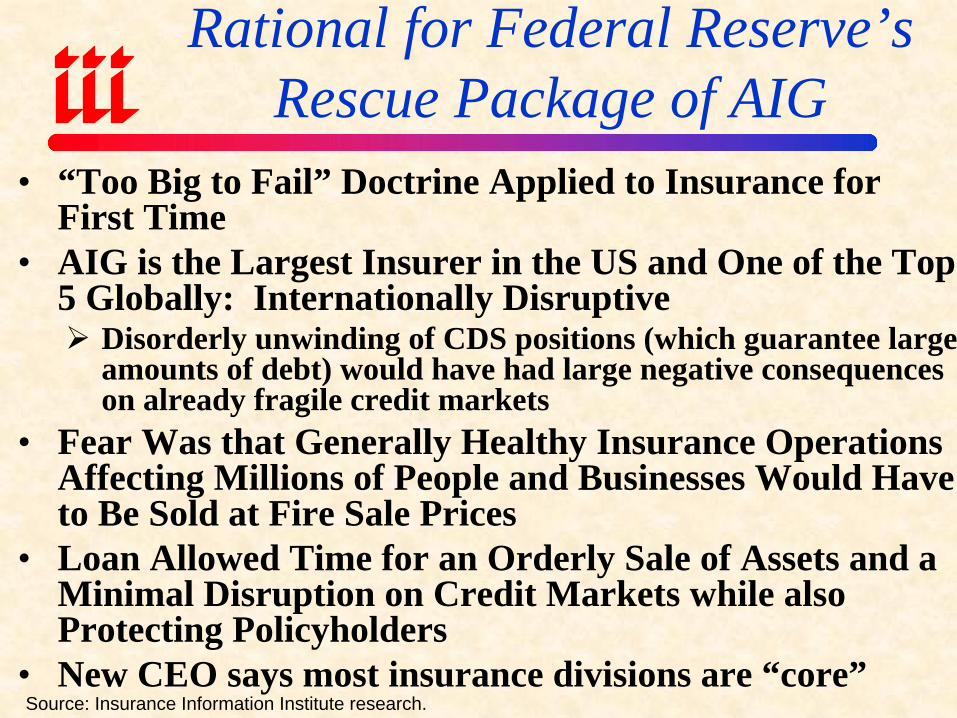
Rational for Federal Reserve’s Rescue Package of AIG
• “Too Big to Fail” Doctrine Applied to Insurance for First Time
• AIG is the Largest Insurer in the US and One of the Top 5 Globally: Internationally Disruptive
Disorderly unwinding of CDS positions (which guarantee large amounts of debt) would have had large negative consequences on already fragile credit markets
• Fear Was that Generally Healthy Insurance Operations Affecting Millions of People and Businesses Would Have to Be Sold at Fire Sale Prices
• Loan Allowed Time for an Orderly Sale of Assets and a Minimal Disruption on Credit Markets while also Protecting Policyholders
• New CEO says most insurance divisions are “core”Source: Insurance Information Institute research.
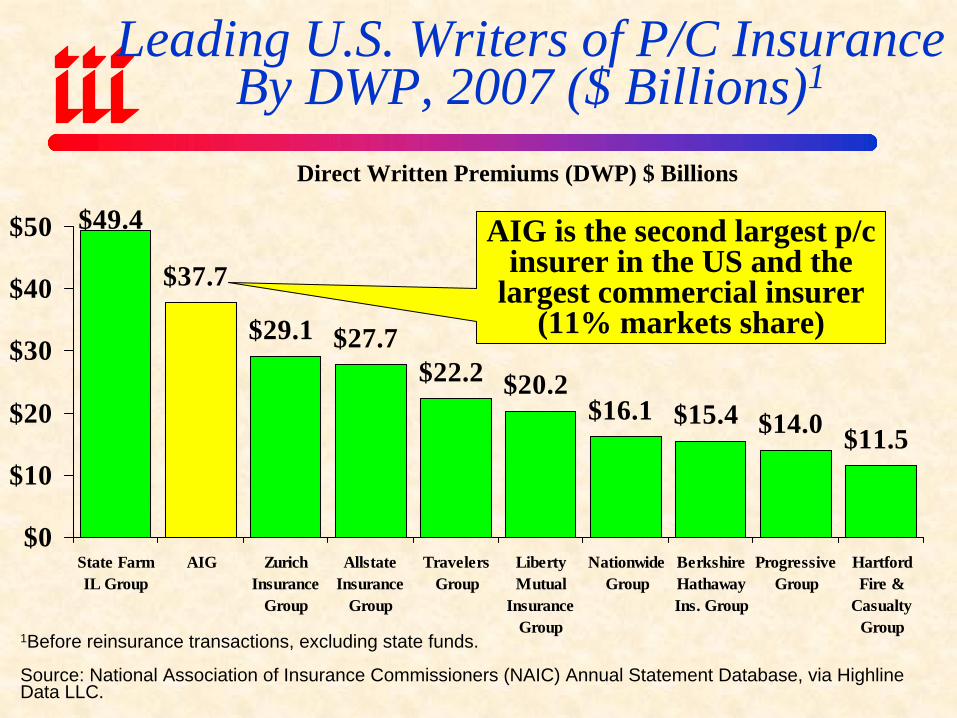
Leading U.S. Writers of P/C Insurance By DWP, 2007 ($ Billions)1
1Before reinsurance transactions, excluding state funds.
Source: National Association of Insurance Commissioners (NAIC) Annual Statement Database, via HighlineData LLC.
$49.4
$37.7
$29.1 $27.7$22.2 $20.2
$16.1 $15.4 $14.0 $11.5
$0
$10
$20
$30
$40
$50
State FarmIL Group
AIG ZurichInsurance
Group
AllstateInsurance
Group
TravelersGroup
LibertyMutual
InsuranceGroup
NationwideGroup
BerkshireHathawayIns. Group
ProgressiveGroup
HartfordFire &
CasualtyGroup
Direct Written Premiums (DWP) $ Billions
AIG is the second largest p/c insurer in the US and the
largest commercial insurer (11% markets share)
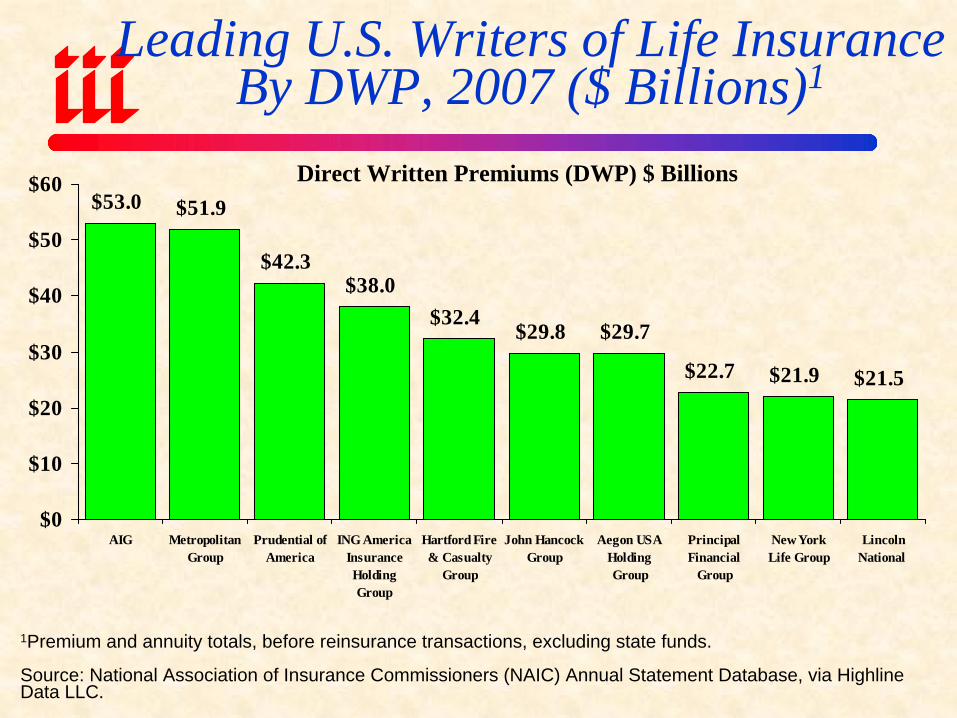
Leading U.S. Writers of Life Insurance By DWP, 2007 ($ Billions)1
1Premium and annuity totals, before reinsurance transactions, excluding state funds.
Source: National Association of Insurance Commissioners (NAIC) Annual Statement Database, via HighlineData LLC.
$53.0 $51.9
$42.3$38.0
$32.4$29.8 $29.7
$22.7 $21.9 $21.5
$0
$10
$20
$30
$40
$50
$60
AIG MetropolitanGroup
Prudential ofAmerica
ING AmericaInsuranceHoldingGroup
Hartford Fire& Casualty
Group
John HancockGroup
Aegon USAHoldingGroup
PrincipalFinancial
Group
New YorkLife Group
LincolnNational
Direct Written Premiums (DWP) $ Billions
AFTERSHOCK: Regulatory Response
Could Be HarshAll Financial Segments
Including InsurersWill Be Impacted
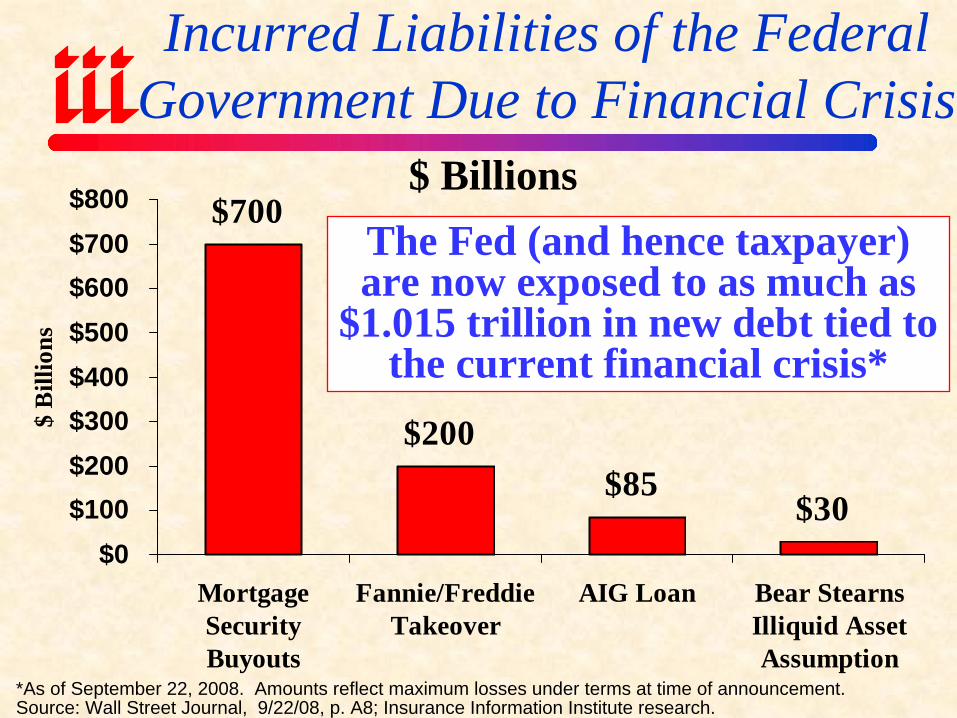
Incurred Liabilities of the Federal Government Due to Financial Crisis
$700
$200$85
$30$0
$100$200$300$400$500$600$700$800
MortgageSecurityBuyouts
Fannie/FreddieTakeover
AIG Loan Bear StearnsIlliquid AssetAssumption
$ B
illio
ns
*As of September 22, 2008. Amounts reflect maximum losses under terms at time of announcement.Source: Wall Street Journal, 9/22/08, p. A8; Insurance Information Institute research.
The Fed (and hence taxpayer) are now exposed to as much as
$1.015 trillion in new debt tied to the current financial crisis*
$ Billions
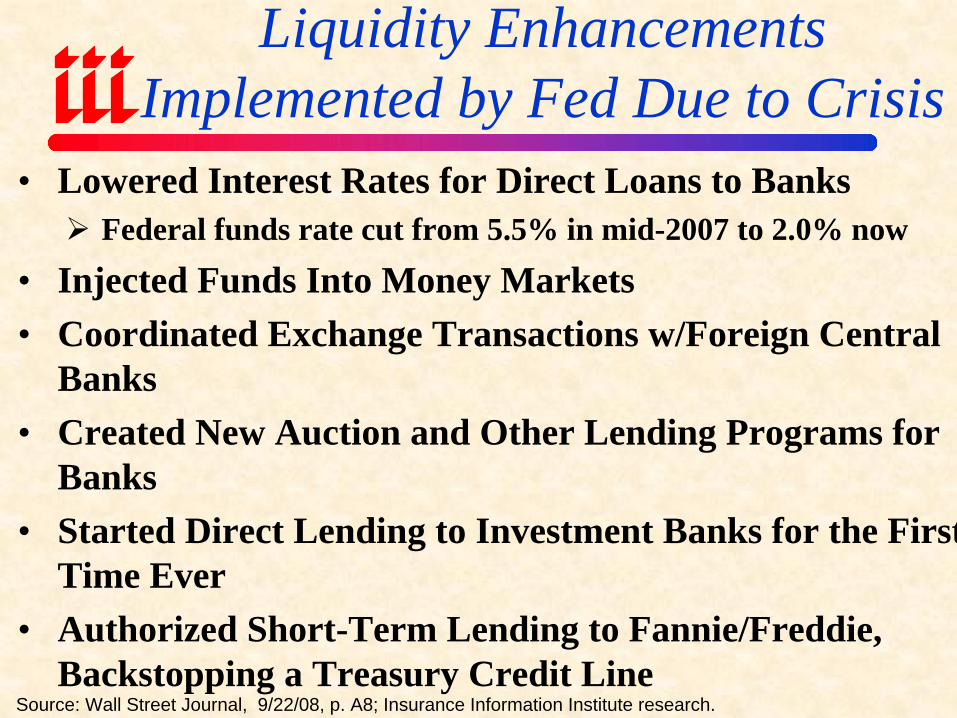
Liquidity Enhancements Implemented by Fed Due to Crisis
• Lowered Interest Rates for Direct Loans to BanksFederal funds rate cut from 5.5% in mid-2007 to 2.0% now
• Injected Funds Into Money Markets• Coordinated Exchange Transactions w/Foreign Central
Banks• Created New Auction and Other Lending Programs for
Banks• Started Direct Lending to Investment Banks for the First
Time Ever• Authorized Short-Term Lending to Fannie/Freddie,
Backstopping a Treasury Credit LineSource: Wall Street Journal, 9/22/08, p. A8; Insurance Information Institute research.

From Hubris to the Humblingof American Capitalism?
“Government is not the solution to our problem, government is the problem.”
--Ronald Reagan, from his first inaugural address, January 20, 1981
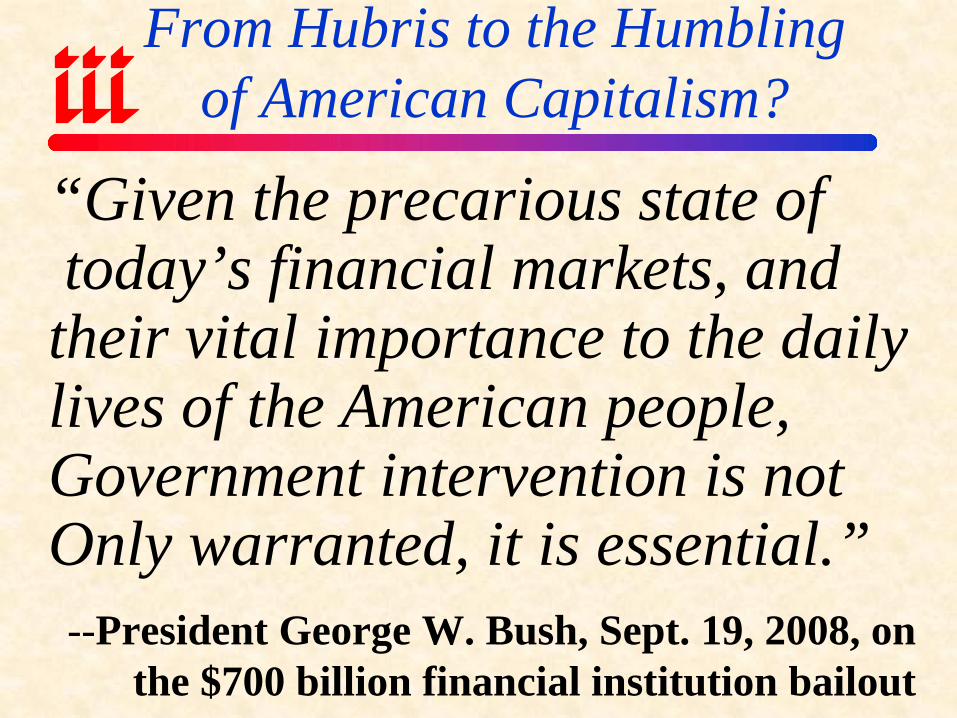
From Hubris to the Humblingof American Capitalism?
--President George W. Bush, Sept. 19, 2008, on the $700 billion financial institution bailout
“Given the precarious state oftoday’s financial markets, andtheir vital importance to the dailylives of the American people,Government intervention is notOnly warranted, it is essential.”
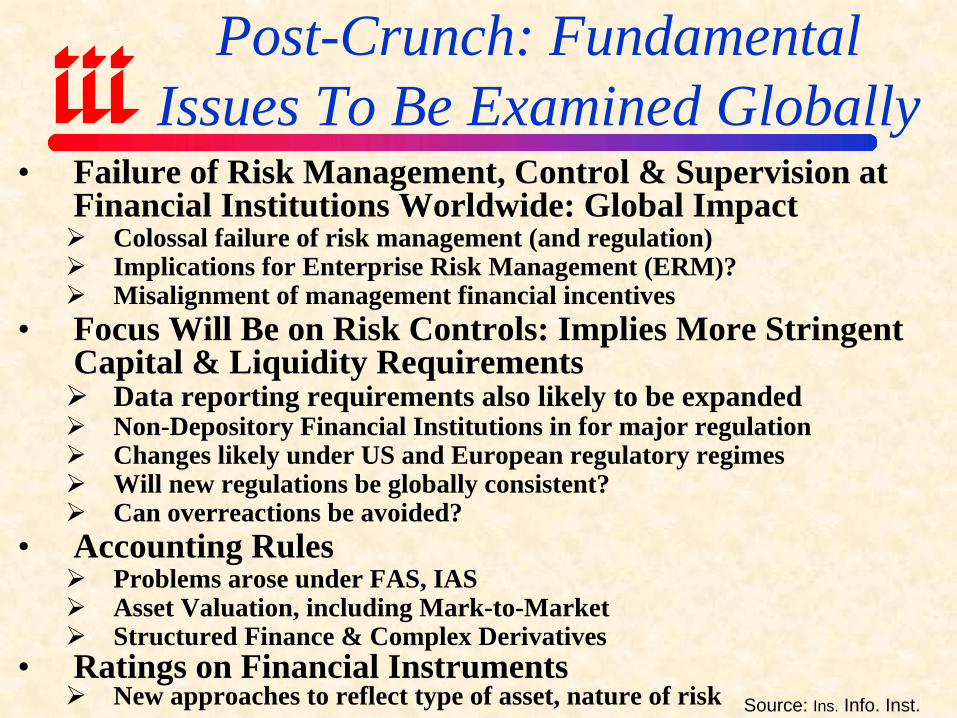
Post-Crunch: Fundamental Issues To Be Examined Globally
Source: Ins. Info. Inst.
• Failure of Risk Management, Control & Supervision at Financial Institutions Worldwide: Global Impact
Colossal failure of risk management (and regulation)Implications for Enterprise Risk Management (ERM)?Misalignment of management financial incentives
• Focus Will Be on Risk Controls: Implies More Stringent Capital & Liquidity Requirements
Data reporting requirements also likely to be expandedNon-Depository Financial Institutions in for major regulationChanges likely under US and European regulatory regimesWill new regulations be globally consistent? Can overreactions be avoided?
• Accounting RulesProblems arose under FAS, IASAsset Valuation, including Mark-to-MarketStructured Finance & Complex Derivatives
• Ratings on Financial InstrumentsNew approaches to reflect type of asset, nature of risk
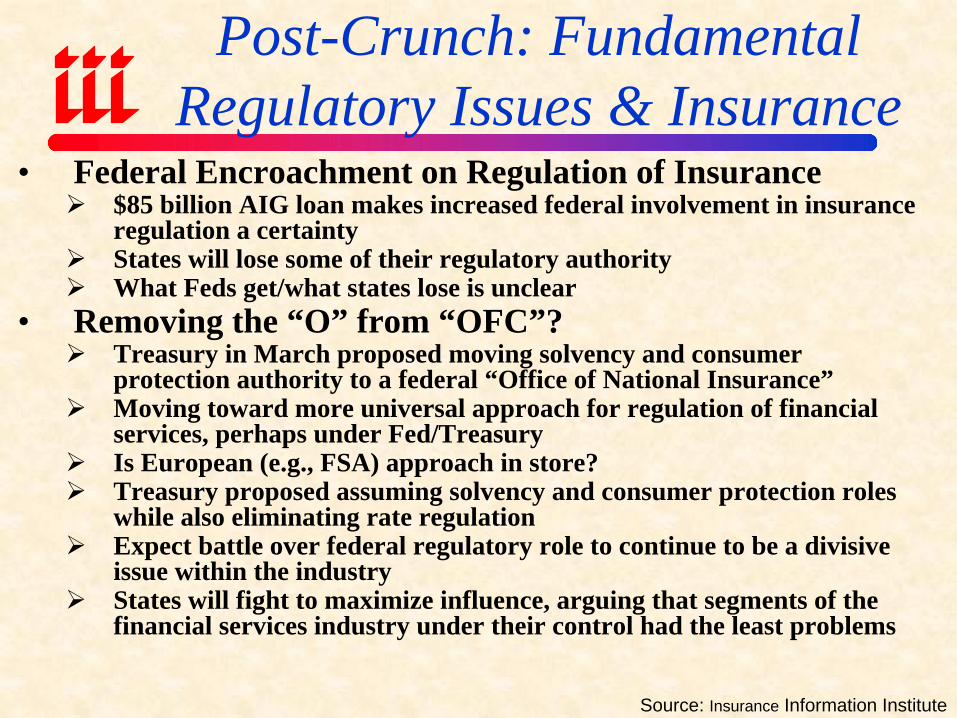
Post-Crunch: Fundamental Regulatory Issues & Insurance
Source: Insurance Information Institute
• Federal Encroachment on Regulation of Insurance $85 billion AIG loan makes increased federal involvement in insurance regulation a certaintyStates will lose some of their regulatory authorityWhat Feds get/what states lose is unclear
• Removing the “O” from “OFC”?Treasury in March proposed moving solvency and consumer protection authority to a federal “Office of National Insurance”Moving toward more universal approach for regulation of financial services, perhaps under Fed/TreasuryIs European (e.g., FSA) approach in store?Treasury proposed assuming solvency and consumer protection roles while also eliminating rate regulationExpect battle over federal regulatory role to continue to be a divisive issue within the industryStates will fight to maximize influence, arguing that segments of the financial services industry under their control had the least problems
Summary of Treasury “Blueprint”for
Financial Services Modernization
Impacts on Insurers
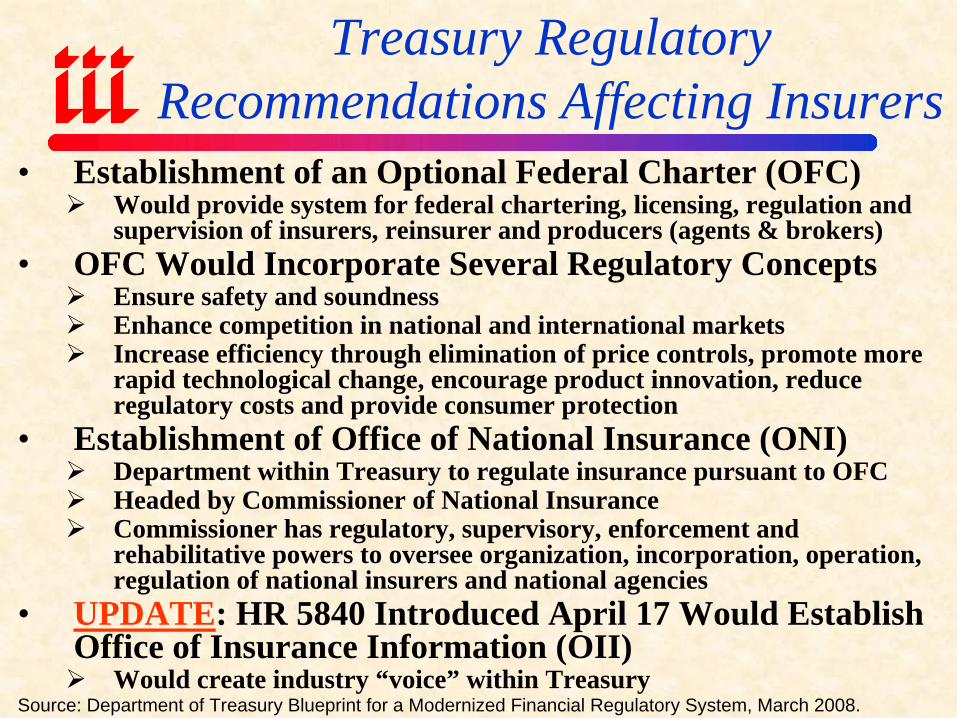
Treasury Regulatory Recommendations Affecting Insurers
Source: Department of Treasury Blueprint for a Modernized Financial Regulatory System, March 2008.
• Establishment of an Optional Federal Charter (OFC)Would provide system for federal chartering, licensing, regulation and supervision of insurers, reinsurer and producers (agents & brokers)
• OFC Would Incorporate Several Regulatory ConceptsEnsure safety and soundnessEnhance competition in national and international marketsIncrease efficiency through elimination of price controls, promote more rapid technological change, encourage product innovation, reduceregulatory costs and provide consumer protection
• Establishment of Office of National Insurance (ONI)Department within Treasury to regulate insurance pursuant to OFCHeaded by Commissioner of National InsuranceCommissioner has regulatory, supervisory, enforcement and rehabilitative powers to oversee organization, incorporation, operation, regulation of national insurers and national agencies
• UPDATE: HR 5840 Introduced April 17 Would Establish Office of Insurance Information (OII)
Would create industry “voice” within Treasury
Government Takeover of Fannie Mae &
Freddie MacBeneficial for Insurers
Treasury’s Fannie/Freddie Rescue Package Should Help Residential Property Insurers
Source: Wall Street Journal Online, 9/7/08; Insurance Information Institute.
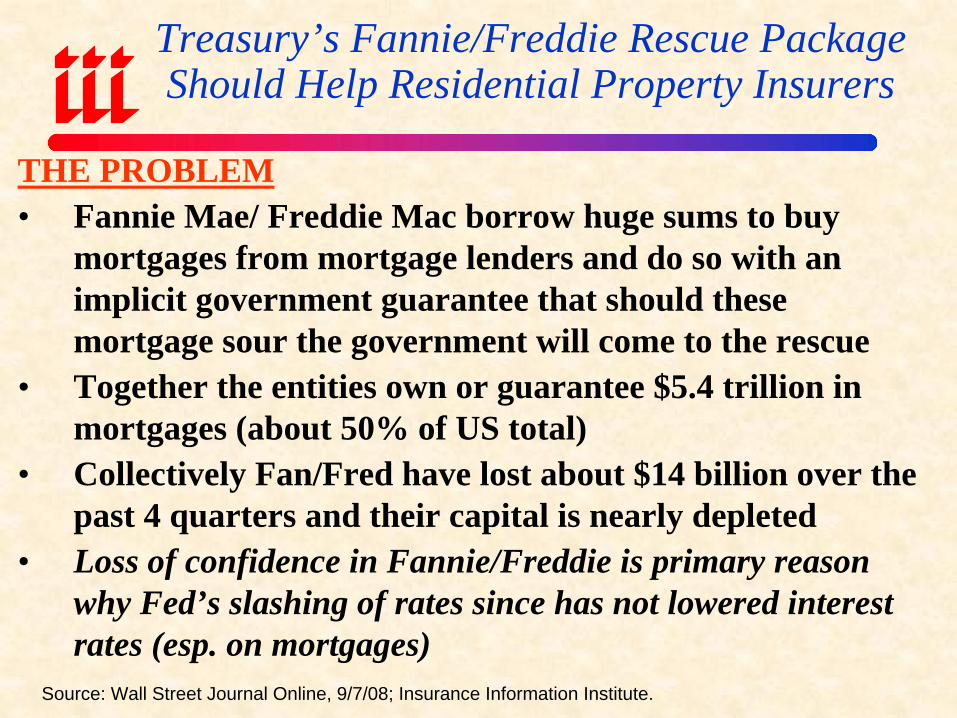
THE PROBLEM• Fannie Mae/ Freddie Mac borrow huge sums to buy
mortgages from mortgage lenders and do so with an implicit government guarantee that should these mortgage sour the government will come to the rescue
• Together the entities own or guarantee $5.4 trillion in mortgages (about 50% of US total)
• Collectively Fan/Fred have lost about $14 billion over the past 4 quarters and their capital is nearly depleted
• Loss of confidence in Fannie/Freddie is primary reason why Fed’s slashing of rates since has not lowered interest rates (esp. on mortgages)
Treasury’s Fannie/Freddie Rescue Package Should Help Residential Property Insurers
Source: Federal Housing Finance Agency; Wall Street Journal Online, 9/7/08; Insurance Information Institute.
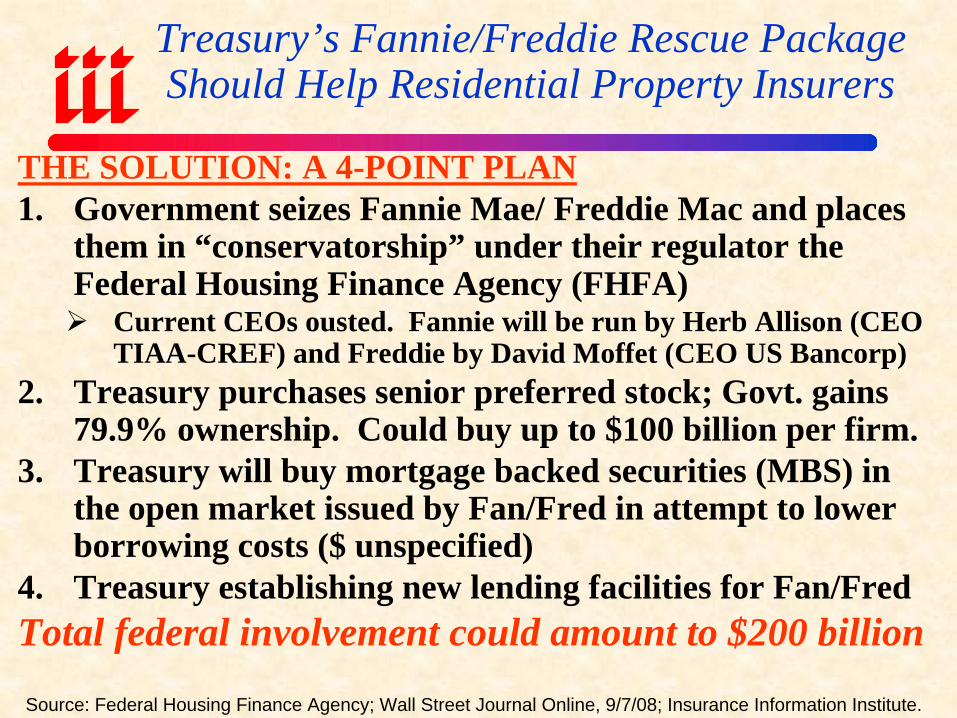
THE SOLUTION: A 4-POINT PLAN1. Government seizes Fannie Mae/ Freddie Mac and places
them in “conservatorship” under their regulator the Federal Housing Finance Agency (FHFA)
Current CEOs ousted. Fannie will be run by Herb Allison (CEO TIAA-CREF) and Freddie by David Moffet (CEO US Bancorp)
2. Treasury purchases senior preferred stock; Govt. gains 79.9% ownership. Could buy up to $100 billion per firm.
3. Treasury will buy mortgage backed securities (MBS) in the open market issued by Fan/Fred in attempt to lower borrowing costs ($ unspecified)
4. Treasury establishing new lending facilities for Fan/FredTotal federal involvement could amount to $200 billion
0.0
1.02.0
3.0
4.05.0
6.0
7.08.0
9.0
Jan-
00
Jan-
01
Jan-
02
Jan-
03
Jan-
04
Jan-
05
Jan-
06
Jan-
07
Jan-
08
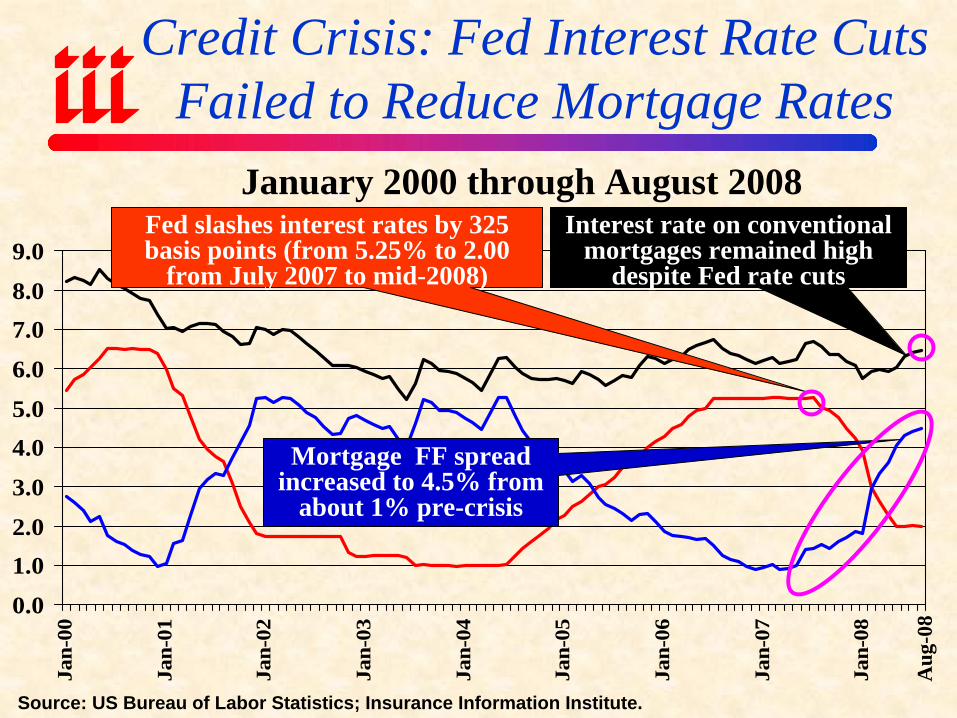
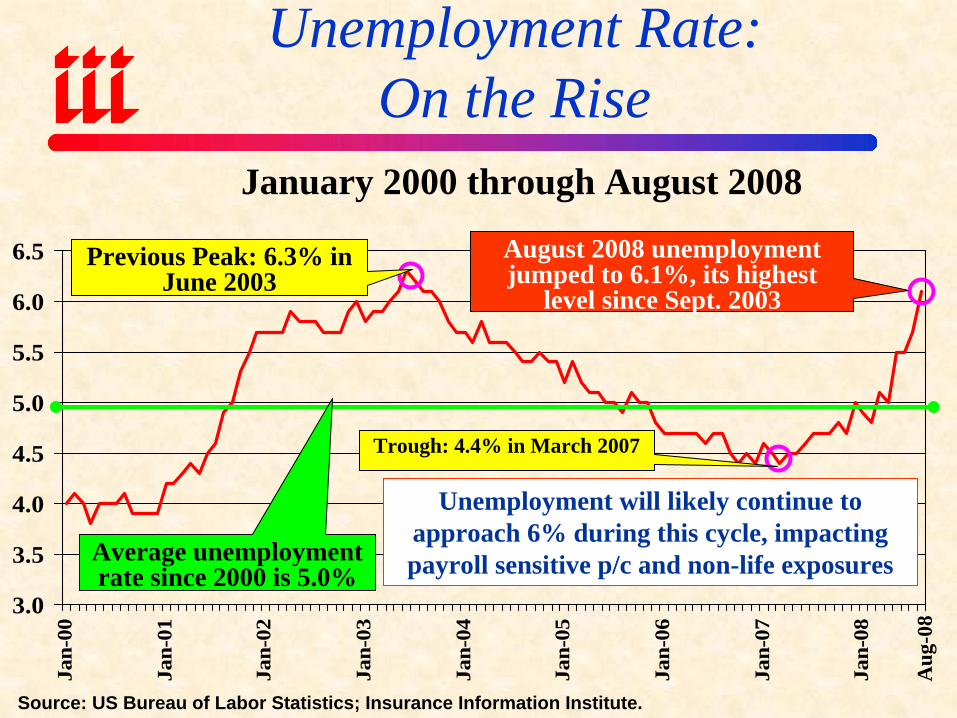
January 2000 through August 2008
Source: US Bureau of Labor Statistics; Insurance Information Institute.
Fed slashes interest rates by 325 basis points (from 5.25% to 2.00
from July 2007 to mid-2008)
Credit Crisis: Fed Interest Rate Cuts Failed to Reduce Mortgage Rates
Mortgage FF spread increased to 4.5% from
about 1% pre-crisis
Interest rate on conventional mortgages remained high
despite Fed rate cuts
Aug
-08
Why Treasury’s Fannie/Freddie Rescue Package Should Help Residential Property Insurers
Source: Insurance Information Institute.
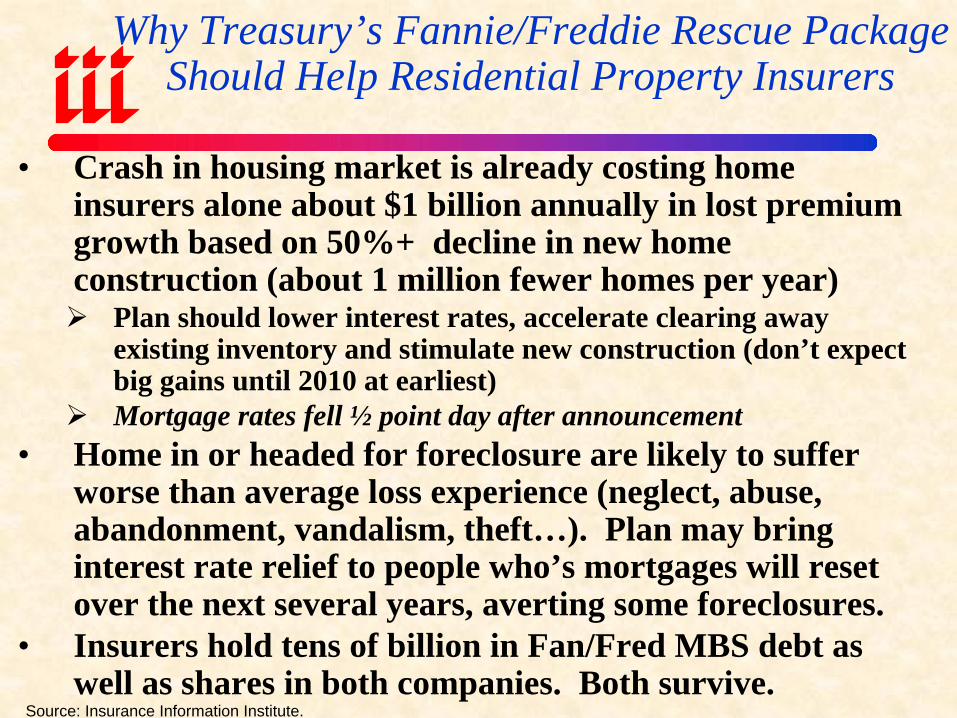
• Crash in housing market is already costing home insurers alone about $1 billion annually in lost premium growth based on 50%+ decline in new home construction (about 1 million fewer homes per year)
Plan should lower interest rates, accelerate clearing away existing inventory and stimulate new construction (don’t expect big gains until 2010 at earliest)Mortgage rates fell ½ point day after announcement
• Home in or headed for foreclosure are likely to suffer worse than average loss experience (neglect, abuse, abandonment, vandalism, theft…). Plan may bring interest rate relief to people who’s mortgages will reset over the next several years, averting some foreclosures.
• Insurers hold tens of billion in Fan/Fred MBS debt as well as shares in both companies. Both survive.
THE ECONOMIC STORM
What a Weakening Economy & The Threat of Inflation Mean
for the Insurance Industry
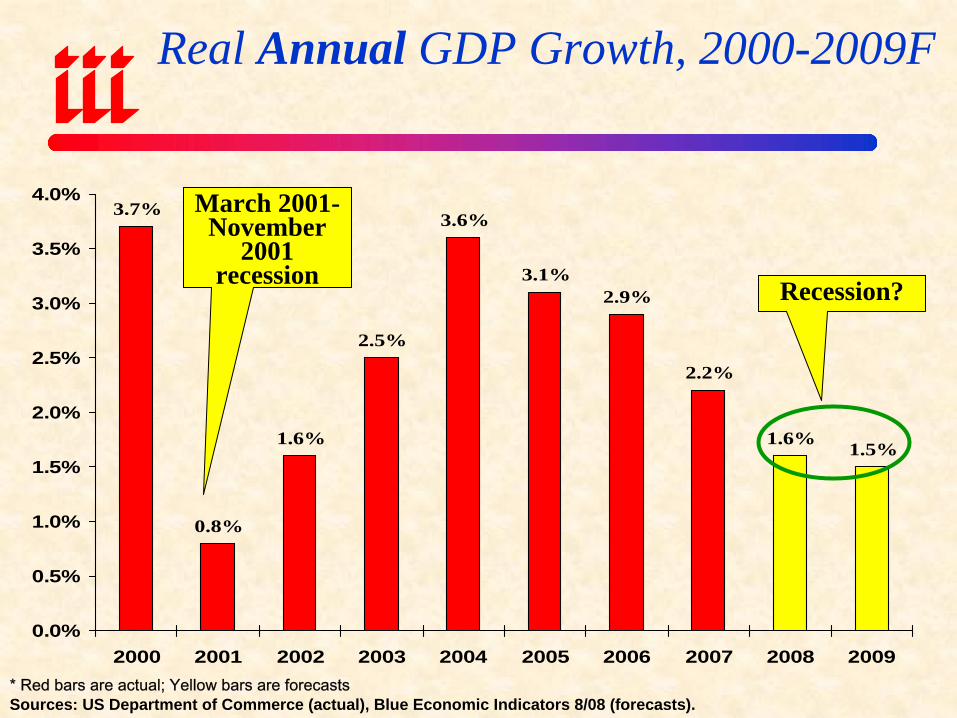
3.7%
0.8%
1.6%
2.5%
3.6%
3.1%2.9%
2.2%
1.6% 1.5%
0.0%
0.5%
1.0%
1.5%
2.0%
2.5%
3.0%
3.5%
4.0%
2000 2001 2002 2003 2004 2005 2006 2007 2008 2009
Real Annual GDP Growth, 2000-2009F
March 2001-November
2001 recession Recession?
* Red bars are actual; Yellow bars are forecastsSources: US Department of Commerce (actual), Blue Economic Indicators 8/08 (forecasts).
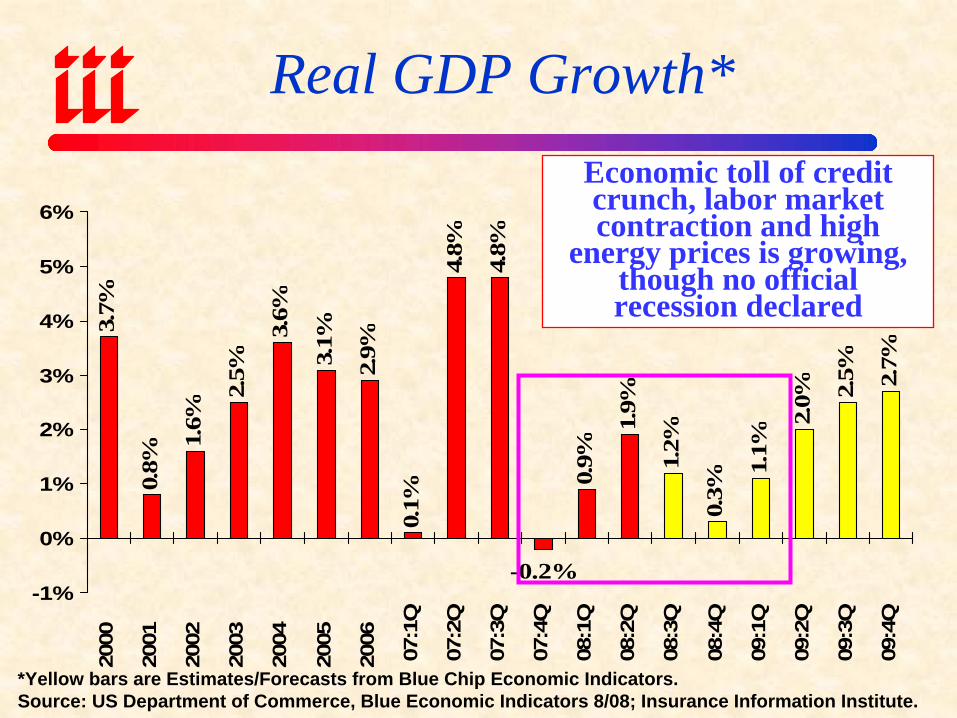
3.7%
0.8%
1.6%
2.5%
3.6%
3.1%
2.9%
0.1%
4.8%
4.8%
0.9%
1.9%
1.2%
0.3%
1.1%
2.0% 2.
5% 2.7%
-0.2%-1%
0%
1%
2%
3%
4%
5%
6%
20
00
20
01
20
02
20
03
20
04
20
05
20
06
07:1
Q
07:2
Q
07:3
Q
07:4
Q
08:1
Q
08:2
Q
08:3
Q
08:4
Q
09:1
Q
09:2
Q
09:3
Q
09:4
Q
Real GDP Growth*
*Yellow bars are Estimates/Forecasts from Blue Chip Economic Indicators.Source: US Department of Commerce, Blue Economic Indicators 8/08; Insurance Information Institute.
Economic toll of credit crunch, labor market contraction and high
energy prices is growing, though no official recession declared
3.0
3.5
4.0
4.5
5.0
5.5
6.0
6.5
Jan-
00
Jan-
01
Jan-
02
Jan-
03
Jan-
04
Jan-
05
Jan-
06
Jan-
07
Jan-
08
January 2000 through August 2008
Unemployment will likely continue to approach 6% during this cycle, impacting payroll sensitive p/c and non-life exposures
Source: US Bureau of Labor Statistics; Insurance Information Institute.
August 2008 unemployment jumped to 6.1%, its highest
level since Sept. 2003
Unemployment Rate:On the Rise
Average unemployment rate since 2000 is 5.0%
Previous Peak: 6.3% in June 2003
Trough: 4.4% in March 2007
Aug
-08
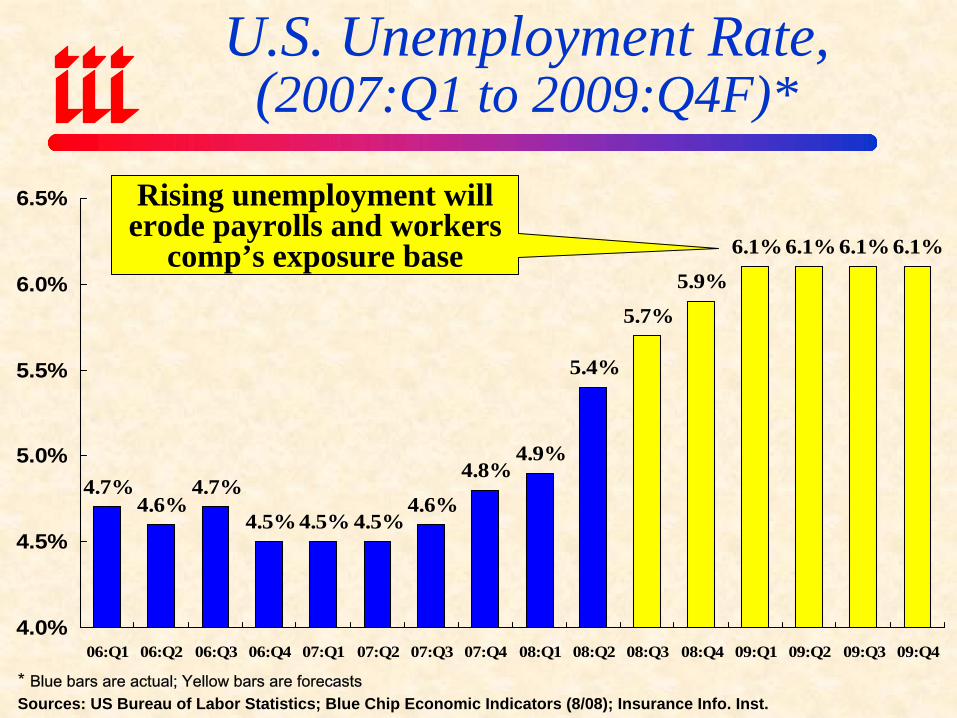
U.S. Unemployment Rate,(2007:Q1 to 2009:Q4F)*
4.7%4.6%
4.7%
4.5%4.5% 4.5%4.6%
4.8%4.9%
5.4%
5.7%
5.9%
6.1%6.1% 6.1% 6.1%
4.0%
4.5%
5.0%
5.5%
6.0%
6.5%
06:Q1 06:Q2 06:Q3 06:Q4 07:Q1 07:Q2 07:Q3 07:Q4 08:Q1 08:Q2 08:Q3 08:Q4 09:Q1 09:Q2 09:Q3 09:Q4
* Blue bars are actual; Yellow bars are forecastsSources: US Bureau of Labor Statistics; Blue Chip Economic Indicators (8/08); Insurance Info. Inst.
Rising unemployment will erode payrolls and workers
comp’s exposure base
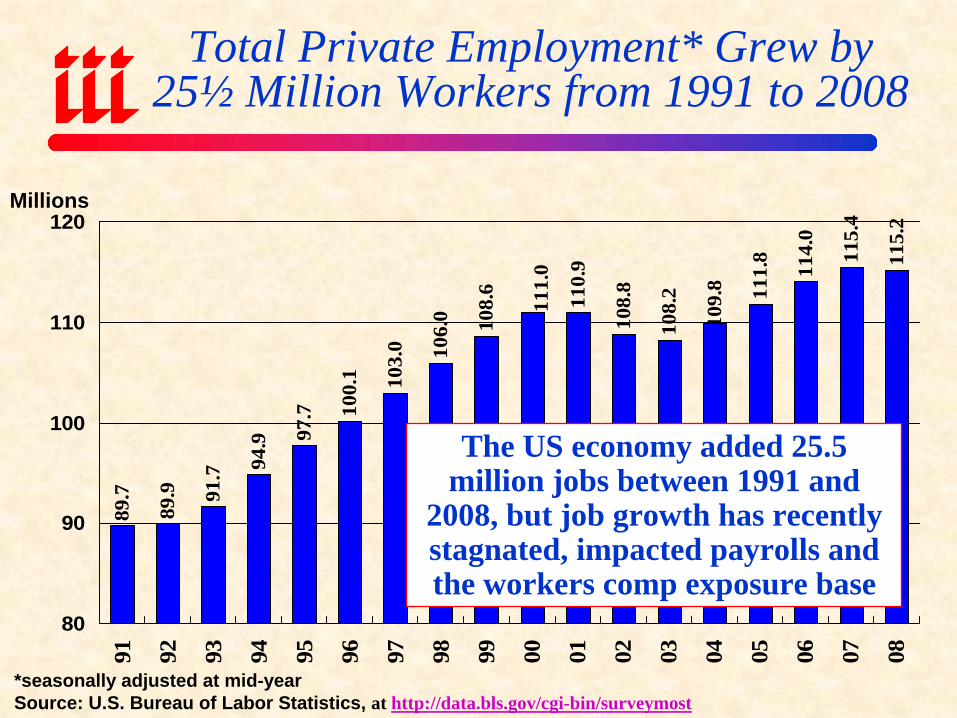
Total Private Employment* Grew by25½ Million Workers from 1991 to 2008
89.7
89.9 91
.7 94.9 97
.7 100.
1 103.
0 106.
0 108.
6
108.
8
108.
2
115.
4
115.
2
110.
9 114.
0
111.
8
111.
0
109.
8
80
90
100
110
120
91 92 93 94 95 96 97 98 99 00 01 02 03 04 05 06 07 08
*seasonally adjusted at mid-yearSource: U.S. Bureau of Labor Statistics, at http://data.bls.gov/cgi-bin/surveymost
Millions
The US economy added 25.5 million jobs between 1991 and
2008, but job growth has recently stagnated, impacted payrolls and the workers comp exposure base
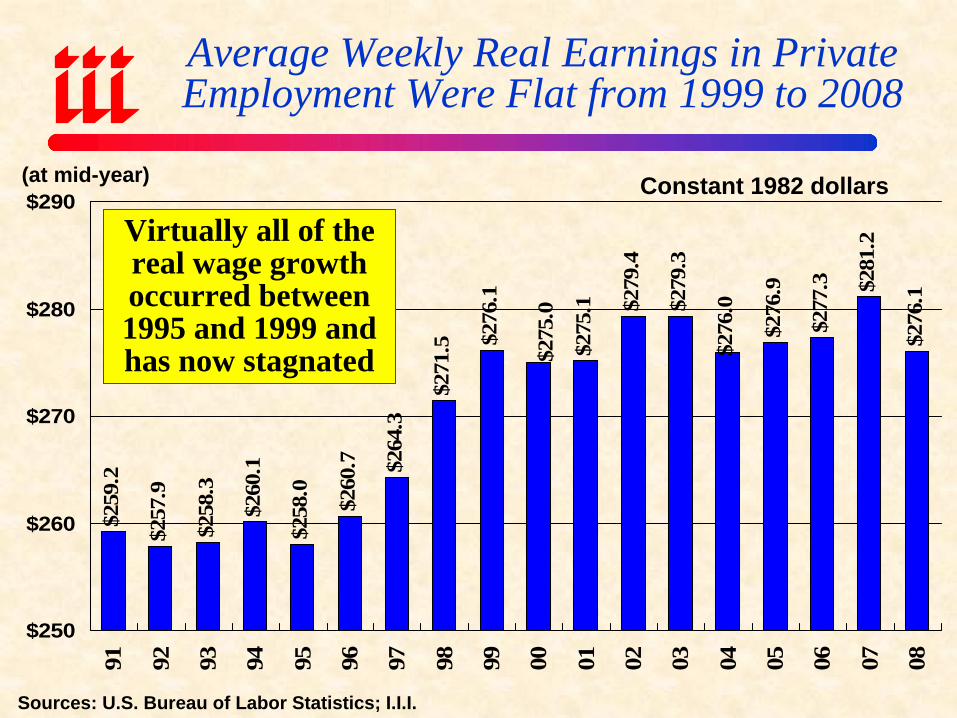
Average Weekly Real Earnings in Private Employment Were Flat from 1999 to 2008$2
59.2
$257
.9
$258
.3
$260
.1
$258
.0
$260
.7 $264
.3
$271
.5 $276
.1 $279
.4
$279
.3
$281
.2
$276
.1
$275
.1
$277
.3
$276
.9
$275
.0
$276
.0
$250
$260
$270
$280
$290
91 92 93 94 95 96 97 98 99 00 01 02 03 04 05 06 07 08
Sources: U.S. Bureau of Labor Statistics; I.I.I.
(at mid-year) Constant 1982 dollars
Virtually all of the real wage growth occurred between 1995 and 1999 and has now stagnated
$0
$1,000
$2,000
$3,000
$4,000
$5,000
$6,000
$7,000
89 90 91 92 93 94 95 96 97 98 99 00 01 02 03 04 05 06 07*$0
$5
$10
$15
$20
$25
$30
$35
$40
$45Wage & SalaryDisbursementsWC NPW
*Average of quarterly figures.Source: US Bureau of Economic Analysis; Federal Reserve Bank of St. Louis at http://research.stlouisfed.org/fred2/series/WASCUR; I.I.I. Fact Books
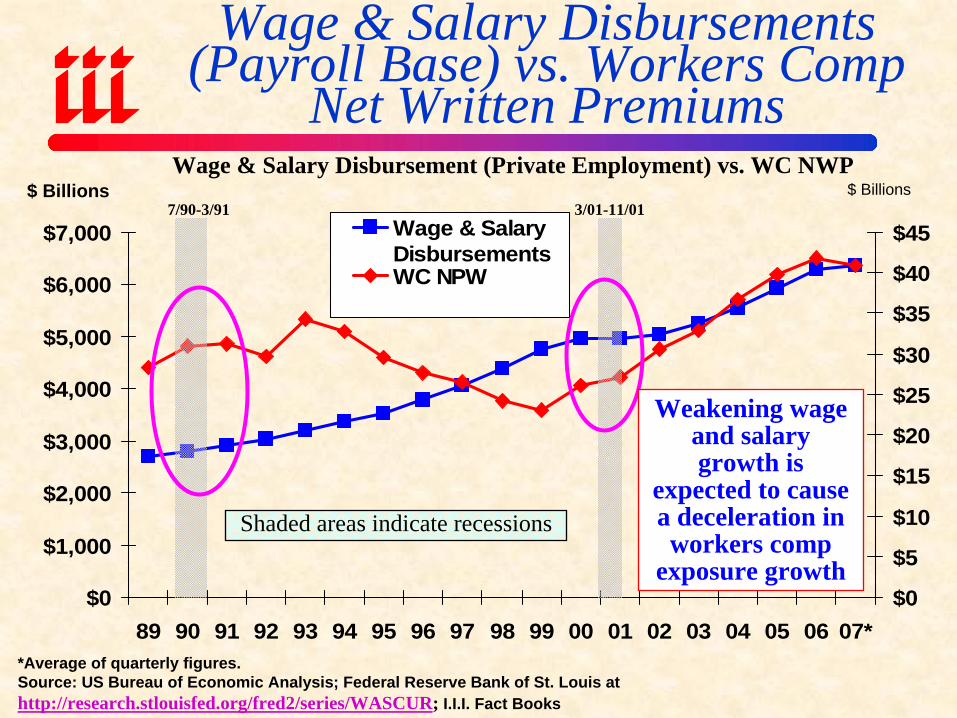
Wage & Salary Disbursements (Payroll Base) vs. Workers Comp
Net Written Premiums
7/90-3/91
Shaded areas indicate recessions
3/01-11/01
Wage & Salary Disbursement (Private Employment) vs. WC NWP$ Billions $ Billions
Weakening wage and salary growth is
expected to cause a deceleration in workers comp
exposure growth
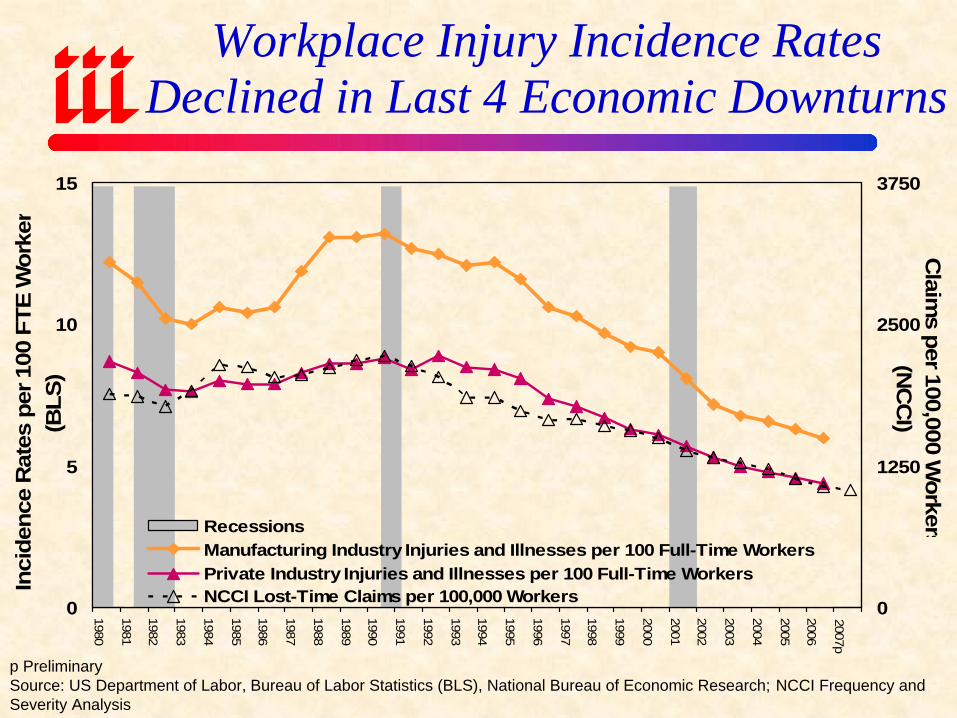
p PreliminarySource: US Department of Labor, Bureau of Labor Statistics (BLS), National Bureau of Economic Research; NCCI Frequency and Severity Analysis
Workplace Injury Incidence RatesDeclined in Last 4 Economic Downturns
0
5
10
15
1980
1981
1982
1983
1984
1985
1986
1987
1988
1989
1990
1991
1992
1993
1994
1995
1996
1997
1998
1999
2000
2001
2002
2003
2004
2005
2006
2007p
Inci
denc
e R
ates
per
100
FTE
Wor
ker
(BLS
)
0
1250
2500
3750
Claim
s per 100,000 Workers
(NC
CI)
RecessionsManufacturing Industry Injuries and Illnesses per 100 Full-Time WorkersPrivate Industry Injuries and Illnesses per 100 Full-Time WorkersNCCI Lost-Time Claims per 100,000 Workers
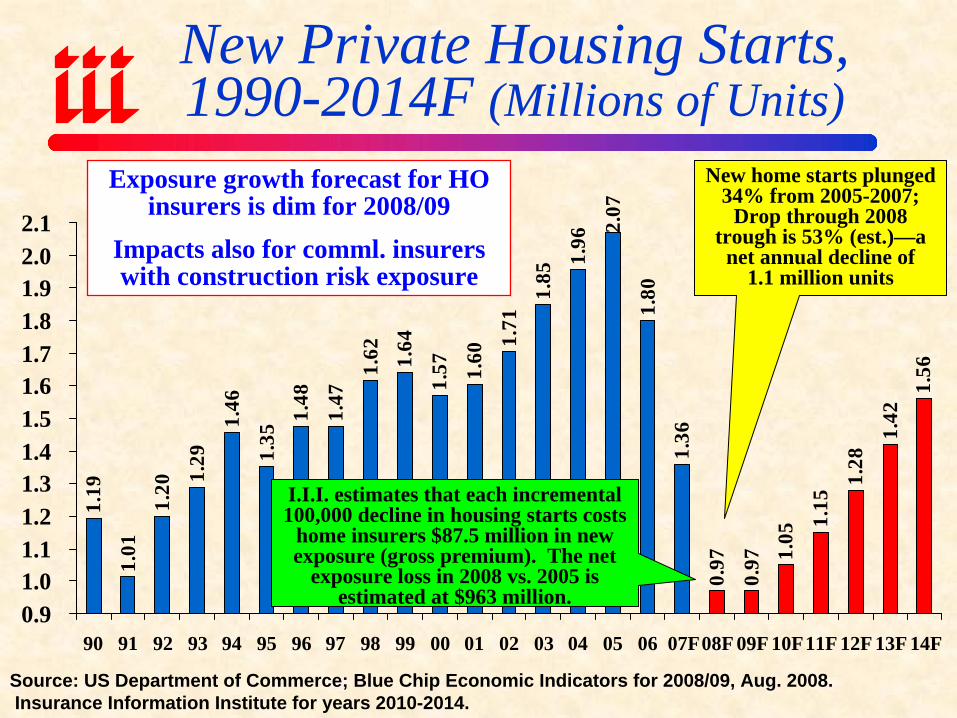
New Private Housing Starts,1990-2014F (Millions of Units)
2.07
1.80
1.36
0.97
0.97 1.
05
1.15
1.42
1.56
1.28
1.48
1.35
1.46
1.29
1.20
1.01
1.19
1.47
1.62 1.64
1.57 1.
60
1.71
1.85
1.96
0.91.01.11.21.31.41.51.61.71.81.92.02.1
90 91 92 93 94 95 96 97 98 99 00 01 02 03 04 05 06 07F08F 09F 10F11F 12F 13F 14F
Exposure growth forecast for HO insurers is dim for 2008/09
Impacts also for comml. insurers with construction risk exposure
New home starts plunged 34% from 2005-2007;
Drop through 2008 trough is 53% (est.)—a
net annual decline of 1.1 million units
I.I.I. estimates that each incremental 100,000 decline in housing starts costs
home insurers $87.5 million in new exposure (gross premium). The net
exposure loss in 2008 vs. 2005 is estimated at $963 million.
Source: US Department of Commerce; Blue Chip Economic Indicators for 2008/09, Aug. 2008.Insurance Information Institute for years 2010-2014.
16.916.916.916.6
17.117.5
17.817.4
16.516.1
14.114.4
14.8
15.4
16.0
16.7
13
14
15
16
17
18
19
99 00 01 02 03 04 05 06 07F 08F 09F 10F 11F 12F 13F 14F
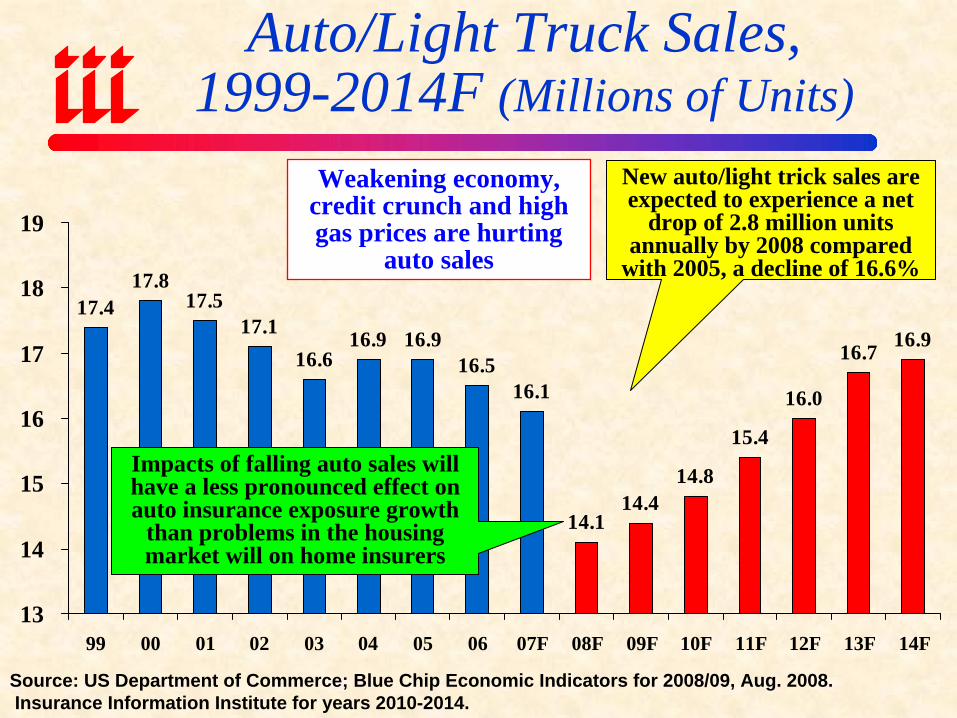
Weakening economy, credit crunch and high gas prices are hurting
auto sales
New auto/light trick sales are expected to experience a net
drop of 2.8 million units annually by 2008 compared
with 2005, a decline of 16.6%
Impacts of falling auto sales will have a less pronounced effect on auto insurance exposure growth
than problems in the housing market will on home insurers
Auto/Light Truck Sales,1999-2014F (Millions of Units)
Source: US Department of Commerce; Blue Chip Economic Indicators for 2008/09, Aug. 2008.Insurance Information Institute for years 2010-2014.
$1,0
82
$1,1
44
$1,2
26
$1,3
07
$1,3
68
$1,4
06
$1,4
13
$0
$200
$400
$600
$800
$1,000
$1,200
$1,400
$1,600
03 04 05 06 07 08F 09F0%
1%
2%
3%
4%
5%
6%
7%
8%
% C
hang
e
Nonresidential Fixed Investment% Change Nonresidential Fixed Investment
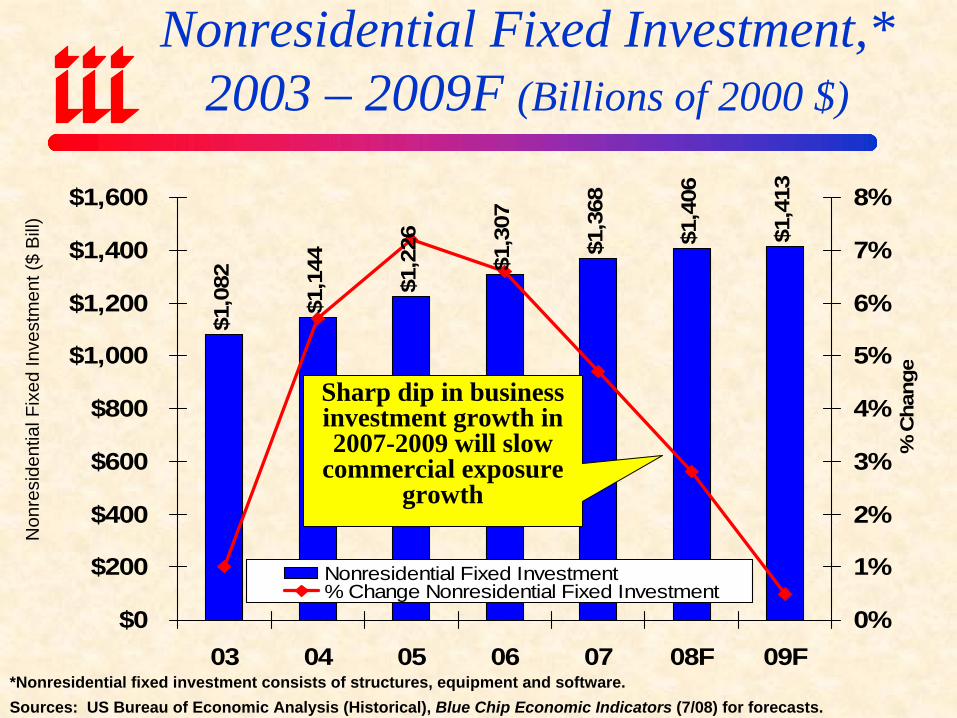
Nonresidential Fixed Investment,* 2003 – 2009F (Billions of 2000 $)
Sharp dip in business investment growth in 2007-2009 will slow
commercial exposure growth
*Nonresidential fixed investment consists of structures, equipment and software.Sources: US Bureau of Economic Analysis (Historical), Blue Chip Economic Indicators (7/08) for forecasts.
Non
resi
dent
ial F
ixed
Inve
stm
ent (
$ B
ill)
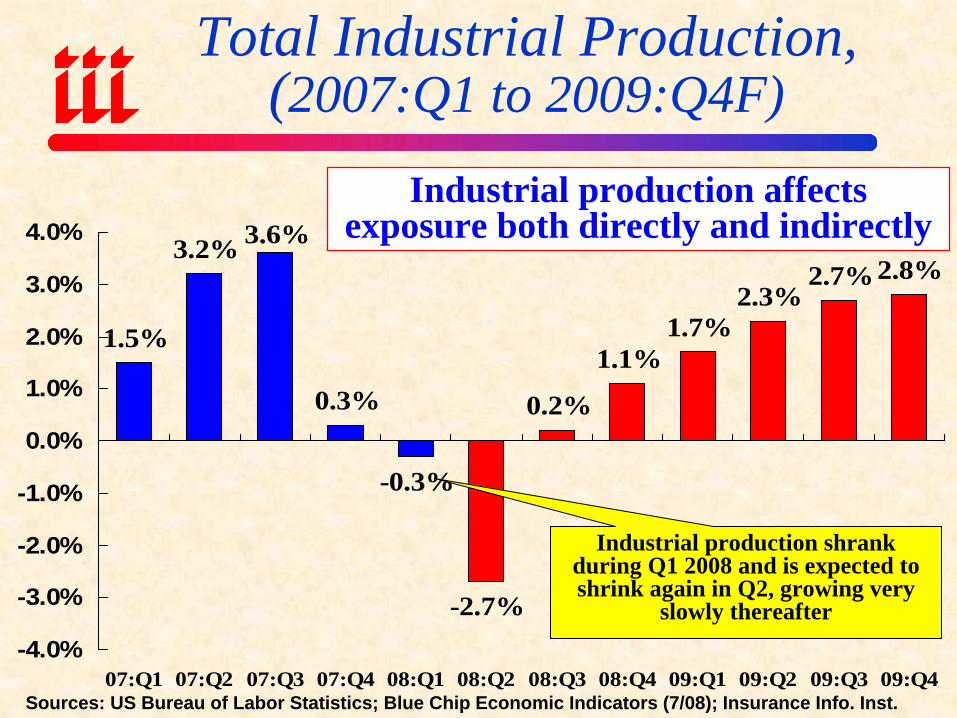
Total Industrial Production,(2007:Q1 to 2009:Q4F)
1.5%
3.2% 3.6%
0.3%
-0.3%
-2.7%
0.2%
1.1%1.7%
2.3%2.7%2.8%
-4.0%
-3.0%
-2.0%
-1.0%
0.0%
1.0%
2.0%
3.0%
4.0%
07:Q1 07:Q2 07:Q3 07:Q4 08:Q1 08:Q2 08:Q3 08:Q4 09:Q1 09:Q2 09:Q3 09:Q4Sources: US Bureau of Labor Statistics; Blue Chip Economic Indicators (7/08); Insurance Info. Inst.
Industrial production shrank during Q1 2008 and is expected to shrink again in Q2, growing very
slowly thereafter
Industrial production affects exposure both directly and indirectly
0%
3%
6%
9%
12%
15%
2004
:Q1
2004
:Q2
2004
:Q3
2004
:Q4
2005
:Q1
2005
:Q2
2005
:Q3
2005
:Q4
2006
:Q1
2006
:Q2
2006
:Q3
2006
:Q4
2007
:Q1
2007
:Q2
2007
:Q3
2007
:Q4
2008
:Q1
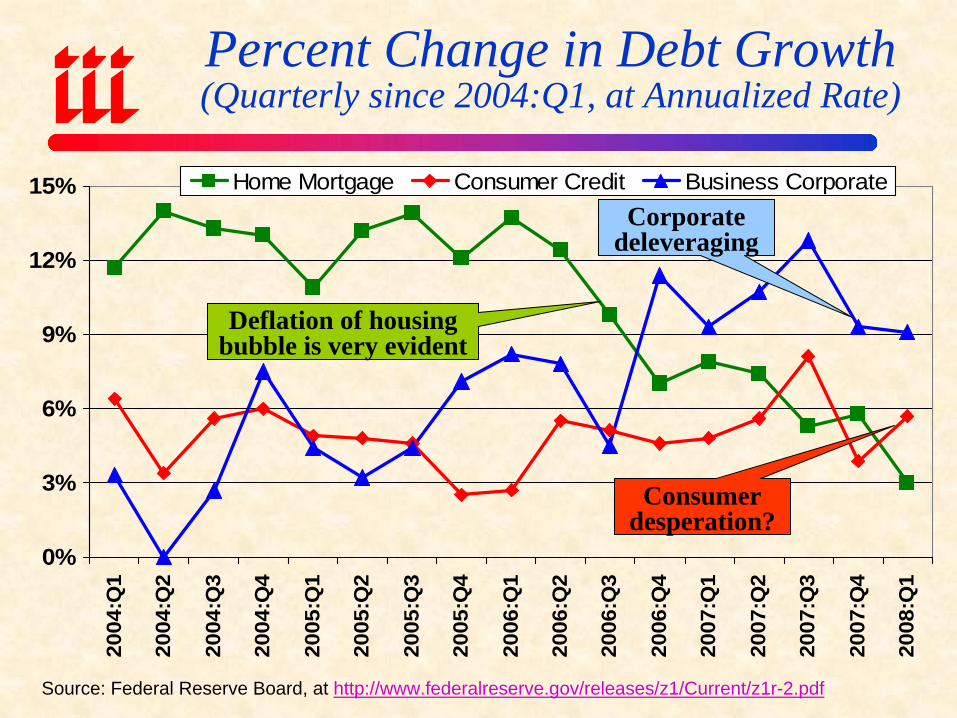
Home Mortgage Consumer Credit Business Corporate
Percent Change in Debt Growth(Quarterly since 2004:Q1, at Annualized Rate)
Source: Federal Reserve Board, at http://www.federalreserve.gov/releases/z1/Current/z1r-2.pdf
Deflation of housing bubble is very evident
Corporate deleveraging
Consumer desperation?

5.2%
-0.9
%-7
.4%
-6.5
%-1
.5%
1.8%
4.3%
18.6
% 20.3
%5.
8%0.
3%-1
.6%
-1.0
%-1
.8%
-1.0
%3.
1%1.
1%0.
8%0.
4%0.
6%-0
.4%
-0.3
%1.
6%5.
6%13
.7%
7.7%
1.2%
-2.9
% -0.5
%-3
.4%
-4.9
%
-10%
-5%
0%
5%
10%
15%
20%
25%78 79 80 81 82 83 84 85 86 87 88 89 90 91 92 93 94 95 96 97 98 99 00 01 02 03 04 05 06 07 08F
Rea
l NW
P G
row
th
-4%
-2%
0%
2%
4%
6%
8%
Real
GDP
Gro
wth
Real NWP Growth Real GDP
Real GDP Growth vs. Real P/C Premium Growth: Modest Association
P/C insurance industry’s growth is influenced modestly by growth
in the overall economy
Sources: A.M. Best, US Bureau of Economic Analysis, Blue Chip Economic Indicators, 8/08; Insurance Information Inst.
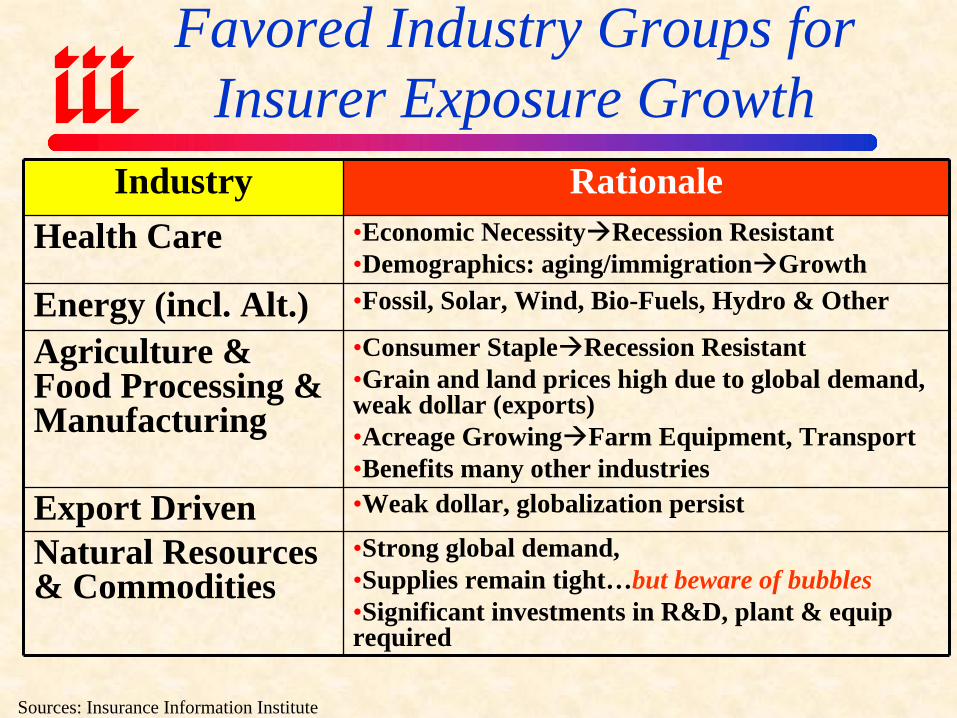
Favored Industry Groups for Insurer Exposure Growth
Industry RationaleHealth Care •Economic Necessity Recession Resistant
•Demographics: aging/immigration Growth
Energy (incl. Alt.) •Fossil, Solar, Wind, Bio-Fuels, Hydro & Other
Agriculture & Food Processing & Manufacturing
•Consumer Staple Recession Resistant•Grain and land prices high due to global demand, weak dollar (exports)•Acreage Growing Farm Equipment, Transport•Benefits many other industries
Export Driven •Weak dollar, globalization persist
Natural Resources & Commodities
•Strong global demand, •Supplies remain tight…but beware of bubbles•Significant investments in R&D, plant & equip required
Sources: Insurance Information Institute
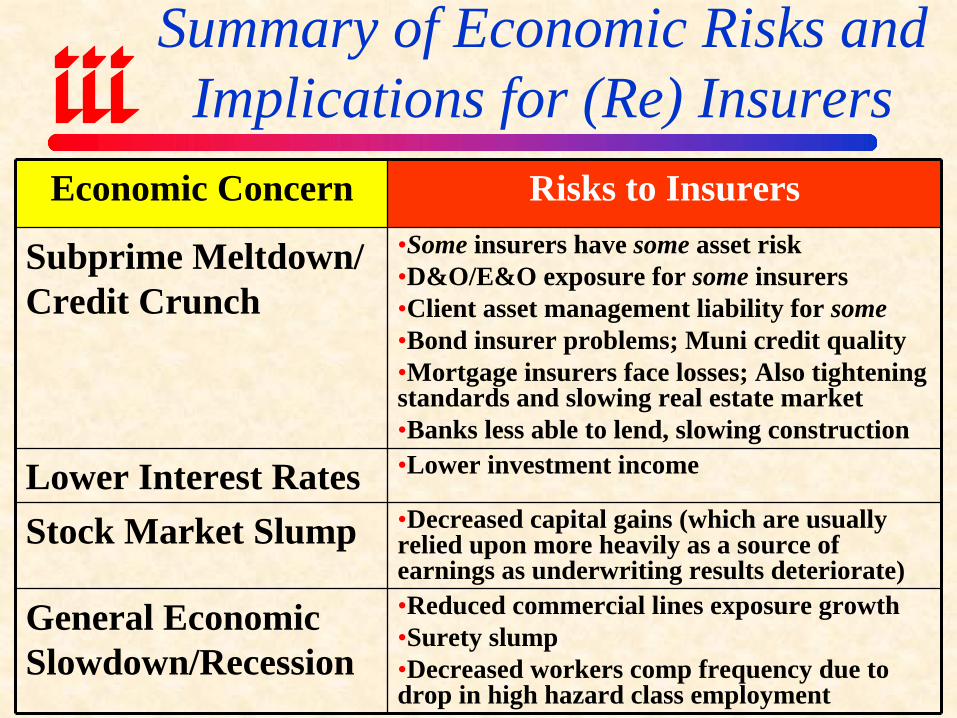
Summary of Economic Risks and Implications for (Re) Insurers
Economic Concern Risks to Insurers
Subprime Meltdown/ Credit Crunch
•Some insurers have some asset risk•D&O/E&O exposure for some insurers•Client asset management liability for some•Bond insurer problems; Muni credit quality•Mortgage insurers face losses; Also tightening standards and slowing real estate market•Banks less able to lend, slowing construction
Lower Interest Rates •Lower investment income
Stock Market Slump •Decreased capital gains (which are usually relied upon more heavily as a source of earnings as underwriting results deteriorate)
General Economic Slowdown/Recession
•Reduced commercial lines exposure growth•Surety slump•Decreased workers comp frequency due to drop in high hazard class employment

Inflation Overview
Pressures Claim Costs, Expands Probable & Possible Max Losses
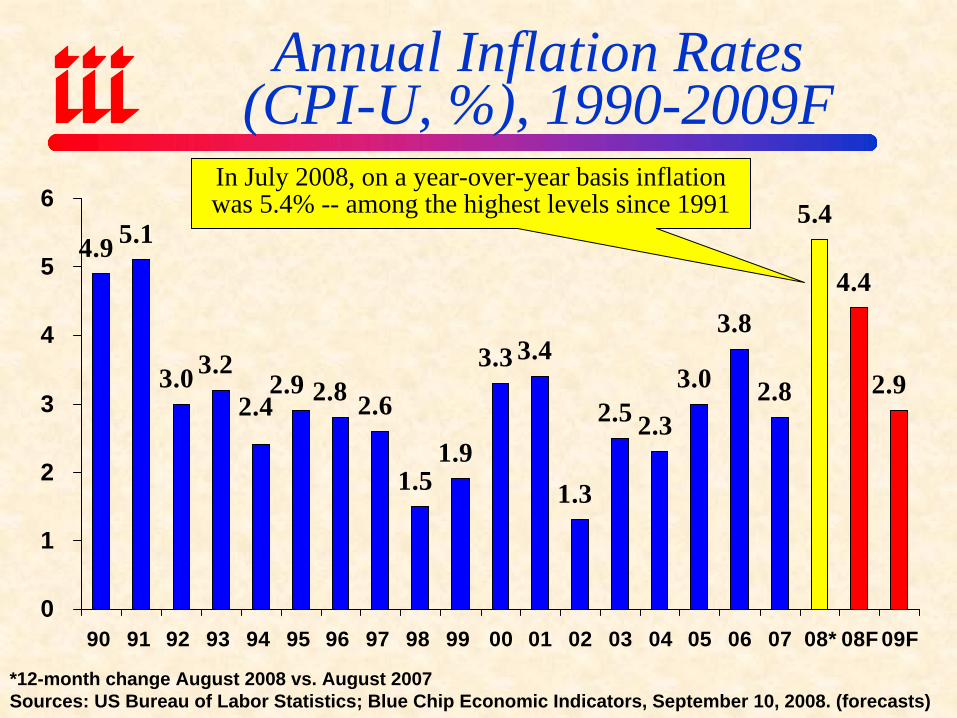
Annual Inflation Rates(CPI-U, %), 1990-2009F
4.9 5.1
3.0 3.22.6
1.51.9
3.3 3.4
1.3
2.5 2.3
3.0
3.8
2.8
5.4
4.4
2.92.82.92.4
0
1
2
3
4
5
6
90 91 92 93 94 95 96 97 98 99 00 01 02 03 04 05 06 07 08* 08F 09F
*12-month change August 2008 vs. August 2007 Sources: US Bureau of Labor Statistics; Blue Chip Economic Indicators, September 10, 2008. (forecasts)
In July 2008, on a year-over-year basis inflation was 5.4% -- among the highest levels since 1991
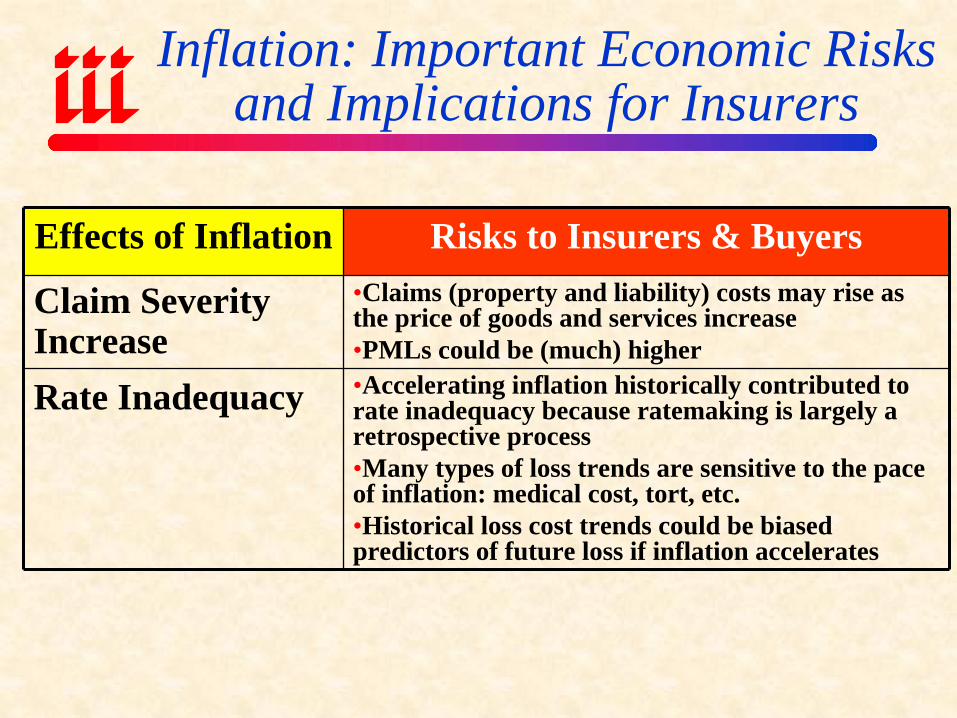
Inflation: Important Economic Risks and Implications for Insurers
Effects of Inflation Risks to Insurers & Buyers
Claim Severity Increase
•Claims (property and liability) costs may rise as the price of goods and services increase•PMLs could be (much) higher
Rate Inadequacy •Accelerating inflation historically contributed to rate inadequacy because ratemaking is largely a retrospective process•Many types of loss trends are sensitive to the pace of inflation: medical cost, tort, etc.•Historical loss cost trends could be biased predictors of future loss if inflation accelerates
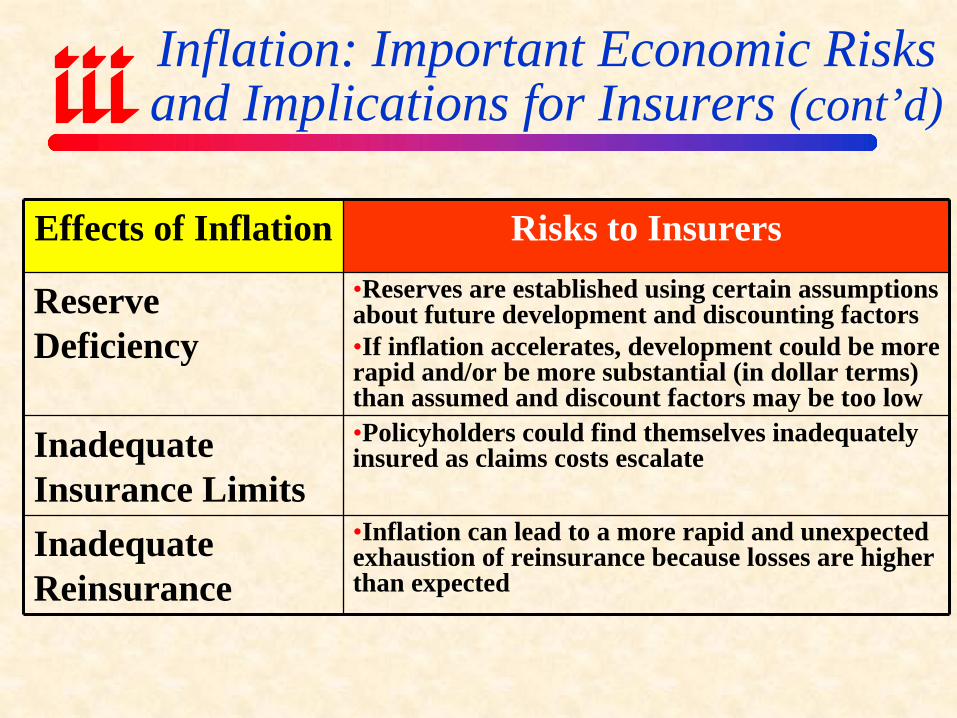
Inflation: Important Economic Risks and Implications for Insurers (cont’d)
Effects of Inflation Risks to Insurers
Reserve Deficiency
•Reserves are established using certain assumptions about future development and discounting factors•If inflation accelerates, development could be more rapid and/or be more substantial (in dollar terms) than assumed and discount factors may be too low
Inadequate Insurance Limits
•Policyholders could find themselves inadequately insured as claims costs escalate
Inadequate Reinsurance
•Inflation can lead to a more rapid and unexpected exhaustion of reinsurance because losses are higher than expected
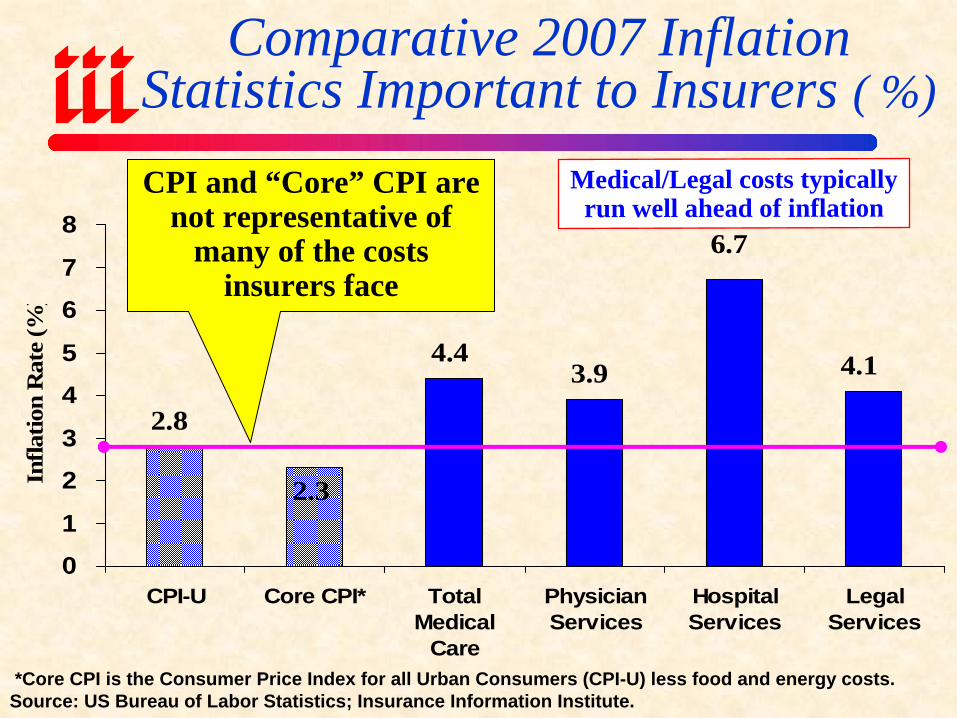
Comparative 2007 Inflation Statistics Important to Insurers ( %)
2.8
4.43.9
2.3
4.1
6.7
0
1
2
3
4
5
6
7
8
CPI-U Core CPI* TotalMedical
Care
PhysicianServices
HospitalServices
LegalServices
Infla
tion
Rat
e (%
)
*Core CPI is the Consumer Price Index for all Urban Consumers (CPI-U) less food and energy costs.Source: US Bureau of Labor Statistics; Insurance Information Institute.
CPI and “Core” CPI are not representative of
many of the costs insurers face
Medical/Legal costs typically run well ahead of inflation
Medical & Tort Cost Inflation
Amplifiers of Inflation, Major Insurance Cost Driver
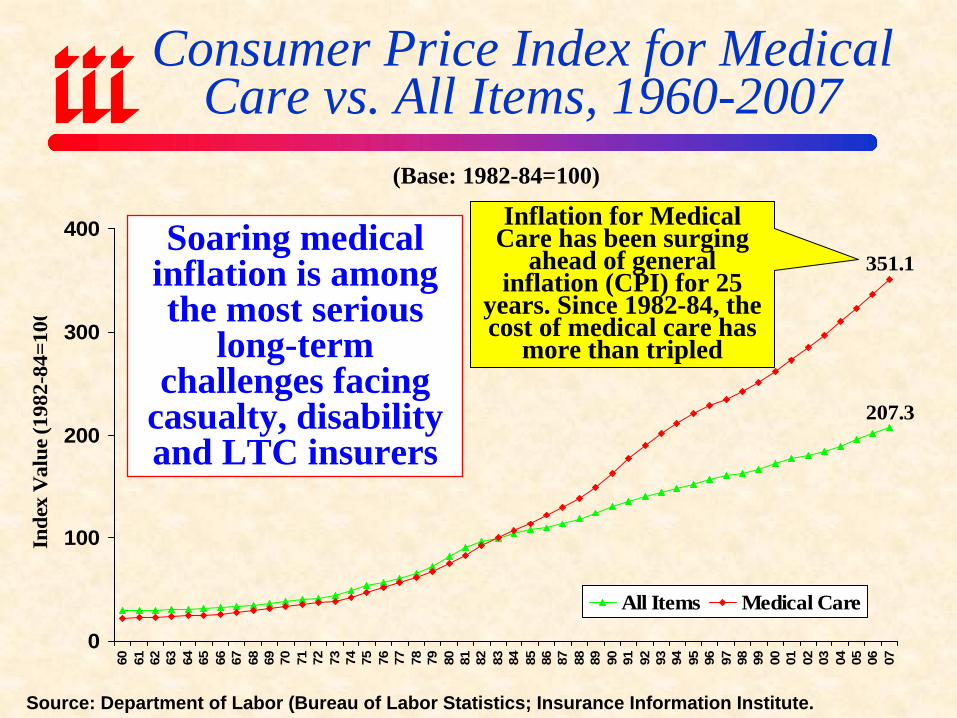
Consumer Price Index for Medical Care vs. All Items, 1960-2007
207.3
351.1
0
100
200
300
400
60 61 62 63 64 65 66 67 68 69 70 71 72 73 74 75 76 77 78 79 80 81 82 83 84 85 86 87 88 89 90 91 92 93 94 95 96 97 98 99 00 01 02 03 04 05 06 07
Inde
x V
alue
(198
2-84
=100
All Items Medical Care
Source: Department of Labor (Bureau of Labor Statistics; Insurance Information Institute.
(Base: 1982-84=100)
Inflation for Medical Care has been surging
ahead of general inflation (CPI) for 25
years. Since 1982-84, the cost of medical care has
more than tripled
Soaring medical inflation is among the most serious
long-term challenges facing
casualty, disability and LTC insurers
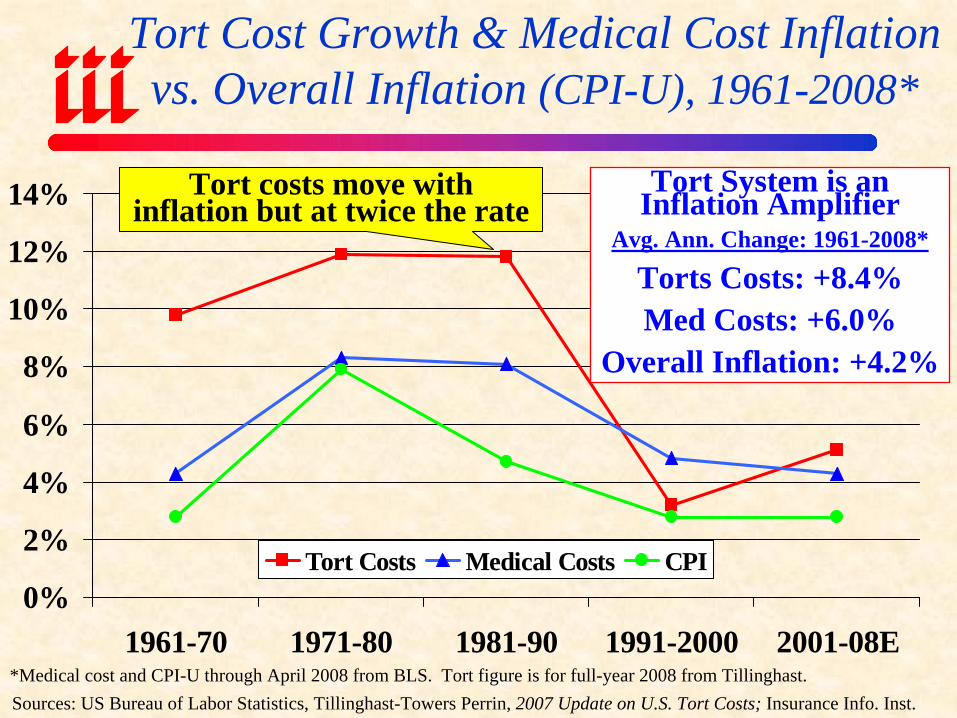
Tort Cost Growth & Medical Cost Inflation vs. Overall Inflation (CPI-U), 1961-2008*
0%
2%
4%
6%
8%
10%
12%
14%
1961-70 1971-80 1981-90 1991-2000 2001-08E
Tort Costs Medical Costs CPI
*Medical cost and CPI-U through April 2008 from BLS. Tort figure is for full-year 2008 from Tillinghast.
Tort System is an Inflation Amplifier
Avg. Ann. Change: 1961-2008*
Torts Costs: +8.4%Med Costs: +6.0%
Overall Inflation: +4.2%
Sources: US Bureau of Labor Statistics, Tillinghast-Towers Perrin, 2007 Update on U.S. Tort Costs; Insurance Info. Inst.
Tort costs move with inflation but at twice the rate
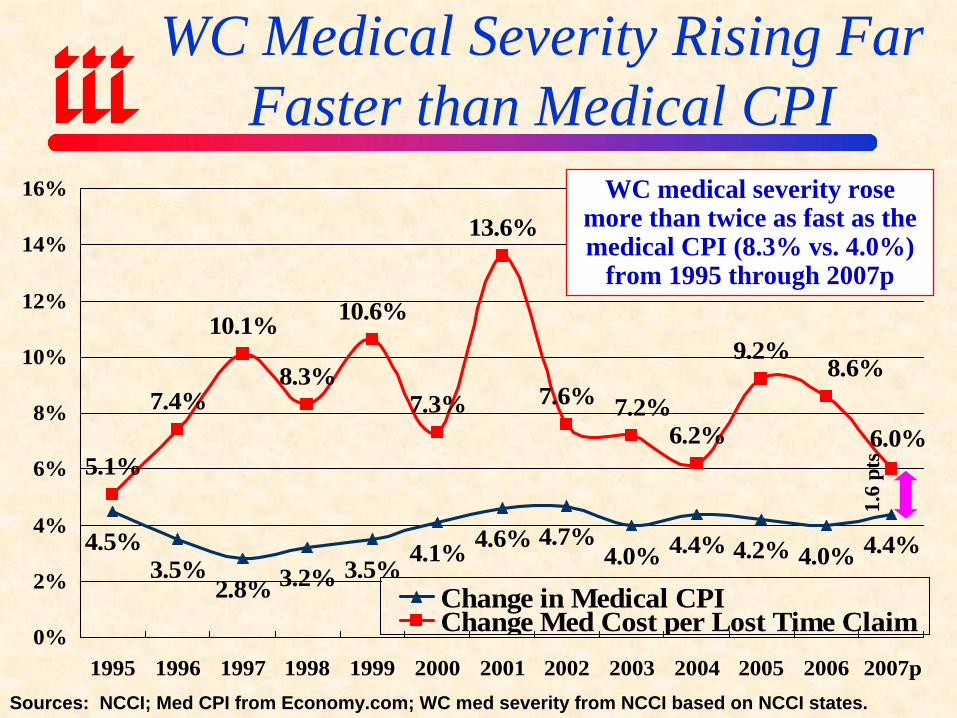
4.5%3.5%
2.8% 3.2% 3.5%4.1% 4.6% 4.7%
4.0% 4.4% 4.2% 4.0% 4.4%
5.1%
7.4%
10.1%
8.3%
10.6%
7.3%
13.6%
7.6%6.2%
9.2%
7.2%8.6%
6.0%
0%
2%
4%
6%
8%
10%
12%
14%
16%
1995 1996 1997 1998 1999 2000 2001 2002 2003 2004 2005 2006 2007p
Change in Medical CPIChange Med Cost per Lost Time Claim
WC Medical Severity Rising Far Faster than Medical CPI
Sources: NCCI; Med CPI from Economy.com; WC med severity from NCCI based on NCCI states.
1.6
pts
WC medical severity rose more than twice as fast as the medical CPI (8.3% vs. 4.0%)
from 1995 through 2007p
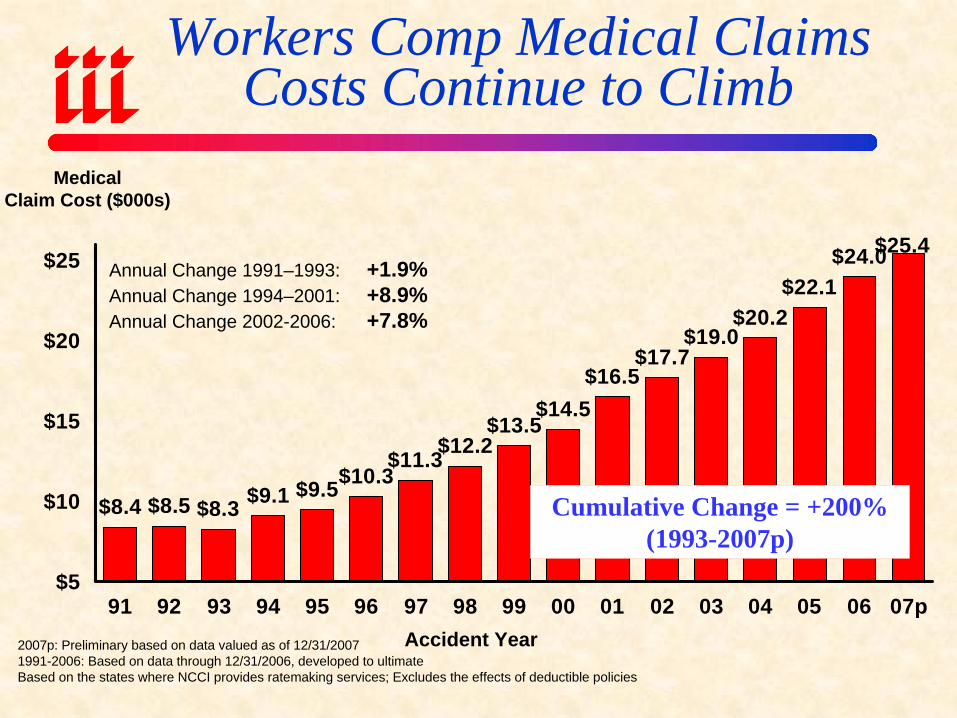
$8.4 $8.5 $8.3 $9.1 $9.5$10.3$11.3$12.2
$13.5$14.5
$16.5$17.7
$19.0$20.2
$22.1$24.0$25.4
$5
$10
$15
$20
$25
91 92 93 94 95 96 97 98 99 00 01 02 03 04 05 06 07p
Annual Change 1991–1993: +1.9%Annual Change 1994–2001: +8.9%Annual Change 2002-2006: +7.8%
Accident Year
MedicalClaim Cost ($000s)
2007p: Preliminary based on data valued as of 12/31/20071991-2006: Based on data through 12/31/2006, developed to ultimateBased on the states where NCCI provides ratemaking services; Excludes the effects of deductible policies
Workers Comp Medical Claims Costs Continue to Climb
Cumulative Change = +200%(1993-2007p)
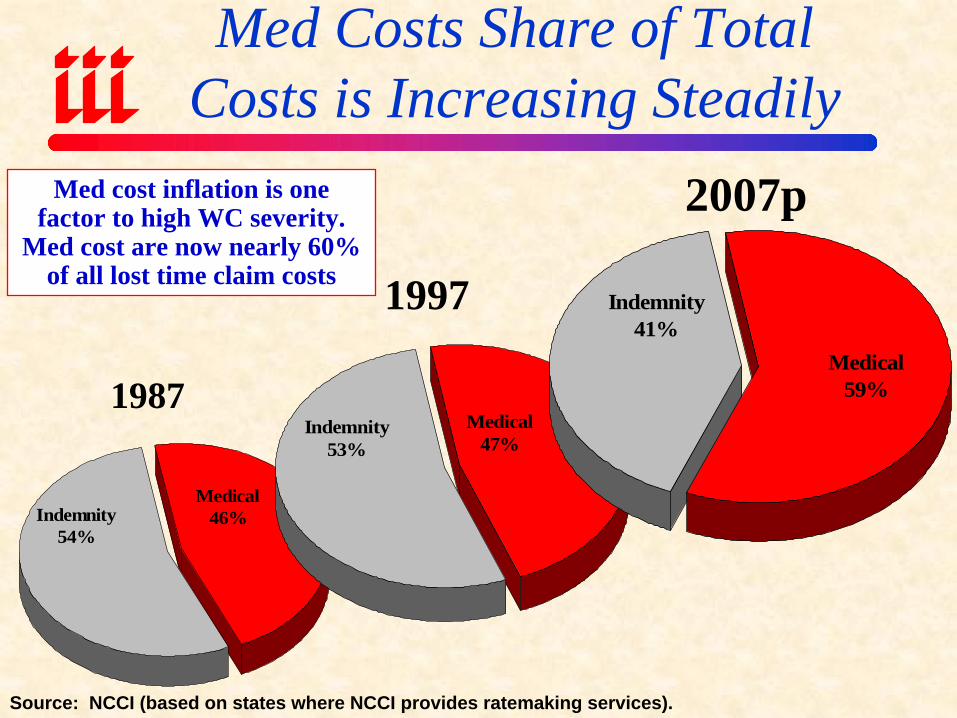
Med Costs Share of Total Costs is Increasing Steadily
Indemnity54%
Medical46%
Source: NCCI (based on states where NCCI provides ratemaking services).
Indemnity53%
Medical47%
Indemnity41%
Medical59%1987
1997
2007pMed cost inflation is one factor to high WC severity.
Med cost are now nearly 60% of all lost time claim costs
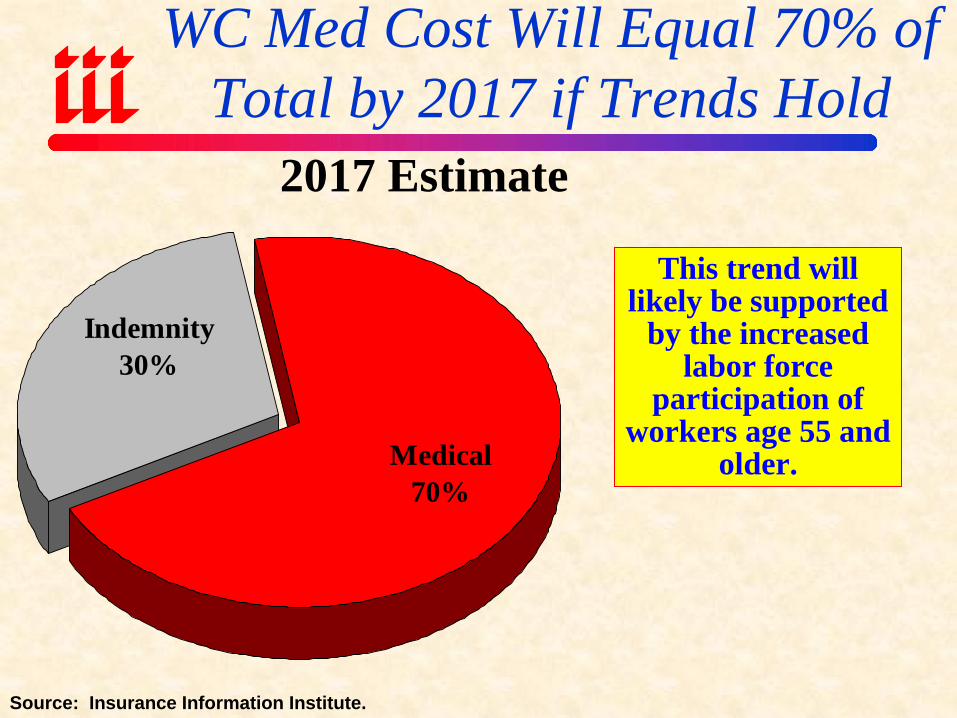
WC Med Cost Will Equal 70% of Total by 2017 if Trends Hold
Source: Insurance Information Institute.
Indemnity30%
Medical70%
2017 Estimate
This trend will likely be supported
by the increased labor force
participation of workers age 55 and
older.
PROFITABILITYProfits in 2006/07 Reached
Their Cyclical Peak;
By No Reasonable Standard Can Profits Be Deemed Excessive
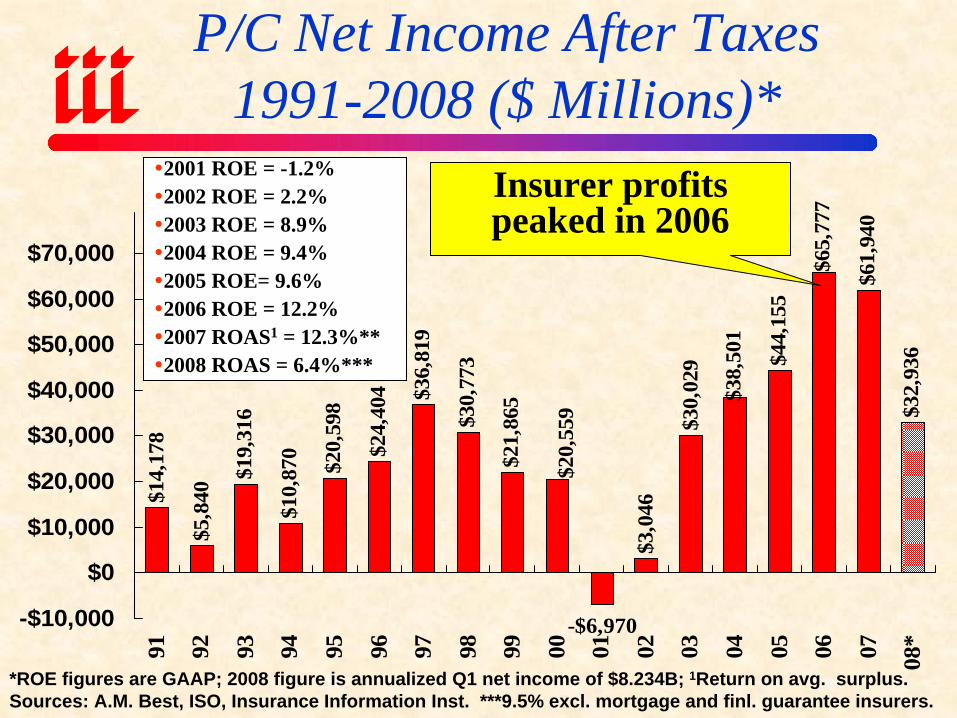
P/C Net Income After Taxes1991-2008 ($ Millions)*
$14,
178
$5,8
40
$19,
316
$10,
870
$20,
598
$24,
404 $3
6,81
9
$30,
773
$21,
865
$3,0
46
$30,
029
$61,
940
$32,
936
-$6,970
$65,
777
$44,
155
$20,
559
$38,
501
-$10,000
$0
$10,000
$20,000
$30,000
$40,000
$50,000
$60,000
$70,000
91 92 93 94 95 96 97 98 99 00 01 02 03 04 05 06 07 08*
*ROE figures are GAAP; 2008 figure is annualized Q1 net income of $8.234B; 1Return on avg. surplus.Sources: A.M. Best, ISO, Insurance Information Inst. ***9.5% excl. mortgage and finl. guarantee insurers.
2001 ROE = -1.2%2002 ROE = 2.2%2003 ROE = 8.9%2004 ROE = 9.4%2005 ROE= 9.6%2006 ROE = 12.2%2007 ROAS1 = 12.3%**2008 ROAS = 6.4%***
Insurer profits peaked in 2006
-5%
0%
5%
10%
15%
20%
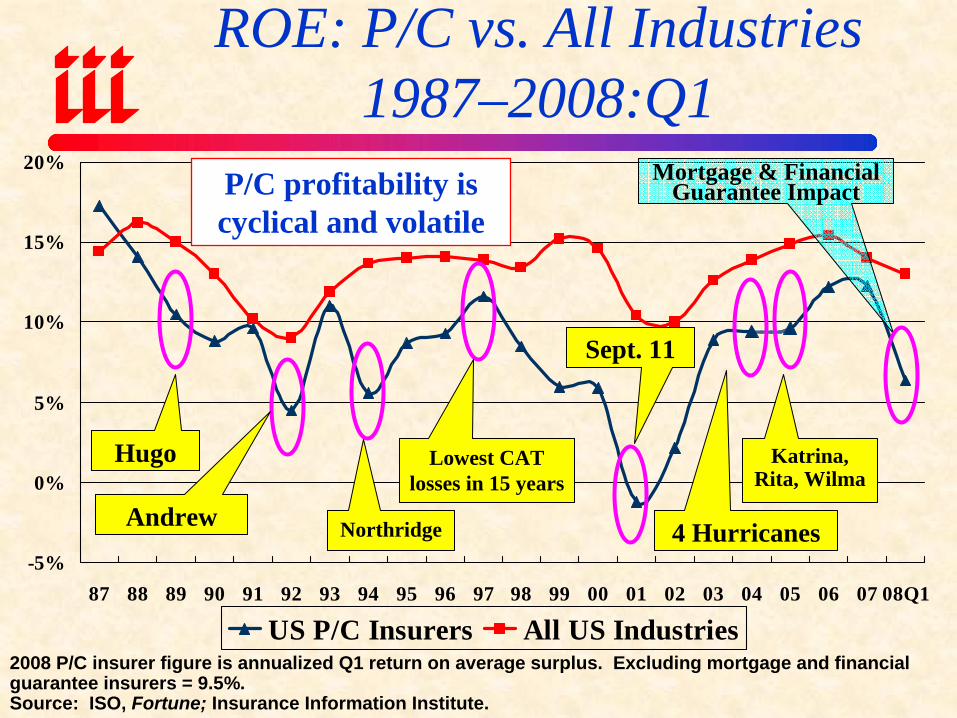
87 88 89 90 91 92 93 94 95 96 97 98 99 00 01 02 03 04 05 06 07 08Q1
US P/C Insurers All US Industries
ROE: P/C vs. All Industries 1987–2008:Q1
2008 P/C insurer figure is annualized Q1 return on average surplus. Excluding mortgage and financial guarantee insurers = 9.5%. Source: ISO, Fortune; Insurance Information Institute.
Andrew Northridge
Hugo Lowest CAT losses in 15 years
Sept. 11
4 Hurricanes
Katrina, Rita, Wilma
P/C profitability is cyclical and volatile
Mortgage & Financial Guarantee Impact
-5%
0%
5%
10%
15%
20%
25%
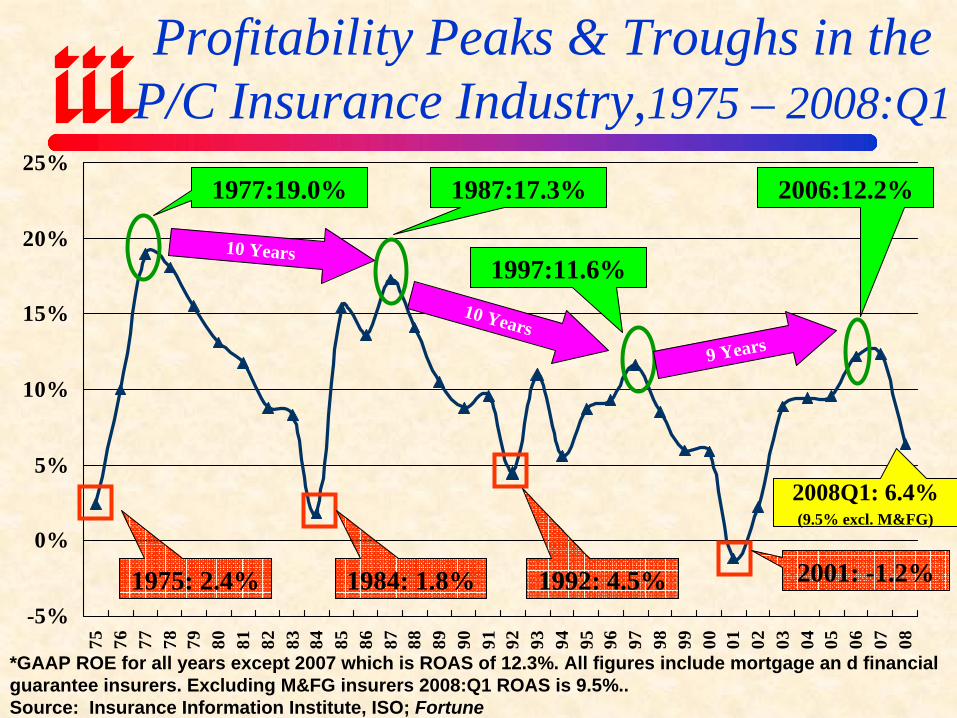
75 76 77 78 79 80 81 82 83 84 85 86 87 88 89 90 91 92 93 94 95 96 97 98 99 00 01 02 03 04 05 06 07 08
Profitability Peaks & Troughs in the P/C Insurance Industry,1975 – 2008:Q1
1975: 2.4%
1977:19.0% 1987:17.3%
1997:11.6%
2006:12.2%
1984: 1.8% 1992: 4.5% 2001: -1.2%
10 Years
10 Years9 Years
*GAAP ROE for all years except 2007 which is ROAS of 12.3%. All figures include mortgage an d financial guarantee insurers. Excluding M&FG insurers 2008:Q1 ROAS is 9.5%..Source: Insurance Information Institute, ISO; Fortune
2008Q1: 6.4%(9.5% excl. M&FG)
-4%
-2%
0%
2%
4%
6%
8%
10%
12%
14%
16%
18%
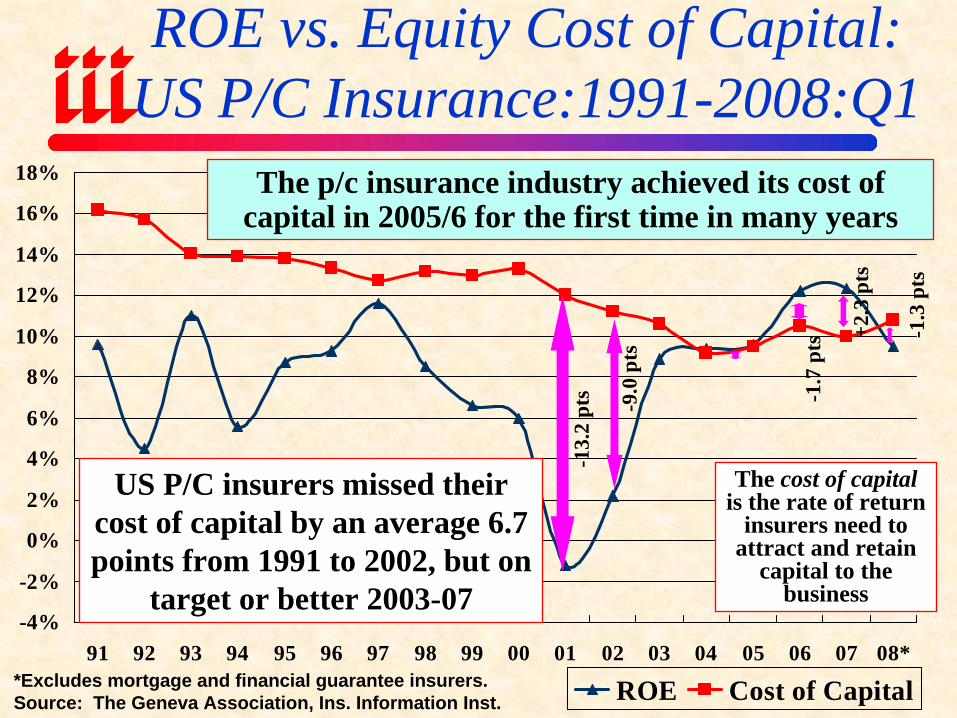
91 92 93 94 95 96 97 98 99 00 01 02 03 04 05 06 07 08*
ROE Cost of Capital
ROE vs. Equity Cost of Capital:US P/C Insurance:1991-2008:Q1
*Excludes mortgage and financial guarantee insurers.Source: The Geneva Association, Ins. Information Inst.
The p/c insurance industry achieved its cost of capital in 2005/6 for the first time in many years
-13.
2 pt
s
US P/C insurers missed their cost of capital by an average 6.7 points from 1991 to 2002, but on
target or better 2003-07
-1.7
pts +2
.3 p
ts
-9.0
pts
The cost of capitalis the rate of return
insurers need to attract and retain
capital to the business
-1.3
pts
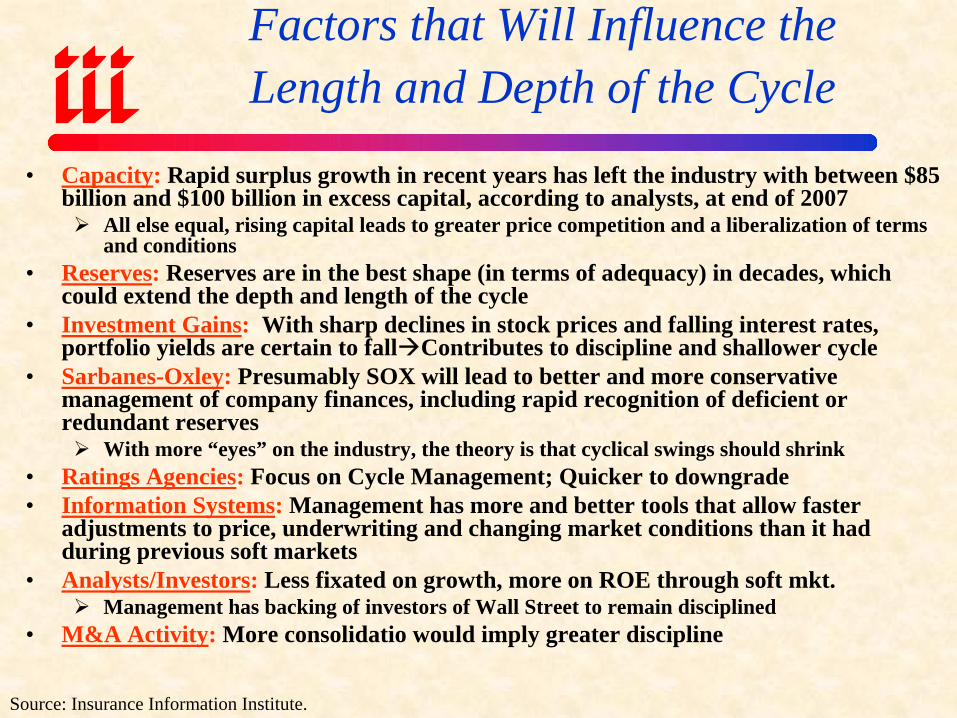
Factors that Will Influence theLength and Depth of the Cycle
• Capacity: Rapid surplus growth in recent years has left the industry with between $85 billion and $100 billion in excess capital, according to analysts, at end of 2007
All else equal, rising capital leads to greater price competition and a liberalization of terms and conditions
• Reserves: Reserves are in the best shape (in terms of adequacy) in decades, which could extend the depth and length of the cycle
• Investment Gains: With sharp declines in stock prices and falling interest rates, portfolio yields are certain to fall Contributes to discipline and shallower cycle
• Sarbanes-Oxley: Presumably SOX will lead to better and more conservative management of company finances, including rapid recognition of deficient or redundant reserves
With more “eyes” on the industry, the theory is that cyclical swings should shrink• Ratings Agencies: Focus on Cycle Management; Quicker to downgrade• Information Systems: Management has more and better tools that allow faster
adjustments to price, underwriting and changing market conditions than it had during previous soft markets
• Analysts/Investors: Less fixated on growth, more on ROE through soft mkt.Management has backing of investors of Wall Street to remain disciplined
• M&A Activity: More consolidatio would imply greater discipline
Source: Insurance Information Institute.
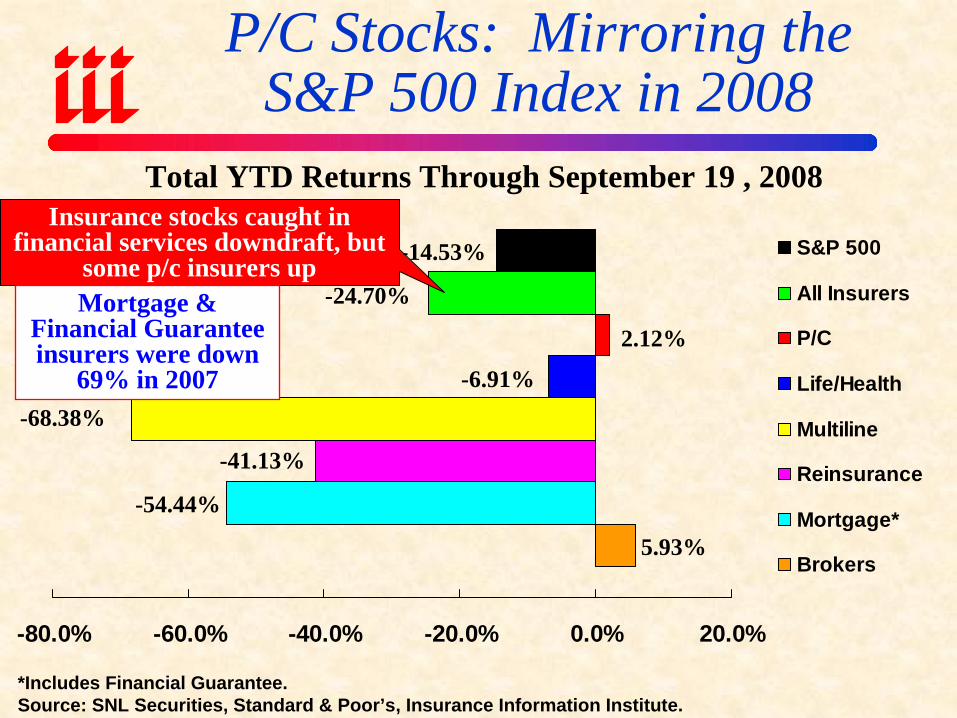
P/C Stocks: Mirroring theS&P 500 Index in 2008
5.93%
-54.44%
-41.13%
-68.38%-6.91%
2.12%
-24.70%
-14.53%
-80.0% -60.0% -40.0% -20.0% 0.0% 20.0%
S&P 500
All Insurers
P/C
Life/Health
Multiline
Reinsurance
Mortgage*
Brokers
*Includes Financial Guarantee.Source: SNL Securities, Standard & Poor’s, Insurance Information Institute.
Total YTD Returns Through September 19 , 2008Insurance stocks caught in
financial services downdraft, but some p/c insurers upMortgage &
Financial Guarantee insurers were down
69% in 2007
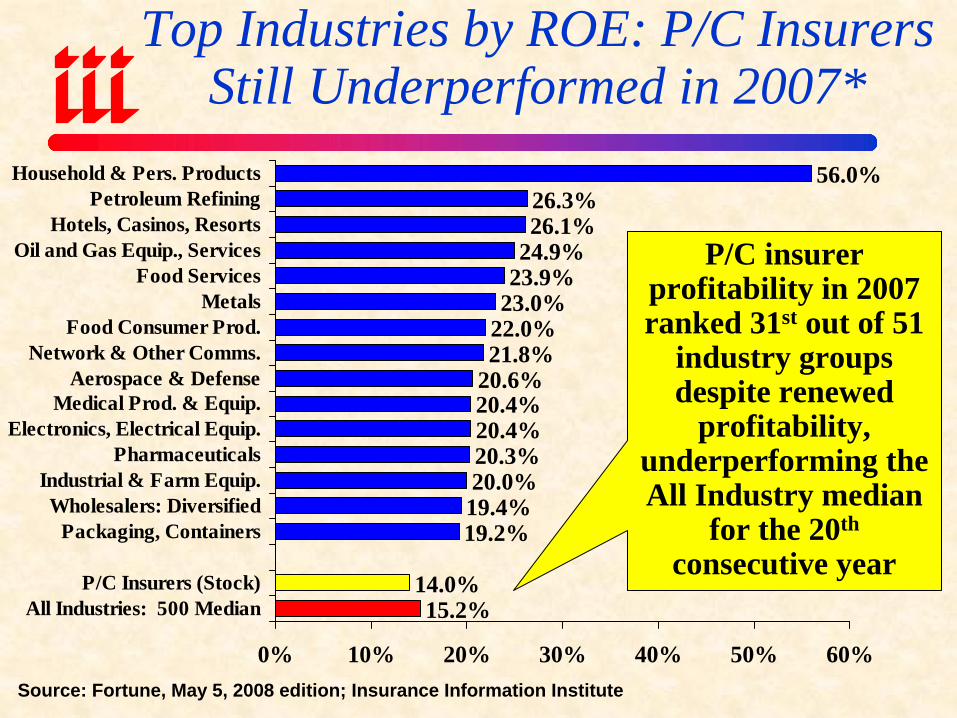
Top Industries by ROE: P/C Insurers Still Underperformed in 2007*
26.3%26.1%
24.9%23.9%
23.0%22.0%21.8%
20.6%20.4%20.4%20.3%20.0%19.4%19.2%
14.0%15.2%
56.0%
0% 10% 20% 30% 40% 50% 60%
Household & Pers. ProductsPetroleum Refining
Hotels, Casinos, ResortsOil and Gas Equip., Services
Food ServicesMetals
Food Consumer Prod.Network & Other Comms.
Aerospace & DefenseMedical Prod. & Equip.
Electronics, Electrical Equip.Pharmaceuticals
Industrial & Farm Equip.Wholesalers: Diversified
Packaging, Containers
P/C Insurers (Stock)All Industries: 500 Median
Source: Fortune, May 5, 2008 edition; Insurance Information Institute
P/C insurer profitability in 2007 ranked 31st out of 51
industry groups despite renewed
profitability, underperforming the All Industry median
for the 20th
consecutive year
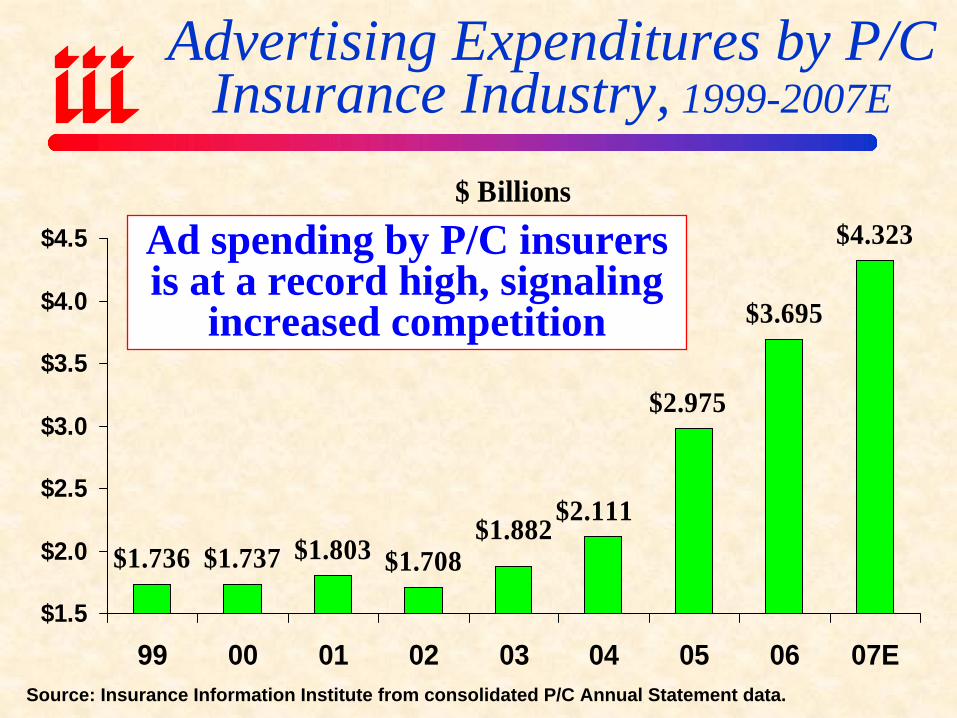
Advertising Expenditures by P/C Insurance Industry, 1999-2007E
$ Billions
$1.736 $1.737 $1.803 $1.708
$3.695
$4.323
$2.975
$2.111$1.882
$1.5
$2.0
$2.5
$3.0
$3.5
$4.0
$4.5
99 00 01 02 03 04 05 06 07ESource: Insurance Information Institute from consolidated P/C Annual Statement data.
Ad spending by P/C insurers is at a record high, signaling
increased competition
FINANCIAL STRENGTH &
RATINGSIndustry Has Weathered
the Storms Well, But Cycle May Takes Its Toll

P/C Insurer Impairments,1969-2007
815
127
11 934
913 12
199
16 14 1336
4931
3449 49
5460 58
4129
1512
3118 19
49 5047
3518
13 154
0
10
20
30
40
50
60
70
69 70 71 72 73 74 75 76 77 78 79 80 81 82 83 84 85 86 87 88 89 90 91 92 93 94 95 96 97 98 99 00 01 02 03 04 05 06 07
The number of impairments varies significantly over the p/c insurance cycle,
with peaks occurring well into hard markets
Source: A.M. Best; Insurance Information Institute
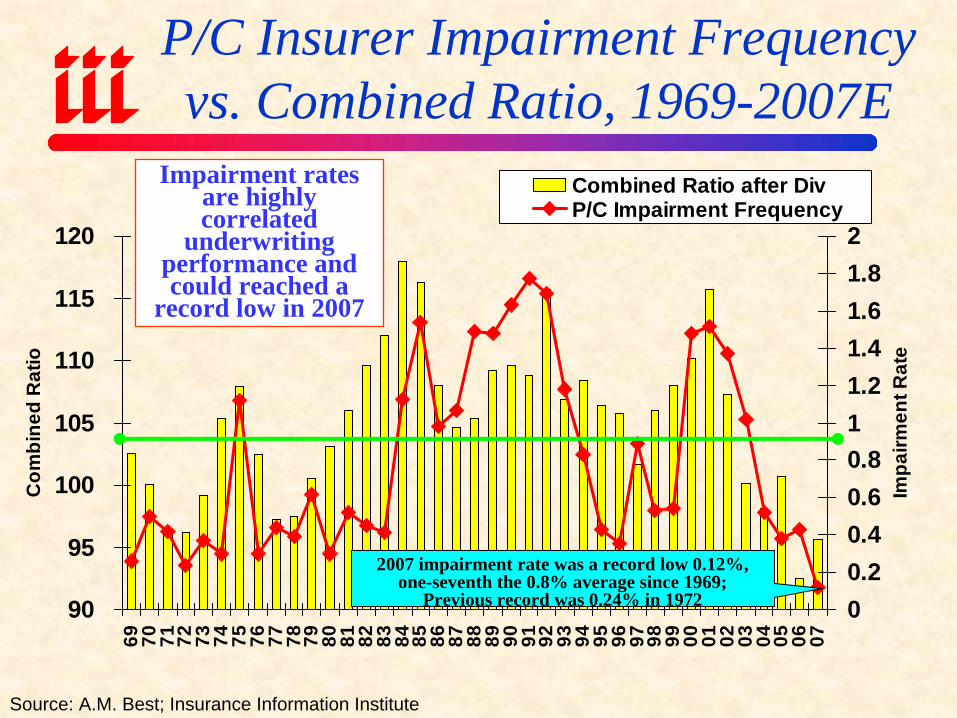
P/C Insurer Impairment Frequency vs. Combined Ratio, 1969-2007E
90
95
100
105
110
115
120
69 70 71 72 73 74 75 76 77 78 79 80 81 82 83 84 85 86 87 88 89 90 91 92 93 94 95 96 97 98 99 00 01 02 03 04 05 06 07
Com
bine
d R
atio
00.20.40.60.811.21.41.61.82
Impa
irmen
t Rat
e
Combined Ratio after DivP/C Impairment Frequency
Impairment rates are highly correlated
underwriting performance and could reached a
record low in 2007
Source: A.M. Best; Insurance Information Institute
2007 impairment rate was a record low 0.12%, one-seventh the 0.8% average since 1969;
Previous record was 0.24% in 1972
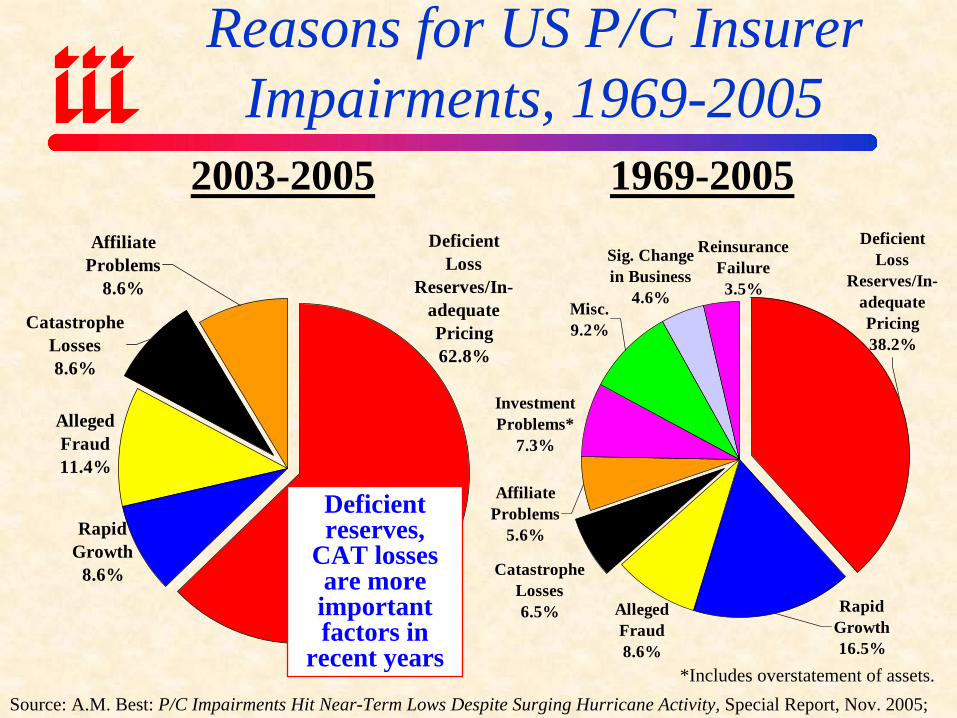
Reasons for US P/C Insurer Impairments, 1969-2005
*Includes overstatement of assets.Source: A.M. Best: P/C Impairments Hit Near-Term Lows Despite Surging Hurricane Activity, Special Report, Nov. 2005;
Catastrophe Losses8.6%
Alleged Fraud11.4%
Deficient Loss
Reserves/In-adequate Pricing62.8%
Affiliate Problems
8.6%
Rapid Growth
8.6%
2003-2005 1969-2005
Deficient reserves,
CAT losses are more important factors in
recent years
Reinsurance Failure3.5%
Rapid Growth16.5%
Misc.9.2%
Affiliate Problems
5.6%
Sig. Change in Business
4.6%
Deficient Loss
Reserves/In-adequate Pricing38.2%
Investment Problems*
7.3%
Alleged Fraud8.6%
Catastrophe Losses6.5%
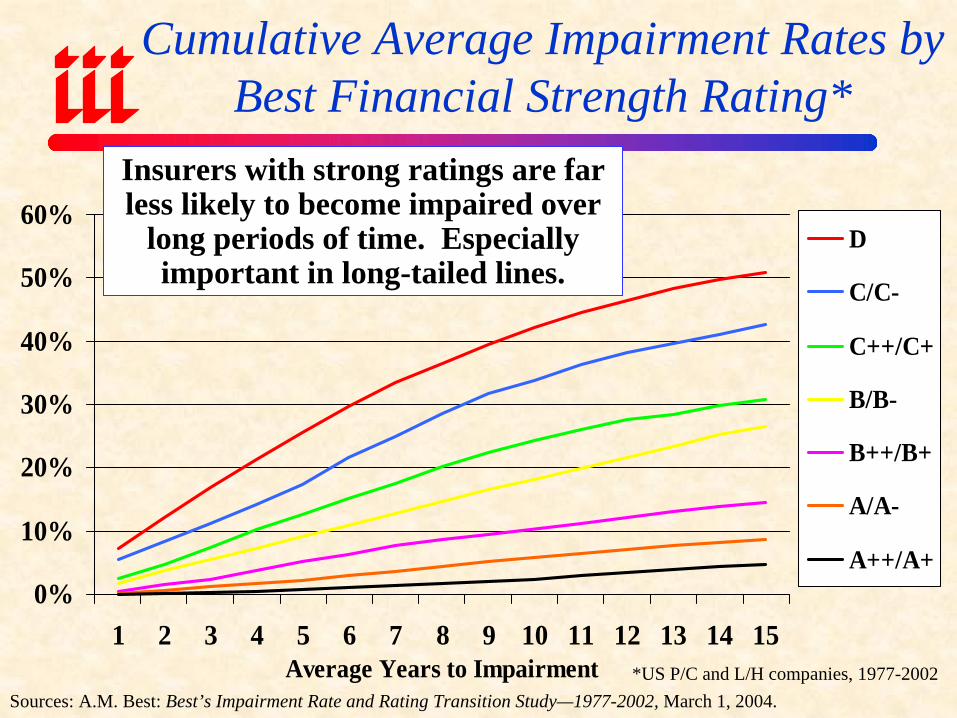
Cumulative Average Impairment Rates by Best Financial Strength Rating*
0%
10%
20%
30%
40%
50%
60%
1 2 3 4 5 6 7 8 9 10 11 12 13 14 15Average Years to Impairment
D
C/C-
C++/C+
B/B-
B++/B+
A/A-
A++/A+
Sources: A.M. Best: Best’s Impairment Rate and Rating Transition Study—1977-2002, March 1, 2004.
Insurers with strong ratings are far less likely to become impaired over
long periods of time. Especially important in long-tailed lines.
*US P/C and L/H companies, 1977-2002
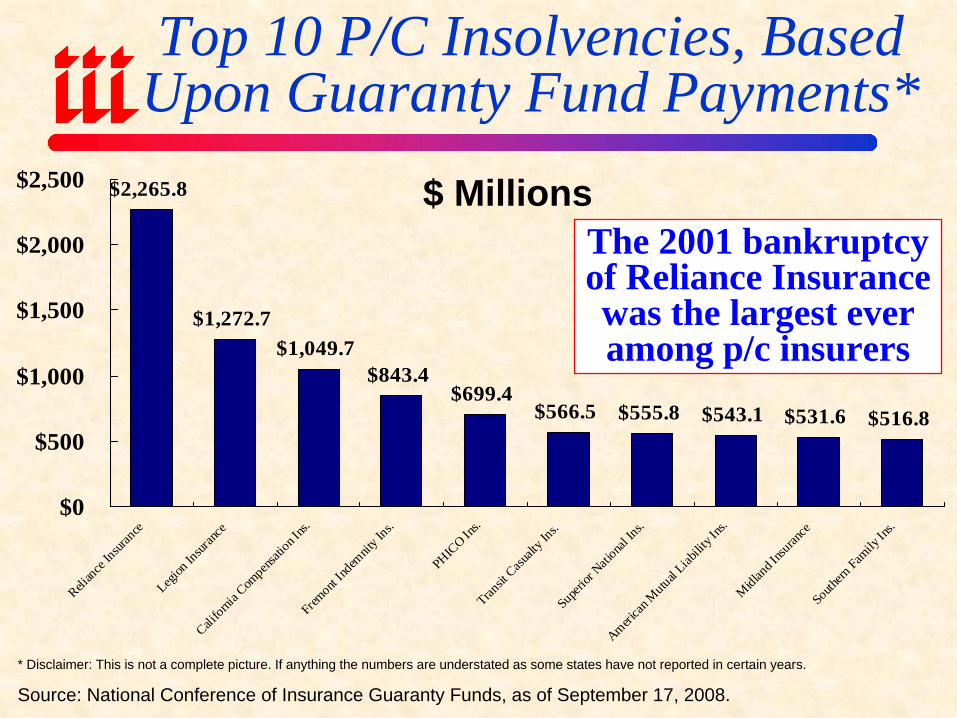
Top 10 P/C Insolvencies, Based Upon Guaranty Fund Payments*
$2,265.8
$1,272.7$1,049.7
$843.4$699.4
$566.5 $555.8 $543.1 $531.6 $516.8
$0
$500
$1,000
$1,500
$2,000
$2,500
Relian
ce Ins
uranc
e
Legion
Insur
ance
Califor
nia C
ompe
nsatio
n Ins.
Frem
ont I
ndem
nity I
ns.
PHIC
O Ins.
Transit
Casu
alty I
ns.
Supe
rior N
ation
al Ins
.
America
n Mutu
al Liab
ility I
ns.M
idlan
d Insu
rance
Southe
rn Fam
ily In
s.
* Disclaimer: This is not a complete picture. If anything the numbers are understated as some states have not reported in certain years.
Source: National Conference of Insurance Guaranty Funds, as of September 17, 2008.
$ MillionsThe 2001 bankruptcy of Reliance Insurance was the largest ever among p/c insurers
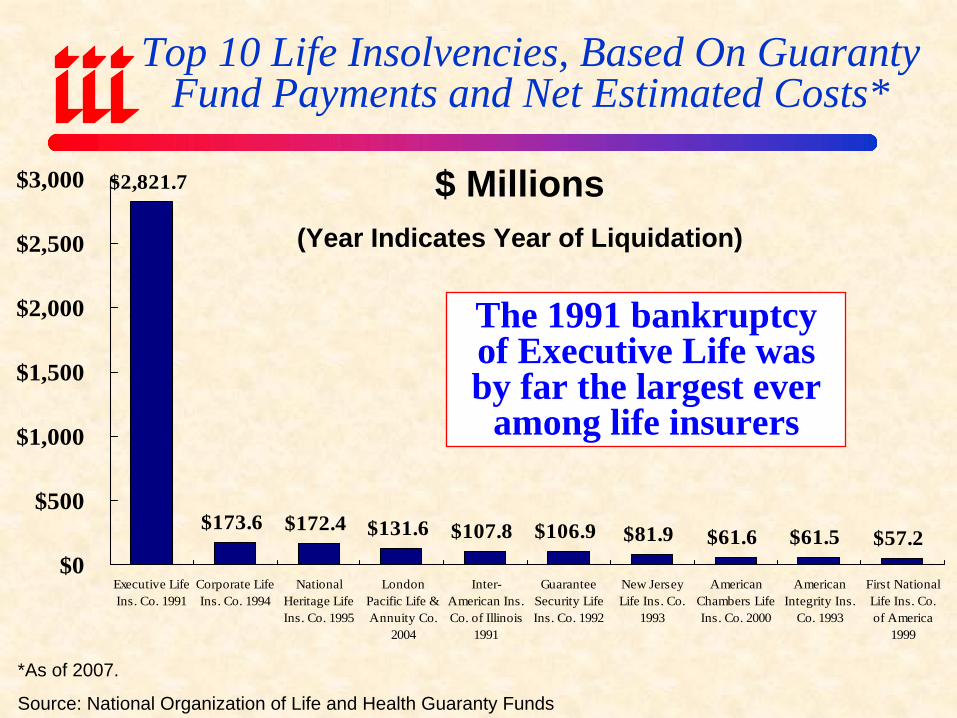
Top 10 Life Insolvencies, Based On GuarantyFund Payments and Net Estimated Costs*
$2,821.7
$173.6 $172.4 $131.6 $107.8 $106.9 $81.9 $61.6 $61.5 $57.2$0
$500
$1,000
$1,500
$2,000
$2,500
$3,000
Executive LifeIns. Co. 1991
Corporate LifeIns. Co. 1994
NationalHeritage LifeIns. Co. 1995
LondonPacific Life &Annuity Co.
2004
Inter-American Ins.Co. of Illinois
1991
GuaranteeSecurity LifeIns. Co. 1992
New JerseyLife Ins. Co.
1993
AmericanChambers LifeIns. Co. 2000
AmericanIntegrity Ins.
Co. 1993
First NationalLife Ins. Co.of America
1999
*As of 2007.
Source: National Organization of Life and Health Guaranty Funds
$ Millions(Year Indicates Year of Liquidation)
The 1991 bankruptcy of Executive Life was by far the largest ever
among life insurers
UNDERWRITINGTRENDS
Extremely Strong 2006/07;Relying on Momentum &
Discipline for 2008
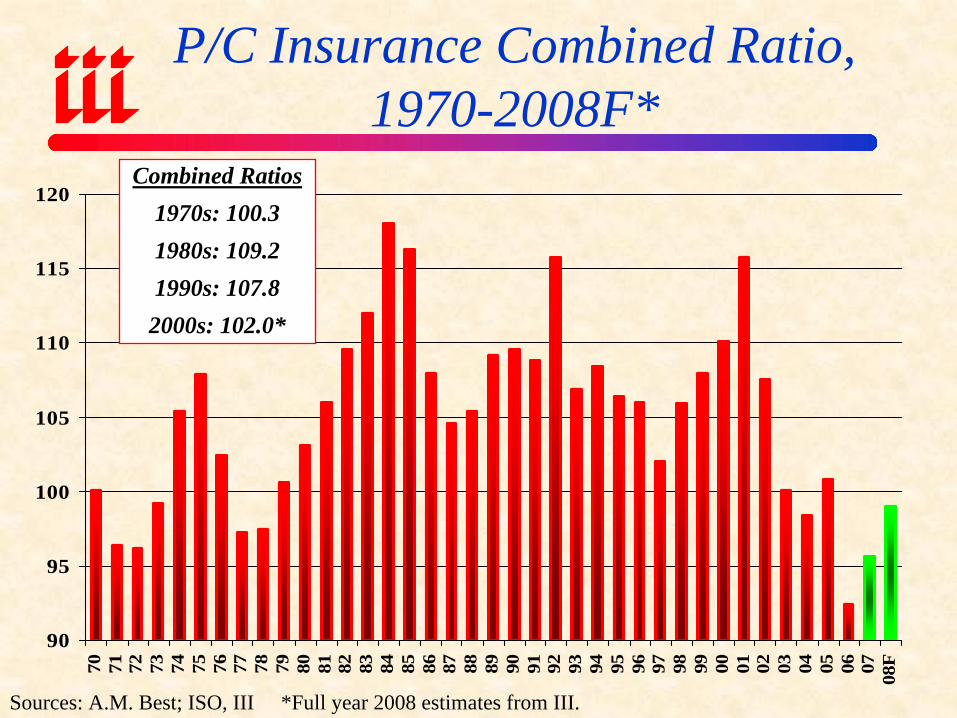
90
95
100
105
110
115
120
70 71 72 73 74 75 76 77 78 79 80 81 82 83 84 85 86 87 88 89 90 91 92 93 94 95 96 97 98 99 00 01 02 03 04 05 06 07 08F
Combined Ratios1970s: 100.31980s: 109.21990s: 107.82000s: 102.0*
Sources: A.M. Best; ISO, III *Full year 2008 estimates from III.
P/C Insurance Combined Ratio, 1970-2008F*
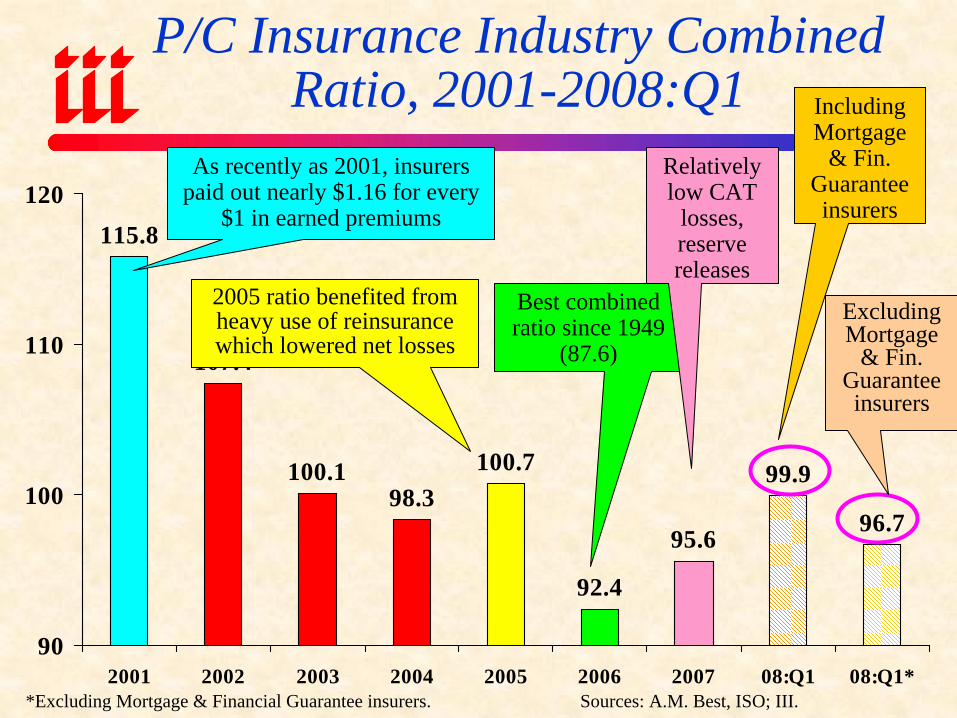
115.8
107.4
100.198.3
100.7
92.4
96.7
99.9
95.6
90
100
110
120
2001 2002 2003 2004 2005 2006 2007 08:Q1 08:Q1*
P/C Insurance Industry Combined Ratio, 2001-2008:Q1
*Excluding Mortgage & Financial Guarantee insurers. Sources: A.M. Best, ISO; III.
2005 ratio benefited from heavy use of reinsurance which lowered net losses
Best combined ratio since 1949
(87.6)
As recently as 2001, insurers paid out nearly $1.16 for every
$1 in earned premiums
Relatively low CAT
losses, reserve releases
Including Mortgage
& Fin. Guarantee insurers
Excluding Mortgage
& Fin. Guarantee insurers
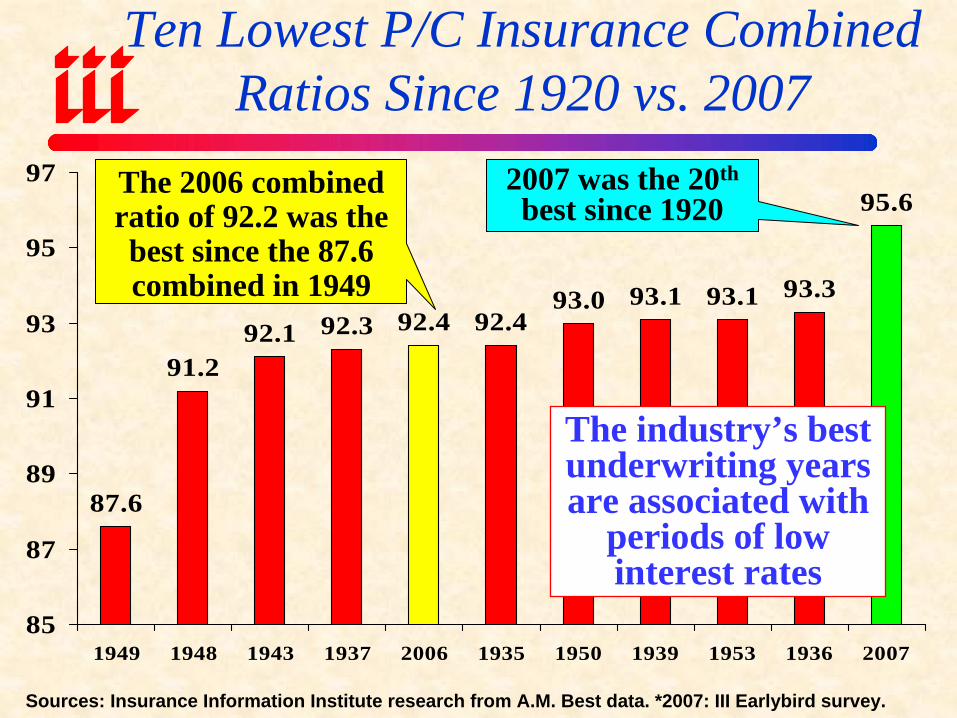
87.6
91.292.1 92.3 92.4 92.4
93.1 93.1 93.3
95.6
93.0
85
87
89
91
93
95
97
1949 1948 1943 1937 2006 1935 1950 1939 1953 1936 2007
Ten Lowest P/C Insurance Combined Ratios Since 1920 vs. 2007
Sources: Insurance Information Institute research from A.M. Best data. *2007: III Earlybird survey.
2007 was the 20th
best since 1920
The industry’s best underwriting years are associated with
periods of low interest rates
The 2006 combined ratio of 92.2 was the best since the 87.6 combined in 1949
-55-50-45-40-35-30-25-20-15-10-505
101520253035
75 76 77 78 79 80 81 82 83 84 85 86 87 88 89 90 91 92 93 94 95 96 97 98 99 00 01 02 03 04 05 06 07 08
Source: A.M. Best, ISO; Insurance Information Institute * Includes mortgage * finl. guarantee insurers
$ B
illio
ns
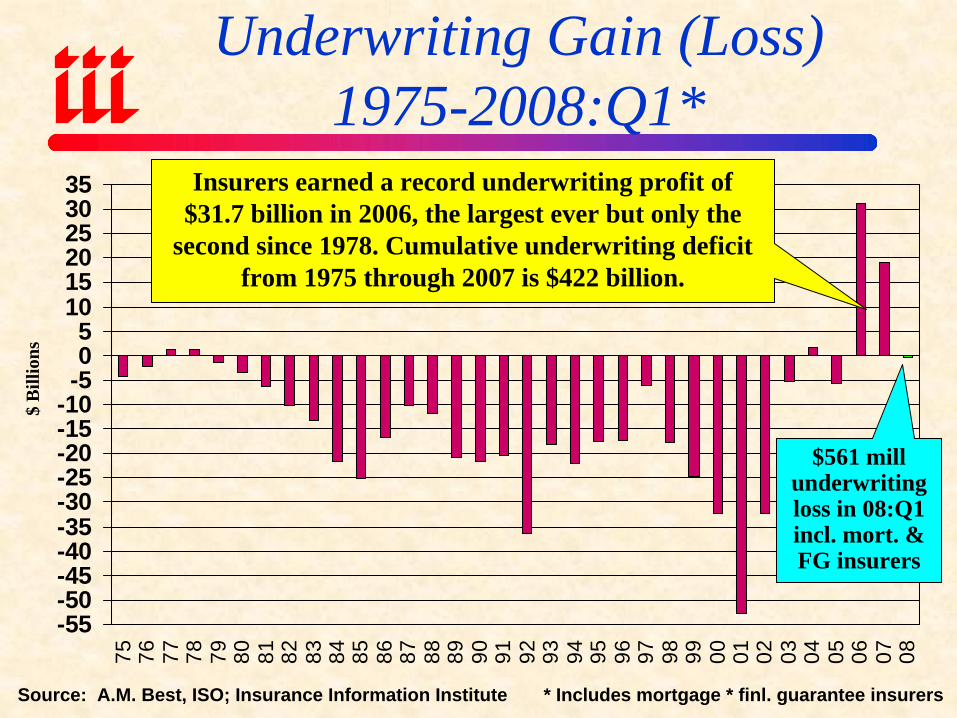
Insurers earned a record underwriting profit of $31.7 billion in 2006, the largest ever but only the
second since 1978. Cumulative underwriting deficit from 1975 through 2007 is $422 billion.
Underwriting Gain (Loss)1975-2008:Q1*
$561 mill underwriting loss in 08:Q1 incl. mort. & FG insurers
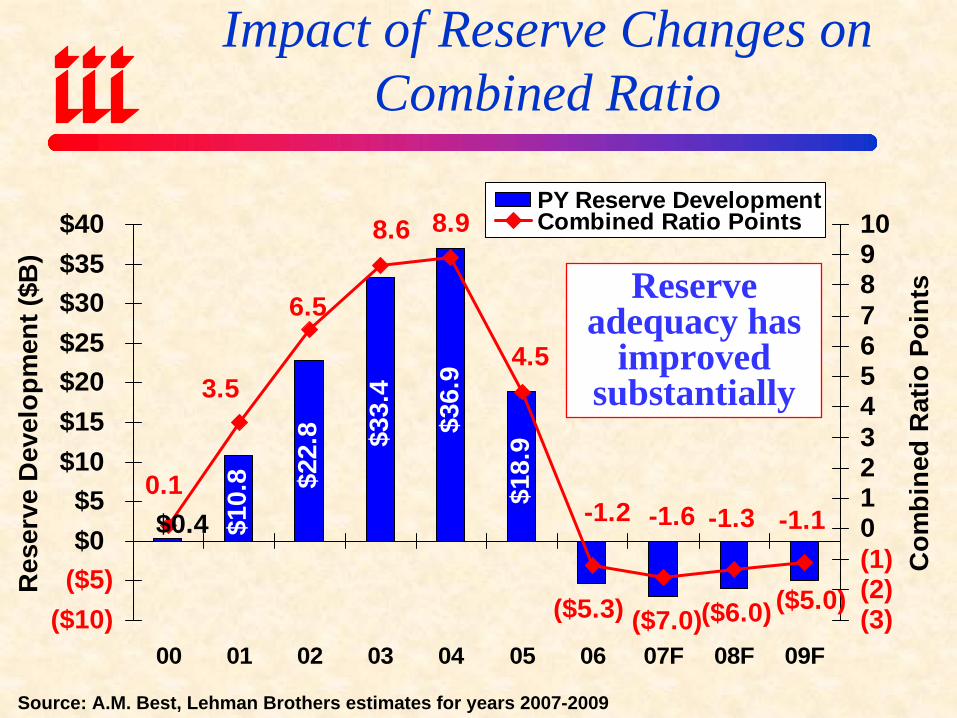
$10.
8 $22.
8 $33.
4
$36.
9
$18.
9
($5.0)($6.0)($5.3)
$0.4
($7.0)
8.9
-1.1-1.3-1.6
4.5
-1.20.1
3.5
8.6
6.5
($10)($5)$0$5
$10$15$20$25$30$35$40
00 01 02 03 04 05 06 07F 08F 09F
Res
erve
Dev
elop
men
t ($B
)
(3)(2)(1)012345678910
Com
bine
d R
atio
Poi
nts
PY Reserve DevelopmentCombined Ratio Points
Impact of Reserve Changes on Combined Ratio
Source: A.M. Best, Lehman Brothers estimates for years 2007-2009
Reserve adequacy has
improved substantially
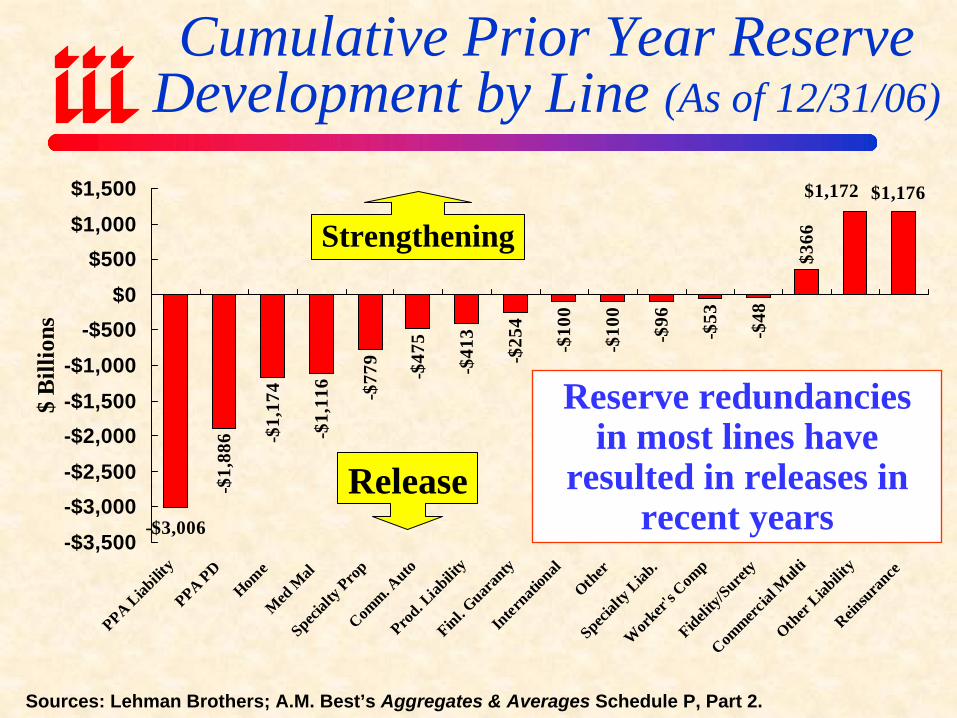
Cumulative Prior Year Reserve Development by Line (As of 12/31/06)
-$1,
886 -$
1,17
4
-$1,
116 -$77
9
-$47
5
-$41
3
-$25
4
-$10
0
-$10
0
-$96
-$53
-$48
$366
$1,176$1,172
-$3,006-$3,500-$3,000-$2,500-$2,000-$1,500-$1,000
-$500$0
$500$1,000$1,500
PPA Liab
ility
PPA PD
Home
Med
Mal
Specialt
y Pro
pCom
m. Auto
Prod. L
iabilit
yFinl. G
uaran
tyIn
ternati
onal
Other
Specialt
y Liab
.W
orker'
s Com
pFideli
ty/Suret
y
Commerc
ial M
ulti
Other
Liabilit
yRein
sura
nce$
Bill
ions
Sources: Lehman Brothers; A.M. Best’s Aggregates & Averages Schedule P, Part 2.
Reserve redundancies in most lines have
resulted in releases in recent years
Release
Strengthening

COMMERCIAL LINES
Commercial AutoCommercial Multi-Peril
Workers Comp
110.
3
110.
2
107.
6
103.
9 109.
7
112.
3
111.
1
122.
3
110.
2
102.
5 105.
4
91.2 94
.0 97.5
102.
0
112.
5
85
90
95
100
105
110
115
120
125
93 94 95 96 97 98 99 00 01 02 03 04 05 06 07E 08F
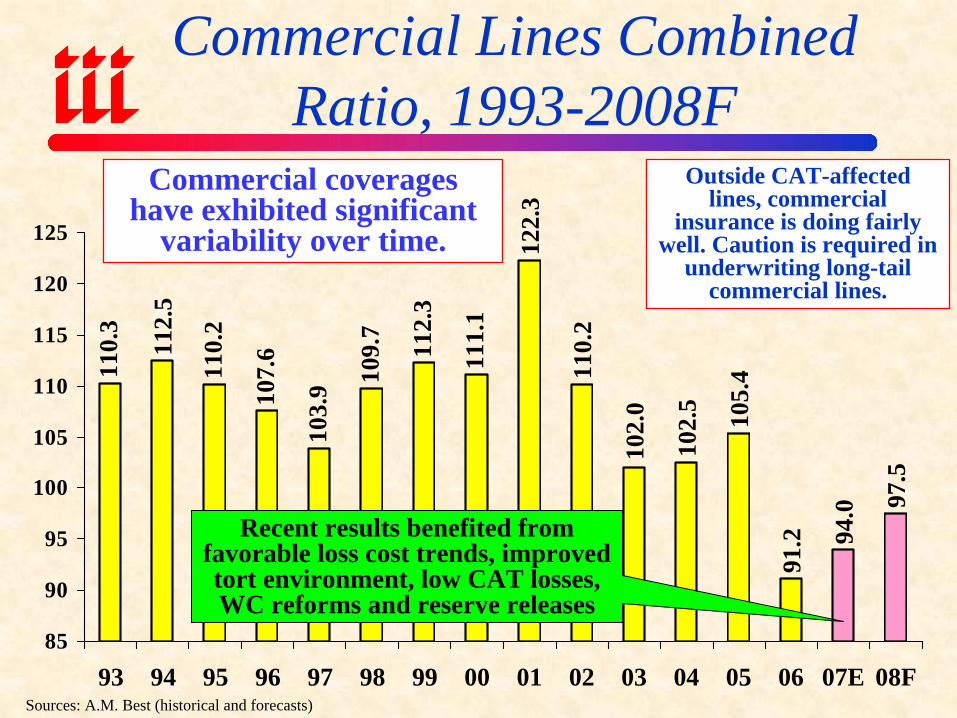
Recent results benefited from favorable loss cost trends, improved tort environment, low CAT losses, WC reforms and reserve releases
Commercial coverages have exhibited significant
variability over time.
Commercial Lines Combined Ratio, 1993-2008F
Outside CAT-affected lines, commercial
insurance is doing fairly well. Caution is required in
underwriting long-tail commercial lines.
Sources: A.M. Best (historical and forecasts)
EMERGING RISKS
Common Mistake is to Assume all Emerging Risks
are About Underwriting
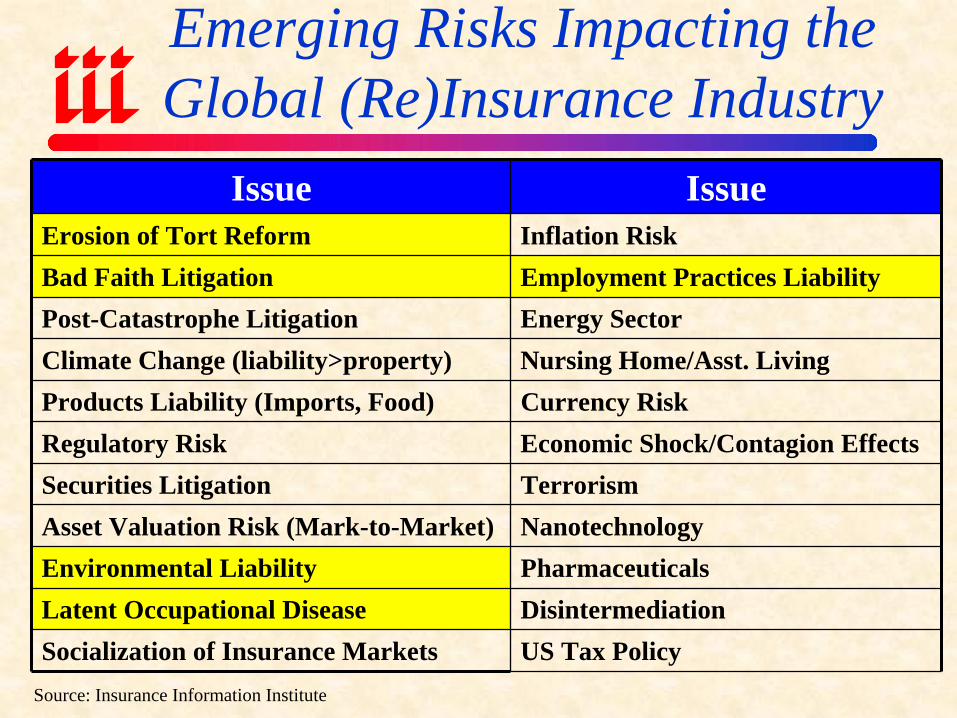
Emerging Risks Impacting the Global (Re)Insurance Industry
Source: Insurance Information Institute
Issue IssueErosion of Tort Reform Inflation RiskBad Faith Litigation Employment Practices LiabilityPost-Catastrophe Litigation Energy SectorClimate Change (liability>property) Nursing Home/Asst. LivingProducts Liability (Imports, Food) Currency RiskRegulatory Risk Economic Shock/Contagion EffectsSecurities Litigation TerrorismAsset Valuation Risk (Mark-to-Market) NanotechnologyEnvironmental Liability PharmaceuticalsLatent Occupational Disease DisintermediationSocialization of Insurance Markets US Tax Policy

PREMIUM GROWTH
At a Virtual Standstillin 2007/08
-2%
0%2%
4%6%
8%10%
12%14%
16%18%
20%22%
24%
1971
1972
1973
1974
1975
1976
1977
1978
1979
1980
1981
1982
1983
1984
1985
1986
1987
1988
1989
1990
1991
1992
1993
1994
1995
1996
1997
1998
1999
2000
2001
2002
2003
2004
2005
2006
2007
2008
2008 is Q1 actual (-0.7%), including Mortgage & Financial Guarantee insurersSources: A.M. Best, ISO, Insurance Information Institute
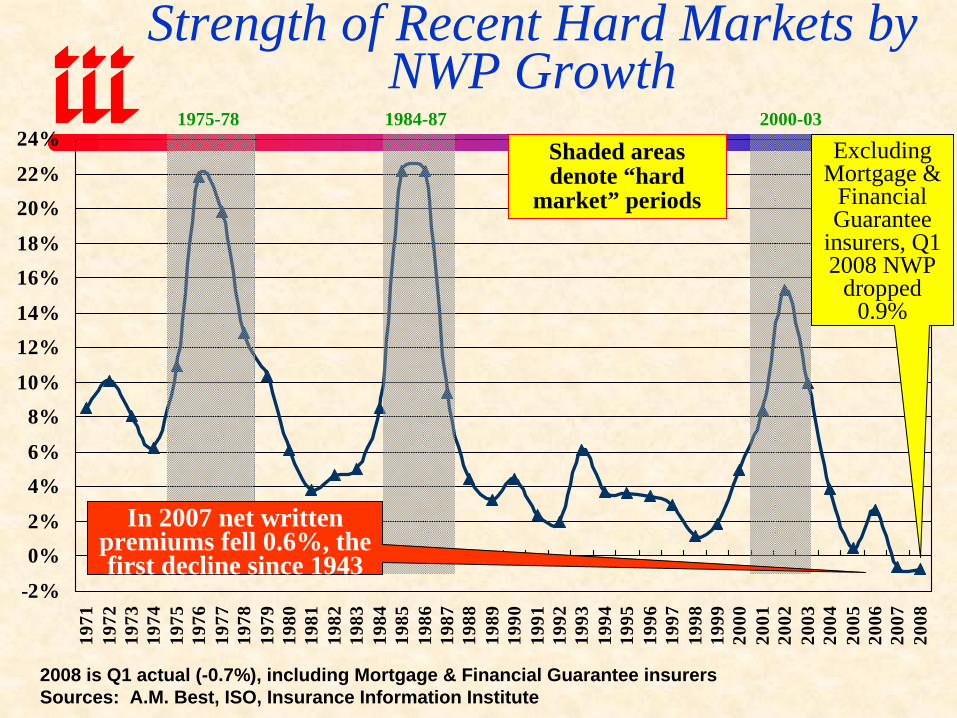
Strength of Recent Hard Markets by NWP Growth
1975-78 1984-87 2000-03
In 2007 net written premiums fell 0.6%, the first decline since 1943
Shaded areas denote “hard
market” periods
Excluding Mortgage &
Financial Guarantee
insurers, Q1 2008 NWP
dropped 0.9%
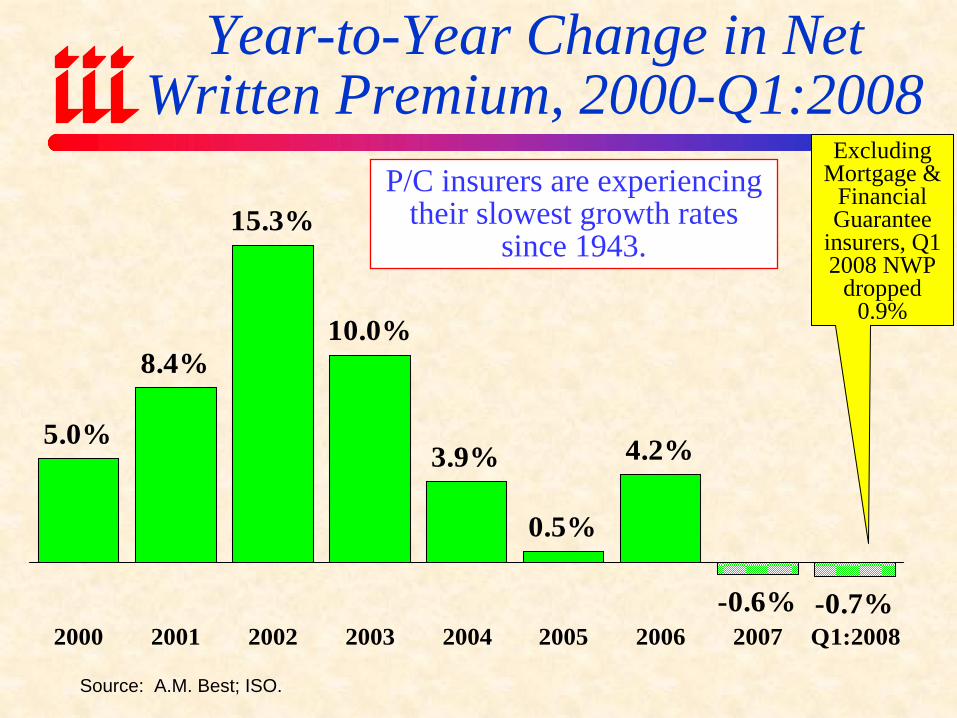
Year-to-Year Change in Net Written Premium, 2000-Q1:2008
Source: A.M. Best; ISO.
5.0%
8.4%
15.3%
10.0%
3.9%
0.5%
4.2%
-0.6% -0.7%2000 2001 2002 2003 2004 2005 2006 2007 Q1:2008
P/C insurers are experiencing their slowest growth rates
since 1943.
Excluding Mortgage &
Financial Guarantee
insurers, Q1 2008 NWP
dropped 0.9%
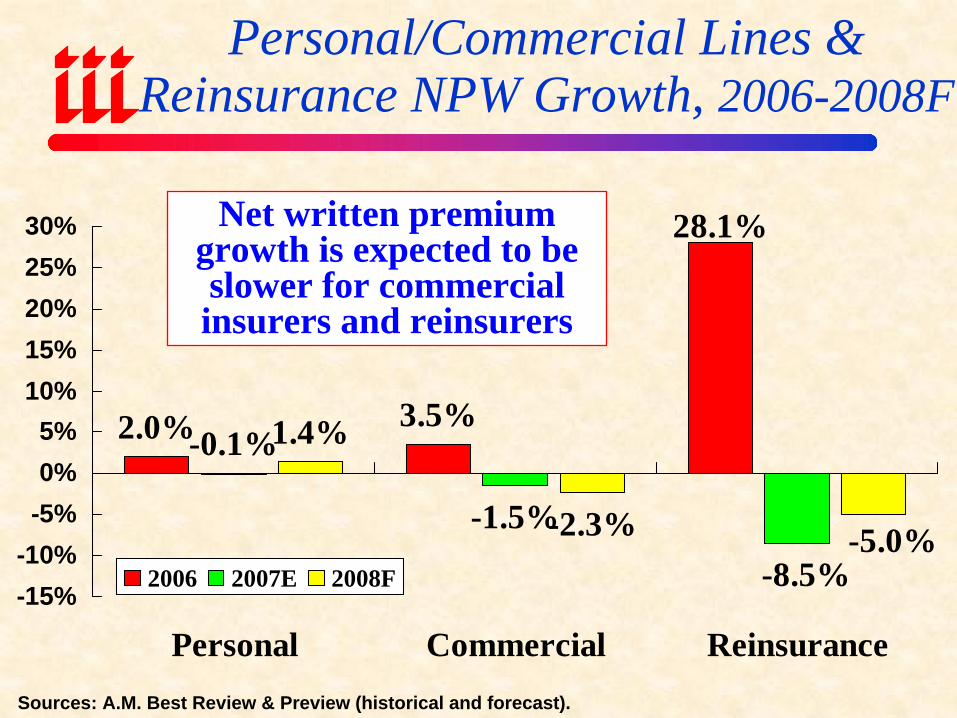
Personal/Commercial Lines & Reinsurance NPW Growth, 2006-2008F
2.0% 3.5%
28.1%
-0.1%
-1.5%
1.4%
-2.3%-8.5%
-5.0%-15%-10%
-5%0%5%
10%15%20%25%30%
Personal Commercial Reinsurance
2006 2007E 2008F
Sources: A.M. Best Review & Preview (historical and forecast).
Net written premium growth is expected to be slower for commercial insurers and reinsurers
0%
10%
20%
30%
40%
50%
60%
70%
80%
90%
72 83 84 85 86 87 88 89 90 91 92 93 94 95 96 97 98 99 00 01 02 03 04 05 06
Direct Independent Agents
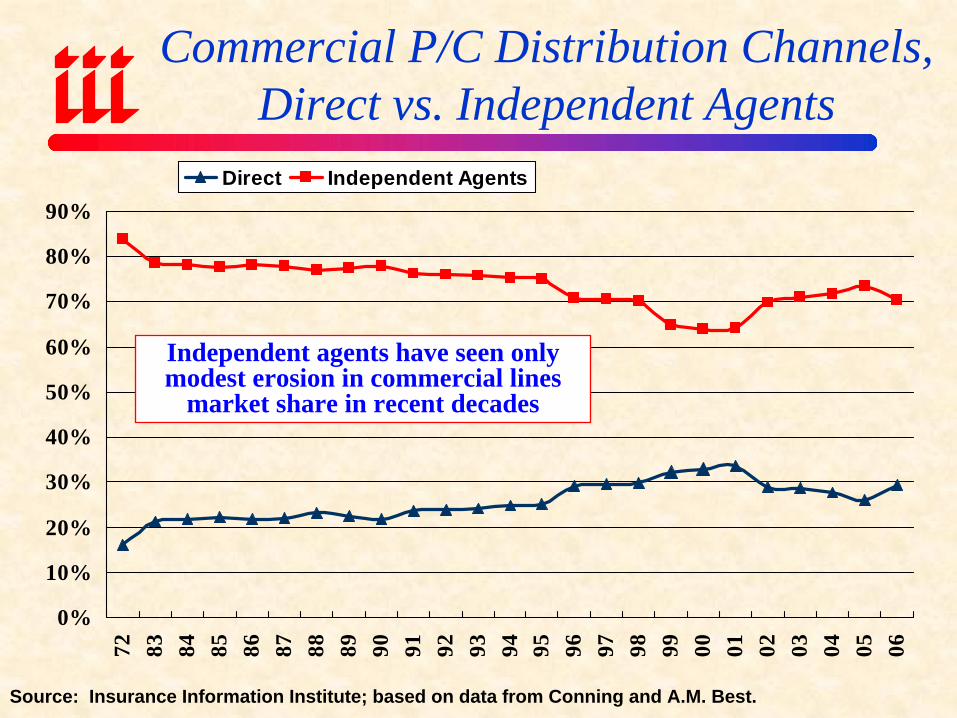
Commercial P/C Distribution Channels, Direct vs. Independent Agents
Source: Insurance Information Institute; based on data from Conning and A.M. Best.
Independent agents have seen only modest erosion in commercial lines
market share in recent decades
PRICING TRENDS
Under Pressure
109.4110.2
118.8
109.5
112.5110.2
107.6
104.1
109.7 110.2
102.5
105.4
90.5 91.4
102.0
111.1112.3
122.3
$7.3
0
$6.4
9
$13.
91
$13.
15
$11.
94
$11.
55
$11.
95
$8.3
0
$13.
50
$8.4
2
$4.8
3
$5.2
0
$5.7
1
$5.2
5
$5.7
0
$7.7
0
$6.4
0
$6.1
0
90
95
100
105
110
115
120
125
90 91 92 93 94 95 96 97 98 99 00 01 02 03 04 05 06 07
Com
mer
cial
Lin
es C
ombi
ned
Rat
io
$0
$2
$4
$6
$8
$10
$12
$14
Cos
t of R
isk/
$100
0 R
even
ue
CommercialCombined RatioCost of Risk
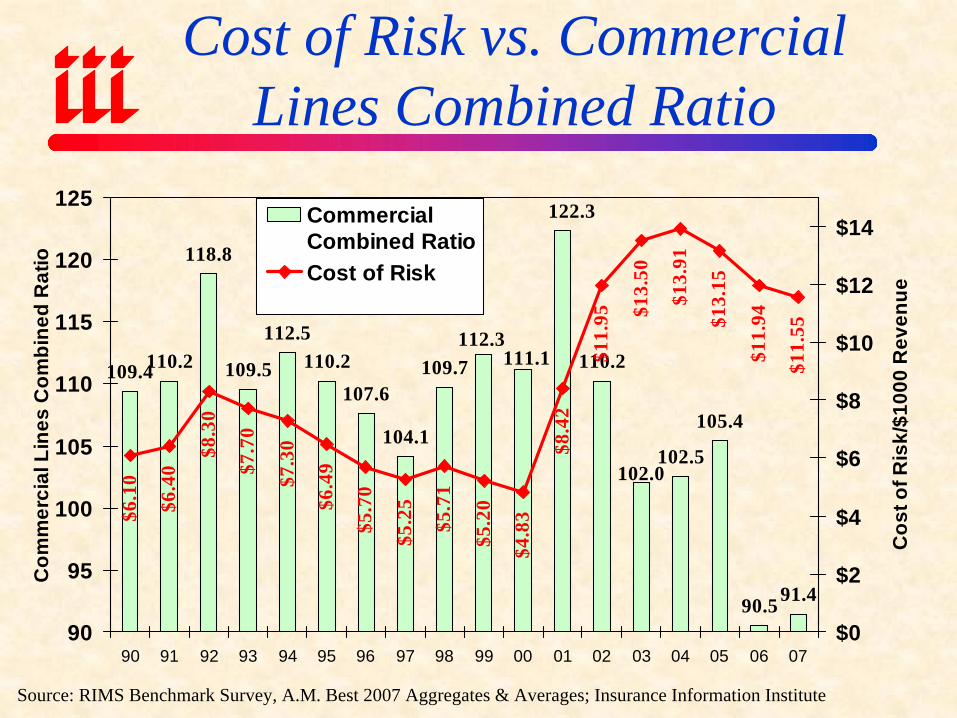
Source: RIMS Benchmark Survey, A.M. Best 2007 Aggregates & Averages; Insurance Information Institute
Cost of Risk vs. Commercial Lines Combined Ratio
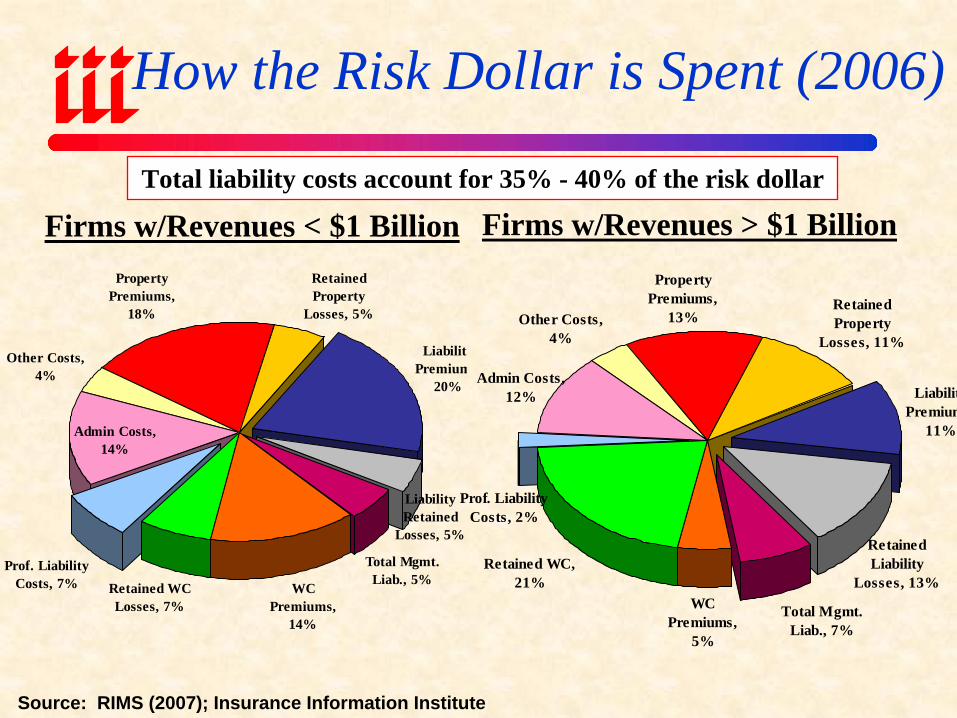
How the Risk Dollar is Spent (2006)
Source: RIMS (2007); Insurance Information Institute
Firms w/Revenues < $1 Billion
Prof. Liability Costs, 7%
Other Costs, 4%
Property Premiums,
18%
Retained Property
Losses, 5%
LiabilityPremium
20%
Admin Costs, 14%
WC Premiums,
14%
Liability Retained
Losses, 5%
Total Mgmt. Liab., 5%Retained WC
Losses, 7%
Firms w/Revenues > $1 Billion
Retained WC, 21%
Other Costs, 4%
Property Premiums,
13%Retained Property
Losses, 11%
LiabilitPremium
11%
Total Mgmt. Liab., 7%
WC Premiums,
5%
Retained Liability
Losses, 13%
Admin Costs, 12%
Prof. Liability Costs, 2%
Total liability costs account for 35% - 40% of the risk dollar
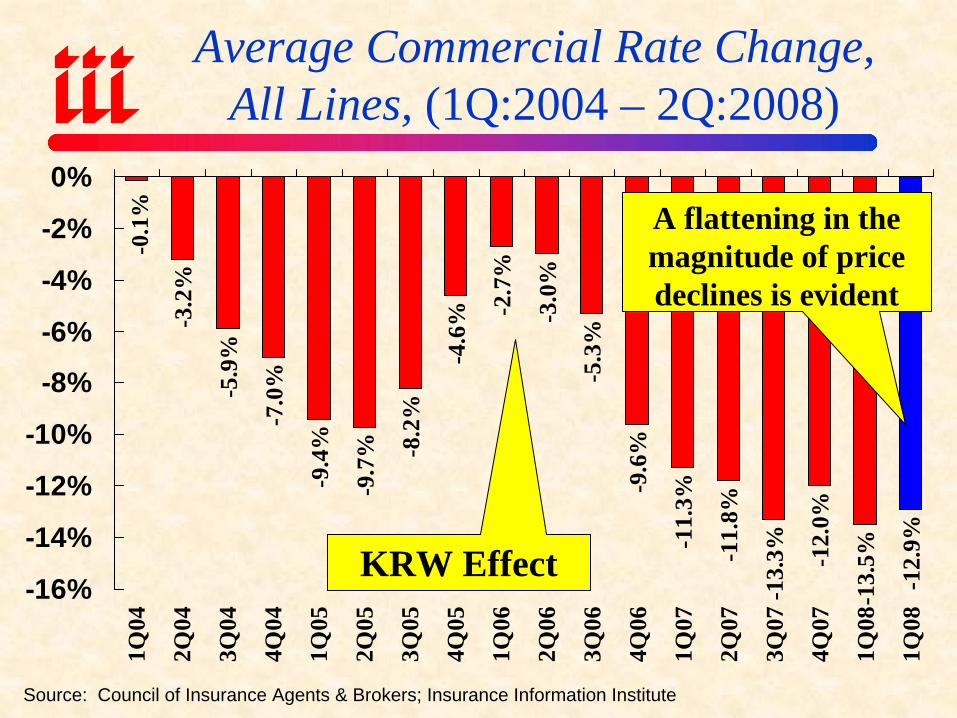
Average Commercial Rate Change,All Lines, (1Q:2004 – 2Q:2008)
-3.2
%
-5.9
%
-7.0
%
-9.4
%
-9.7
% -8.2
%
-4.6
% -2.7
%
-3.0
%
-5.3
%
-9.6
%
-11.
3%
-11.
8%
-13.
3% -12.
0%
-13.
5%
-12.
9%
-16%
-14%
-12%
-10%
-8%
-6%
-4%
-2%
0%1Q
04
2Q04
3Q04
4Q04
1Q05
2Q05
3Q05
4Q05
1Q06
2Q06
3Q06
4Q06
1Q07
2Q07
3Q07
4Q07
1Q08
1Q08
Source: Council of Insurance Agents & Brokers; Insurance Information Institute
KRW Effect
-0.1
% A flattening in the magnitude of price declines is evident
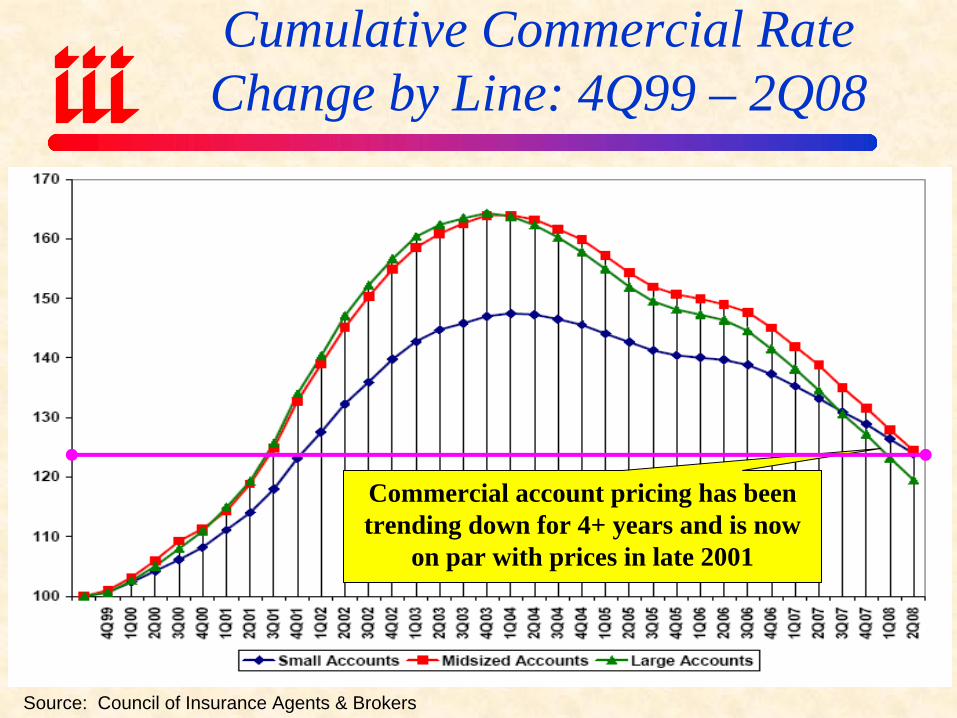
Cumulative Commercial Rate Change by Line: 4Q99 – 2Q08
Source: Council of Insurance Agents & Brokers
Commercial account pricing has been trending down for 4+ years and is now
on par with prices in late 2001
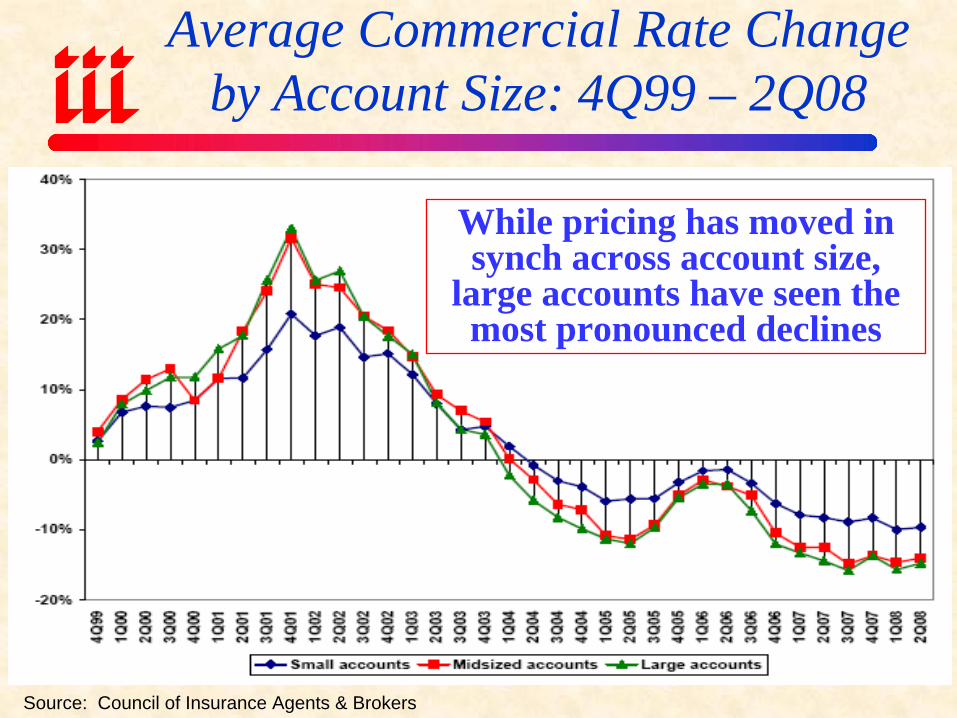
Average Commercial Rate Changeby Account Size: 4Q99 – 2Q08
Source: Council of Insurance Agents & Brokers
While pricing has moved in synch across account size,
large accounts have seen the most pronounced declines
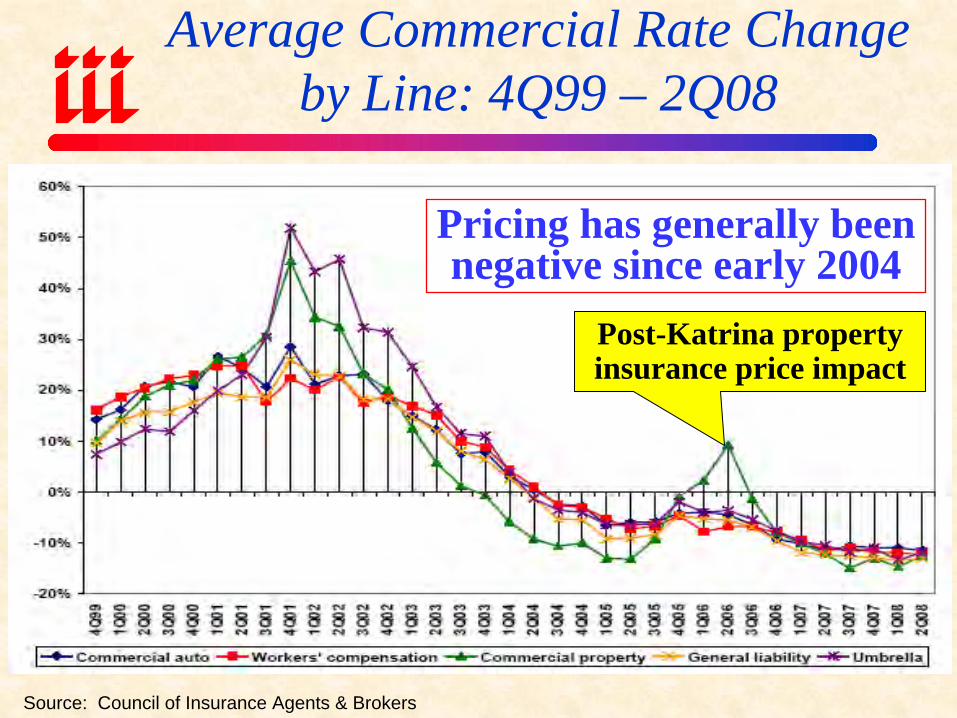
Average Commercial Rate Changeby Line: 4Q99 – 2Q08
Source: Council of Insurance Agents & Brokers
Pricing has generally been negative since early 2004
Post-Katrina property insurance price impact
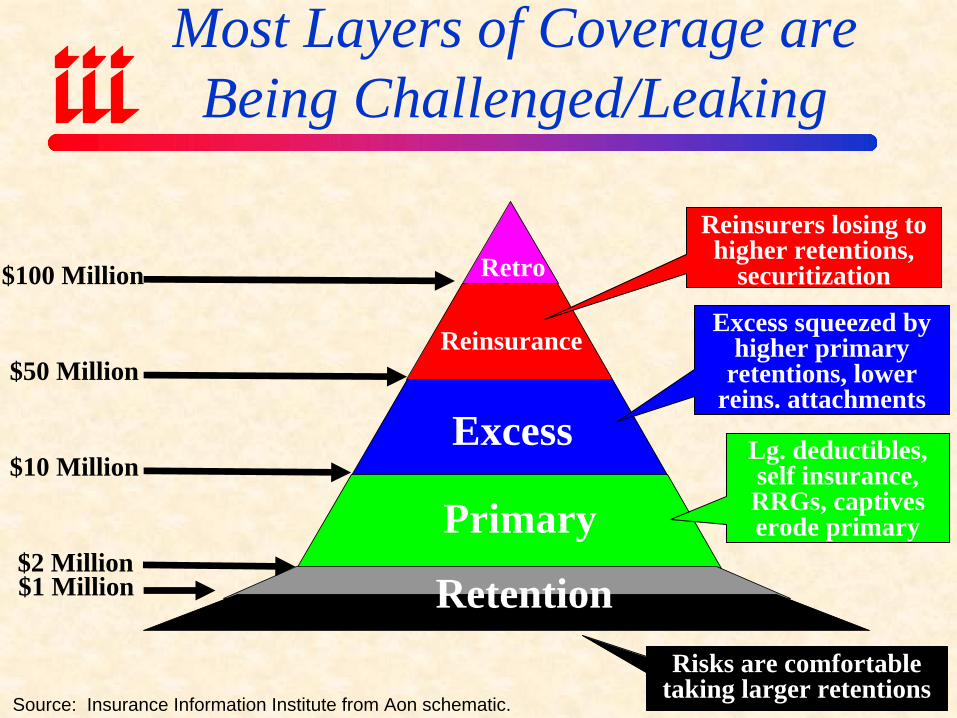
Most Layers of Coverage are Being Challenged/Leaking
Retention$1 Million$2 Million
Primary
Excess
Reinsurance
Retro
$10 Million
$50 Million
$100 Million
Risks are comfortable taking larger retentions
Lg. deductibles, self insurance, RRGs, captives erode primary
Excess squeezed by higher primary
retentions, lower reins. attachments
Reinsurers losing to higher retentions,
securitization
Source: Insurance Information Institute from Aon schematic.
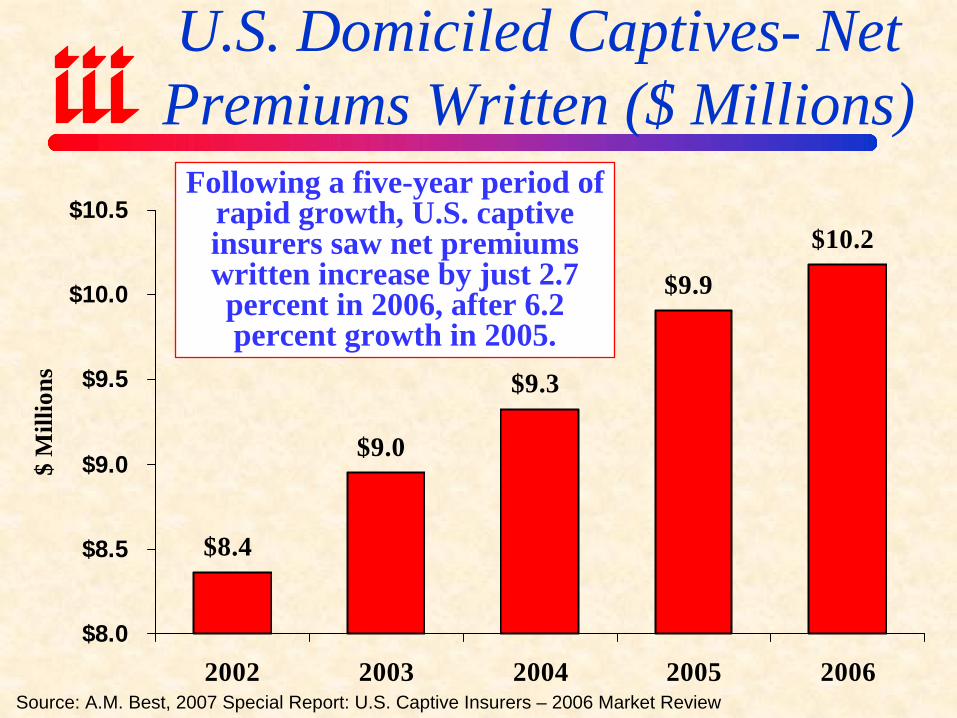
U.S. Domiciled Captives- Net Premiums Written ($ Millions)
$8.4
$9.0
$9.3
$9.9
$10.2
$8.0
$8.5
$9.0
$9.5
$10.0
$10.5
2002 2003 2004 2005 2006
$ M
illio
ns
Source: A.M. Best, 2007 Special Report: U.S. Captive Insurers – 2006 Market Review
Following a five-year period of rapid growth, U.S. captive insurers saw net premiums written increase by just 2.7 percent in 2006, after 6.2 percent growth in 2005.
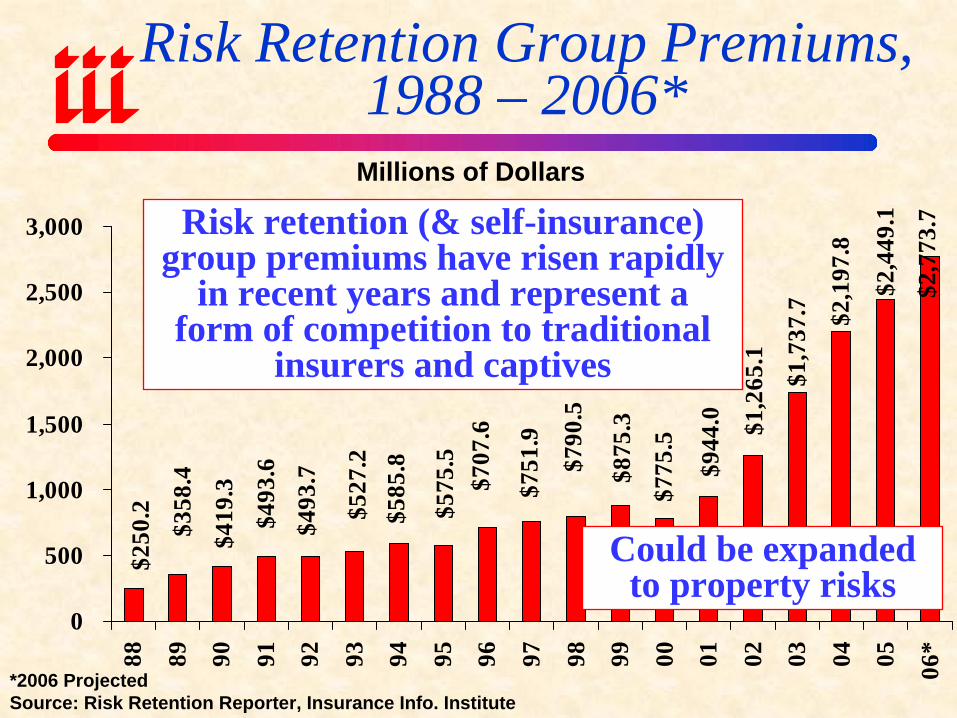
Risk Retention Group Premiums,1988 – 2006*
$1,7
37.7 $2
,197
.8
$2,4
49.1
$2,7
73.7
$585
.8$5
27.2
$493
.7$4
93.6
$419
.3
$358
.4
$250
.2 $575
.5$7
07.6
$751
.9
$790
.5
$875
.3
$775
.5
$944
.0 $1,2
65.1
0
500
1,000
1,500
2,000
2,500
3,000
88 89 90 91 92 93 94 95 96 97 98 99 00 01 02 03 04 05 06*
*2006 ProjectedSource: Risk Retention Reporter, Insurance Info. Institute
Millions of Dollars
Risk retention (& self-insurance) group premiums have risen rapidly
in recent years and represent a form of competition to traditional
insurers and captives
Could be expanded to property risks
RISING EXPENSES
Expense Ratios Will Rise as Premium Growth Slows
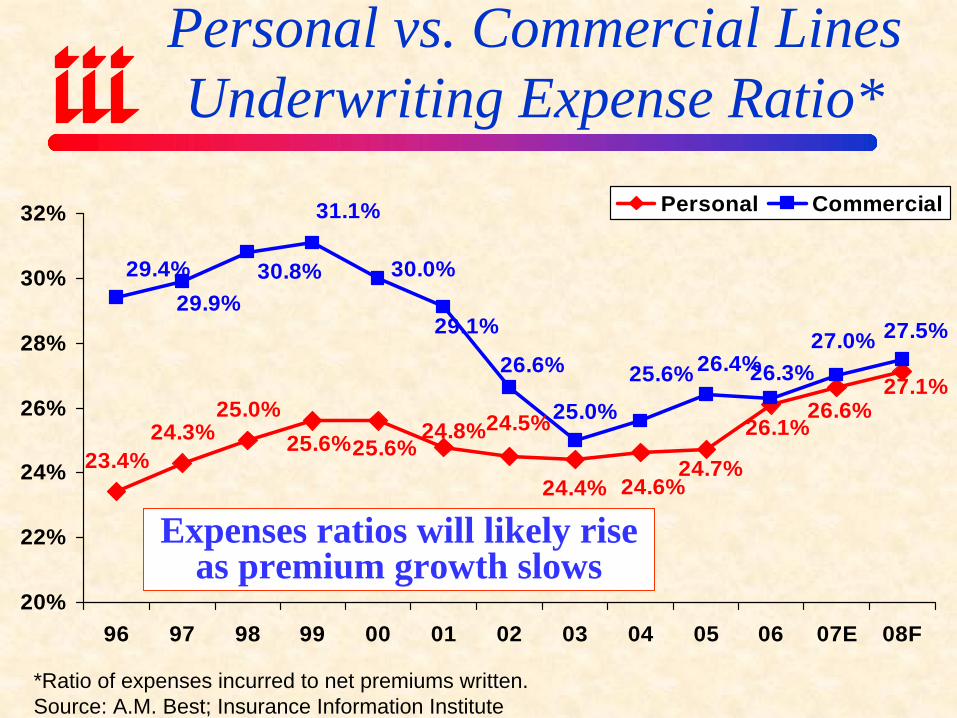
Personal vs. Commercial Lines Underwriting Expense Ratio*
23.4%24.3%
25.0%27.1%
24.4%
24.5%24.8%25.6%
24.6%
25.6%24.7%
26.1%26.6%
27.5%
30.8%
27.0%26.3%26.4%25.6%
30.0%
31.1%
29.4%29.9%
29.1%
26.6%
25.0%
20%
22%
24%
26%
28%
30%
32%
96 97 98 99 00 01 02 03 04 05 06 07E 08F
Personal Commercial
*Ratio of expenses incurred to net premiums written.Source: A.M. Best; Insurance Information Institute
Expenses ratios will likely rise as premium growth slows
CAPACITY/SURPLUS
Accumulation of Capital/ Surplus Depresses ROEs
$0
$50
$100
$150
$200
$250
$300
$350
$400
$450
$500
$550
75 76 77 78 79 80 81 82 83 84 85 86 87 88 89 90 91 92 93 94 95 96 97 98 99 00 01 02 03 04 05 06 07 08
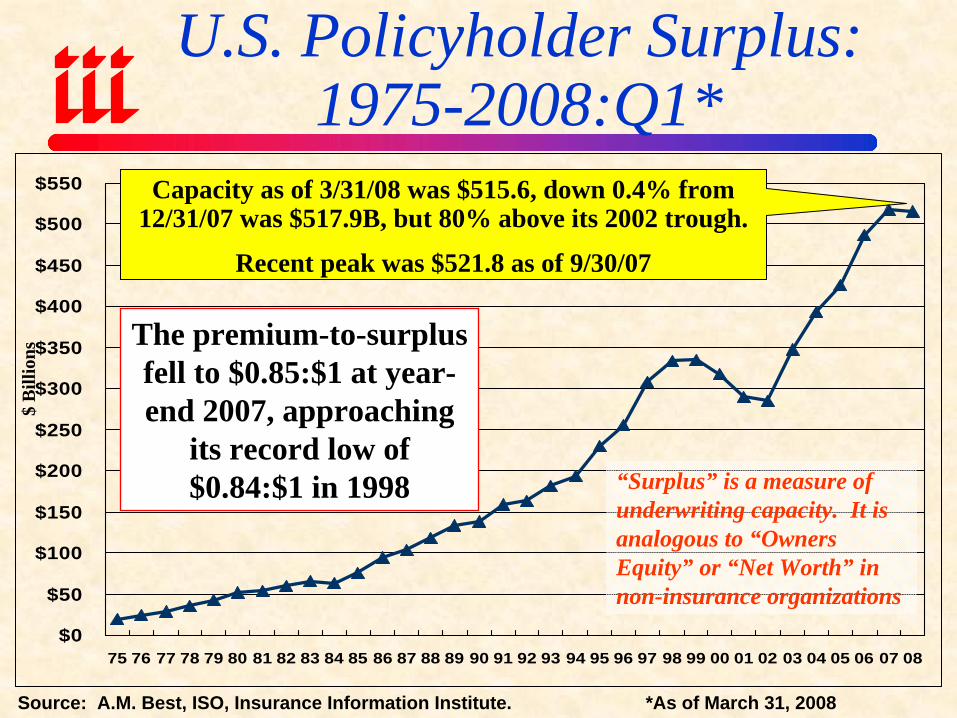
U.S. Policyholder Surplus: 1975-2008:Q1*
Source: A.M. Best, ISO, Insurance Information Institute. *As of March 31, 2008
$ B
illio
ns
“Surplus” is a measure of underwriting capacity. It is analogous to “Owners Equity” or “Net Worth” in non-insurance organizations
Capacity as of 3/31/08 was $515.6, down 0.4% from 12/31/07 was $517.9B, but 80% above its 2002 trough.
Recent peak was $521.8 as of 9/30/07
The premium-to-surplus fell to $0.85:$1 at year-end 2007, approaching
its record low of $0.84:$1 in 1998
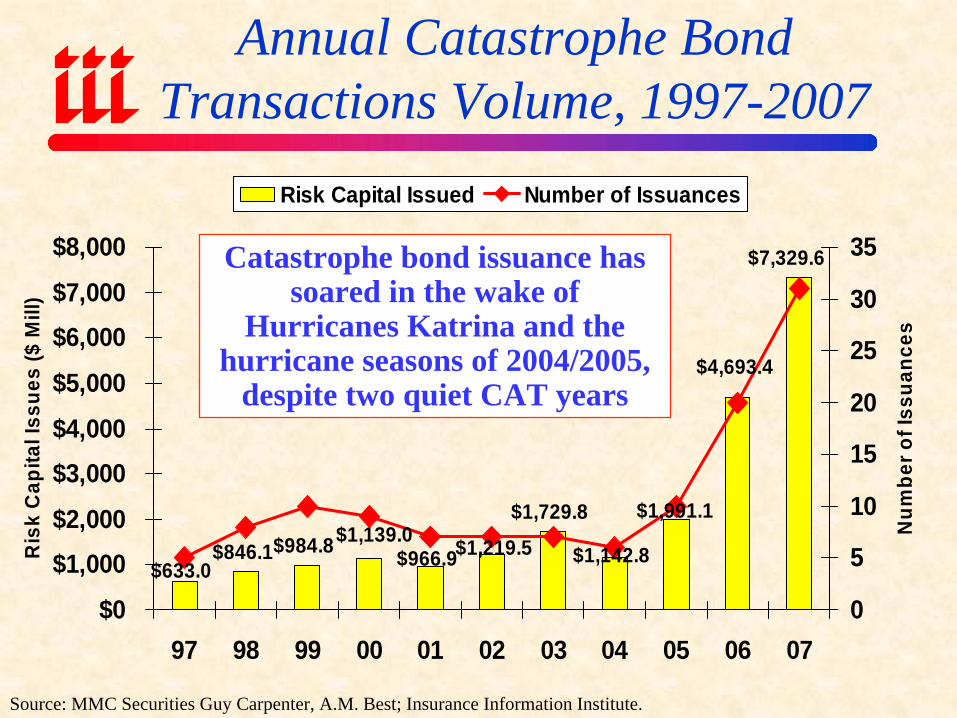
Annual Catastrophe Bond Transactions Volume, 1997-2007
$1,729.8
$966.9
$7,329.6
$4,693.4
$1,991.1
$1,142.8$1,219.5$846.1$984.8$1,139.0
$633.0
$0
$1,000$2,000
$3,000$4,000
$5,000
$6,000$7,000
$8,000
97 98 99 00 01 02 03 04 05 06 07
Ris
k C
apita
l Iss
ues
($ M
ill)
0
5
10
15
20
25
30
35
Num
ber o
f Iss
uanc
es
Risk Capital Issued Number of Issuances
Source: MMC Securities Guy Carpenter, A.M. Best; Insurance Information Institute.
Catastrophe bond issuance has soared in the wake of
Hurricanes Katrina and the hurricane seasons of 2004/2005,
despite two quiet CAT years
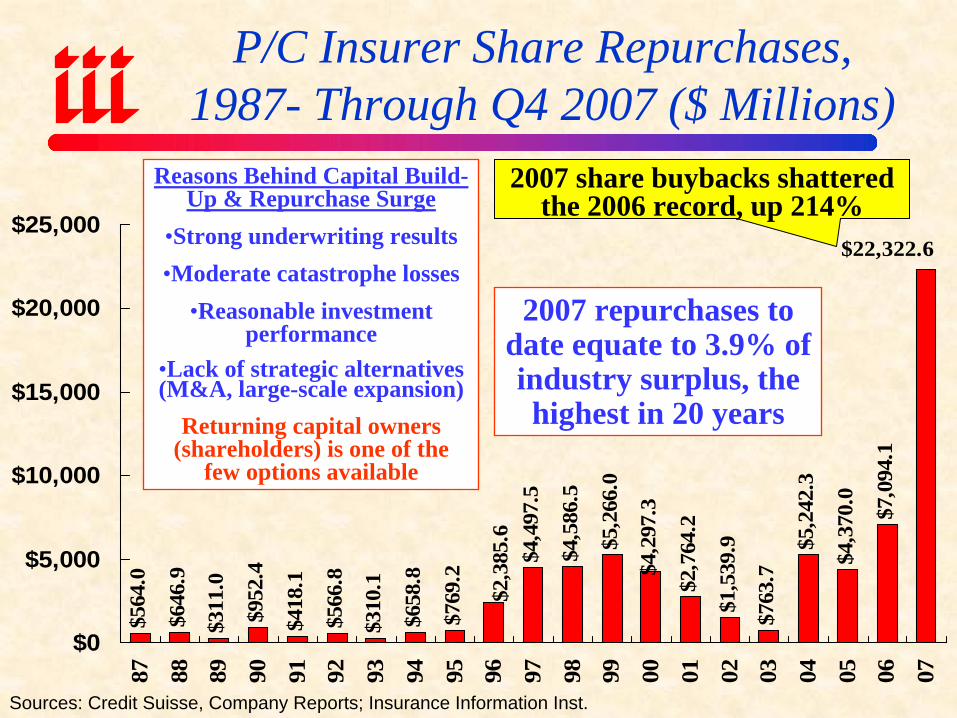
P/C Insurer Share Repurchases,1987- Through Q4 2007 ($ Millions)
$564
.0
$646
.9
$311
.0
$952
.4
$418
.1
$566
.8
$310
.1
$658
.8
$769
.2
$4,5
86.5
$5,2
66.0
$763
.7
$5,2
42.3
$4,3
70.0
$7,0
94.1
$22,322.6
$4,4
97.5
$1,5
39.9
$2,7
64.2
$2,3
85.6
$4,2
97.3
$0
$5,000
$10,000
$15,000
$20,000
$25,000
87 88 89 90 91 92 93 94 95 96 97 98 99 00 01 02 03 04 05 06 07
Sources: Credit Suisse, Company Reports; Insurance Information Inst.
2007 share buybacks shattered the 2006 record, up 214%
Reasons Behind Capital Build-Up & Repurchase Surge
•Strong underwriting results•Moderate catastrophe losses
•Reasonable investment performance
•Lack of strategic alternatives (M&A, large-scale expansion)
Returning capital owners (shareholders) is one of the
few options available
2007 repurchases to date equate to 3.9% of industry surplus, the highest in 20 years

MERGER & ACQUISITION
Are Catalysts for P/C Consolidation Growing
in 2008?
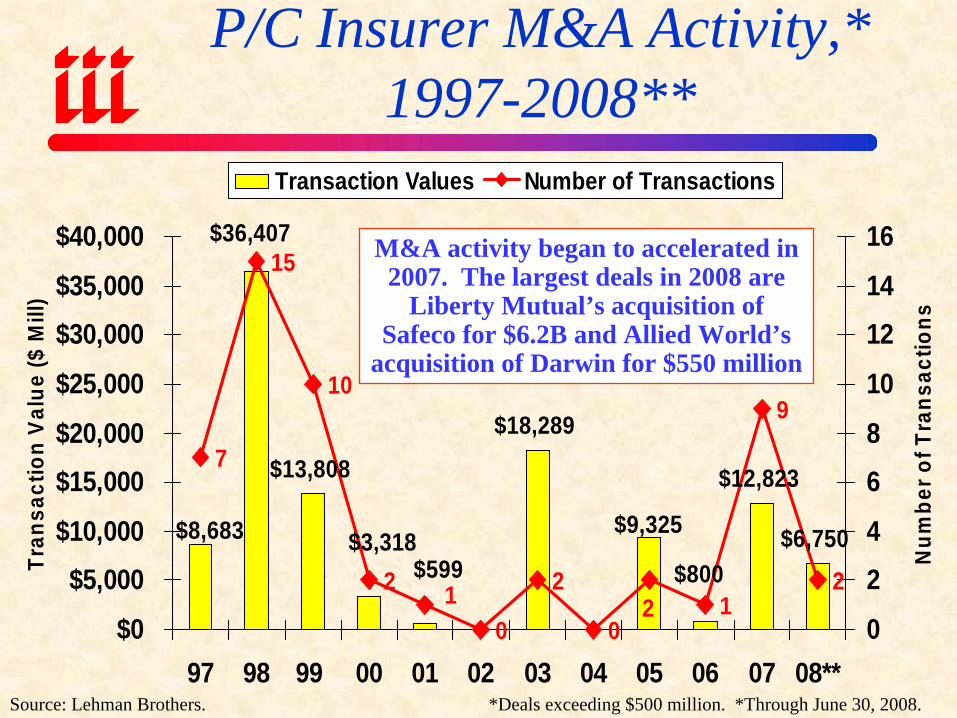
P/C Insurer M&A Activity,* 1997-2008**
$18,289
$6,750$599
$12,823
$800
$9,325
$36,407
$13,808
$3,318$8,683
7
15
10
2
0
2
01
9
21 2$0
$5,000$10,000
$15,000$20,000
$25,000
$30,000$35,000
$40,000
97 98 99 00 01 02 03 04 05 06 07 08**
Tran
sact
ion
Valu
e ($
Mill
)
0
24
68
10
1214
16
Num
ber o
f Tra
nsac
tions
Transaction Values Number of Transactions
Source: Lehman Brothers. *Deals exceeding $500 million. *Through June 30, 2008.
M&A activity began to accelerated in 2007. The largest deals in 2008 are
Liberty Mutual’s acquisition of Safeco for $6.2B and Allied World’s
acquisition of Darwin for $550 million
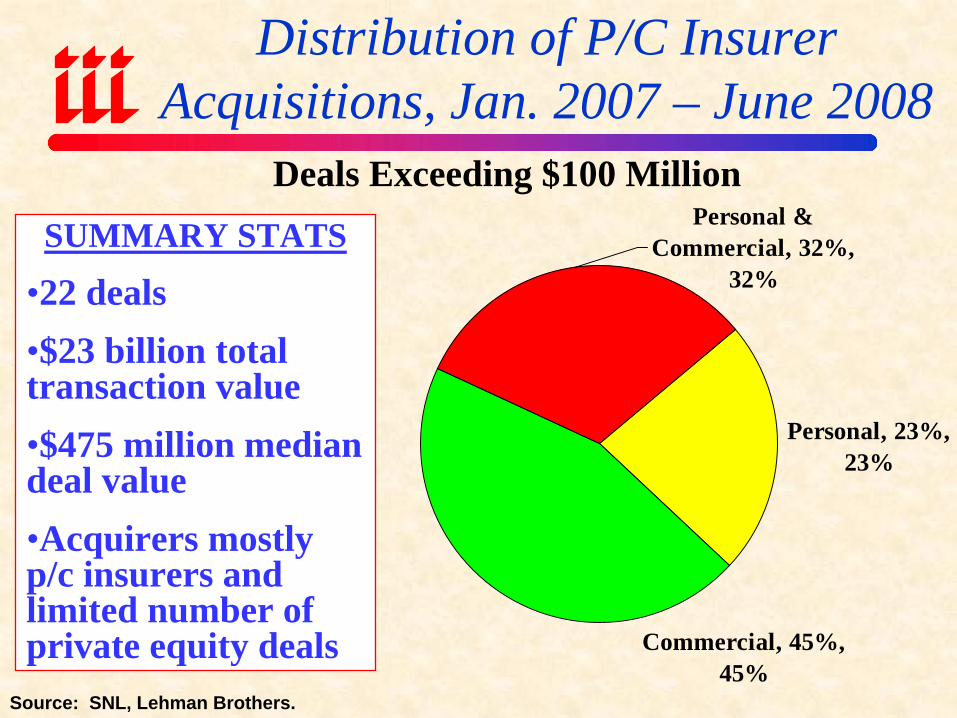
Distribution of P/C Insurer Acquisitions, Jan. 2007 – June 2008
Personal, 23%, 23%
Commercial, 45%, 45%
Personal & Commercial, 32%,
32%SUMMARY STATS
•22 deals•$23 billion total transaction value•$475 million median deal value•Acquirers mostly p/c insurers and limited number of private equity deals
Source: SNL, Lehman Brothers.
Deals Exceeding $100 Million
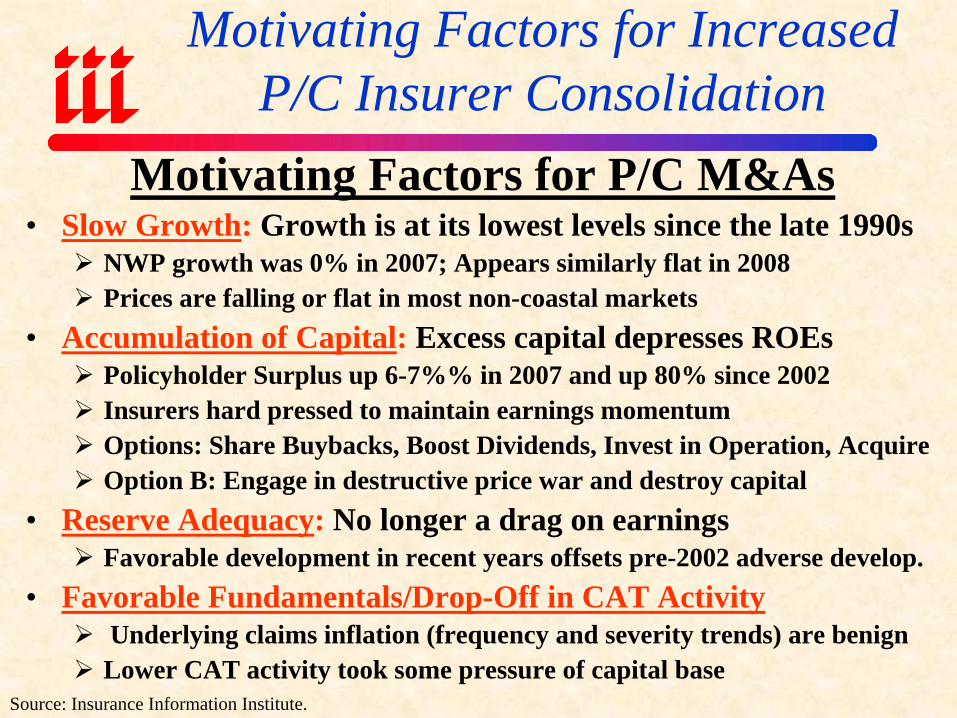
Motivating Factors for Increased P/C Insurer Consolidation
Motivating Factors for P/C M&As• Slow Growth: Growth is at its lowest levels since the late 1990s
NWP growth was 0% in 2007; Appears similarly flat in 2008Prices are falling or flat in most non-coastal markets
• Accumulation of Capital: Excess capital depresses ROEsPolicyholder Surplus up 6-7%% in 2007 and up 80% since 2002Insurers hard pressed to maintain earnings momentum Options: Share Buybacks, Boost Dividends, Invest in Operation, AcquireOption B: Engage in destructive price war and destroy capital
• Reserve Adequacy: No longer a drag on earningsFavorable development in recent years offsets pre-2002 adverse develop.
• Favorable Fundamentals/Drop-Off in CAT ActivityUnderlying claims inflation (frequency and severity trends) are benign
Lower CAT activity took some pressure of capital baseSource: Insurance Information Institute.
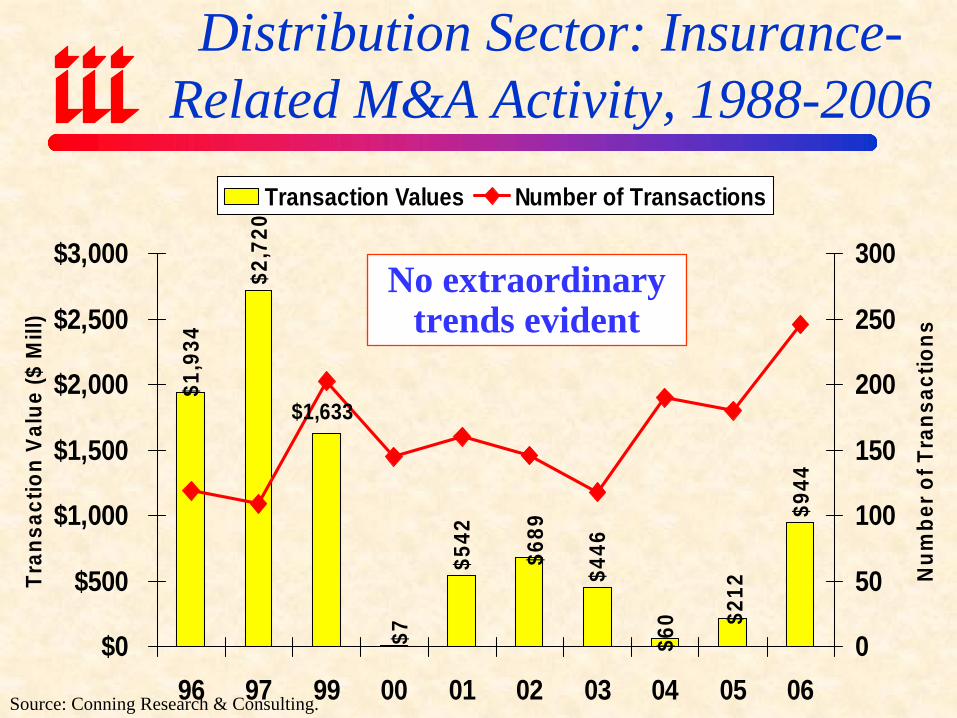
Distribution Sector: Insurance-Related M&A Activity, 1988-2006
$542
$446
$1,9
34
$7$1,633
$2,7
20
$689
$60 $2
12
$944
$0
$500
$1,000
$1,500
$2,000
$2,500
$3,000
96 97 99 00 01 02 03 04 05 06
Tran
sact
ion
Valu
e ($
Mill
)
0
50
100
150
200
250
300
Num
ber o
f Tra
nsac
tions
Transaction Values Number of Transactions
Source: Conning Research & Consulting.
No extraordinary trends evident
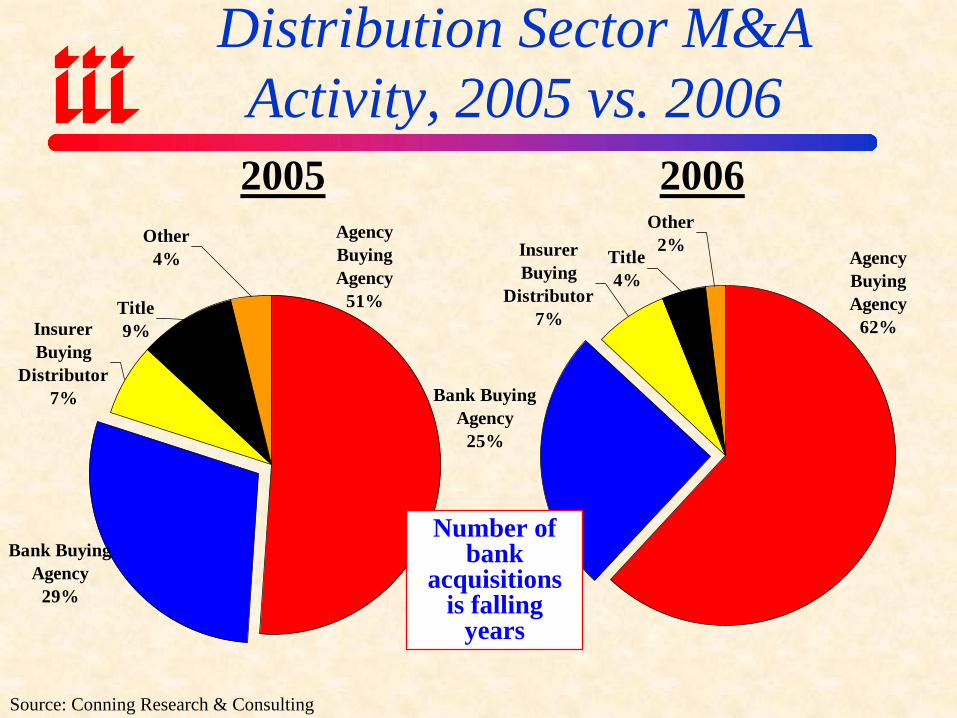
Distribution Sector M&A Activity, 2005 vs. 2006
Source: Conning Research & Consulting
Title9%Insurer
Buying Distributor
7%
Agency Buying Agency
51%
Other4%
Bank Buying Agency
29%
2005 2006
Title4%
Insurer Buying
Distributor7%
Agency Buying Agency
62%
Other2%
Bank Buying Agency
25%
Number of bank
acquisitions is falling
years

INVESTMENT OVERVIEW
More Pain, Little Gain
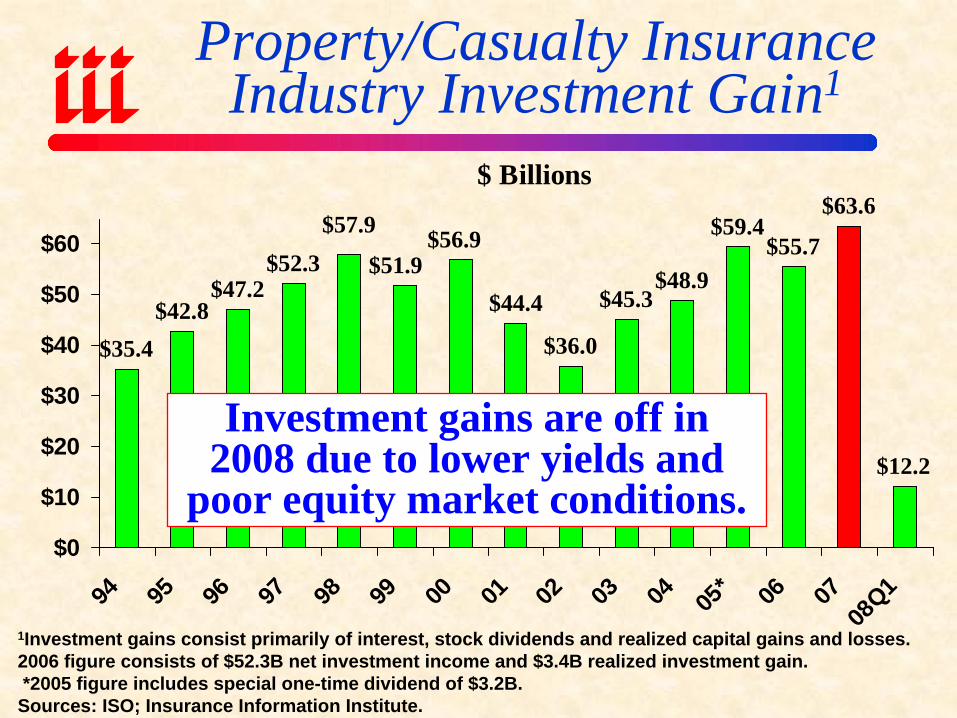
Property/Casualty Insurance Industry Investment Gain1
$ Billions
$35.4$42.8
$47.2$52.3
$44.4
$36.0
$45.3$48.9
$59.4$55.7
$63.6
$12.2
$56.9$51.9
$57.9
$0
$10
$20
$30
$40
$50
$60
94 95 96 97 98 99 00 01 02 03 04 05* 06 07
08Q1
1Investment gains consist primarily of interest, stock dividends and realized capital gains and losses. 2006 figure consists of $52.3B net investment income and $3.4B realized investment gain.*2005 figure includes special one-time dividend of $3.2B.
Sources: ISO; Insurance Information Institute.
Investment gains are off in 2008 due to lower yields and
poor equity market conditions.
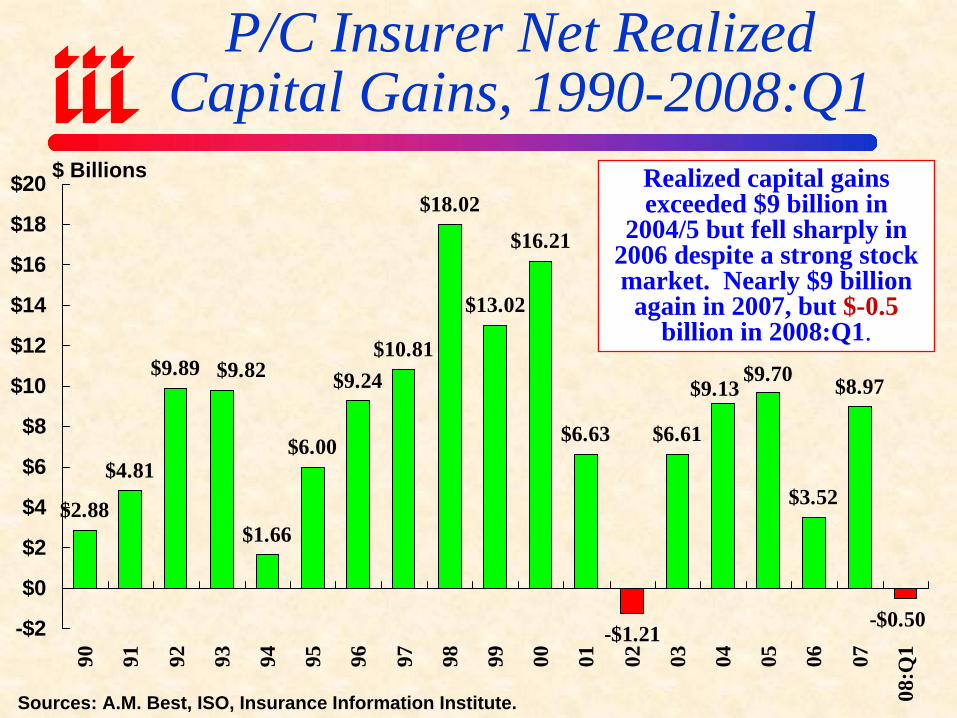
P/C Insurer Net Realized Capital Gains, 1990-2008:Q1
$2.88
$4.81
$9.89
$1.66
$6.00
$9.24$10.81
$13.02
$16.21
$6.63
-$1.21
$6.61
$8.97
-$0.50
$18.02
$3.52
$9.70$9.13
$9.82
-$2
$0
$2
$4
$6
$8
$10
$12
$14
$16
$18
$20
90 91 92 93 94 95 96 97 98 99 00 01 02 03 04 05 06 07
08:Q
1
Sources: A.M. Best, ISO, Insurance Information Institute.
Realized capital gains exceeded $9 billion in
2004/5 but fell sharply in 2006 despite a strong stock market. Nearly $9 billion
again in 2007, but $-0.5billion in 2008:Q1.
$ Billions
-30%
-20%
-10%
0%
10%
20%
30%
40%
1970
1971
1972
1973
1974
1975
1976
1977
1978
1979
1980
1981
1982
1983
1984
1985
1986
1987
1988
1989
1990
1991
1992
1993
1994
1995
1996
1997
1998
1999
2000
2001
2002
2003
2004
2005
2006
2007
2008
*
Source: Ibbotson Associates, Insurance Information Institute. *Through September 19, 2008.
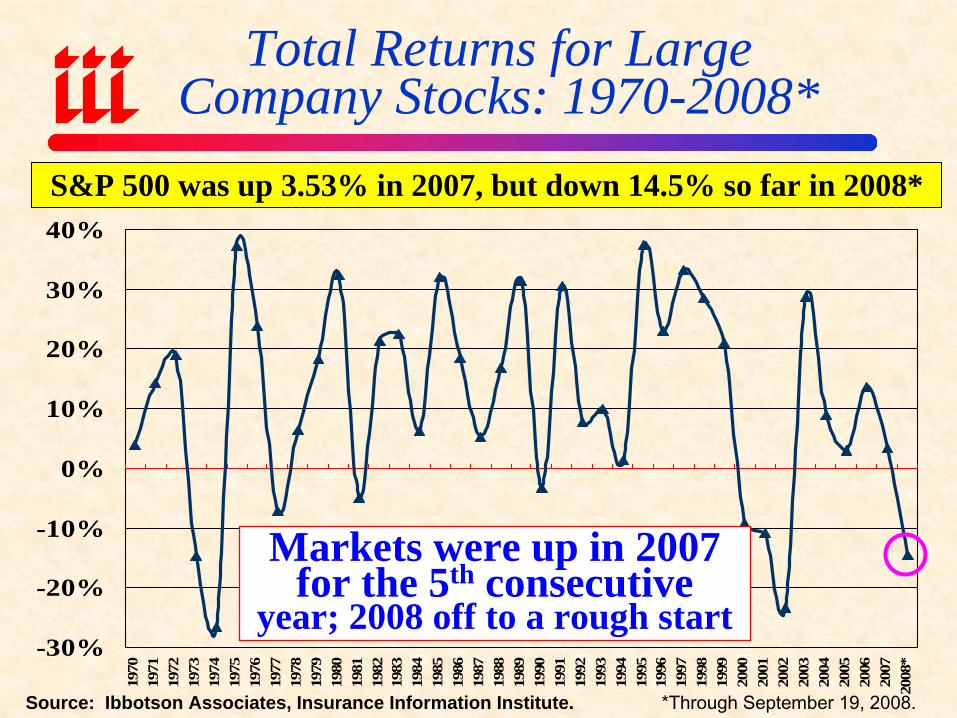
Total Returns for Large Company Stocks: 1970-2008*
S&P 500 was up 3.53% in 2007, but down 14.5% so far in 2008*
Markets were up in 2007 for the 5th consecutive
year; 2008 off to a rough start
2%
3%
4%
5%
6%
7%
8%
9%
90 91 92 93 94 95 96 97 98 99 00 01 02 03 04 05 06 07 08*
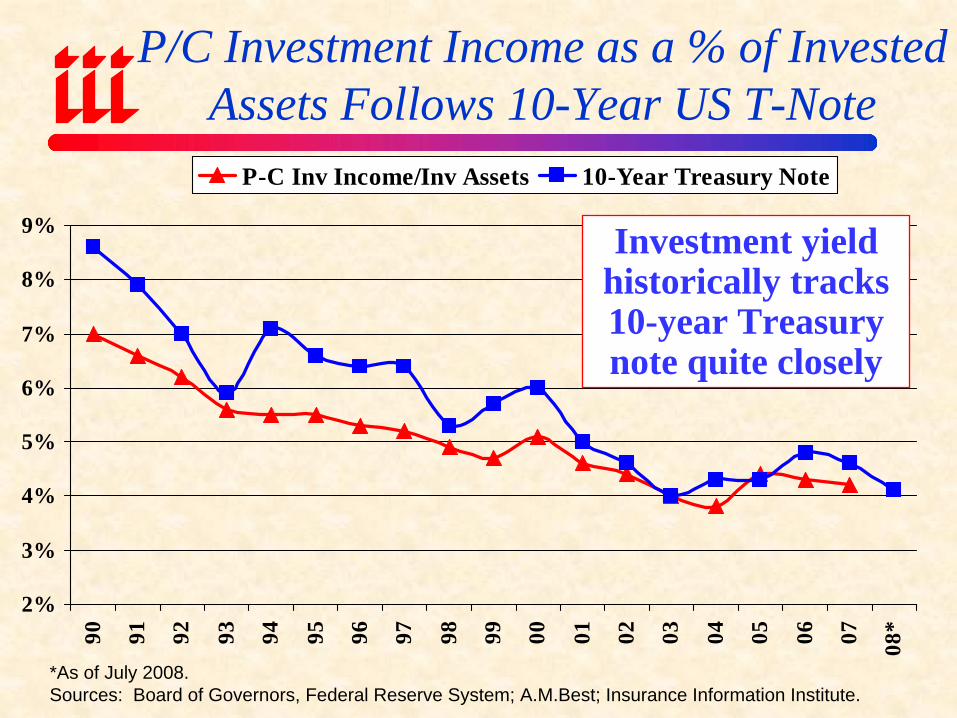
P-C Inv Income/Inv Assets 10-Year Treasury Note
P/C Investment Income as a % of Invested Assets Follows 10-Year US T-Note
*As of July 2008.Sources: Board of Governors, Federal Reserve System; A.M.Best; Insurance Information Institute.
Investment yield historically tracks 10-year Treasury note quite closely
CATASTROPHICLOSS
This is (One Reason) Why You Buy Reinsurance
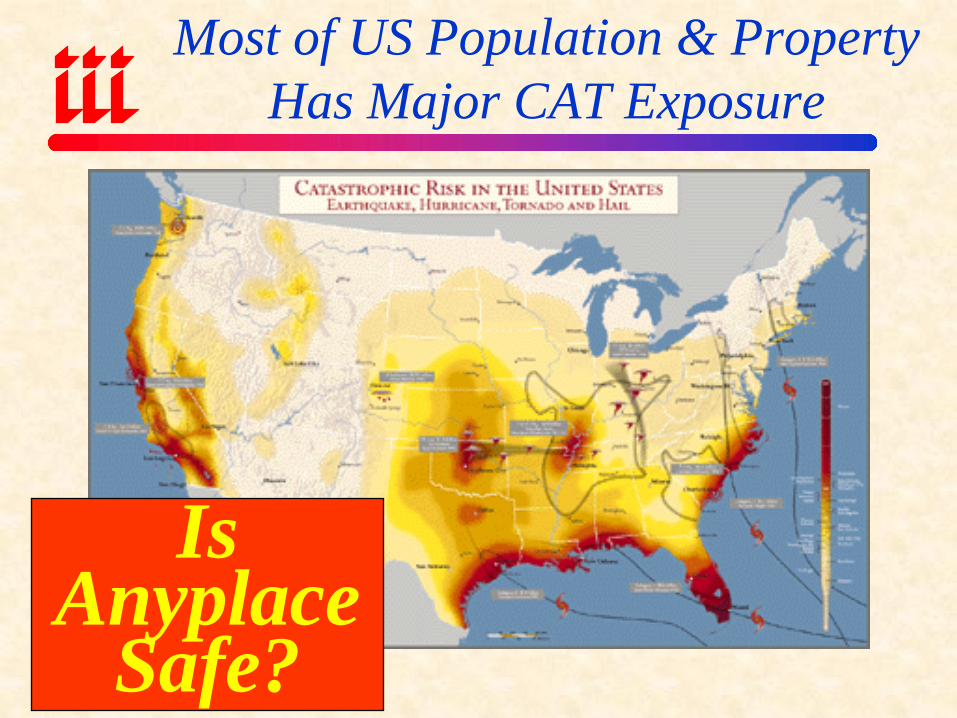
Most of US Population & Property Has Major CAT Exposure
Is Anyplace
Safe?
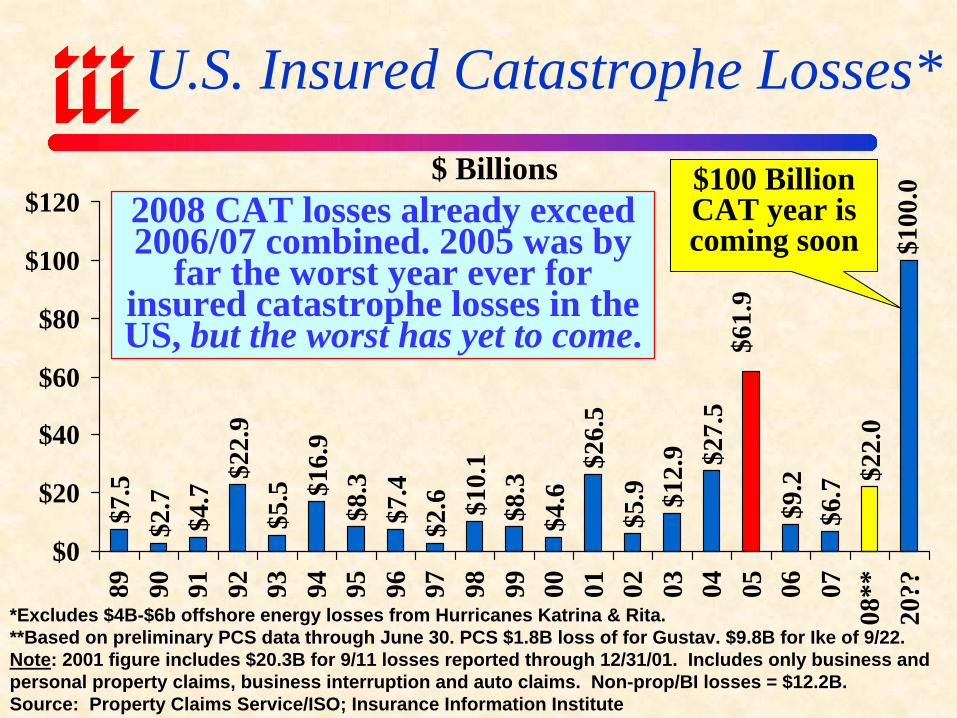
U.S. Insured Catastrophe Losses*$7
.5$2
.7$4
.7$2
2.9
$5.5 $1
6.9
$8.3
$7.4
$2.6 $1
0.1
$8.3
$4.6
$26.
5$5
.9 $12.
9 $27.
5
$6.7 $2
2.0
$100
.0
$61.
9
$9.2
$0
$20
$40
$60
$80
$100
$120
89 90 91 92 93 94 95 96 97 98 99 00 01 02 03 04 05 06 0708
**20
??
*Excludes $4B-$6b offshore energy losses from Hurricanes Katrina & Rita.**Based on preliminary PCS data through June 30. PCS $1.8B loss of for Gustav. $9.8B for Ike of 9/22.Note: 2001 figure includes $20.3B for 9/11 losses reported through 12/31/01. Includes only business and personal property claims, business interruption and auto claims. Non-prop/BI losses = $12.2B.Source: Property Claims Service/ISO; Insurance Information Institute
$ Billions2008 CAT losses already exceed 2006/07 combined. 2005 was by
far the worst year ever for insured catastrophe losses in the US, but the worst has yet to come.
$100 Billion CAT year is coming soon
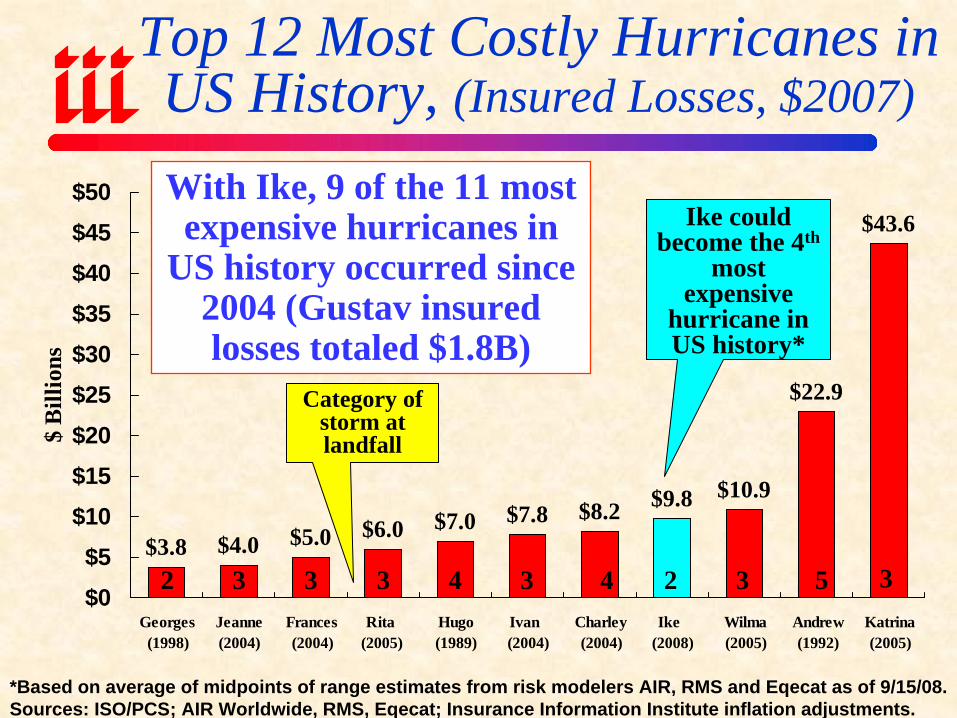
Top 12 Most Costly Hurricanes in US History, (Insured Losses, $2007)
$3.8 $4.0 $5.0 $6.0 $7.0 $7.8 $8.2 $9.8 $10.9
$22.9
$43.6
$0$5
$10$15$20$25$30$35$40$45$50
Georges(1998)
Jeanne(2004)
Frances(2004)
Rita (2005)
Hugo(1989)
Ivan (2004)
Charley(2004)
Ike (2008)
Wilma(2005)
Andrew(1992)
Katrina(2005)
$ B
illio
ns
*Based on average of midpoints of range estimates from risk modelers AIR, RMS and Eqecat as of 9/15/08.Sources: ISO/PCS; AIR Worldwide, RMS, Eqecat; Insurance Information Institute inflation adjustments.
With Ike, 9 of the 11 most expensive hurricanes in
US history occurred since 2004 (Gustav insured losses totaled $1.8B)
2 3 3 4 3 4 3 5 3
Category of storm at landfall
3 2
Ike could become the 4th
most expensive
hurricane in US history*
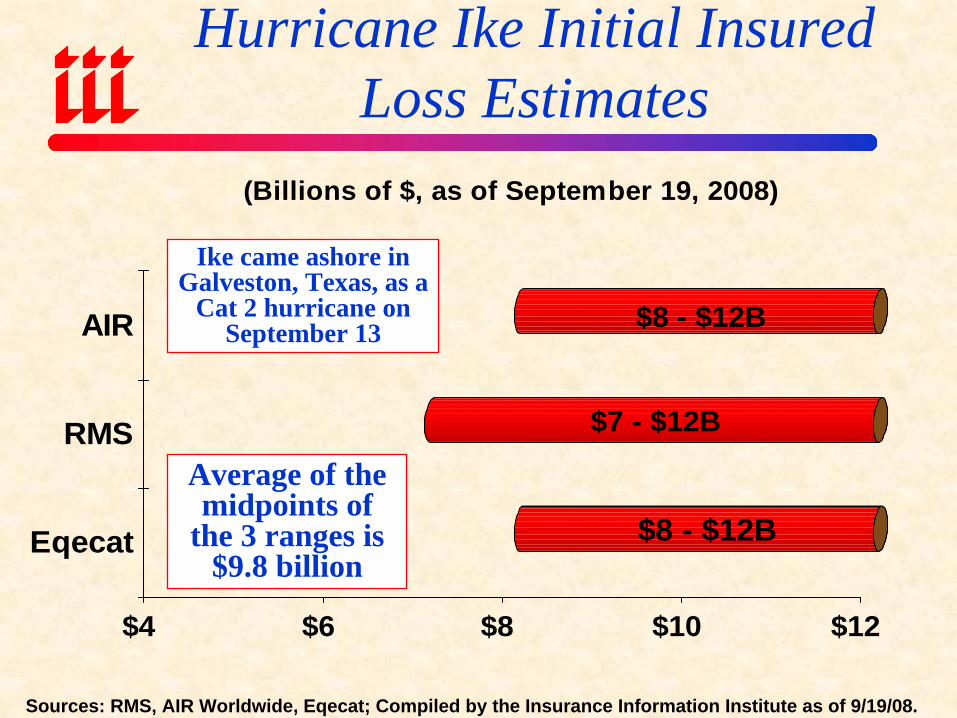
Hurricane Ike Initial Insured Loss Estimates
$8 - $12B
$7 - $12B
$8 - $12B
$4 $6 $8 $10 $12
Eqecat
RMS
AIR
(Billions of $, as of September 19, 2008)
Sources: RMS, AIR Worldwide, Eqecat; Compiled by the Insurance Information Institute as of 9/19/08.
Ike came ashore in Galveston, Texas, as a
Cat 2 hurricane on September 13
Average of the midpoints of
the 3 ranges is $9.8 billion
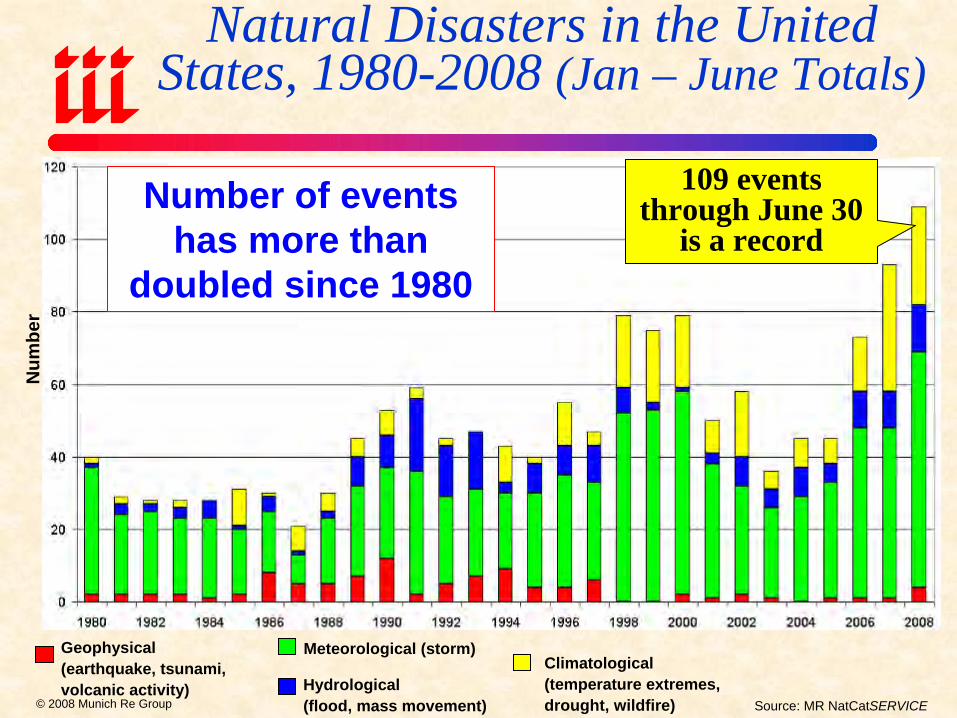
Geophysical (earthquake, tsunami, volcanic activity)
Climatological (temperature extremes, drought, wildfire)
Meteorological (storm)
Hydrological (flood, mass movement)
Num
ber
Source: MR NatCatSERVICE
Number of events has more than
doubled since 1980
© 2008 Munich Re Group
109 events through June 30
is a record
Natural Disasters in the United States, 1980-2008 (Jan – June Totals)
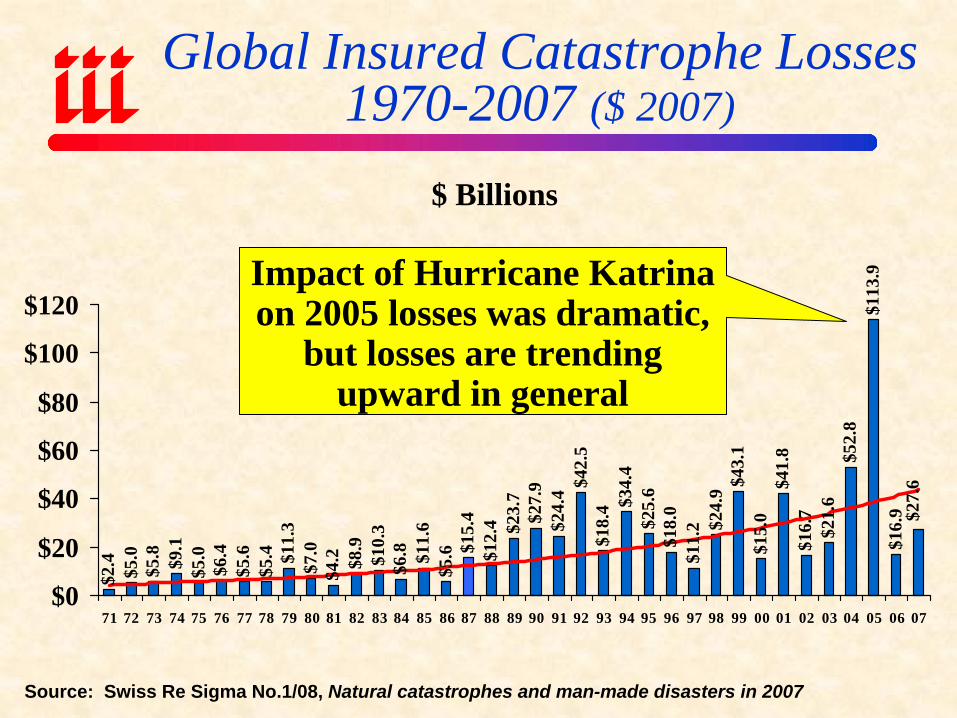
Global Insured Catastrophe Losses 1970-2007 ($ 2007)
$2.4 $5.0
$5.8 $9.1
$5.0
$6.4
$5.6
$5.4 $1
1.3
$7.0
$4.2 $8
.9$1
0.3
$6.8 $1
1.6
$5.6 $1
5.4
$12.
4 $23.
7$2
7.9
$24.
4 $42.
5$1
8.4 $3
4.4
$25.
6$1
8.0
$11.
2 $24.
9 $43.
1$1
5.0
$41.
8$1
6.7
$21.
6$5
2.8
$113
.9$1
6.9 $2
7.6
$0
$20
$40
$60
$80
$100
$120
71 72 73 74 75 76 77 78 79 80 81 82 83 84 85 86 87 88 89 90 91 92 93 94 95 96 97 98 99 00 01 02 03 04 05 06 07
Source: Swiss Re Sigma No.1/08, Natural catastrophes and man-made disasters in 2007
$ Billions
Impact of Hurricane Katrina on 2005 losses was dramatic,
but losses are trending upward in general
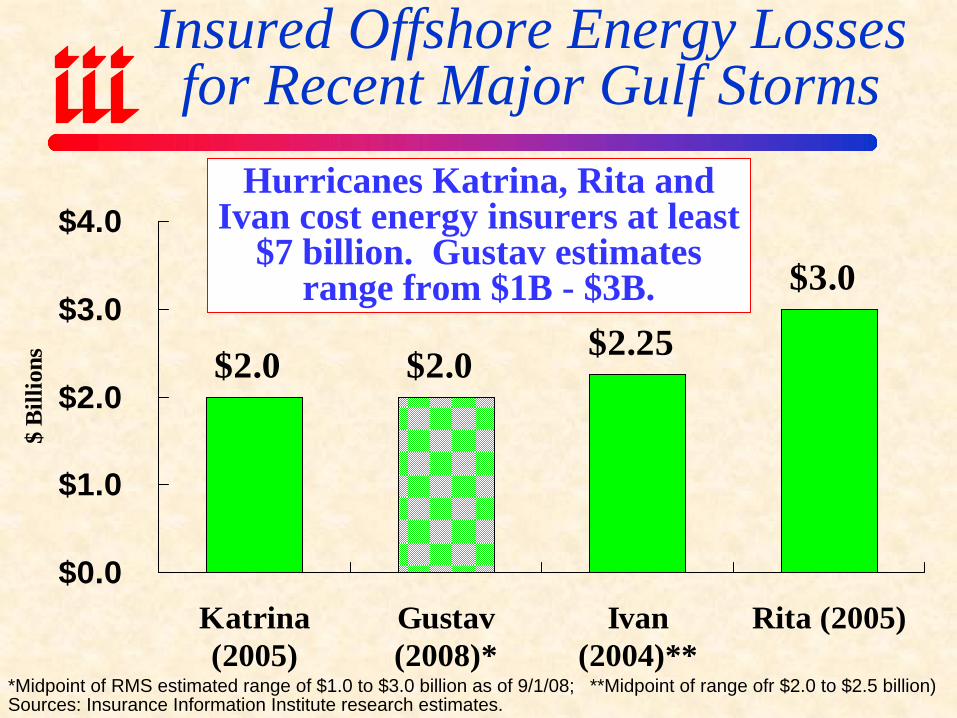
Insured Offshore Energy Losses for Recent Major Gulf Storms
$2.0 $2.0 $2.25
$3.0
$0.0
$1.0
$2.0
$3.0
$4.0
Katrina(2005)
Gustav(2008)*
Ivan(2004)**
Rita (2005)
$ B
illio
ns
Hurricanes Katrina, Rita and Ivan cost energy insurers at least
$7 billion. Gustav estimates range from $1B - $3B.
*Midpoint of RMS estimated range of $1.0 to $3.0 billion as of 9/1/08; **Midpoint of range ofr $2.0 to $2.5 billion)Sources: Insurance Information Institute research estimates.
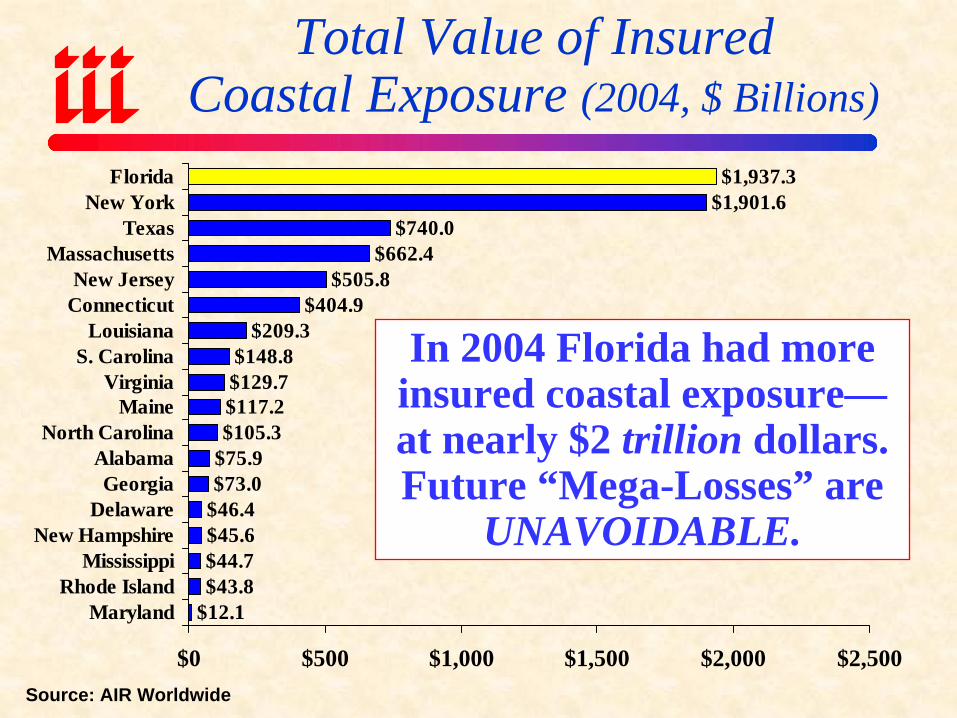
Total Value of Insured Coastal Exposure (2004, $ Billions)
$1,901.6$740.0
$662.4$505.8
$404.9$209.3
$148.8$129.7$117.2$105.3
$75.9$73.0
$46.4$45.6$44.7$43.8
$12.1
$1,937.3
$0 $500 $1,000 $1,500 $2,000 $2,500
FloridaNew York
TexasMassachusetts
New JerseyConnecticut
LouisianaS. Carolina
VirginiaMaine
North CarolinaAlabamaGeorgia
DelawareNew Hampshire
MississippiRhode Island
Maryland
Source: AIR Worldwide
In 2004 Florida had more insured coastal exposure—at nearly $2 trillion dollars. Future “Mega-Losses” are
UNAVOIDABLE.
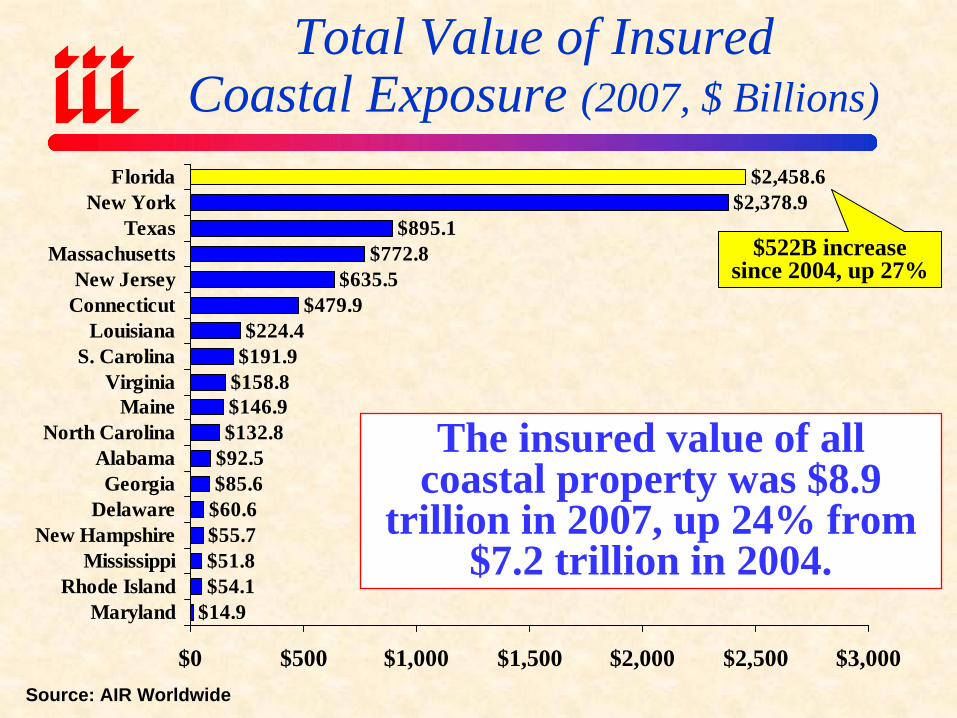
Total Value of Insured Coastal Exposure (2007, $ Billions)
$2,378.9$895.1
$772.8$635.5
$479.9$224.4
$191.9$158.8$146.9$132.8
$92.5$85.6
$60.6$55.7$51.8$54.1
$14.9
$2,458.6
$0 $500 $1,000 $1,500 $2,000 $2,500 $3,000
FloridaNew York
TexasMassachusetts
New JerseyConnecticut
LouisianaS. Carolina
VirginiaMaine
North CarolinaAlabamaGeorgia
DelawareNew Hampshire
MississippiRhode Island
Maryland
Source: AIR Worldwide
The insured value of all coastal property was $8.9
trillion in 2007, up 24% from $7.2 trillion in 2004.
$522B increase since 2004, up 27%
The 2008 Hurricane Season:
Preview to Disaster?
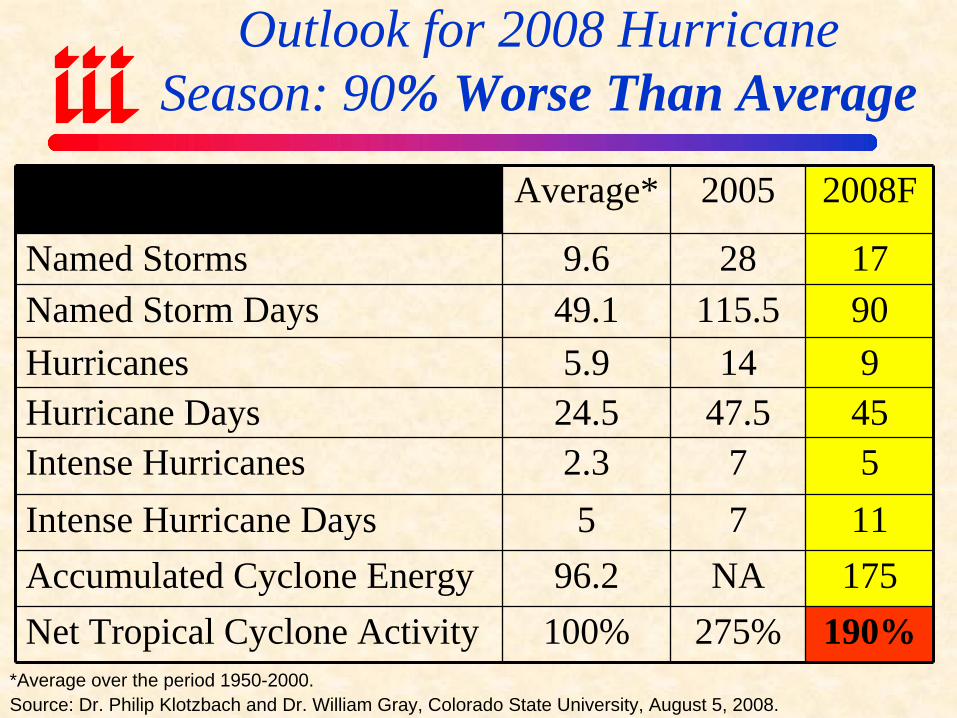
Outlook for 2008 Hurricane Season: 90% Worse Than Average
Average* 2005 2008F
Named Storms 9.6 28 17Named Storm Days 49.1 115.5 90Hurricanes 5.9 14 9Hurricane Days 24.5 47.5 45Intense Hurricanes 2.3 7 5Intense Hurricane Days 5 7 11Accumulated Cyclone Energy 96.2 NA 175Net Tropical Cyclone Activity 100% 275% 190%
*Average over the period 1950-2000.Source: Dr. Philip Klotzbach and Dr. William Gray, Colorado State University, August 5, 2008.
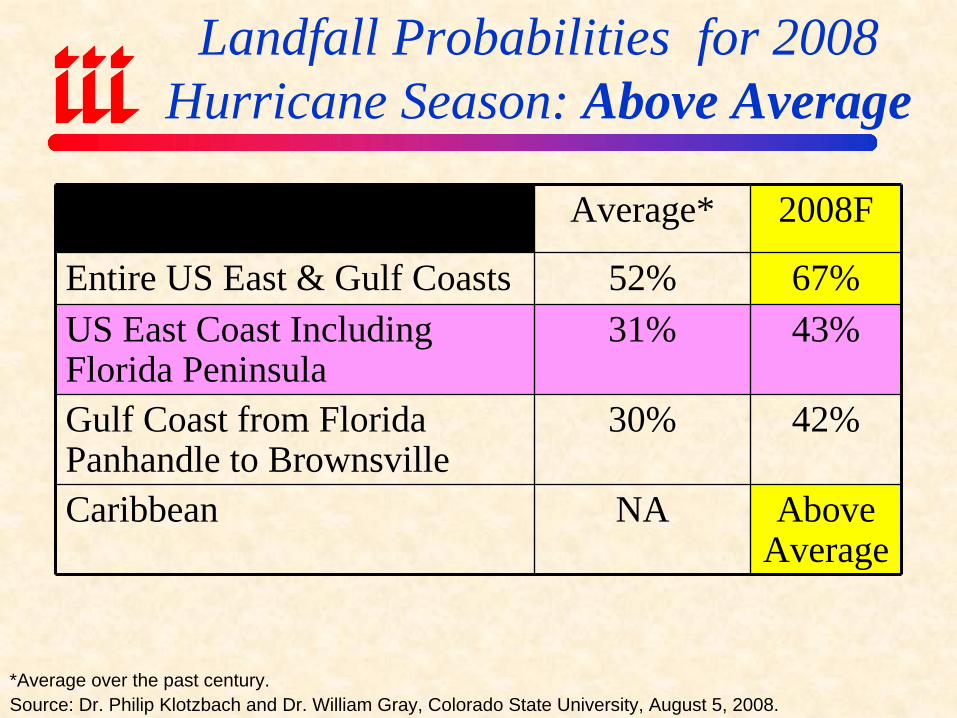
Landfall Probabilities for 2008 Hurricane Season: Above Average
Average* 2008F
Entire US East & Gulf Coasts 52% 67%US East Coast Including Florida Peninsula
31% 43%
Gulf Coast from Florida Panhandle to Brownsville
30% 42%
Caribbean NA Above Average
*Average over the past century.Source: Dr. Philip Klotzbach and Dr. William Gray, Colorado State University, August 5, 2008.
REINSURANCE MARKETS
Reinsurance Prices are Falling in Non-Coastal Zones, Casualty Lines
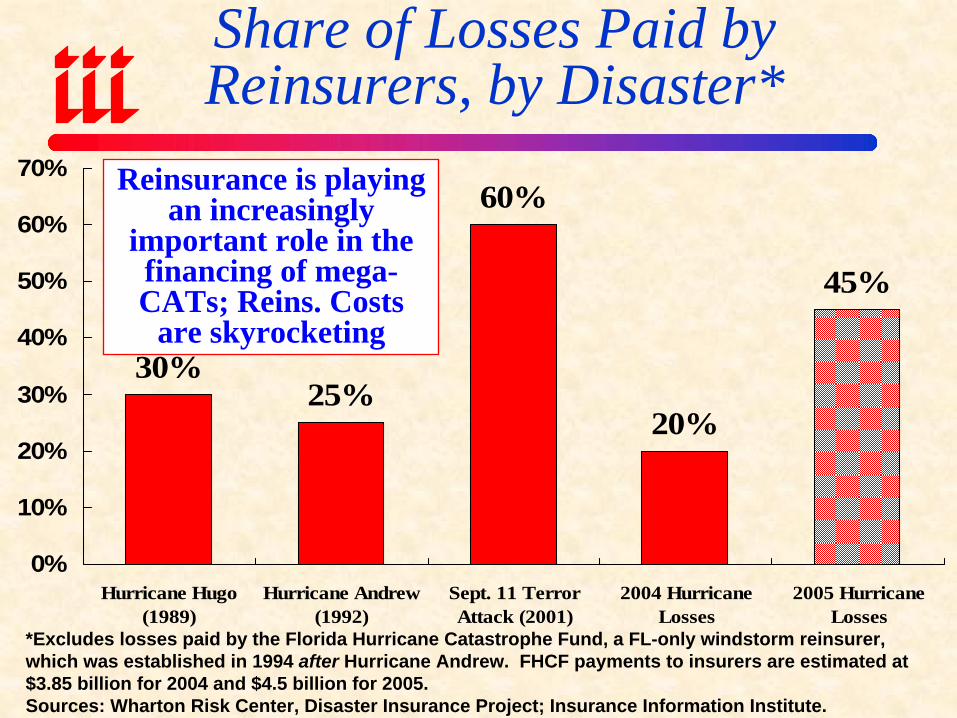
Share of Losses Paid by Reinsurers, by Disaster*
30%25%
60%
20%
45%
0%
10%
20%
30%
40%
50%
60%
70%
Hurricane Hugo(1989)
Hurricane Andrew(1992)
Sept. 11 TerrorAttack (2001)
2004 HurricaneLosses
2005 HurricaneLosses
*Excludes losses paid by the Florida Hurricane Catastrophe Fund, a FL-only windstorm reinsurer, which was established in 1994 after Hurricane Andrew. FHCF payments to insurers are estimated at $3.85 billion for 2004 and $4.5 billion for 2005.Sources: Wharton Risk Center, Disaster Insurance Project; Insurance Information Institute.
Reinsurance is playing an increasingly
important role in the financing of mega-CATs; Reins. Costs
are skyrocketing

US Reinsurer Net Income& ROE, 1985-2007*
$1.9
4
$2.0
3
$1.9
5 $3.7
1$4
.53
$5.4
3$1
.47
$1.9
9
$1.3
1 $3.1
7$3
.41
$2.5
1$9
.68
$7.9
6
($2.98)
$0.1
2
$1.9
5
$1.3
8$1
.22
$1.8
7
$1.1
7 $2.5
2$1
.79
($4)
($2)
$0
$2
$4
$6
$8
$10
$12
85 86 87 88 89 90 91 92 93 94 95 96 97 98 99 00 01 02 03 04 05 06 07*
Net
Inco
me
($ B
ill)
-10%
-5%
0%
5%
10%
15%
20%
RO
E
Net Income ROE
Source: Reinsurance Association of America. *2007 ROE figure is III estimate based return on average 2007 surplus.
Reinsurer profitability rebounded post-Katrina
but is now falling
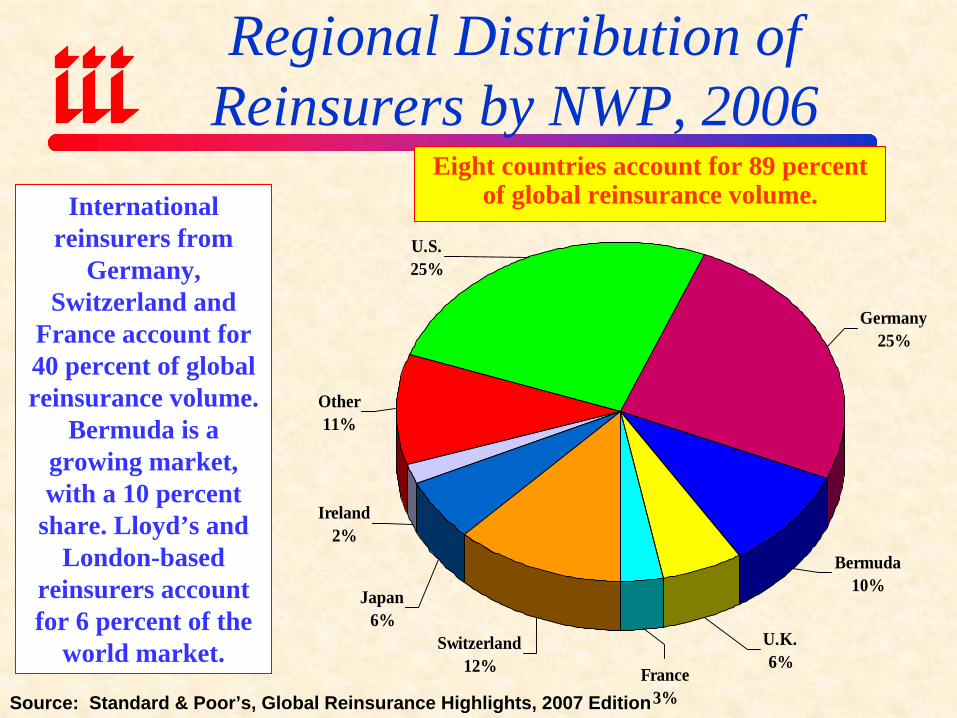
Regional Distribution of Reinsurers by NWP, 2006
Other11%
U.K.6%
Switzerland12%
Ireland2%
Japan6%
Germany25%
France3%
Bermuda10%
U.S.25%
Source: Standard & Poor’s, Global Reinsurance Highlights, 2007 Edition
International reinsurers from
Germany, Switzerland and
France account for 40 percent of global reinsurance volume.
Bermuda is a growing market, with a 10 percent
share. Lloyd’s and London-based
reinsurers account for 6 percent of the
world market.
Eight countries account for 89 percent of global reinsurance volume.
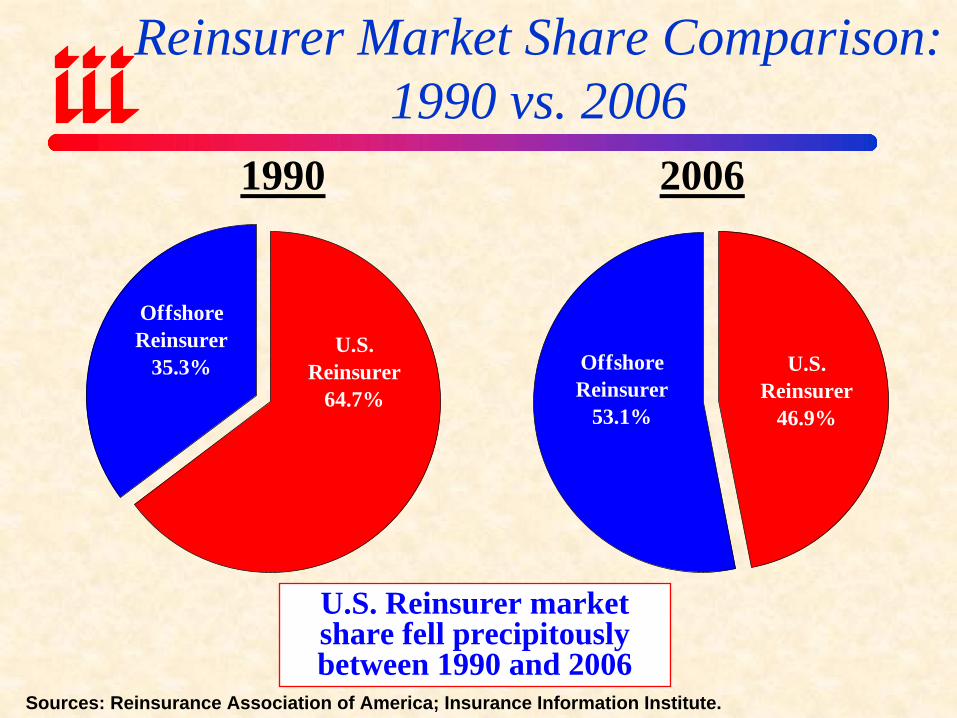
Reinsurer Market Share Comparison: 1990 vs. 2006
U.S. Reinsurer
64.7%
Offshore Reinsurer
35.3%
1990 2006
Sources: Reinsurance Association of America; Insurance Information Institute.
U.S. Reinsurer
46.9%
Offshore Reinsurer
53.1%
U.S. Reinsurer market share fell precipitously between 1990 and 2006
Shifting Legal Liability & Tort
EnvironmentIs the Tort Pendulum
Swinging Against Insurers?
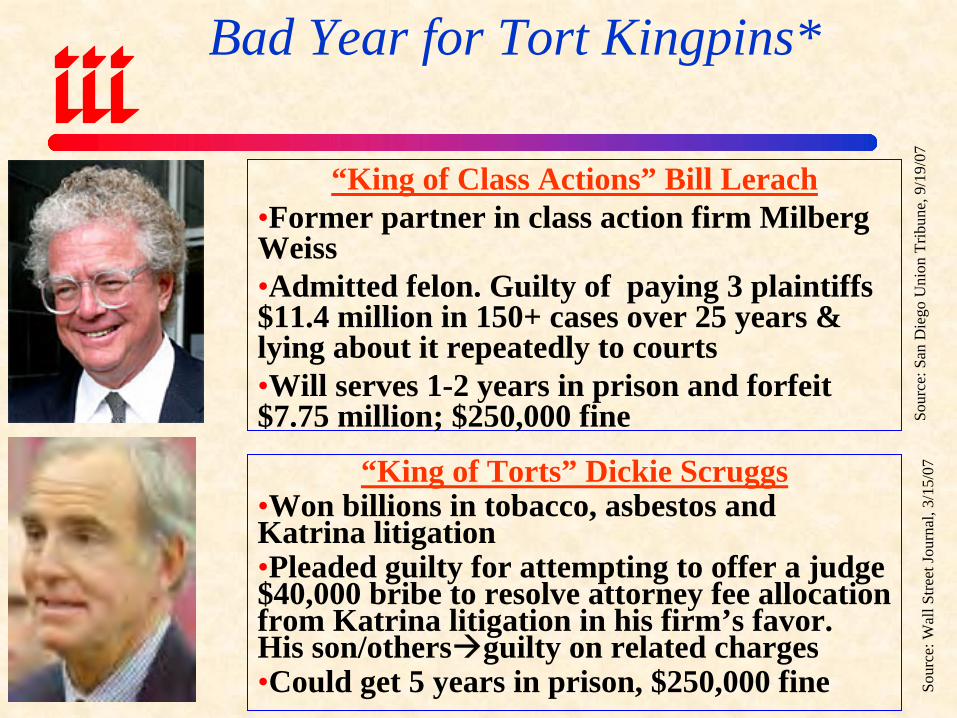
Bad Year for Tort Kingpins*
“King of Class Actions” Bill Lerach•Former partner in class action firm Milberg Weiss•Admitted felon. Guilty of paying 3 plaintiffs $11.4 million in 150+ cases over 25 years & lying about it repeatedly to courts•Will serves 1-2 years in prison and forfeit $7.75 million; $250,000 fine
“King of Torts” Dickie Scruggs•Won billions in tobacco, asbestos and Katrina litigation•Pleaded guilty for attempting to offer a judge $40,000 bribe to resolve attorney fee allocation from Katrina litigation in his firm’s favor. His son/others guilty on related charges•Could get 5 years in prison, $250,000 fine
Sour
ce: S
an D
iego
Uni
on T
ribun
e, 9
/19/
07So
urce
: Wal
l Stre
et Jo
urna
l, 3/
15/0
7
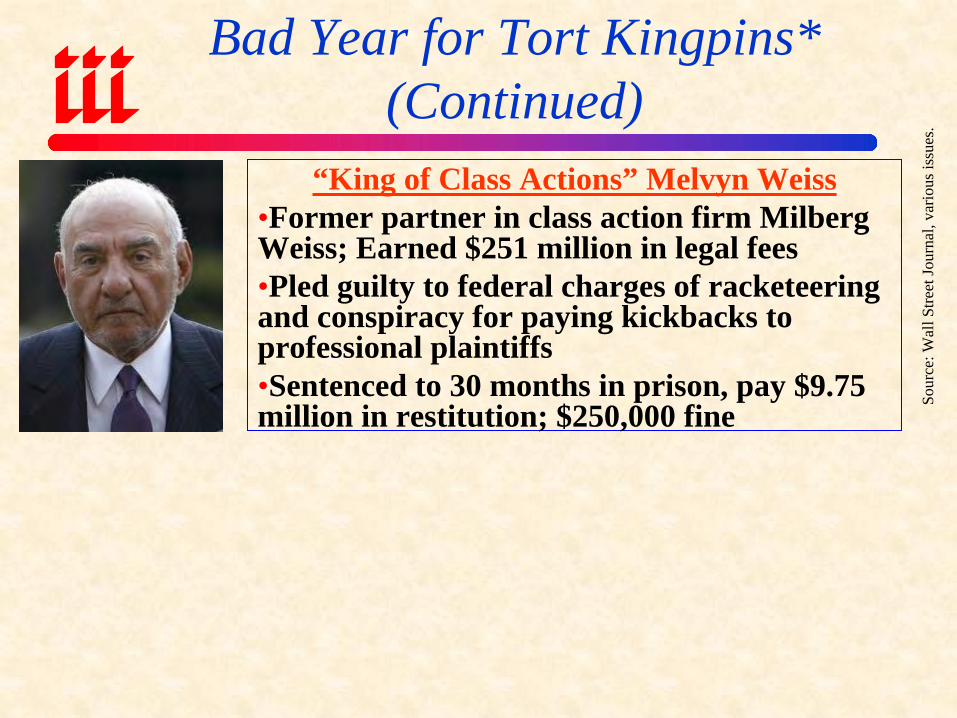
Bad Year for Tort Kingpins*(Continued)
“King of Class Actions” Melvyn Weiss•Former partner in class action firm Milberg Weiss; Earned $251 million in legal fees•Pled guilty to federal charges of racketeering and conspiracy for paying kickbacks to professional plaintiffs•Sentenced to 30 months in prison, pay $9.75 million in restitution; $250,000 fine
Sour
ce: W
all S
treet
Jour
nal,
vario
us is
sues
.
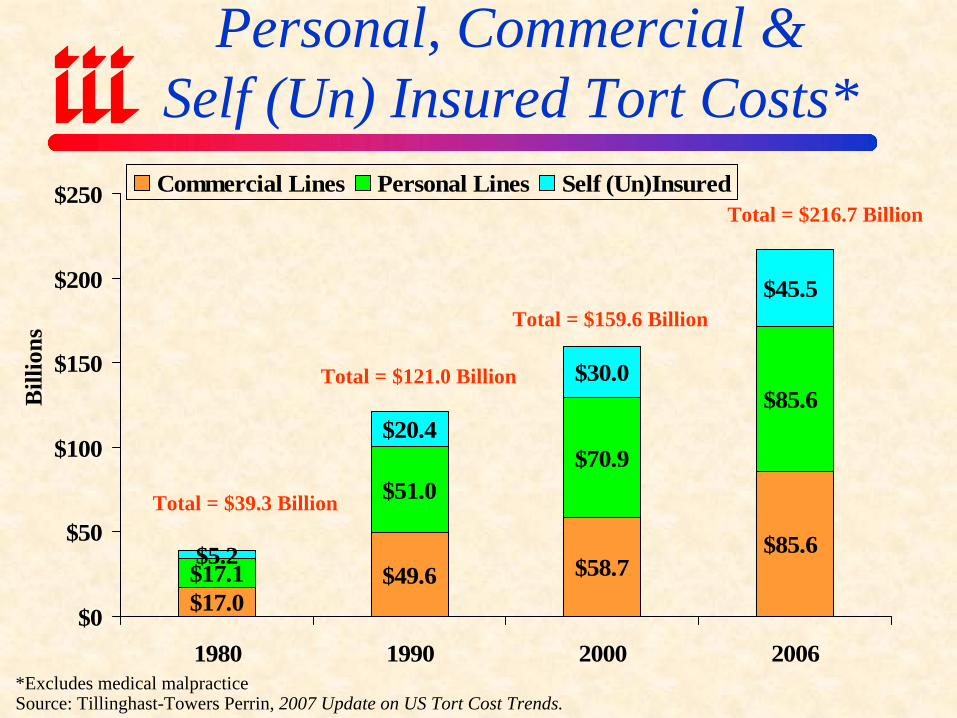
$17.0$49.6 $58.7
$85.6$17.1
$51.0$70.9
$85.6
$5.2
$20.4
$30.0
$45.5
$0
$50
$100
$150
$200
$250
1980 1990 2000 2006
Commercial Lines Personal Lines Self (Un)Insured
Bill
ions
Total = $39.3 Billion
*Excludes medical malpracticeSource: Tillinghast-Towers Perrin, 2007 Update on US Tort Cost Trends.
Total = $121.0 Billion
Total = $159.6 Billion
Total = $216.7 Billion
Personal, Commercial & Self (Un) Insured Tort Costs*
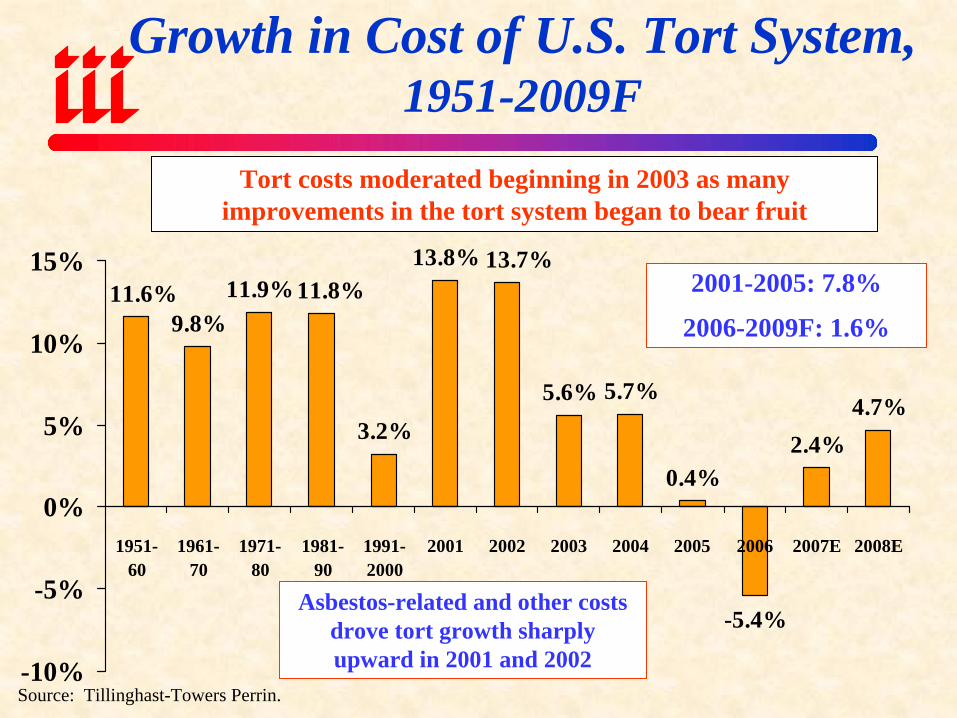
Growth in Cost of U.S. Tort System,1951-2009F
Source: Tillinghast-Towers Perrin.
9.8%11.9%
3.2%
13.8%
5.6% 5.7%
0.4%
-5.4%
2.4%4.7%
11.6% 11.8%13.7%
-10%
-5%
0%
5%
10%
15%
1951-60
1961-70
1971-80
1981-90
1991-2000
2001 2002 2003 2004 2005 2006 2007E 2008E
Tort costs moderated beginning in 2003 as many improvements in the tort system began to bear fruit
Asbestos-related and other costs drove tort growth sharply upward in 2001 and 2002
2001-2005: 7.8%
2006-2009F: 1.6%
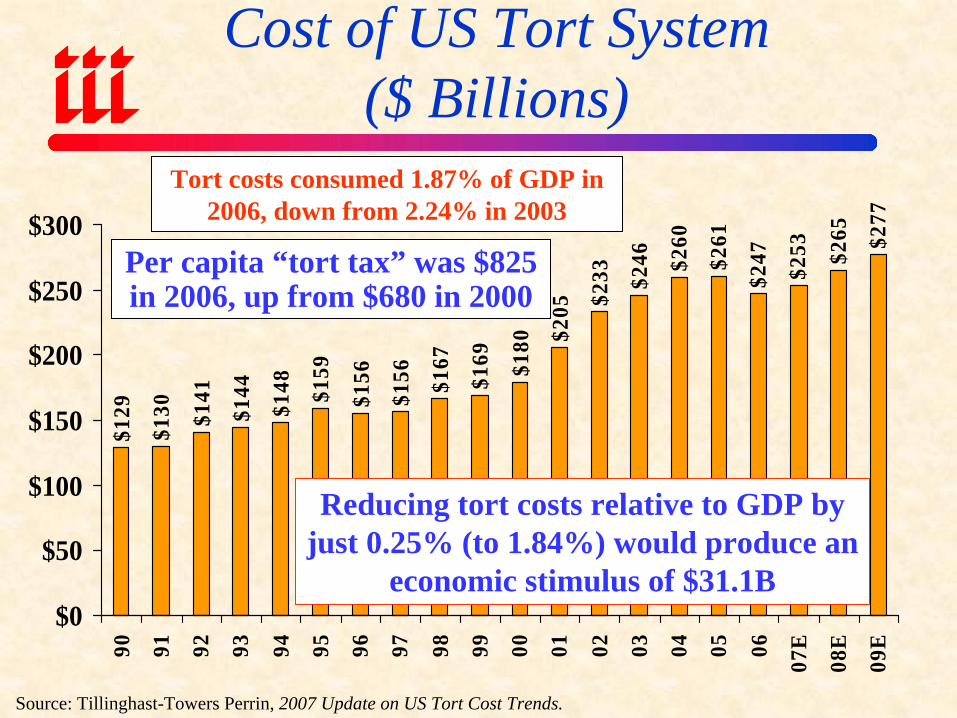
Cost of US Tort System ($ Billions)
$129
$130 $1
41
$144
$148 $1
59
$156
$156 $1
67
$169 $1
80 $205 $2
33 $246 $2
60
$261
$247
$253 $2
65 $277
$0
$50
$100
$150
$200
$250
$300
90 91 92 93 94 95 96 97 98 99 00 01 02 03 04 05 06
07E
08E
09E
Tort costs consumed 1.87% of GDP in 2006, down from 2.24% in 2003
Per capita “tort tax” was $825 in 2006, up from $680 in 2000
Reducing tort costs relative to GDP by just 0.25% (to 1.84%) would produce an
economic stimulus of $31.1B
Source: Tillinghast-Towers Perrin, 2007 Update on US Tort Cost Trends.
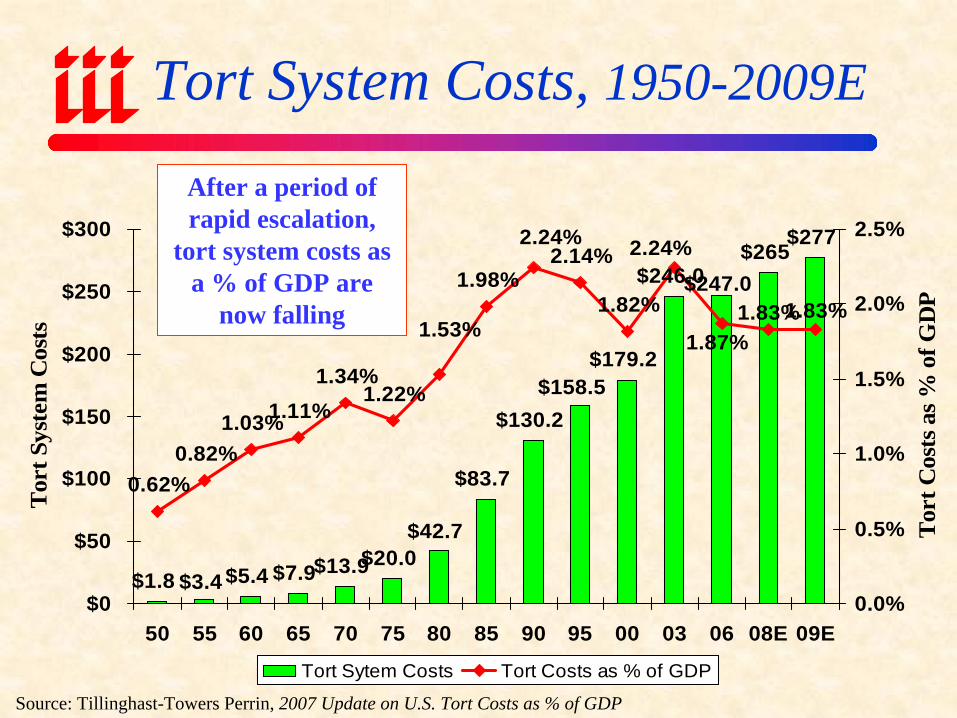
Tort System Costs, 1950-2009E
$1.8 $5.4 $7.9$13.9$20.0
$83.7
$130.2
$179.2
$246.0$265
$277
$158.5
$247.0
$42.7
$3.4
0.62%0.82%
1.03%
1.34%1.22%
1.98%2.14%
1.82% 1.83%1.83%1.87%
2.24%2.24%
1.53%
1.11%
$0
$50
$100
$150
$200
$250
$300
50 55 60 65 70 75 80 85 90 95 00 03 06 08E 09E
Tor
t Sys
tem
Cos
ts
0.0%
0.5%
1.0%
1.5%
2.0%
2.5%
Tor
t Cos
ts a
s % o
f GD
P
Tort Sytem Costs Tort Costs as % of GDP
Source: Tillinghast-Towers Perrin, 2007 Update on U.S. Tort Costs as % of GDP
After a period of rapid escalation,
tort system costs as a % of GDP are
now falling
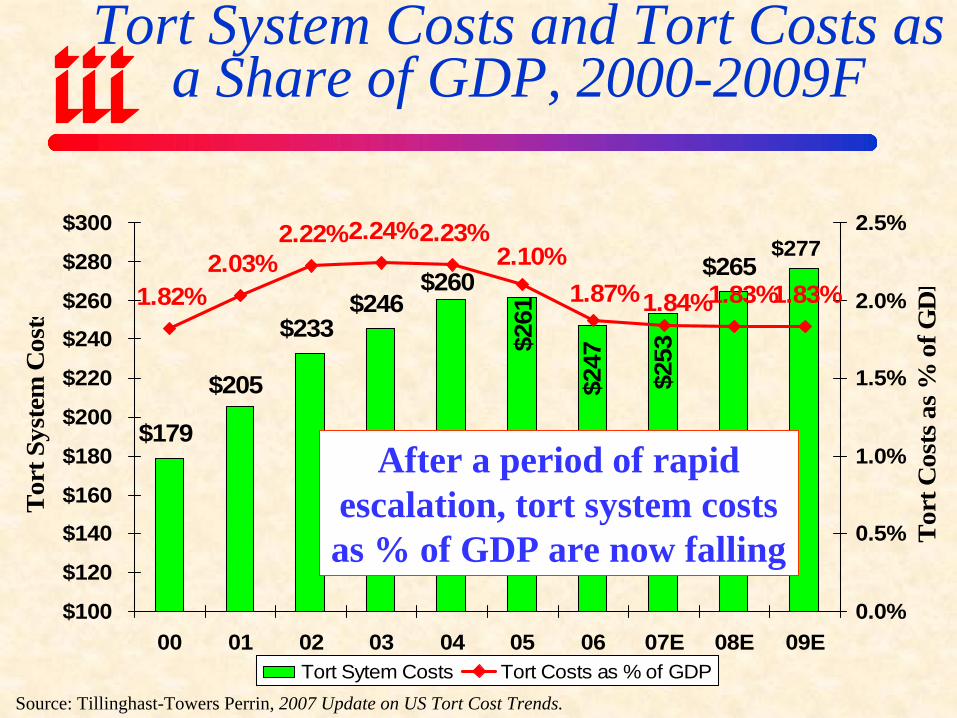
Tort System Costs and Tort Costs as a Share of GDP, 2000-2009F
$179
$233$246
$265
$253
$260
$261
$277
$247
$205
1.82%2.03%
2.22% 2.23%
1.83%1.84%
2.10%1.83%1.87%
2.24%
$100
$120
$140
$160
$180
$200
$220
$240
$260
$280
$300
00 01 02 03 04 05 06 07E 08E 09E
Tor
t Sys
tem
Cos
ts
0.0%
0.5%
1.0%
1.5%
2.0%
2.5%
Tor
t Cos
ts a
s % o
f GD
P
Tort Sytem Costs Tort Costs as % of GDP
After a period of rapid escalation, tort system costs as % of GDP are now falling
Source: Tillinghast-Towers Perrin, 2007 Update on US Tort Cost Trends.
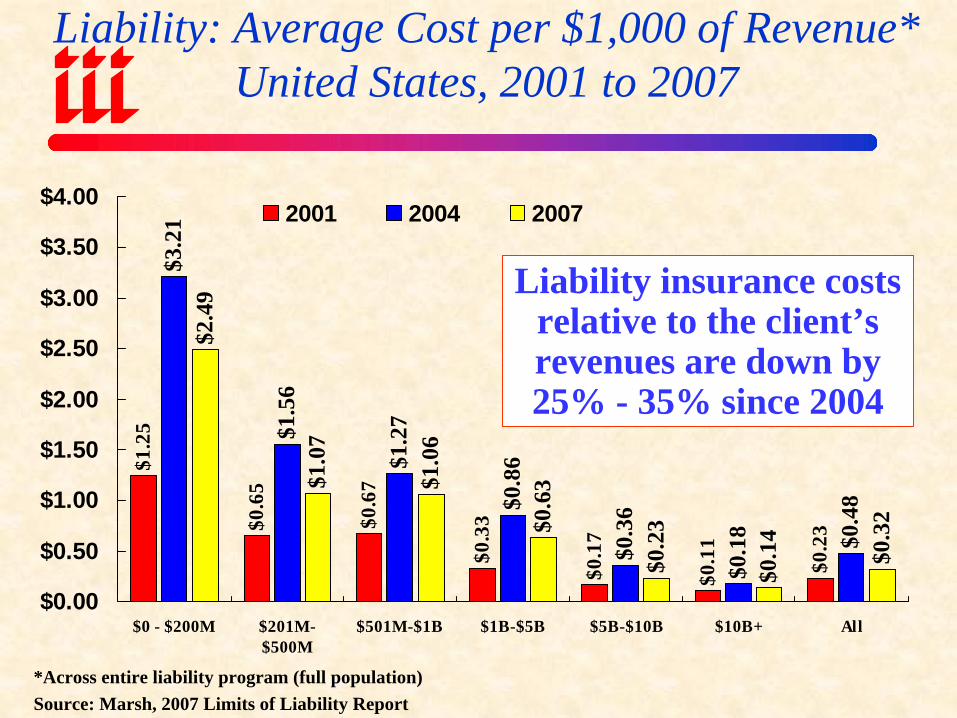
Liability: Average Cost per $1,000 of Revenue* United States, 2001 to 2007
$1.2
5
$0.6
5
$0.6
7
$0.3
3
$0.1
7
$0.1
1
$0.2
3
$3.2
1
$1.5
6
$1.2
7
$0.8
6
$0.3
6
$0.1
8 $0.4
8
$2.4
9
$1.0
7
$1.0
6
$0.6
3
$0.2
3
$0.1
4
$0.3
2
$0.00
$0.50
$1.00
$1.50
$2.00
$2.50
$3.00
$3.50
$4.00
$0 - $200M $201M-$500M
$501M-$1B $1B-$5B $5B-$10B $10B+ All
2001 2004 2007
*Across entire liability program (full population)Source: Marsh, 2007 Limits of Liability Report
Liability insurance costs relative to the client’s revenues are down by 25% - 35% since 2004
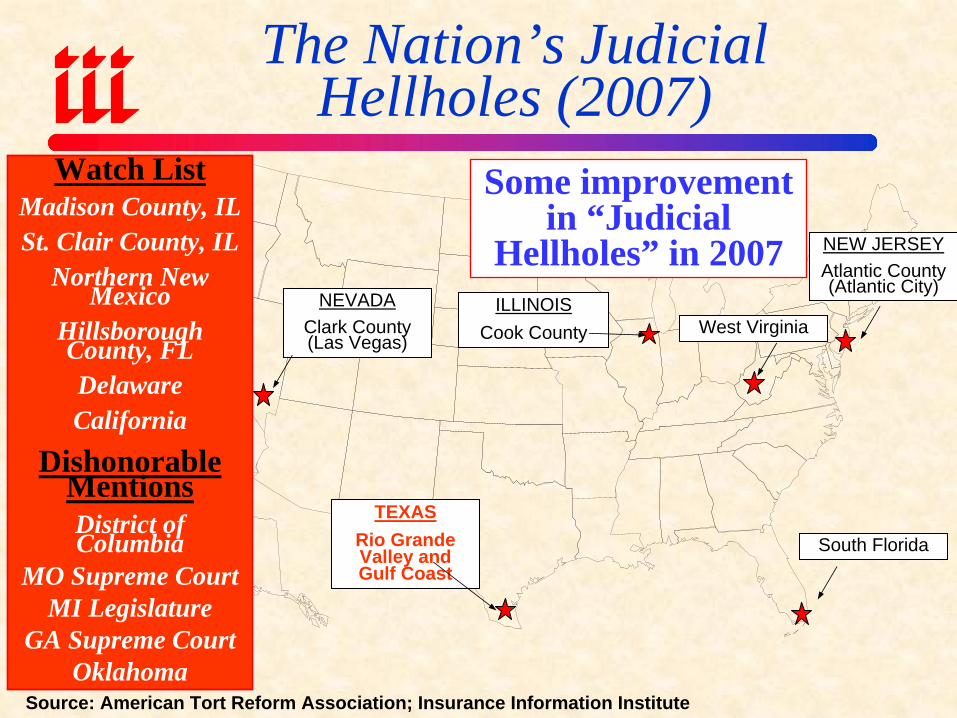
The Nation’s Judicial Hellholes (2007)
Source: American Tort Reform Association; Insurance Information Institute
TEXASRio Grande Valley and Gulf Coast
South Florida
ILLINOISCook County West Virginia
Some improvement in “Judicial
Hellholes” in 2007
Watch ListMadison County, ILSt. Clair County, IL
Northern New Mexico
Hillsborough County, FLDelawareCalifornia
Dishonorable MentionsDistrict of Columbia
MO Supreme CourtMI Legislature
GA Supreme CourtOklahoma
NEVADAClark County (Las Vegas)
NEW JERSEYAtlantic County (Atlantic City)
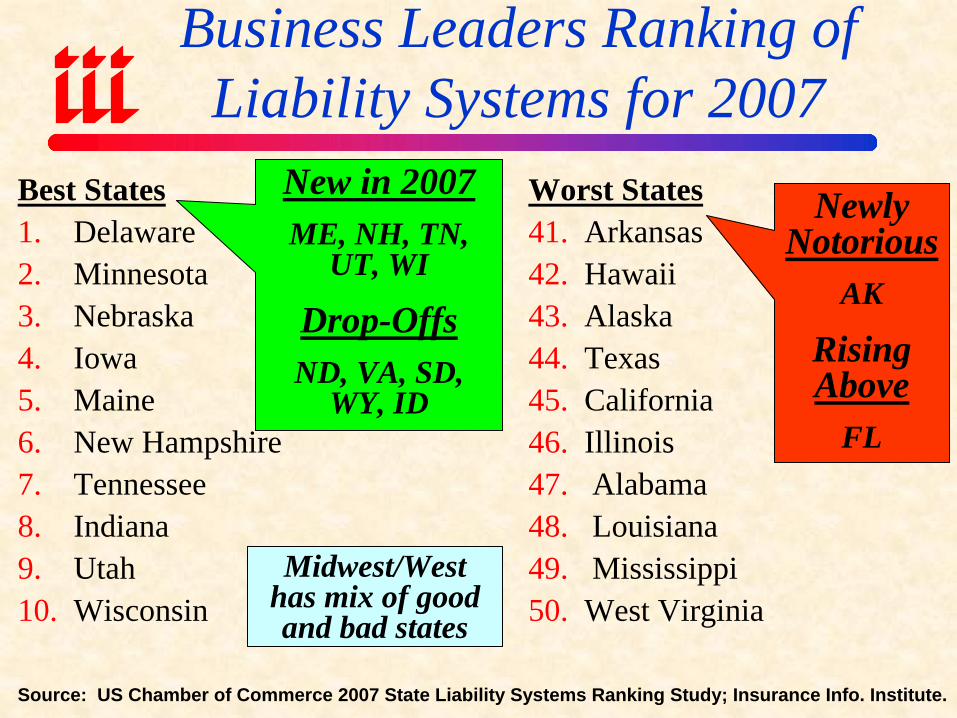
Business Leaders Ranking of Liability Systems for 2007
Best States1. Delaware2. Minnesota3. Nebraska4. Iowa5. Maine6. New Hampshire7. Tennessee8. Indiana9. Utah10. Wisconsin
Worst States41. Arkansas42. Hawaii43. Alaska44. Texas45. California46. Illinois47. Alabama48. Louisiana49. Mississippi50. West Virginia
Source: US Chamber of Commerce 2007 State Liability Systems Ranking Study; Insurance Info. Institute.
New in 2007ME, NH, TN,
UT, WI
Drop-OffsND, VA, SD,
WY, ID
NewlyNotorious
AK
RisingAbove
FL
Midwest/West has mix of good and bad states
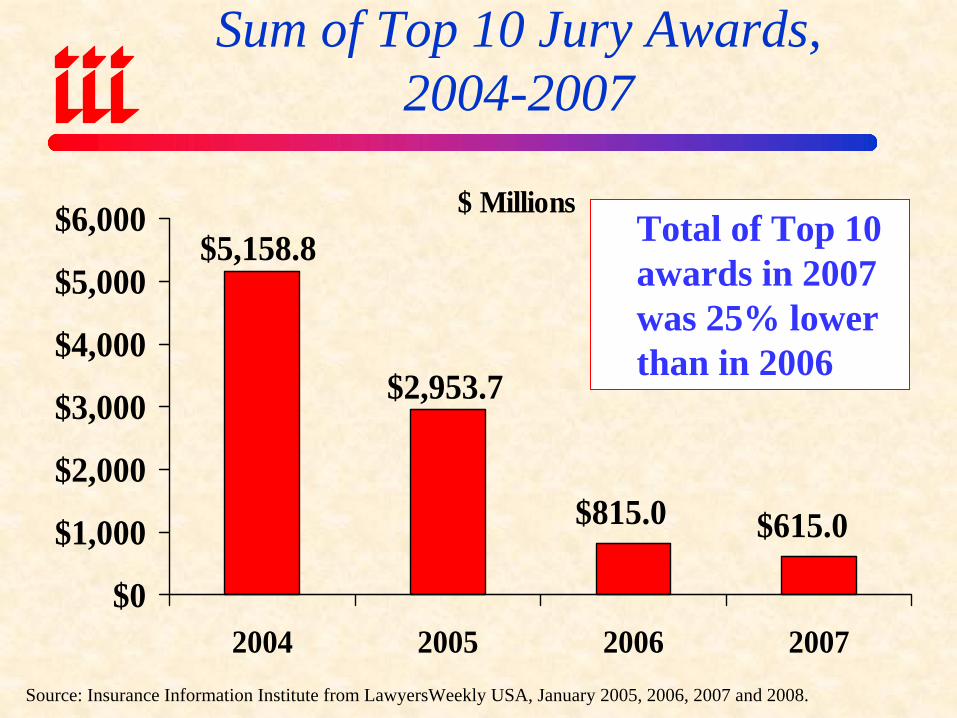
Sum of Top 10 Jury Awards, 2004-2007
$ Millions
$615.0$815.0
$2,953.7
$5,158.8
$0
$1,000
$2,000
$3,000
$4,000
$5,000
$6,000
2004 2005 2006 2007Source: Insurance Information Institute from LawyersWeekly USA, January 2005, 2006, 2007 and 2008.
Total of Top 10 awards in 2007 was 25% lower than in 2006
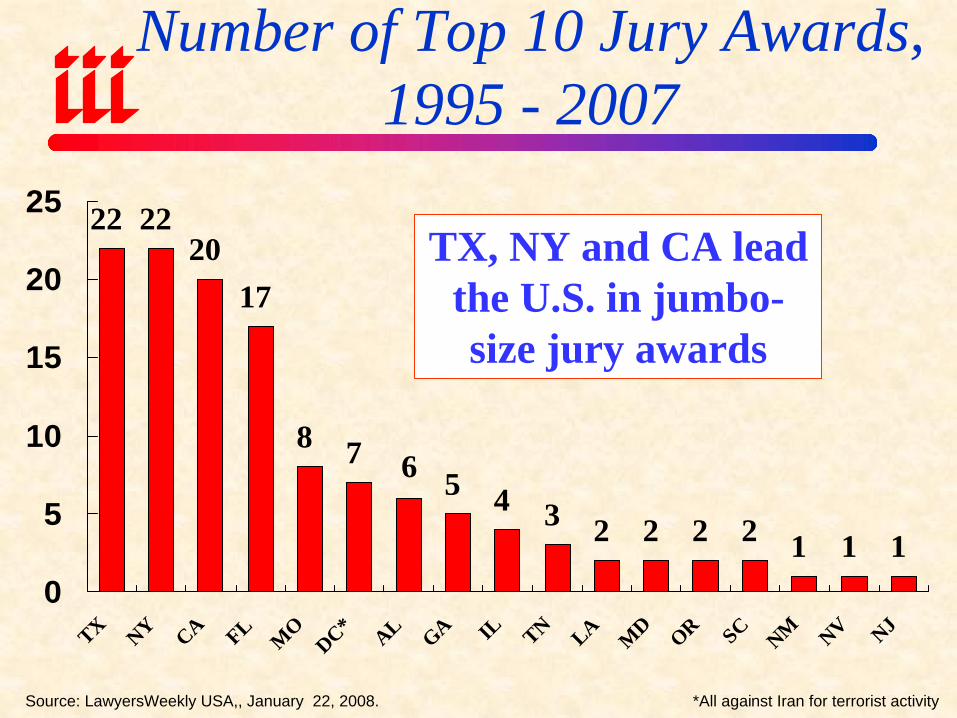
Number of Top 10 Jury Awards, 1995 - 2007
22 2220
17
8 75 4 3 2 2 2 2 1 1 1
6
0
5
10
15
20
25
TX NY CA FL
MO
DC* AL GA IL TN LA MD OR SC NM NV NJ
TX, NY and CA lead the U.S. in jumbo-size jury awards
Source: LawyersWeekly USA,, January 22, 2008. *All against Iran for terrorist activity
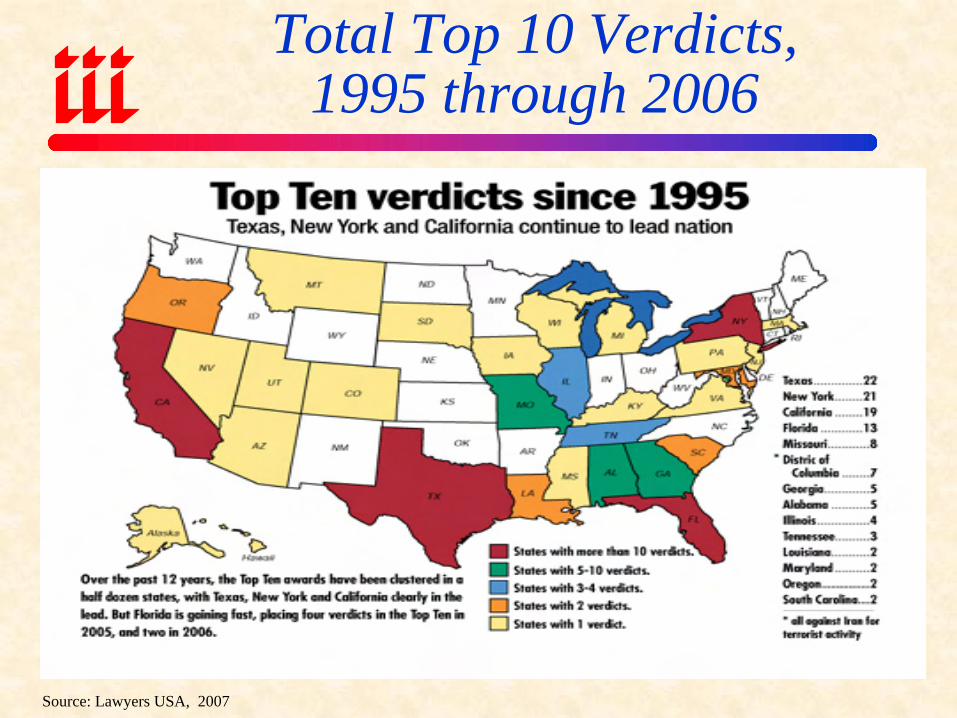
Total Top 10 Verdicts, 1995 through 2006
Source: Lawyers USA, 2007
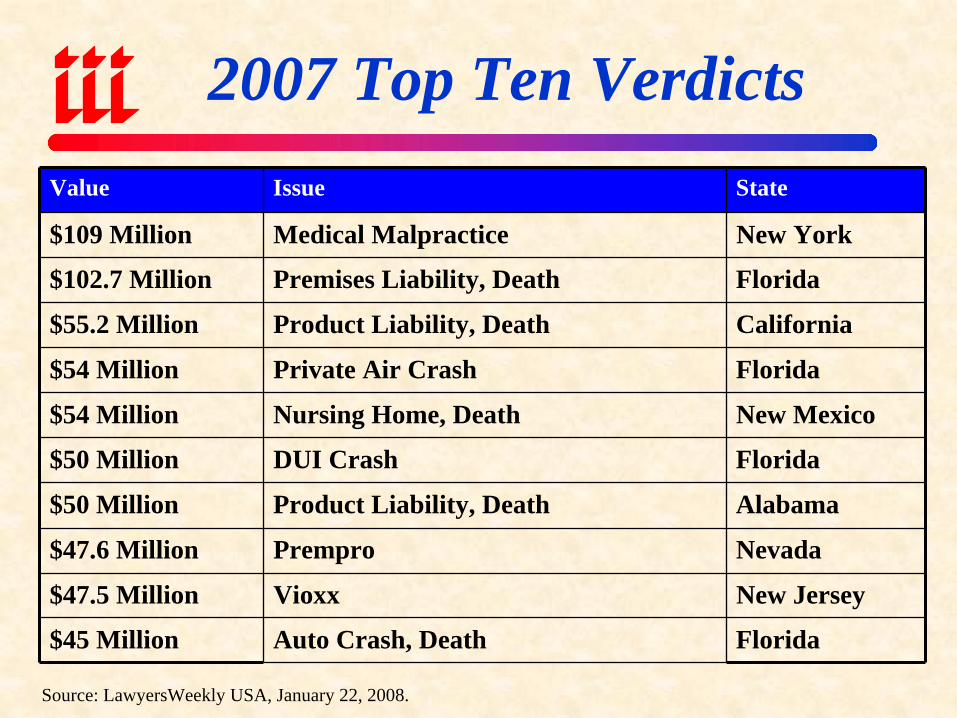
2007 Top Ten Verdicts
Source: LawyersWeekly USA, January 22, 2008.
Value Issue State
$109 Million Medical Malpractice New York
$102.7 Million Premises Liability, Death Florida
$55.2 Million Product Liability, Death California
$54 Million Private Air Crash Florida
$54 Million Nursing Home, Death New Mexico
$50 Million DUI Crash Florida
$50 Million Product Liability, Death Alabama
$47.6 Million Prempro Nevada
$47.5 Million Vioxx New Jersey
$45 Million Auto Crash, Death Florida
REGULATORY & LEGISLATIVE
ENVIRONMENT
Isolated Improvements, Mounting Zealoutry
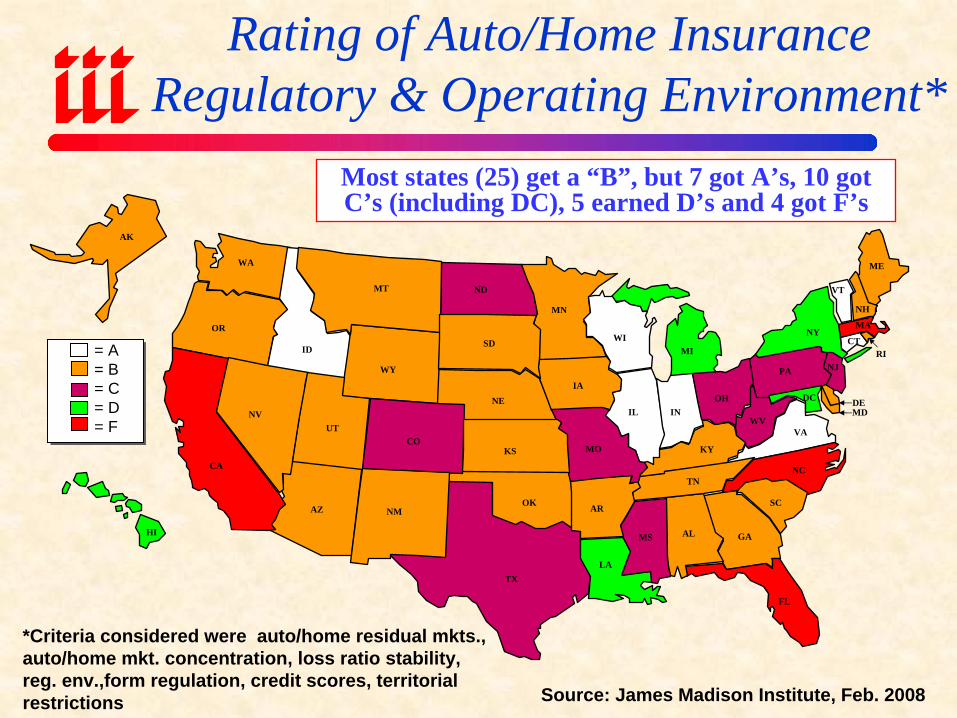
Rating of Auto/Home Insurance Regulatory & Operating Environment*
Source: James Madison Institute, February 2008.
ME
NH
MA
CT
PA
WVVA
NC
LATX
OK
NE
ND
MN
MI
IL
IA
ID
WA
OR
AZ
HI
NJRI
MDDE
AL
VT
NY
DC
SC
GA
TN
AL
FL
MS
ARNM
KYMOKS
SD WI
INOH
MT
CA
NVUT
WY
CO
AK
Most states (25) get a “B”, but 7 got A’s, 10 got C’s (including DC), 5 earned D’s and 4 got F’s
*Criteria considered were auto/home residual mkts., auto/home mkt. concentration, loss ratio stability, reg. env.,form regulation, credit scores, territorial restrictions
= A= B= C= D= F
Source: James Madison Institute, Feb. 2008

Insurance Information Institute On-Line
If you would like a copy of this presentation, please give me your business card with e-mail address