Embed Size (px)
Citation preview
パーソナルファイナンス研究No.3
55
The Financial Activities of Households, and US Financial Institutions
Abstract Households’ financial transactions have been increasing in recent years. In the United States, the
household as a fund raiser has increased borrowing in the forms of mortgages and consumer credit.
Households, as asset holders, own a great deal of stocks and real estate, such as housing. The borrowing
of households has become greatly affected by their asset value fluctuation, as financial instruments by
which to borrow against the collateral assets held by households have become more popular in recent
years.
US financial institutions have been expanding their financial business in those areas that target house-
holds. Financial institutions have increased lending to households, while expanding the volume of target
customers and the auspices of loan collateral. At that time, financial institutions attempted to reduce their
credit risk by using securitization; however, the credit cost of US financial institutions increased rapidly
during the 2008 financial crisis. In looking at its content, credit cost increased rapidly—not only with
respect to mortgages, but also in other areas, such as credit cards. To date, financial institutions have
applied credit risk management to each distinct loan product; however, at the time of the financial crisis,
increased credit risk with respect to mortgages (i.e., due to the decrease in housing prices) also affected
credit risk with respect to credit cards and other products. As such, the risk management undertaken by
financial institutions—which has previously been done through the use of traditional financial instru-
ments and business lines—may have become insufficient. Overall, I do believe that financial institutions
require an integrated risk management strategy with respect to the financial transactions of households
and individuals.
Shinichiro MaedaMeijo University
56
パーソナルファイナンス研究No.3
1 Introduction
Does an expansion in household financial activity in-
crease macro-level financial instability? The finance busi-
ness, in catering to an unspecified number of households
or individuals, has developed into a stable profit source
for financial institutions.1 That financial business tar-
geting households has promoted a small amount of risk
dispersion, although its cost is high. However, since the
2008 global financial crisis—which presumably stemmed
from subprime mortgages in the United States—the busi-
ness results of financial institutions have largely wors-
ened, not only in the United States, but internationally.2
A home mortgage loan is a loan made at the household or
individual level, and US commercial banks have pushed
and promoted home mortgage loans since approximately
the 1930s.3 In addition, the securitization of home mort-
gages has been pushed since the 1970s, and the results
of that push are only manifesting now.4 The financial
development and innovation of management methods
helped expand financial activities at the household level;
on the other hand, we can also see qualitative changes
in the financial activities of households. In this study, I
analyze the influence that changes to and expansion in fi-
nancial activities among US households have had on the
management of financial institutions, within the context
of the outbreak of the financial crisis. I want to clarify
the relationship seen, even today, between households
and financial institutions, by analyzing the influence of
increased financial activity among US households on the
management of financial institutions.
Financial activities of US household
2. 1 Money flows of US households
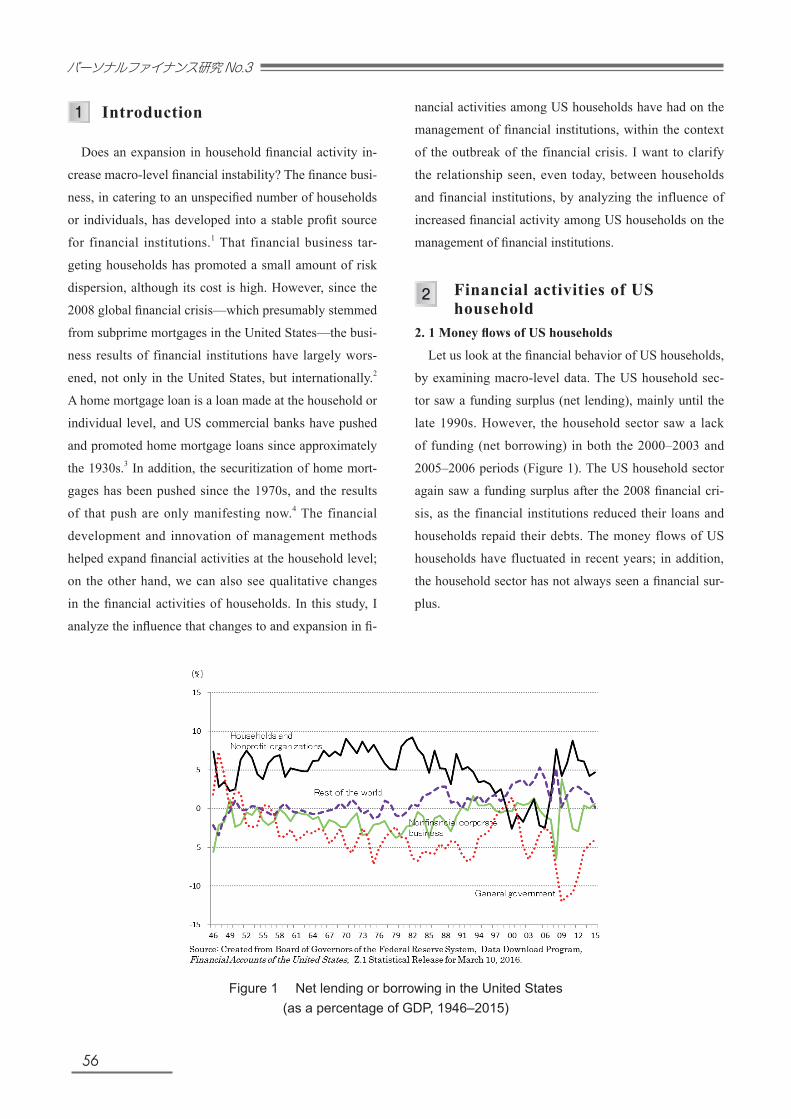
Let us look at the financial behavior of US households,
by examining macro-level data. The US household sec-
tor saw a funding surplus (net lending), mainly until the
late 1990s. However, the household sector saw a lack
of funding (net borrowing) in both the 2000–2003 and
2005–2006 periods (Figure 1). The US household sector
again saw a funding surplus after the 2008 financial cri-
sis, as the financial institutions reduced their loans and
households repaid their debts. The money flows of US
households have fluctuated in recent years; in addition,
the household sector has not always seen a financial sur-
plus.
Figure 1 Net lending or borrowing in the United States(as a percentage of GDP, 1946–2015)
2
57
The Financial Activities of Households, and US Financial Institutions
Figure 2 Net change in US household liabilities(home mortgages and consumer credit, 1970–2014)
2. 2 Households as fund raisers
How has the financial behavior of US households
changed in recent years? First of all, let’s take a look at
the household as a fund raiser: the main forms of fund
raising among households are residential mortgage loans
and consumer credit.5 In the postwar years, improve-
ments in living standards among US individuals were
achieved through home ownership. The number of new
housing starts in the United States has been at high levels
since the 1970s6, reaching a record high of 2.36 million
in 1972. Both new housing starts and car sales are im-
portant to the diffusion index. Additionally, the value of
outstanding residential mortgage loans of US households
has increased significantly since the 1970s, with their
value increasing from $286 billion in 1970 to $10.6 tril-
lion in 2007, at an annual rate of 10.3%.
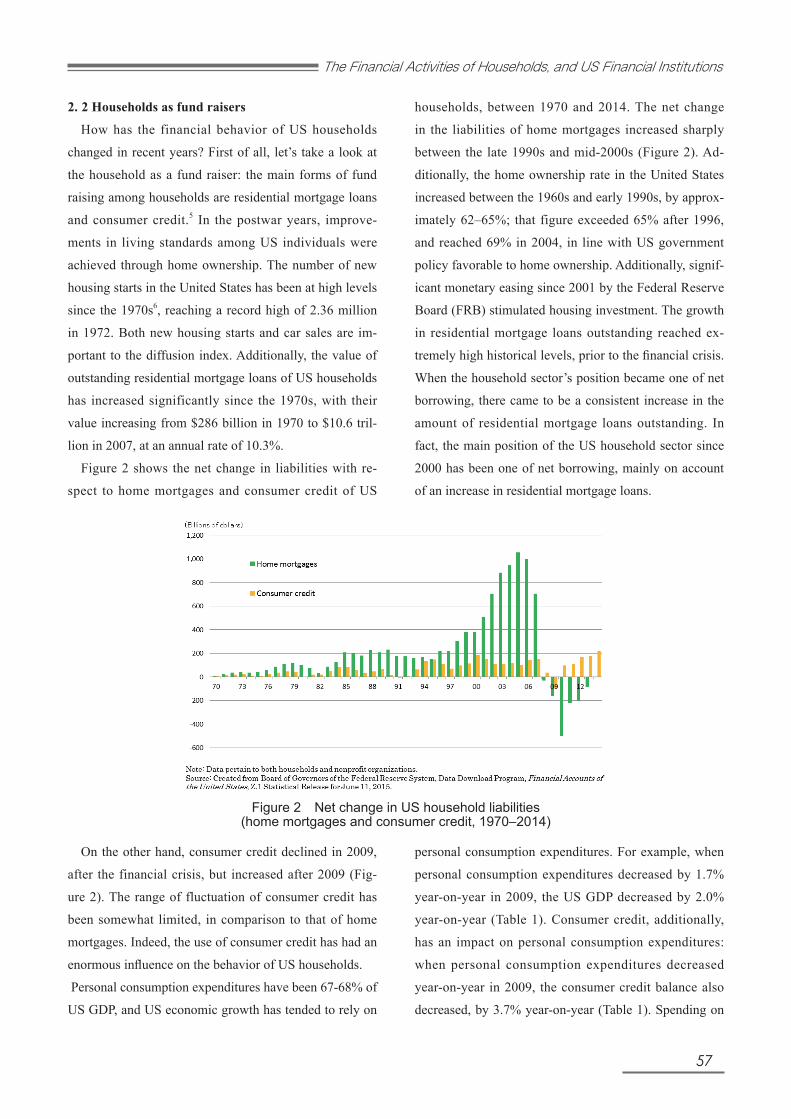
Figure 2 shows the net change in liabilities with re-
spect to home mortgages and consumer credit of US
households, between 1970 and 2014. The net change
in the liabilities of home mortgages increased sharply
between the late 1990s and mid-2000s (Figure 2). Ad-
ditionally, the home ownership rate in the United States
increased between the 1960s and early 1990s, by approx-
imately 62–65%; that figure exceeded 65% after 1996,
and reached 69% in 2004, in line with US government
policy favorable to home ownership. Additionally, signif-
icant monetary easing since 2001 by the Federal Reserve
Board (FRB) stimulated housing investment. The growth
in residential mortgage loans outstanding reached ex-
tremely high historical levels, prior to the financial crisis.
When the household sector’s position became one of net
borrowing, there came to be a consistent increase in the
amount of residential mortgage loans outstanding. In
fact, the main position of the US household sector since
2000 has been one of net borrowing, mainly on account
of an increase in residential mortgage loans.
On the other hand, consumer credit declined in 2009,
after the financial crisis, but increased after 2009 (Fig-
ure 2). The range of fluctuation of consumer credit has
been somewhat limited, in comparison to that of home
mortgages. Indeed, the use of consumer credit has had an
enormous influence on the behavior of US households.
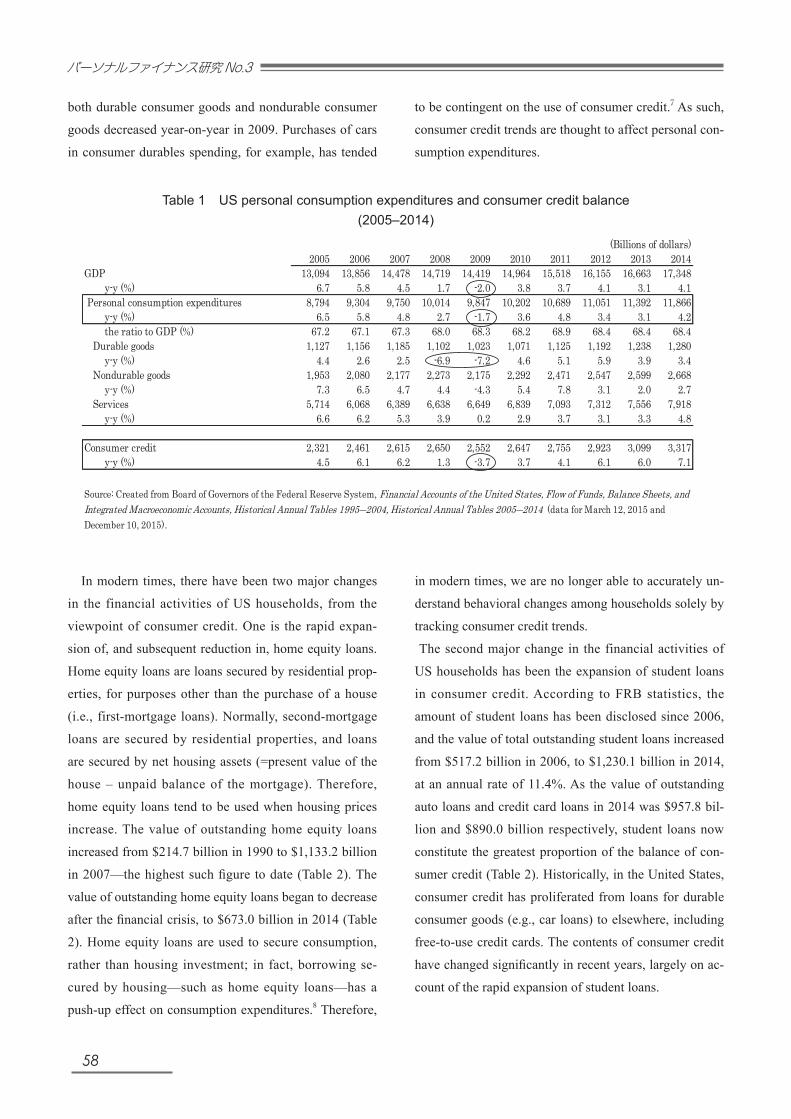
Personal consumption expenditures have been 67-68% of
US GDP, and US economic growth has tended to rely on
personal consumption expenditures. For example, when
personal consumption expenditures decreased by 1.7%
year-on-year in 2009, the US GDP decreased by 2.0%
year-on-year (Table 1). Consumer credit, additionally,
has an impact on personal consumption expenditures:
when personal consumption expenditures decreased
year-on-year in 2009, the consumer credit balance also
decreased, by 3.7% year-on-year (Table 1). Spending on
58
パーソナルファイナンス研究No.3
both durable consumer goods and nondurable consumer
goods decreased year-on-year in 2009. Purchases of cars
in consumer durables spending, for example, has tended
to be contingent on the use of consumer credit.7 As such,
consumer credit trends are thought to affect personal con-
sumption expenditures.
6
Table 1. US personal consumption expenditures and consumer credit balance (2005–2014)
(Billions of dollars)2005 2006 2007 2008 2009 2010 2011 2012 2013 2014
GDP 13,094 13,856 14,478 14,719 14,419 14,964 15,518 16,155 16,663 17,348 y-y (%) 6.7 5.8 4.5 1.7 -2.0 3.8 3.7 4.1 3.1 4.1 Personal consumption expenditures 8,794 9,304 9,750 10,014 9,847 10,202 10,689 11,051 11,392 11,866 y-y (%) 6.5 5.8 4.8 2.7 -1.7 3.6 4.8 3.4 3.1 4.2 the ratio to GDP (%) 67.2 67.1 67.3 68.0 68.3 68.2 68.9 68.4 68.4 68.4 Durable goods 1,127 1,156 1,185 1,102 1,023 1,071 1,125 1,192 1,238 1,280 y-y (%) 4.4 2.6 2.5 -6.9 -7.2 4.6 5.1 5.9 3.9 3.4 Nondurable goods 1,953 2,080 2,177 2,273 2,175 2,292 2,471 2,547 2,599 2,668 y-y (%) 7.3 6.5 4.7 4.4 -4.3 5.4 7.8 3.1 2.0 2.7 Services 5,714 6,068 6,389 6,638 6,649 6,839 7,093 7,312 7,556 7,918 y-y (%) 6.6 6.2 5.3 3.9 0.2 2.9 3.7 3.1 3.3 4.8
Consumer credit 2,321 2,461 2,615 2,650 2,552 2,647 2,755 2,923 3,099 3,317 y-y (%) 4.5 6.1 6.2 1.3 -3.7 3.7 4.1 6.1 6.0 7.1
Source: Created from Board of Governors of the Federal Reserve System, Financial Accounts of the United States, Flow of Funds, Balance Sheets, andIntegrated Macroeconomic Accounts, Historical Annual Tables 1995―2004, Historical Annual Tables 2005―2014 (data for March 12, 2015 andDecember 10, 2015). In modern times, there have been two major changes in the financial activities of US households, from the viewpoint of consumer credit. One is the rapid expansion of, and subsequent reduction in, home equity loans. Home equity loans are loans secured by residential properties, for purposes other than the purchase of a house (i.e., first-mortgage loans). Normally, second-mortgage loans are secured by residential properties, and loans are secured by net housing assets (=present value of the house – unpaid balance of the mortgage). Therefore, home equity loans tend to be used when housing prices increase. The value of outstanding home equity loans increased from $214.7 billion in 1990 to $1,133.2 billion in 2007—the highest such figure to date (Table 2). The value of outstanding home equity loans began to decrease after the financial crisis, to $673.0 billion in 2014 (Table 2). Home equity loans are used to secure consumption, rather than housing investment; in fact, borrowing secured by housing—such as home equity loans—has a push-up effect on consumption expenditures 8 . Therefore, in modern times, we are no longer able to accurately understand behavioral changes among households solely by tracking consumer credit trends. The second major change in the financial activities of US households has been the expansion of student loans in consumer credit. According to FRB statistics, the amount of student loans has been disclosed since 2006, and the value of total outstanding student loans increased from $517.2 billion in 2006, to $1,230.1 billion in 2014, at an annual rate of 11.4%. As the value of outstanding auto loans and credit card loans in
Table 1 US personal consumption expenditures and consumer credit balance (2005–2014)
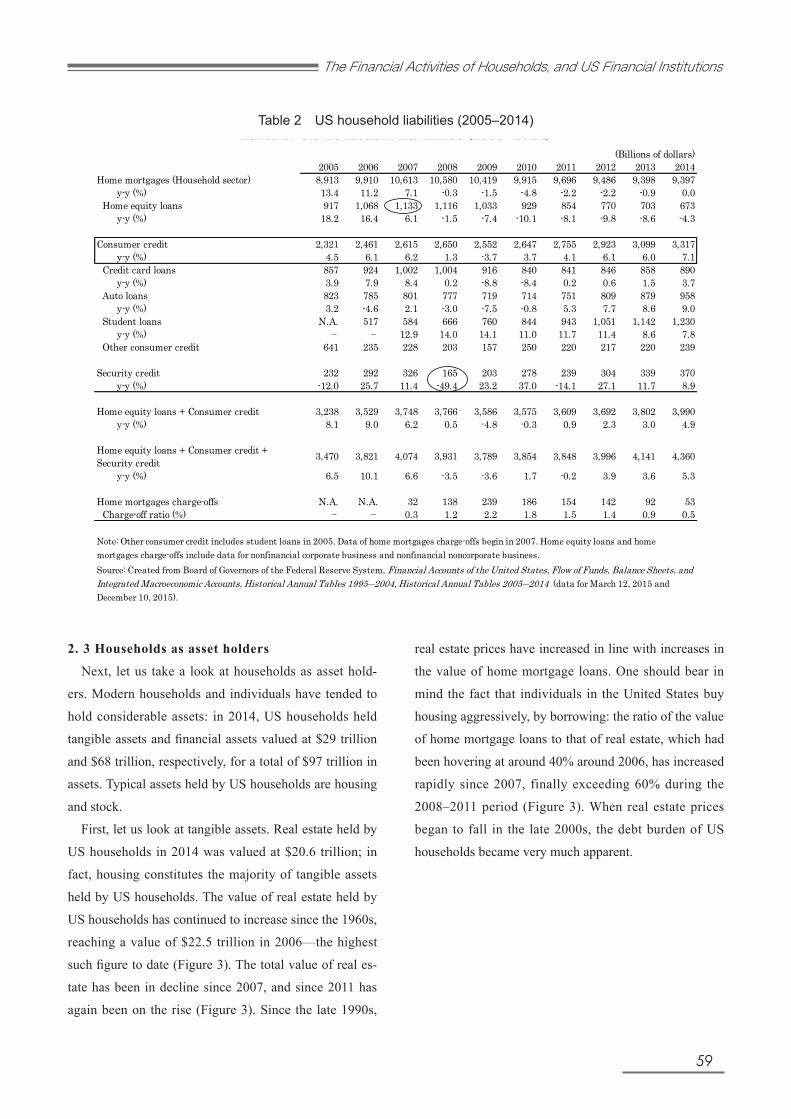
In modern times, there have been two major changes
in the financial activities of US households, from the
viewpoint of consumer credit. One is the rapid expan-
sion of, and subsequent reduction in, home equity loans.
Home equity loans are loans secured by residential prop-
erties, for purposes other than the purchase of a house
(i.e., first-mortgage loans). Normally, second-mortgage
loans are secured by residential properties, and loans
are secured by net housing assets (=present value of the
house – unpaid balance of the mortgage). Therefore,
home equity loans tend to be used when housing prices
increase. The value of outstanding home equity loans
increased from $214.7 billion in 1990 to $1,133.2 billion
in 2007—the highest such figure to date (Table 2). The
value of outstanding home equity loans began to decrease
after the financial crisis, to $673.0 billion in 2014 (Table
2). Home equity loans are used to secure consumption,
rather than housing investment; in fact, borrowing se-
cured by housing—such as home equity loans—has a
push-up effect on consumption expenditures.8 Therefore,
in modern times, we are no longer able to accurately un-
derstand behavioral changes among households solely by
tracking consumer credit trends.
The second major change in the financial activities of
US households has been the expansion of student loans
in consumer credit. According to FRB statistics, the
amount of student loans has been disclosed since 2006,
and the value of total outstanding student loans increased
from $517.2 billion in 2006, to $1,230.1 billion in 2014,
at an annual rate of 11.4%. As the value of outstanding
auto loans and credit card loans in 2014 was $957.8 bil-
lion and $890.0 billion respectively, student loans now
constitute the greatest proportion of the balance of con-
sumer credit (Table 2). Historically, in the United States,
consumer credit has proliferated from loans for durable
consumer goods (e.g., car loans) to elsewhere, including
free-to-use credit cards. The contents of consumer credit
have changed significantly in recent years, largely on ac-
count of the rapid expansion of student loans.
59
The Financial Activities of Households, and US Financial Institutions
7
2014 was $957.8 billion and $890.0 billion respectively, student loans now constitute the greatest proportion of the balance of consumer credit (Table 2). Historically, in the United States, consumer credit has proliferated from loans for durable consumer goods (e.g., car loans) to elsewhere, including free-to-use credit cards. The contents of consumer credit have changed significantly in recent years, largely on account of the rapid expansion of student loans.
Table 2. US household liabilities (2005–2014) (Billions of dollars)
2005 2006 2007 2008 2009 2010 2011 2012 2013 2014Home mortgages (Household sector) 8,913 9,910 10,613 10,580 10,419 9,915 9,696 9,486 9,398 9,397 y-y (%) 13.4 11.2 7.1 -0.3 -1.5 -4.8 -2.2 -2.2 -0.9 0.0 Home equity loans 917 1,068 1,133 1,116 1,033 929 854 770 703 673 y-y (%) 18.2 16.4 6.1 -1.5 -7.4 -10.1 -8.1 -9.8 -8.6 -4.3
Consumer credit 2,321 2,461 2,615 2,650 2,552 2,647 2,755 2,923 3,099 3,317 y-y (%) 4.5 6.1 6.2 1.3 -3.7 3.7 4.1 6.1 6.0 7.1 Credit card loans 857 924 1,002 1,004 916 840 841 846 858 890 y-y (%) 3.9 7.9 8.4 0.2 -8.8 -8.4 0.2 0.6 1.5 3.7 Auto loans 823 785 801 777 719 714 751 809 879 958 y-y (%) 3.2 -4.6 2.1 -3.0 -7.5 -0.8 5.3 7.7 8.6 9.0 Student loans N.A. 517 584 666 760 844 943 1,051 1,142 1,230 y-y (%) - - 12.9 14.0 14.1 11.0 11.7 11.4 8.6 7.8 Other consumer credit 641 235 228 203 157 250 220 217 220 239
Security credit 232 292 326 165 203 278 239 304 339 370 y-y (%) -12.0 25.7 11.4 -49.4 23.2 37.0 -14.1 27.1 11.7 8.9
Home equity loans + Consumer credit 3,238 3,529 3,748 3,766 3,586 3,575 3,609 3,692 3,802 3,990 y-y (%) 8.1 9.0 6.2 0.5 -4.8 -0.3 0.9 2.3 3.0 4.9
Home equity loans + Consumer credit +Security credit 3,470 3,821 4,074 3,931 3,789 3,854 3,848 3,996 4,141 4,360
y-y (%) 6.5 10.1 6.6 -3.5 -3.6 1.7 -0.2 3.9 3.6 5.3
Home mortgages charge-offs N.A. N.A. 32 138 239 186 154 142 92 53 Charge-off ratio (%) - - 0.3 1.2 2.2 1.8 1.5 1.4 0.9 0.5
Note: Other consumer credit includes student loans in 2005. Data of home mortgages charge-offs begin in 2007. Home equity loans and homemortgages charge-offs include data for nonfinancial corporate business and nonfinancial noncorporate business.Source: Created from Board of Governors of the Federal Reserve System, Financial Accounts of the United States, Flow of Funds, Balance Sheets, andIntegrated Macroeconomic Accounts, Historical Annual Tables 1995―2004, Historical Annual Tables 2005―2014 (data for March 12, 2015 andDecember 10, 2015). 2.3. Households as asset holders Next, let us take a look at households as asset holders. Modern households and individuals have tended to hold considerable assets: in 2014, US households held tangible assets and financial assets valued at $29 trillion and $68 trillion, respectively, for a total of $97 trillion in assets. Typical assets held by US households are housing and stock. First, let us look at tangible assets. Real estate held by US households in 2014 was valued at $20.6 trillion; in fact, housing constitutes the majority of tangible assets held by US households. The value of real estate held by US households has continued to
Table 2 US household liabilities (2005–2014)
2. 3 Households as asset holders
Next, let us take a look at households as asset hold-
ers. Modern households and individuals have tended to
hold considerable assets: in 2014, US households held
tangible assets and financial assets valued at $29 trillion
and $68 trillion, respectively, for a total of $97 trillion in
assets. Typical assets held by US households are housing
and stock.
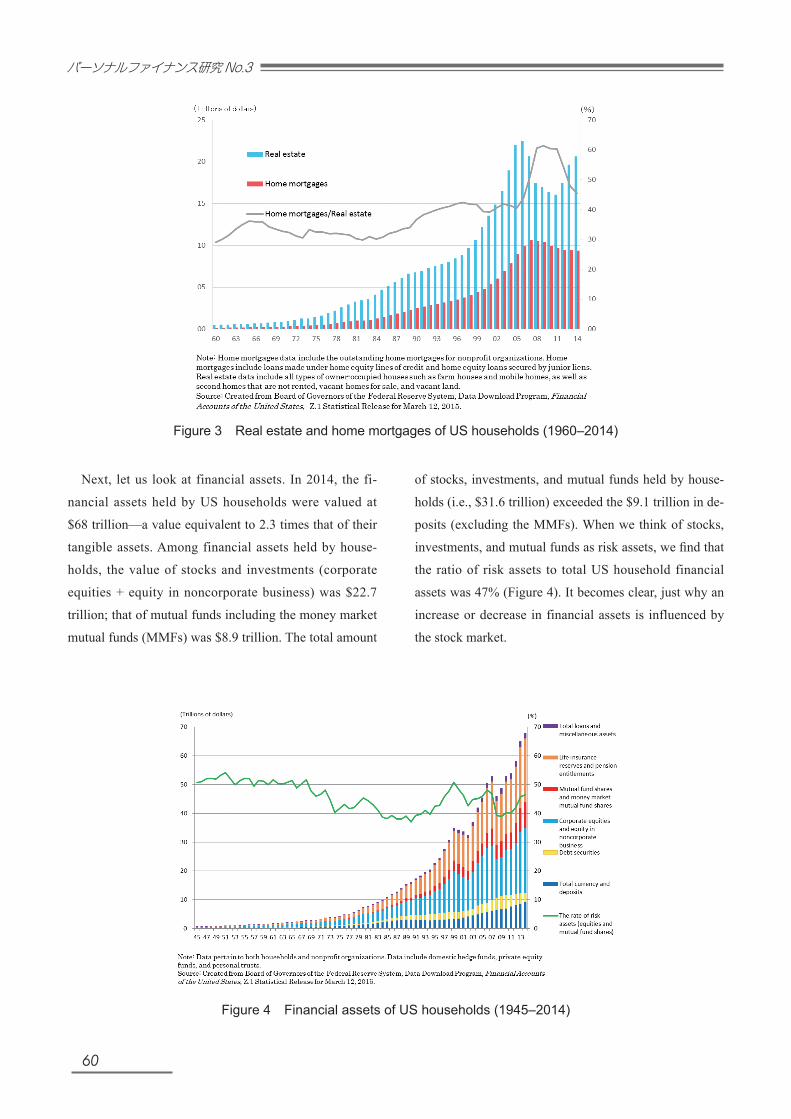
First, let us look at tangible assets. Real estate held by
US households in 2014 was valued at $20.6 trillion; in
fact, housing constitutes the majority of tangible assets
held by US households. The value of real estate held by
US households has continued to increase since the 1960s,
reaching a value of $22.5 trillion in 2006—the highest
such figure to date (Figure 3). The total value of real es-
tate has been in decline since 2007, and since 2011 has
again been on the rise (Figure 3). Since the late 1990s,
real estate prices have increased in line with increases in
the value of home mortgage loans. One should bear in
mind the fact that individuals in the United States buy
housing aggressively, by borrowing: the ratio of the value
of home mortgage loans to that of real estate, which had
been hovering at around 40% around 2006, has increased
rapidly since 2007, finally exceeding 60% during the
2008–2011 period (Figure 3). When real estate prices
began to fall in the late 2000s, the debt burden of US
households became very much apparent.
60
パーソナルファイナンス研究No.3
Figure 3 Real estate and home mortgages of US households (1960–2014)
Figure 4 Financial assets of US households (1945–2014)
Next, let us look at financial assets. In 2014, the fi-
nancial assets held by US households were valued at
$68 trillion—a value equivalent to 2.3 times that of their
tangible assets. Among financial assets held by house-
holds, the value of stocks and investments (corporate
equities + equity in noncorporate business) was $22.7
trillion; that of mutual funds including the money market
mutual funds (MMFs) was $8.9 trillion. The total amount
of stocks, investments, and mutual funds held by house-
holds (i.e., $31.6 trillion) exceeded the $9.1 trillion in de-
posits (excluding the MMFs). When we think of stocks,
investments, and mutual funds as risk assets, we find that
the ratio of risk assets to total US household financial
assets was 47% (Figure 4). It becomes clear, just why an
increase or decrease in financial assets is influenced by
the stock market.
61
The Financial Activities of Households, and US Financial Institutions
2. 4 US households’ asset holding and financial activities
One characteristic of modern US economy is that
households’ consumption activities closely relate to the
assets they hold. In what follows, I attempt to describe
this in terms of the housing and stock held by house-
holds.
Specific examples based on housing are home equity
loans. Statistically, home equity loans are considered
home mortgage loans, as they are secured by housing;
additionally, they are distinguished from consumer credit.
However, funds derived through home equity loans have
primarily been directed toward consumption, rather than
housing investments. There are two types of home equity
loan. One is the traditional loan, which is executed by
contract. The other one is the credit line (or open-ended
type), which can be used multiple times as needed, so
long as the balance remains within lending limits. As the
credit-line type involves borrowing on a revolving basis
and is accessed through an automated teller machine
(ATM), it is materially identical to a credit card. As the
payment of interest is deducted from taxable income in
the case of loans secured by housing, the actual interest
rate is suppressed significantly lower, relative to that for
consumer credit. For this reason, home equity loans are
frequently used as alternative means of consumer credit.
A specific example that is based on stock is securities
backed loans (security credit). In the United States, one
opportunity for individuals to access the equity invest-
ment market came in 1971, with the sale of money mar-
ket mutual funds (MMFs) by securities companies. The
sale of MMFs began to increase explosively with the ad-
vent of cash management accounts (CMAs), which were
developed in 1977 by Merrill Lynch in partnership with
Bank One of Columbus. At that point, individuals could
write checks and use credit cards attached to CMAs;
individuals were also able to receive loans as collateral
securities if the MMF balance were deemed insufficient
at the time of fund settlement. The security credit bal-
ance exceeded $200 billion in 1999, and exceeded $300
billion in 2007 and after 2011 (Table 2). Security credit
is not necessarily used to make securities investments:
today, it is used also to fund consumption. Since the
Gramm–Leach–Bliley (GLB) Act was enacted in 1999,
major securities companies have typically strengthened
the lending business by using deposits of subsidiary
banks. For example, Merrill Lynch has since 2000 incor-
porated the deposits of subsidiary banks into CMA, and
has induced short-term funds from MMFs to deposit cov-
ered by deposit insurance. Merrill Lynch also introduced
in April 2004 the multi-purpose account known as the
loan management account (LMA), which consolidates
more than one security credit. The purpose of introducing
this product was to extend comprehensive management
services to assets and liabilities at the individual level,
to encompass all of their financial assets and liabilities.
The state of the security credit market depends largely on
the price of securities, which are used as collateral. It is
possible for individuals to use security credit for short-
term borrowing, even if they have invested in securities
for long-term purposes. This is a characteristic of the US
market, and it proliferated among individual investors.
Receivers of consumer credit look to obtain credit, based
on future income, to fund consumption expenditures.
Individuals who have available-for-sale assets will find
it bankroll consumption by selling their assets. However,
even if it were necessary for individuals to borrow for
some reason, they can continue to hold assets and carry
out effective asset management by using their held assets
as borrowing collateral.9 As home equity loans are se-
cured by housing, and security credit by securities, both
can be statistically distinguished from consumer credit;
however, their purposes relate to consumption, and they
are also used similarly. We can consider home equity
loans and security credit as comprising consumer cred-
it—in the broad, modern sense—when we pay attention
to consumer credit and how it allows for intertemporal
consumption selection and contributes to the maximiza-
tion of utility among households and individuals. Indeed,
in modern times—at least in the United States—consum-
er credit has expanded while changing its format.
62
パーソナルファイナンス研究No.3
3. 1 US households and US commercial banks
US financial institutions have helped enhance finan-
cial transactions at the household level. For example, the
loan balance composition ratio of consumer lending (i.e.,
the total of consumer credit and home mortgage loans)
is higher than that of corporate lending by US commer-
cial banks.10 There is the factor that, within this context,
households have borrowed to raise funds and built up
their financial assets. US capital markets are well devel-
oped, and commercial banks have historically found it
difficult to expand corporate lending. Commercial banks
have been working to improve credit assessments and
develop financial instruments so as to expand loans made
to individuals; in recent years, those banks have followed
two processes to increase the loans made to households
and individuals.
One such process involves enlarging the circle of
lending target customers—that is, the extension of loans
to relatively low-creditworthy customers (e.g., subprime
loans). Some credit card companies in the United States
also offer loans to relatively low-creditworthy customers.
In the past, regulators have crafted separate regulations
with respect to subprime loans, but those regulations
have not stopped such large-scale problems as the 2008
financial crisis from occurring. Financial institutions need
a new mechanism by which to reduce their credit risk, if
they wish to extend loans to relatively low-creditworthy
individuals. Therefore subprime loans are being made
not only through credit cards, but also in a form collat-
eralized by housing. In the background, subprime loans
through credit cards were strictly regulated by regulators;
when extending loans to low-creditworthy individuals,
financial institutions have been focusing on house prices,
which have continuously increased since 2000.
The second process involved the extension of loan
collateral. Housing loans extended to low-creditworthy
individuals differ from traditional housing loans: in the
former, financial institutions put up as collateral future
increases in housing prices, rather than the present value
of a house. Additionally, home equity loans have also
been extended, based on the net assets of a house (=pres-
ent value of house – unpaid balance of the mortgages).
This serves also as an example of how loan collateral has
expanded.
3. 2 Bank loans and financing
Commercial banks have increased lending to individu-
als, in forms such as home mortgage loans and consumer
credit; they have also extended the loan period. The loan
period of home mortgages is long-term, and the loan pe-
riod of consumer credit, at least in the case of installment
credit, is usually more than one year. The loan period of
commercial banks increases as the composition ratio of
home mortgage loans and consumer credit increases, and
the increase in medium and long-term loans has created
liquidity problems among commercial banks.
The Housing and Urban Development Act of 1968 was
established in the United States, and on account of it, the
federal government has been found to support the secu-
ritization of home mortgage loans held by thrift institu-
tions.11 The Government National Mortgage Association
(GNMA) first issued MBSs in 1970. The Federal Home
Loan Mortgage Corporation (FHLMC) started in 1971
to issue pass-through securities where the monthly prin-
cipal and interest repayment of the mortgage was paid to
security holders. The use of securitization was required,
given the fact that financial institutions need to mitigate
the risk that comes with holding long-term loan receiv-
ables. Commercial banks began to use securitization in
the process of increasing consumer lending: the US home
mortgage loan market, for example, began to expand
rapidly through its use. As a result of the extensive use
of securitization, commercial banks now hold only in the
vicinity of 25% of all home mortgage balances (Table
3); on the other hand, government-sponsored enterprises
(GSEs) such as FNMA ((A) of Table 3) and agency and
GSE-backed mortgage pools ((B) of Table 3) hold the
majority of home mortgages.
3 US households and financial institution management
63
The Financial Activities of Households, and US Financial Institutions
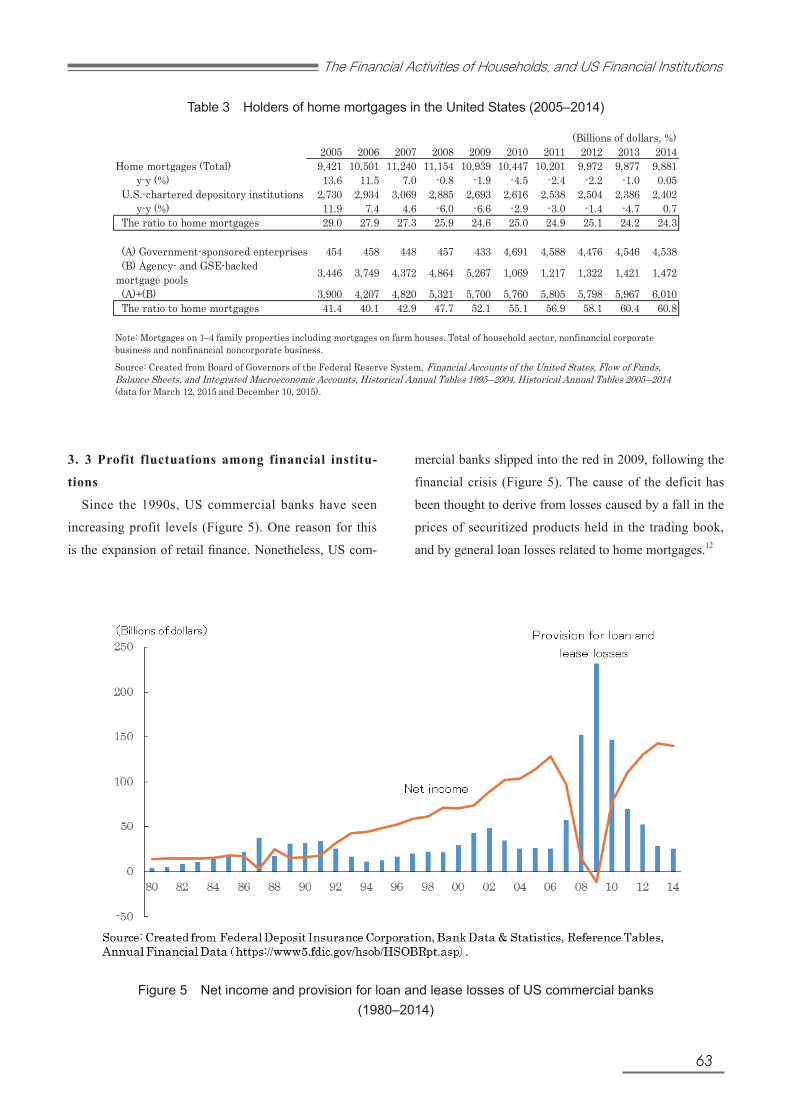
Table 3 Holders of home mortgages in the United States (2005–2014)
3. 3 Profit fluctuations among financial institu-
tions
Since the 1990s, US commercial banks have seen
increasing profit levels (Figure 5). One reason for this
is the expansion of retail finance. Nonetheless, US com-
mercial banks slipped into the red in 2009, following the
financial crisis (Figure 5). The cause of the deficit has
been thought to derive from losses caused by a fall in the
prices of securitized products held in the trading book,
and by general loan losses related to home mortgages.12
Figure 5 Net income and provision for loan and lease losses of US commercial banks (1980–2014)
13
commercial banks increases as the composition ratio of home mortgage loans and consumer credit increases, and the increase in medium and long-term loans has created liquidity problems among commercial banks. The Housing and Urban Development Act of 1968 was established in the United States, and on account of it, the federal government has been found to support the securitization of home mortgage loans held by thrift institutions11. The Government National Mortgage Association (GNMA) first issued MBSs in 1970. The Federal Home Loan Mortgage Corporation (FHLMC) started in 1971 to issue pass-through securities where the monthly principal and interest repayment of the mortgage was paid to security holders. The use of securitization was required, given the fact that financial institutions need to mitigate the risk that comes with holding long-term loan receivables. Commercial banks began to use securitization in the process of increasing consumer lending: the US home mortgage loan market, for example, began to expand rapidly through its use. As a result of the extensive use of securitization, commercial banks now hold only in the vicinity of 25% of all home mortgage balances (Table 3); on the other hand, government-sponsored enterprises (GSEs) such as FNMA ((A) of Table 3) and agency and GSE-backed mortgage pools ((B) of Table 3) hold the majority of home mortgages.
Table 3. Holders of home mortgages in the United States (2005–2014) (Billions of dollars, %)
2005 2006 2007 2008 2009 2010 2011 2012 2013 2014Home mortgages (Total) 9,421 10,501 11,240 11,154 10,939 10,447 10,201 9,972 9,877 9,881 y-y (%) 13.6 11.5 7.0 -0.8 -1.9 -4.5 -2.4 -2.2 -1.0 0.05 U.S.-chartered depository institutions 2,730 2,934 3,069 2,885 2,693 2,616 2,538 2,504 2,386 2,402 y-y (%) 11.9 7.4 4.6 -6.0 -6.6 -2.9 -3.0 -1.4 -4.7 0.7 The ratio to home mortgages 29.0 27.9 27.3 25.9 24.6 25.0 24.9 25.1 24.2 24.3
454 458 448 457 433 4,691 4,588 4,476 4,546 4,538 (B) Agency- and GSE-backedmortgage pools 3,446 3,749 4,372 4,864 5,267 1,069 1,217 1,322 1,421 1,472
(A)+(B) 3,900 4,207 4,820 5,321 5,700 5,760 5,805 5,798 5,967 6,010 The ratio to home mortgages 41.4 40.1 42.9 47.7 52.1 55.1 56.9 58.1 60.4 60.8
Source: Created from Board of Governors of the Federal Reserve System, Financial Accounts of the United States, Flow of Funds,Balance Sheets, and Integrated Macroeconomic Accounts, Historical Annual Tables 1995―2004, Historical Annual Tables 2005―2014(data for March 12, 2015 and December 10, 2015).
Table 3. Holders of home mortgages in the United States (2005-2014)
Note: Mortgages on 1–4 family properties including mortgages on farm houses. Total of household sector, nonfinancial corporatebusiness and nonfinancial noncorporate business.
3.3. Profit fluctuations among financial institutions Since the 1990s, US commercial banks have seen increasing profit levels (Figure 5). One reason for this is the expansion of retail finance. Nonetheless, US commercial
(A) Government-sponsored enterprises
64
パーソナルファイナンス研究No.3
As mentioned, commercial banks have used securiti-
zation in the process of increasing their home mortgage
loans. As a result of this, as mentioned, commercial
banks hold only roughly 25% of all home mortgage
balances. Commercial banks have also increased their
noninterest income by using securitization.13 Why, then,
have the profits of commercial banks deteriorated?
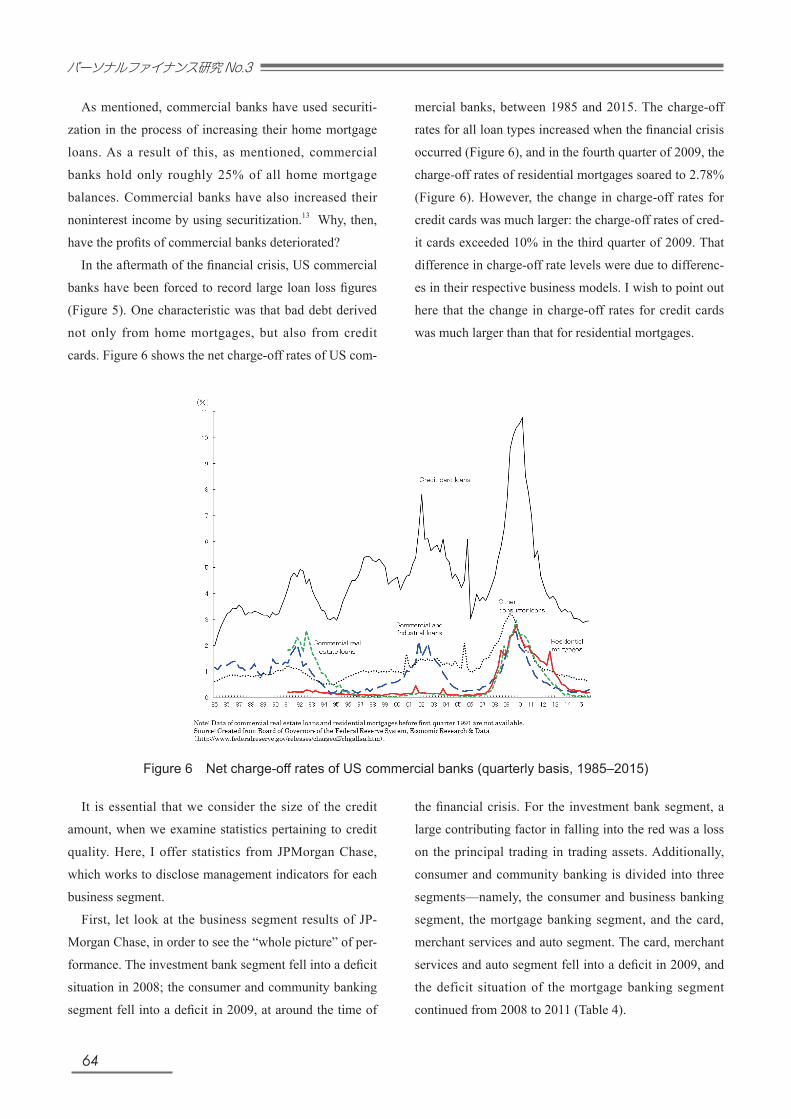
In the aftermath of the financial crisis, US commercial
banks have been forced to record large loan loss figures
(Figure 5). One characteristic was that bad debt derived
not only from home mortgages, but also from credit
cards. Figure 6 shows the net charge-off rates of US com-
mercial banks, between 1985 and 2015. The charge-off
rates for all loan types increased when the financial crisis
occurred (Figure 6), and in the fourth quarter of 2009, the
charge-off rates of residential mortgages soared to 2.78%
(Figure 6). However, the change in charge-off rates for
credit cards was much larger: the charge-off rates of cred-
it cards exceeded 10% in the third quarter of 2009. That
difference in charge-off rate levels were due to differenc-
es in their respective business models. I wish to point out
here that the change in charge-off rates for credit cards
was much larger than that for residential mortgages.
It is essential that we consider the size of the credit
amount, when we examine statistics pertaining to credit
quality. Here, I offer statistics from JPMorgan Chase,
which works to disclose management indicators for each
business segment.
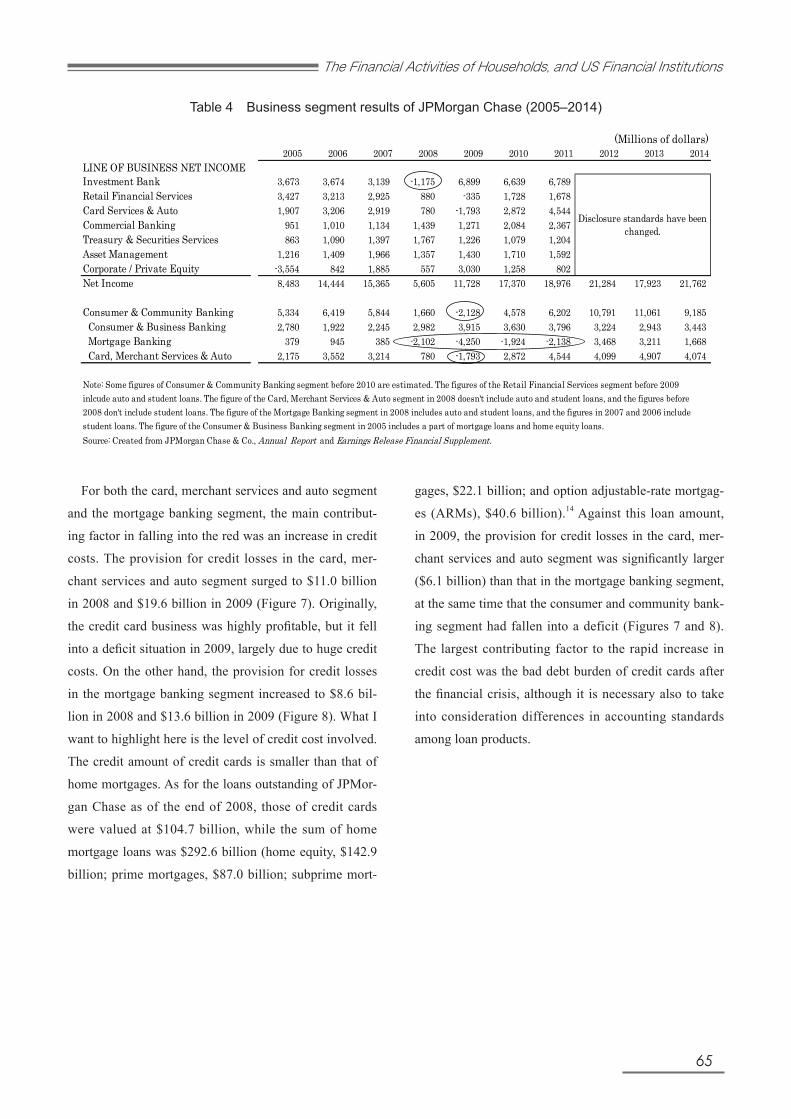
First, let look at the business segment results of JP-
Morgan Chase, in order to see the “whole picture” of per-
formance. The investment bank segment fell into a deficit
situation in 2008; the consumer and community banking
segment fell into a deficit in 2009, at around the time of
the financial crisis. For the investment bank segment, a
large contributing factor in falling into the red was a loss
on the principal trading in trading assets. Additionally,
consumer and community banking is divided into three
segments—namely, the consumer and business banking
segment, the mortgage banking segment, and the card,
merchant services and auto segment. The card, merchant
services and auto segment fell into a deficit in 2009, and
the deficit situation of the mortgage banking segment
continued from 2008 to 2011 (Table 4).
Figure 6 Net charge-off rates of US commercial banks (quarterly basis, 1985–2015)
65
The Financial Activities of Households, and US Financial Institutions
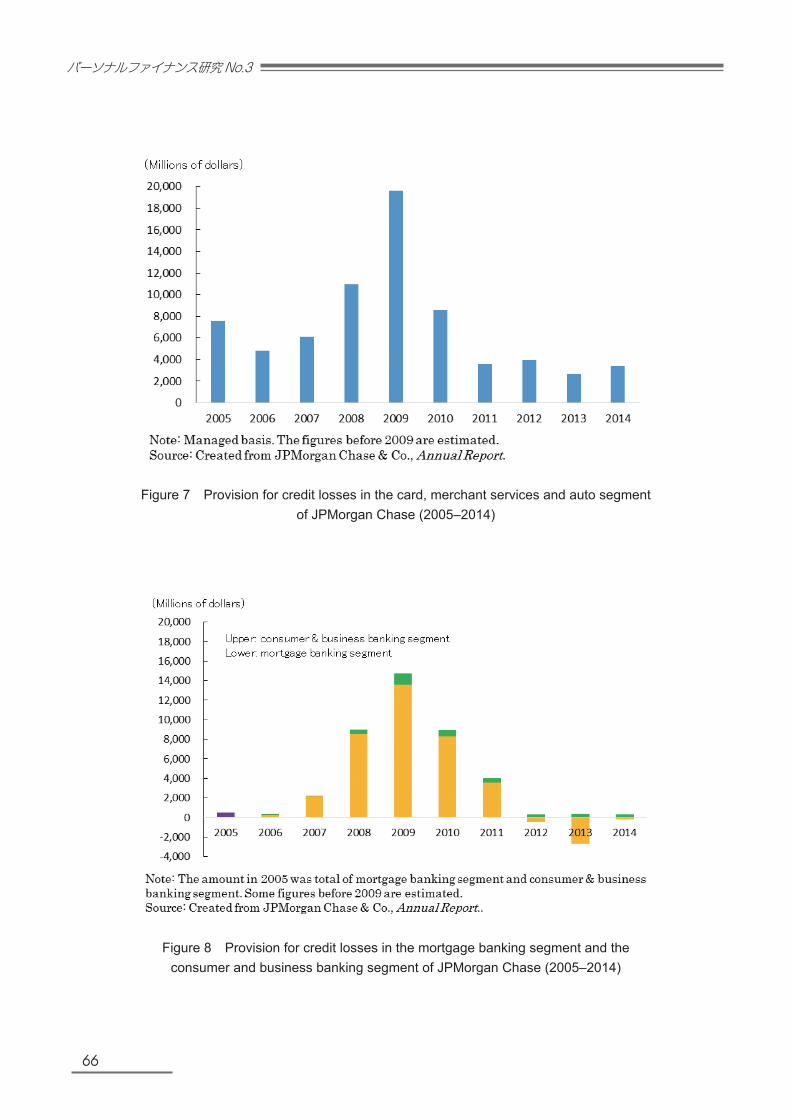
For both the card, merchant services and auto segment
and the mortgage banking segment, the main contribut-
ing factor in falling into the red was an increase in credit
costs. The provision for credit losses in the card, mer-
chant services and auto segment surged to $11.0 billion
in 2008 and $19.6 billion in 2009 (Figure 7). Originally,
the credit card business was highly profitable, but it fell
into a deficit situation in 2009, largely due to huge credit
costs. On the other hand, the provision for credit losses
in the mortgage banking segment increased to $8.6 bil-
lion in 2008 and $13.6 billion in 2009 (Figure 8). What I
want to highlight here is the level of credit cost involved.
The credit amount of credit cards is smaller than that of
home mortgages. As for the loans outstanding of JPMor-
gan Chase as of the end of 2008, those of credit cards
were valued at $104.7 billion, while the sum of home
mortgage loans was $292.6 billion (home equity, $142.9
billion; prime mortgages, $87.0 billion; subprime mort-
gages, $22.1 billion; and option adjustable-rate mortgag-
es (ARMs), $40.6 billion).14 Against this loan amount,
in 2009, the provision for credit losses in the card, mer-
chant services and auto segment was significantly larger
($6.1 billion) than that in the mortgage banking segment,
at the same time that the consumer and community bank-
ing segment had fallen into a deficit (Figures 7 and 8).
The largest contributing factor to the rapid increase in
credit cost was the bad debt burden of credit cards after
the financial crisis, although it is necessary also to take
into consideration differences in accounting standards
among loan products.
Table 4 Business segment results of JPMorgan Chase (2005–2014)
16
mortgage banking segment continued from 2008 to 2011 (Table 4).
Table 4. Business segment results of JPMorgan Chase (2005–2014) (Millions of dollars)
2005 2006 2007 2008 2009 2010 2011 2012 2013 2014LINE OF BUSINESS NET INCOMEInvestment Bank 3,673 3,674 3,139 -1,175 6,899 6,639 6,789Retail Financial Services 3,427 3,213 2,925 880 -335 1,728 1,678Card Services & Auto 1,907 3,206 2,919 780 -1,793 2,872 4,544Commercial Banking 951 1,010 1,134 1,439 1,271 2,084 2,367Treasury & Securities Services 863 1,090 1,397 1,767 1,226 1,079 1,204Asset Management 1,216 1,409 1,966 1,357 1,430 1,710 1,592Corporate / Private Equity -3,554 842 1,885 557 3,030 1,258 802Net Income 8,483 14,444 15,365 5,605 11,728 17,370 18,976 21,284 17,923 21,762
Consumer & Community Banking 5,334 6,419 5,844 1,660 -2,128 4,578 6,202 10,791 11,061 9,185 Consumer & Business Banking 2,780 1,922 2,245 2,982 3,915 3,630 3,796 3,224 2,943 3,443 Mortgage Banking 379 945 385 -2,102 -4,250 -1,924 -2,138 3,468 3,211 1,668 Card, Merchant Services & Auto 2,175 3,552 3,214 780 -1,793 2,872 4,544 4,099 4,907 4,074
Source: Created from JPMorgan Chase & Co., Annual Report and Earnings Release Financial Supplement.
Disclosure standards have beenchanged.
Note: Some figures of Consumer & Community Banking segment before 2010 are estimated. The figures of the Retail Financial Services segment before 2009inlcude auto and student loans. The figure of the Card, Merchant Services & Auto segment in 2008 doesn't include auto and student loans, and the figures before2008 don't include student loans. The figure of the Mortgage Banking segment in 2008 includes auto and student loans, and the figures in 2007 and 2006 includestudent loans. The figure of the Consumer & Business Banking segment in 2005 includes a part of mortgage loans and home equity loans.
For both the card, merchant services and auto segment and the mortgage banking segment, the main contributing factor in falling into the red was an increase in credit costs. The provision for credit losses in the card, merchant services and auto segment surged to $11.0 billion in 2008 and $19.6 billion in 2009 (Figure 7). Originally, the credit card business was highly profitable, but it fell into a deficit situation in 2009, largely due to huge credit costs. On the other hand, the provision for credit losses in the mortgage banking segment increased to $8.6 billion in 2008 and $13.6 billion in 2009 (Figure 8). What I want to highlight here is the level of credit cost involved. The credit amount of credit cards is smaller than that of home mortgages. As for the loans outstanding of JPMorgan Chase as of the end of 2008, those of credit cards were valued at $104.7 billion, while the sum of home mortgage loans was $292.6 billion (home equity, $142.9 billion; prime mortgages, $87.0 billion; subprime mortgages, $22.1 billion; and option adjustable-rate mortgages (ARMs), $40.6 billion)14. Against this loan amount, in 2009, the provision for credit losses in the card, merchant services and auto segment was significantly larger ($6.1 billion) than that in the mortgage banking segment, at the same time that the consumer and community banking segment had fallen into a deficit (Figures 7 and 8). The largest contributing factor to the rapid increase in credit cost was the bad debt burden of credit cards after the financial crisis, although it is necessary also to take into consideration differences in accounting standards among loan products.
66
パーソナルファイナンス研究No.3
Figure 7 Provision for credit losses in the card, merchant services and auto segment of JPMorgan Chase (2005–2014)
Figure 8 Provision for credit losses in the mortgage banking segment and the consumer and business banking segment of JPMorgan Chase (2005–2014)
67
The Financial Activities of Households, and US Financial Institutions
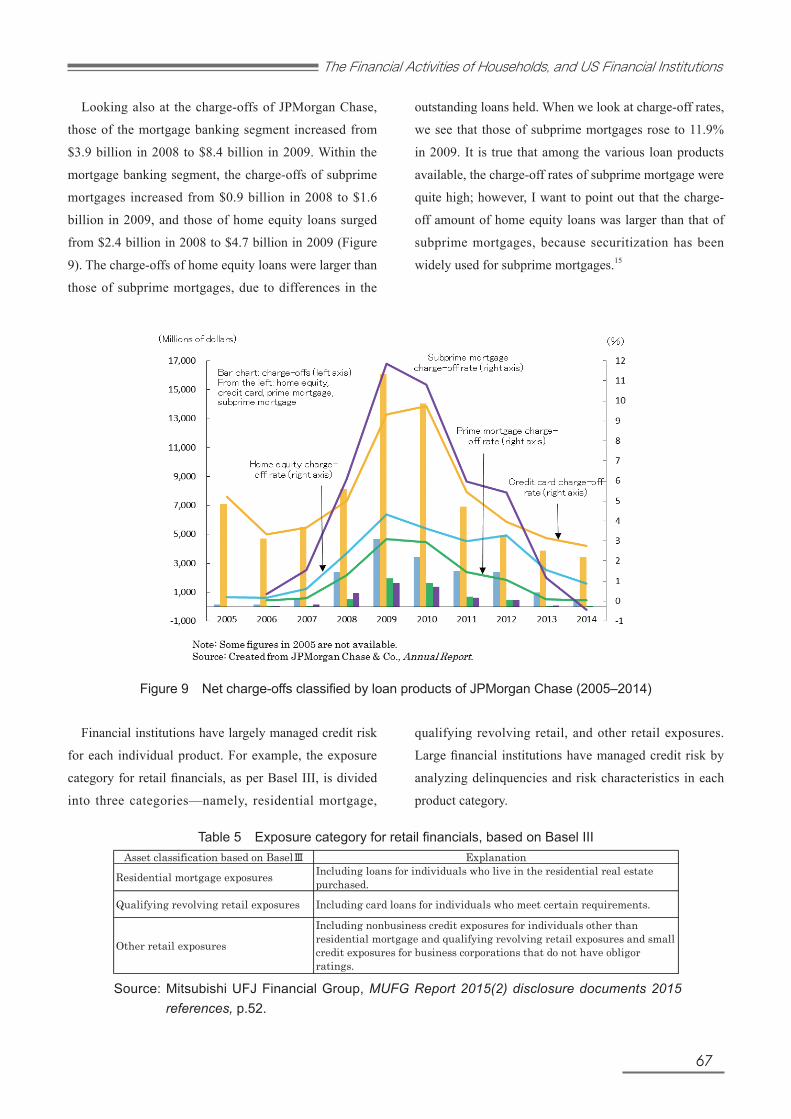
Figure 9 Net charge-offs classified by loan products of JPMorgan Chase (2005–2014)
Source: Mitsubishi UFJ Financial Group, MUFG Report 2015(2) disclosure documents 2015 references, p.52.
Looking also at the charge-offs of JPMorgan Chase,
those of the mortgage banking segment increased from
$3.9 billion in 2008 to $8.4 billion in 2009. Within the
mortgage banking segment, the charge-offs of subprime
mortgages increased from $0.9 billion in 2008 to $1.6
billion in 2009, and those of home equity loans surged
from $2.4 billion in 2008 to $4.7 billion in 2009 (Figure
9). The charge-offs of home equity loans were larger than
those of subprime mortgages, due to differences in the
outstanding loans held. When we look at charge-off rates,
we see that those of subprime mortgages rose to 11.9%
in 2009. It is true that among the various loan products
available, the charge-off rates of subprime mortgage were
quite high; however, I want to point out that the charge-
off amount of home equity loans was larger than that of
subprime mortgages, because securitization has been
widely used for subprime mortgages.15
Financial institutions have largely managed credit risk
for each individual product. For example, the exposure
category for retail financials, as per Basel III, is divided
into three categories—namely, residential mortgage,
qualifying revolving retail, and other retail exposures.
Large financial institutions have managed credit risk by
analyzing delinquencies and risk characteristics in each
product category.
Table 5 Exposure category for retail financials, based on Basel III
19
Table 5. Exposure category for retail financials, based on Basel III
Asset classification based on BaselⅢ Explanation
Residential mortgage exposures Including loans for individuals who live in the residential real estatepurchased.
Qualifying revolving retail exposures Including card loans for individuals who meet certain requirements.
Other retail exposures
Including nonbusiness credit exposures for individuals other thanresidential mortgage and qualifying revolving retail exposures and smallcredit exposures for business corporations that do not have obligorratings.
Source: Mitsubishi UFJ Financial Group, MUFG Report 2015 (2 )disclosure documents 2015 references , p.52. However, the increased credit risk in home mortgages—due largely to the decline in housing prices—affected the credit risk in credit cards; credit costs then sharply increased at the time of the financial crisis. A larger amount of charge-offs has occurred in home equity loans than in subprime loans within total home mortgage loans, as households and individuals holding mortgages also concurrently use credit cards and home equity loans. As has been described in this paper, US financial institutions expanded financial transactions at the household level, all while developing new financial products. Credit risk management has differed between home mortgage loans secured by housing, and unsecured credit cards; however, those product borrowers are single individuals. Financial institutions’ means of risk management may become insufficient when they are applied to financial products and business segments as per usual. The management of financial institutions tends to be affected more by the financial activities of households as households expand their financial transactions. I believe financial institutions are facing a need for integrated risk management, in terms of the financial transactions of households and individuals. I also believe that discussion on this point will lead to a reconsideration of the significance of financial services; this will compel us to look at both the assets and liabilities of households and individuals. It is essential that financial institutions further develop management techniques with respect to retail financial services, especially in the aftermath of the financial crisis. 4. Conclusion Financial institutions make economic activity more dynamic, chiefly by offering loans and extending consumer-spending opportunities to a larger circle of households and individuals, including relatively low-creditworthy customers. More individuals who are given credit opportunities should naturally behave to increase their personal utility; nevertheless, individuals may face difficulties when confronting a level of debt that
68
パーソナルファイナンス研究No.3
However, the increased credit risk in home mortgages—
due largely to the decline in housing prices—affected the
credit risk in credit cards; credit costs then sharply increased
at the time of the financial crisis. A larger amount of charge-
offs has occurred in home equity loans than in subprime
loans within total home mortgage loans, as households
and individuals holding mortgages also concurrently use
credit cards and home equity loans. As has been described
in this paper, US financial institutions expanded financial
transactions at the household level, all while developing
new financial products. Credit risk management has differed
between home mortgage loans secured by housing, and
unsecured credit cards; however, those product borrowers
are single individuals. Financial institutions’ means of
risk management may become insufficient when they are
applied to financial products and business segments as per
usual. The management of financial institutions tends to be
affected more by the financial activities of households as
households expand their financial transactions.
I believe financial institutions are facing a need for
integrated risk management, in terms of the financial
transactions of households and individuals. I also believe
that discussion on this point will lead to a reconsideration
of the significance of financial services; this will compel
us to look at both the assets and liabilities of households
and individuals. It is essential that financial institutions
further develop management techniques with respect to
retail financial services, especially in the aftermath of the
financial crisis.
Financial institutions make economic activity more dy-
namic, chiefly by offering loans and extending consum-
er-spending opportunities to a larger circle of households
and individuals, including relatively low-creditworthy
customers. More individuals who are given credit oppor-
tunities should naturally behave to increase their personal
utility; nevertheless, individuals may face difficulties
when confronting a level of debt that exceeds their ability
to repay, if that credit provision is excessive.
Financial institutions do not make loans in consideration
of their own bad debt. However, one of the contributing
factors of the current financial crisis is that financial in-
stitutions are inclined to make certain financial transac-
tions accessible to households and individuals, all in an
attempt to derive greater profits. Global financial institu-
tions have been limited in terms of their scale and scope
of business, by virtue of growing regulation; however,
severe regulation will change the behavior of those fi-
nancial institutions, as they search out their next revenue
source. Financial institutions need to assume the risk re-
lated to obtaining profits; the current financial crisis has
raised the issue of where to find the source of risk taking
and revenue inherent in financial institutions at the micro
level.
*On proceeding with this study, I received a 2013 re-
search grant from Japan Academy of Personal Finance. I
would like to thank all concerned.
4 Conclusion
69
The Financial Activities of Households, and US Financial Institutions
【Notes】
1 Please refer to Maeda, 2014, chapter 5.2 For example, large Japanese financial institu-
tions—such as Mitsubishi UFJ Financial Group,
Sumitomo Mitsui Financial Group, and Mizuho
Financial Group—fell into a consolidated deficit
position in fiscal year 2008.3 In the United States, Federal Housing Adminis-
tration (FHA) insurance was introduced in 1934
to offer public insurance with respect to principal
and interest payments on home mortgage loans.4 The Government National Mortgage Associa-
tion issued the first Mortgage Backed Securities
(MBSs), in 1970. Please refer to Maeda, 2004,
chapter 5.5 In the United States, housing loans have been re-
ferred to as home mortgage loans. 6 Please refer to Maeda, 2014, pp.121–123.7 In the United States, the correlation between du-
rable goods consumption expenditures and con-
sumer credit is high. Please refer to Maeda, 2014,
pp.35–38.8 According to a 2007 paper co-authored by FRB
Greenspan and economists, finances backed by
housing are estimated to have increased personal
consumption expenditures by an annual average
of 1.1% between 1991 and 2000, and by an annu-
al average of 3% between 2001 and 2005 (Green-
span and Kennedy, 2007, p.10).9 In the case of holding assets, if the asset value
increases, the individual is considered to have
consumed more, even when personal income re-
mains unchanged. The effect of the size asset on
consumption expenditures is known as the wealth
effect.10 Please refer to Maeda, 2014, chapter 4, section 3.11 Please refer to Maeda, 2004, p.135.12 As for the cause of the financial crisis, please
refer to Japan Society of Monetary Economics,
2013, chapter 4.
13 Please refer to Maeda, 2014, pp.200–202.14 Please refer to JPMorgan Chase & Co., 2010,
p.69.15 About 75% of the total loan amount of the sub-
prime mortgage loans had been securitized.
Please refer to the International Monetary Fund,
2008, p.59.
【References】
Allen, Franklin and Douglas Gale (2004). “Financial
Fragility, Liquidity, and Asset Prices,” Journal of
the European Economic Association, 2(6), 1015-
1048.
Brunnermeier, Markus K. and Lasse Heje Pedersen
(2009). “Market Liquidity and Funding Liquid-
ity,” Review of Financial Studies, 22(6), 2201-
2238.
Diamond, Douglas W. and Philip H. Dybvig (1983).
“Bank Runs, Deposit Insurance, and Liquidity,”
Journal of Political Economy, 91(3), 401-419.
Diamond, Douglas W. and Raghuram G. Rajan (2005).
“Liquidity Shortages and Banking Crises,” Jour-
nal of Finance, 60(2), 615-647.
Diamond, Douglas W. and Raghuram Rajan (2009). “The
Credit Crisis: Conjectures about Causes and Rem-
edies,” NBER Working Paper, No.14739.
Diamond, Douglas W. and Raghuram G. Rajan (2001).
“Liquidity Risk, Liquidity Creation, and Financial
Fragility: A Theory of Banking,” Journal of Polit-
ical Economy, 109(2), 287-327.
Financial Crisis Inquiry Commission (2011).The Finan-
cial Crisis Inquiry Report: Final Report of the
National Commission on the Causes of the Fi-
nancial and Economic Crisis in the United States,
Official Government Edition, United States of
America.
Greenspan, Alan and James Kennedy (2007). “Sourc-
es and Uses of Equity Extracted from Homes,”
Finance and Economics Discussion Series, Di-
visions of Research & Statistics and Monetary
70
パーソナルファイナンス研究No.3
Affairs, Federal Reserve Board, Washington, D.C.
Hector, Gary (1988). Breaking The Bank: The Decline of
BankAmerica, Little Brown and Company.
Hirtle, Beverly J. and Kevin J. Stiroh (2005). “The
Return to Retail and the Performance of U.S.
Banks,” Federal Reserve Bank of New York Staff
Reports, No.233, 1-37.
Imura, Shinya (2002). Evolution of the American Hous-
ing Finance System, University of Tokyo Press.
(originally written in Japanese)
International Monetary Fund (2008). Global Financial
Stability Report, Containing Systemic Risks and
Restoring Financial Soundness, World Economic
and Financial Surveys, International Monetary
Fund.
Japan Securities Research Institute (2013). Securities
Market in the USA 2013, Japan Securities Re-
search Institute. (originally written in Japanese)
Japan Society of Monetary Economics (2013). Review
of Monetary and Financial Studies, Special Issue
January 2013, Why Financial Crises Occur?:
Frontiers of Monetary and Financial Studies, Ja-
pan Society of Monetary Economics. (originally
written in Japanese)
JPMorgan Chase & Co. (2010). Annual Report 2009.
Maeda, Shinichiro (2004). Successful Retail Strategies
for Financial Services Companies, Toyo Keizai
Inc. (originally written in Japanese)
Maeda, Shinichiro (2014). A Study of Retail Finance
in the United States: Historical Development in
Consumer Credit, Nippon Hyoron Sha Co., Ltd.
(originally written in Japanese)
McDonald, Larry and Patrick Robinson (2009). A Co-
lossal Failure of Common Sense: The Incredible
Inside Story of the Collapse of Lehman Brothers,
Crown Business.
Mian, Atif and Amir Sufi (2014). House of Debt: How
They (and You) Caused the Great Recession, and
How We Can Prevent It from Happening Again,
The University of Chicago Press.
Minsky, Hyman P. (1986). Stabilizing an Unstable Econ-
omy, Yale University Press.
Wolfson, Martin H. (1994). Financial Crises: Under-
standing the Postwar U.S. Experience, Second
Edition, M.E. Sharpe Inc., New York.
Accepted: 31 October 2016