Embed Size (px)
Citation preview

1
The finance-welfare state nexus EDDIE GERBA AND WALTRAUD SCHELKLE
Paper for EILS, 12 March 2013
Please note: this paper presents very preliminary results and they should be taken as such.
Abstract: Comparative welfare state research focuses on labour markets and has largely neglected
financial markets. This paper explores what hypotheses comparative welfare state research entails
regarding the relationship between welfare state and financial development. Do generous welfare
states replace household finance as a source of social security or do they actually help retail financial
markets to flourish by allowing them to piggy-back on public provisions or by providing universal
income security? The answer is relevant for the question of whether the restructuring of welfare
states since the mid-1980s contributed to the most severe crisis in the post-war era, for instance by
enlisting financial markets in the provision of income security for households and thus exposing
them to high risks. In this paper, we propose a systematic way of assessing the relationship between
provisions of financial markets and public welfare, using structural vector auto-regression. We spell
out the causal mechanisms that can account for a substitutive or complementary relationship and
then see whether advanced econometric techniques find evidence for the existence of either of
these mechanisms. Our preliminary results make us confident that a causal link runs from public
social spending to private social spending and life insurance markets. And there is arguably a
complementary relationship between public welfare and private finance in the five OECD countries
we analyze.
Introduction This is an explorative paper on a potential research programme, not a paper with a well-defined
puzzle. We start from the observation that comparative welfare state research has largely neglected
financial markets and focused on the social safety nets around the employment relationship. In turn,
financial market research has largely neglected the welfare state even though private welfare
institutions, such as pension funds and life insurers, are big financial players. We bring the two
strands together as this allows us to re-examine our theories about the welfare state, on the one
hand, and to study the effects of financial markets on households’ social security, on the other.
The turmoil in financial markets since 2007 has reminded us how important this nexus is. Take old-
age security of households with private pension wealth: as stock markets plunged in 2008-09, the
assets of pension funds fell by about 15% in OECD countries (weighted average) and anyone who
retired in these two years was at risk of their annuity incomes being significantly reduced.1 Those
who will retire in the coming decade will be hit by low interest rates in the aftermath of the crisis:
£100,000 worth of savings convert into an annuity of £5,000 now, while the same amount of savings
generated an annual income of £15,000 twenty years ago. Both risks, one related to the retirement
date and the other to the rate of return to pension savings, are concrete example for the down-side
1 In practice, governments often suspended rules that would have forced retirees to turn their (tax-subsidised)
pension fund savings immediately into an annuity and thus realise large losses (ref#).

2
risks that financial markets entail; risks that for the living standard of middle-class households may
be more significant than those from labour markets.
At the same time, it is hardly possible to stay away from financial markets as they provide
households with saving vehicles, insurance products and credit that can smooth consumption – just
as the welfare state does. And it is conceivable that financial market provisions will become even
more relevant over the next decades as overstretched public finances make governments go for
basic income support rather than the insurance of living standards, a trend that is already discernible
in welfare state reforms.
The outline of our paper is as follows: in the next section, we infer from political and economic
theories of the welfare state what they implicitly assume about the relationship to financial markets.
Then we explain our empirical strategy, focusing on the causal mechanisms we assume in the model.
In the fourth section we present first findings from an analysis based on structural vector auto-
regressions. The conclusions outline where we would like to go from here.
Two views of the finance-welfare state nexus2 The relationship between public welfare and private finance has been explicitly discussed in the
welfare state literature at least once, for the specific case of pensions and housing finance. Kemeny
(1980) and Castles (1998) were the protagonists in a debate on why the prevalence of
homeownership may be associated with a small welfare state, especially low public pensions.
Kemeny made taxpayers’ resistance responsible for lean pension provisions, ie where
homeownership is high, indebted households of working age resent being taxed for generous social
spending (see also Ansell 2011). Castles, by contrast, argued that the ‘big tradeoff’ results from the
fact that a weak welfare state provides incentives for homeownership as a nest-egg. In other words,
homeownership can act as the equivalent of a social insurance mechanism (see also Conley and
Gifford 2006). While these two authors disagreed on the exact motivation of this relationship, they
agreed that private finance substitutes for public welfare and vice versa.
This debate ties in with the mainstream of comparative welfare state research. In the tradition of
Karl Polanyi’s Great Transformation, Gøsta Esping-Andersen conceptualised all public welfare as
‘decommodifying’ labour by replacing earnings with income and in-kind transfers (Esping-Andersen
1990: 3). Decommodification extends logically to financial markets: insofar non-market income
replaces earnings in the case of incapacity or unemployment, workers and their dependants have
also no need to take recourse to savings, debt or private insurance. This more or less generous
substitution of markets by the welfare state is ultimately the outcome of a political struggle of
labour for protection from the vagaries of the capitalist economy (Iversen 2006).
In this political conceptualization of a substitutive relationship, the Polanyite tradition in welfare
state research is backed by the old mainstream in welfare economics, from Pigou’s Economics of
Welfare (1920) to Okun’s big tradeoff between equity and efficiency (1975). Welfare economists in
this tradition agree that redistribution must be pursued against the tendency of market forces to
settle for income maximizing but inequitable outcomes. In financial markets, this means that low-
income or marginally employed individuals are excluded from access to credit, that homeownership
2 Schelkle (2012a) elaborates further on these two views of the welfare state but not with reference to the
finance nexus.

3
is out of reach for most households and that women get considerably lower annuities from their
insurance companies. Policymakers who want to correct for these inequities must be prepared to
forego aggregate income by taxing the well-off in order to compensate for these inequities.
Despite these overwhelming arguments for substitution, there is also a relevant strand in welfare
state research that implies complementarity between public welfare and private finance. We can
discern a pessimistic-political and an optimistic-economic view of this nexus. The pessimistic version
goes back to Richard Titmuss (1958) who had great reservations against the notion of a ‘welfare
state’, not only because of its teleological undercurrent, but also because the term concealed state
patronage of special interests. 3 He singled out the interests attached to ‘occupational welfare’, ie all
employment related benefits, and professionals in social services themselves. In both cases, special
interests push for an extension of the welfare state and market provisions for social purposes like
private health insurance and pension plans through tax-subsidies. The increasing influence of
financial interests should give the concomitant development of welfare states and financial markets
a new impetus. The work of Howard (1997) and Hacker (2004) on the ‘hidden welfare state’,
specifically the privatization of risk in old-age security and health care with the help of tax
expenditures, belongs to this tradition.4
A more optimistic version of a complementary relationship can be found in the new economics of
the welfare state that rationalizes social policy systematically as ways of correcting market failure
(Barr 1992, 2012). Competition in areas of health, pensions or insurance is actually self-defeating,
with less coverage and less income generation in its wake. But in the presence of public
interventions that rein in exploitation, exclusion and opportunistic behaviour, financial markets may
flourish and at the same time satisfy individual and collective needs.5 Lindert (2003) popularized the
message by noting that the ‘welfare state looks like a free lunch’, achieving both equity and
efficiency. His solution to the puzzle is that contestation among interest groups and electoral politics
provide a check on overly generous benefits that favour predominantly certain groups. This leads,
on average and in the long run, to welfare states, which exploit the spectrum of policies not subject
to the big tradeoff between equity and efficiency.
Even the most optimistic new welfare economist would admit, however, that substitution may result
from households’ budget constraints. If social insurance is quite high and raised further, there may
be little room for private pensions or private health insurance until the efficiency gains feed into
higher net incomes. This will prove relevant for the interpretation of our results.
A third possibility is that there is no predictable connection between public welfare and private
finance. Rising income may be the omitted variable that drives both the development of the welfare
state and of financial markets but at different speeds and time horizons. Moreover, the causalities
may run in both directions: big welfare states may crowd out finance where they were established
before the Big Bang in the 1980s. Or strong financial services, including those of households invested
3 In this, he can be seen as a predecessor of the new politics of welfare (Pierson 2001) in that he stressed that
social policy creates its own stakeholders. 4 Esping-Andersen (1990:92-94) conceded what was a ‘paradox’ of commodification along with
decommodification in pensions to him, namely governments having built up public systems while they also promoted private provisions. 5 The relatively new and burgeoning strand in behavioural financial economics that studies households
supports this message for minorities of poor, unsophisticated or naïve investors (Campbell 2006).

4
in the service, may prevent public offers from developing beyond a minimal level because a strong
industry lobby and a private ownership ideology oppose them. Our empirical research design can
uncover this third possibility of no significant relationship between welfare and finance as well as
feedback effects.
Empirical strategy This section first explains why we use the econometric technique of structural vector auto-
regression (SVAR), then which causal mechanisms between public welfare and private finance we
assume and finally which data we use. This section can be skipped as the next section on the findings
is self-contained; but those who are mildly interested can rest assured that we keep it as non-
technical as possible.
The structural VAR’s methodology6
VAR models are used if one wants to estimate time series that are interrelated by more than just
time, so they are, in principle, correlated in more than a random way. Structural is a characterization
in contrast to ‘behavioural’ and refers to the fact that these time series of variables may be related
to each other as in a simultaneous equation model, so that we could predict the effect of an
exogenous change (an ‘intervention’) on all variables at once through the system of equations. In
contrast to simultaneous equation models, however, SVARs allow us to be agnostic as to which
behaviour exactly generates this systematic and predictable relationship between series of variables.
This does not mean that SVAR is inductive. We should use (political-)economic theory for why we
assume certain relationships between these variables even if we do not know the functional form.
SVARs are post-Lucas critique in the sense that one assumes that a shock can affect all variables
(notably because the change was expected), rather than assume that such a change affects only a
subset of variables directly and deterministically.
The first go at the data, the VAR estimates, allows us to find out whether there is a more than
random relationship between the time series of variables. This relationship can itself change over
time, ie analogous to a dynamic simultaneous equation model but without all the problems that
dynamic simultaneous equation models run into, such as complex modelling and/or simplistic
assumptions. This possible change over a horizon of 10 periods7 is revealed, on the one hand, by the
variance decomposition in which we look at how much of the variance of a variable (such as private
credit given by banks) is driven or explained by the variance of the other variables in the model (we
are particularly interested in welfare state variables). Since we do this for all variables, we can also
capture feedback effects (for instance whether variance in a welfare state variable is explained by
private social spending or a financial market variable). On the other hand, we look at impulse
responses which we get when all but the variable under consideration (say life insurance premia) are
shocked by 1%. The results can be read like elasticities (ie the percentage change of a dependent
variable in response to a 1% change in the independent variable). We can also infer whether the
impulse response of the financial market variable to a shock in the welfare state variable is negative
or positive, thus revealing the substitutive or complementary relationship, respectively, that we are
after.
6 The following has benefitted from Sims (2002).
7 Since we use annual data this amounts to a time horizon of ten years which is rather long for VAR estimates.

5
The theoretical assumptions in our model The ordering of the variables in a VAR(p) is crucial since it establishes the order of causality (or
structure) in the economy, ie the theory underpinning the estimation. The first variable is assumed
to determine the second and all subsequent variables, the second the third and all subsequent and
so on. At the same time, the flexibility of the model also accommodates for feedback effects so that
the second variable can have contemporary effects on the first, the third can have feedback effects
on the first and second variables etc.
Our model consists of the following ordering (all six series of variables are measured in natural
logs)8:
Public social spending per capita Taxes (incl. social security contributions) per capita
Output per capita Private social spending per capita average annual earnings
Ratio of life insurance to non-life insurance premia
We think this captures the line of reasoning in old and new welfare economics and can be supported
with political considerations, indicated above. We start with two fiscal variables, public social
spending and (redistributive) taxes. The ordering implies that we assume governments determine
their desired level of spending first and raise revenue in line with their spending plans. The two
welfare state variables then determine private sector variables, such as GDP, private spending on
social purposes such as health and pensions9 and average earnings. The fiscal variables can affect
output negatively (the neoclassical distortionary-taxation story) or positively (the New Keynesian
market-failure-amended story).10 Output, or value added in production determines private social
spending11 because of households’ budget constraint. This determines average earnings, we assume
because wage and salary earners ask for a take home pay that covers their spending on major items
of social safety. The financial market variable we chose is a measure of insurance premia: spending
on life insurance as a form of saving for old age. Private survivor benefit should rise with income as it
is increasing with relative affluence of households and society as a whole (Engel’s Law).12
When would in particular gross public social spending, the first variable in the causal chain of our
model, be substitutive or complementary to spending on life insurance, the financial market variable
at the end of the chain?
Substitution is to be expected in a neoclassical economic reading of the model. Distortionary
taxes to finance (higher) public social expenditure then has a negative effect on output and
lower value added depresses the ability to spend privately along with earnings; hence,
households face a tighter budget constraint for their demand of insurance services. The
substitution story could also be explained more directly by the possibility of contracting out,
8 More specifications are available upon request. We here report only the most significant results.
9 We explain this interesting variable in the next sub-section on data issues.
10 The advantage of this ordering is that we do not have to decide which story holds since the model allows for
either. Impulse responses could in principle detect which one makes more sense but we are not interested in neoclassical v New Keynesian economics here. 11
Our indicator is voluntary and mandatory private spending. 12
The use of a ratio works best in a technical sense because it increases the size of the variable compared to the others and scales it in a way that controls for the different sizes of insurance markets in different countries (presumably, where life insurance markets are big, non-life insurance markets are big and vice versa).

6
ie when governments offer individuals to take a private alternative to the public service.
Examples for such substitution through contracting out are pensions in the UK or health
insurance in Germany. The opposite movement of public and private social spending is
expected to be more pronounced in a neoclassical reading of the model, as the private
alternatives tend to be less redistributive and hence more efficient.
Complementarity between public spending and private finance could be rationalised by
pointing out that public social spending may increase output by making markets function
better, in fact make some market provisions at all possible (through co-insurance or income
maintenance that ensures households honouring their contracts). As security is a luxury
good, households will spend part of the additional income on more tailored private services,
like tuition for their children or supplementary health care insurance. This stimulus to
demand will increase earnings and sales of insurance. There is also a direct link, namely
when public welfare insures individually catastrophic risk while private insurance covers
standard risk, a division of responsibilities that is for instance proposed for long-term care
for which households have to pay only up to an insurable maximum amount.13 The public
spending on care for the elderly would thus stimulate private spending on care insurance.
We run this model for five countries with reasonably good data: Canada as our benchmark non-
European country, France, Germany, the Netherlands and Spain. They represent, ex ante, a diverse
set of constellations as regards to welfare state size and the relevance of financial markets for their
economies and households in particular.
Data issues and country cases
The relationship between finance and social welfare has received much less scholarly attention than
the connection between finance and growth (Levine 2005). Hence, the limited data availability is a
real issue, for instance there exists no data reaching back to the early 1980s on pension assets or
mortgage credit. However, this is changing. The ECB is building up a database on household debt
that it keeps under wraps so far. The World Bank collects and publishes time series indicators of
financial development (Beck et al 2010) although they relate largely to corporate finance. The OECD
has detailed and more meaningful data on social expenditure (Adema et al 2011). Other data
sources include the IMF and Reuter’s EcoWin, in particular for advanced economies that are our
focus.
As a consequence, our country case studies had to be selected not least on the basis of data
availability. Notably, this excluded Scandinavian countries. How do our countries compare with
respect to our key variables, public and private social spending? The OECD provides a number of
measures on the size of welfare states, among them the most widely used, gross public social
expenditure on both cash transfers and services. This measure does not include benefits that are
distributed through the tax system, ie the various forms of tax breaks for social purposes such as
saving for old age or buying child care. Being a gross, ie before tax, measure, it also leaves out that
benefits can be taxed and that beneficiaries pay taxes on their consumption.14 Nor does it take into
account that governments make private spending on social purposes mandatory, for instance force
13
The cap that the Dilnot Commission on Care and Support recommended was £35,000 (URL: http://www.dilnotcommission.dh.gov.uk/our-report/ , accessed 10/3/2013). 14
Indirect taxes are sometimes compensated, for instance when energy taxes go up, poor pensioners may get a higher winter fuel allowance.
7
employers or wage earners to buy insurance against accidents or occupational diseases.
Governments also incentivise voluntary private spending for social purposes by making such
spending tax-deductible, for instance on health insurance.15 Research since the mid-1990s, by
Willem Adema and collaborators at the OECD, allows us now to take some of these indirect and
hidden ways of public welfare provision into account.
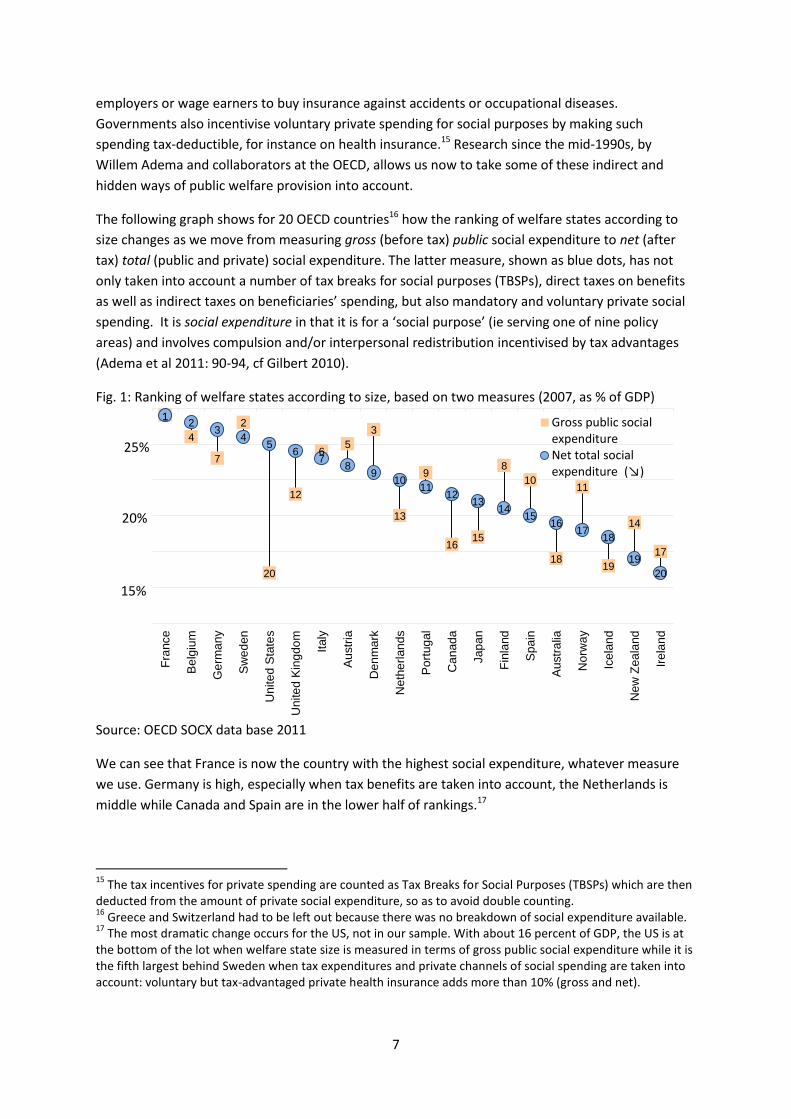
The following graph shows for 20 OECD countries16 how the ranking of welfare states according to
size changes as we move from measuring gross (before tax) public social expenditure to net (after
tax) total (public and private) social expenditure. The latter measure, shown as blue dots, has not
only taken into account a number of tax breaks for social purposes (TBSPs), direct taxes on benefits
as well as indirect taxes on beneficiaries’ spending, but also mandatory and voluntary private social
spending. It is social expenditure in that it is for a ‘social purpose’ (ie serving one of nine policy
areas) and involves compulsion and/or interpersonal redistribution incentivised by tax advantages
(Adema et al 2011: 90-94, cf Gilbert 2010).
Fig. 1: Ranking of welfare states according to size, based on two measures (2007, as % of GDP)
Source: OECD SOCX data base 2011
We can see that France is now the country with the highest social expenditure, whatever measure
we use. Germany is high, especially when tax benefits are taken into account, the Netherlands is
middle while Canada and Spain are in the lower half of rankings.17
15
The tax incentives for private spending are counted as Tax Breaks for Social Purposes (TBSPs) which are then deducted from the amount of private social expenditure, so as to avoid double counting. 16
Greece and Switzerland had to be left out because there was no breakdown of social expenditure available. 17
The most dramatic change occurs for the US, not in our sample. With about 16 percent of GDP, the US is at the bottom of the lot when welfare state size is measured in terms of gross public social expenditure while it is the fifth largest behind Sweden when tax expenditures and private channels of social spending are taken into account: voluntary but tax-advantaged private health insurance adds more than 10% (gross and net).
1
4
7
2
20
12
6 5
3
13
9
16 15
8
10
18
11
19
14
17
1 2
3 4
5 6
7 8
9 10
11 12
13 14
15 16
17 18
19
20
Fra
nce
Be
lgiu
m
Ge
rma
ny
Sw
ed
en
Unite
d S
tate
s
Unite
d K
ing
do
m
Italy
Au
str
ia
Den
ma
rk
Neth
erl
an
ds
Po
rtug
al
Can
ad
a
Jap
an
Fin
land
Sp
ain
Au
str
alia
Norw
ay
Ice
lan
d
New
Zea
land
Ire
lan
d
Gross public socialexpenditureNet total social expenditure (↘)
15%
25%
20%

8
In terms of financial market development, we can look first at the ‘financialization’ of the economy
(Bermeo and Pontusson 2011), here measured as the contribution of financial activity to output, in
contrast to manufacturing. We do not have Canada and the Netherlands in the picture yet but both
would probably look similar to Germany. The striking picture here is that France is not only the
highest social spender but also the most financialized economy; if we find complementarity at all, we
should find it for France. It is also striking that even in Germany, with its manufacturing-based
export-oriented economy, financial services contribute more to national income than
manufacturing; which is also the case in Spain which experienced noticeable deindustrialisation over
these years.
Fig. 2: Financial services v manufacturing, value added as percentage of GDP
Source: Bermeo and Pontusson (2011, fig.6)
We can finally also look at household indebtedness, a time series that is not available back to the
1980s, which we therefore could not include into our model.

9
Fig.3: Household debt as percentage of disposable income
Source: André (2010, fig.8)
The Netherlands is the country with the highest household debt due to, until recently, very high tax
incentives for mortgage debt that made Dutch households hold on to it purely for tax purposes. Our
other country cases range in the middle (Spain) to low end (Canada, Germany, France). Germany,
along with Japan, was the only country where households reduced debt as a share of disposable
income between 2000 and 2007, a tribute to depressed development of real wages during these
years.
First findings At this early stage, we have managed to address three questions:
a) Does public social spending indeed cause private social spending? We can answer this by looking
at the SVAR estimates (t-statistics) together with the variance decomposition, the latter allowing
us to pick up the dynamics of the causal link as well as feedback effects from private to public
social spending.
b) Can we identify any significant drivers of (life) insurance premia? The sources for an answer are
the same as under a).
c) Are indicators of social spending and taxation substitutive or complementary to insurance
markets? For an answer, we look at the impulse response of (the time series of) the insurance
market variable since these contain the elasticities.
The data runs from the early to mid-19080s until the late 2000s, depending on the time series
available in each country. Our findings are encouraging as regards the model but suggest we need

10
refinement as regards the simple dichotomous hypotheses of either substitutability or
complementarity between public welfare and private finance.
Public social spending causes private social spending in Canada, the Netherlands and Spain in the
fairly robust sense that we have both significant SVAR estimates and a relevant contribution of
public spending to the variances of private spending. In addition, we find in the case of Canada and
the Netherlands a feedback effect from private to social spending in the variance decomposition.
Where we do not find this causal link so clearly, in France and Germany, there are still some links
discernible. In the case of France, it consists of a significant SVAR estimate of the causal link from
public to private social spending and a lagged feedback effect from private to public. In Germany, we
find only a causal effect of public on private spending in the variance decomposition, ie dynamically,
but neither a significant SVAR estimate nor a feedback effect.
As regards potential welfare state drivers of insurance markets (public, private social spending,
taxes), we find evidence for all or some of these drivers in every country but to varying degrees: for
all three drivers in Canada and Spain, for public and private spending in France, for public spending
in Germany, and for taxes only in the Netherlands.18
As regards the complementary or substitutive relationship between the financial industry and the
welfare state, the comparison between the five countries reveals some surprisingly robust patterns.
In the impulse response of insurance premia, public social spending is first substitutive (ie
contributes negatively to the response) and then complementary (positive contribution) in all
countries except France. Because we are interested in the long-run impact (beyond the
contemporaneous effects), we can say that the two are complementary. This interpretation is
compatible with the complementarity hypothesis if we take into account that an increase in public
social spending will first make households spend less on private provisions, because they have less
demand for the latter but also because of a tighter budget constraint if this leads to higher taxes. But
as time goes by, households and private providers piggy-back on the public services at the margin,
hence public welfare and private spending on insurance complement each other.
This chain of reasoning is supported by the fact that higher taxes cause a negative (or substitutive)
response of insurance markets in all countries but Germany, where the contribution of taxes to
variation in insurance premia is insignificant. If private social spending is typically incentivised by tax
subsidies, then lower tax revenue means higher subsidies for private spending and vice versa. So, in
fact, this is in line with a story of complementarity between public welfare (foregone tax revenue)
and private finance for social purposes (life insurance).
In France, public social spending is shown to be complementary over the entire impulse response
horizon of insurance premia. This is in line with our expectations that France is a big social spender
and a highly financialised economy. The pattern fits neatly into the Titmuss tradition of welfare state
research.
18 This result for the Netherlands confirms what was said with respect to tax incentives for mortgage debt
above and is also visible in graph 1. Even if not all SVAR estimates of these drivers are significant, the variance
decomposition confirms their importance in driving the insurance markets.

11
Finally, we do not find any robust relationship of private social spending and insurance premia,
which is an interesting and surprising non-finding. One would assume that when insurance premia
vary, this is largely due to shocks in private social spending. Moreover, we would find
complementarity, ie a positive variation more plausible as paying for insurance is part of private
social spending. But only in the Netherlands do we find clear-cut and sustained complementarity. In
Germany, the relationship is initially substitutive and becomes complementary over time. In Canada
and France, insurance premia respond as if private social spending were a substitute. In Spain, there
is no contribution of private spending to the impulse response of insurance premia. Only a closer
look at the country cases can tell.
Concluding remarks We are encouraged by our findings so far. We used SVAR because it is an advanced econometric
technique to establish causality between variables that may be linked in a rather complex and
dynamically varying fashion. Our model establishes a link between public welfare and private finance
(in the disguise of life insurance premia) that so far hardly anybody in comparative welfare state
research or in financial economics has even looked for. For the five countries we looked at, the
finance-welfare state nexus fits the complementarity hypothesis better. We inferred this hypothesis
theoretically from an account of the welfare state inspired by Richard Titmuss (1958) who stressed
the private interests that attach themselves to the benefits of public welfare and use it for their own,
not necessarily intended purposes, for instance reduce the risk of private insurance. Another, if
more optimistic version of this complementarity can be inferred from the new welfare economics,
that is interested in the range of policy options that escape the equity-efficiency tradeoff because
redistributive policies may also alleviate market failures.
There is a potentially big research programme hidden in these preliminary findings. It would involve
running the model with other financial variables than insurance premia. Household panel data could
be exploited to make the findings on complementarity or substitution between public welfare and
private finance more robust. Another is to allow structural changes and variations in shocks (and
transmission) throughout the entire sample period. Ultimately, one will have to do qualitative case
studies to uncover what establishes the nexus in political terms. Finally, one would also like to relate
the link between public welfare, private social spending and financial markets to outcomes in terms
of inequality and risk allocation.
Our more immediate intention is to relate this work to the question of who’s to blame for the
financial crisis. At the height of the financial crisis, in 2009-10, the Western welfare state arguably
prevented a repeat of the Great Depression. But there were also suggestions that social policy had
contributed to the crisis, particularly by promoting households’ access to credit in pursuit of welfare
goals (eg Fannie Mae’s role in subprime-lending). This would fit the complementarity hypothesis
although the exact ways of how social policy complements financial market provisions may make a
difference (Schelkle 2012b). By contrast, Schwartz (2012) claims that it was the withdrawal of state
welfare that contributed to the disaster which is in line with understanding public welfare as a
substitute for private finance. One way of distinguishing between these two hypotheses with a view
to explaining the crisis is to look for structural breaks in the finance-welfare state nexus around the
mid-1990s.
12
Bibliography: Adema, W., P. Fron and M. Ladaique (2011), ‘Is the European Welfare State Really More Expensive?:
Indicators on Social Spending, 1980-2012; and a Manual to the OECD Social Expenditure Database
(SOCX)’, OECD Social, Employment and Migration Working Papers, No.124, Paris: OECD Publishing.
André, C. (2010), ‘A Bird’s Eye View of OECD Housing Markets’, OECD Economics Department
Working Paper No.746, Paris: OECD.
Ansell, B. (2011), ‘Nest Eggs and Negative Equity: The Political Economy of Ownership’, Working
Paper.
Barr, N. (1992), ‘Economic Theory and the Welfare State: A Survey and Interpretation’, Journal of
Economic Literature, vol 30(2), 741-803.
Barr, N. A. (2012), Economics of the welfare state. 5th ed., Oxford: Oxford University Press.
Beck, T., A. Demirgüç-Kunt and R. Levine (2010), ‘Financial Institutions and Markets across Countries
and over Time: The Updated Financial Development and Structure Database’, The World Bank
Economic Review, vol 24(1), 77-92.
Bermeo, N. and Pontusson, J. (2011), ‘Coping with Crisis: an Introduction’, Unpublished working
paper, Oxford and Geneva.
Campbell , J.Y.(2006), ‘Household Finance’, Journal of Finance 61(4), pp.1553-1604.
Castles, F. G. (1998), ‘The Really Big Trade-Off: Home Ownership and the Welfare State in the New
World and the Old’, Acta Politica, 33(1), pp. 5–19.
Esping-Andersen, G. (1990), The Three Worlds of Welfare Capitalism, Cambridge: Polity Press.
Gilbert, N. (2010) ‘Comparative Analyses of Stateness and State Action: What Can We Learn From
Patterns of Expenditure?’ in J. Alber and N. Gilbert (eds.), United in Diversity, New York: Oxford
University Press, 2010, 133-150.
Hacker, Jacob S. (2004), ‘Privatizing Risk without Privatizing the Welfare State: The Hidden
Politics of Social Policy Retrenchment in the United States’. American Political Science
Review 98 (2): 243-260.
Howard, C. (1997), The Hidden Welfare State. Tax Expenditures and Social Policy in the United State,
Princeton, NJ: Princeton University Press.
Iversen, T. (2006), ‘Capitalism and Democracy’, In B. R. Weingast and D. A. Wittman (eds), The
Oxford Handbook of Political Economy, Oxford: Oxford University Press, 601-623.
Kemeny, J. (1980), ‘Home Ownership and Privatisation’, International Journal of Urban and Regional
Research 4(3), 372–388.
13
Kemeny, J. (2005), ‘‘‘The Really Big Trade-Off ’’ between Home Ownership and Welfare: Castles’
Evaluation of the 1980 Thesis, and a Reformulation 25 Years on’, Housing, Theory and Society 22(2),
59-75.
Lindert, P. H. (2003), ‘Why the Welfare State Looks Like a Free Lunch’, NBER Working Paper No.9869,
Cambridge MA: National Bureau of Economic Research.
Okun, A. M. (1975), Equality and efficiency: the big tradeoff, Washington DC: The Brookings
Institution.
Pigou.A.C. (1920), The Economics of Welfare, London: Macmillan.
Polanyi, K. (1944, 1957), The Great Transformation: the political and economic origins of our time.
Boston: Beacon Press.
Schelkle, W. (2012a), Collapsing Worlds and Varieties of welfare capitalism: In search of a new
political economy of welfare, LEQS Paper No.54, London: European Institute, LSE.
Schelkle, W. (2012b) ‘A crisis of what? Mortgage credit markets and the social policy of promoting
homeownership in the United States and in Europe’, Politics & Society 40(1), 59-80.
Schwartz, H.M. (2012), ‘Housing, the Welfare State, and the Global Financial Crisis: What is the
Connection?’, Politics & Society 40(1): 35-58.
Sims, C (2002), Structural VAR’s, typescript, available at URL:
www.eco.uc3m.es/jgonzalo/teaching/PhDTimeSeries/SimsVARS.pdf.
Titmuss, R. M. (1958), Essays on ‘the Welfare State’. London: University Books.