Embed Size (px)
Citation preview
The Fertilizer Market and Price Risk Management
April 2014

• Fertilizers are a commodity
• Key drivers are supply and demand variables in the global agricultural markets
• The fertilizer market is volatile and trades in substantial volumes
• Clear requirement for price risk management
• The FIS cash settled fertilizer swaps market is established and growing rapidly
The ferts market..

Volatility
Year 2013 High Low
Yuzhnyy Urea Index 07-Feb-13 29-Aug-13
437.5 288.75
DAP Tampa Index 28-Mar-13 21-Nov-13
513 347.5
UAN NOLA Index 21-Feb-13 24-Oct-13
342.5 224.5
NOLA Urea Index 07-Feb-13 17-Oct-13
435.75 280
Egypt Urea Index 07-Feb-13 29-Aug-13
506.25 312.5
UAN Rouen Index 21-Feb-13 19-Sep-13
253.5 176
Urea China Index 07-Feb-13 03-Oct-13
416.25 278.25
0.00
200.00
400.00
600.00
800.00
1,000.00
1,200.00
1,400.00
Urea (Prill) fob Yuzhnyy Index (metric tonne) DAP fob Tampa Index (metric tonne)
UAN (32% N) fob NOLA Index (short tonne) Urea (gran) fob barge NOLA Index (short ton)
UAN FOT Rouen 30% (€/metric tonne) Urea (gran) fob Egypt (metric tonne)
Urea(Prill) fob China (metric tonne)

… At the mercy of
Ever changing fundamentals….
The future – Uncertain……
Inventory levels?

In response to increasing demand from traders and end user markets both East and West of Suez, FIS has introduced cash settled swaps with settlement against the Urea (Prill) fob China (metric tonne) price reported on the Fertilizer Index. Trading commenced on 20th February 2014 and liquidity and volume of trades continue to build in this developing market.
FERTILIZER INDEX prilled fob China price - Methodology: The price covers prilled urea shipped from a range of ports in China. Reported prices are based on actual fob conclusions, or may be basis best estimates on netbacks when no new export sales are made in a given week. Please note - the prices are reported basis tax paid. Basis announcements for 2014 :
The tax for urea is fixed at a flat RMB 40/mt for urea exported in the July 1 to October 31 “low season”.
The tax rate for the high season from January 1 through June 30 and from November 1 through December 31 has been fixed 15% calculated on the net export value, plus Rmb 40/t.
Disclaimer: Any changes on the tax regime and/or changes to the dates of the low-tax and high tax export windows will impact reported prices. Any FIS swap counterparty enters into a swap trade at their own discretion on what the prevailing China export tax rates will be and agrees to settlement against the China fob price as per the FERTILIZER INDEX. FIS and any / all of the FERTILIZER INDEX price range providers cannot be held accountable for any changes made to the levels and timings of export tax imposed.
Urea (Prill) fob China - Methodology

China High Tax Period
$200
$250
$300
$350
$400
$450
$500
$550
$600
High Tax Period Urea (Prill) fob China (metric tonne)
16/Sep/2010 - 15/Oct/2010
01/Dec/2010 - 30/Jun/2011
01/Nov/2011 - 30/Jun/2012
01/Nov/2012 - 30/Jun/2013
01/Feb/2010 - 30/Jun/2010
Urea Export Volume (Gran + Prill) in kt
2011 2012 2013 2014*
3,559 6,948 8,265 10,000+
*Projected figures

FIS Cash Settled Swaps –Mitigate Risk
Fertilizer derivative (FIS cash-settled swap):
“An agreement between a buyer and a seller, made today to pay the difference between a price agreed today and the future
price of a specific Fertilizer Index at an agreed point in time”
FIS swaps allow you to manage price risk and hedge physical positions in the forward market

Key points
A cash-settled swap is a paper trade only:
No payment until settlement date (no capital outlay)
No delivery of physical product
Cash-settled vanilla swap settled against the Fertilizer Index price
Hedging
To take a position in a futures (swaps) market, opposite to a position held in the physical market, with the intention of minimizing the risk of financial loss from an adverse price change.
Positioning
To buy and sell positions in a futures (swaps) market, levering physical and market knowledge, through taking short term positions where you believe market is mispricing, with the aim of making a profit.
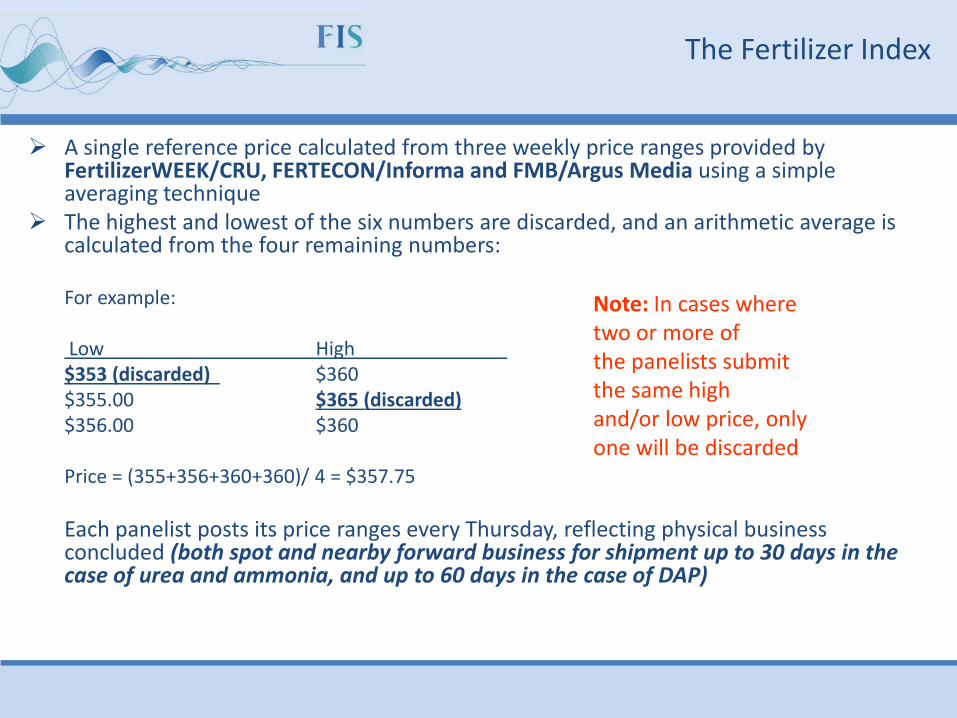
The Fertilizer Index
A single reference price calculated from three weekly price ranges provided by FertilizerWEEK/CRU, FERTECON/Informa and FMB/Argus Media using a simple averaging technique
The highest and lowest of the six numbers are discarded, and an arithmetic average is calculated from the four remaining numbers:
For example: Low High $353 (discarded) $360 $355.00 $365 (discarded) $356.00 $360
Price = (355+356+360+360)/ 4 = $357.75
Each panelist posts its price ranges every Thursday, reflecting physical business concluded (both spot and nearby forward business for shipment up to 30 days in the case of urea and ammonia, and up to 60 days in the case of DAP)
Note: In cases where two or more of the panelists submit the same high and/or low price, only one will be discarded

Tradable products

Market example
Position
trader requires to cover forward short sold at say 10,000mt x $ 295 pt fob for JUN
to secure $10 pt margin requires cover at $285
buy swap or physical?
assess FIS swap market Bids/ Offers JUN
Seller OFFER on FIS swaps China
= $285 pt for JUN
BUY the FIS swap China = $285 pt all JUN
Trader BUYS FIS swap for 10,000 mt China Urea at $285 all JUN
Ou
t-o
f-th
e-m
on
ey
Price (Underlying)
In-t
he
-mo
ney
Price (Underlying)
$285
$10
FIS Swap
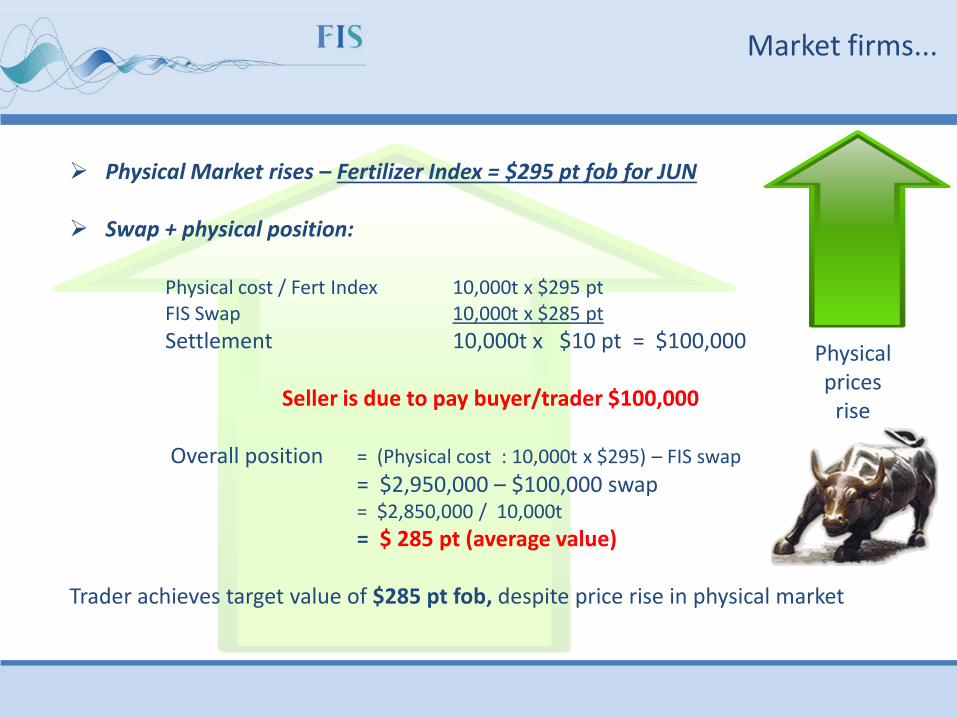
Physical Market rises – Fertilizer Index = $295 pt fob for JUN
Swap + physical position: Physical cost / Fert Index 10,000t x $295 pt FIS Swap 10,000t x $285 pt
Settlement 10,000t x $10 pt = $100,000
Seller is due to pay buyer/trader $100,000
Overall position = (Physical cost : 10,000t x $295) – FIS swap
= $2,950,000 – $100,000 swap = $2,850,000 / 10,000t
= $ 285 pt (average value)
Trader achieves target value of $285 pt fob, despite price rise in physical market
Market firms...
Physical prices
rise
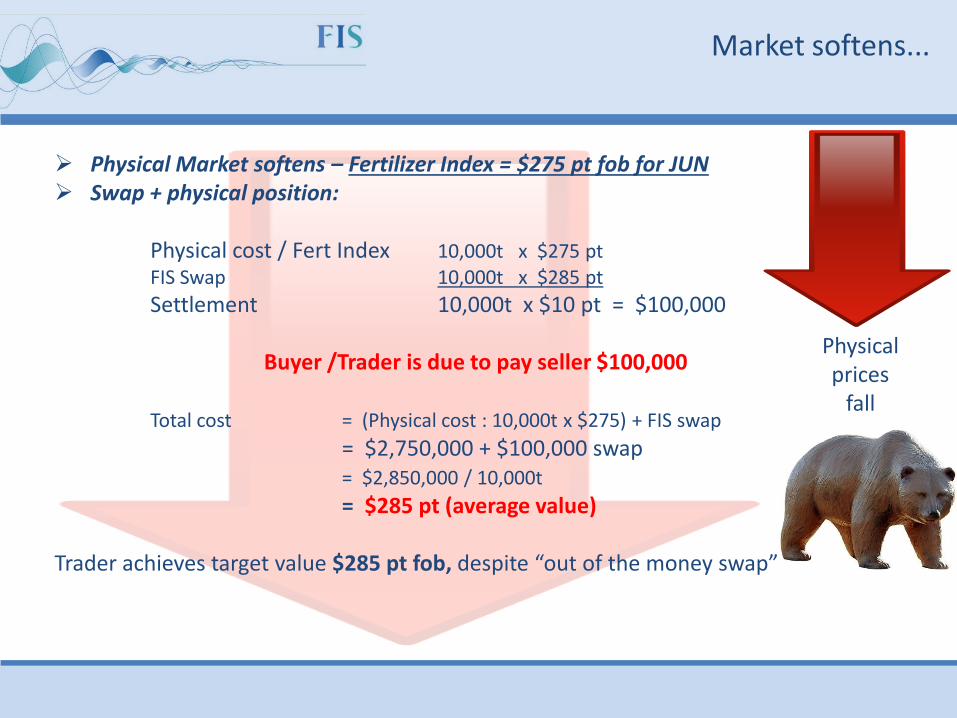
Physical Market softens – Fertilizer Index = $275 pt fob for JUN Swap + physical position: Physical cost / Fert Index 10,000t x $275 pt FIS Swap 10,000t x $285 pt
Settlement 10,000t x $10 pt = $100,000
Buyer /Trader is due to pay seller $100,000
Total cost = (Physical cost : 10,000t x $275) + FIS swap
= $2,750,000 + $100,000 swap = $2,850,000 / 10,000t
= $285 pt (average value)
Trader achieves target value $285 pt fob, despite “out of the money swap”
Market softens...
Physical prices
fall

Fertilizer price and FIS Swaps volume
Freight Investor Services
0
0.5
1
1.5
2
2.5
3
3.5
4
0.00
100.00
200.00
300.00
400.00
500.00
600.00
700.00
800.00
900.00
$/m
t -
$/s
t
Fertilizer price and FIS Swaps volume
Fertilizer Swap Volume Urea (Prill) fob Yuzhnyy (metric tonne) Urea (gran) fob NOLA (short tonne) Urea (Prill) fob China (metric tonne)
Mill
ion
to
n

FIS Commission
The commission charged by FIS Ltd on any swap contract is 50 US cents payable by each counterparty per unit (metric tonne or short ton) traded
The value of the commodity has no influence on FIS commissions – it is a fixed rate.

Some of the companies participating….
TRAMMO
CHS Crop Nutrients
KOCH
MOSAIC
GAVILON
AMEROPA
HELM
GROWMARK
ADM
SCOTTS
INTERCHEM
YARA
ORASCOM / EGYPTIAN FERTILIZER CO.
*Not ranked

The Fertilizer Index derives an average price from spot price ranges for each product
Therefore, physical cover may be booked within a price range, not necessarily at the spot average as represented by the Fertilizer Index
For this reason, your spot physical price and the Fertilizer Index price may not converge – there is some “basis risk” and imperfect hedging
However, it should be noted that substantial physical volumes are contracted based on the Fertilizer Index formula price which allows perfect hedging
Basis risk...

• Open Credit ; Standby Letter of Credit ; LCH or CME Cleared
• Open Credit
• Pros: No extra cost
• Cons: 100% counterparty exposure, credit limits can be quickly reached
• Standby Letter of Credit
• Pros: provides proportionate performance guarantee
• Cons: can be substantial fixed amounts , ties up capital, as market moves exposure will change, but the terms of the LC do not.
• LCH or CME Cleared
• Eliminates counter party risk
• Guarantees settlement
Credit

LCH or CME Cleared trades
• Eliminates counter party risk
• Guarantees settlement
• Counterpartys’ identity in any cleared swap trade is NOT disclosed at any stage
• Provides mark-to-market evaluations on open positions
Secure and anonymous
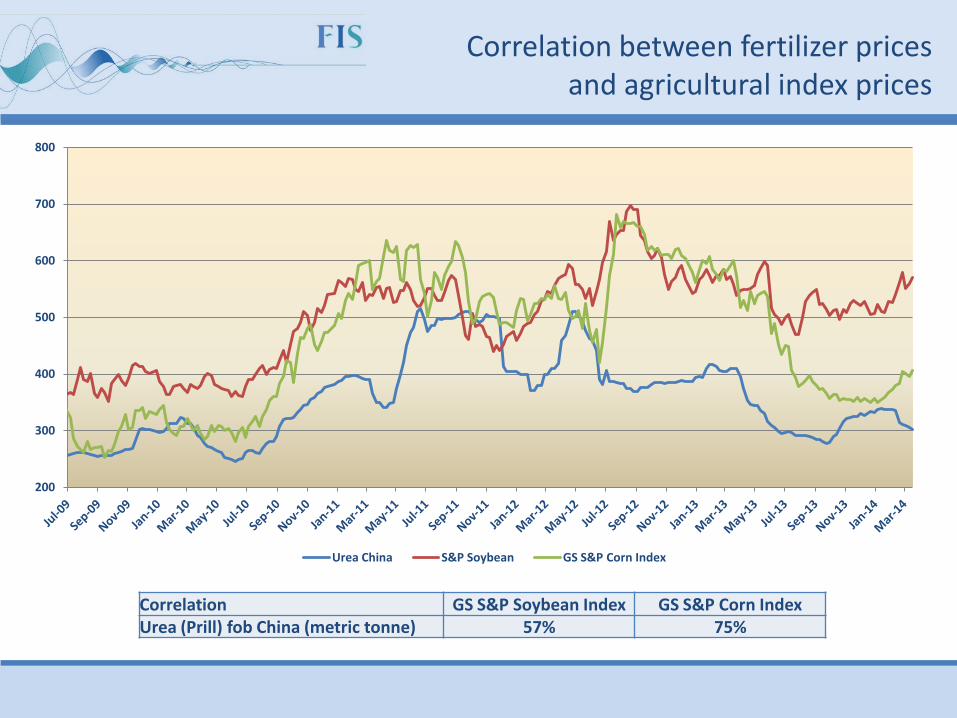
Correlation GS S&P Soybean Index GS S&P Corn Index Urea (Prill) fob China (metric tonne) 57% 75%
Correlation between fertilizer prices and agricultural index prices
200
300
400
500
600
700
800
Urea China S&P Soybean GS S&P Corn Index

PROVEN MARKET - FIS Ltd has successfully established cash settled fertilizer swaps activity
in worldwide markets. The liquidity and volumes traded on FIS swaps continues to grow steadily.
PRICE DISCOVERY - the swaps market provides a platform for forward price discovery and the facility to secure a forward price without commitment of physical product.
SWAP POSITIONS - may be “closed out” which determines exactly the profit or loss on the swap contract position , or may be left open to settle at maturity – but a swap contract is settled at the end of the defined period.
MINIMAL COMMITMENT of CAPITAL – to secure a forward price in the swaps market minimises commitment of capital and preserves your cash flow.
LOCK IN MARGIN – build a swaps book allied to your physical commitments and minimise exposure to price swings with FIS fertilizer swaps.
Conclusions

Freight Investor Services
Ron Foxon (UK office) : + 44 207 090 1122
Yan Redwood (UK office) : + 44 207 090 1122
Alexey Paliy (US office) : +1 212 634 6424
Rob Duncan (US office) : +1 502 357 0094
E-mail: [email protected]
http://www.freightinvestor.com
Contact Details