Embed Size (px)
Citation preview

The Feel of MEMS Barometers: Inexpensive and Easily Customized Tactile Array Sensors
CitationTenzer, Yaroslav, Leif P. Jentoft, and Robert D. Howe. 2014. “The Feel of MEMS Barometers: Inexpensive and Easily Customized Tactile Array Sensors.” IEEE Robot. Automat. Mag. 21 (3) (September): 89–95. doi:10.1109/mra.2014.2310152.
Published Versiondoi:10.1109/MRA.2014.2310152
Permanent linkhttp://nrs.harvard.edu/urn-3:HUL.InstRepos:22088984
Terms of UseThis article was downloaded from Harvard University’s DASH repository, and is made available under the terms and conditions applicable to Open Access Policy Articles, as set forth at http://nrs.harvard.edu/urn-3:HUL.InstRepos:dash.current.terms-of-use#OAP
Share Your StoryThe Harvard community has made this article openly available.Please share how this access benefits you. Submit a story .
Accessibility

1
Under Review - (c) IEEE 2012
Inexpensive and Easily Customized Tactile ArraySensors using MEMS Barometers Chips
Yaroslav Tenzer, Leif P. Jentoft, Robert D. HoweHarvard School of Engineering and Applied Sciences
Abstract—This paper presents a new approach to the con-struction of tactile array sensors based on barometric pressuresensor chips and standard printed circuit boards. The chipsinclude tightly integrated instrumentation amplifiers, analog-to-digital converters, pressure and temperature sensors, and controlcircuitry that provides excellent signal quality over standarddigital bus interfaces. The resulting array electronics can beeasily encapsulated with soft polymers to provide robust andcompliant grasping surfaces for specific hand designs. The useof standard commercial-off-the-shelf technologies means thatonly basic electrical and mechanical skills are required tobuild effective tactile sensors for new applications. Performanceevaluation of prototype arrays demonstrate excellent linearity(<1% typical) and low noise (<0.01 N). External addressingcircuitry allows multiple sensors to communicate on the samebus at over 100 Hz per sensor element. Sensors can be mountedas close as 3x5 mm spacing, and spatial impulse response testsshow that solid-mechanics based signal processing is feasible. Thisapproach promises to make sensitive, robust, and inexpensivetactile sensing available for a wide range of robotics and human-interface applications.
I. INTRODUCTION
Tactile sensing is widely considered an essential capabilityfor effective grasping and manipulation [1], [2], [3]. Parame-ters such as the location of object contacts on the robot handand contact pressure distribution are believed to be essentialfor effective manipulation in unstructured environments. Yetdespite decades of research and the availability of several com-mercial tactile array sensors, there has been little experimentalprogress in using tactile information to control grasping andmanipulation.
There are many reasons for the lack of headway in thisarea, but a major factor is certainly the cost and complexity ofintegrating tactile sensing into robot hands. Hundreds of touchsensing devices have been published in the robotics literature,but building such sensors requires custom fabrication usingnonstandard techniques [1], [2], [3].
Commercial tactile array sensors avoid the need to masterexotic fabrication technologies, but they are typically costly,fragile, and cover only a limited area of a hand [4], [5], [6].Both custom-built and commercial sensors require consider-able engineering effort to integrate into the contact surfacesof a new robot hand, and there are further challenges indeveloping the multiplexing, cabling, and digitizing to getthe sensor signals down the robot arm and into the controlcomputer.
This paper presents a new method for tactile array con-struction and integration. The approach takes advantage of
Figure 1. MPL115A2 sensor from Freescale Semiconductor, and the blockdiagram of the device.
recently-available miniature barometric sensor chips, whichinclude a MEMS pressure sensor, temperature sensor, instru-mentation amplifier, analog-to-digital converter, and standardbus interface, all for as little as US$1 per sensor. These devicescan be mounted on standard printed circuit boards (rigid orflexible) using standard IC surface-mount techniques. Thecircuit boards can be mounted to robot fingers and easily over-molded with rubber to provide robust grasping surfaces. Theresulting tactile array sensors have moderate spatial resolution(3-5 mm), and excellent sensitivity (<0.01 N), linearity (<1%),and bandwidth (>100 Hz). In the following section we describethe sensor chips and their integration into tactile arrays. Inparticular, we present solutions to two key issues: extendingaddress limitations to enable connection of multiple sensorsonto one bus at high bandwidth, and adapting the rubber mold-ing process to provide high contact sensitivity. We then presentexperimental characterization of a prototype array sensor interms of force magnitude, spatial, and temporal response. Weconclude with a discussion of design considerations and theimplications for robot manipulation research.
II. TACTILE ARRAY INTEGRATION
A. Barometric Sensors
Barometric sensor chips were developed for consumerproducts such as desktop weather stations and GPS systems,where altimeters can improve vertical positioning accuracy[7]. As such, these sensors have a small footprint, low powerconsumption, and are mass produced at low cost. Severalversions are available, all sharing the combination of a MEMS

Under Review - (c) IEEE 2012
Figure 2. An example of the use of auxiliary circuits to enable connectionof up to eight barometric sensors on the same I2C bus.
transducer with integrated signal conditioning and bus inter-face in a standard surface mount IC package (e.g. [8], [9]).In this paper we focus on the MPL115A2 sensor (FreescaleSemiconductor Inc., Austin, TX, USA). This device (Fig.1) has a miniature 5x3x1.2 mm package, uses the I2C busprotocol [10] and, at the time of writing, is the least expensivealternative. These sensors have an air pressure range of 50-115 kPa with a resolution of 0.15 kPa. This sensor also has arelatively large ventilation hole (1 mm diameter) directly abovethe pressure sensor. This is advantageous for rubber casting,as described below.
B. Circuitry Design and Rubber Casting
A number of steps are required to adapt the barometricsensors for tactile applications. First, circuitry and program-ming protocols are required to access multiple sensors overthe I2C bus because all sensors are manufactured with thesame preassigned I2C address. Chip select can be implementedthrough the RST pin, which disables the I2C interface whendriven low [9]. This is preferable to applying and removingpower, as required for some alternative chips, because it avoidsthe power-up delay that would greatly limit sampling rates. Inthe circuit example in Fig. 2, the RST pin of up to eight sensorsare controlled by an I/O expander (MCP23008, MicrochipTechnology Inc., Chandler, AZ, USA). Multiple I/O expanderscan share the I2C bus with the sensors, so a total of onlytwo communication wires and two power lines are required tocommunicate to an array of hundreds of sensors. Arrays withlarge number of sensors would require the use of I/O expanderswith larger addressing range and extra I/O pins (e.g. PCA9671,NXP Semiconductors, Eindhoven, The Netherlands).
The sensor array sampling speed was calculated basedon the performance characteristics of the sensors, the I/Oexpander, and the bus communication speed; here we use thechip maximum of 400 kHz. The main performance bottleneckis the sensor data conversion time of 1.6 ms, which is theminimum interval between the start convert command and dataavailable in the internal registers. Two different algorithms
Figure 3. Theoretical sampling rates of an array with I2C bus speed of400kHz. A) Serial approach where for each sensor the system commandsto start conversion, waits till the data is available (1.6 ms), and then readsthe data. B) Double loop (i.e. alternating start conversion and read sensor)approach utilizing the waiting time to communicate the start-conversioncommand to other sensors in the array.
were developed to scan an array of sensors. The first is aserial approach, where the controller sends the start-convertcommand to a sensor, waits for the conversion time interval,and then reads the data. The time to scan an array is(
Cbits + Sbits +Rbits
bus speed+ Tc
)·N
where Cbits is the number of bits required to command theIO expander to select a single barometer chip, Sbits is thenumber of bits required to command data conversion, Rbits
is the number of bits required to read the data, Tc is theconversion time of the sensors, and N is the number of sensorsin the array.The second algorithm utilizes the waiting time tocommunicate the start-conversion command to other sensorsin the array, then returns to each sensor after the appropriateinterval and reads the data. Using this double loop method thearray sampling time is(
2Cbits + Sbits +Rbits
bus speed
)·N + Tc
The performance of the algorithms is shown in Fig. 3. Thesecond algorithm is about three times as fast for the selectedeight sensor example in Fig. 2 with a 400 kHz bus speed,and about four times as fast for a 22 sensor array, which iscurrently under development for a robotic finger.
The second issue requiring special attention is casting ofthe sensors in rubber. Rubber forms a robust and compliantcontact surface for grasping and manipulation, and serves tocommunicate surface contact pressure within the layer of rub-ber to the ventilation hole and thus to the MEMS transducer.Encapsulation of the array can be readily accomplished bysuspending the circuit board with mounted sensors in a moldand pouring in liquid polymer. When molding is performed atatmospheric pressure, however, air is trapped within the sensorchip behind the ventilation hole. This results in low sensitivity
2
Under Review - (c) IEEE 2012
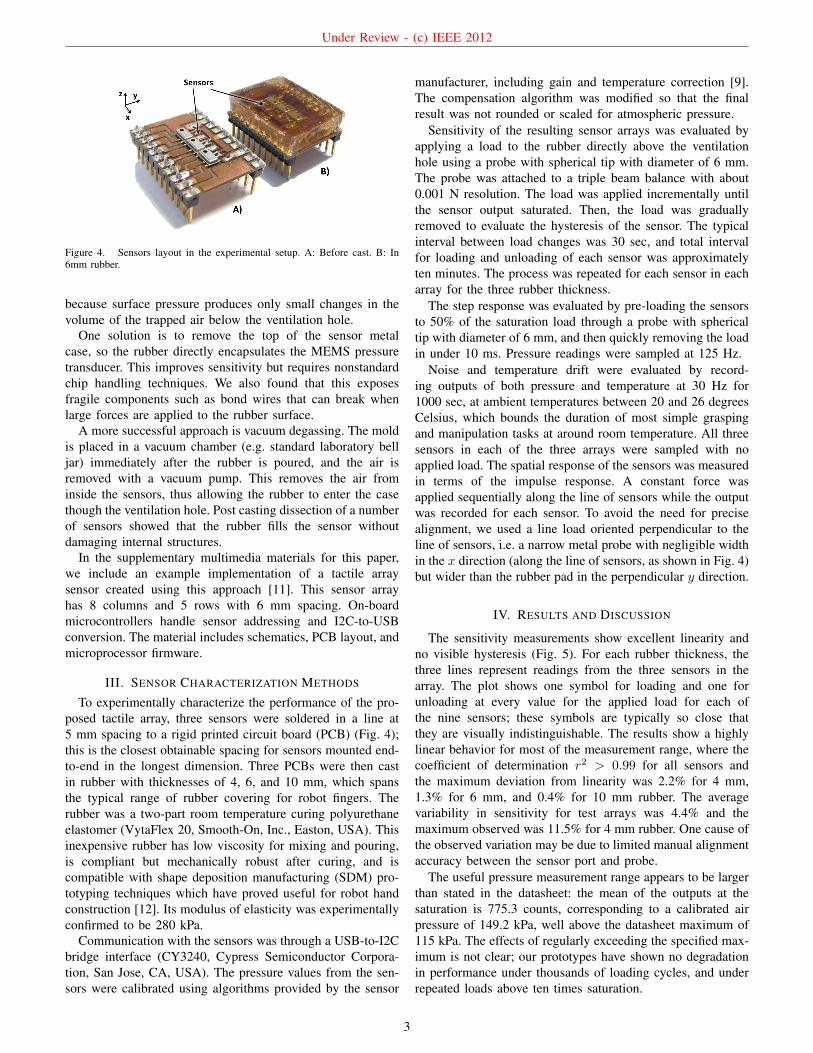
Figure 4. Sensors layout in the experimental setup. A: Before cast. B: In6mm rubber.
because surface pressure produces only small changes in thevolume of the trapped air below the ventilation hole.
One solution is to remove the top of the sensor metalcase, so the rubber directly encapsulates the MEMS pressuretransducer. This improves sensitivity but requires nonstandardchip handling techniques. We also found that this exposesfragile components such as bond wires that can break whenlarge forces are applied to the rubber surface.
A more successful approach is vacuum degassing. The moldis placed in a vacuum chamber (e.g. standard laboratory belljar) immediately after the rubber is poured, and the air isremoved with a vacuum pump. This removes the air frominside the sensors, thus allowing the rubber to enter the casethough the ventilation hole. Post casting dissection of a numberof sensors showed that the rubber fills the sensor withoutdamaging internal structures.
In the supplementary multimedia materials for this paper,we include an example implementation of a tactile arraysensor created using this approach [11]. This sensor arrayhas 8 columns and 5 rows with 6 mm spacing. On-boardmicrocontrollers handle sensor addressing and I2C-to-USBconversion. The material includes schematics, PCB layout, andmicroprocessor firmware.
III. SENSOR CHARACTERIZATION METHODS
To experimentally characterize the performance of the pro-posed tactile array, three sensors were soldered in a line at5 mm spacing to a rigid printed circuit board (PCB) (Fig. 4);this is the closest obtainable spacing for sensors mounted end-to-end in the longest dimension. Three PCBs were then castin rubber with thicknesses of 4, 6, and 10 mm, which spansthe typical range of rubber covering for robot fingers. Therubber was a two-part room temperature curing polyurethaneelastomer (VytaFlex 20, Smooth-On, Inc., Easton, USA). Thisinexpensive rubber has low viscosity for mixing and pouring,is compliant but mechanically robust after curing, and iscompatible with shape deposition manufacturing (SDM) pro-totyping techniques which have proved useful for robot handconstruction [12]. Its modulus of elasticity was experimentallyconfirmed to be 280 kPa.
Communication with the sensors was through a USB-to-I2Cbridge interface (CY3240, Cypress Semiconductor Corpora-tion, San Jose, CA, USA). The pressure values from the sen-sors were calibrated using algorithms provided by the sensor
manufacturer, including gain and temperature correction [9].The compensation algorithm was modified so that the finalresult was not rounded or scaled for atmospheric pressure.
Sensitivity of the resulting sensor arrays was evaluated byapplying a load to the rubber directly above the ventilationhole using a probe with spherical tip with diameter of 6 mm.The probe was attached to a triple beam balance with about0.001 N resolution. The load was applied incrementally untilthe sensor output saturated. Then, the load was graduallyremoved to evaluate the hysteresis of the sensor. The typicalinterval between load changes was 30 sec, and total intervalfor loading and unloading of each sensor was approximatelyten minutes. The process was repeated for each sensor in eacharray for the three rubber thickness.
The step response was evaluated by pre-loading the sensorsto 50% of the saturation load through a probe with sphericaltip with diameter of 6 mm, and then quickly removing the loadin under 10 ms. Pressure readings were sampled at 125 Hz.
Noise and temperature drift were evaluated by record-ing outputs of both pressure and temperature at 30 Hz for1000 sec, at ambient temperatures between 20 and 26 degreesCelsius, which bounds the duration of most simple graspingand manipulation tasks at around room temperature. All threesensors in each of the three arrays were sampled with noapplied load. The spatial response of the sensors was measuredin terms of the impulse response. A constant force wasapplied sequentially along the line of sensors while the outputwas recorded for each sensor. To avoid the need for precisealignment, we used a line load oriented perpendicular to theline of sensors, i.e. a narrow metal probe with negligible widthin the x direction (along the line of sensors, as shown in Fig. 4)but wider than the rubber pad in the perpendicular y direction.
IV. RESULTS AND DISCUSSION
The sensitivity measurements show excellent linearity andno visible hysteresis (Fig. 5). For each rubber thickness, thethree lines represent readings from the three sensors in thearray. The plot shows one symbol for loading and one forunloading at every value for the applied load for each ofthe nine sensors; these symbols are typically so close thatthey are visually indistinguishable. The results show a highlylinear behavior for most of the measurement range, where thecoefficient of determination r2 > 0.99 for all sensors andthe maximum deviation from linearity was 2.2% for 4 mm,1.3% for 6 mm, and 0.4% for 10 mm rubber. The averagevariability in sensitivity for test arrays was 4.4% and themaximum observed was 11.5% for 4 mm rubber. One cause ofthe observed variation may be due to limited manual alignmentaccuracy between the sensor port and probe.
The useful pressure measurement range appears to be largerthan stated in the datasheet: the mean of the outputs at thesaturation is 775.3 counts, corresponding to a calibrated airpressure of 149.2 kPa, well above the datasheet maximum of115 kPa. The effects of regularly exceeding the specified max-imum is not clear; our prototypes have shown no degradationin performance under thousands of loading cycles, and underrepeated loads above ten times saturation.
3

Under Review - (c) IEEE 2012
Figure 5. Sensor output values versus applied surface load for rubbersof different thickness. The three lines per rubber thickness represent offsetcorrected readings from the three sensors in each array. Symbols indicate theoutput from each sensor during loading and unloading cycles.
Figure 6. Step change in load for a sensor in 10 mm rubber. The linerepresents offset corrected reading during unloading of the sensor.
Sensor output in step tests showed fast response and nohysteresis; an example from a sensor under 10 mm rubberis shown in Fig. 6. The full step response invariably occurswithin two samples or 16 ms. The negligible hysteresis level isexpected for a system with force (or pressure) input and output.If the input was specified as a position step, hysteresis wouldlikely have been evident in the sensor output, but the behaviorunder force loads seems most germane to robotic manipulationapplications, where forces must be controlled for grasping andmanipulation. In any case, the hysteretic properties depend onthe properties of the elastomer used for encapsulation, andcould be limited if needed through careful choice of materials.
Sensor output variation with ambient temperature is highlylinear (r2 > 0.99 for all sensors) over the range of 20-26degrees Celsius (Fig.7). The manufacture provides a temper-ature compensation algorithm using the on-board temperaturesensor (see [9]), but it is not accurate for sensors cast in rubber,probably due to the differences in thermal expansion coef-
Figure 7. Variation in pressure output (shown as the mean of the values) asa function of temperature for different rubber thicknesses, and values from acalibrated sensor without rubber for reference. Lines are best fits (r2 > 0.99)
ficients. The observed linearity suggests that a simple linearcompensation scheme is adequate, although high accuracy mayrequire determination of the specific calibration coefficient foreach sensor.
The signal noise was recorded from all nine unloadedsensors in the three arrays at 100 Hz for 60 seconds. Theoverall average root-mean-square noise was 1.27 counts withstandard deviation of 0.1 counts. This corresponds to anapplied load of 0.0077 N, 0.0026 N, and 0.00092 N for rubbersof 10, 6 and 4 mm respectively, where the sensitivity wascalculated using the measured ratios from Fig.5. These noiselevels are small with respect to the measurement range of thesensor, and simple filtering can further reduce the effects ofthe noise; for example, we were able reliably detect a onegram load on the 6 mm array with a 10 Hz bandwidth.
Power spectrum analysis suggests that the noise is homoge-neously distributed across frequencies. We observed variationsin noise level as a function of the capacitor value (Fig.2),with higher capacitance reducing noise, which may have animpact on the response time. The results reported here usedthe recommended capacitor value of 1µF ) [9].
The spatial impulse response from an array of sensors fordifferent rubber thickness is presented in Fig.8. The resultsshow that as rubber thickness grows, the strain distributiongrows but the sensor loses sensitivity. Some variation in outputvalues and curve amplitude between the sensor readings canbe observed, and these also may be attributed to the alignmentaccuracy of the setup.
Fig.9 shows the impulse response from a single sensor in6 mm of rubber, and the theoretically predicted curve for thesubsurface vertical normal stain distribution at the sensor depth(from [13]). The rubber thickness for the theoretical curvewas adjusted with respect to the thickness of the sensor (i.e.1.2 mm), and the amplitude of the curve has been fitted to theexperimental data.
The calculated and experimental curves show close agree-
4

Under Review - (c) IEEE 2012
Figure 8. Spatial response to a scanned normal impulse for three sensors ineach array with with different rubber thicknesses.
Figure 9. Single sensor response for an impulse normal to the surfacefor 6mm rubber, and the theoretically predicted curve [13]. Sensor valueswere offset corrected, and the theoretical curve magnitude (but not spatialdimension) was scaled to the data.
ment, indicating that methods from solid mechanics (e.g. [13])may be useful for analysis and interpretation of the sensorsignals. The discrepancy between theoretical prediction (basedon an infinite half-space model) and the data at the edges of theplot may be due to the irregular structures within the rubber,i.e. the rigid sensor package mounted on the PCB and thelocation of the MEMS sensor beneath the ventilation hole.
V. CONCLUSIONS
This paper presents a new approach to the constructionof tactile arrays based on barometric pressure sensor chipsand standard printed circuit boards. The chips include tightlyintegrated instrumentation amplifiers, analog-to-digital con-verters, temperature sensors, and control circuitry that providesexcellent signal quality over standard digital bus interfaces.The resulting electronic array can be easily encapsulated insoft polymers to adept the sensors to specific robot handdesigns.
Performance evaluation of prototype arrays demonstratedexcellent linearity (<1% typical) and low noise levels(<0.01 N). External addressing circuitry allows multiple sen-sors to communicate on the same bus at over 100 Hz per sensorelement. Sensors can be mounted as close as 3x5 mm spacing,and spatial impulse response tests show that solid-mechanicsbased signal processing approaches are feasible [13]. Thesensors also have temperature sensing capabilities, which canbe useful for development of thermal sensing systems [14].
The use of standard commercial-off-the-shelf technologiesmeans that only basic electrical and mechanical skills arerequired to build effective tactile sensors, and costs are low de-spite the high performance of the resulting sensor system. Thesensor arrays circuits can be embedded in rubber using custom3D-printed molds to integrate the sensors into robot fingerstructures with a robust and compliant grasping surface. Thisapproach can enable new progress in understanding the roleof tactile information in robotic grasping and manipulation,as well as research in diverse fields such as biomechanics andhuman-machine interfaces where contact location and pressuredistribution information can be valuable.
ACKNOWLEDGMENTS
The authors would like to acknowledge seminal discussionswith Gill Pratt. This work was supported by the NationalScience Foundation under award number IIS-0905180 andby the Defense Advanced Research Projects Agency undercontract number W91CRB-10-C-0141.
REFERENCES
[1] R. S. Dahiya, G. Metta, M. Valle, and G. Sandini, “Tactile Sensing -From Humans to Humanoids,” IEEE Transactions on Robotics, vol. 26,no. 1, pp. 1–20, 2010.
[2] M. R. Cutkosky, R. D. Howe, and W. R. Provancher, “Force and TactileSensing,” in Springer Handbook of Robotics, B. Siciliano and O. Khatib,Eds. Springer Berlin / Heidelberg, 2008, ch. 19.1, p. 1611.
[3] M. H. Lee and H. R. Nicholls, “Tactile sensing for mechatronics-a stateof the art survey,” Mechatronics, vol. 9, no. 1, pp. 1–31, 1999.
[4] “Pressure Profile Systems, Inc.” [Online]. Available:http://www.pressureprofile.com/
[5] “Syntouch - The BioTac.” [Online]. Available:http://www.syntouchllc.com/
[6] “Tactile Pressure Measurement, Tekscan Inc.” [Online]. Available:http://www.tekscan.com/
[7] G. Lammel and J. Patzel, “Pressure Sensors provide indoor competencyfor navigation,” Small Times, pp. 1–4, 2009.
[8] Bosh Sensortec, “BMP085 Digital Pressure Sensor,” Datasheet, no. Oct,2009.
[9] Semiconductor Freescale, “MPL115A2 Miniature I2C Digital Barome-ter,” Datasheet, 2010.
[10] NXP Semiconductors, “UM10204 I2C-bus specification and user man-ual,” User Manual, vol. 4, no. February, 2012.
[11] “Takktile Project. Open source tactile array.” [Online]. Available:http://www.takktile.com
[12] A. M. Dollar and R. D. Howe, “A robust compliant grasper via shapedeposition manufacturing,” IEEEASME Transactions on Mechatronics,vol. 11, no. 2, pp. 154–161, 2006.
[13] R. S. Fearing and J. M. Hollerbach, “Basic solid mechanics for tactilesensing,” The International Journal of Robotics Research, vol. 4, no. 3,pp. 266–275, 1984.
[14] H. R. Nicholls and M. H. Lee, “A Survey of Robot TactileSensing Technology,” The International Journal of RoboticsResearch, vol. 8, no. 3, pp. 3–30, Jun. 1989. [Online]. Available:http://ijr.sagepub.com/content/8/3/3.abstract
5