Embed Size (px)
Citation preview
Technological University Dublin Technological University Dublin
ARROW@TU Dublin ARROW@TU Dublin
Masters Tourism and Food
2008-01-01
The Feasibility of Producing Vacuum-Packed Fermented The Feasibility of Producing Vacuum-Packed Fermented
Vegetable Products. Vegetable Products.
Antoni Llovera Technological University Dublin
Follow this and additional works at: https://arrow.tudublin.ie/tourmas
Part of the Food Processing Commons
Recommended Citation Recommended Citation Llovera, A.:The Feasibility of Producing Vacuum-Packed Fermented Vegetable Products. M. Phil Thesis. Technological University Dublin, 2008.
This Theses, Masters is brought to you for free and open access by the Tourism and Food at ARROW@TU Dublin. It has been accepted for inclusion in Masters by an authorized administrator of ARROW@TU Dublin. For more information, please contact [email protected], [email protected].
This work is licensed under a Creative Commons Attribution-Noncommercial-Share Alike 4.0 License

The Feasibility of Producing Vacuum-Packed
Fermented Vegetable Products
Antoni Llovera B. Sc.
A thesis presented to the Dublin Institute of Technology for the award
of Master of Philosophy
June 2008
School of Food Science and Environmental Health
Dublin Institute of Technology, Cathal Brugha St., Dublin 1
Supervisors: Dr. Nissreen Abu-Ghannam &
Dr. Catherine Barry-Ryan

ii
ABSTRACT
The average intake of vegetables in Ireland falls below the recommendations of Bord
Glas and FSAI. Carrots are the third most consumed vegetable in Ireland and they are
an excellent source of vitamins A and B as well as phytochemicals. Lactic acid
bacteria (LAB) are well-known in food for their benefits such as improvement of the
nutritional value of food and improvement of the digestion of lactose. Vegetable
consumption could be enhanced by promoting a novel snack fermented carrot product
that would provide the healthy benefits of vegetables coupled with the benefits of the
probiotic lactic acid bacteria. Two varieties of carrots, Amsterdam (baby carrots) and
Nantes half-long were chosen for this study due to their availability throughout the
year. Carrot sticks (90 mm x 5 mm x 5 mm) were produced to standardize and reduce
the heterogeneity of the raw material. The initial levels of total viable counts on
Amsterdam carrots were established at 2.0x10⁵ cfu/g. Blanching treatments of a
minimum of 40 seconds were required to inactivate the initial microbiological load.
There were no significant differences (p<0.05) in the carrot texture after 40 seconds of
blanching. A carrot juice broth (CJB) was prepared in which the growth of a mixed
culture of L. plantarum and L. brevis was not significantly different (p<0.05) to the
MRS broth after 48 hours of fermentation. Fermentation studies of vacuum-packed
carrot sticks were carried out analysing the effect of 2 factors: pH and LAB load (log
cfu/g) and 4 variables: dipping time meaning the period of time that carrot sticks were
immersed in the CJB inoculated with LAB at different concentrations (1/2/4 hours),
initial LAB concentration of CJB (106/107/108 cfu/g), storage temperature (4/10/25ºC)
and storage time (0/1/7/14 days). ANOVA and variable interactions studies concluded
that conditions such as dipping time of 1 hour, storage temperature of 25ºC and storage
time of 7 days were optimal for fermented carrot sticks production. A preliminary
sensory analysis found no significant differences between fermented carrot sticks (1
day) and unfermented carrot sticks (raw and blanched) in terms of brightness, orange
colour and the overall visual quality implying its acceptability by the panel. This study
proved that carrot sticks may be fermented by lactic acid bacteria in vacuum
conditions.

iii
Declaration page
I certify that this thesis which I now submit for examination for the award of Master of
Philosophy is entirely my own work and has not been taken from the work of others
save and to the extent that such work has been cited and acknowledged within the text
of my work.
This thesis was prepared according to the regulations for postgraduate study by
research of the Dublin Institute of Technology and has not been submitted in whole or
in part for an award in any other Institute or University.
The work reported on in this thesis conforms to the principles and requirements of the
Institute's guidelines for ethics in research.
The Institute has permission to keep, to lend or to copy this thesis in whole or in part,
on condition that any such use of the material of the thesis be duly acknowledged.
Signature __________________________________ Date _______________
Candidate

iv
Acknowledgements
I would like to thank my wife, Aveen for her encouragement and understanding
throughout this work. Her help and support enabled me to complete this project. I am
also highly thankful to Dr. Nisrreen Abu-Ghannam and Dr. Rena Barry-Ryan for their
valuable help, support and guidance in this study.
Also, I am deeply grateful for the cooperation of the technicians in DIT, specially
Plunkett and Tony for their help and advice throughout this project. I am also thankful
to my parents and my sisters for their love and support given through my life.
I wish to express appreciation to the members of DIT; Julien, Peter, Paula, Fintan, June,
Tony, Plunkett, Leixuri and Denise for participating in the sensorial analysis of this
study and their valuable time.
Finally, I wish to express my gratitude to the rest of the people who have been
involved in this project for their time, help and guidance; without them it would not
have been possible.

v
Abbreviations list
1st: First 2nd: Second 3rd: Third €: euro $: American dollar
∅: diameter ºC: grade Celsius %: Percentage µ: micro (10-6) α: alpha β: beta ADP: Adenosine diphosphate ANOVA: Analysis of Variance ATCC: American Type Culture Collection
ATP: adenosine triphosphate ASTM: American Society for Testing and Materials BPW: Buffered peptone water CJB: Carrot juice broth cfu: colony forming unit cm: centimetre Co: company CO2: carbon dioxide DIT: Dublin Institute of Technology e.g.: for example et al.: et alii EU: European Union FAO: Food and Agriculture Organization FDA: Food and Drug Administration FFDCA: Federal Food, Drug and Cosmetic Act of 1938 FSAI: Food Safety Authority of Ireland GI: Gastrointestinal GRAS: Generally Recognized As Safe h: hour ha: hectare HSD: Tukey's Honestly Significant Difference IgA: Immunoglobulin A IgG: Immunoglobulin G IgM: Immunoglobulin M I.U: International Units Kcal: Kilocalories Kg: Kilograms KN: Kilonewtons

vi
L.: Lactobacillus
LAB: Lactic Acid Bacteria Log: logarithm LSD: Least Significant Difference MA: Massachusetts MAP: Modified atmosphere packaging mcg: one millionth mg: milligram min: minutes mL: millilitres MNL: Manual MRS: De Man Rogosa and Sharpe OTR: Oxygen transmission rate OVQ: Overall visual quality PPE: Polyphenyl Ether PS: Peptone saline R2: coefficient of determination rpm: revolutions per minute S.: Streptococcus
sp.: species SPCA: Standard plate count agar sec: seconds TVC: Total viable counts UK: United Kingdom US: United States USDA: United States Department of Agriculture VRBGA: Violet red bile glucose agar WHO: World Health Organization

vii
CONTENTS
Abstract .............................................................................................................. ii
Declaration Page ................................................................................................ iii
Acknowledgements............................................................................................. iv
Abbreviations .....................................................................................................v
Table of contents ................................................................................................vii
List of Tables......................................................................................................x
List of Figures.....................................................................................................xi
CHAPTER ONE: INTRODUCTION..................................................................1
1. Introduction.............................................................................................2
1.1 Vegetables in Ireland and in the Irish diet................................................4
1.2 Carrot anatomy and composition .............................................................7
1.3 Fermented vegetables: History and uses ..................................................10
1.4 Lactic Acid Bacteria – their uses in food .................................................12
1.4.1 Lactic acid fermentation .......................................................................13
1.4.1.1 Conditions that influence the lactic acid fermentation ........................14
1.4.1.1.1 Temperature ...................................................................................15
1.4.1.1.2 Salt concentration ...........................................................................15
1.4.1.1.3 Water activity .................................................................................15
1.4.1.1.4 Hydrogen ion concentration............................................................15
1.4.1.1.5 Oxygen availability.........................................................................16
1.4.1.1.6 Nutrients.........................................................................................16
1.4.2 Lactic acid bacteria benefits .................................................................16
1.5 Functional foods and probiotics products.................................................20
1.6 Blanching................................................................................................24
1.7 Texture....................................................................................................26
1.8 Preliminary sensory analysis ...................................................................28
1.9 Research objectives .................................................................................31
CHAPTER TWO: MATERIALS AND METHODS ...........................................32
2. Materials ...................................................................................................33

viii
2.1 Plant material preparations ......................................................................33
2.1.1 Unpeeled carrots washed with buffered peptone water..........................33
2.1.2 Macerated carrots extraction method ....................................................34
2.2 Microbiological analysis .........................................................................35
2.2.1 Pour plate technique .............................................................................35
2.2.2 Surface spread technique ......................................................................35
2.2.3 Total viable counts ...............................................................................36
2.2.4 Enterobacteriaceae ..............................................................................36
2.2.5 Lactic acid bacteria...............................................................................37
2.2.6 Halotolerance test.................................................................................37
2.3 Blanching................................................................................................38
2.4 Texture analysis of carrots.......................................................................39
2.4.1 Effect of blanching on carrot texture.....................................................39
2.4.2 Relationship between carrot diameter and textural degradation after a
period of blanching times .....................................................................40
2.4.3 Texture comparison of two jar carrot products......................................41
2.5 Modification of the plant material: carrot sticks.......................................42
2.6 Evaluation of O2 and CO2 levels of packaged minimally processed
carrots sticks and blanched carrot sticks .................................................43
2.7 Broth for lactic acid bacteria: Carrot Juice Broth (CJB) ...........................43
2.7.1 Comparison of carrot juice broth and MRS broth..................................44
2.8 Fermentation of carrot sticks ...................................................................44
2.9 Preliminary sensory analysis ...................................................................45
2.9.1 Test sheet preparation...........................................................................45
2.9.2 Panel Initiation .....................................................................................46
2.10 Statistical analysis .................................................................................47
CHAPTER THREE: RESULTS AND DISCUSSION.........................................48
3.1 Determination and identification of the general microflora of carrots.......49
3.1.1 Microbiological analysis of carrots .......................................................49
3.2 Enumeration of halotolerant bacteria on carrots .......................................51

ix
3.3 Blanching of carrots ................................................................................53
3.4 Texture analysis of carrots.......................................................................54
3.4.1 Effect of blanching on carrot texture.....................................................55
3.4.2 Relationship between carrot diameter and textural degradation after a
period of blanching times .....................................................................57
3.4.3 Texture analysis of two jar carrot products ...........................................61
3.5 Modification of the plant material: carrot sticks.......................................61
3.6 Evaluation of O2 and CO2 levels on packaged minimally processed
carrots sticks and blanched carrot sticks .................................................62
3.7 Utilization of carrot juice as a new growth media for lactic acid bacteria .65
3.7.1 Comparison of LAB growth in carrot juice broth (CJB) and
MRS broth............................................................................................65
3.8 Fermentation of carrot sticks ...................................................................68
3.8.1 Changes in pH over the fermentation of carrot sticks ............................70
3.8.2 Changes in LAB concentration over the fermentation of carrot sticks ...76
3.9. Preliminary sensory analysis of the carrot sticks .....................................82
CHAPTER FOUR: CONCLUSIONS .................................................................87
4. Conclusions...............................................................................................88
REFERENCES ...................................................................................................91
APPENDIX A ....................................................................................................112
APPENDIX B.....................................................................................................118
APPENDIX C.....................................................................................................121

x
LIST OF TABLES
Table 1.1. Constituents of fruits and vegetables that have a positive impact
on human health and their sources.......................................................................3
Table 1.2. Vegetable Consumption in Ireland on a daily basis ............................6
Table 1.3. Nutrient content in 100 g of carrots....................................................8
Table 1.4. Principal genera of the lactic acid bacteria used in food fermentations..... 13
Table 1.5. Selected health-promoting lactic acid bacteria, their health
impact and mechanisms of action........................................................................19
Table 1.6. Requirements for the safety and quality of probiotic food
supplements ........................................................................................................22
Table 1.7. Optimum blanching times for some vegetables ..................................25
Table 3.1. Total Viable Counts, Enterobacteriaceae and Lactic Acid Bacteria
loads on Amsterdam carrots both macerated and unpeeled whole carrots
washed with BPW...............................................................................................49
Table 3.2. Maximum load (N) for shearing canned carrot products A and B .......61
Table 3.3. Multifactor ANOVA of the effect fermentation on the pH of
carrot sticks ........................................................................................................70
Table 3.4. Multifactor ANOVA of the effect fermentation on the LAB
concentration of carrot sticks .............................................................................77

xi
LIST OF FIGURES
Figure 1.1. Production area (ha) of the most important field vegetables
in Ireland 1999 & 2002 .......................................................................................5
Figure 1.2. Production value (106 Euro) of most important field vegetables
in Ireland 1999 & 2002 .......................................................................................5
Figure 1.3. The two pathways of lactic acid fermentation...................................14
Figure 1.4. Main structural features of a plant cell..............................................27
Figure 2.1. Flow diagram of the methodology used for unpeeled carrots
washed with buffered peptone water ...................................................................34
Figure 2.2. Flow diagram of the methodology used for macerated carrots ..........34
Figure 2.3. Illustration of the system used for blanching Amsterdam carrots ......38
Figure 2.4. Flow diagram of the blanching experiment carried out on
Amsterdam carrots followed by microbiological analysis....................................39
Figure 2.5. Universal Testing machine Instron 4302...........................................40
Figure 2.6a. Flow diagram design used to determine the effect of blanching
on the texture of the carrots.................................................................................40
Figure 2.6b. Two groups of carrots used (1st group: 2 carrots with diameter
bigger than 40 mm / 2nd group: 3 carrots with diameter smaller than 10 mm) ......41
Figure 2.7.a. Carrots product A examined (Supervalu baby carrot).....................42
Figure 2.7.b. Carrots product B examined (Lidl, Gem whole carrots).................42
Figure 2.8 Carrot sticks produced by Megamix 5100..........................................42
Figure 2.9. Flow diagram representing the steps carried out during the
fermentation of carrot sticks................................................................................45
Figure 3.1. Microbiological loads of carrots (variety Amsterdam)
under halophilic conditions of 2%, 4% and 6.5% NaCl .......................................52
Figure 3.2. Microbiological loads on carrots (variety Amsterdam) after blanching
for 10-60 seconds................................................................................................54
Figure 3.3. A typical curve of shear force (kN) versus displacement upon
shearing of raw Amsterdam carrots .....................................................................55

xii
Figure 3.4. Shear Force (N) for shearing raw Amsterdam carrots over
a range of blanching times ..................................................................................56
Figure 3.5a. Carrots (variety Amstedam) with a range of diameters ...................58
Figure 3.5b. Carrots (variety Amstedam) in retail packs.....................................58
Figure 3.6 Maximum load (N) for shearing the two groups of carrots
after blanching for 30 to 270 seconds..................................................................59
Figure 3.7. O2% and CO2% levels of packed blanched and minimally
processed (MP) carrot sticks monitored over 72 hours ........................................64
Figure 3.8. Lactic acid bacteria load (Log cfu/ml) in CJB and MRS broth
monitored over 48 hours ....................................................................................67
Figure 3.9. Flow-chart representing the steps carried out for the carrot sticks
fermentation........................................................................................................69
Figure 3.10. Graphical ANOVA of the fermentation factors with respect to pH
of carrot sticks ....................................................................................................71
Figure 3.11. Means and 95% LSD intervals plots for the different levels of
the factors initial LAB concentration, dipping time, storage time and
storage temperature ............................................................................................72
Figure 3.12. Interaction plots between the initial LAB concentration time –
storage time, initial LAB concentration - storage temperature, dipping time –
storage temperature, storage time – storage temperature (95.0% LSD) ................74
Figure 3.13. Graphical ANOVA of the fermentation factors with respect to LAB
concentration (cfu/g) of carrot sticks ...................................................................78
Figure 3.14. Means and 95% LSD intervals plots for the factors initial LAB
concentration, dipping time, storage time and storage temperature for the
variable LAB concentration (cfu/g).....................................................................79
Figure 3.15. Interaction plots between the initial LAB concentration time and
storage time at 95% LSD and Tukey’s HSD intervals .........................................80
Figure 3.16. Spider graphic with the sensory scores for the two groups of carrot
sticks. ..................................................................................................................83

- 1 -
CHAPTER ONE
Introduction
- 2 -
1. Introduction
As a food group, vegetables are low fat and highly nutritious because they contain a
variety of vitamins such as A, B1 (thiamine), B3 (niacin), B6 (pyridoxine), C (ascorbic
acid) and E (α-tocopherol) (Quebedeaux and Bliss, 1988; Quebedeaux and Eisa, 1990),
and minerals such as magnesium (Mg), iron (Fe), calcium (Ca), potassium (K),
manganese (Mn), zinc (Zn), and phosphorus (P) (Decuypere, 2005).
Some components of vegetables are strong antioxidants such as selenium, flavonoids,
carotenoids and vitamins C and E and function to modify the metabolic activation and
detoxification of carcinogens (Wargovich, 2000). Consequently, diets rich in
vegetables are associated with the reduced risk of many chronic diseases (Farley,
1996) and the consumption of vegetables have been strongly associated with reduced
risk to some forms of cancer, heart disease and stroke (Prior and Cao, 2000).
Fibre plays a very important role in the human diet as it provides a variety of health
benefits (Sudha et al., 2006). It is beneficial for many health conditions, such as
constipation, haemorrhoids, appendicitis, diverculitis, colon cancer and diabetes (Van
Duyn and Pivonka, 2000). It prevents compaction of the intestinal contents and
stimulates the gastrointestinal tract muscles. In particular, soluble fibre is known for its
hypocholesterolemic effect and insoluble fibre is known for reduction in the risk of
colon cancer (Farley, 1996).
Because of their inherent health benefits, recommendations to consume more fruits and
vegetables are included in the dietary guidelines of many countries. A major initiative
of Food Dudes or 5 A Day program (Produce for Better Health Foundation, 2005)
advises each person to eat five or more servings of fruits and vegetables each day.
However, fruit and vegetable intake usually falls below these recommendations (Satia
et al., 2002). It may be more challenging to increase vegetable intake rather than fruit
intake as fruits require less preparation and, usually, have a sweeter taste. Further, high
consumption of convenience products, pre-packed and ready-to-eat products

- 3 -
contributes to the low intake of fruits and vegetables. The programme 5-a-Day
challenges individuals, families, schools, and communities to increase fruit and
vegetables consumption to reduce risk of disease and achieve good health. Examples
of the components of fruits and vegetables that have positive effects on human health
and their important sources are shown in Table 1.1.
Table 1.1. Constituents of fruits and vegetables that have a positive impact on human
health and their sources.
Constituent Sources Human diseases Impact
Vitamin C
Broccoli, cabbage, cantaloupe, citrus fruits, guava,
kiwifruit, leafy greens, pepper, pineapple, potato,
strawberry, tomato
Vitamin A
Dark-green vegetables (collards, spinach, and turnip
greens), orange vegetables, (carrots, pumpkin, and sweet
potato), orange-flesh fruits (apricot, cantaloupe, mango,
nectarine, orange, papaya, peach, persimmon, and
pineapple), tomato
Vitamin E Nuts (almonds, cashew nuts, filberts, macadamias,
pecans, pistachios, and walnuts)
Cancer, cataracts, heart disease,
stroke
Fiber Most fresh fruits and vegetables, nuts cooked dry beans
and peas Diabetes , heart disease
Folate
Dark-green leafy vegetables (spinach mustard greens,
and romaine lettuce), legumes (cooked dry beans and
peas, green peas), oranges
Birth defects, cancer, heart
disease
Potassium
Baked potato or sweet potato, banana & plantain, cooked
dry beans, cooked greens, dried fruits (apricot and
prune), winter (orange) squash
Hypertension, stroke
(Source: Produce for Better Health Foundation, 2005 & USDA 2005b).

- 4 -
Efforts to encourage higher vegetable and fruit consumption may be more successful if
programmes to promote healthful lifestyles and also, factors such as levels of physical
activity and fat intake are incorporated in the general population (Kristal et al., 2000).
1.1 Vegetables in Ireland and in the Irish diet
Ireland has a temperate climate which influences the types of crops grown as well as
the pattern of demand for vegetable lines. Traditionally, brassicas and root crops
tended to be the main staple produce items consumed in colder/winter weather whereas
salad vegetables came into their own in the warmer summer months (Bord Glas,
2003b). However, more recently there has been increased demand for salad vegetables
all the year round in line with healthy eating trends and mainland Continental
European culinary influences.
According to the last census reported edited in 2003 (Field vegetables census) by Bord
Bia, Dublin is the most important county involved in the production of field vegetables
with 32% of all growers accounting for 41% of the total production area and 50% of
the total farmgate value. Leinster, in general, tends to dominate the sector with six of
the top seven field vegetable producing counties.
Cabbage and carrots are the two most important crops in terms of both production area
and farmgate value. In 2002, 918 hectares of cabbage were grown (Figure 1.1), with an
estimated farmgate value of €7.6 million (Figure 1.2). Approximately 694 hectares of
carrots were grown with an estimated farmgate value of €8.2 million (Bord Glas,
2003a).

- 5 -
Figure 1.1. Production area (ha) of the most important field vegetables in Ireland 1999
& 2002 (Source: Bord Glas, 2003a)
Figure 1.2. Production value (106 Euro) of most important field vegetables in Ireland 1999 & 2002 (Source: Bord Glas, 2003a)
The importance of vegetables in the Irish diet was highlighted in the last available
survey published North/South Ireland Food Consumption Survey in 2000 (Table 1.2).
The average intake of vegetables (in either their fresh or processed form) is 122g per
person (Table 1.2) per day across the island. Only 57% of the population consume
vegetables (in either their fresh or processed form) on a daily basis (Table 1.2).
Although contributing only 4% to daily energy intake, vegetables were found to
contribute 16% of daily dietary fibre intake.

- 6 -
Table 1.2. Vegetable Consumption in Ireland on a daily basis
Mean grammes /
person
% Consumption
population / day
Vegetable & Pulse Dishes 17 50
Peas, Beans & Lentils 23 75
Green Vegetables 14 63
Carrots 15 66
Salad Vegetables 24 76
Other Vegetables 25 85
Tinned or Jarred Vegetables 3 23
Nuts & Seeds, Herbs & Spices 1 18
Mean 122 57
(Source: North/South Ireland Food Consumption Survey, Irish Universities Nutrition Alliance, 2000)
Vegetables have been a main component of traditional Irish cooking and recipe dishes
for centuries. Vegetables and potatoes (and other carbohydrate-rich food such as pasta
and rice) are consumed as the main component of everyday meals. Their versatility,
taste and texture allow them to be used in a variety of different ways in a multitude of
dishes. Vegetables are consumed all the year round, prepared hot or eaten in their raw
state and are valued principally as a major source of dietary fibre (Bord Glas, 2003b).
In particular, carrots are the 3rd most consumed vegetable after a group of other
vegetables, salad vegetables and peas, beans and lentils. Carrot characteristics such as
colour, shape and continuous availability in the Irish market make them an attractive
and potential key-vegetable that could be used to enhance the Irish vegetables
consumption.

- 7 -
1.2 Carrot anatomy and composition
Carrot (Daucus carota) is a root vegetable described as an edible, reddish yellow and
fusiform root (Llorca, 2001). Like other thick fleshy roots, carrot originates from
secondary growth of the merismatic tissue or cambium which forms the xylem (inner
portion) and phloem (outer portion). It is a vegetable widely cultivated in Ireland and
from a nutritional point of view the carrot is an excellent source of vitamins and
minerals. It contains about 85-90% water and it is an excellent source of vitamins B
and C as well as calcium pectate, an extraordinary pectin fibre that has been found to
have cholesterol-lowering properties (USDA Nutrient Data Base, 2005a). Carrots also
contain, in smaller amounts, essential oils, carbohydrates and nitrogenous composites.
They are well-known for their sweetening, antianaemic, healing, diuretic,
remineralizing and sedative properties (McKevith, 2005).
The three most important elements found in carrots are ß-carotene, vitamin A, and
phytochemicals. ß-carotene usually receives most attention when examining carrots
and also, the high level of beta-carotene is very important because it gives carrots their
distinctive orange colour. It is one of about 500 similar compounds called carotenoids,
which are present in many fruits and vegetables. The body changes ß-carotene into
vitamin A, which is important in strengthening the mucous membranes, bones, teeth,
vision and reproduction (Llorca, 2001), the immune system, immune skin protection,
lungs and intestinal track and promoting healthy cell growth (Montaño et al., 1997).
Vitamin A is a pale yellow primary alcohol derived from carotene. In addition, dietary
vitamin A, in the form of ß-carotene, an antioxidant, may help reduce the risk of
certain cancers. However, ß-carotene is much more than the precursor for vitamin A.
Not all ß-carotene content is converted to vitamin A, the unchanged portion contributes
to boosting the immune system and is also a potent antioxidant. Raw carrots are an
excellent source of vitamin A and potassium; they contain vitamin C, vitamin B6,
thiamine, folic acid, and magnesium (Table 1.3). Cooked carrots are an excellent
source of vitamin A, a good source of potassium, and contain vitamin B6, copper, folic
acid, and magnesium (Table 1.3).

- 8 -
Table 1.3. Nutrient content in 100 g of carrots
Nutrients Units Raw carrots Cooked carrots, drained
(without salt)
Water g 88.29 90.17
Energy kcal 41 35
Protein g 0.93 0.76
Total lipid (fat) g 0.24 0.18
Carbohydrate g 9.58 8.22
Fiber, total dietary g 2.8 3
Minerals
Calcium, Ca mg 33 30
Iron, Fe mg 0.3 0.34
Magnesium, Mg mg 12 10
Phosphorus, P mg 35 30
Potassium, K mg 320 235
Sodium, Na mg 69 58
Zinc, Zn mg 0.24 0.20
Copper, Cu mg 0.045 0.017
Manganese, Mn mg 0.143 0.7155
Selenium, Se mcg 0.1 0.7
Vitamins
Vitamin C mg 5.9 3,6
B-1 (thiamin) mg 0.066 0.066
B-2 (riboflavin) mg 0.058 0.044
B-3 (niacin) mg 0.983 0.645
B-5 (pantothenic acid) mg 0.273 0.232
B-6 (pyridoxine) mg 0.138 0.153
Folate, total mcg 19 14
Vitamin A, IU I.U *1 16811 17202
Vitamin E (α-tocoferol) mg 0.66 1.03
Vitamin K (phylloquinone) mcg 13.2 13.7 *1 International units (Source: USDA Nutrient Database, 2005a)
Exposure to sunlight, cigarette smoke and air pollution, along with body's every day
cellular activities, cause free radicals to form (Montaño et al., 1997). Antioxidants
fight free radicals and help prevent them from causing membrane damage, DNA

- 9 -
mutation, and lipid (fat) oxidation, all of which may lead to many of the diseases that
are considered "degenerative." It is free radical havoc that is believed to be pivotal in
the development of age related degenerative diseases such as cancer,
cataracts, arthritis, heart disease and even asthma (Ong and Chytil, 1983). It is highly
recommended that vitamin A be consumed in the diet rather than from supplements
(particularly in the case of ß-carotene), because vitamin A obtained from a varied diet
offers the maximal potential of health benefits that supplements cannot (USDA,
2005b).
Vitamin A is found in a variety of dark green and deep orange fruits and vegetables,
such as carrots, sweet potatoes, pumpkin, spinach, butternut squash, turnip greens,
mustard greens and lettuce (Montaño et al., 1997). ß-carotene is the most active
carotenoid (the red, orange, and yellow pigments) form of vitamin A, but it is
inefficiently absorbed and converted to retinol as compared to vitamin A from animal
sources.
Phytochemicals which are found in vegetables, fruits and nuts, may reduce the risk of
cancer, strokes, hinder the ageing process, balance hormonal metabolism and have
antiviral and antibacterial properties (Ong and Chytil, 1983). A phytochemical is a
natural bioactive compound found in plant foods that works with nutrients and dietary
fibre to protect against disease (Prakash et al., 2004). Research suggests that
phytochemicals, working together with nutrients found in fruits, vegetables and nuts,
may help slow the ageing process and reduce the risk of many diseases, including
cancer, heart disease, stroke, high blood pressure, cataracts, osteoporosis and urinary
tract infections (Llorca, 2001). They can have complementary and overlapping
mechanisms of action in the body, including antioxidant effects, modulation of
detoxification enzymes, stimulation of the immune system, modulation of hormone
metabolism, and antibacterial and antiviral effects.

- 10 -
Many phytochemicals are thought to be destroyed or removed by modern food
processing techniques, possibly including cooking. For this reason, it is believed that
industrially processed foods are less beneficial (contain fewer phytochemicals) than
unprocessed foods. The absence or deficiency of phytochemicals is also, believed to
have contributed to the increased prevalence of the previously mentioned preventable
or treatable causes of death in contemporary society (Prakash et al., 2004).
1.3 Fermented Vegetables: History and uses
Fermentation is one of the oldest forms of food preservation technologies in the world
(Battcock and Azam-Ali, 1998). Fermented vegetable products have been used for a
long time (Lee, 1994). There is reliable information that fermented drinks were being
produced over 7,000 years ago in Babylon (now Iraq) 5,000 years ago, in Egypt 3,500
years ago in Mexico and in Sudan (Dirar, 1993). Indigenous fermented foods such as
bread, cheese and wine, have been prepared and consumed for thousands of years and
are linked to culture and tradition, especially in rural households and village
communities. Bread-making probably originated in Egypt over 3,500 years ago
(Sugihara, 1985) and fermentation of milk started in many places with evidence of
fermented products in use in Babylon over 5,000 years ago (Yokotsuka, 1985).
However, the scientific understanding of fermentation microbiology and biotechnology
only began in the 1850s, after Louis Pasteur succeeded in isolating two different
alcohol components (L and D amyl alcohol). In 1857, Pasteur published the results of
his studies on fermentation which marked the birth of fermentation microbiology,
which later on would be called biotechnology, as a new discipline (El-Mansi and
Bryce, 1999).
Fermentation can be defined as a relatively efficient, low energy preservation process
which increases the shelf life and decreases the need for refrigeration or other form of
food preservation technology (Battcock and Azam-Ali, 1998). It is therefore a highly

- 11 -
appropriate technique for use in developing countries and remote areas where the
process developed in the first place. Fermented foods are popular throughout the world
and in some regions make a significant contribution to the diet of millions of
individuals. Fermentation is the "slow decomposition process of organic substances
induced by micro-organisms, or by complex nitrogenous substances (enzymes) of
plant or animal origin" (Walker, 1998). It can be described as a biochemical change,
which is brought about by the anaerobic or partially anaerobic oxidation of
carbohydrates by either micro-organisms or enzymes. This is distinct from
putrefaction, which is the degradation of protein materials (Battcock and Azam-Ali,
1998). The changes caused by fermentation can be both beneficial and harmful.
Fermentation is initiated by the action of micro-organisms which occur naturally and is
often part of the process of decay, especially in fruits and vegetables. However,
fermentation can be controlled to give beneficial results. A balanced microbial growth
during the fermentation is required to achieve the optimum fermentation. An excess
overgrowth during the fermentation could produce instable conditions such as low pH
and production of undesirable products such biogenic amines (Lonvaud-Funel, 2001).
Most, if not all vegetables, may be pickled in acetic acid or more commonly known as
brine. The most important products produced entirely or in part by fermentation are
pickles, sauerkraut and olives, although lesser quantities of other vegetables are, also
fermented such as carrots, cauliflower, celery, onions, sweet and hot peppers and
tomatoes (Wood, 1992). Traditionally, vegetables are immersed in acetic acid (pickling
process) which is inoculated with a certain concentration of the bacteria, generally,
lactic acid bacteria (105-109 cfu/ml) for a period of time that depends on the product
(from days to several months). Generally, the fermentation takes place in the dark with
an optimum temperature range of 15-25ºC. During this period of time, fermentation
takes place changing the characteristics of the vegetables (colour, aroma, flavour, and
texture) and producing a new product different from the original one. Probably, the
most famous and well-known product that uses the technique described above is
sauerkraut. Sauerkraut is produced by immersing finely sliced cabbage in a container

- 12 -
of brine containing salt (1-3%) and 108-109 cfu/ml of lactic acid bacteria (Kalac et al.,
2000). Traditionally, the container is a stoneware crock and the seal is created with a
piece of wet linen cloth, a board, and a heavy stone. This arrangement is not fully
airtight and will lead to spoiled sauerkraut unless the surface of the brine is skimmed
daily to remove molds and other aerobic contaminants that grow on the surface where
there is contact with air. When this trough is filled with water the result is an airtight
seal. Fully cured sauerkraut keeps for several months in an airtight container stored at
or below 15°C. Temperature control is critical, because spoilage leading to food
poisoning can occur if the fermentation temperature is too high (Viander et al., 2003).
The production of different compounds during the fermentation, such as lactic acid and
acetic acid by lactic acid bacteria is effective at preventing the growth of most
pathogenic food microorganisms (Lee, 1994). The main types of microorganisms used
include lactic acid bacteria such as Lactobaccillus spp. (L. plantarum, L.
mesenteroides and L. brevis) and Pediococcus cerevisiae.
1.4 Lactic Acid Bacteria – their uses in food
Lactic acid bacteria (LAB) are a group of gram positive bacteria, anaerobic and
aerobic bacteria, non-spore forming, cocci or rods, which produce lactic acid as the
major end product of the fermentation of carbohydrates (El-Mansi and Bryce, 1999).
They are the most important bacteria in desirable food fermentations, being
responsible for the fermentation of sour dough bread, sorghum beer, all fermented
milks and most fermented vegetables. Historically, bacteria from the genera
Lactobacillus, Leuconostoc, Pediococcus and Streptococcus are the main species
involved although several more have been identified, but play a minor role in lactic
fermentations (Wood, 1992). They have been used to ferment or culture foods for at
least 4,000 years (EUFIC, 2000).
- 13 -
Lactic acid bacteria carry out their reactions - the conversion of carbohydrate to lactic
acid, carbon dioxide and other organic acids - without the need for oxygen (Renault,
2002). Some of the strains are homofermentative; they predominantly produce lactic
acid, while others are heterofermentative and produce lactic acid and other volatile
compounds and small amounts of alcohol (Beasley, 2004). All species of lactic acid
bacteria have their own particular reactions and niches, but overall, homofermentative
bacteria produces high acidity in vegetable fermentations and play the major role. The
lactic acid produced by the lactic acid bacteria is effective in inhibiting the growth of
other bacteria.
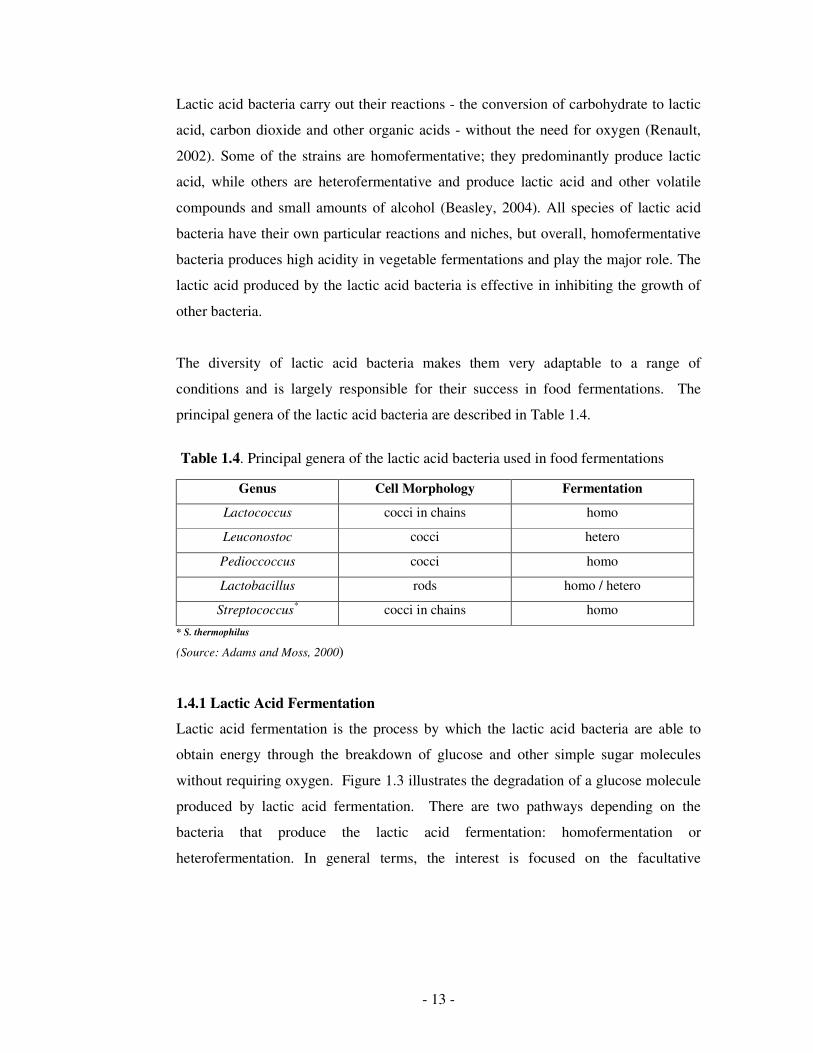
The diversity of lactic acid bacteria makes them very adaptable to a range of
conditions and is largely responsible for their success in food fermentations. The
principal genera of the lactic acid bacteria are described in Table 1.4.
* S. thermophilus
(Source: Adams and Moss, 2000)
1.4.1 Lactic Acid Fermentation
Lactic acid fermentation is the process by which the lactic acid bacteria are able to
obtain energy through the breakdown of glucose and other simple sugar molecules
without requiring oxygen. Figure 1.3 illustrates the degradation of a glucose molecule
produced by lactic acid fermentation. There are two pathways depending on the
bacteria that produce the lactic acid fermentation: homofermentation or
heterofermentation. In general terms, the interest is focused on the facultative
Table 1.4. Principal genera of the lactic acid bacteria used in food fermentations
Genus Cell Morphology Fermentation
Lactococcus cocci in chains homo
Leuconostoc cocci hetero
Pedioccoccus cocci homo
Lactobacillus rods homo / hetero
Streptococcus* cocci in chains homo
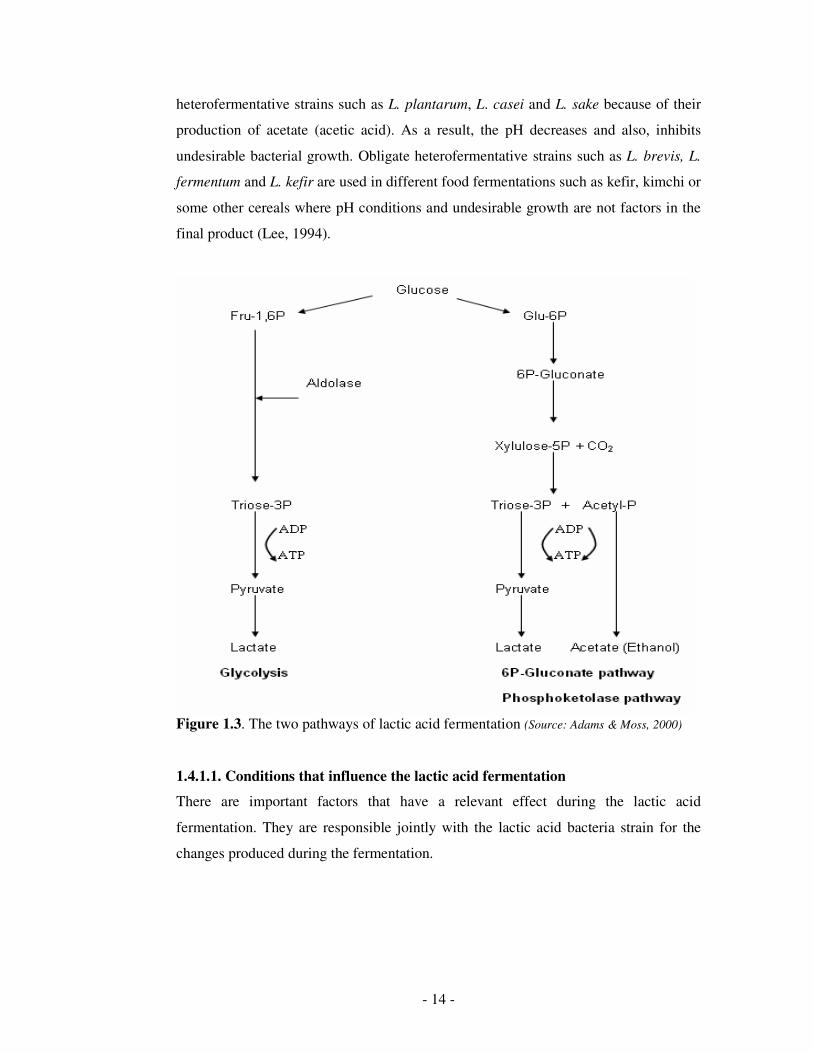
- 14 -
heterofermentative strains such as L. plantarum, L. casei and L. sake because of their
production of acetate (acetic acid). As a result, the pH decreases and also, inhibits
undesirable bacterial growth. Obligate heterofermentative strains such as L. brevis, L.
fermentum and L. kefir are used in different food fermentations such as kefir, kimchi or
some other cereals where pH conditions and undesirable growth are not factors in the
final product (Lee, 1994).
Figure 1.3. The two pathways of lactic acid fermentation (Source: Adams & Moss, 2000)
1.4.1.1. Conditions that influence the lactic acid fermentation
There are important factors that have a relevant effect during the lactic acid
fermentation. They are responsible jointly with the lactic acid bacteria strain for the
changes produced during the fermentation.

- 15 -
1.4.1.1.1. Temperature
Different bacteria can tolerate different temperatures, which provide enormous scope
for a range of fermentations (Wood, 1992). While most bacteria have a temperature
optimum of between 20 to 30ºC, there are some (thermophiles) which prefer higher
temperatures (50 to 55ºC) and those with colder temperature optima (15 to 20ºC). Most
lactic acid bacteria work best at temperatures of 18 to 22ºC. The Leuconostoc sp.
which initiate fermentation of some products (e.g. sour cream) have an optimum of 18
to 22ºC. Temperatures above 22ºC, favour the Lactobacillus species (El-Mansi and
Bryce, 1999).
1.4.1.1.2. Salt concentration
Lactic acid bacteria tolerate high salt concentrations (Viander et al., 2003). Salt
tolerance gives them an advantage over other less tolerant species and allows the lactic
acid bacteria to begin their metabolism, thus producing acid, which further inhibits the
growth of non-desirable organisms. Leuconostoc sp. is noted for its high salt tolerance
and for this reason, initiates the majority of vegetable fermentations (e.g. kimchi –
Korean fermented cereal and cabbage)
1.4.1.1.3. Water activity
Lactic acid bacteria require a fairly high water activity (0.9 or higher) to survive
(Fajardo-Lira et al, 1997). There are a few species, some LAB (e.g. L. curvatus or L.
danicus) that can tolerate water activities lower than this, but usually yeasts and fungi
predominate on foods with a lower water activity.
1.4.1.1.4. Hydrogen ion concentration (pH)
The optimum pH for most bacteria is near the neutral point (pH 7.0). Certain bacteria
are acid tolerant and will survive at reduced pH levels (Wood, 1992). Notable acid-
tolerant bacteria include the Lactobacillus and Streptococcus species, which play a role
in the fermentation of dairy and vegetable products.
- 16 -
1.4.1.1.5. Oxygen availability
Some of the fermentative bacteria are anaerobes, while others require oxygen for their
metabolic activities (Wood, 1992). They grow in the presence of reduced amounts of
atmospheric oxygen. In aerobic fermentations, the amount of oxygen present is one of
the limiting factors. As a result, the amount of substrate consumed and the energy
released from the reaction is determined by the type and amount of oxygen present.
1.4.1.1.6. Nutrients
All bacteria require a source of nutrients for metabolism. The fermentative bacteria
require carbohydrates – either simple sugars such as glucose and fructose or complex
carbohydrates such as starch or cellulose Gardner et al. (2001). The growth of lactic
acid bacteria, and in general for all bacteria can be modeled with four different phases:
lag phase, exponential phase, stationary phase, and decline phase.
The effects of lactic acid fermentation on different vegetables have been widely
studied in recent years. Some examples of these studies are the effects of fermentation
of onions (Roberts and Kidd, 2005), cabbage (Osaro, 2003), cucumber (Lu et al.,
2003), carrot-orange juice (Nagy-Gasztonyi et al., 2002), and carrots (Llorca, 2001).
The main aim of these studies was to ferment the product, producing changes during
fermentation and then, determine the effects on texture, pH, colour and level of lactic
acid bacteria.
1.4.2 Lactic acid bacteria benefits
Lactic acid bacteria are substances generally recognized as safe- GRAS (Holzapfel et
al., 1998). It is a Food and Drug Administration (FDA) designation for a chemical or
substance added to food and considered safe by experts, and it is exempted from the
usual Federal Food, Drug, and Cosmetic Act (FFDCA) food additive tolerance
requirements.

- 17 -
LAB constitute an integral part of the healthy gastrointestinal (GI) microecology and
are involved in the host metabolism (Fernandes et al., 1987). LAB along with other gut
microbiota ferment various substrates like lactose, biogenic amines and allergenic
compounds into short-chain fatty acids and other organic acids and gases (Gibson and
Fuller, 2000; Gorbach, 1990). LAB synthesize enzymes, vitamins, antioxidants and
bacteriocins (Fernandes et al., 1987; Knorr, 1998). With these properties, intestinal
LAB constitute an important mechanism for the metabolism and detoxification of
foreign substances entering the body (Salminen, 1990).
LAB have been found to control intestinal disorders, partially due to serum antibodies
IgG, and secretory IgA and IgM enhancing immune response (Cross, 2002; Grangette
et al., 2001; Kimura et al., 1997; Link-Amster et al., 1994; Perdigón et al., 1999).
Certain strains of LAB can intermittently translocate across the intestinal mucosa
without causing infection (Berg, 1995), thus influencing systemic immune events
(Cross, 2002). Evidence has been presented that some lactobacilli can directly
stimulate the immune system on the gut mucosal surface via localized GI tract
lymphoid cell foci (Perdigón et al., 1999).
Lactic acid bacteria are well-known for their ability to produce antimicrobial
substances (El-Mansi and Bryce, 1999). Technically, this group of antimicrobial
substances is described as bacteriocins. Bacteriocins were defined by Jacob et al.
(1953) as protein antibiotics, an antibacterial substance produced by a strain of certain
bacteria, which is harmful to another strain within the same family. Bacteriocins,
generally are produced during the fermentation process. The amount of available
carbohydrates are reduced resulting in a range of small molecular mass organic
molecules that exhibit antimicrobial activity (bacteriocins), commonly being lactic,
acetic and propionic acid (Blom and Mörtvedt, 1991).
Also, LAB capable of secreting antimicrobial peptides are used in a probiotic manner
as food preservatives as well as health-promoting agents for humans (Barefoot and
Nettles, 1993; Ryan et al., 1996; Ocaña et al., 1999; O’Sullivan et al., 2002) and

- 18 -
animals (Robredo and Torres, 2000; Ryan et al., 1996). For probiotic purposes,
bacteriocins are generally produced by a LAB strain in the product (Bernet-Camard et
al., 1997; Dunne and Shanahan, 2003; Joosten and Nuñez, 1996; Yuki et al., 1999).
Bacteriocins produced by LAB have been reported to permeate the outer membrane of
Gram-negative bacteria and to induce the inactivation of Gram-negative bacteria in
conjunction with other enhancing antimicrobial environmental factors, such as low
temperature, organic acid and detergents (Alakomi et al., 2000; Elliason and Tatini,
1999). Bacteriocins produced by LAB are classified into three main groups;
lantibiotics - most documented and industrially exploited (Class I), nonlantibiotics,
small heat-stable peptides (Class II) and large heat-labile protein (Class III)
(O’Sullivan, et al., 2002).
The lantibiotic nisin naturally produced by Lactococcus lactis ssp. lactis is
commercially available as food additive E234. The nisin variants A and Z, differing by
one amino acid (De Vos et al., 1993), are approved for use in foodstuffs by food
additive legislating bodies in the US (Food and Drug Administration, FDA) and in the
EU (Thomas et al., 2000). Nisin applied as a food preservative extends the shelf life of
a product (O’Sullivan, et al., 2002; Zottola et al., 1994). It is relatively stable in
foodstuffs since 15 – 20% of nisin is lost in heat treatment (Thomas et al., 2000).
Bacteria have self-protective mechanisms limiting the bacteriocin production, as in the
case of nisin-producing Lactococcus lactis (Immonen and Saris, 1998; Kuipers et al.,
1993; Qiao et al., 1995). The bacteriocin production is highest at the end of the
exponential and early stationary phase (Daba et al., 1993; Thomas et al., 2000) and
reduction is caused by proteolytic degradation of the bacteriocin (De Vuyst and
Vandamme, 1994; Thomas et al., 2000).
The health-promoting effects of LAB are strain specific and result in different
mechanisms to produce beneficial health impacts (Table 1.5)

- 19 -
Table 1.5. Selected health-promoting lactic acid bacteria, their health impact and
mechanisms of action
Health Effect Mechanisms of action Strain example Reference
Relieve lactose intolerance symptoms
Hydrolysing lactose into glucose and galactose and forming the physical appearance of milk into a thick substance, such as yogurt, that passes through the GI tract slowly, reducing the lactose pulse in the colon.
Lactobacillus
rhamnosus GG
Drouault and Corthier, 2001 Heyman, 2000 Hove et al., 1999
Control viral, bacterial and antibiotic associated diarrhoea in humans and animals
Reinforcing the local immune defence through specific IgA response to rotavirus and pathogens.
L. rhamnosus
GG L. reuterii
Enterococcus
faecium
Ehrmann et al., 2002 Heyman, 2000 Majamaa & Isolauri, 1997 Oksanen et al., 1990 Vahjen and Männer, 2003
Prevention of allergies and atopic eczema
Prevention is partially due to serum antibodies IgG and secretory IgA and IgM immune response enhanced by probiotics
L. rhamnosus
GG Bifidobacterium
lactis Bb-12
Cross, 2002 Link-Amster et al., 1994 Perdigón et al., 1999 Majamaa & Isolauri, 1997 Isolauri et al., 2000
Prevention of intestinal bacterial enzymes involved in the synthesis of colonic carcinogens
Enhancing host’s immune response, binding and degrading carcinogens, producing antimutagenic compounds, alteration of metabolic activities of intestinal bacteria and alteration of physiochemical conditions in colon might work to prevent cancer.
B. bifidum
B. infantis
B. longum
L. acidophilus
L. paracasei
Hirayama & Rafter, 2000 Rolfe, 2000 Sanders, 1998
Inactivation and reduction of pathogenic bacteria
Production of antimicrobic substances and Competitive Exclusion (CE).
Lactococcus
lactis
Pediococcus
acidilactici
Elliason & Tatini, 1999 Nurmi & Rantala, 1973 O’Sullivan et al., 2002
Direct stimulation of the immune system on the gut mucosal surface
Adherence to mammalian extracellular matrix. Stimulation via localized GI tract lymphoid cell foci.
L. crispatus
strains JCM1132, ST1, A33 and 134mi L. gasseri CT5 L. reuteri CT7
Edelman et al., 2002 Toba et al., 1995
(Source: Beasley, 2004)
- 20 -
There have been many studies (Stanton et al., 2005; Ross et al., 2000; Stanton et al.,
1998) in the recent years carried out in Ireland regarding probiotic lactic acid bacteria
and their effect on animals and dairy products. The production of probiotic cheese and
the study of fermented functional food based on probiotics are some of these studies.
Also, lactic acid bacteria are commercially used as starter cultures for the manufacture
of dairy-based probiotic foods (Heenan et al., 2002) and they are regarded as a major
group of probiotic bacteria (Collins et al., 1998; Tannock, 1998; Schrezenmeir and de
Vrese, 2001).
1.5 Functional Foods and Probiotics Products
Functional foods are defined as ‘foods that contain some health-promoting
component(s) beyond traditional nutrients’ (Shah, 2001). The term functional foods
was first introduced in Japan in the mid-1980s and refers to processed foods containing
ingredients that aid specific bodily functions in addition to being nutritious (Hasler,
1998). Functional foods are also known as designer foods, medicinal foods,
nutraceuticals, therapeutic foods, superfoods, foodiceuticals, and medifoods (Shah,
2001). In general, the term refers to a food that has been modified in some way to
become “functional”. One way in which foods can be modified to become functional is
by addition of probiotics: the word “probiotic” originated from Greek meaning “for
life”. According to the definition contained in the report by the Food and Agriculture
Organization of the United Nations and the World Health Organization (FAO/WHO)
in 2002, probiotics are: “Live microorganisms which when administered in adequate
amounts confer a health benefit on the host” (FAO/WHO, 2002).
The term ‘probiotics’ should only be used for products if:
1. The bacterial strains in the product are able to survive the stomach acid and bile, so
that they reach the intestines alive in adequate numbers
2. The bacterial strains have health improving features
- 21 -
3. The probiotic activity is guaranteed throughout the entire production process,
storage period and shelf life of the product.
Most probiotics consist of lactic acid bacteria, such as Lactobacilli, Lactococci and
Bifidobacteria. These bacteria are also found in large quantities in the human
intestines. However, several strains of Streptococcus, Enterococcus, Pediococcus,
Bacillus species and some yeast are also regarded as probiotic strains as they produce
the same benefits than the lactic acid bacteria.
Functional foods occupy a large market segment in Japan and United States and there
is currently a strong emphasis in Ireland on research and development into value added
foods, such as functional foods. It is estimated that the functional food market is
growing by some 20% a year, a trend that is expected to continue. The market of
functional foods is estimated value at 33.3 billion US dollars (Hilliam, 2000).
According to the available estimations, the market of functional food products which
make specific health claims on the packaging or in the advertising exceeds the volume
of 2.0 billion US dollars in Europe (Menrad, 2003). According to Food Safety
Authority of Ireland, a balanced and varied diet should provide sufficient nutrition for
the average person, however functional foods are promoted as helping to limit or
reduce the impact of a number of disease risk factors and are thus proving popular with
many consumers seeking to achieve or maintain good health (FSAI, 2006). Functional
foods already available on the EU market include those with added cholesterol
lowering plant sterols and stanols, as well as those containing live bacteria (probiotics)
that allegedly enhance the quality of the human gut microflora.
However, functional food is not defined in EU or Irish food legislation and is regulated
through existing food legislation. New legislation is currently being developed at EU
level to harmonise the rules governing the nature and extent of nutrition and health
claims associated with food. This pending legislation will clarify many issues to do
with health and nutrition claims, but in the meantime, this area is governed by existing

- 22 -
food legislation. However, considering the reports of the FAO/WHO (FAO 2001; FAO
2002), the European Commission and the Scientific Committee on Food consider the
following quality and safety requirements for probiotic food supplements (Table 1.6).
Table 1.6: Requirements for the safety and quality of probiotic food supplements
Requirements
Food safety
Produced conform relevant hygiene and quality control rules (HACCP) Probiotic bacteria should have: no pathogenic properties no virulence properties no toxin production no acquired antibiotic resistance
Labelling
Conform European regulations Should contain the identity of each bacteria strain Should contain the quantity of the living bacteria in total, guaranteed until the ‘best before’ date.
Health claims Conform national regulations (in future European regulations)
(Source: FAO/WHO, 2002)
Traditionally, probiotics have been added to yogurt and other fermented dairy
products, but lactose intolerance and their cholesterol content are drawbacks that affect
their consumption among specific consumer segments (Yoon et al., 2006). In recent
years, consumer demand for non-dairy based probiotic products has increased, and
probiotics have been incorporated into drinks as well as marketed as supplements in
the form of tablets, capsules, and freeze-dried preparations (Shah, 2001). The
importance of prebiotics as enhancers of the growth and performance of probiotic
bacteria has been documented in humans by Fooks et al. (1999) and Van Loo et al.
(1999). Source of prebiotic might be dietary fibre, mainly oligosaccharides and
olysaccharides, which are fermented in the colon (Fooks et al., 1999; Ziemer and
Gibson, 1998).
In the majority of controlled studies on probiotics performed with children and adults,
no adverse effects have been observed, even in studies in which probiotics were

- 23 -
administered to humans suffering from a severely compromised immune system
(Gionchetti et al. 2000; Naidu et al. 1999; Wolf et al. 1998; Aso et al. 1995). In
addition, probiotics were not found to have any toxic effects in animal tests (Zhou et
al. 2000). A concentration of 107 cfu/ml at the time of consumption is considered
functional (Gomes and Malcata, 1999; Shortt, 1999). A small portion of yogurt can
also contain a similar number of bacteria.
In spite of the fact that probiotics generally make a positive contribution to the health
of the host, a few cases of adverse effects are known (Saxelin et al., 1996, Gasser
1994; Aguirre et al., 1993). Some metabolic features such as the possible production of
biogenic amines in fermented products could generate undesirable adverse effects;
although, it is unlikely that the probiotic bacteria were the causative agents in these
cases (Holzapfel et al., 1998; Gasser, 1994). Nevertheless the safety of probiotic
organisms is an important criterion for the use of these strains into food products. It is
the responsibility of the manufacturer to demonstrate the safety of the strains used.
Given the large amount of probiotic bacteria that have already been consumed for
many years without any problems and the many studies that have demonstrated their
health benefits, it can be confidently stated that the advantages of consuming
probiotics far outweigh any risks (Reid, 2006).
Due to improvements in hygiene, human beings today are exposed to bacteria much
less frequently than was formerly the case. This is certainly true for the undesirable
(pathogenic) bacteria, but it also holds for useful, protective bacteria. Bacteria have
been consumed by humans for many years, not only because they are used in
traditional preparations such as yogurt, cheese, sauerkraut, sausage, etc., but also
because they occur naturally in various foodstuffs. These foodstuffs contain bacteria
that are now classified as beneficial to health. At present there are strict rules
governing food safety. These products are therefore fermented under stringently
controlled, hygienic conditions. Only a limited number of selected bacteria are as yet
used to produce these products and in some instances products are no longer fermented

- 24 -
but acidulated. However, traditional spontaneous fermentation products such as beer,
or wine would not be included in the probiotic range of products as the strains used are
not classified as probiotic. In addition, more and more products are pasteurized or
sterilized at the end of the production process, or are subjected to other purification
steps, which destroy these beneficial bacteria (Tijsseling et al., 2005). As a result of all
these changes, the human body comes into contact with far fewer bacteria (both in
terms of quantities and variety of species) than formerly. This has the advantage, of
course, that many diseases caused by pathogenic bacteria can be avoided, but it also
means that the human being comes into natural contact with beneficial and useful
bacteria to a much lesser extent than was formerly the case (Shah, 2007).
Probiotics support the microbial balance in the intestines of the host and are therefore
recommended as supplements to normal everyday nutrition. In addition, they are also
used for their health benefits and are attracting a great deal of interest from scientists,
as is apparent from a report of a FAO/WHO expert group in which the various
potential health and nutritional benefits of probiotics are evaluated (FAO/WHO, 2001).
1.6 Blanching
Blanching is described as the exposure of vegetables to boiling water or steam for a
short period of time in order to inactivate enzyme and eliminate microorganisms. The
blanching times vary from seconds to minutes and are determined depending on the
vegetables, their shape and size (Table 1.7).

- 25 -
Table 1.7. Optimum blanching times for some vegetables
Vegetable Blanching Time
(min) Vegetable
Blanching Time
(min)
Beans-Lima, Butter, or Pinto Small
Medium Large
2 3 4
Mushrooms Whole (steamed)
Buttons or Quarters (steamed)
Slices (steamed)
5 3 1/2
3
Broccoli (1 1/2 inches across)
steamed
3 5
Onions (blanch until center is
heated) Rings
3-7 10-15 sec
Cabbage or Chinese Cabbage (shredded)
1 1/2 Peas-Green 1 1/2
Carrots Small
Diced, Sliced or Lengthwise strips
5 0.5-1
Peppers-Sweet Halves
Strips or Rings
3 2
Cauliflower (1 inch across)
3
Potatoes-Irish (New) 3-5
(Source: Kovack, 1999)
The blanching process stops enzyme actions which can cause loss of flavour and
texture. Also, blanching causes tissue cell membrane disruption, protein denaturation
(Hansen et al., 1994), turgor loss (Greeve et al., 1994a), and poor firmness and
crispness (De Belie et al., 2000). Another benefit of blanching is the reduction of
microbial load (Breidt et al., 2000). It also wilts or softens vegetables and makes them
easier to pack. Time is an important factor for the process as under-blanching
stimulates the activity of enzymes and is worse than no blanching, but over-blanching
causes loss of flavours, colours, vitamins and minerals.

- 26 -
1.7 Texture
Fruits and vegetables are edible parts of plants. Fruits are usually regarded as the
reproductive organs of plants, containing the seeds. Vegetables are generally classified
as the non-reproductive parts of plants such as roots, leaves or stems. Both are
composed of cells, and the structure of these cells is one of the major contributors to
the characteristic texture of the food (Rosenthal, 1999). Food texture is a major
determinant in consumer appreciation of foods.
The breakdown pattern of the food as it is chewed and the size, shape and composition
of the particles produced by chewing are responsible for the food texture that is
perceived in the mouth (Christiansen, 1984). Texture is a quality factor that
differentiates foods, for example, fresh fruits and vegetables are described as “crisp” or
“firm”, while processed foods have textures that are “soft” or “chewy”. Bourne (1982)
defined the textural properties of a food as the group of physical characteristics that
arise from the structural elements of the food, they are sensed by the feeling of touch,
they are related to the deformation, disintegration, and flow of food under force and
they are measured objectively by functions of mass, time and distance. However,
Szczesniak (1990) defined food texture as the sensory manifestation of the structure of
food and the manner in which this structure reacts to the applied forces; the specific
senses involved being, vision, kinaesthesia, and hearing.
The main structural material in fruit and vegetables is cellulose, a polymer of glucose
monomers, and the fracture behaviour of this material is a vital part of the fracture
behaviour pattern of plant material. However, the behaviour of cellulose is
dramatically affected by the presence of water (Rosenthal, 1999). Most plant tissues
used for food contain 75% to 95% water, and the behaviour of this component is a
vital factor in the effects of food processing on structure and texture.
Texture is one the most prominent quality attributes to which cell walls contribute
(Waldron et al., 2003). Food-processing methods that have the effect of killing the

- 27 -
cells destroy the integrity of the plasmalemma and the ability of the cell to maintain
turgor (Figure 1.4). Thermal treatments such as blanching cause an initial loss of
instrumental firmness due to the disruption of the plasmalemma (Greeve et al. 1994b).
The latter may result in the development of a rubbery character (Waldron et al., 2003).
However, the most significant softening occurs subsequently as a result of an increase
in the ease of cell separation in many nonlignified tissues (Van Buren, 1979). The final
texture will therefore depend on the relative importance of each factor contributing to
texture and the degree to which that factor has been changed by the processing method
used.
Figure 1.4. Main structural features of a plant cell
(Source: Rosenthal, 1999)
Most common methods of vegetable processing involve heat treatment. As the
temperature rises from 20ºC to 60ºC cell walls thicken, with disruption of the
plasmalemma. The structural changes to vegetable cells by food processing are the
result of complex interactions between the response of their chemical components to
heat; cold; treatment with chemicals such as salt, sugar, or acid and the overall
structure of the cells (Rosenthal, 1999).
The possible use of blanching in combination with controlled fermentation has been
considered by some authors (Fasina and Fleming, 2001, De Castro et al., 1998). The

- 28 -
effects of blanching will be conditioned mainly, the vegetable itself, temperature, and
blanching time. Loss of cellular integrity becomes evident at 60ºC in carrots (Grote &
Fromme, 1984). The rigidity of the tissue is closely related to the shear modulus,
which declines rapidly at 55ºC to 60ºC, in contrast to the slow, steady decline in the
modulus of elasticity (Ramana et al., 1992). It is important to find the right balance
between time and temperature to reduce the level of microorganisms without affecting
much of the initial texture.
1.8 Preliminary consumer study
Sensory analysis or sensory evaluation is a scientific discipline that applies principles
of experimental design and statistical analysis to the use of human senses such as sight,
smell, taste, touch and hearing for the purposes of evaluating consumer products
(Yantis, 1992). The discipline requires panels of human assessors, on whom the
products are tested, and recording the responses made by them. By applying statistical
techniques to the results it is possible to make inferences and insights about the
products under test. From the perspective of a typical new product development, a
preliminary screening consumer study would be recommended as it could provide
useful information about the product characteristics. The selection of sensory panel
combined with screening and acceptability tests would be required to carry out this
preliminary consumer study.
The sensory judges are familiarised with similar products used in this research project
and they are asked to describe their sensory experiences. The development of a sensory
panel deserves thought a planning with respect to the inherent need for the panel, the
availability and interest of panel candidates, the need for screening of training samples
and references, and the availability and condition of the panel room and booths. In
food industries, the sensory panel is the company’s single most important tool in
research and development and in quality control.

- 29 -
The screening tests should use products to be studied and the sensory methods to be
used in the research study (Meilgaard et al., 1999). The screening tests aim to
determine differences among candidates in the ability to discriminate and describe
character differences among product, and discriminate and describe with a scale for
attribute differences in the intensity or strength of characteristic.
The members of the sensory panel will be specifically selected on the basis of their
sensory ability to recognize and discriminate among a range of relevant products. The
preliminary sensory analysis involves that the panellists are familiarised to similar
range of products and they are asked to evaluate these products by rating the intensity
of various characteristics on a scale. This analysis enables the panel administrator to
select the most accurate and consistent subjects, and to identify those individuals who
require more sessions and specific sensory attributes and those judges to be excused
from further tests. Also, it establishes whether there are product differences and at the
same time can establish relationship amongst the attributes assessed. It is applicable to
the characterization of a wide variety of product changes and research questions in
food product development (Lawless and Heymann, 1999). The information can be
related to consumer acceptance information or to preliminary consumer study.
Statistical analyses are applied to look for differences among various products for
characteristics of interest.
The primary purpose of a consumer acceptance study is to assess the personal response
(preference or acceptance) of current or potential customers to a product, a product
idea or specific product characteristics (Meilgaard et al., 1999). The panel
administrator can sometimes apply acceptances tests in a limited way to obtain an
indication about product acceptability and may be asked to pilot such “preliminary
screening” test during product development and before the product is subjected to
more detailed market research. Information derived from acceptance testing will only
be of value if it reflects the results that would be obtained in the population at large and

- 30 -
this is unlikely to be achieved unless a panel which represents the target population is
recruited.

- 31 -
1.9 Research Objectives
The aim of this project was to investigate the potential of producing a fermented carrot
product, a vegetable of significant importance in the Irish market, using beneficial
lactic acid bacteria, a group of bacteria well-known for healthy human benefits and
widely used in food fermentation. The carrot product would be fermented under dry
conditions differing from other fermented vegetables (e.g. sauerkraut, onions and
beetroot) where the fermentation takes place by immersing the vegetables in liquid-
brine inoculated with lactic acid bacteria. The product will be vacuum packed in order
to promote the fermentation. The Research objectives are:
1) Determine and identify the initial microflora and investigate sources of lactic acid
bacteria present in carrots using microbiological techniques.
2) Investigate the effect of blanching times from 10 to 60 seconds on the
microbiological loads and textural degradation of the carrots.
3) Develop a new carrot juice broth media for growth of the lactic acid bacteria and
compare it with a commercial laboratory base media.
4) To apply the process of fermentation using lactic acid bacteria to carrot sticks and
to monitor the pH levels and the microbiological growth.
5) Carry out a preliminary sensory analysis to determine whether judges can
differentiate between fermented and unfermented carrot sticks and determine the
acceptability of these two groups.

- 32 -
CHAPTER TWO
Materials & Methods

- 33 -
2. Materials
2.1 Plant Material Preparation
Carrot varieties available in Ireland include Amsterdam, Chantenays, Nantes &
Danvers half-longs, Cosmic Purple and Round carrots. However, the permanent and
continual availability of some of these carrot varieties were not guaranteed by the
supplier. Two varieties of carrots, Amsterdam (baby carrots) and Nantes half-long
were chosen for this study because they could be obtained all year round. Amsterdam
carrots variety (origin: South Africa) were purchased from Marks & Spencer (Dublin)
and Nantes half-longs carrots variety (origin: Ireland) from Dunnes Stores (Dublin).
Both products were stored under refrigeration conditions at 4ºC until they were used.
Carrots were inspected for quality and only those free from surface blemishes and
defects were chosen for further processing. Carrots were purchased on a weekly basis
and used within 7 days.
Two different methods of extraction of microorganisms were compared to identify and
determine the initial microflora on the carrots. The comparison of the two methods was
carried out in order to determine an efficient method for enumeration of microbial load
and to isolate the initial microflora present on the surface of the carrots.
2.1.1 Unpeeled carrots washed with buffered peptone water
Ten grams ± 0.5 g of whole Amsterdam carrots were placed into 250 ml Duran bottles
with 90 ml of sterile buffered peptone water (Oxoid, Hampshire, United Kingdom).
The bottle was stirred manually for one minute in order to transfer the microorganisms
on the surface of the carrots into the buffered peptone water (BPW). A series of
dilutions were prepared (from 10-1 to 10-3) transferring 1 mL of BPW into 9 mL
peptone saline (Oxoid, Hampshire, United Kingdom). The content in the BPW was
analyzed as described in sections 2.2.1 and 2.2.2. Figure 2.1 is an illustration of the
methodology applied.

- 34 -
Sterile stomacher bag with
90 ml BPW
Figure 2.1. Flow diagram of the methodology used for unpeeled carrots washed with
buffered peptone water.
2.1.2 Macerated carrots extraction method
Ten grams ± 0.5 g of Amsterdam carrots were chopped with a knife which had been
disinfected with methanol and added into a sterile stomacher bag with 90 mL of sterile
BPW. The contents were homogenised using a stomacher 400 Lab Blender (Seward,
London, United Kingdom) at normal speed for 1 minute. A series of dilutions were
prepared (from 10-1 to 10-3) transferring 1 mL of the dilution into 9 mL peptone saline
(Oxoid, Hampshire, United Kingdom). The homogenised content was analysed as
described in sections 2.2.1 and 2.2.2. Figure 2.2 illustrates the flow diagram of the
experiment applied.
Figure 2.2. Flow diagram of the methodology used for macerated carrots
10 ± 0.5 g Whole Amsterdams carrots 90 ml (1:9) Buffered Peptone Water (BPW) Stirred manually 1 min
Dilutions
10 ± 0.5 g Amsterdam carrots 90 ml (1:9) Buffered Peptone Water (BPW) Homogenised (Stomacher) 1 min
1 ml (10-1) +
9 ml peptone saline (PS)
(10-2)
1 ml (10-2) +
9 ml peptone saline (PS)
(10-3)
Dilutions
10-1
1 ml (10-1) +
9 ml peptone saline (PS)
(10-2)
1 ml (10-2)
+ 9 ml peptone saline (PS)
(10-3)
10-1

- 35 -
2.2 Microbiological analysis
The microbiological analyses were adapted from Lyhs (2002).
2.2.1 Pour plate technique
The pour plate technique is used for enumeration of microorganisms in a sample. In
this technique, test samples or suspensions of microorganisms are mixed with molten
agar (45-50°C). The agar is allowed to solidify, trapping the bacteria at separate
discrete positions within the matrix of the medium. While the medium holds bacteria
in place, it is soft enough to permit growth of bacteria and the formation of discrete
isolated colonies. The pour plate technique is based on the following steps:
1. Serial dilution of sample is performed
2. The dilution is aseptically transferred into petri dishes.
3. Melted agar that has been cooled to approximately 44–45°C is added
4. The content is mixed well by slightly rotating plate with bacteria and agar mixture.
5. Agar is allowed to solidify.
6. Plates are incubated inverted at 30ºC or 37ºC depending on the bacteria to be
determined.
7. The number of colonies is counted and the number of microorganisms in the
original sample is calculated.
2.2.2 Surface spread plate technique
The streak plate method is used primarily for isolating microorganisms in pure culture
from specimens or samples containing mixed flora. Obtaining isolated colonies on
plates allows colonial morphology and haemolytic reactions to be examined, and
biochemical/serological testing to be performed. The spread plate technique is used for
enumerating microorganisms and is based on the following steps:
1. 0.1 millilitre (mL) aliquots from the series of dilutions is added to the surface of an
agar plate.

- 36 -
2. Aseptically, the inoculum is spread across the surface using a sterile inoculating
loop. By spreading the suspension over the plate, a dilution gradient is established
to provide isolated colonies.
3. Agar plates are incubated inverted at 30ºC or 37ºC depending on the bacteria to be
determined.
4. Colonies are counted and the number of microorganisms is calculated.
2.2.3. Total Viable Counts (BS EN ISO 4833:2003)
A non-selective nutrient medium, standard plate count agar SPCA; (Oxoid,
Hampshire, United Kingdom) was used to culture a wide range of microorganisms,
collectively referred to as the standard plate count. Aseptically, 1 ml of each required
dilution (10-1, 10-2, 10-3, 10-4, 10-5, 10-6, 10-7) was inoculated into a labelled Petri dish
(duplicate plates were used for each dilution). 15 ml of tempered (46 ± 1°C) SPCA
agar were added into each Petri dish. Carefully the plates were mixed by swirling six
times clockwise, six times left to right, six times anticlockwise and six times up and
down. The plates were allowed to set. The time elapsing between the preparation of the
initial suspension and contact with the agar did not exceed 45 minutes. The Petri
dishes were inverted and incubated at 30 ± 1°C for 48 hours ± 3 hours. The colonies
were counted and recorded on each plate containing between 30 and 300 colonies. The
result calculated was rounded to two significant figures (Appendix A). The result was
reported as total aerobic count g-1 product.
2.2.4 Enterobacteriaceae (BS 5763-10:1993, ISO 7402:1993 )
Aseptically, 1 mL of each decimal dilution (10-1, 10-2 and 10-3) was transferred into a
sterile petri dish. 15 mL of molten violet red bile glucose agar (VRBGA) (Difco,
Oxford, United Kingdom) was tempered at 45ºC in a waterbath (Grant W14,
Cambridgeshire, United Kingdom) and then poured into each plate. The time elapsing
between the end of the preparation of the initial suspension and the medium was
poured did not exceed 15 minutes. The inoculum with the medium was mixed and was
allowed to solidify. After solidification was completed, 10–15 mL of VRBGA was

- 37 -
overlayed on to the surface of the inoculated medium in order to create anaerobic
conditions. The Petri dishes were inverted and placed in an incubator at 37 ± 1°C for
24 ± 2 hours. Colonies of Enterobacteriaceae produce purple red colonies with a
diameter of 0.5mm or greater and sometimes surrounded by a red zone of precipitated
bile. Typical Enterobacteriaceae colonies were counted and recorded on each plate
containing between 30 and 300 colonies. Confirmatory tests were carried out in order
to confirm suspect colonies found (Appendix A).
2.2.5 Lactic Acid Bacteria (BS 7857-2:1996, ISO 13721:1995)
Aseptically, 0.1 mL of each dilution (10-1, 10-2 and 10-3) were transferred into Man-
Rogosa-Sharpe (MRS) agar plates (Oxoid, Hampshire, United Kingdom). They were
incubated in jars under anaerobic conditions using anaerobic GasPack generators
systems (Oxoid, Hampshire, United Kingdom) at 30 ± 1 ºC for 48 ± 3 hours.
Anaerobic indicators (Oxoid, Hampshire, United Kingdom) were used in order to
check that the anaerobic conditions were kept all the time during the incubation time.
Typical Lactobacillus sp. colonies were counted and recorded on each plate containing
between 30 and 300 colonies. Confirmatory tests were carried out in order to confirm
suspect colonies found (Appendix A).
2.2.6 Halotolerance test
Lactic acid bacteria can tolerate high salt concentrations; as a result an analysis of
tolerance in different NaCl concentrations was carried out to identify the lactic acid
bacteria that were originally in the plant material and also, to detect competitors
against lactic acid bacteria. The analysis was adapted from Ventosa et al. (1998).
Aseptically, 0.1 mL of each dilution (10-1, 10-2 and 10-3) was transferred into SPCA
plates (Oxoid, Hampshire, United Kingdom) with the following NaCl (Riedel-de
Haën, Seelze, Germany) concentrations: 2%, 4% and 6.5%. They were incubated at
30ºC for 48 ± 3 hours. The colonies were counted and recorded on each plate
containing between 30 and 300 colonies. The result calculated was rounded to two
significant figures (Appendix A).

- 38 -
Pirex beaker
Wired basket immersed in boiling water
2.3 Blanching
Blanching was applied to the carrots in order to determine the effect on surface
microflora. Ten grams ± 0.5 grams of Amsterdam carrots were put into a wire basket
(18 cm high with a diameter 10 cm, the hole size in the basket was 5 mm diameter) and
placed in a 2L Pyrex beaker filled with deionised water heated by a bunsen burner
(Figure 2.3) and maintained at 100ºC ± 2ºC. The blanching times studied were 10, 20,
30 40, 50 and 60 seconds. Wire baskets were used for ease of removal from the beaker
after the allotted blanching times to ensure that carrots were in direct contact with the
water and that there was a good flow of water in and around them.
Figure 2.3. Illustration of the system used for blanching Amsterdam carrots
The samples were microbiologically analysed to determine total viable counts (as
described in Sections 2.2.1 and 2.2.3). Figure 2.4 illustrates a sketch of the steps
involved in the blanching process and the microbiological analysis.
Bunsen Burner

- 39 -
Figure 2.4. Flow diagram of the blanching experiment carried out on Amsterdam
carrots followed by microbiological analysis.
2.4 Texture analysis of carrots
Texture analysis to assess the effects of blanching time and carrot dimensions was
investigated. In addition, the texture analysis of two jar baby carrot products available
in the current market was analysed in order to determine a range of commercially
acceptable texture for a carrot product.
2.4.1 Effect of blanching on carrot texture
Ten grams ± 0.5 grams of Amsterdam carrots were blanched as described in Section
2.3 for periods of time of 30 to 300 seconds. The diameter of the carrots used was
between 10 and 40 mm and from the three cuts applied in three sections along the
blanched carrot, texture analyses were carried out to determine the effect of the
blanching time on texture. Texture was measured using an Instron texture analyser
10 ± 0.5 g Amsterdam carrots 90 ml (1:9) Buffer Peptone Water Homogenised (Stomacher) 1 min
Dilutions
1 ml (10-1) +
9 ml peptone saline (PS)
(10-2)
1 ml (10-2) +
9 ml peptone saline (PS)
(10-3)
X 2 X 2 X 2
Incubation
48 ± 2 h 30 ºC
Time 10 sec
20 sec Blanching 30 sec time 40 sec 50 sec 60 sec
AEROBIC
Medium SPCA
AEROBIC
Medium SPCA
Whole Amsterdam carrots

- 40 -
(Instron 4302 Universal Testing Machine, Canton MA, USA) to which a single blade,
1 mm thick was attached to the crosshead and the carrot was sheared longitudinally to
a depth of 25 mm (Figure 2.5)
Figure 2.5. Universal Testing machine Instron 4302
The crosshead speed was set at 50 mm/min. A plot of force (kN) against displacement
(mm) was produced by the Instron Series IX (Windows) during the test. Maximum
load force (kN), maximum extension (mm) and break load (N) were recorded. Figure
2.6 is a representation of the steps followed.
Figure 2.6. Flow diagram design used to determine the effect of blanching on the
texture of the carrots
2.4.2 Relationship between carrot diameter and textural degradation after a
period of blanching times
Amsterdam carrots were selected depending on the diameter (∅); carrots with a
diameter bigger than 40 mm (∅>40 mm) were included in one group. The second
group included carrots with a diameter smaller than 10 mm (∅<10 mm). Due to the
Texture Analysis Instron 4302
Blanching 30 180 time 60 210 (seconds) 90 240 120 270 150 300
Whole Amsterdam carrots
(10mm ≤ ∅ ≤ 40 mm)

- 41 -
heterogeneity in diameters, the first group (∅>40 mm), included two carrots and group
of three carrots were used in the second group (∅<10 mm) for each blanching time.
Three cuts on three sections along the carrot were carried out in order to determine the
texture. A total of 50 carrots were used in this experiment. Figure 2.6 is a photograph
representing the two different groups of carrots used.
Figure 2.6. Two groups of carrots
used (1st group: 2 carrots with
diameter bigger than 40 mm / 2nd
group: 3 carrots with diameter
smaller than 10 mm)
2.4.3 Texture comparison of two jar carrot products
Texture analysis was applied on two jar carrot products purchased in two supermarkets
in Dublin in order to determine commercially acceptable texture values. Product A
(Figure 2.7.a) was a glass jar baby carrot product (ingredients: baby carrot, water,
sugar, salt and antioxidant: ascorbic acid) purchased in Supervalu (Dublin); (Nutrient
value for 100g is 29 Kcal, with 0.5 g of protein, 6.0 g of carbohydrates and 0.3 g of
fat). The Product B (Figure 2.7.b) was, also, a glass jar carrot product (ingredients:
carrot, water, salt and sugar) purchased in Aldi (Dublin); (Nutrient value for 100 g was
18 Kcal, with 0.8 g of protein, 3 g of carbohydrates, 0.2 g of fat, 1.7 g of fibre and 0.3
of sodium).
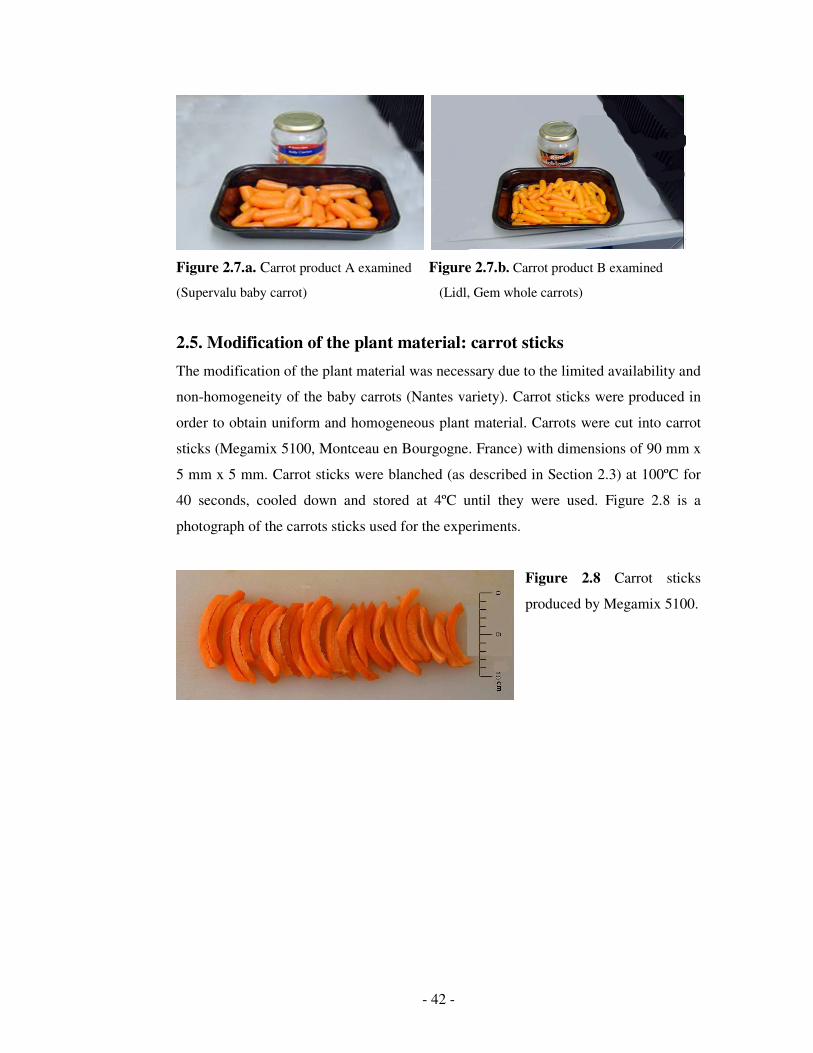
- 42 -
Figure 2.7.a. Carrot product A examined Figure 2.7.b. Carrot product B examined
(Supervalu baby carrot) (Lidl, Gem whole carrots)
2.5. Modification of the plant material: carrot sticks
The modification of the plant material was necessary due to the limited availability and
non-homogeneity of the baby carrots (Nantes variety). Carrot sticks were produced in
order to obtain uniform and homogeneous plant material. Carrots were cut into carrot
sticks (Megamix 5100, Montceau en Bourgogne. France) with dimensions of 90 mm x
5 mm x 5 mm. Carrot sticks were blanched (as described in Section 2.3) at 100ºC for
40 seconds, cooled down and stored at 4ºC until they were used. Figure 2.8 is a
photograph of the carrots sticks used for the experiments.
Figure 2.8 Carrot sticks
produced by Megamix 5100.

- 43 -
2.6. Evaluation of O2 and CO2 levels of packaged minimally processed
carrots sticks and blanched carrot sticks
Minimally processed carrot sticks and carrot sticks blanched for 40 seconds were
placed in an air sealed bag and the evolution of gases within the packages were
monitored to determine the change in O2 and CO2 concentrations over storage time.
Gas analysis of the package atmospheres was carried out at 0, 18, 24, and 72 hours. A
rubber adhesive septum (Madderlake Scientific, Oxford, United Kingdom) was
attached to the individual packs before gas analysis took place to prevent ingress of air.
Gas samples were extracted using a hypodermic needle (Neolus Belgium Terumo, No.
2 110559, Merseyside, United Kingdom). Duplicate samples were analysed using a
Systech Gaspace II gas analyser (Systech Instrument Ltd., Oxon, United Kingdom).
2.7 Broth for Lactic Acid Bacteria: Carrot Juice Broth (CJB)
A broth prepared from carrots was tested as an edible medium where the lactic acid
bacteria could be cultivated. A hundred grams ± 5 g of carrots (variety Nantes) were
washed with water and topped and tailed using a sharp knife which was previously
disinfected with methanol. The outer layer of skin was removed manually using a
standard vegetable peeler. The peeled carrots were placed in a juice extractor (Breville
JE95, Botany, Australia) and the carrot juice was collected in a 250 ml Duran Bottle.
The carrot juice was pre-filtered through Whatman 541 paper filters (Whatman,
Nottingham, United Kingdom) using a ceramic funnel and pump suction (Millipore,
Billerica, MA, USA). The filtrate content was centrifuged for 15 minutes at 12,000
rpm (Sigma 2K15, Munich, Germany). The liquid phase was filtered again with 0.8
µm Millipore sterile filters (Millipore, Billerica, MA, USA), placed in a 250 ml Duran
bottle and autoclaved at 121ºC for 15 minutes. The broth was kept at 4 ± 2 ºC until it
was used. CJB was used within 7 days of production,

- 44 -
2.7.1 Comparison of Carrot Juice Broth and MRS broth
Fresh carrot juice broth and MRS (De Man Rogosa and Sharpe) broth (Oxoid,
Hampshire, United Kingdom) were monitored over 48 hours in order to compare their
ability to sustain microbial growth. Two strains of Lactobacillus sp.; Lactobacillus
plantarum (ATCC 8014, Medical Supply, Ireland) and Lactobacillus brevis (ATCC
8287, Medical Supply, Ireland) were inoculated with a loop from a pure culture in
MRS slant into either 100 ml ± 5 ml of fresh CJB or MRS broth. Microbiological
analyses (total viable counts) were carried out at 0, 24, and 48 hours in order to
compare the microbiological growth of Lactobacillus sp in the CJB and the MRS
broth.
2.8 Fermentation of carrot sticks
Ten grams ± 0.5 g of carrot sticks were placed in a fermentation test tube (15 cm
length x 5 cm diameter) which was filled up with carrot juice broth inoculated with
three different levels of Lactobacillus plantarum (1.5-5.3x10⁶ cfu/ml; 3.2-8.1x10⁷
cfu/ml; 4.3-8.4x10⁸ cfu/ml). Carrot sticks were removed from the fermentation tube
after periods of time of 1, 2 and 4 hours and placed in PPE barrier bags (20 cm x 30
cm), sealed by a Multi Vac heat sealer Webomatic (Werner Bonk Bochum C1011,
Bochum, Germany) and stored at 4ºC (Carel Master Cella Compact Cold Room, Cross
Refrigeration, Padova, Italy), 10ºC (LMS-305, Sevenoaks, Kent, UK) and 25ºC
(room temperature). The pH and total viable counts (seen in section 2.2.3) were
monitored at day 0, 1, 7 and 14. Carrot sticks were placed in a juice extractor (Breville
JE95, Australia) where the homogenates obtained was collected in a test tube and pH
readings were recorded (Orion pH meter 420A, United Kingdom). The pH meter was
calibrated using standard phosphate buffers of pH 4, 7 and 10, and the electrode was
washed thoroughly with distilled water after each measurement. Figure 2.9 is a
representation of the experimental work carried out.

- 45 -
Figure 2.9. Flow diagram representing the steps carried out during the fermentation of
carrot sticks.
2.9 Preliminary sensory analysis
Sensory analysis techniques were used to assess sensory qualities such as colour,
texture, aroma and overall visual quality of the vegetable products over time. The
judges were familiarised with the sensory attributes of unfermented and fermented
carrot sticks.
2.9.1. Test sheet preparation
Three quality attributes, appearance, texture and aroma, were chosen for the
determination of sensory changes applied to carrots (Kala and Prakash, 2004).

- 46 -
Appearance was scored in terms of colour and brightness and aroma was scored in
terms of freshness and pickled aroma. Texture was scored in terms of the firmness and
the overall quality. Each attribute was evaluated on a test sheet using a vertical 5 point
scoring scale, where 1 reflects a low level of the attribute and 5 a high level of
attribute. This vertical scoring scale was adopted for ease of use for the judge and
statistical analysis. (Appendix B). Visual assessment of appearance attributes was
made under fluorescent light which eliminated any lightning differences which may
have occurred under natural light.
2.9.2. Panel Initiation
A group of ten people, seven postgraduate students and three staff members of the
Food Science School and Environmental Health, Faculty of Tourism and Food (DIT)
were chosen for the panel. They participated in six sessions to become familiar with
sensory methodology and products. Sensory analysis took place in a dedicated sensory
analysis facility in the Food Processing Lab (Sackville Place, DIT) where judges were
separated from each other by individual booths and conditions giving rise to
interference were minimised. Instructions for the panel and sensory analysis were
displayed to all judges by computers located in booths. All computers were connected
to a main terminal where all data was collected and analysed by Compusense Five
software (Release 4.4, Ontario, Canada). All the samples were served to judges at
room temperature on a white paper plate.
Products were coded using randomly chosen three digit figure to avoid bias. The
vertical five-point scoring scale was explained to judges whereby a score of 5 would
represent the highest score of an attribute quality, and decreasing scores towards one,
signifying a deterioration in quality, with one reflecting a very poor quality parameter.
At initial introductory sessions, judges were given single vegetable samples typical of
fermented and pickled products (e.g.: sauerkraut, gherkins, pickled onions and
beetroot), to familiarise them with the attributes of theses products. Judges were
instructed to give the raw products the highest scores (5) for the appearance and

- 47 -
texture attributes. However, they were instructed to give the pickled aroma the highest
score (5) for aroma attribute. As a result, judges were familiarised with the layout and
scoring scale of the test.
Further to this testing and as a preliminary consumer analysis, judges were given two
groups of carrots in order to evaluate their attributes and level of acceptability. The
first group consisted in unfermented carrots, which were divided into two subgroups;
raw carrot sticks and blanched carrot sticks. The second group consisted in fermented
carrots which were divided in two subgroups, carrot sticks fermented for 1 day
(representing the early stage of the fermentation) and carrot sticks fermented for 14
days (representing the final stage of the fermentation)
The perceived intensity of each attribute, relative to the fresh sample was indicated by
clicking on the screen of the appropriate score on the scale. For evaluating texture,
judges were instructed to break the product using a fork or their hands. Those judges
who demonstrated consistent scoring ability were selected for the preliminary sensory
analysis panel. These judges were consistently able to distinguish the pickled samples
from raw and blanched samples and accurately evaluate the differences among
products. This panel consisted of eight judges (4 males and 4 females) with ages
between 23-41 years old.
2.10 Statistitical Analysis
Single, two-way and multiple analyses of variances (ANOVA) were performed in
order to determine differences among the treatments. Differences were reported as
significant to 95% LSD intervals and to Tukey’s HSD intervals. Also, Multiple Range
Tests were performed. They are the default method used when comparing pairs of
means in the ANOVA procedures. Statgraphics Centurion XV (Version 15.1.02;
Statistical Graphics Co., Rockville, USA) was used to analyse the data.

- 48 -
CHAPTER THREE
Results & Discussion

- 49 -
3.1 Determination and identification of the general microflora of
carrots
The microbiological load of carrots (variety Amsterdam) was determined using either
raw whole carrots washed with buffered peptone water (BPW) or macerated carrots as
described in Section 2.1.
3.1.1 Microbiological analysis of carrots
Total Viable Counts (TVC), Enterobacteracteriacea and Lactic Acid bacteria results
are presented in Table 3.1. Total Viable Counts and Enterobactericeae loads for raw
whole carrots washed with BPW were significantly (p<0.05) lower than macerated
carrots by 1 Log.
Table 3.1. Total Viable Counts, Enterobacteriaceae and Lactic Acid Bacteria loads on
Amsterdam carrots both macerated and unpeeled whole carrots washed with BPW.
Macerated Carrots
(Log cfu / g) Whole carrots washed with BPW
(Log cfu / g)
Total Viable Counts 5.30a ± 0.05 4.54
b ± 0.11
Enterobacteriaceae 3.59c ± 0.20 2.55
d ± 0.21
Lactic Acid Bacteria ND* ND*
Mean ± Standard Deviation based on twenty four measurements. Different lower case letter denotes
significant differences according to Duncan’s Multiple Comparison test (p<0.05)
*ND: Not detected
The effectiveness of extracting the microbial load by washing raw whole carrots with
BPW without the destruction of the carrot was not as efficient as macerating the
carrots due to the irregular microsurface and the existence of microcavities on the
carrot surface. As a result, these areas were not accessible to BPW during the washing
process. However, the maceration of carrots assured that the total microbiological load
was accounted by this method. The same conclusion was reached in similar studies

- 50 -
comparing non-destructive and destructive techniques applied to meat surface products
(Fliss et al., 1991). Previous studies on macerated carrots (Gleeson and O’Beirne 2005,
and O’Reilly, 2000) estimated the initial bacterial load of total viable counts and
Enterobacteriaceae as 5.0 and 3.21 Log cfu/g, respectively. These results are in
accordance with the microbial load obtained in the macerated carrots (Table 3.1).
According to the microbiological quality of ready-to-eat foods at the point of sale
(FSAI, 2001) raw carrots are classified as category E (raw vegetables). Under this
category, carrots are classified in 3 subcategories depending on their microbial load:
satisfactory, acceptable and unsatisfactory (Appendix C Table 1).
Accordingly, the carrots (variety Amsterdam) used in this study could be classified as
satisfactory with respect to aerobic colony counts indicating a good microbiological
quality. However, for Enterobacteriaceae loads, carrots were classified as acceptable,
a borderline limit of microbiological quality.
Ireland’s Guideline for the microbiological quality of ready-to-eat foods at point of
sale does not include LAB as a parameter to be analysed, as they are considered non
pathogenic bacteria; although in higher concentration they are associated with spoilage
of fish (Lyhs, 2002), meat (Franz and Van Holy, 1996), and fruits and vegetables
(Vaughan et al., 1994). Also, LAB produce organic acid, which modify the
environment within the food thus, inhibiting the growth of pathogenic bacteria (Rankin
et al. 2007; Ammor et al.; 2006, Gomez et al., 2002).
However, LAB were not detected using either surface washing whole raw nor
macerated carrots. These results were in disagreement with the findings of Klaiber et
al. (2005) and O’Reilly (2000) whereby lactic acid bacteria populations were found on
carrots in the range of 2.53-3.50 Log cfu/g. However, according to Gomez et al.
(2002), vegetables generally contain low levels of LAB, and the detection of LAB by
traditional procedures is difficult. The absence of lactic acid bacteria might also be
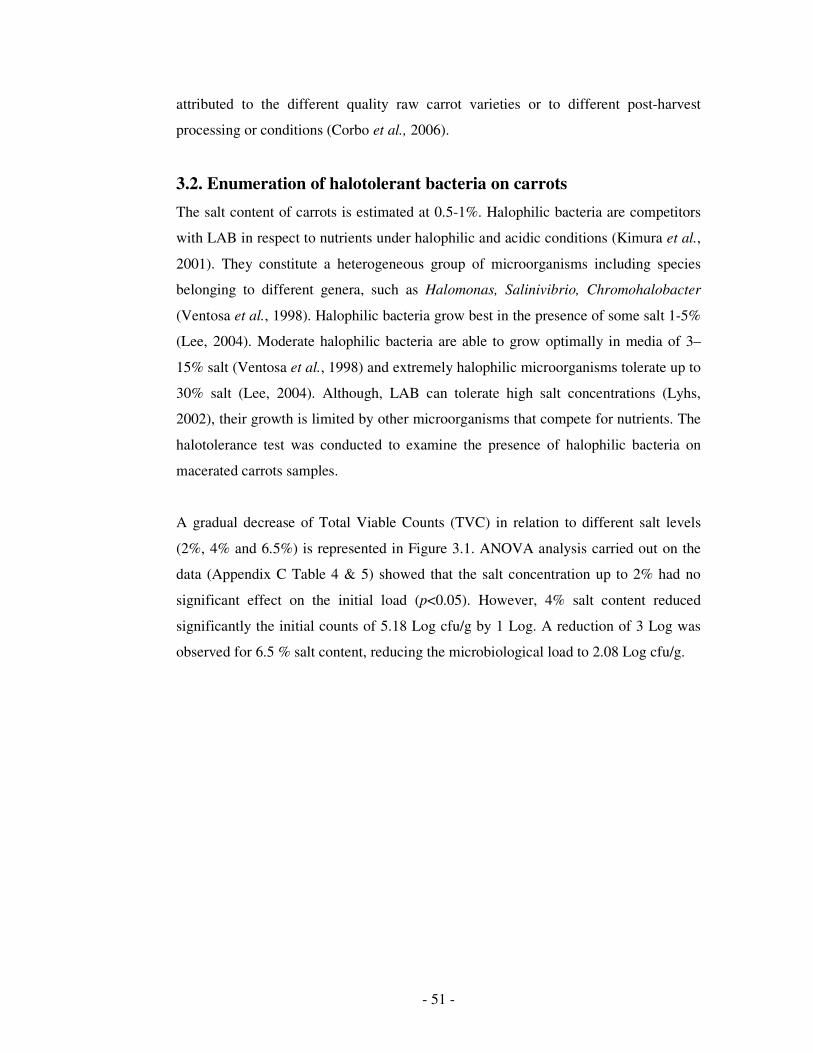
- 51 -
attributed to the different quality raw carrot varieties or to different post-harvest
processing or conditions (Corbo et al., 2006).
3.2. Enumeration of halotolerant bacteria on carrots
The salt content of carrots is estimated at 0.5-1%. Halophilic bacteria are competitors
with LAB in respect to nutrients under halophilic and acidic conditions (Kimura et al.,
2001). They constitute a heterogeneous group of microorganisms including species
belonging to different genera, such as Halomonas, Salinivibrio, Chromohalobacter
(Ventosa et al., 1998). Halophilic bacteria grow best in the presence of some salt 1-5%
(Lee, 2004). Moderate halophilic bacteria are able to grow optimally in media of 3–
15% salt (Ventosa et al., 1998) and extremely halophilic microorganisms tolerate up to
30% salt (Lee, 2004). Although, LAB can tolerate high salt concentrations (Lyhs,
2002), their growth is limited by other microorganisms that compete for nutrients. The
halotolerance test was conducted to examine the presence of halophilic bacteria on
macerated carrots samples.
A gradual decrease of Total Viable Counts (TVC) in relation to different salt levels
(2%, 4% and 6.5%) is represented in Figure 3.1. ANOVA analysis carried out on the
data (Appendix C Table 4 & 5) showed that the salt concentration up to 2% had no
significant effect on the initial load (p<0.05). However, 4% salt content reduced
significantly the initial counts of 5.18 Log cfu/g by 1 Log. A reduction of 3 Log was
observed for 6.5 % salt content, reducing the microbiological load to 2.08 Log cfu/g.

- 52 -
0
1
2
3
4
5
6
0 1 2 3 4 5 6 7
salt content (% NaCl)
TV
C (
Lo
g c
fu/g
)
Figure 3.1. Microbiological loads of carrots (variety Amsterdam) under halophilic conditions
of 2%, 4% and 6.5% NaCl.
Values are mean and standard deviation based on 16 determinations.
The presence of halophilic bacteria was detected (2.08 Log cfu/g at 6.5% salt content)
on the carrot samples. Halophilic bacteria are associated with the spoilage of products
in brine and meats (Ventosa et al., 1998) and fish (Dissaraphong et al., 2006). In terms
of microbiological levels and according to the results in Table 3.1 and Figure 3.1,
Amsterdam carrots had a considerable risk of spoilage and a short shelf life due to the
presence of mesophilic and halophilic bacteria.
3.3 Blanching of carrots
Since the presence of halophilic and mesophilic bacteria was detected on Amsterdam
carrots, the inactivation of the microflora present on the surface was imperative as a
preventative measure to reduce spoilage and extend shelf life.
Thermal methods are extensively used for the preservation of foods and they are highly
effective at inactivating microorganisms and are also sometimes employed in pickling
of fruits and vegetables to increase the microbial stability or safety of food products

- 53 -
(Lee, 2004). Also, blanching treatment causes the inactivation of enzymes such as
polyphenoloxidases, peroxidase, catalase, and phenolase, which may otherwise lead to
the development of deterioration reactions, such as undesirable colour, flavour or
texture changes in the product (Gorniki and Kaleta, 2007). As a result, blanching using
boiling water at 100ºC was carried out to investigate the effect of short time thermal
treatment on reducing the microbial load on carrot samples. Carrots (variety
Amsterdam) were blanched for 10, 20, 30, 40, 50 and 60 seconds. This range covered
both low and conventional blanching times for carrots (Section 1.6).
ANOVA analysis which was carried out on the total viable counts over a range of
thermal treatments showed that blanching times had a significant effect (p<0.05) on
reducing surface microflora of carrots, as it would be expected (Appendix C Table 5 &
6). For example, 10 seconds caused a significant reduction (p<0.05) of 2 Log cfu/g
from the initial microbial population of 5.27 Log cfu/g as seen in Figure 3.2. Also, 20
seconds blanching time produced a significant reduction (p<0.05) of 3 Log cfu/g. A
reduction of 3.7 Log cfu/g was achieved after a blanching time of 30 seconds. Finally,
blanching for 40 seconds caused the total inactivation of the initial microflora on the
carrot samples.
The absence of total viable counts for 50 and 60 seconds of blanching was in
agreement with a similar study (Breidt et al., 2000); where a variety of blanching times
were applied to pickled cucumber obtaining similar microbial reductions. Pao and
Davis (1999) determined that immersion of oranges in hot water (70°C for 2 min, or
80°C for 1 min) effectively reduced Escherichia coli on fruit surfaces by 5 Log
cfu/cm2.

- 54 -
0
1
2
3
4
5
6
0 10 20 30 40 50 60
Blanching time (seconds)
TV
C (
Lo
g c
fu/g
)
Figure 3.2. Microbiological loads on carrots (variety Amsterdam) after blanching for 10-60
seconds
Values are mean and standard deviation based on 28 results.
3.4 Texture analysis of carrots
The effect on the texture after applying a series of blanching times and the correlation
between texture and diameter of carrots (variety Amsterdam) were investigated using
an Instron 4302 Universal Testing Machine (Instron, Canton MA, USA). The
maximum shear force for blanched carrots was taken as indicative of the fracture of the
carrot texture. A typical Instron curve, showing the shear force (kN) against
displacement (mm) is shown in Figure 3.3.
* * *
* Not detected

- 55 -
0
0,01
0,02
0,03
0,04
0,05
0,06
1 2 3 4 5 6 7 8 9 10 11 12 13 14 15
Displacement (mm)
Sh
ear
Fo
rce (
kN
)A
B
C E
F
G
H
D
Figure 3.3. A typical curve of shear force (kN) versus displacement upon shearing of raw
Amsterdam carrots.
The first sharp peak (A) is produced when the blade first slices the carrot, then a series
of jagged peaks (B-H) are produced as the blade passes through the carrot. In this
research work, shear force recorded are those represented by the first sharp peak (A).
These jagged peaks are the result of the blade rupturing the cell walls of the carrot
tissue, which are still intact in a raw carrot. The main contributors to textural loss are a
sequence of semipermeable membrane degradation, cell wall separation and final
collapse of the pectin network which is responsible for cell adhesion (Lillford, 2000).
3.4.1 Effect of blanching on carrot texture
The textural changes during blanching have been investigated by Fuchigami et al.
(1994), Glasscock et al. (1982) and Rahman et al. (1971) who found significant
differences in the texture of carrots after blanching treatments. A progressive decrease
in the shear force of blanched carrots over the different blanching periods of time was
observed (Figure 3.4). Similar trends were recorded by other authors (Rico et al., 2007
and Gomez et al., 2005).

- 56 -
Figure 3.4. Shear Force (N) for shearing raw Amsterdam carrots over a range of blanching times.
Mean ± Standard Deviation based on 30 determinations.
ANOVA analysis of the maximum loads to shear blanched carrots over a range of
blanching times showed that blanching times up to 30 seconds did not have a
significant effect on the initial carrot texture at the 95% confidence level (Appendix
C). As a consequence, the textural degradation up to 30 seconds blanching could not
be considered significant. However, significant differences were found for blanching
times higher than 30 seconds at p<0.05. A progressive decrease in the tissue strength
was observed for blanching periods longer than 120 seconds (Figure 3.4). Carrots
soften upon blanching due to both turgor loss caused by cell membrane disruption and
to changes produced in cell wall polymers, particularly the pectic substances (Ng and
Waldron, 1997; Greeve et al., 1994a and Greeve et al., 1994b), which are involved in
holding the plant cells together (Ryden & Selvendran, 1990). The textural degradation
of the blanched carrots after 210 seconds reached 61% of the initial texture, 69% after
270 seconds and increased up to 77% after 300 seconds.
During prolonged heating, cells may become completely separated resulting in major
loss of textural strength. A two-stage sequence explains this tissue softening: a partial
0
10
20
30
40
50
0 30 60 90 120 150 180 210 240 270 300
Time (sec)
Max
. L
oad
(N
)
1st phase: pectin methylesterase activity
2nd phase: polygalacturonase activity

- 57 -
demethylation of pectins and associated methanol production as a result of pectin
methylesterase activity, followed by depolymerization of the lower degree of
methylated pectins and galacturonic acid by polygalacturonase activity (Vu et al.,
2004). These two phases can be observed in Figure 3.4, where the first phase is
associated with the pectin methylesterase activity followed by the second phase, which
is associated with the polygalacturonase activity.
The maximum load for shearing the carrots showed a good correlation for each of the
two-stage sequence in relation to blanching treatment. If the maximum load is taken as
an indicator of the textural degradation produced in the carrots, then the textural
degradation corresponding to the first phase could be modelled as a linear equation;
y= -0.0948x + 39.905 (R2=0.902) where y represents maximum load to shear blanched
carrots (N) and x represents blanching time (seconds). Following the first phase, the
second phase could be modelled also, using linear regression as y = -0.0991x + 38.154
(R2= 0.9883).
Forty seconds was the minimum blanching time required to inactivate the initial
microflora of carrots (Section 3.3). In terms of textural degradation, 40 seconds
blanching would have caused a 6.5% loss of the initial texture. ANOVA analysis
showed that texture after 40 seconds blanching would not have caused a significant
change from the initial texture (p<0.05). Blanching and texture analysis trials led to the
conclusion that a 40 seconds blanching treatment was enough to cause total
inactivation of the initial microflora with minimal textural degradation. Subsequently,
these treatment conditions will be applied for the rest of this work.
3.4.2 Relationship between carrot diameter and textural degradation after a
period of blanching times
Amsterdam carrots were purchased from a local supermarket in Dublin in retail packs
of 250 grams (Figure 3.5a). Carrot samples utilized did not all have a uniform shape as
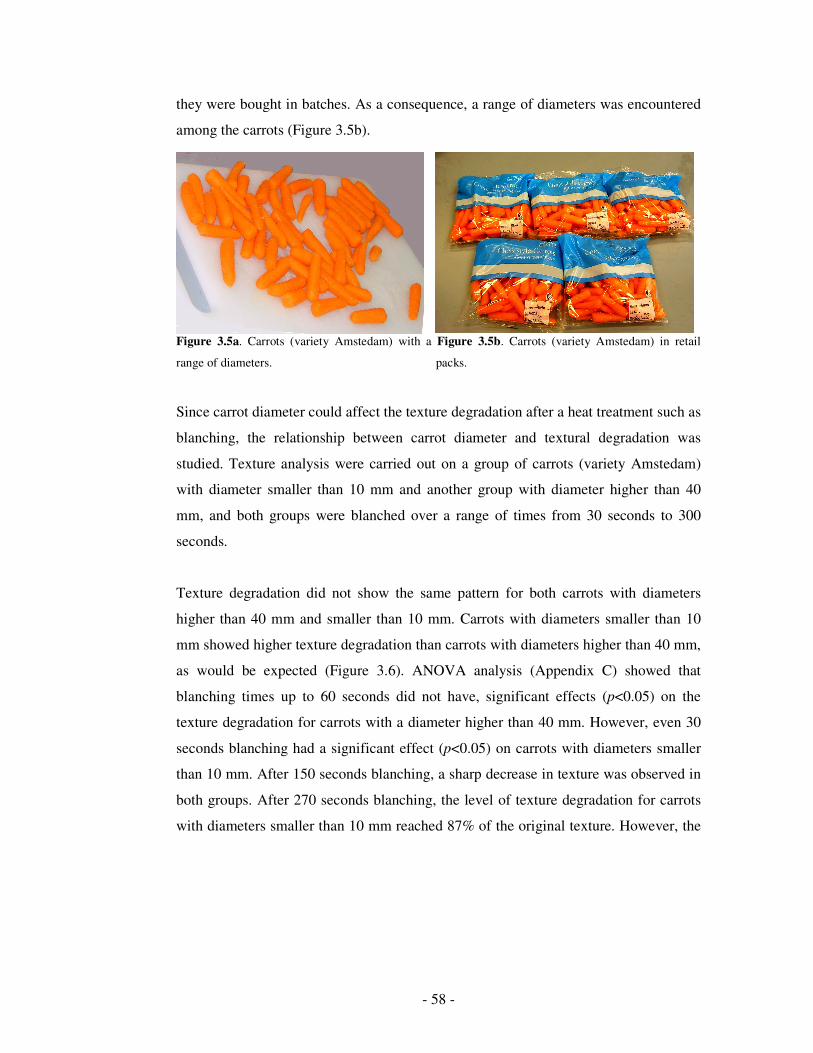
- 58 -
they were bought in batches. As a consequence, a range of diameters was encountered
among the carrots (Figure 3.5b).
Figure 3.5a. Carrots (variety Amstedam) with a Figure 3.5b. Carrots (variety Amstedam) in retail
range of diameters. packs.
Since carrot diameter could affect the texture degradation after a heat treatment such as
blanching, the relationship between carrot diameter and textural degradation was
studied. Texture analysis were carried out on a group of carrots (variety Amstedam)
with diameter smaller than 10 mm and another group with diameter higher than 40
mm, and both groups were blanched over a range of times from 30 seconds to 300
seconds.
Texture degradation did not show the same pattern for both carrots with diameters
higher than 40 mm and smaller than 10 mm. Carrots with diameters smaller than 10
mm showed higher texture degradation than carrots with diameters higher than 40 mm,
as would be expected (Figure 3.6). ANOVA analysis (Appendix C) showed that
blanching times up to 60 seconds did not have, significant effects (p<0.05) on the
texture degradation for carrots with a diameter higher than 40 mm. However, even 30
seconds blanching had a significant effect (p<0.05) on carrots with diameters smaller
than 10 mm. After 150 seconds blanching, a sharp decrease in texture was observed in
both groups. After 270 seconds blanching, the level of texture degradation for carrots
with diameters smaller than 10 mm reached 87% of the original texture. However, the

- 59 -
level of degradation reached in carrots with diameters higher than 40 mm was only
75%.
0
10
20
30
40
50
60
0 30 60 90 120 150 180 210 240 270 300Time (sec)
Ma
x L
oa
d (
N)
Carrot diameter <10mm
Carrot diameter >40 mm
Figure 3.6. Maximum load (N) for shearing the two groups of carrots after blanching for 30 to 270
seconds.
Mean ± Standard Deviation based on 50 determinations.
The two-stage sequence of this tissue softening was observed in the previous section
(Figure 3.4). The first phase is associated with a partial demethylation of pectins and
methanol production and the second phase is associated with polygalacturonase
activity (depolymerization of the lower degree of methylated pectins and galacturonic
acid).
The maximum load for shearing the carrots showed a good correlation for each of the
two-stage sequence in relation to blanching treatment for both groups; carrots with
diameters less 10 mm and with diameters higher than 40mm. The first phase in carrots
with diameter higher than 40 mm could be modelled as a linear equation; y = -0.0697x
+ 48.303 (R2=0.9872) where y represents maximum load to shear blanched carrots (N)
1st phase: pectin methylesterase activity
2nd phase: polygalacturonase activity

- 60 -
and x represents blanching time (seconds). In carrots with diameter less than 10 mm
the linear equation would be modelled as y = -0.1778x + 31.058 (R2=0.9925)
The second phase in carrots with diameter higher than 40 mm could be modelled as y
= -0.2505x + 79.657 (R2=0.9885). In the case of carrots with diameter less than 10
mm, linear equation would be modelled as y=-0.119x + 34.711 (R2=0.9369).
Larger diameters delayed texture degradation due to blanching treatments. Carrots with
smaller diameters suffered higher texture degradation caused by the enzymatic
degradation of the cell wall pectin (a cell wall polysaccharide) catalysed by different
pectinases (Vu et al., 2004) than those with diameters bigger than 40 mm. The main
contributor to textural loss is a sequence of degradation of semipermeable membranes,
cell wall separation and final collapse of the pectin network (Lillford, 2000), which is
directly correlated to the cell wall diameter of the carrot. A homogeneity in carrots
diameters would be required to achieve homogeneous results and reduce variability in
the final results.
One of the aims of this work was to determine the feasibility of producing fermented
carrots using lactic acid bacteria. This product would be considered a novel fermented
snack product as it would be commercially different from other fermented vegetables.
The fermented carrot would be vacuum-packed and fermented in dry conditions
differing from other fermented vegetables (e.g. sauerkraut, onions and beetroot) where
the fermentation takes place by immersing the vegetables in liquid-brine inoculated
with lactic acid bacteria. Microbiological analysis, blanching and textural studies have
determined the initial load of microorganisms, time required to remove the microflora
by blanching and the effect on the texture of the carrots. However, as a novel product,
it is important to establish a benchmark in texture. As a result, textural studies of
similar products were carried out.

- 61 -
3.4.3 Texture analysis of two jar carrot products
At this stage, it was important to establish a texture reference point which is considered
acceptable from a consumer’s view and also, establish a range of textures that would
be considered as a benchmark for the novel fermented snack carrot. The aim was not to
compare textures between products but rather to find out a commercially acceptable
texture. Accordingly, the texture of two jar carrot products was analysed using texture
analysis methods as applied to the blanched carrots (Section 3.4.1).
ANOVA analysis (Appendix C) showed significant differences (p<0.05) of the
maximum load results for the two jar carrot products (Table 3.2). The heterogeneity
between products, in terms of variety, length and diameter may explain the variation in
the results. However, the textural analysis of product A and B provided a range of
texture from 2.62 to 1.68 N (Table 3.3). This could be used as a texture reference for
the product to be developed in this study.
Table 3.2. Maximum load (N) for shearing canned carrot products A and B
PRODUCT A
(Supervalu baby carrot)
PRODUCT B
(Lidl, Gem whole carrots)
2.62 ± 0.59 N 1.68 ± 0.52 N
Mean ± Standard Deviation based on 30 determinations.
3.5. Modification of the plant material: carrot sticks
The importance of working with a homogeneous product in terms of shape, length and
diameter is fundamental for obtaining reproducible results. According to the results of
Section 3.4.2, the modification of the plant material into a homogeneous diameter
carrot was required. Using carrot sticks provided homogeneity in terms of length,
shape and diameter as opposed to using whole baby carrots. The carrot variety used in
this study (Amsterdam variety) was not suitable for carrots sticks due to its
heterogeneity and the fact that the supplier could not guarantee its availability all the
year round (seasonal production). An alternative carrot source (Nantes variety) was

- 62 -
chosen (Section 2.5). The modification of the sample reduced the initial
microbiological levels to lower levels than the initials loads for carrots (Amsterdam).
This was achieved by removing the external layers and producing carrot sticks. As a
result, the microbiological results would not be a significant factor in further
experiments.
3.6. Evaluation of O2 and CO2 levels of packaged minimally processed
carrots sticks and blanched carrot sticks
Respiration is an important process in vegetables because it may affect the shelf-life of
the product. The shelf life of harvested vegetables depends on the interaction between
genetic and physiological status, the post harvest physicochemical environment and
spoilage microorganisms. Fruits and vegetables with higher respiration rates tend to
have shorter storage-life than those with low rates of respiration. Extension of shelf life
of vegetables can be achieved by minimizing the rate of respiration and biochemical
activities during storage (Zagory and Kader, 1988). Carrots have a moderate
respiration rate between 10-20 mg CO2 kg-1 h-1 (USDA, 2004). However, blanching
has an effect on decreasing or even inactivating the respiration rate (Haas et al., 1994).
Different types of packaging films in modified atmosphere packaging (MAP) of
vegetables have different permeability to O2, CO2 and water vapour. The effects of
MAP are based on the often observed slowing of plant respiration in low O2
environments. There is about 21% O2 in the air (Zagory and Kader, 1988). As the
concentration of O2 inside the package falls below about 10%, respiration starts to
slow. This suppression of respiration continues until O2 reaches about 2-4% for most
produce. If O2 gets lower than 2-4% (depending on product and temperature),
fermentative metabolism replaces normal aerobic metabolism and off-flavours, off-
odours and undesirable volatiles are produced. Similarly, as CO2 increases above the
0.03% found in air, a suppression of respiration appears. Reduced O2 and elevated CO2
together can reduce respiration more than either alone. In addition, elevated CO2
suppresses plant tissue sensitivity to the effects of the ripening hormone ethylene. For

- 63 -
those products that tolerate high concentrations of CO2, suppression of the growth of
many bacteria and fungi results at higher than 10% of CO2. The goal of MAP of fresh
produce is to create an equilibrium package atmosphere with % O2 low enough and %
CO2 high enough to be beneficial and not injurious. Appropriate packaging materials
have been developed for most of the more common fruits and vegetables. There is
consensus as to which films are appropriate for standard size packages of garden salad,
broccoli and peeled carrots. Films for low, medium and high respiration rate
commodities are now available from many package vendors and the process of
matching oxygen transmission rate (OTR) to product is being constantly refined. PPE
bags have the properties of high barrier to moisture, vapour, chemicals, fats and gas
(Seyoum et al., 2001). They are non-toxic and transparent with high clarity.
The effect of blanching on the respiration of carrot sticks was studied. Minimally
processed (MP) carrot sticks (no treatment applied) and carrots sticks blanched for 40
seconds were packed in polypropylene ether (PPE) bags with 90% vacuum and stored
at room temperature. Levels of O2 and CO2 were monitored at 0, 18, 24 and 72 hours
(Figure 3.7)
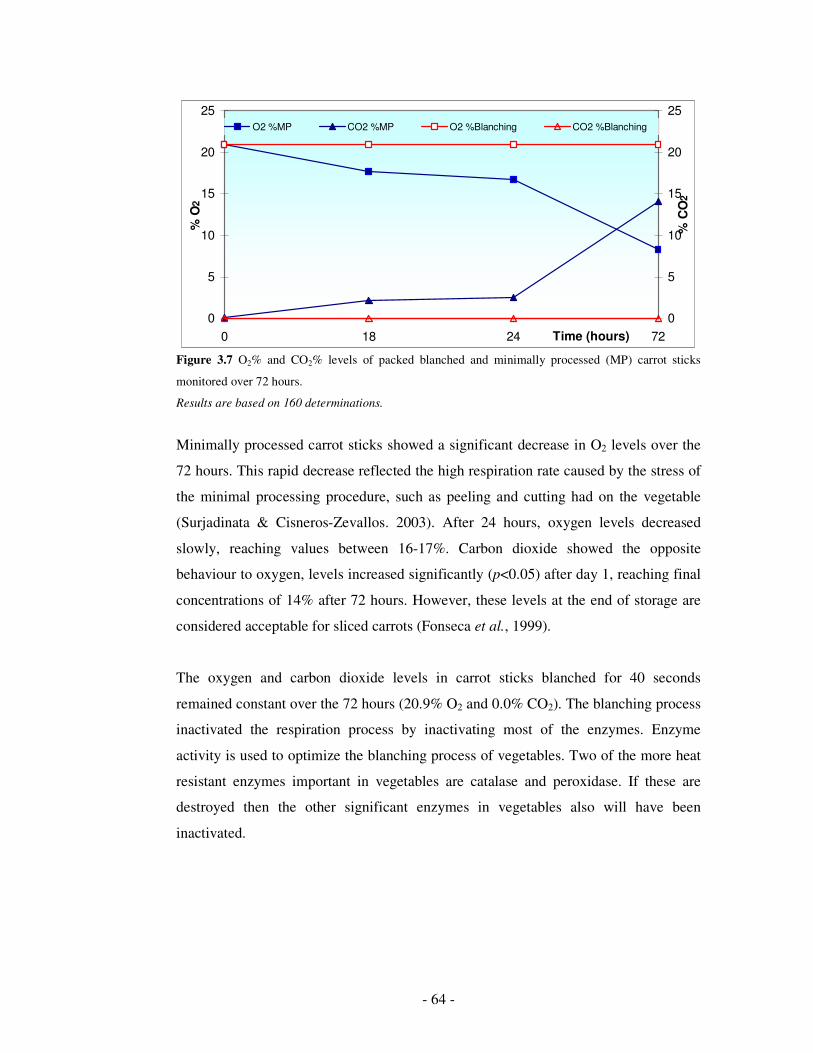
- 64 -
0
5
10
15
20
25
0 18 24 72Time (hours)
% O
2
0
5
10
15
20
25
% C
O2
O2 %MP CO2 %MP O2 %Blanching CO2 %Blanching
Figure 3.7 O2% and CO2% levels of packed blanched and minimally processed (MP) carrot sticks
monitored over 72 hours.
Results are based on 160 determinations.
Minimally processed carrot sticks showed a significant decrease in O2 levels over the
72 hours. This rapid decrease reflected the high respiration rate caused by the stress of
the minimal processing procedure, such as peeling and cutting had on the vegetable
(Surjadinata & Cisneros-Zevallos. 2003). After 24 hours, oxygen levels decreased
slowly, reaching values between 16-17%. Carbon dioxide showed the opposite
behaviour to oxygen, levels increased significantly (p<0.05) after day 1, reaching final
concentrations of 14% after 72 hours. However, these levels at the end of storage are
considered acceptable for sliced carrots (Fonseca et al., 1999).
The oxygen and carbon dioxide levels in carrot sticks blanched for 40 seconds
remained constant over the 72 hours (20.9% O2 and 0.0% CO2). The blanching process
inactivated the respiration process by inactivating most of the enzymes. Enzyme
activity is used to optimize the blanching process of vegetables. Two of the more heat
resistant enzymes important in vegetables are catalase and peroxidase. If these are
destroyed then the other significant enzymes in vegetables also will have been
inactivated.

- 65 -
The constant oxygen and carbon dioxide levels minimize the risk of hypoxic
atmosphere, in agreement with Sode & Khün (1998). Such conditions will minimise
the fermentative process which might cause the formation of acetaldehyde and the
appearance of off-flavour compounds (Kays, 1991). This was an important finding in
this project as the fermented carrot sticks would not be affected by the respiration
process.
3.7 Utilization of carrot juice broth as a new growth media for lactic
acid bacteria
The fermentation of carrot sticks using the beneficial lactic acid bacteria was one of
the aims of this work. MRS (De Man Rogosa and Sharpe) broth is the growth media
commonly used for LAB, however such a broth is considered unsuitable for human
consumption as it contains chemicals such as di-ammonium hydrogen citrate,
magnesium sulphate and manganese sulphate. As a result, a new media, which would
support the growth of LAB and be suitable for human ingestion was required. Carrot
juice broth (CJB) was investigated as a potential new broth for LAB. CJB was
produced by filtration and sterilization of the carrot juice extracted from whole carrots
(Section 2.6). Nagy-Gasztonyi et al. (2002) and Gardner et al. (2001) used similar
vegetable juice broth based on carrot, cabbage, beet and onion in their studies whereby
lactic acid bacteria strains were inoculated to obtain a fermented mixed vegetable
product.
3.7.1 Comparison of LAB growth in carrot juice broth (CJB) and MRS broth
The CJB has to offer the same or similar conditions to support the growth of LAB as
the MRS broth. Since LAB were not detected in carrots (Section 3.1.1), an external
source of LAB was required to carry out the comparison study between both broths.
The main function of LAB, generally, in food products is to produce a rapid pH drop,
which in turn favours product safety by inactivating pathogens. In addition, LAB

- 66 -
enhance product stability and shelf life by inhibiting undesirable changes caused by
spoilage microorganisms. Also, they create the biochemical conditions to attain new
sensory properties through modification of the raw materials (Lücke, 2000). Based on
similar studies applied to carrot juice, onions, cabbage and beet (Bergqvist et al. 2005;
Roberts & Kidd, 2005; Gardner et al., 2001; Steinkraus, 1996; and Fleming et al.
(1983), L. plantarum (ATCC 8014) and L. brevis (ATCC 8287) were the strains most
commonly used. These two strains are also, considered as probiotic bacteria (Saito,
2004), which would enhance the possibility of producing a health promoting novel
product. As a result, these two lactic acid bacteria strains were selected as the external
sources of LAB.
The same level of inoculation was used to compare the growth of lactic acid bacteria in
both, CJB and MRS broths. A 1:1 ratio of the two strains of Lactobacillus sp.; L.
plantarum (ATCC 8014) and L. brevis (ATCC 8287) were inoculated with a loop from
a pure culture on MRS slant into both, CJB and MRS broths. Microbiological
determinations were carried out at 0, 24, and 48 hours.
Statistical analysis carried out (Appendix C) on the microbiological loads (Log cfu/ml)
at 0, 24 and 48 hours determined that there were no significant differences between
MRS and CJB (p=0.2162). However, the factor time had a significant effect on the
microbiological loads (Log cfu/ml) at the 95% confidence level.
The initial concentrations of Lactobacillus sp. (Lactobacillus plantarum and
Lactobacillus brevis) at day 0 in both broths (CJB and MRS) were the same magnitude
(Figure 3.8). After 24 hours, an exponential increase of 3 Log (cfu/ml) was observed in
both broths. This growth is associated with the exponential phase where
microorganisms grow in an exponential rate. An increase of 0.6 Log was recorded in
both broths between 24 and 48 hours. This stabilization in growth is associated with
the stationary phase where the growth rate of the microorganisms balances with the
death rate.

- 67 -
0
2
4
6
8
10
0 24 48
Time (hours)
LA
B (
Lo
g c
fu/m
l)
CJB
MRS Broth
Figure 3.8. Lactic acid bacteria load (Log cfu/ml) in CJB and MRS broth monitored over 48 hours. Different lower case letter denotes significant differences according to Tukey’s HSD (95%) Values are the mean and standard deviation based on 24 readings.
The carrot juice broth (CJB) supported the same level of growth for a mixed culture of
Lactobacillus sp. (Lactobacillus plantarum and Lactobacillus brevis) as MRS broth
over 48 hours. This was an important finding because it meant that CJB could be used
as a broth to cultivate Lactobacillus sp., with the main advantage that it is edible, 100%
natural and does not contain any chemicals, additives or preservatives. A drawback of
utilizing CJB is that it requires a longer period of time for its preparation implying
higher production cost.
A potential use of the inoculated CJB is that it could be considered as a probiotic
drink. According to De Vrese et al. (2001), 5-15% of the population in Europe is
lactose intolerant. Dairy products with probiotic bacteria are unsuitable for this group
of population because of their condition. The inoculated CJB could provide an
alternative probiotic product enhancing the benefits of the lactic acid bacteria for the
human body. The CJB would accomplish the requirements of FAO/WHO and the
Scientific Committee on Food for probiotic supplements (Table 1.2). The probiotic
bacteria used, L. plantarum and L. brevis, have a long history of safe use, have no
a
b c

- 68 -
pathogenic nor virulence properties, do not produce toxins and do not acquire
antibiotic resistance.
3.8 Fermentation of carrot sticks
At this stage, CJB was found to support the same level of growth of L. plantarum and
L. brevis as MRS broth. In addition, a blanching period of 40 seconds was found to
remove surface microflora without significant textural changes. The blanched carrots
sticks must be dipped in the CJB for the fermentation to be initiated. The dipping will
allow for the LAB to adhere to the surface of the carrots. The fermentation process as
applied in this work will be evaluated with respect to number of factors including
inoculation level, dipping time, storage time and storage temperature.
In this study, carrot sticks were blanched for 40 seconds and dipped into CJB with
three levels of LAB (106, 107 108 cfu/g) for 1, 2 or 4 hours. Then, they were vacuum
packed and sealed in a PPE barrier bags and stored at three different temperatures, 4ºC,
10ºC and 25ºC. LAB concentrations and pH levels of the carrot sticks were determined
at day 0, 1, 7 and 14 to monitor the progress of the fermentation process. At the end of
the fermentation process, a total of 162 carrot sticks samples were analysed (Figure
3.9).
Initial trials carried out in the laboratory determined that the period of time required for
the LAB to adhere onto the carrot sticks ranged from 1 to 4 hours. Carrot sticks were
therefore dipped in CJB for 1, 2 and 4 hours.
In this case, the fermentation of carrots sticks would differ from the traditional
fermented vegetables where the fermentation takes place when the product is
immersed in brine which contains the fermenting bacteria. In this research work,
fermentation of carrot sticks will take place outside of the inoculation broth. However,

- 69 -
a dipping time is required to allow the lactic acid bacteria to adhere onto the carrot
sticks surface.
Storage temperatures studied included 4, 10 and 25ºC. This range of storage
temperatures included typical chilling temperatures (4-10ºC) and room temperature
(25ºC), to determine the optimum storage temperature.
Storage time monitored included 1, 7 and 14 days after inoculation. This range of
storage time is considered optimum for the fermentation using LAB.
The range of suspensions (106, 107 and 108 cfu/ml) were chosen based on similar
studies (Yoon et al., 2005 and Yoon et al., 2006) where LAB concentration of 106
cfu/ml were used to ferment beet and cabbage. In addition probiotic products must
contain in the range of 107-108 viable LAB per portion in order to show any probiotic
benefits (Tijsseling et al., 2005).
The effects on carrots pH and LAB concentration adhered to the surface will be
studied for the four factors; initial LAB concentration, dipping time, storage
temperature and storage time
Figure 3.9. Flow-chart representing the steps carried out for the carrot sticks fermentation

- 70 -
3.8.1 Changes in pH over the fermentation of carrot sticks
A multi-factor ANOVA was performed on the data collected in order to determine the
effects of the factors: initial LAB concentration, dipping time, storage temperature,
storage time and also, their interactions on the pH of the carrot sticks (Table 3.3)
Table 3.3. Multifactor ANOVA of the effect of fermentation on the pH of carrot sticks
Factors Sum of Squares Mean Square F-Ratio p-value
A: Initial LAB concentration 2.036 1.018 30.08 0.0000
B: Dipping Time 0.2184 0.1092 3.23 0.0435
C: Storage Time 246.1 82.04 2424.02 0.0000
D: Storage Temperature 1.145 0.5725 16.92 0.0000
Interactions
AB 0.1996 0.0499 1.47 0.2150
AC 0.6651 0.1109 3.28 0.0053
AD 2.053 0.5133 15.17 0.0000
BC 0.2846 0.04743 1.40 0.2207
BD 0.481 0.1202 3.55 0.0092
CD 0.8671 0.1445 4.27 0.0007
ABC 0.3129 0.02608 0.77 0.6793
ABD 0.2969 0.03711 1.10 0.3713
ACD 2.471 0.2059 6.08 0.0000
BCD 0.398 0.03316 0.98 0.4727
ABCD 0.01766 0.01766 0.52 0.9657
Residual 3.655 0.03384
Total (Corrected) 261.6
p-values < 0.05 denotes significant differences
All the factors; initial LAB concentration, dipping time, storage temperature and
storage time had a significant effect on the pH of carrot sticks (p<0.05). The factor
dipping time compared with the other factors has the lowest significant effect on the
pH of carrots sticks (p-value=0.0435).
A graphical ANOVA plot using Statgraphics Centurion XV software was performed to
display the importance of each factor in the analysis (Figure 3.10). It is a plot of the
scaled effects of each factor, where the “effect” of a factor equals the difference

- 71 -
between the least squares mean for a level of that factor and the estimated grand mean
(Hunter, 2005). The p-values for the main factors taken from Table 3.3 are located on
the right-hand side of the plot. By comparing the variability amongst the levels of the
factors to that of the residuals, it is clear that all of the factors show differences of a
greater magnitude than could be accounted for solely by experimental error.
According to the plot, the factor storage time had the greatest effect compared with the
rest of the studied factors. The factor storage temperature and initial LAB
concentration showed similar magnitude of differences and the factor dipping time had
the lowest significant effect, confirming what was determined by the multifactorial
ANOVA.
Figure 3.10. Graphical ANOVA of the fermentation factors with respect to pH of carrot sticks.
The Least Significant Difference (LSD) procedure was performed to establish the
variation between the means of the factors at their associated levels (Appendix C).
LSD forms a confidence interval for each pair of means at the selected confidence
level using Student’s t-distribution. The magnitude of the limits indicates the smallest

- 72 -
difference between any two means that can be declared to represent a statistically
significant difference.
Figure 3.11 illustrates the means and their intervals of each level of the studied factors;
initial LAB concentration, dipping time, storage time and storage temperature. It
displays the main effects for each factor. The main effect is a component that measures
the variability amongst the mean responses of each levels of the factor, identifying if
there are significant differences between the levels for a specific factor.
Initial LAB concentration (Log cfu/g)
6 7 8
4.5
4.6
4.7
4.8
4.9
pH
1 2 4
Dipping Time
4.6
4.64
4.68
4.72
4.76
4.8
4.84
pH
0 1 7 14
Storage Time
3.4
3.9
4.4
4.9
5.4
5.9
6.4
pH
4 10 25
Storage Temperature
4.6
4.65
4.7
4.75
4.8
4.85
pH
Figure 3.11. Means and 95% LSD intervals plots for the different levels of the factors initial LAB concentration, dipping time, storage time and storage temperature
There was no overlap between the intervals of levels 106, 107 and 108 of the factor
initial LAB concentration. The same trend was observed for the intervals of levels 0,
1, 7 and 14 of the factor storage time and levels 4, 10 and 25 of the factor storage
temperature (Figure 3.11). As a result, the absence of overlapping between the levels
of each factor; initial LAB concentration, storage time and storage temperature

- 73 -
indicated that there were significant differences between the means of the levels at the
95% significance level. The factor storage time had the highest difference between its
levels confirming the high significant effect showed in the multifactor ANOVA table
(Table 3.3).
The factor dipping time has a low significant effect compared to the other studied
factors. The interval of the level 4 hours overlaps with the other two intervals levels, 1
and 2 hours. As a result, the pH of carrot sticks dipped for 4 hours is not significantly
different from those dipped for 1 and 2 hours. These interactions show that dipping
time does not have a significant role with respect to the variable pH of carrot sticks in
comparison with the other factors studied. The fact that the surface of carrot sticks is
smooth and free from crevices and microcavities and also, that the whole part of the
carrot sticks is dipped in the broth inoculated with LAB explain that there will always
be a certain level of LAB adhered to the surface regardless of the dipping time applied
(1, 2 or 4 hours).
In addition, the interaction between the studied factors was also analysed. Figure 3.12
illustrates the interaction plots of the least squares means at combinations of the factors
and their levels as deemed significant using Statgraphics Centurion XV software
(Table 3.3).
Although the factor dipping time showed a significant effect on the pH, this effect is
not apparent when it interacts with the storage time and initial LAB concentration.
According to Table 3.3, there is significant interaction between dipping time and
storage temperature. Figure 3.12 shows that carrot sticks dipped for 1 hour and stored
at 4ºC have a highest pH than the rest of samples. The optimum temperature for
similar fermented vegetables (i.e. sauerkraut) fluctuates between 15-20ºC (Battcock &
Azam-Ali, 1998). The high levels of pH at 4ºC could be due to the low LAB growth
rate associated with refrigeration temperature (4ºC) and also, the short length of time
which carrot sticks were dipped into (1 hour). These facts explain that the LAB

- 74 -
concentration adhered to the surface of carrot sticks were not able to produce a high
concentration of metabolites which will lead to a little reductions in pH level.
Dipping Time (hours)
4.5
4.6
4.7
4.8
4.9
5p
H
1 2 4
Storage Temperature (ºC)
4
10
25
Storage Temperature (ºC)
Storage Time (days)
0
1
7
14
3.3
3.8
4.3
4.8
5.3
5.8
6.3
pH
4 10 25
Initial LAB concentration (Log cfu/g)
Storage Time (days)
0
1
7
14
3.3
3.8
4.3
4.8
5.3
5.8
6.3
pH
6 7 8
Initial LAB concentration (Log cfu/g)
Storage Temperature (ºC)
4
10
25
4.2
4.4
4.6
4.8
5
pH
6 7 8
Figure 3.12. Interaction plots between the initial LAB concentration time - storage time, initial LAB concentration - storage temperature, dipping time – storage temperature, storage time – storage temperature (95.0% LSD)
Storage time showed significant interactions with storage temperature. The lowest pH
values were reached at day 14, however it seems that storage temperature does not
have a significant effect on the final pH of the carrot sticks with the exception of 10ºC.
At day 1 and day 7, carrots sticks stored at 10ºC reached significant lower pHs than the
rest of the carrot sticks. This could be due to the fact that 10ºC is the storage
temperature closest to the optimum growth of LAB (Guerzoni et al., 1995) and day 1
and 7 represent the time where LAB growth is in the exponential growth phase. This is
in agreement with the results obtained in Section 3.7 where LAB growth produced in
the carrot juice broth was within the exponential phase after day 1 of inoculation.
However at day 0, the lag phase is the dominant phase as LAB are still adapting to the

- 75 -
new environment and conditions and as a result the pH is not largely affected. On the
other extreme, at day 14 the stationary phase is reached and the LAB concentration
remains relatively constant and as result minimal changes in the pH are observed.
Initial LAB concentration has significant interactions with storage time at the levels
investigated. While there was no overlap between the intervals with respect to storage
time, there was a clear overlap between the levels of initial LAB concentration. This
was an important finding in this study as the effect on the variable pH was not
determined by the level of initial LAB concentration. As a result, the initial level of
inoculation could be reduced to the 106 cfu/ml as the pH of carrot sticks will not be
affected.
While there was an interaction between the initial LAB concentration and storage
temperature, these interactions were significant only when LAB concentration was 108
cfu/ml. Carrot sticks dipped into CJB with LAB concentration at 108 cfu/g and stored
at 10ºC, had a pH significantly lower than all the rest of the samples. According to
Guerzoni et al. (1995), the optimum temperature for L. plantarum, as mesophilic
bacteria, is around 15ºC. This condition and high load of LAB (108 cfu/g) could
explain this significant decrease produced on the pH of carrot sticks stored at 10ºC.
Since the rest of the intervals all overlapped, it indicated no statistically significant
differences amongst any of the remaining levels.
The pH decrease between 1-1.5 after 24 hours is consistent with Roberts & Kidd
(2005), Yoon et al. (2005) and Gardner et al. (2001) findings. At day 7, pH readings
values decreased to 3.59-4.24. After 14 days, pH values of carrot sticks reached 3.32-
3.78, in all the cases. According to Pedersen (1979), the optimum pH in similar
fermented products, such as sauerkraut, is around 3.4-3.6. Also, similar final pH values
were observed in fermented onions after 14 days (Roberts & Kidd, 2005), and Osaro
(2003) and Gardner et al. (2001). This finding was very remarkable for this project as
it proved that the fermentation took place when the carrot sticks were packed in

- 76 -
vacuum and sealed in a PPE barrier bags. The fermentation process in onions (Roberts
& Kidd, 2005) took place when the product was immersed in brine. In this case, the
fermentation of carrot sticks was achieved in vacuum conditions without immersing
the product for the whole process.
Although the initial lactic acid bacteria population in fermented and probiotics
products such as sauerkraut or probiotic yogurts is not often specified, some authors
(Roberts & Kidd, 2005 Yoon et al., 2005, Gardner et al., 2001) have used a range
between 106-107 cfu/ml for their studies. According to this, the initial LAB
concentration of 106 and 107 cfu/g showed progressive and gradual decrease on the pH
of carrot sticks over the 14 days. However, the highest initial load (108 cfu/g) showed
significant differences in relation to storage temperature indicating a higher LAB
metabolism for carrot sticks stored at 10ºC. This might be related to the combination of
the initial high LAB concentration and the optimum growth temperature of LAB.
In conclusion, the optimum conditions in order to obtain the lowest pH and at the same
time the highest LAB concentration of the carrot sticks is 108 cfu/g initial LAB
concentration and storage at 10ºC for 14 days. This was further confirmed when
examining the multifactor table (Table 3.4) whereby there is significant effect of these
factors of storage time, storage temperature and initial LAB concentration. The lowest
pHs were reached after day 14 (Fig 3.11). The dipping time levels 1, 2 or 4 hours
seemed to have a low effect on the final pH of the carrot sticks.
3.8.2 Changes in LAB concentration over the fermentation of carrot sticks
A multifactor ANOVA using Statgraphics Centurion XV software was carried out on
the results to investigate the significance of the main effects of initial LAB
concentration, dipping time, storage temperature and also, the interactions among these
factors on the variable LAB concentrations (Log cfu/g) (Table 3.5).

- 77 -
Table 3.4. Multifactor ANOVA of the effect of fermentation LAB concentration of
carrot sticks
Factor Sum of Squares Mean Square F-Ratio p-value
A: Initial LAB concentration 80.9 40.45 516.58 0.0000
B: Dipping Time 0.2972 0.1486 1.90 0.1548
C: Storage Time 97.39 32.46 414.61 0.0000
D: Storage Temperature 0.05734 0.02867 0.37 0.6942
Interactions
AB 0.3725 0.09313 1.19 0.3197
AC 28.87 4.812 61.45 0.0000
AD 0.5519 0.138 1.76 0.1418
BC 0.5089 0.08481 1.08 0.3772
BD 0.6296 0.1574 2.01 0.0982
CD 0.2913 0.04855 0.62 0.7138
ABC 0.6533 0.05444 0.70 0.7530
ABD 0.5691 0.07113 0.91 0.5124
ACD 1.565 0.1304 1.67 0.0845
BCD 1.368 0.114 1.46 0.1524
ABCD 3.353 0.1397 1.78 0.0238
Residual 8.457 0.0783
Total (Corrected) 225.8
p-values < 0.05 denotes significant differences
Upon examining the multifactor ANOVA (Table 3.5), only the factors initial LAB load
and storage time have a significant effect on the variable final LAB load of the carrot
sticks (p<0.05). However, neither the variable dipping time (p=0.1548) nor the storage
temperature (p=0.6942) had a significant effect on the variable LAB loads
Figure 3.13 displays a graphical ANOVA using Statgraphics Centurion XV in order to
illustrate a better understanding of the effect of the factors and their levels.

- 78 -
Figure 3.13. Graphical ANOVA of the fermentation factors with respect to LAB concentration
(cfu/g) of carrot sticks.
The initial LAB load and storage time have the highest variability amongst the levels
of the factors, in accordance to the multifactor ANOVA (Table 3.5). The storage
temperature and dipping time do not have a significant effect on the LAB
concentration of carrot sticks.
The Least Significant Difference (LSD) procedure was performed to establish the
variation between the means of the factors at their associated levels (Appendix C). A
graphical representation of LSD intervals for the factors initial LAB concentration,
dipping time, storage time and temperature is displayed in Figure 3.14
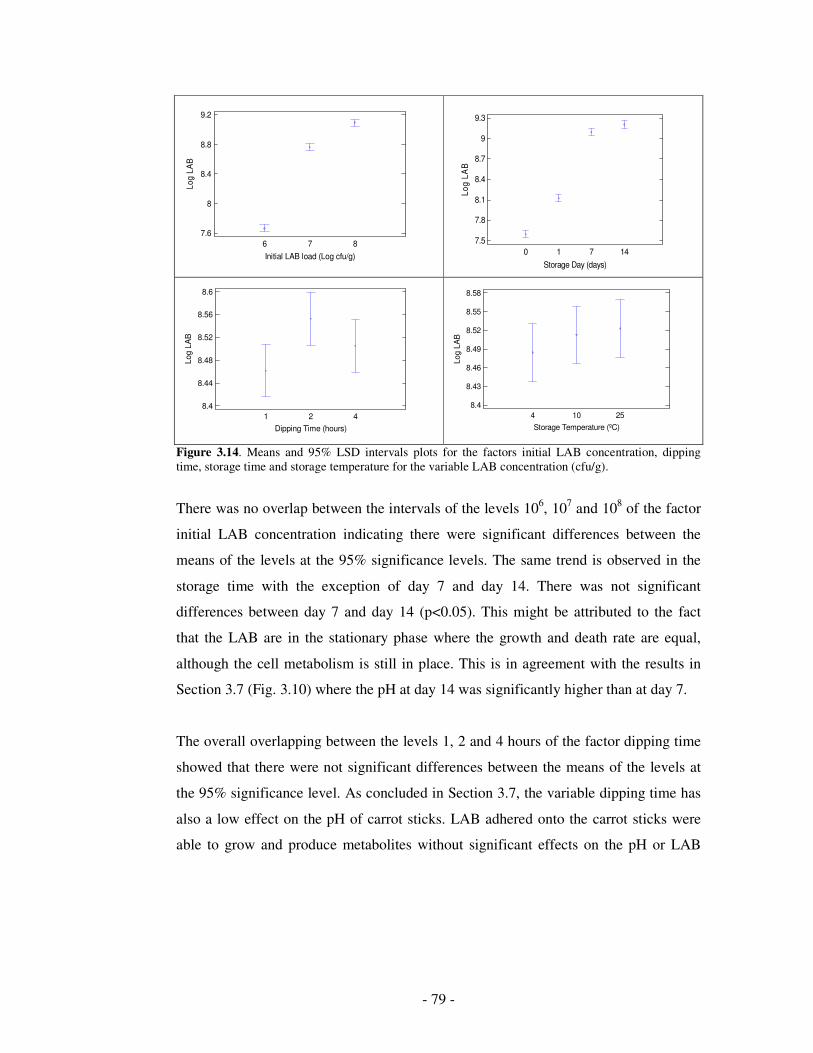
- 79 -
6 7 8
Initial LAB load (Log cfu/g)
7.6
8
8.4
8.8
9.2
Lo
g L
AB
0 1 7 14
Storage Day (days)
7.5
7.8
8.1
8.4
8.7
9
9.3
Lo
g L
AB
Dipping Time (hours)
1 2 4
8.4
8.44
8.48
8.52
8.56
8.6
Log L
AB
Storage Temperature (ºC)
4 10 25
8.4
8.43
8.46
8.49
8.52
8.55
8.58
Lo
g L
AB
Figure 3.14. Means and 95% LSD intervals plots for the factors initial LAB concentration, dipping time, storage time and storage temperature for the variable LAB concentration (cfu/g).
There was no overlap between the intervals of the levels 106, 107 and 108 of the factor
initial LAB concentration indicating there were significant differences between the
means of the levels at the 95% significance levels. The same trend is observed in the
storage time with the exception of day 7 and day 14. There was not significant
differences between day 7 and day 14 (p<0.05). This might be attributed to the fact
that the LAB are in the stationary phase where the growth and death rate are equal,
although the cell metabolism is still in place. This is in agreement with the results in
Section 3.7 (Fig. 3.10) where the pH at day 14 was significantly higher than at day 7.
The overall overlapping between the levels 1, 2 and 4 hours of the factor dipping time
showed that there were not significant differences between the means of the levels at
the 95% significance level. As concluded in Section 3.7, the variable dipping time has
also a low effect on the pH of carrot sticks. LAB adhered onto the carrot sticks were
able to grow and produce metabolites without significant effects on the pH or LAB

- 80 -
concentration regardless of the length of time which carrot sticks were dipped (1, 2 or
4 hours) into the LAB broth. This was an important finding in this study as the dipping
time could be reduced to 1 hour without a significant effect on the pH and final LAB
concentration.
The same trend is observed in the storage temperature. A general overlapping of the
levels 4ºC, 10ºC and 25ºC showed that there were not significant differences between
the means of the levels at the 95% significance level. It seems that LAB concentration
adhered onto the carrot sticks were able to grow under a range of temperatures from
4ºC to 25ºC). This might be due to the lack of competitors against LAB and the
availability of nutrients, basically carbohydrates that provided optimum conditions for
their growth and metabolism. This finding was very important as the final product
could be stored at room temperature without a significant effect on the final LAB
concentration. It would reduce the cost of maintenance and storage as chilling
conditions would not be required.
Also, the interaction among the factors was studied. In this case, only the interaction
between the factor initial LAB concentration and the factor storage time was
significantly different (Table 3.5). Figure 3.15 displays the interaction plots of the LSD
at combinations of factors and their levels and also, the Tukey’s HSD intervals as it
provides a better pairwise comparison of which of those levels do interact at a
significant level.
Figure 3.15. Interaction plots between the initial LAB concentration time and storage time at 95% LSD and Tukey’s HSD intervals.
Initial LAB load (Log cfu/g)
Storage Time (day)
0
1
7
14
Interactions and 95.0 Percent LSD Intervals
6.2
7.2
8.2
9.2
10.2
Log L
AB
6 7 8
Initial LAB load (Log cfu/g)
Storage Time (day)
0
1
7
14
Interactions and 95.0 Percent Tukey HSD Intervals
6.1
7.1
8.1
9.1
10.1
Log L
AB
6 7 8
- 81 -
The overlapping between day 7 and day 14 for initial LAB concentration of 107 cfu/g
and 108 cfu/g showed significant differences with the rest of the samples. It seems that
the highest levels of LAB on the carrots sticks are reached between day 7 and day 14
for initial LAB concentration of 107 cfu/g and 108 cfu/g. This fact was an important
finding in this work in terms of time, as it could reduce the length of time for the
production of fermented carrots sticks to 50% without having a significant effect on
the final LAB concentration of the carrot sticks. However, as it was determined in
Figure 3.12, the variable pH is highly affected by the levels of the factor storage time
at day 7 and producing the lowest pH at day 14.
LAB concentration reached on carrot sticks at day 7 are in the same order of
magnitude of those studies observed by Yoon et al. (2005), Nagy-Gastonyi et al.
(2002) and Slinde (1993) when using fermented onions and mixed vegetable juices. At
the end of day 14, carrot sticks contained a significant number of beneficial lactic acid
bacteria (108-109 cfu/ml). The results are in line with Yoon et al. (2005) who
maintained the same level of L. casei, L. plantarum and L. debreuckii (106-108 cfu/ml)
after 4 weeks of cold storage at 4ºC in fermented beet juice.
In order to optimize the fermentation, LAB levels of 108-109 cfu/g would be required.
Also, it would promote the condition that the novel fermented carrot sticks could be
considered a probiotic product. Since the factors dipping time and storage temperature
did not have any significant effect on the LAB concentrations (Log cfu/g), it is more
viable to reduce the dipping time of carrot sticks to 1 hour and store them at 25ºC. In
addition, since there were not significant differences between day 7 and day 14 on the
final LAB concentrations, the storage time of the fermented carrot sticks could be
reduced down to 7 days in order to increase the productivity.

- 82 -
3.9 Preliminary sensory analysis of the carrot sticks
A sensory analysis was applied as a preliminary consumer study to evaluate the
attributes of unfermented and fermented carrot sticks. Also, the preliminary sensory
analysis was applied as screening test to determine if fermented carrots sticks were
acceptable by the sensory panel for the various sensory attributes and if the
fermentation time had a significant effect on this acceptability.
The preliminary sensory analysis evaluated 2 groups of carrots:
1st group) Unfermented carrot sticks, which were divided into two subgroups; raw
carrot sticks (control) and carrot sticks blanched for 40 seconds
2nd group) Fermented carrot sticks, which were divided into two subgroups; fermented
carrots sticks inoculated with an initial LAB concentration of 108 cfu/g after 1 day of
fermentation, vacuum packed in PPE bags and stored at room temperature and
fermented carrots sticks inoculated with an initial LAB concentration of 108 cfu/g after
14 days of fermentation, vacuum packed in PPE bags and stored at room temperature.
The attributes of colour, brightness, orange colour, fresh carrot aroma, pickled aroma,
texture and overall visual quality were evaluated to determine the effect of the different
treatment on the carrot sticks. Mean scores and standard deviation for sensory
attributes according to two groups of carrot sticks are shown in Figure 3.14.

- 83 -
1
2
3
4
5
Colour brightness
Orange colour
Fresh carrot aroma
Pickled aroma
Texture
Overall visual quality
Unfermented carrot sticks (raw)
Unfermented carrot sticks (blanched)
Fermented carrot sticks (1 day)
Fermented carrot sticks (14 days)
Figure 3.16. Spider graphic with the sensory scores for the two groups of carrot sticks. Different lower case letter denotes significant differences according to Turkey’s HSD (95%)
The sensory panel observed significant (p<0.05) differences in brightness between
fermented carrot sticks (14 days) and the rest of the carrot sticks (Appendix C).
However, the panel could not find differences in brightness among unfermented
carrots sticks (raw and blanched) and fermented carrot sticks (1 day).
In respect to orange colour, statistical analysis determined that there were no
significant differences between unfermented and fermented the carrot sticks (p-
value=0.1362). The levels of the carotenoids, the main carrot pigments responsible for
the orange colour, did not statistically change over the 14 days. Carotenoids pigments
are high unsaturated molecules and they are subject to isomerization, which causes
colour loss and oxidation. The blanching process disrupted the cell wall of carrot and
released the carotenoids in the chloroplasts and in cell fluids. As the carotenoids were
still bound to proteins, they maintained their natural state which provided stability to
the highly unsaturated pigment structure and the colour remained more stable during
the different stages of the process (Çinar, 2003).
a
b c
d
e
f
g
ed h
i j
j
k kl
m lm

- 84 -
The sensory panel found that fermented carrot sticks (1 day and 14 days) to be
significantly different from unfermented (raw and blanched) carrot sticks in terms of
fresh carrot aroma and pickled aroma. Fresh carrot aroma and pickled aroma attributes
scores were inversely related. Unfermented carrot sticks (raw and blanched) scored
highest in terms of fresh carrot aroma; however fermented carrot sticks (1 day and 14
days) scored the highest with respect to pickled aroma.
Carrot sticks fermented for 1 day and for 14 days were chosen as the extremes of the
fermentation. The sensory panel found that the pickled aroma between 1 day and 14
days fermented carrot sticks was not significantly different (p<0.05). This was an
important finding as after 1 day of fermentation; carrot sticks develop the same pickled
aroma similar to other fermented products such as gherkins, pickled onions and
beetroot aroma. These products develop the pickled aroma by immersing them in the
broth/brine which is inoculated with the LAB. The production of metabolites such as
lactic acid and acetate are correlated with lactic acid fermentation and the pickled
aroma (Battock and Azam-Ali, 1998). This was very important because it meant that
the pickled aroma was developed in the early stages of the fermentation of carrot
sticks.
The sensory panel found significant differences between the texture scores of
unfermented carrots sticks (raw) and fermented carrot sticks (14 days). Fermented
carrot sticks (14 days) had significantly the lowest sensorial texture scores (1.73)
compared to unfermented carrots sticks (raw), which scored the highest sensorial
texture score (4.01). However, the sensory panel did not find significant differences
between unfermented carrots sticks (blanched) and fermented carrot sticks (1 day).
This was an important finding in this study, as the texture of fermented carrot sticks
after 1 day did not change from the blanched carrot sticks although signs of the lactic
acid fermentation had already started such as the developing of the pickled aroma.
Similar blanched products such as blanched carrot discs or blanched cucumber are
already available in the market; however they do not contain the pickled aroma from

- 85 -
pickled products such as gherkins or pickled onions. These novel fermented carrot
sticks could provide the texture of blanched carrot sticks mixed with the pickled aroma
of pickled products producing a new range of products available in the market. Finally,
the overall visual quality attribute showed that unfermented carrots sticks (blanched)
scored the highest. Unfermented carrots sticks (blanched) were described as “bright”
and “soft”; qualities which made the sensory panel give them the highest score.
Unfermented carrots sticks (raw) were described as “fresh”, “crispy” and “natural”.
The sensory panel did not find significant differences in the overall visual quality
between fermented carrot sticks (1 day) and unfermented carrots sticks (raw). This was
an important finding as the fermented carrot sticks (1 day) would be considered as the
same overall quality as unfermented carrots sticks (raw). In addition, fermented carrot
sticks (1 day) would contain the pickled aroma developed from the early stages of the
lactic acid fermentation and the texture would be considered the same as the blanched
carrots sticks. The sensory panel described fermented carrot sticks (14 days) as
“soft”, “dull”, “rubbery” and “non-natural”. This might be due to the LAB activity
produced over the 14 days fermentation. The degradation of the carbohydrates and
enzymes of the carrot sticks resulted in a loss of colour, brightness and texture which
made the sensory panel giving them the lowest score in the overall quality.
In conclusion, the results showed that fermented carrot sticks (1 day) are considered
acceptable at the same level as unfermented carrots sticks (raw or blanched) in terms
of brightness and orange colour and overall visual quality attribute implying its
acceptability as novel product. These findings were very important as the colour,
brightness and the visual quality attributes were still maintained on the fermented
carrot sticks after 1 day of fermentation. However, the pickled aroma started
developing at the early stages of the fermentation without involving changes in the
initial colour and brightness. As a preliminary consumer study, the overall level of
degradation produced on fermented carrot sticks (14 days) made the product to be
considered as unacceptable. Brightness, fresh carrot aroma, texture and overall visual
quality attributes scored the lowest. From the point of view of product development,

- 86 -
the time fermentation of carrot sticks of 14 days would not be considered suitable.
However, as fermented carrot sticks (1 day) were considered acceptable by the judges
for brightness, orange colour and overall visual quality attributes, the acceptability of
fermented carrot sticks up to 14 days might be considered.

- 87 -
CHAPTER FOUR
Conclusions

- 88 -
4. Conclusions
This study was carried out to investigate the feasibility of producing fermented carrot
sticks using lactic acid bacteria cultivated in a new potential carrot juice broth. A total
viable counts (TVC) concentration of 2.0 x 10⁵ cfu/g was found in raw carrots (variety
Amsterdam) and also, an initial presence of halophilic bacteria of 1.2 x 10² cfu/g.
However, the presence of lactic acid bacteria was not detected. In addition, blanching
studies concluded that carrots blanched for a minimum of 40 seconds inactivate the
initial microbiological content.
Texture analysis determined that the effect of the blanching for 40 seconds was
estimated to be not significant in relation to the initial texture. The diameter was a
significant factor in terms of the textural degradation. After a blanching period of 270
seconds, Amsterdam carrots with diameters higher than 40 mm reached a level of
texture degradation of 75%, meanwhile the textural degradation reached a level of 87%
in carrot with diameters less than 10 mm. Also, a study conducted to establish a texture
benchmark for a similar commercial product such as two jar carrot products provided a
benchmark consumer texture of 1.68-2.62 N.
In terms of length, shape and diameter, the plant material was modified into carrot
sticks with dimensions of 90mm x 5 mm x 5 mm (variety Nantes) providing a
homogeneity product and reproducible results.
Respiration studies in carrot sticks packed in PPE bags concluded that the O2 and CO2
levels in carrot sticks blanched for 40 seconds remained constant over 72 hours. The
blanching process inactivated the respiration process by inactivating enzymes such as
catalyse and peroxidase. However, the O2 and CO2 levels in raw carrot sticks were
modified over 72 hours. The %CO2 increased from 0% at day 0 up to 14% over 72
hours, meanwhile the %O2 dropped from 21% to 14%.

- 89 -
Microbiological analysis determined that carrot juice broth (CJB) supported the same
level of growth of LAB as the commercial laboratory media MRS broth over 48 hours.
Also, this study concluded the CJB inoculated with LAB has the potential to be used as
a probiotic drink since it would provide the benefits of LAB for the human body.
Fermentation studies concluded that lactic acid bacteria successfully fermented the
carrots sticks in vacuum conditions and packed in PPE barrier bags. The factor dipping
time has a low significant effect on the pH of carrots sticks compared to the factors of
initial LAB concentration, storage time and storage temperature. The highest pH was
obtained in carrot sticks dipped for 1 hour and stored at 4ºC. The lowest pH was
reached in carrot sticks dipped into CJB with a LAB concentration of 108 cfu/g and
stored at 10ºC after 14 days.
Factors such as initial LAB concentration and storage time had a significant effect in
terms of LAB concentrations. On the other hand, the factors dipping time and storage
temperature did not have any statistically significant effect on the LAB concentrations
of carrot sticks. Moreover, there were not significant differences between day 7 and
day 14 with respect to LAB concentrations leading to conditions such as dipping time
of 1 hour, storage temperature of 25ºC and storage time of 7 days would optimize the
fermented carrot sticks production.
The sensory panel did not find significant differences between fermented carrot sticks
(1 day) and unfermented carrots sticks (raw or blanched) in terms of brightness and
orange colour and overall visual quality attribute.
The overall degradation produced on fermented carrot sticks (14 days) make the
product unacceptable. However, fermented carrot sticks (1 day) were considered
acceptable by the sensory panel.
- 90 -
More studies such as the viability of LAB in simulated high-acid gastric conditions
and analysis of nutritional content analysis could be investigated in future work. Also,
alternative products such as beetroot or onion could be used to compare results. In
addition, more sensory analysis and market research studies need to be carried out to
establish the preferences from the consumer point of view of this novel product.

- 91 -
REFERENCES

- 92 -
Abu-Ghannam, N and Crowley, H. (2006) The effect of low temperature blanching on the texture of whole processed new potatoes. Journal of Food Engineering, 74, 3, 335-344. Adams, J. B. (1991). Review: Enzyme inactivation during heat processing of food-studies. International Journal of Food Science and Technology, 26, 1–20. Adams, M. R. and Moss, M.O. (2000) Food Microbiology. Cambridge, Royal Society of Chemistry Aguirre M. and Collins M.D. (1993) Lactic acid bacteria and human clinical infection. Journal of Applied Bacteriology 75, 95-107. Alakomi, H.L., Skyttä, E., Saarela, M., Mattila-Sandholm, T., Latva-Kala, K. and Helander, I.M. (2000) Lactic acid permeabilizes Gram-negative bacteria by disrupting the outer membrane. Applied and Environmental Microbiology, 66, 2001-2005. Amerine, M.A., Pangborn, R.M., and Roessler, E.B. (1965) In: Principals of Sensory
Evaluation of Food. New York Academic Press Ammor, S., Tauveron, G., Dufour, E. & Chevallier, I. (2006) Food control, 7, 454-461. Amrane, A. (2005) Analysis of the kinetics of growth and lactic acid production for Lactobacillus helveticus growing on supplemented whey permeate. Journal of
Chemical Technology and Biotechnology, 80, 345–352. Aso Y., Akaza H., Kotake T., Tsukamoto T., Imai K. and Naito S. (1995) Preventive effect of a Lactobacillus casei preparation on the recurrence of superficial bladder cancer in a double-blind trial. European Urology 27, 104-109. ASTM, (1968). Manual on Sensory Testing Methods, no. 434. American Society for
Testing and Materials, Philadelphia, ASTM Special Technical Publication. Barefoot, S.F. and Nettles, C.G. (1993) Antibiosis revisited: Bacteriocins produced by dairy starter cultures. Journal of Dairy Science, 76, 2366-2377. Bates, R. P. and Matthews, R. F. (1971) Lactic acid fermentation of Florida vegetables. Proceedings of the Florida State Horticultural Society 84, 254–257. Battcock, M. and S. Azam-Ali (1998) Fermented fruits and vegetables: A global
perspective. Food and Agriculture Organization of the United Nations, Rome.
- 93 -
Beasley, S. (2004) Isolation, identification and exploitation of lactic acid bacteria from human and animal microbiota. Faculty of Agriculture and Forestry Sciences of the University of Helsinki. Academic Dissertation in Microbiology Berg, R.D.(1995) Bacterial translocation from the gatstrointestinal tract. Trends of
Microbiology. 3, 139-154. Bergqvist, S.W., Sandberg, A. S. Carlsson, N. G. and Andlid, T. (2005) Improved iron solubility in carrot juice fermented by homo- and hetero fermentative lactic acid bacteria. Food Microbiology 22, 53-61. Bernet-Camard, M.-F., Liévin, V., Brassart, D., Neeser, J.-R., Servin, A.L. and Hudault, S. (1997) The human Lactobacillus acidophilus strain LA1 secretes a nonbacteriocin antibacterial substance(s) active in vitro and in vivo. Applied and
Environmental Microbiology. 63, 2747- 2753. Blom, H. and Mörtvedt, C. (1991) Antimicrobial substances produced by food associated micro-organisms, Biochem. Soc. Trans. 19, 694-698 Bord Glas (2003a) Sector Profile Field Vegetables, Annual Report, Irish Food Board Bord Glas (2003b) Sector Profile Horticulture, Annual Report, Irish Food Board Bourne M. C. (1982) Food texture and viscosity: concept and measurement. 330 London, U.K., Academic Press Breidt, F., Hayes, J.S. & Fleming, H.P. (2000) Reduction of microflora of whole pickling cucumbers by blanching. Journal of Food Science 65,1354 BS EN ISO 4833:2003 (2003) Microbiology of food and animal feeding stuffs. Horizontal method for the enumeration of microorganisms. Colony-count technique at 30°C. The British Standards Institution, London. BS 5763-10:1993, ISO 7402:1993 (1993) Methods for microbiological examination of food and animal feeding stuffs. Enumeration of Enterobacteriaceae. The British Standards Institution, London. BS 7857-2:1996, ISO 13721:1995 (1995) Methods for microbiological examination of meat and meat products. Enumeration of lactic acid bacteria. Colony-count technique at 30°C. The British Standards Institution, London. BS OP TP 26 (2008). Oxidase Test. National Standard Method Standards Unit, Evaluations and Standards Laboratory. London
- 94 -
Charalampopoulos D., Pandiella S.S. and Webb C. (2002) Growth studies of potentially probiotic lactic acid bacteria in cereal-based substrates. Journal of Applied
Microbiology 92, 851–859 Cherl-Ho L (1997) Lactic acid fermented foods and their benefits in Asia. Food
Control 8, 259-269.
Christiansen, C.M. (1984) Food texture perception. Advances in Food Research, 29, 159-129 Çinar, I. (2003) Carotenoid pigment loss of freeze-dried plant samples under different storage conditions. Journal of Agricultural and Food Chemistry. 2, 536-569 Code of Federal Regulations (2000) Title 21, Part 101.95. Food Labelling: “Fresh,” “freshly frozen,” “fresh frozen,” “frozen fresh.” [online] available: http://www.access.gpo.gov/nara/cfr/index.html, [accessed 5th May 2007] Collins, J.K., Thornton, G. and Sullivan, G.O. (1998) Selection of probiotic strains for human applications. International Dairy Journal. 8, 487-490. Corbo, M. R., Del Nobile, M. A. and Sinigaglia, M. (2006) A novel approach for calculating shelf life of minimally processed vegetables. International Journal of Food
Microbiology 106, 69-73. Cristiani-Urbina, E., Netzahuatl-Munoz, A. R., Manriquez-Rojas, F. J., Juarez-Ramyrez, C., Ruiz-Ordaz, N., & Galyndez-Mayer, J. (2000) Batch and fed-batch cultures for the treatment of whey with mixed yeast cultures. Process Biochemistry, 35, 649–657. Cross, M.L. (2002) Microbes versus microbes: immune signals generated by probiotic lactobacilli and their role in protection against microbial pathogens. FEMS
Immunology and Medical Microbiology. 34, 245-253. Daba, H., Lacroix, C., Huang, J. and Simard, R.E. (1993) Influence of growth conditions on production and activity of mesenterocin 5 by a strain of Leuconostoc
mesenteroides. Applied Microbiology and Biotechnology, 39, 166-173 De Belie, N., Herppich, W. and De Baerdemaeker, J. (2000). Turgor changes in red cabbage during mild heat treatment. Journal of Plant Physiology, 157, 263–272. De Castro, A, Montano, A, Sanchez and Rejano, A. H. (1998) Lactic acid fermentation and storage of blanched garlic, International Journal of Food Microbiology, 3, 205-211

- 95 -
De Vos, W.M., Mulders, J.W., Siezen, R.J., Hugenholtz, J. and Kuipers, O.P. (1993) Properties of Nisin Z and distribution of its gene, nisZ, in Lactococcus lactis. Applied
and Environmental Microbiology. 59, 213-218. De Vrese, M., Stegelmann, A., Richter, B., Fenselau, S., Laue, C., and Schrezenmeir J. (2001) Probiotics—compensation for lactase insufficiency. American Journal of
Clinical Nutrition 73, 421-429 De Vuyst, L. and Vandamme, E.J. (1994) Nisin, a lantibiotic produced by Lactococcus
lactissubsp. lactis: Properties, biosynthesis, fermentation and applications. Eds De Vuyst, L., E.J. Vandamme. Blackie Academic & Professional, Chapman & Hall. London Decuypere, D., (2005) Mineral content of fruit and vegetables [online], available http://www.lenntech.com/fruit-vegetable-mineral-content.htm, [acessed: April 2006] Dirar, H. (1993) The Indigenous Fermented Foods of the Sudan: A Study in African
Food and Nutrition, CAB International, UK Dissaraphong, S., Benjakul, S., Visessanguan W., and Kishimura H. (2006) The influence of storage conditions of tuna viscera before fermentation on the chemical, physical and microbiological changes in fish sauce during fermentation. Bioresource
Technology, 97, 2032-2040.
Drouault, S. and Corthier, G. (2001) Effets des bactéries lactiques ingérées avec des laits fermentés sur la santé. Veterinary Research 32, 101-117. Dunne, C., and Shanahan, F. (2003) Biotherapeutic agents in the treatment of gastrointestinal disorders. Current Opinion in Infectious Diseases, 5, 183-188. Edelman S., Westerlund-Wikström, B., Leskelä, S., Kettunen, H., Rautonen, N., Apajalahti, J. and Korhonen, T.K. (2002) In vitro adhesion specifity of indigenous lactobacilli within the avian intestinal tract. Applied and Environmental Microbiology. 68, 5155-5159. Ehrmann, M.A., Kurzak, P., Bauer, J. and Vogel, R.F. (2002) Characterization of lactobacilli towards their use as probiotic adjuncts in poultry. Journal of Applied
Microbiology. 92, 966-975. Elliason, D.J. and Tatini, S.R. (1999) Enhanced inactivation of Salmonella
typhimurium and verotoxigenic Escherichia coli by nisin at 6.5ºC. Food Microbiology. 16, 257-267.

- 96 -
El-Mansi, E.M.T. & Bryce, C.F.A (1999) Fermentation Microbiology and Biotechnology. Edinburgh. Taylor & Francis Ltd.. Erbas, M., Kemal, U.M., Ozgun E. M. and Certel, M. (2006) Effects of fermentation and storage on the organic and fatty acid contents of tarhana, a Turkish fermented cereal food, Journal of Food Composition and Analysis 19, 294-301 EUFIC (2000) Lactic acid bacteria - their uses in food. Food Today, 12, 1. Fajardo-Lira, C., García-Garibay M., Wacher-Rodarte, C., Farrés, A. and Marshall V.M. (1997) International Dairy Journal 7, 4, 279-281 FAO/WHO (2001) Expert Consultation on Evaluation of Health and Nutritional properties of probiotics in food including powder milk with live lactic acid bacteria, Córdoba, Argentina, 1-4 October. FAO/WHO (2002) Working group on Drafting Guidelines for the Evaluation of Probiotics in Food, London Ontario, Canada, April 30 and May 1. Farley, D. (1996) More People Trying Vegetarian Diets. FDA Consumer. 96-2296 Fasina, O. O. and Fleming, H. P (2001) Heat transfer characteristics of cucumbers during blanching. Journal of Food Engineering, 47, 203-210 Fernández, M. F., Boris S. and Barbés C. (2003) Probiotic properties of human lactobacilli strains to be used in the gastrointestinal tract. Journal of Applied
Microbiology 94, 449–455. Fernandes, C. F., Shahani, K.M. and Amer, M. A. (1987) Therapeutic role of dietary lactobacilli and lactobacillic fermentated dairy products. FEMS Microbiology, 46, 343-356. Fleming, H. P., McFeeters, R. F., Thompson, R. L., & Sanders, D. C. (1983). Storage stability of vegetables fermented with pH control. Journal of Food Science, 48, 975–981. Fliss, I., Simard, R. E. and Ettriki A. (1991). Comparison of Three Sampling Techniques for Microbiological Analysis of Meat Surfaces. Journal of Food Science 56, 249–250 Fonseca, S., Oliveira, F.A.R., Brecht, J. K. and Chau, K. V. (1999) Development of perforation-mediated modified atmosphere packaging for fresh-cut vegetables, 389-403. In F. A. R. Oliveira and J. C. Oliveira (eds.). Processing foods: quality optimisation and quality assessment. Fla. CRC Press. Boca Raton,.
- 97 -
Fooks, L.J., Fuller, R. and Gibson G.R. (1999) Prebiotics, probiotics and human gut microbiology. International Dairy Journal. 9, 53-61. Franz C. M. A. P. and Von Holy A. (1996) Thermotolerance of meat spoilage lactic acid bacteria and their inactivation in vacuum-packaged vienna sausages. International
Journal of Food Microbiology, 29, 59-73. FSAI (2001) Guidelines for the interpretation of results of microbiological analysis of some ready-to-eat foods sampled at point of sale. Dublin. FSAI FSAI (2006) Functional Food Claims Must Not Refer to Diseases or Mislead Consumers, Press Release
Fuchigami M, Hyakumoto N, Miyazaki K, Nomura T and Sasaki J. (1994) Texture and histological structure of carrots frozen at a programmed rate and thawed in an electrostatic field. Journal of Food Science 59, 1162-1167 Fuller, R. (1989). Probiotics in man and animals. Journal of Applied Bacteriology 66, 365–378. Gardner, NJ., Savard, T., Obermeier, P., Caldwell, G. and Champagne, C P. (2001) Selection and characterization of mixed starter cultures for lactic acid fermentation of carrot, cabbage, beet and onion vegetable mixture. Journal of Food Microbiology, 64, 261-275. Gasser F. (1994) Safety of lactic acid bacteria and their occurrence in human clinical infections. Bulletin of the Institute Pasteur 92, 45-67. Gibson, G.R. and Fuller R. (2000) Aspects of in vitro and in vivo research approaches directed toward identifying probiotics and probiotics for human use. Journal of
Nutrition. 130, 391S- 395S. Gionchetti P., Rizzello F., Venturi A., Brigidi P., Matteuzzi D., Bazzocchi G., Poggioli G., Miglioli M. and Campieri M. (2000) Oral bacteriotherapy as maintenance treatment in patients with chronic pouchitis: a double-blind, placebo-controlled trial. Gastroenterology 119, 305-309. Glasscock S.J., Axelson J.M., Palmer J.K., Phillips J.A. and Taper L.J. (1982) Microwave blanching of vegetables for frozen storage. Home Economics Research
Journal 11,149-158

- 98 -
Gleeson, E. and O’Beirne, D. (2005) Effects of process severity on survival and growth of Escherica coli and Listeria iinocua on minimally processed vegetables. Food
Control, 16, 277-685 Gmeiner, M., Kneifel, W., Kulbe, K.D., Wouters, R., De Boever, P., Nollet, L. and Verstraete, W. (2000) Influence of a symbiotic mixture consisting of Lactobacillus
acidophilus 74-2 and a fructooligosaccharide preparation on the microbial ecology sustained in a simulation of the human intestinal microbial ecosystem (SHIME reactor). Applied Microbiology and Biotechnology, 53, 219-223. Gomes, A.M.P. and Malcata, F.X. (1999) Bifidobacterium spp. & Lactobacillus Acidophilus: biological, biochemical, technological and therapeutical properties relevant for use as probiotics. Trends in Food Science and Technology 10, 139–157. Gomez, F., Toledo, R. T. and Sjöhol I. (2005). Tissue damage in heated carrot slices. Comparing mild hot water blaching and infrared heating. Journal of Food, 67, 381-385 Gomez, R., Muñoz M., De Ancos, B. and Cano, M.P (2002) New procedure for detection of lactic acid bacteria in vegetables producing antibacterial substances. Lebensmittel-Wissenschaft und-Technologie, 35, 284-288. Gorbach, S. L. (1990) Lactic acid bacteria and human health. Annal of Internal
Medicine 22, 37-41. Gornicki K. and Kaleta A. (2007) Modelling convection drying of blanched parsley root slices, Biosystems Engineering 97, 1, 2007, 51-59 Grangette, C., Müller-Alouf, H., Goudercourt, D., Geoffroy, M.-C, Turneer, M., and Mercenier, A. (2001) Mucosal immune responses and protection against tetanus toxin after intranasal immunization with recombinant Lactobacillus plantarum. Infection
and Immunity, 69,1547-1553. Greeve, L. C., McArdle R.N., Gohlke J.R. and Labavitch J.M., (1994a). Impact of heating on carrot Firmness: changes in cell wall components. Journal of Agricultural
and Food Chemistry 42, 2900-2906 Greeve, L. C., Shackel, K. A., Ahmadi, H., McArdle, R. N., Gohlke, J. M., and Labavitch, J. M. (1994b). Impact on heating on carrot firmness: contribution of cellular turgor. Journal of the Agriculture and Food Chemistry, 42, 2896–2899. Grote, M., and Fromme, H.G. (1984). Electron microscopic investigation of the cell structure in fresh and processed vegetables (carrots and green bean pods). Food
Microstructure, 3, 73-82.

- 99 -
Guerzoni M. E., Sinigaglia M., Gardini F., Ferruzzi M. and S. Torriani (1995). Effects of pH, Temperature, Ethanol, and Malate Concentration on Lactobacillus plantarum and Leuconostoc oenos: Modelling of the Malolactic Activity. American Journal of
Enology and Viticulture, 46,3, 368-374. Haas G. J., Prescott Jr H and Cante C. J. (1994) On rehydration and respiration of dry and partially dried vegetables. Journal of Food Science 39, 681–684 Hansen, L. D., Afzal, M., Breidenbach, R. W., and Criddle, R. S. (1994). High- and low-temperature limits to growth of tomato cells. Planta, 195, 1–9. Hasler, C. (1998). Functional Foods: Their Role in Disease Prevention, Food
Technology, 52, 1-24 Havas, S., Heimendinger, J., Reynolds, K., Baranowski, T., Nicklas, T.A., Bishop, D., Buller, D., Sorensen, G., Beresford, S.A. and Cowan, A. (1994) 5 A Day for Better Health: a new research initiative, Journal of the American Dietetic Association, 94, 32-6. Havenaar R, Huis in’t Veld J. H. J (1992) Probiotics: a general view. The lactic acid
bacteria in health & disease, vol 1, London: BJB Wood, Chapman & Hall, 151-170, 209-224 Heenan, C.N., Adams, M.C., Hosken, R.W. and Fleet, G.H., (2002) Growth medium for culturing probiotic bacteria for applications in vegetarian food products. Lebensmittel-Wissenschaft und-Technologie 35, 171–176. Heyman, M. (2000). Effect of lactic acid bacteria on diarrheal diseases. Journal of the
American College of Nutrition, 19, 137S-146S. Holzapfel, W. H., Geisen, R., & Schillinger, U. (1995). Biological preservation of foods with reference to protective cultures, bacteriocins, and food-grade enzymes. International Journal of Food Microbiology, 24, 343–362. Hilliam, M. (2000) Functional food––How big is the market? The World of Food
Ingredients. 12, 50–52. Hirayama, K. and Rafter, J. (2000) Review: The role of probiotic bacteria in cancer prevention. Microbes and Infection, 2, 681-686. Holley, R. A., Doyon, G., Fortin, J., Rodriguez, N. and Carbonneau M. (1996) Post-process, packaging-induced fermentation of delicatessen meats, Food Research
International, 29, 1, 35-48.
- 100 -
Holzapfel W.H., Haberer P., Snel J., Schillinger U. and Huis in ‘t Veld J.H.J. (1998) Overview of gut flora and probiotics. International Journal of Food Microbiology, 41, 85-101. Hove, H., Nørgaard, H. and Brøbech Mortensen, P. (1999) Lactic acid bacteria and the human gastrointestinal tract. European Journal of Clinical Nutrition, 53, 339-350. Hunter, J.S (2005) Statistics for Experimenters, Technometrics 3 (3), 311-351 Immonen, T. and Saris, P.E.J. (1998) Characterization of the nisFEG operon of the nisin Z producing Lactococcus lactis subsp. lactis N8 strain. DNA Sequence, 67, 1-12. Irish Universities Nutrition Alliance (2000) North/South Ireland Food Consumption
Survey, Dublin, Press released, Food Safety Promotion Board. Isolauri, E., Arvola T., Sütas, Y., Moilanen, E. and Salminen, S. (2000) Probiotics in the management of atopic eczema. Clinical & Experimental Allergy30, 1604-1610. Jacob, F., Lwoff, A., Siminovistch, A. and Wollman, E. (1953) Définition de quelques termes relatifs à la lysogénie, Annal of Institute Pasteur 84, 222-225 Jacxsens, L., Devlieghere, F., Ragaert, P., Vanneste E. and Debevere, J. (2004) Relation between microbiological quality, metabolite production and sensory quality of equilibrium modified atmosphere packaged fresh-cut produce. International Journal
of Food Microbiology 83, 263-280
Jehanno, D., Thuault D. and Bourgeois, C.M. (1992) Development of a Method for Detection of Lactic Acid Bacteria Producing Exclusively the L-(+)-Isomer of Lactic Acid. Applied and Environmental Microbiology, 58, 4064-4067. Joosten, H.M.L.J. and Nuñez, M. (1996) Prevention of histamine formation in cheese by bacteriocin –producing lactic acid bacteria. Applied and Environmental
Microbiology, 62, 1178-1181. Kader, A. (2001) Importance of Fruits, Nuts, and Vegetables in Human Nutrition and Health, Perishables Handling Quarterly, 106, 4-6 Kala A. and Prakash J. (2004) Nutritional composition and sensory profile of microwave and conventionally cooked vegetables. Foodservice Research
Internacional 15. 1–12 Kalac, P., Spicka, J., Krizek, M. and Pelikanova, T. (2000) The effects of lactic acid bacteria inoculants on biogenic amines formation in sauerkraut. Food Chemistry 70, 3, 355-359.

- 101 -
Kays, S. J. (1991). Postharvest physiological of perishable plant products. New York. Ed. Van Nostrand Reinhold. Kilcast, D. and Fillion L. (2001). Understanding consumer requirements for fruit and vegetables. Nutrition & Food Science 31, 221-225. Kimura B., Konagaya Y. and Fujii T. (2001) Histamine formation by Tetragenococcus
muriaticus, a halophilic lactic acid bacterium isolated from fish sauce. International
Journal of Food Microbiology, 70, 71-77. Kimura, K., McCartney, A.L., McConnell, M.A. and Tannock, G.W. (1997) Analysis of faecal populations of bifidobacteria and lactobacilli and investigation of the immunological responses of their human hosts to the predominant strains. Applied and
Environmental Microbiology, 63, 3394-3398. Klaiber, R. K, Baur S., Wolf, G., Hammes W. P. and Carlea, R. (2005) Quality of minimally processed carrots as affected by warm water washing and chlorination. Innovative Food Science and Emerging Technologies, 6, 351-362. Knorr, D. (1998) Technology aspects related to microorganisms in functional foods. Trends of Food Science. 9, 295-306. Kovack, R. T (1999). Blanching vegetables. Backwoods at Home Magazine. 59, 53. Kreutzmann, S., Thybo, A. K. and Bredie W. L. P. (2007) Tranining of a sensory panel and profiling of winter hardy and coloured carrot genotypes. Food Quality and
Preference 18, 482–489 Kristal, A. R., Curry, S.J, Shattuck, A.L., Feng, Z and Li S.A. (2000) Randomized trial of a tailored, self-help dietary intervention: the Puget Sound Eating Patterns Study. Preventive Medicine, 31, 380 Kuipers, O. P., Beerthuyzen, M. M., Siezen, R. J. and W. M. de Vos. (1993) Characterization of the nisin gene cluster nisABTCIPR of Lactococcus lactis. Requirement of expression of the nisA and nisI genes for evelopment of immunity. European Journal of Biochemistry, 216, 281-291 Lau, M. H., Tang, J., and Swanson, B. G. (2000) Kinetics of textural and colour changes in green asparagus during thermal treatments. Journal of Food Engineering,
45, 231-236. Lavelli V., Pagliarini E., Ambrosoli R., Minati J.L. and Zanoni B. (2006) Physicochemical, microbial, and sensory parameters as indices to evaluate the quality of minimally-processed carrots. Posthavervest Biology and Technology. 40, 34-40.
- 102 -
Lawless H. T. and Heymann H. (1999) Sensory evaluation of food, principles and practices. New York. Aspen Publishers Lee, C.H. (1994) Importance of lactic acid bacteria in non-dairy food fermentation, In Lactic Acid Fermentation of Non-dairy Food and Beverages, ed. C.H. Lee, J. Adler-Nissen and G. Barwald, HarnLimWon, Seoul, 132-150 Lee, S. Y. (2004) Microbial Safety of Pickled Fruits and Vegetables and Hurdle Technology. Internet Journal of Food Safety, 4, 21-32 Lillford, P. (2000) The materials science of eating and food breakdown. The material science of food. MRS Bulletin 12, 38–43. Link-Amster, H., Rochat, F., Saudan, K.Y., Mignot, O. and Aeschlimann, J.M. (1994) Modulation of a specific humoral immune response and changes in intestinal microbiota medicated through fermented milk intake. FEMS Immunology and Medical
Microbiology, 10, 55-64. Llorca E., Puig A., Hernando I., Salvador A., Fiszman S M. and Lluch M A. (2001) Effect of fermentation time on texture and microstructure of pickled carrots. Journal of
the Science of Food and Agriculture, 81, 1553-1560. Lonvaud-Funel, A. (2001) Biogenic amines in wines: role of lactic acid bacteria FEMS
Microbiology Letters 199, 9-13
Lu, Z., Breidt Jr. F., Fleming, H. P., Altermann, E. and Klaenhammer, T. R. (2003) Isolation and characterization of a Lactobacillus plantarum bacteriophage, phiJL-1, from a cucumber fermentation, International Journal of Food Microbiology, 84, 225-235. Lücke, F. K. (2000). Utilization of microbes to process and preserve meat. Meat
Science, 56, 105–115. Luckow, T., and Delahunty, C. (2004). Which juice is healthier? A consumer study of probiotic non-dairy juice drinks. Food Quality and Preference 15, 751-759 Lyhs, U. (2002) Lactic acid bacteria associated with the spoilage of fish products. Academic Dissertation. Department of Food and Environmental Hygiene. Faculty of Veterinary Medicine. University of Helsinki. Majamaa, H. and Isolauri, E. (1997) Probiotics: A novel approach in the management of food allergy. Journal of Allergy and Clinical Immunology, 99, 179-185.

- 103 -
Marx, M., Stuparic, M., Schieber, A. and Carle, R. (2003) Effects of thermal
processing on trans-cis-isomerization of β-carontene in carrot juice and caronten-containing preparations. Food Chemistry 83, 609-617 McGartland, C. P., Robson, P. J., Murray, L. J., Cran, G. W., Savage, M. J., Watkins, D. C., Rooney, M. M. and Boreham C. A. (2004) Fruit and vegetable consumption and bone mineral density: the Northern Ireland Young Hearts Project, American Journal of
Clinical Nutrition 80, 1019-1023. McKevith, B. (2005) A carrot a day to keep cancer away? Nutrition Bulletin. 30, 117–119 McNaught, C.E. and MacFie, J., (2001). Probiotics in clinical practice: a critical review of the evidence. Nutrition Research, 21, 343–353. Meilgaard, D., Civille, G.V., & Carr, B.T (1991) Sensory Evaluation Techniques. Boca Raton CRC Press Menrad, K. (2003) Market and marketing of functional food in Europe. Journal of
Food Engineering, 56, 2-3, Montaño, A., Sánchez, A.H., Rejano, L. and de Castro A. (1997) Processing and storage of lye-treated carrots fermented by a mixed starter culture. International
Journal of Food Microbiology 35, 83-90.
Mugula, J.K., Narvhus, J.A. and Sorhaug T. (2003) Use of starter cultures of lactic acid bacteria and yeasts in the preparation of togwa, a Tanzanian fermented food. International Journal of Food Microbiology 3, 307-318. Nagy-Gasztonyi, M., Biekmna, E. and Krebbers, B. (2002) Working up a lactofermented vegetable product. Acta Alimentaria 31, 407-412. Naidu A.S., Bidlack W.R. and Clemens R.A. (1999) Probiotic spectra of lactic acid bacteria (LAB). Critical Reviews in Food Science and Nutrition 39, 13-126. Naska, A., Vasdekis, V.G.S., Trichopoulou, A., Friel, S., Leonhauser, I.U., Moreiras, O., Nelson, M., Remaut, A.M., Schmitt, A., Sekula, W., Trygg, K.U. and Zajkás, G. (2000) Fruit and vegetable availability among ten European countries how does it compare with the “five-a-day” recommendation. British Journal of Nutrition. 84, 549-556. Ng, A., & Waldron, K. W. (1997). Effect of cooking and pre-cooking on cell-wall chemistry in relation to .rmness of carrot tissues. Journal of the Science of Food and
Agriculture, 73, 503–512.

- 104 -
Niketic-Aleksic, G., Bourne, M. C., & Stamer, J. R. (1973). Preservation of carrots by
lactic acid fermentation. Journal of Food Science, 38, 84–86. Nurmi, E. and Rantala, M. (1973) New aspects of Salmonella infection in broiler production. Nature 241, 210-211. Ocaña, V.S., Pesce de Ruiz Holgado, A.A. and Nader-Macías, M. E. (1999) Characterization of a bacteriocin-like substance produced by a vaginal Lactobacillus
salivarius strain. Applied and Environmental Microbiology, 65, 5631-5635. Oh, H., Wee, Y. J., Yun, J. S., Han, S. H., Jung, S., & Ryu, H. W. (2005) Lactic acid production from agricultural resources as cheap raw materials. Bioresource
Technology, 96, 1492–1498. Oksanen, P.J, Salminen, S., Saxelin, M. , Hämäläinen, P., Ihantola-Vormisto, A., Muurasniemi-Isoviita, L., Nikkari, S., Oksanen, T., Pörsti, I., Salminen, E., Siitonen, S., Stuckey, H., Toppila, A. and Vapaatalo, H. (1990) Prevention of travellers’ diarrhea by Lactobacillus GG. Annal of Medicine. 22, 53-56. Ong, D. E., and Chytil, F. (1983) Vitamins and hormones In G. D. vurbach Ed, 105–112, New York: Academic Press. Osaro, E.F. (2003) Production of sauerkraut (picked) from cabbage (Brassica
Oleracea) by the action of lactic acid bacteria. African Journal of Science and
Technology. Science and Engineering Series 4, 92-95.
O’Mahony, M. (1986) Sensory Evaluation of Food. New York. Marcel Dekker, Inc. O’Reilly, E. (2000) Compositional Changes in Selected Minimally Processed Vegetables. M. Phil, Dublin Institute of Technology. O’Sullivan, L., Ross, R.P. and Hill, C. (2002) Review: Potential of bacteriocin-producing lactic acid bacteria for improvements in food safety and quality. Biochimie
84, 593-604. Pao, S. and Davis C.L. (1999) Enhancing microbiological safety of fresh orange juice by fruit immersion in hot water and chemical sanitizers. Journal of Food Protection, 62, 756-60. Pedersen, C.S. (1979) Microbiology of Food Fermentations, Westport, USA, AVI Publishers.

- 105 -
Perdigón, G., Fuller, R. and Raya, R. (2001) Lactic acid bacteria and their effect on the immune system. Current Issues in Intestinal Microbiology 2, 27-42. Perdigón, G., Vintiñi, E., Alvarez, S., Medina, M. and Medici, M. (1999) Study of the possible mechanisms involved in the mucosal immune system activation by lactic acid bacteria. Journal of Dairy Science, 82, 1108-1114. Potty, V. H. (1996). Physico-chemical aspects, physiological functions, nutritional importance and technological significance of dietary fibre - A critical appraisal, Journal of Food Science and Technology, 33, 1–18. Prakash, S., Jha, S. K. and Datta, N. (2004) Performance evaluation of blanched carrots dried by three different driers. Journal of Food Engineering 62, 305-313. Prior, R.L. and Cao, G. (2000) Antioxidant phytochemicals in fruits and vegetables; diet and health implications. HortScience 35, 588-592. Produce for Better Health Foundation (2005) 5 a Day Program, [online] available: http://www.5aday.org (accessed May 2006) Puchooa, D. and Rambum, R. (2004) A study on the use of carrot juice in the tissue culture of Daucus carota. African Journal of Biotechnology 3, 248-252. Qiao, M., Immonen, T., Koponen, O. and Saris, P.E.J. (1995) The cellular location and effect on nisin immunity of the NisI protein from Lactococcus lactis N8 expressed in Escherichia coli and L. lactis. FEMS Microbiology Letters, 131, 75-80. Quebedeaux, B. and Bliss, F.A. (1988) Horticulture and human health. Contributions of fruits and vegetables. Proc. 1st Intl. Symposium Hort. and Human Health. Prentice Hall, Englewood. Quebedeaux, B. and Eisa, H.M. (1990) Horticulture and human health. Contributions of fruits and vegetables. Proc. 2nd Intl. Symposium Hort. and Human Health. Rahman A.R., Henning W.L., and Westcott D.E. (1971) Histological and physical changes in carrot as affected by blanching, cooking, freezing, freeze drying and compression. Journal of Food Science 36, 500-502 Ramana, S.V., Wright, C.J., and Taylor, A.J. (1992). Measurement of firmness in carrots tissue during cooking using dynamic, static and sensory test. Journal of the
Science of Food and Agriculture 60, 369-375

- 106 -
Randazzo, C.L., Restuccia, C., Romano, A.D. and Cinzia, C. (2004) Lactobacillus
casei, dominant species in naturally fermented Sicilian green olive. International
Journal of Food Microbiology 90, 9-14. Rankin, M., Vukasinovic, M., Siler-Marinkovic and S., Maksimovic (2007), Food
Chemistry, 100, 599-602 Reid, G., (2006) Safe and efficacious probiotics: what are they? Trends in
Microbiology 14, 348-352 Renault P. (2002) Genetically modified lactic acid bacteria: applications to food or health and risk assessment. Biochimie, 84, 1073-1087. Rico, D., Martín-Diana, A.B., Frías, J.M., Barat, J.M., Henehan, G.T.M., Barry-Ryan, C.(2007). Improvement in texture using calcium lactate and heated treatments for stored ready-to-eat carrots. Journal of Food Engineering 79, 1196-1236. Roberts, J.S. and Kidd, D. R. (2005). Lactic acid fermentation of onions. Lebensmittel-
Wissenschaft und-Technologie, 38,185–190 Robredo, B. and Torres, C. (2000) Bacteriocin production by Lactobacillus salivarius
of animal origin. Journal of Clinical Microbiology, 38, 3908-3909. Rolfe, R.D. (2000) The role of probiotic cultures in the control of gastrointestinal health. Journal of Nutrition, 130, 396S-402S. Ross R. P, Stanton, C., Hill, C., Fitzgerald, G. F., and Coffey A. (2000) Novel cultures for cheese improvement. Trends in Food Science & Technology 11, 96-104 Rosenthal, A. J. (1999). Food texture. Measurement and Perception. An Aspen Publicationsm, Gaithersburg, MD (USA) Ryan, K.J. and Ray, C.G. (2004). Sherris Medical Microbiology, 4th ed., New York. McGraw Hill Medical Ryan, M.P., Meaney, W.J., Ross, R.P. and Hill, C. (1998) Evaluation of lactacin 3147 and a teat seal containing this bacteriocin for inhibition of mastitis pathogens. Applied and Environmental Microbiology. 64, 2287-2290. Ryan, M.P., Rea, M.C. Hill, C. and Ross, R.P. (1996) An application in cheddar cheese manufacture for a strain of Lactococcus lactis producing a novel broad-spectrum bacteriocin, lacticin 3147. Applied and Environmental Microbiology. 62, 612-619.

- 107 -
Ryden, P. and Selvendran R. R. (1990). Cell-wall polysaccharides and glycoproteins of parenchymatous tissues of runner bean (Phaseolus coccineus). Biochemistry Journal 269, 393-402 Saito, T. (2004). Selection of useful probiotic lactic acid bacteria from the Lactobacillus acidophilus group and their applications to functional foods Animal
Science Journal, 75, 1. Salminen M.K., Järvinen A., Saxelin M., Tynkkynen S., Rautelin H., Valtonen V. (2001) Increasing consumption of Lactobacillus GG as a probiotic and the incidence of lactobacilli bacteraemia in Finland. Clinical Microbiology and Infection 7, 802. Salminen, S. (1990) The role of intestinal microbiota in preserving intestinal integrity and health with special reference to lactic acid bacteria. Annal of Medicine, 22, 42. Salminen, S., Bonley, C., Bourron-Ruanlt, M., Cummings, J.H., Franck, A., Gibson, G.R., Isolauri E., Moreau, M.C., Roberfroid, M. and Rowland, I. (1998) Functional food science and gastrointestinal physiology and function. British Journal of Nutrition. 80, 147S-171S. Sanders, M. E. (1998) Overview of functional foods: emphasis on probiotic bacteria. International Dairy Journal, 8, 341–347. Satia, J. A., Kristal, A. R., Patterson, R.. E, Neuhouser, M. L. and Trudeau E. (2002) Psychosocial Factors and Dietary Habits Associated With Vegetable Consumption. Nutrition, 18, 247-254. Savard, T., Beaulieu, C., Gardner, N. J. and Champagne C. P. (2002) Characterization of spoilage yeasts isolated from fermented vegetable and Inhibition by lactic, acetic and propionic acids, Food Microbiology, 19, 363-373. Saxelin M., Rautelin H., Salminen S. and Makela P.H. (1996) The safety of commercial products with viable Lactobacillus strains. Infectious Diseases in Clinical
Practice 5, 331-335. Schrezenmeir, J., de Vrese M. (2001) Probiotics, prebiotics, and synbiotics – approaching a definition. American Journal of Clinical Nutrition, 73, 361-364. Seyoum, T, Osthoff, G. and Steyn M.S. (2001). Effect of modified atmosphere packaging on microbiological, physiological and chemical qualities of stored carrot. The journal of Food Technology in Africa 6, 4. 138-143. Shah, N. P. (2001). Functional foods from probiotics and prebiotics. Food Technology,
55, 46-53.

- 108 -
Shah, N. P. (2007) Functional cultures and health benefits, International Dairy Journal
17, 1262–1277 Shortt, C. (1999) The probiotic century: historical and current perspectives. Trends in
Food Science and Technology 10, 411–417. Sindhu, S.C. and Khetarpaul, N. (2001) Probiotic fermentation of indigenous food mixture: effect on antinutrients and digestibility of starch and protein. Journal of Food
Composition and Analysis 14, 601–609. Steinkraus, K. H. (1996) Handbook of Indigenous Fermented Foods. Marcel Decker Inc, New York Slinde, E. (1993) Lactic acid fermentation influence on sugar content and colour of deep-fried chips. Fd. Res. Int., 26, 255-266. Snijders, J.M.A, Janssen, M.H.W., Gerats G.E. and G.P. Corstiaensen (1984) A comparative study of sampling techniques for monitoring carcass contamination. International Journal of Food Microbiology, 1, 229-236 Sode F., and Kühn B. F. (1998) Respiration in MA-packed, cut carrots. Journal of
Food Engineering 37, 223-232. Stanton, C, Ross, P., Fitzgerald, G. F. and Van Sinderen, D. (2005) Fermented functional foods based on probiotics and their biogenic metabolites. Current Opinion
in Biotechnology 16, 198-203 Stanton, C., Gardiner, G., Lynch, P. B., Collins, Fitzgerald, J. K.G. and Ross R. P. (1998) Probiotic Cheese, International Dairy Journal 8, 491-496 Sudha, M.L., Vetrimani, R. and Leelavathi K. (2006) Influence of fibre from diferent cereals on the rheological characteristics of wheat flour dough and on biscuit quality. Food Chemistry, 1365-1370 Sugihara, T.F. (1985) Microbiology of Breadmaking, In "Microbiology of Fermented Foods", Ed. by Wood, B.J.B., London, Elsevier Applied Science Publishers, Surjadinata, B. B., & Cisneros-Zevallos, L. (2003). Modeling wounding induced respiration of fresh-cut carrots (Daucus carots L.). Journal of Food Science, 68, 2735– 2740. Szczesniak A. S. (1990) Psychorheology and texture as factors controlling the consumer acceptance of food. Cereal Foods World 351, 1201-1205

- 109 -
Tannahill R, (1991) Food in History, Ed. by Tannahill R. Three Rivers Press, New York. Tannock, G.W. (1998) Studies of the intestinal microbiota: a prerequisite for the development of probiotics. International Dairy Journal8, 527-533. Taylor-Davis, S. (2005) Food Processing and Preservation, Microsoft® Encarta® Online Encyclopedia [online] available: http://ca.encarta.msn.com/encyclopedia_761560675_4/food_processing_and_preservation.html [accessed: June 2006] Tijsseling, I.A., Pekelharing, P.R. and Rombouts, F.M. (2005) Position paper on probiotics. Natuur- & gezondhelids producten, 1, 1-6 Toba, T., Virkola, R., Westerlund, B., Björkman, Y., Sillanpää, J., Vartio, T., Kalkkinen, N. and Korhonen, T.K. (1995) A collagen-binding S-layer protein in Lactobacillus crispatus. Applied and Environmental Microbiology. 61, 2467-2471. Thomas, L. V., Clarkson, M. R. and Delves-Broughton, J. (2000) Nisin, p. 463-524. Natural Food Antimicrobial Systems, ed. A. S. Naidu. CRC Press, Boca Raton. USDA (2004) The Commercial Storage of Fruits, Vegetables, and Florist and Nursery Stocks, Agriculture Handbook 66. USDA (2005a) Nutrient Database for Standard Reference, 18 USDA (2005b) Nutrition and your health: dietary guidelines for Americans. 6th Edition, Washington, DC: Government Printing Office Vahjen, W. and Männer, K. (2003) The effect of a probiotic Enterococcus faecium
product in diets of healthy dogs in bacteriological counts of Salmonella spp., Campylobacter spp. and Clostridium spp. in faeces. Archives of Animal Nutrition . 57, 229-233. Valerio, F., Lavermicocca, P., Pascale, M. and Visconti, A. (2004) Production of phenyllactic acid by lactic acid bacteria: an approach to the selection of strains contributing to food quality and preservation. FEMS Microbiology Letters 233, 289-295 Van Buren J. P. (1979) The chemistry of texture in fruits and vegetables. Journal of
Texture Studies10, 1-23.

- 110 -
Van Duyn, M. A. and Pivonka, E. (2000) Overview of the Health Benefits of Fruit and Vegetable Consumption for the Dietetics Professional: Selected Literature Journal of
the American Dietetic Association 100, 1511-1521 Van Loo, J.,Cummings, J., Delzenne, N., Englyst, H., Franck, A., Hopkins, M., Kok, N., Macfarlane, G., Newton, D., Quigley, M., Roberfroid, M., van Vliet, T. and Van den Heuvel, E. (1999) Functional food properties of non-digestible oligosaccharides: a consensus report from the ENDO project (DGXII AIRII-CT94-1095). British Journal
of Nutrition. 81, 121-132. Vaughan, E. E., Caplice. E., Looney, R., O’Rourke, N., Coveney, H., Daly C. Fitzgerald G. F. (1994) Isolation from food sources, of lactic acid bacteria that produced antimicrobials. Journal of Applied bacteriology 76, 118-123. Ventosa, A., Nieto, J. J. and Oren A. (1998) Biology of Moderately Halophilic Aerobic Bacteria. Microbiology and Molecular Biology Reviews, 62, 504–544 Viander, B., Maki, M. and Palva, A. (2003) Impact of low salt concentration, salt quality on natural, Food Microbiology 20, 391–395 Vu, S., Smout, C., Sila, D., LyNguyen, B., Van Loey, A., & Hendrickx, M. (2004). Effect of preheating on thermal degradation kinetics of carrot texture. Innovative Food
Science and Emerging Technologies, 5, 37–44 Waldron, K. W., Parker, M. L. and Smith A. C. (2003) Plant cell walls and food quality. Comprehensive Reviews In Food Science And Food Safety, 2, 101-119 Walker, P.M.B. (1988), Chambers Science and Technology Dictionary, Chambers, Cambridge University Press Wargovich, M.J. (2000). Anticancer properties of fruits and vegetables : The Role of Oxidative Stress and Antioxidants in Plant and Human Health. HortScience, 35, 573-575 Wolf B.W., Wheeler K.B., Ataya D.G. and Garleb K.A (1998) Safety and tolerance of Lactobacillus reuteri supplementation to a population infected with the Human Immunodeficiency Virus. Food and Chemical Toxicology 36, 1085-1094. Wood, B. J B. (1992) The lactic acid bacteria in health and disease. London, Blackie Academic & Professional. Wu, A. and Chang, W.H. (1990) Influence of pre-cooking on the firmness and pectic substances fo threee stem vegetables. International Journal of Food Science and
Technology, 25, 558-55
- 111 -
Yantis, J. E (1992) The Role of Sensory Analysis in Quality Control, Edited by Yantis J. L. West Conshohocken, USA, ASTM Intl Publisher Yokotsuka, T. (1985) Fermented Protein Foods in the Orient, with Emphasis on Shoyu and Miso in Japan, in "Microbiology of Fermented Foods", Ed. by Wood, B.J.B., London, Elsevier Applied Science Publishers Yoon, K. Y., Woodams, E. E. and Hang, Y. D. (2005) Production of beet juice by beneficial lactic acid bacteria, Lebensmittel-Wissenschaft und-Technologie, 38, 73–75 Yoon, K. Y., Woodams, E. E. and Hang, Y. D. (2006) Production of probiotic cabbage juice by lactic acid bacteria, Bioresource Technology 97, 1427–1430 Yuki, N., Watanebe, K., Mike, A., Tagami, Y., Tanaka, R., Ohwaki, M. and Morotomi, M. (1999) Survival of a probiotic, Lactobacillus casei strain Shirota, in the gastrointestinal tract: Selective isolation from faeces and identification using monoclonal antibodies. International Journal of Food Microbiology. 48, 51-57. Zagory, D. (1999) Effects of post-processing handling and packaging on microbial populations, Posthaverst Biology and Technology and Technology, 5, 313-321. Zagory, D. and Kader, A.A. (1988) Modified atmosphere packaging of fresh produce. Food-Technology, 42, 70-77 Zhou J.S., Shu Q., Rutherfurd K.J., Prasad J. Gopal P.K. and Gill H.S.(2000) Acute oral toxicity and bacterial translocation studies on potentially probiotic strains of lactic acid bacteria, Food and Chemical Toxicology 38, 153-161, Ziemer, C.J. and Gibson G.R. (1998) An overview of probiotics, prebiotics and synbiotics in the functional food concept: perspectives and future strategies. International Dairy Journal, 8, 473-479. Zottola, E.A., Yezzi, T.L., Ajao, D.B. and Roberts, R.F. (1994) Utilization of cheddar cheese containing nisin as an antimicrobial agent in other foods. International Journal
of Food Microbiology, 24, 227- 238.

- 112 -
APPENDIX A
- 113 -
Microbiological Analysis
1. Counting of colonies
The colonies were counted and recorded on each plate containing between 30 and 300
colonies.
Number of micro-organisms = d)n1.0n(
c
21 ×+
∑
c = The sum of colonies counted
n1 = The number of dishes retained in the 1st dilution
n2 = The number of dishes retained in the 2nd dilution
d = The dilution factor corresponding to the first dilution
2. Confirmation for Enterobacteriaceae
Enterobacteriaceae are defined as microorganisms that ferment glucose and show a
negative oxidase reaction when the test is carried out. For confirmation, at least five
suspects Enterobacteriaceae colonies were selected (or all colonies if less than 5) from
the highest dilution showing from 30 to 300 colonies and subcultured onto a segment
of a nutrient agar plate (Difco, Oxford, United Kingdom). Petri dishes were placed
inverted in an incubator at 37ºC for 24±2 hours. The growth level obtained was used
for confirmation.
2.1. Gram Stain
Gram-staining is a four part procedure which uses certain dyes to make a colony stand
out against its background, determining if it is gram positive (blue-violet) or gram
negative (pink). The suspect was picked from the nutrient agar plate fixed on the slide.
The slide was placed on a rack. It was flooded with crystal violet about 60 seconds and
then the slide was washed for 5 seconds with water. The slide was flooded with the
iodine solution for about 60 seconds. When the time expired, it was rinsed with water
for 5 seconds and ethanol was added dropwise until the blue-violet colour was no
- 114 -
longer emitted. It was rinsed with the water for 5 seconds. The slide was flooded with
saffranin for 60 seconds and finally, the slide was rinsed for 5 seconds to remove any
dye excess. The slide was placed on the microscope for examination. The majority of
Enterobacteriaceae are gram negative
2.2. Oxidase test (BS OP TP 26)
The oxidase test is a test used in microbiology to determine if a colony produces
certain cytochrome C oxidases. Cytochrome oxidase is an enzyme found in some
bacteria that transfers electrons to oxygen, the final electron acceptor in some electron
transport chains. Thus, the enzyme oxidizes reduced cytochrome c to make this
transfer of energy. Presence of cytochrome oxidase can be detected through the use of
an oxidase strip reagent which acts as an electron donator to cytochrome oxidase. If the
bacteria oxidize the strip (remove electrons) the disk will turn blue, indicating a
positive test. No colour change indicates a negative test. The surface of the suspect
colonies were touched with a loop in order to transfer the colonies into the oxidase
strip reagent (Oxoid, Hampshire, United Kingdom). The immediate appearance of a
blue-purple colour at the point of contact denoted a positive reaction while no colour
change or a bluish colour which developed later are both negative reactions.
Enterobacteriaceae are oxidase negative.
2.3 Glucose Fermentation Test
Suspect colonies were stabbed into tubes of glucose fermentation agar (Difco, Oxford,
United Kingdom) using a small loop. Then, the tubes were incubated at 37° ± 1º C for
24 ± 2 hours. If yellow colour was developed throughout the contents of the tube, the
reaction was positive (fermentation of glucose took place). Enterobacteriaceae are
glucose fermentation positive.

- 115 -
3. Confirmation of Lactobacillus sp.
Lactic acid bacteria are gram-positive and catalase-negative. These two tests were
carried out in order to enumerate the lactic acid bacteria counts. Also, API 50 CH
identification system (Biomerieux, Marcy l'Etoile, France) was carried out.
3.1. Gram stain
Described as in section section 2.2 (appendix A)
3.2. Catalase test
A drop of hydrogen peroxide was placed on a slide. An applicator stick was used to touch the colony and then smear into the hydrogen peroxide (Riedel-de Haën, Seelze, Germany). Bubble formations indicates that the organism is catalase positive

- 116 -
a. API 50 CHL

- 117 -

- 118 -
APPENDIX B

- 119 -
QUESTIONNAIRE
COLOUR
Scale: 1 t 5 (Dull to Bright)
Scale: 1 to 5 (Orange colour – noticeable pale colour to red orange)
APPEARANCE / VISUAL QUALITY
Scale: 1 to 5 (Not appealing to Appealing)
Orange Colour. Brightness
1 2 3 4 5 Dull Bright Very bright
Colour. Orange
1 2 3 4 5 Pale orange Orange Red orange
Visual quality
1 2 3 4 5 Not appealing Appealing Very appealing

- 120 -
AROMA
Scale: 1 to 5 (off-odour to very fresh)
Scale: 1 to 5 (no pickled aroma to very strong pickled aroma)
TEXTURE
Scale: 1 to 5 (Soft to Firm)
OVERALL QUALITY / OVERALL SENSORY QUALTIY
Scale: 1 to 9 (Poor to Good)
Aroma: fresh carrot aroma
1 2 3 4 5 Off Fresh Very fresh
Aroma: pickled aroma
1 2 3 4 5 No pickled Little Medium Strong Very strong
Texture
1 2 3 4 5 Very soft Soft Medium Firm Very firm
Overall quality
1 2 3 4 5 Very poor Poor Medium High Very high

- 121 -
APPENDIX C

- 129 -
Appendix C. Statistical Analysis
1. Microbiological analysis of carrots
Appendix C Table 1. Guidelines for the microbiological quality of ready-to-eat foods (category E)
Microbiological quality (cfu/g)
Parameters Satisfactory Acceptable Unsatisfactory
Aerobic colony counts
(30ºC/48h) <106 106 to <107 >107
Indicator organisms
Enterobacteriaceae <102 102 to <104 >104
(Source: FSAI, 2001)
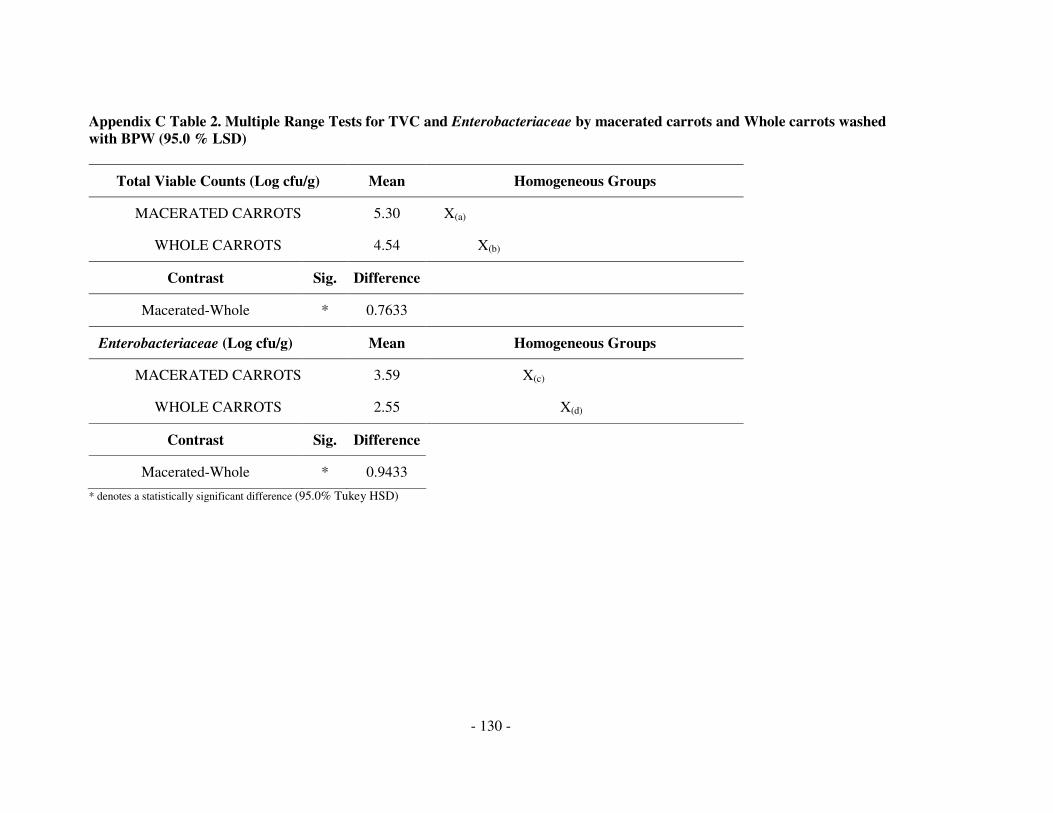
- 130 -
Appendix C Table 2. Multiple Range Tests for TVC and Enterobacteriaceae by macerated carrots and Whole carrots washed
with BPW (95.0 % LSD)
Total Viable Counts (Log cfu/g) Mean Homogeneous Groups
MACERATED CARROTS 5.30 X(a)
WHOLE CARROTS 4.54 X(b)
Contrast Sig. Difference
Macerated-Whole * 0.7633
Enterobacteriaceae (Log cfu/g) Mean Homogeneous Groups
MACERATED CARROTS 3.59 X(c)
WHOLE CARROTS 2.55 X(d)
Contrast Sig. Difference
Macerated-Whole * 0.9433
* denotes a statistically significant difference (95.0% Tukey HSD)

- 131 -
1.1. Enumeration for halotolerant bacteria on carrots
Appendix C Table 3. ANOVA table for Log TVC (Log cfu/g) by salt content (%NaCl) (95.0 % confidence level)
Source Sum of Squares Mean Square F-Ratio p-value
Between groups 11.8 3.934 381.12 0.0000
Within groups 0.04129 0.01032
Total (Corr.) 11.84
Appendix C Table 4. Multiple Range Tests for TVC (Log cfu/g) by Salt content (%NaCl)
Salt content (NaCl%) Mean Homogeneous Groups
6.5 2.088 X
4 3.998 X
2 4.923 X
0 5.185 X
Contrast Sig.
0 - 2
0 - 4 *
0 - 6.5 *
2 - 4 *
2 - 6.5 *
4 - 6.5 *
* denotes a statistically significant difference (95.0% Tukey HSD)

- 132 -
2. Blanching of carrots
Appendix C Table 5. ANOVA table for Log TVC (Log cfu/g) by blanching Time (sec) (95.0 % confidence level)
Source Sum of Squares Mean Square F-Ratio p-value
Between groups 103.4 17.23 125.31 0.0000
Within groups 2.888 0.1375
Total (Corr.) 106.3
Appendix C Tables 6a & 6b. Multiple Range Tests for Log TVC (Log cfu/g) by blanching Time (sec) (95.0 % LSD)
Table 6b
Table 6a
Time Mean Homogeneous Groups
60 0.0 X
50 0.0 X
40 0.0 X
30 1.197 X
20 2.204 X
10 3.142 X
0 5.52 X
* denotes a statistically significant difference (95.0% Tukey HSD)
Contrast Sig. Contrast Sig.
0 - 10 * 20 - 30 *
0 - 20 * 20 - 40 *
0 - 30 * 20 - 50 *
0 - 40 * 20 - 60 *
0 - 50 * 30 - 40 *
0 - 60 * 30 - 50 *
10 - 20 * 30 - 60 *
10 - 30 * 40 - 50
10 - 40 * 40 - 60
10 - 50 * 50 - 60
10 - 60 *
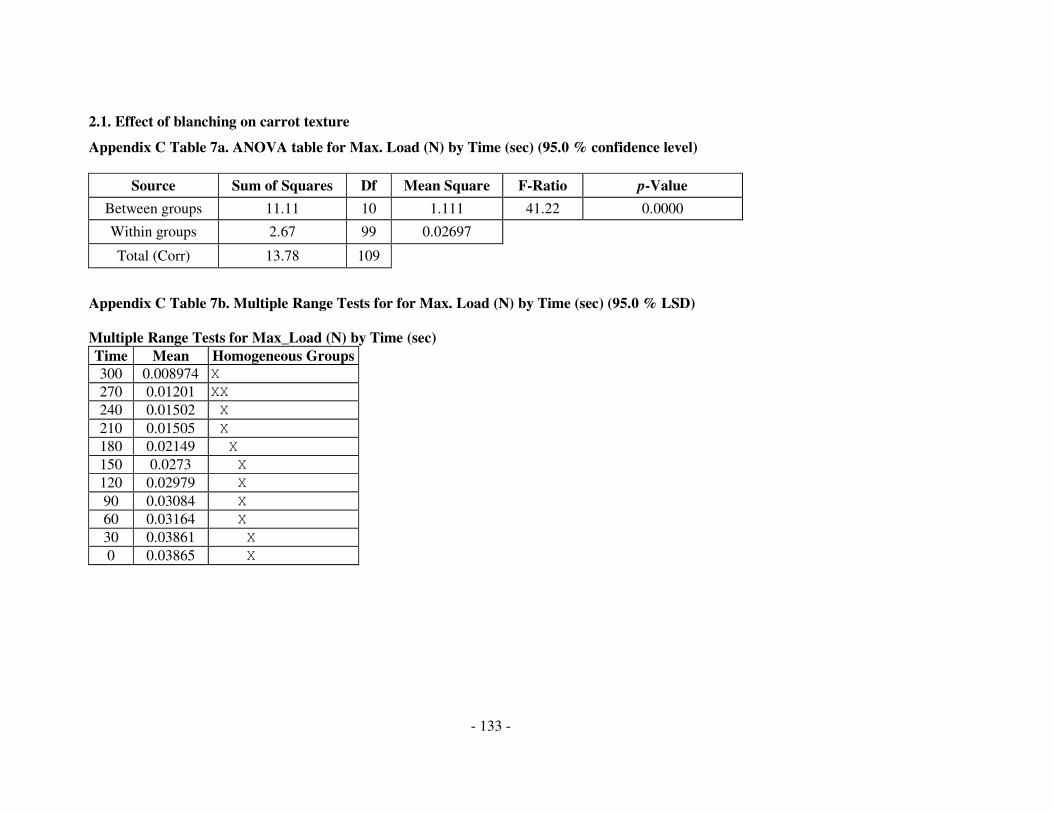
- 133 -
2.1. Effect of blanching on carrot texture
Appendix C Table 7a. ANOVA table for Max. Load (N) by Time (sec) (95.0 % confidence level)
Source Sum of Squares Df Mean Square F-Ratio p-Value
Between groups 11.11 10 1.111 41.22 0.0000
Within groups 2.67 99 0.02697
Total (Corr) 13.78 109
Appendix C Table 7b. Multiple Range Tests for for Max. Load (N) by Time (sec) (95.0 % LSD)
Multiple Range Tests for Max_Load (N) by Time (sec)
Time Mean Homogeneous Groups
300 0.008974 X
270 0.01201 XX
240 0.01502 X
210 0.01505 X
180 0.02149 X
150 0.0273 X
120 0.02979 X
90 0.03084 X
60 0.03164 X
30 0.03861 X
0 0.03865 X

- 134 -
Appendix C Table 8.Relationship between carrot diameter and textural degradation after a period of blanching times
Blanching time
(sec)
Texture (N)
Carrot diameter <10 mm Deviation
Texture (N)
Carrot diameter >40 mm Deviation
0 30.79 2.75 48.17 5.56
30 26.26 5.16 46.48 2.9
60 20.12 4.4 43.99 5.42
90 19.3 3.08 43.31 5.5
120 18.65 4.43 42.16 2.66
150 18.02 5.65 41.87 5.36
180 13.37 2.5 35.65 4.41
210 7.49 2.86 25.19 0.62
240 5.68 1.28 20.86 5.28
270 4.01 0.6 11.69 4.21

- 135 -
Appendix C Tables 9a & 9b. Multiple Range Tests for Max. Load (N) (carrots diameter <10mm) by blanching time (sec)
(95.0 % LSD)
Table 9a
Time Mean Homogeneous Groups
270 4.01 X
240 5.68 XX
210 7.49 XX
180 13.37 XX
150 18.02 X
120 18.65 XX
90 19.3 XX
60 20.12 XX
30 26.26 XX
0 30.79 X
Table 9b
Contrast Sig. Contrast Sig. Contrast Sig. Contrast Sig. Contrast Sig. Contrast Sig.
0 - 30 30 - 60 60 - 90 90 - 120 120 - 150 180 - 210
0 - 60 * 30 - 90 60 - 120 90 - 150 120 - 180 180 - 240
0 - 90 * 30 - 120 60 - 150 90 - 180 120 - 210 * 180 - 270 *
0 - 120 * 30 - 150 * 60 - 180 90 - 210 * 120 - 240 * 210 - 240
0 - 150 * 30 - 180 * 60 - 210 * 90 - 240 * 120 - 270 * 210 - 270
0 - 180 * 30 - 210 * 60 - 240 * 90 - 270 * 150 - 180 240 - 270
0 - 210 * 30 - 240 * 60 - 270 * 150 - 210 *
0 - 240 * 30 - 270 * 150 - 240 *
0 - 270 * 150 - 270 * * denotes a statistically significant difference (95.0% Tukey HSD)

- 136 -
Appendix C Tables 10a & 10b Multiple Range Tests for Max. Load (N) (carrots diameter >40mm) by Time(sec) (95.0 %
LSD) Table 10a
Time Mean Homogeneous Groups
270 11.69 X
240 20.86 XX
210 25.19 X
180 35.65 X
150 41.87 XX
120 42.16 XX
90 43.31 XX
60 43.99 X
30 46.48 X
0 48.17 X
Table 10b
Contrast Sig. Contrast Sig Contrast Sig Contrast Sig Contrast Sig. Contrast Sig.
0 - 30 30 - 60 60 - 90 90 - 120 120 - 150 180 - 210 *
0 - 60 30 - 90 60 - 120 90 - 150 120 - 180 180 - 240 *
0 - 90 30 - 120 * 60 - 150 * 90 - 180 120 - 210 * 180 - 270 *
0 - 120 * 30 - 150 * 60 - 180 * 90 - 210 * 120 - 240 * 210 - 240
0 - 150 * 30 - 180 * 60 - 210 * 90 - 240 * 120 - 270 * 210 - 270 *
0 - 180 * 30 - 210 * 60 - 240 90 - 270 * 150 - 180 240 - 270
0 - 210 * 30 - 240 60 - 270 150 - 210 *
0 - 240 30 - 270 150 - 240 *
0 - 270 150 - 270 * * denotes a statistically significant difference (95.0% Tukey HSD)
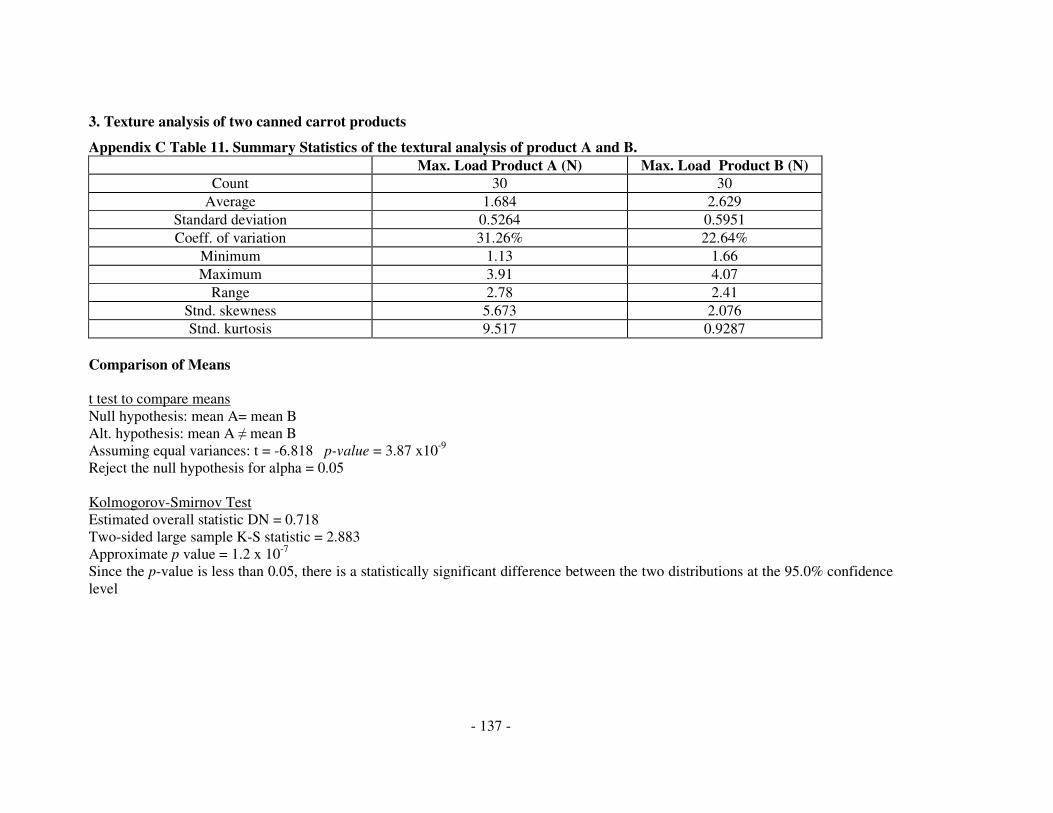
- 137 -
3. Texture analysis of two canned carrot products
Appendix C Table 11. Summary Statistics of the textural analysis of product A and B.
Max. Load Product A (N) Max. Load Product B (N)
Count 30 30
Average 1.684 2.629
Standard deviation 0.5264 0.5951
Coeff. of variation 31.26% 22.64%
Minimum 1.13 1.66
Maximum 3.91 4.07
Range 2.78 2.41
Stnd. skewness 5.673 2.076
Stnd. kurtosis 9.517 0.9287
Comparison of Means t test to compare means Null hypothesis: mean A= mean B Alt. hypothesis: mean A ≠ mean B Assuming equal variances: t = -6.818 p-value = 3.87 x10⁻⁹ Reject the null hypothesis for alpha = 0.05 Kolmogorov-Smirnov Test Estimated overall statistic DN = 0.718 Two-sided large sample K-S statistic = 2.883 Approximate p value = 1.2 x 10⁻⁷ Since the p-value is less than 0.05, there is a statistically significant difference between the two distributions at the 95.0% confidence level

- 138 -
3. Comparison of LAB growth (Log cfu/ml) in carrot juice broth (CJB) and MRS broth
Appendix C Table 12. Mean and deviation of the LAB load (log cfu/ml) of CJB and MRS monitored over 48 hours.
Mean (Log cfu/ml) Deviation Mean (Log cfu/ml) Deviation Time
5.51 0.143 5.67 0.171 0
8.97 0.142 8.81 0.345 24
MR
S
9.43 0.213
CJB
9.35 0.352 48
Hypothesis Tests for CJB-MRS (Log cfu/ml) t-test Null hypothesis: mean = 0.0 Alternative: mean MRS ≠ mean CJB Computed t statistic = -1.562 p-value = 0.2162 Do not reject the null hypothesis for alpha = 0.05

- 139 -
Appendix C Table 13. ANOVA table for MRS and CJB lactic acid bacteria (Log cfu/ml) by Incubation time (hours)
Source Sum of Squares Mean Square F-Ratio p-value
Between groups 34.03 17.02 369.52 0.0000
Within groups 0.4144 0.04605
Total (Corr.) 34.44
Appendix C Table 14. Multiple Range Tests for LAB load (Log cfu/ml) by Time (hours)
Time Mean Homogeneous Groups
0 5.598 X
24 8.896 X
48 9.392 X
Contrast Sig. Difference
0 - 24 * -3.299
0 - 48 * -3.794
24 - 48 * -0.4954 * denotes a statistically significant difference (95.0% Tukey HSD)

- 139 -
4. Changes in pH over the fermentation of carrot sticks
Appendix C Table 15. pH values over the fermentation of carrot sticks
Dipping time
(hour)
Storage
temperature
(ºC) Day 0 Day 1 Day 7 Day 14
LAB
(cfu/ml)
4 5.46 ±0.23 4.07 ±0.21 3.64 ±0.11
10 5.28 ±0.26 4.15 ±0.15 3.61 ±0.08 1
25
6.18 ±0.19
5.55 ±0.28 4.38 ±0.20 3.72 ±0.20
4 5.61 ±0.30 4.00 ±0.17 3.48 ±0.15
10 5.53 ±0.25 4.41 ±0.22 3.61 ±0.21 2
25
6.22 ±0.12
5.27 ±0.28 4.18 ±0.12 3.53 ±0.23
4 5.62 ±0.21 3.97 ±0.19 3.36 ±0.16
10 5.30 ±0.25 4.16 ±0.15 3.55 ±0.12 4
25
6.25 ±0.15
5.39 ±0.23 4.34 ±0.18 3.49 ±0.19
106 c
fu/m
l
4 5.67 ±0.32 4.24 ±0.20 3.78 ±0.25
10 5.37 ±0.28 3.59 ±0.39 3.36 ±0.12 1
25
6.16 ±0.20
5.12 ±0.24 4.05 ±0.15 3.37 ±0.09
4 5.38 ±0.29 3.95 ±0.10 3.36 ±0.11
10 5.44 ±0.18 3.94 ±0.21 3.46 ±0.06 2
25
6.18 ±0.15
5.23 ±0.25 3.90 ±0.25 3.31 ±0.12
4 5.31 ±0.11 3.85 ±0.14 3.40 ±0.15
10 5.52 ±0.32 3.93 ±0.18 3.49 ±0.17 4
25
6.20 ±0.12
5.48 ±0.28 3.79 ±0.13 3.32 ±0.10 107
cfu
/ml
4 5.45 ±0.30 4.68 ±0.10 3.62 ±0.21
10 4.76 ±0.15 3.34 ±0.20 3.38 ±0.15 1
25
6.06 ±0.12
5.48 ±0.11 3.91 ±0.14 3.59 ±0.18
4 5.27 ±0.21 4.08 ±0.18 3.55 ±0.12
10 4.52 ±0.22 3.37 ±0.13 3.34 ±0.10 2
25
6.10 ±0.08
5.26 ±0.18 3.31 ±0.10 3.27 ±0.17
4 5.39 ±0.15 4.38 ±0.23 3.49 ±0.19
10 4.55 ±0.18 3.39 ±0.15 3.29 ±0.10 4
25
6.08 ±0.10
5.48 ±0.11 3.92 ±0.15 3.26 ±0.09
10
8 c
fu/m
l

- 140 -
Appendix C Table 16. Table of Least Squares Means (LSD) for pH with 95.0 % Confidence Intervals Level Mean Lower
Limit
Upper
Limit
Mean Lower
Limit
Upper
Limit
Grand Mean 4.73
Initial LAB load Initial LAB load by Storage Temperature
6 4.85 4.807 4.893 6 & 4 4.822 4.747 4.896
7 4.729 4.686 4.772 6 & 10 4.854 4.78 4.929
8 4.612 4.57 4.655 6 & 25 4.875 4.801 4.949
Dipping Time 7 & 4 4.79 4.716 4.864
1 4.773 4.73 4.816 7 & 10 4.72 4.646 4.794
2 4.696 4.653 4.739 7 & 25 4.676 4.601 4.75
4 4.723 4.68 4.765 8 & 4 4.846 4.771 4.92
Storage Time 8 & 10 4.348 4.274 4.423
0 6.159 6.109 6.209 8 & 25 4.643 4.569 4.718
1 5.322 5.272 5.371 Dipping Time by Storage Temperature
7 3.973 3.924 4.023 1 & 4 4.918 4.843 4.992
14 3.468 3.418 3.517 1 & 10 4.603 4.529 4.678
Storage Temperature 1 & 25 4.797 4.723 4.872
4 4.819 4.776 4.862 2 & 4 4.765 4.691 4.839
10 4.641 4.598 4.684 2 & 10 4.677 4.602 4.751
25 4.731 4.688 4.774 2 & 25 4.647 4.572 4.721
Initial LAB load by Storage Time 4 & 4 4.775 4.701 4.849
6 & 0 6.217 6.131 6.303 4 & 10 4.643 4.568 4.717
6 & 1 5.446 5.36 5.532 4 & 25 4.75 4.676 4.824
6 & 7 4.184 4.098 4.27 Storage Time by Storage Temperature
6 & 14 3.554 3.468 3.64 0 & 4 6.159 6.073 6.245
7 & 0 6.18 6.094 6.266 0 & 10 6.159 6.073 6.245
7 & 1 5.391 5.305 5.477 0 & 25 6.159 6.073 6.245
7 & 7 3.916 3.83 4.002 1 & 4 5.462 5.376 5.548
7 & 14 3.428 3.342 3.514 1 & 10 5.141 5.055 5.227
8 & 0 6.08 5.994 6.166 1 & 25 5.362 5.276 5.448
8 & 1 5.129 5.043 5.215 7 & 4 4.136 4.05 4.222
8 & 7 3.82 3.734 3.906 7 & 10 3.809 3.723 3.895
8 & 14 3.421 3.335 3.507 7 & 25 3.976 3.89 4.062
14 & 4 3.52 3.434 3.606
14 & 10 3.454 3.368 3.54
14 & 25 3.429 3.343 3.515

- 141 -
5. Changes in LAB load (Log cfu/g) over the fermentation of carrot sticks
Appendix C Table 17. LAB load (log cfu/g) over the fermentation of carrot sticks
Dipping time
(hour)
Storage
temperature
(ºC) Day 0 Day 1 Day 7 Day 14
LAB
(cfu/ml)
4 6.85 ±0.21 8.61 ±0.34 8.97 ±0.31
10 6.75 ±0.18 8.54 ±0.41 8.78 ±0.22 1
25
6.30 ±0.25
6.88 ±0.28 8.85 ±0.37 8.37 ±0.42
4 6.75 ±0.32 8.54 ±0.39 8.78 ±0.29
10 6.81 ±0.15 8.53 ±0.24 8.42 ±0.37 2
25
6.32 ±0.19
6.90 ±0.30 8.76 ±0.35 9.44 ±0.30
4 6.74 ±0.25 8.76 ±0.24 9.55 ±0.34
10 6.89 ±0.21 8.45 ±0.38 8.78 ±0.26 4
25
6.42 ±0.16
6.96 ±0.22 8.34 ±0.41 8.74 ±0.32
10
6 c
fu/m
l
4 8.57 ±0.35 9.22 ±0.21 9.44 ±0.34
10 8.68 ±0.28 9.14 ±0.42 9.64 f±0.21 1
25
7.60 ±0.32
8.90 ±0.25 8.79 ±0.30 9.16 ±0.32
4 8.58 ±0.32 9.05 ±0.39 9.40 ±0.30
10 8.91 ±0.34 9.53 ±0.35 9.72f±0.41 2
25
7.72 ±0.41
8.84 ±0.25 9.80 ±0.42 9.65f ±0.25
4 8.48 ±0.23 8.90 ±0.21 9.62f ±0.18
10 8.52 ±0.31 8.83 ±0.35 9.60f ±0.35 4
25
7.65 ±0.38
8.68 ±0.28 9.78f±0.31 9.10 ±0.23 10
7 c
u/m
l
4 8.71 ±0.34 8.92 ±0.14 9.54 ±0.10
10 8.95 ±0.21 9.64 ±0.10 9.41 ±0.12 1
25
8.72 ±0.20
8.91 ±0.22 9.44 ±0.12 9.11 ±0.15
4 8.77 ±0.35 9.82 ±0.15 8.95 ±0.19
10 8.93 ±0.24 9.68 ±0.11 9.07 ±0.21 2
25
8.80 ±0.15
8.93 ±0.30 9.45 ±0.18 9.37 ±0.15
4 8.82 ±0.12 9.86 ±0.19 8.86 ±0.50
10 8.93 ±0.29 9.42 ±0.10 9.52 ±0.25 4
25
8.85 ±0.21
8.83 ±0.23 8.89 ±0.15 9.58 ±0.15
10
8 c
u/m
l

- 142 -
Appendix C Table 18. Table of Least Squares Means (LSD) for LAB loads (Log
cfu/g) with 95.0 Percent Confidence Intervals
Level Mean Lower Limit Upper Limit
Grand Mean 8.507
Initial LAB load
6 7.663 7.597 7.728
7 8.762 8.697 8.828
8 9.095 9.03 9.16
Dipping Time
1 8.462 8.397 8.527
2 8.553 8.487 8.618
4 8.505 8.44 8.571
Storage Time
0 7.598 7.522 7.673
1 8.129 8.053 8.204
7 9.094 9.019 9.17
14 9.206 9.131 9.282
Storage Temperature
4 8.484 8.419 8.55
10 8.512 8.447 8.578
25 8.523 8.458 8.588
Initial LAB load by Storage Time
6 & 0 6.347 6.216 6.477
6 & 1 6.837 6.706 6.967
6 & 7 8.598 8.467 8.729
6 & 14 8.87 8.739 9.001
7 & 0 7.657 7.526 7.787
7 & 1 8.684 8.554 8.815
7 & 7 9.227 9.096 9.357
7 & 14 9.481 9.35 9.612
8 & 0 8.79 8.659 8.921
8 & 1 8.864 8.734 8.995
8 & 7 9.458 9.327 9.589
8 & 14 9.268 9.137 9.399

- 142 -
14D 1D B R
Means and 95.0 Percent LSD Intervals
Carrot type
2.4
2.8
3.2
3.6
4
4.4
4.8
Brightn
ess c
olo
ur
14D 1D B R
Means and 95.0 Percent LSD Intervals
Carrot type
3.3
3.6
3.9
4.2
4.5
4.8
Ora
nge c
olo
ur
6. Sensory analysis of the carrot sticks
Appendix C Table 19. Sensory analysis scores summary
Sample Colour brightness Orange colour Fresh carrot aroma Pickled aroma Texture
Overall
quality
(OVQ)
Raw carrot sticks 4.25±0.1 3.9±0.2 3.32±0.1 1.51±0.3 4.01±0.3 3.87±0.3
Blanched carrot sticks 4.13±0.2 4.32±0.3 2.97±0.2 1.42±0.2 2.71±0.3 4.17±0.2
1 day fermented carrot sticks 3.89±0.2 4.41±0.3 2.45±0.2 2.44±0.2 2.3±0.1 3.22±0.2
14 days fermented carrot sticks 2.76±0.3 3.73±0.2 2.39±0.3 2.79±0.3 1.73±0.3 2.43±0.3
Appendix C Table 20. ANOVA table for Brightness colour by Carrot type
Source Sum of Squares Mean Square F-Ratio p-value
Between groups 2.788 0.9292 21.07 0.0065
Within groups 0.1764 0.0441
Total (Corr.) 2.964
Appendix C Table 21. ANOVA table for Orange colour by Carrot type
Source Sum of Squares Mean Square F-Ratio p-value
Between groups 0.642 0.214 3.36 0.1362
Within groups 0.2548 0.0637
Total (Corr.) 0.8968
Appendix C Figure 1.Means and 95% LSD intervals plots for the attribute brightness
Appendix C Figure 2.Means and 95% LSD intervals plots for the attribute orange colour

- 143 -
14D 1D B R
Means and 95.0 Percent LSD Intervals
Carrot type
2
2.3
2.6
2.9
3.2
3.5
3.8
Fre
sh c
arr
ot aro
ma
14D 1D B R
Means and 95.0 Percent LSD Intervals
Carrot type
1
1.4
1.8
2.2
2.6
3
3.4
Pic
kle
d a
rom
a
Appendix C Table 22. ANOVA table for Fresh carrot aroma by Carrot type
Source Sum of Squares Mean Square F-Ratio p-value
Between groups 1.177 0.3925 8.90 0.0304
Within groups 0.1764 0.0441
Total (Corr.) 1.354
Appendix C Table 23. ANOVA table for Pickled aroma by Carrot type
Source Sum of Squares Mean Square F-Ratio p-value
Between groups 2.776 0.9252 14.52 0.0129
Within groups 0.2548 0.0637
Total (Corr.) 3.03
Appendix C Figure 3.Means and 95% LSD intervals plots for the attribute fresh carrot aroma
Appendix C Figure 4.Means and 95% LSD intervals plots for the attribute pickled aroma

- 144 -
14D 1D B R
Means and 95.0 Percent LSD Intervals
Carrot type
1.3
2.3
3.3
4.3
5.3
Textu
re
14D 1D B R
Means and 95.0 Percent LSD Intervals
Carrot type
2
2.5
3
3.5
4
4.5
5
OV
Q
Appendix C Table 24. ANOVA table for Texture by Carrot type
Source Sum of Squares Mean Square F-Ratio p-value
Between groups 5.633 1.878 27.37 0.0040
Within groups 0.2744 0.0686
Total (Corr.) 5.907
Appendix C Table 25. ANOVA table for OVQ by Carrot type
Source Sum of Squares Mean Square F-Ratio p-value
Between groups 3.57 1.19 18.68 0.0081
Within groups 0.2548 0.0637
Total (Corr.) 3.825
Appendix C Figure 5.Means and 95% LSD intervals plots for the attribute texture
Appendix C Figure 6.Means and 95% LSD intervals plots for the attribute overall visual quality

145