Embed Size (px)
Citation preview

NASA Contractor Report 191527
74P
The Feasibility of ProducingAluminum-Lithium Structures for
Cryogenic Tankage Applications
by Laser Beam Welding
R. P. Martukanitz
K. G. Lysher
\
Pennsylvania State University
Applied Research Laboratory
State College, Pennsylvania
Purchase Order L-4409D
April 1993
National Aeronautics andSpace Administration
Langley Research CenterHampton, Virginia 23681-0001
_DNO,4"
I,4"O_Z
I/1t_
U¢
Oo_,#,.o0o
o
o,f_j
c_
https://ntrs.nasa.gov/search.jsp?R=19940009553 2018-08-18T15:41:39+00:00Z
i
i
Z
i
F
=
i
|
ABSTRACT
Laser beam welding offersseveralpotentialadvantages for producing "built-up"structuresfrom
aluminum-lithiumalloysfor cryogenictankageapplications.These include: improved loadtransfer
between stiffenersand theskin,enhanced structuralintegrityof welds,higherproductivity,lower cost,
and processingin a fullyautomated environment. Based on thesepotentialbenefitsa program was
initiatedbetween NASA Langley Research Center and the Applied Research Laboratory,The"
PennsylvaniaStateUniversity(ARL Penn State)to determinethe feasibilityof laserbeam welding
aluminum-lithiumalloysfor cryogenictankage. Four primary taskswere proposed to determinethe
viabilityof laserbeam weldingforthisapplication.These includedestablishmentof processparameters
fortwo thicknessand alloycombinations,productionof testspecimens,determinationof criticalweld
properties,and fabricationof prototypepanelsfor evaluation.Laser beam welding evaluationswere
conductedon aluminum-lithiumalloycombinations8090-T6 welded to 2090-T83 and 2095-T6 welded
to 2095-T8 tosimulatestiffenertoskinconditions.Processdevelopment,productionoftestspecimens,
and fabricationofprototypepanelswere performedusingtheLaserArticulatingRoboticSystem servicedby a 14 kW carbon-dioxidelaser.
Results of the evaluation indicate that laser beam welding may provide improved productivity and lower
costs over resistance welding for fabrication of stiffened panels. Lap-welds having good penetration and
positive weld bead reinforcement were produced by autogenously laser beam welding at power levels of
5 to 7 kW and travel speeds of 150 to 160 IPM (6.4 to 6.8 cm/s). Aggressive pretreatment in the form
of chemical milling in a 32 percent NaOH aqueous solution at 210"F (99"C) was found to be necessary
to reduce porosity at the interface. This required-removal of 0.010 in. (0.25 mm) per side by chemical
milling prior to welding and is believed due to the presence of a hydrogen-enriched layer near thesurface. Although chemical milling was able to reduce porosity at the interface between the stiffeners
and skin, radiography indicated that weld porosity was consistently observed at the root of the welds.
Adequate clamping force between the stiffeners and face-sheet was also found to be critical in achievingconsistent weld quality along the length of the stiffeners.
Conditions amicable to improved load transfer and enhanced structural integrity were also demonstrated
by the laser beam welding process. Laser beam welding provided accessibility such that lap-welds could
be produced very near the edge of the vertical member on stepped-hat stiffeners of prototype panels.
Tensile tests of laser beam welds representing partial penetration of the face-sheet provided a joint
efficiency of 77 percent (at 40 percent through-thickness penetration) for 2090-T83 and 65 percent joint
efficiency (at 60 percent through-thickness penetration) for 2095-T8. However, it is anticipated that the
joint efficiency of the partial penetration welds of the skin would be greater for 2095-T83, based on equal
penetration. Results of tension shear tests of lap-welds that were produced by laser beam welding
indicated that the alloy combination of 2095-T6 to 2095-I"8 exhibited significantly higher weld shearstrength at the interface in comparison to welds of 8090-T6 to 2090-T83. This is believed due to the
ability of alloy 2095 to precipitation strengthen (naturally age) after welding. The average shear strengthof welds between 2095-T6 to 2095-T8 was 18.8 KSI (130 MPa) as compared to an average shear strength
of 11.7 KSI (81 MPa) for 8090-T6 welded to 2090-T83. The results of mechanical property
characterization indicated that minimal degradation to the base metal may be achieved by laser beamwelding.

Basedon the results of this initial investigation, it is recommended that further laser beam weldingevaluations be conducted. Laser beam welding has demonstrated the ability to offer high production
rates, and possibly lower cost, for joining of stiffeners to skin. Extrinsic process development, such as
fixture and joint design, should be optimized for laser beam welding of larger prototype panels. Directcomparison of laser beam welded and resistance welded structures should then be performed to ascertain
structural integrity, quality, and costs associated with these processes.
ii

TABLE OF CONTENTS
ABSTRACT i,.o.°°.,o..°..°...°..,,..,,.,,o .... ..°o°°o
°°.
TABLE OF CONTENTS ......................................... m
LIST OF FIGURES °w..oo..o.o....i,°..,..v..,J-.°,,.°°..°°°iv
LIST OF TABLES vii, , , • • • • • • • • • • • • • • • • • • • • • • • • • • • • • • • • ° • • • • •
i .O INTRODUCTION ....................................... l
2.0 EVALUATIONS ........................................ 3
2.1 Process Parameters Development .......................... 3
2.1.1 Initial Process Development ......................... 4
2.1.2 Factorial Experiment ............................. 42.1.3 Second Process Parameters Evaluation .................. 5
2.1.4 Chemical Cleaning Evaluations ....................... 5
2.2 Production of Test Specimens ......................... • .... 7
2.2.1 Specimens for Determining Strength AcrossPartial Penetration ............................... 8
2.2.2 Weld Shear Strength Specimens ...................... 82.3 Characterization ....................................... 9
2.3.1 Mechanical Property Characterization .................. 9
2.3.2 Metallurgical Characterization ............ .......... 11
2.4 Fabrication of Prototype Panels ............................ l 1
3.0 DISCUSSION OF RESULTS .................................. 12
3.1 ProcessParameters .................................... 12
3.2 Chemical Cleaning .................................... 13
3.3 MechanicalProperties.................................. 16
3.4 Weld Characterization.................................. 17
184.0 CONCLUSIONS .........................................4.1 Laser Beam Welding Process Evaluation ....................... 18
4.2 Pretreatment and Porosity Evaluation ......................... 19
4.3 Mechanical Property Characterization ........................ 19
5.0 RECOMENDATIONS ....................................... 19
6.0 REFERENCES 20• ° ° • • • • • • • ..... • • • ° • ° • • • • ° ° • • . • • • ° • • • • • • •
7°0 FIGURES AND TABLES ................ ..................... 23
..°
ill

LIST OF FIGURES
1
2
3
4
5
7
8
9
10
11
12
Title
Artist's Rendition of an Advanced Launch Vehicle Showing
Liquid Oxygen and Liquid Hydrogen Tanks ...................
Depiction of Stiffened Panel Proposed for Built-Up Structure ........
A Comparison of Ultimate Tensile Strength of Butt-Welds in
Alloy 2090-T83 Produced Using Various Welding Processes ........
Diagram Showing Task Sequences for Program to Determine
Feasibility of Laser Beam Welding Aluminum-Lithium Alloys
for Cryogenic Tank Applications .........................
Schematic of Laser Articulating Robotic System CLARS) Usedfor Laser Beam Welding Program .........................
Optical Arrangement Used for the Laser Articulating RoboticSystem (LARS) ....................................
Clamping Arrangement Utilized for Initial Process Parameter
Development for Lap-Welds ............................
Amount of Porosity Associated With the Interface of Laser
Beam Welded Samples that had been Chemically Milled VariousAmounts Prior to Welding .............................
Photographs of 2095-'1"6 to 2095-'1"8 Laser Beam Weld Specimens
After Dye Penetrant Testing Showing Degree of Porosity at
the Interface Associated with Chemical Milling of 0.001,0.005, and 0.010 in. Per Side ...........................
Photographs of 8090-T6 to 2090-T83 Laser Beam Weld Specimens
After Dye Penetrant Testing Showing Degree of Porosity at theInterface Associated with Chemical Milling of 0.001, 0.005, and0.010 in Per Side ...................................
Configuration of a Weld Specimen Used to Obtain Weld ShearStrength Samples ...................................
Contact Prints of Radiographs Showing Porosity in 0.050 in.Thick 8090-T6 to 0.120 in. Thick 2090-T83 Weld With 0.001 in.
Removed by Chemical Milling ...........................
24
25
26
27
28
29
3O
31
32
33
34
35
iv
LIST OF FIGURES - Continued
Fibre Number Title P_CZ
13
14
15
16
17
18
19
20
21
22
23
24
Contact Prints of Radiographs Showing Porosity in 0.050 in.Thick 8090-T6 to 0.120 in. Thick 2090-T83 Weld With 0.005 in.
Removed by Chemical Milling 36
Contact Prints of Radiographs Showing Porosity in 0.050 in.Thick 8090-T6 to 0.120 in. Thick 2090-T83 Weld With 0.010 in.
Removed by Chemical Milling ........................... 37
Contact Prints of Radiographs Showing Porosity in 0.068 in.Thick 2095-T6 to 0.120 in. Thick 2095-T8 Weld With 0.001 in.
Removed by Chemical Milling ........................... 38
Contact Prints of Radiographs Showing Porosity in 0.068 in.Thick 2095-T6 to 0.120 in. Thick 2095-T8 Weld With 0.005 in.
Removed by Chemical Milling 39
Contact Prints of Radiographs Showing Porosity in 0.068 in.Thick 2095-T6 to 0.120 in. Thick 2095-T8 Weld With 0.010 in.
Removed by Chemical Milling ........................... 4O
Photomacrographs of Laser Beam Welds Used for Determination of
Strength Across Partial Penetration Welds of the Face-Sheet
8090-T6 to 2090-T83 and 2095-T6 to 2095-T8 ................. 41
Hardness Profile Across Fusion Zone and Heat Affected Zone ofthe Partial Penetration Weld in 2090-T83 at Various Times After
Welding 42
Hardness Prof'de Across Fusion Zone and Heat Affected Zone of
the Partial Penetration Weld in 2095-T8 at Various Times After
Welding_.._,,,... __;.,:_....,.....,.,,.._ ..... 43
Photographs of Clamping Arrangement used to Weld PrototypePanels ......................................... 44
Photographs of a Prototype Panel that had been Laser Beam Welded ... 45
Macrographs of Cross-Sections of Prototype Panels of 8090-T6 to2090-T83 and 2095-T6 to 2095-T8 46
Contact Print of Radiograph Showing Porosity in 8090-T6 to
2090-T83 Welds on Prototype Parts That were Chemically Milled
0.001 in. Prior to Welding ............................. 47
LIST OF FIGURES - Continued
Title P__
25
26
27
28
29
Contact Print of Radiograph Showing Porosity in 2095-T6 to
2095-T8 Welds on Prototype Parts That were Chemically Milled 0.001
in. Prior to Welding .................................
Contact Prints of Radiographs Showing Porosity in 8090-T6 to
2090-T83 Welds on Prototype Parts That were Chemically Milled
0.005 in. Prior to Welding .............................
Contact Prints of Radiographs Showing Porosity in 2095-T6 to
2095-T8 Welds on Prototype Parts That were Chemically Milled
0.005 in. Prior to Welding .............................
Scanning Electron Micrographs of Fractured Surface of Partial
Penetration Welds of 2090-T83 After Tensile Testing .............
Scanning Electron Micrographs of Fractured Surface of PartialPenetration Welds of 2095-T8 After Tensile Testing .............
48
49
5O
51
52
vi


Table Number
I
H
HI
IV
V
VI
VII
VIII
IX
X
XI
XII
XilI
LIST OF TABLES
Title
Nominal Compositions,Densities,and ElasticModuliiof Aluminum-
Lithium Alloysof InterestforProducingStiffenedPanels ..........
Alloy and Thickness Combinations for Stiffeners and Skin-Sheetthat were Initially of Interest ............................
Welding Parameters Identified During Initial Process Development ....
Results of Factorial Experiment Showing Distribution of Porosity
and Experimental Conditions ............................
Modified Welding Parameters for Each Alloy and ThicknessCombination ......................................
Laser Welding Parameters Used to Produce Lap-Welds on Material
that had been Chemically Milled by Chemtronics Corporation to Remove0.005 and 0.010 in. Per Side ............................
Laser Beam Welding Parameters for Producing Specimens Used to
Obtain Weld Shear Strength of 8090-T6 to 2090-T83 .............
Laser Beam Welding Parameters for Producing Specimens Used to ObtainWeld Shear Strength of 2095-T6 to 2095-T8 ..................
Results of Tensile Tests for Base Metal and Partial Penetration
Welds of 2090-T83 ..................................
Results of Tensile Tests for Base Metal and Partial Penetration
Welds of 2095-T8 ...................................
Results of Tension Shear Tests for 0.050 in. Thick 8090-T6 to
0.120 in. Thick 2090-T83 ..............................
Results of Tension Shear Tests for 0.068 in. Thick 2095-T6 to
0.120 in. Thick 2095-T8 ...............................
Laser Beam Welding Parameters for Producing Prototype Panels .....
53
54
55
56
57
58
59
6O
61
62
63
64
65
vii


1.0 INTRODUCTION
NASAandindustrystudieshaveshownthatlow densityaluminum-lithiumalloytechnologycanaid inimprovingperformanceandincreasepayloadsof launchvehicles(Refs.1-3).Componentsthat have beenidentified for implementation of these new alloys are the cryogenic tanks used to carry liquid oxygen and
liquid hydrogen. An artist's rendition of an advanced launch vehicle showing the liquid oxygen and
hydrogen tanks is shown in Figure 1. These tanks, as well as the intertank used to connect the hydrogen
and oxygen tanks, are assembled from integrally machined panels containing stiffeners. The tanks may
be used in pressu_'e environments ranging from zero to 80.0 psi due to internal pressure loading of theoxidant and fuel under flight dynamics. They will also be used to support the upper vehicle structure and
payload which may result in compressive loading ranging from 900 to 3,000 psi. Since the tanks will
be used to store cryogenic propellants, the panels may experience temperatures from -460"F to + 150"F
(-273" C to 66" C).
NASA and industry has proposed the use of "built-up" structures for aluminum-lithium panels whichwould be fabricated into tanks (Ref. 4). This concept is radically different from the current panel design
requiring extensive machining to produce the stiffened structure and results in accumulation of costlyaluminum-lithium scrap. Although the recently developed aluminum-lithium alloys offer between 7 to
12 percent reduced density and approximately 10 percent increase in stiffness over the current alloy,2219-1"87, used for these applications, the need for specialized processing has resulted in costs of three-
times that of conventional aluminum alloys. Hence, removal of large amounts of material by machining
is not a cost-effective approach for utilizing aluminum-lithium alloys for this application.
The built-up concept would utilize net or near-net shapes to form stiffeners that would be joined to skin
sheet to produce the panels. Figure 2 depicts a cross-section of one concept for the proposed built-up
structure. Longitudinal stiffeners would be produced by methods such as extruding, roll-forming, or
superplasticaliy forming (SPF) Of parts. Because the SPF process possesses the ability to produce
relatively complex shapes, which may result in optimized designs, SPF processing of the stiffeners is
especially of interest. The stiffeners would then be joined to the outer skin-sheet, in order to produce
the panels. Current methods being evaluated for joining the stiffeners to skin are resistance spot or seam
welding. Aluminum-lithium alloys of interest for producing the built-up structure include 2095 (formerlyWeldalite" 049) stiffeners to 2095 skin and alloy 8090 stiffeners to alloy 2090 skin. Nominal
compositions, densities, and elastic modulii for these alloys are shown in Table I (P,efs. 5-7). As
mentioned previously, the stiffeners are necessary along the length of the panels in order to prevent
longitudinal buckling during loading of the tank. Compressive stress along the length of the panels wouldtranslate into sheer stress at the interface of the stiffener to skin welds, and hoop stress due to internal
pressure would result in transverse tensile stress across the partial penetration weld and heat affected zoneof the skin.

Laserweldingfor Olis application possesses several advantages over resistance spot and seam welding.
In order to optimize structural integrity during load transfer, it is most desirable to produce the welds as
close to the corner of the vertical member of the stiffener as possible. Prototype stiffeners, currently
being evaluated, possess approximately a 0.750 (1.9 cm) inch wide flange primarily for resistance spot
welding access and results in a weight penalty and waste of expensive material. Laser welding couldprovide a continuous weld along the length of the extrusion or SPF part extremely close to the corner of
the vertical member. Because of this, the flange requirements for laser beam welding of the stiffenersto face-sheet would be greatly reduced.
Laser welding offers other potential benefits such as higher production rates, narrow heat affected zones,
and the potential for process automation. Laser welding of lap-joints in the thicknesses currently beingconsidered may employ extremely high welding speeds when compared to current fusion welding
techniques. It is estimated that welding speeds of 100 to 200 inches per minute (4.2 to 8.4 cm/s) are
achievable by muitikilowaRR, carbon-dioxide lasers for this application. Because of the extensive amount
of welding required to fabricate the panels, higher welding speeds would significantly impact productivity
and cost. The high welding velocity in combination with the laser's ability to generate high powerdensities results in low overall heat input to the base metal. The ramifications of this characteristic is
minimal thermal distortion and high joint strength associated with laser beam welds. Figure 3 shows a
comparison of ultimate tensile strength of buRR-welds in alloy 2090-T83 produced using various welding
processes (Refs. 8 and 9). As illustrated in the figure, welds produced with the high-energy densityprocesses such as electron beam and laser beam welding exhibited the highest ultimate tensile strength.
However, as opposed to electron beam welding, laser beam welding does not require a vacuum during
processing. The favorable weld strength exhibited by laser beam welds is primarily due to the highcooling rates in the fusion zone and adjacent base material. Finally, for safety considerations laser beam
welding requires automated manipulation of either the beam or the part, as well as automatic control of
the various processing parameters. Since laser beam welding is performed in a fully automatedprocessing environment it provides inherent capabilities for process control.
Based on the potential benefits of laser beam welding for fabrication of the stiffened panels, a program
was initiated between NASA Langley Research Center and the Applied Research Laboratory, ThePennsylvania State University (ARL Penn State) to determine the feasibility of laser beam welding
aluminum-lithium alloys for cryogenic tankage. Four primary tasks were proposed to determine the
viability of laser beam welding for this application. This included establishment of process parameters
for two thickness and alloy combinations, production of test specimens, determination of critical weld
properties, and fabrication of prototype panels for evaluation. The sequence of tasks for the program isshown in Figure 4.
Process parameters wouldbe established to provide lap welds possessing positive weld reinforcement withpartial penetration in the face-sheet and at processing speeds applicable to high production rates for two
face-sheet thicknesses and two alloy combinations. Welding parameters would be developed utilizing the
Laser Articulating Robotic System (LARS) at ARL Penn State, which is serviced by a 14 kW United
Technologies carbon dioxide laser. LARS provides full process automation while being capable of
producing prototype panels up to 10 R. by 10 ft. (3.0 m by 3.0 m) in size. A schematic of LARS is
shown in Figure 5.
2.0 EVALUATIONS
The evaluation involved four primary tasks: process parameters development, production of test
specimens, characterization of test specimens, and fabrication of prototype panels. Processing
parameters, such as beam power, travel speed, and shielding gas arrangement would be identified for
producing lap-welds using LARS. Constraints imposed in producing the lap-welds were positive weld-:
bead reinforcement and approximately 50 percent penetration into the face-sheet at processing speeds
applicable to high production rates. Also of consideration during this task would be pretreating
procedures for the aluminum-lithium alloys. Because aluminum-lithium alloys possess a hydrogen-
enriched layer near the surface due to thermally induced oxidation during primary processing, surface
pretreatments would be concurrently evaluated during process development with the goal of producing
porosity-free welds (Refs. 10 and 11). Once established, these processing parameters would be used to
produce test specimens for determining weld characteristics critical for ascertaining the viability of laser
beam welding for this application.
Mechanical analysis indicated that during service, the weld joints of the built-up panels would incur two
primary loading conditions. Compressive stress along the length of the panels would translate to shearstress at the weld between the stiffener to skin, and hoop stress due to internal pressure would result in
transverse tensile stress across the partial penetration and heat affected zone of the skin. Based on this
analysis, it was recognized that shear strength of the lap weld and strength across the partial penetrationof the skin would be essential for determining the viability of laser beam welding. This resulted in a
testing plan thafwould utilize specimens produced using optimal processing parameters to determine
_r|t_cal ]0_-fit pr6perties.::Resuits of static tests would then be compared to prototype panels tested under
simulative loading condmons.
Material required for program execution was supplied by NASA Langley Research Center. This included
sheet material of alloys 2095-T6 and 8090-T6 representing stiffeners, 2095-T8 and 2090-T83 representingskin-sheet, as well as SPF stepped-hat stiffeners of 2095-1"5 and 8090-T5. The alloy and thicknesscombinations for stiffeners and skin that were initially of interest are shown in Table II.
2.1 Process Parameters Development
Welding parameters were developed on LARS, which is serviced by a 14 kW, United TechnologiesIndustrial Lasers Model SM21-14, carbon dioxide laser. LARS is a large rectilinear robot having three
linear degrees-of-freedom and three rotational degrees-of-freedom. The system utilizes water-cooled,
copper mirrors to manipulate the unfocused beam, being approximately 3.0 in. (7.6 ram) in diameter,
to the welding head. A spherical, Water-cooled mirror is then used to focus the beam to a spot size of
approximately 0.030 inch (0.8ram) in diameter. This results in attainable power densities at focus of7.07x10 e w/in.2 (l.lxl0 e w/cm 2) at 5 kW to 1.99x10 _ w/in. 2 (3.08x10 _ w/cm 2) at 14 kW. The reflective
optics utilized on LARS provide an ample stand-off distance between the work-piece and welding head,therefore, shielding gas is typically supplied externally through the use of a copper nozzle. A schematic
of the optical arrangement utilized for LARS is shown in Figure 6.

2.1.1 Initial Process Development
Initial process parameters were obtained by producing autogenous lap-welds on thicknesses applicable tothe stiffener to skin configuration with material in the as-received condition. All material was received
in the as-fabricated condition except for the 0.050 in. (1.3 mm) thick 8090-T6 sheet that was given an
acid pretreatment (8 oz. of commercial Aluma" etchant per gallon of water at room temperature for 10minutes) at NASA Langley Research Center. The two thickness combinations were: 0.050 in. (1.3 mm)
thick top-sheet to a 0.095 in. (2.4 ram) thick bottom-sheet, and 0.050 in. (1.3 mm) thick top-sheet to a0.120 in. (3.0 mm) thick bottom-sheet. Sheet specimens 4.0 in. (10.2 cm) in width and 6.0 in. (15.2
mm) in length were completely overlapped and welded at the center along the length direction. Clamping
of the sheets was accomplished through the use of two 0.250 in. (6.4 mm) thick by 1.5 in. (3.8 cm) wideby 8.0 in. (20.3 cm) long bars of Inconel 625 allowing a 1.0 in. (2.5 cm) gap along the center of the
sheet for welding. The Inconel 625 bars were deformed to obtain a slight curvature, and with the
curvature facing upward the bars were clamped at three points along the length of the sheet specimens.A bronze plate machined to 0.375 in. (9.5 mm) in thickness was used as backing beneath the thicker
bottom-sheet. Figure 7 depicts the clamping arrangement used during this evaluation.
Full penetration of the top-sheet and partial penetration of the bottom-sheet was achieved at power levelsof 6.5 to 7.0 kW and travel speeds of 150 to 170 IPM (6.4 to 7.2 cm/s). A stand-off distance of
approximately 6.0 in. (15.2 cm) between the welding head and the part was utilized. Helium shieldinggas at a flow rateof 200 CFH (94.4 l/min.) was supplied by a 0.375 in. (9.5 ram) inside-diameter nozzle
mounted at a 35° angle from the vertical and directed at the front edge of the weld pool opposite thewelding direction. These parameters were used to produce autogenous welds having bead widths of
approximately 0.187 in. (4.7 mm) and exhibiting positive weld bead reinforcement. Operating within
the range of parameters shown above provided approximately 75 percent penetration for both alloycombinations. The welding parameters identified during initial process development are summarized inTable HI.
2.1.2 Factorial Experiment
After establishing initial process parameters, a 2_ factorial experiment was designed to measure the effects
of alloy combination, material thicknesses, and precleaning processes on weld porosity. This involvedeight combinations for a total of 16 runs with replication. Values of plus-one or minus-one were
arbitrarily assigned to the conditions for each independent variable. The experimental conditions were:
..... gJl_6yCombmat_ons: (-1) 8_T6to_I'_ .... _(+I_ 2095-T6to 2095-T8
2) Material Thicknesses: (-1)
(+1)
3) Cleaning Treatment: (-1)
(+t)
0.050 inchesto0.095 inches(1.3to 2.4 mm)
0.050 inchesto0.120 inches(1.3to 2.4 mm)
Chemicallycleanedinsodium hydroxide
Wire brus]ie£afid Soivent degreased
4

Pretreating techniques utilized in the factorial experiment were chemical cleaning by immersion in a 8%NaOH solution at 170 "F (77 "C) for 60 minutes to remove 0.001 in. (0.02 ram) per side and
mechanically wire brushing followed by cleaning with acetone just prior to welding. The chemically
etched specimens were wrapped in paper, stored at ambient temperature, and welded within 48 hours oftreatment. The mechanically wire brushed samples were also welded within 48 hours of treatment.
Welding parameters were adjusted during the experiment to obtain a constant depth of penetration of 75
percent and varied from 6.5 to 7.0 kW beam power and 150 to 170 IPM (6.4 to 7.2 cm/s) travel speed.
.°
Four-inch (10.2 cm) long autogenous lap-welds were produced on specimens representing the various
combinations. The clamping arrangement used during the factorial experiment was identical to the
arrangement described earlier. After welding, a cross-section and a 1.0 in. (2.5 cm) long longitudinalsection from each weld were removed and prepared for metallographic analysis. A section 1.2 in. (3.2
cm) in length from each weld was also peel-fractured at the weld interface and examined at 10X
magnification for weld porosity. The fractured lap-welds were characterized by determining the number
of pores less than 0.005 in. (0.13 mm) in diameter, between 0.005 and 0.020 in. (0.13 and 0.51 mm)in diameter, and greater than 0.020 in. (0.51 ram) in diameter. The values obtained for the initial run
and replication were averaged for the three pore-size categories. Results of the factorial experiment
showing distribution of porosity, based on the average of two 1.2 in. 0.2 cm) long weld specimens,
along with experimental conditions are shown in Table IV.
2.1.3 Second Process Parameters Evaluation
It was observed during initial process development that penetration depth into the bottom-sheet was
effected by the alloy combination being welded. The alloy combination of 8090-T6/2090-T83 required
less heat input than 2095-T6/2095-T8 to obtain a given penetration depth. Therefore, it was necessary
to adjust welding parameters to obtain equal penetration depths for each alloy combination. Modifications
to the welding parameters were made by slightly adjusting travel speed and power to obtain 50 percent
penetration into the bottom-sheet for both alloy combinations. Specimen configuration and clamping
arrangement used during the second process parameters development were identical to those describedearlier. The combination of 8090-T6/2090-T83 necessitated lower beam power and higher welding
speeds. The modified parameters established for each alloy and thickness combination are shown in
Table V.
2.1.4 Chemical Cleaning Evaluations
Earlier evaluations conducted during process development had indicated that unacceptable porosity was
formed within the fusion zone during laser beam welding while employing pretreatments such as wire
brushing, solvent degreasing, and mild NaOH etching. Metallographic sections taken longitudinally alongthe weld continued to show porosity within the fusion zone. It was believed that a hydrogen enriched
layer near the surface of the base metal was responsible for generating gas porosity during welding, andthis theory had been supported by results of prior investigations using conventional welding processes
(Refs. 12-14). To determine if a hydrogen enriched layer was responsible for generating the weld
5

porosity,more aggressive pretreating was evaluated. Vendors were contacted to obtain quotes for
chemical treating of specimens to remove up to 0.010 in. (0.25 mm) per side by chemical milling inNaOH aqueous solutions. Two vendors were chosen for evaluating the effect of chemical milling on weld
porosity. These were: Chem-Tron Company of Danbury, CT and Chemtronics Corporation of El Cajon,CA.
Initial samples were forwarded to Chem-Tron Company requesting 0.010 in. (0.25 mm) to be removed
per side; however, inspection of the returned samples indicated that 0.001 in. (0.02 mm) per side was.removed. These specimens were treated by chemical milling in a 20 percent NaOH solution at 81 "F
(27"C) for 45 minutes. An evaluation was conducted on the material chemically milled at Chem-Tron.
Autogenous laser beam welded specimens of both alloy and thickness combinations were produced usingthe established parameters shown in Table V. Treated material was wrapped in paper and stored at
ambient temperature; welding was performed within 48 hours of chemical milling. If successful inproducing porosity-free welds, the panels produced during the experiment would also be utilized to
determine weld strength across the partial penetration welds of the face-sheet. Specimen configuration
utilized during the evaluation was two 4.0 in. by 6.0 in. (10.2 by 15.2 cm) sheets having complete
overlap with the laser weld at the center along the 6.0 inch (15.2 cm) dimension. Clamping arrangementremained the same as described previously. After welding, the first and last inch (2.5 cm) of weld was
removed and discarded. Addihonal samples were removed for metallographic analysis. The remainingpanel being approximately 4.0 in. by 3.0 in. (10.2 by 7.6 cm) was retained for tensile test specimens of
the partial penetration welds of the bottom sheet, representing alloys 2090-T83 and 2095-T8.
The panels retained for tensile tests were prepared by carefully machining-away the top sheet, being alloy$090-T6 or 2095-T6, to within 0.003 in. (0.08 mm) of the bottom sheet. The remaining weld crown was
then removed by hand-sanding to achieve fiat panels suitable for obtaining subsize tensile specimens
having a 1.0 in. (2.5 cm) gage length with the weld transverse to the specimen. However, during thefinishing operation it became apparent that unacceptable porosity was present at the interface. The
interface of both the 0.095 and 0.120 in. (2.4 and 3.0 mm) thick panels of 2905 exhibited large poresapproximately 0.010 to 0.030 in. (0.25 to 0.76 mm) in diameter along the length of the weld, whereas,
the weld on alloy 2090-T8 exhibited smaller pores approximately 0.003 to 0.010 in. (0.08 to 0.25 mm)
in diameter. The panels were dye penetrate inspected to readily illustrate the porosity present along the
weld. Based on these results, production of tensile specimens for measuring strength across the partialpenetration weld of the face-sheet was postponed until an acceptable pretreating method was identified.
Based on the laser welding results of material that had been chemically milled 0.001 in. (0.03 mm) per
side by Chem-Tron Company of Danbury, CT, specimens representing both alloy and thickness
combinations were forwarded to Chemtronics Corporation, E! Cajon, CA for chemical milling to remove
0.005 and 0.010 in. (0.13 mm and 0.25 mm) per side. Specimens were chemically milled byChemtronics Corporation by immersion in a 32 percent NaOH aqueous solution at 210"F (99"C) for 5
to 10 minutes. Thickness measurement were performed on material prior to shipment and after return
from Chemtronics Corporation to confirm the amount of material removed by chemical milling. Thesamples were then welded using the specimen configuration and clamping arrangement described earlier,
however, because of the decrease in thickness and change in surface conditions, slight adjustment were
made to the pre-established welding parameters. Treated material was wrapped in paper and stored at
ambient temperature. Welds were performed within 48 hours of chemical milling. The parameters used

to producethepanelsareshownin TableVI. These parameters provided between 35 and 70 percent
partial penetration tO the thicker, bottom-sheet.
After welding the material that had been chemically milled by Chemtronic Corporation to remove 0.005and 0.010 in. (0.13 and 0.25 ram) per side, the first and last half-inch (12.7 ram) of weld was removed
and discarded. Additional samples were removed for metallographic analysis to determine weld
penetration. The remaining panels being approximately 4.0 in. by 3.5 in. (10.2 by 8.9 cm) in size were
retained for obtaining tensile test specimens of the partial penetration welds of the bottom sheet_
representing alloys 2090-T83 and 2095-T8. As performed earlier, the panel retained for tensile testspecimens was prepared by carefully machining-away the top sheet, being alloy 8090-T6 or 2095-T6, to
within 0.003 in. (0.08 nun) of the bottom sheet. The remaining weld crown was then removed by hand-
sanding to achieve fiat panels suitable for obtaining subsize tensile specimens.
Identical to the procedure utilized for the welds produced from material chemically milled 0.001 in. (0.02
ram) per side by Chem-Tron Company, the 4.0 in. by 3.5 in. (10.2 by 8.9 cm) panels that had been
prepared for tensile testing of the partial penetration welds of the bottom sheet were also used to
determine the extent of porosity associated with the welds. The top surface of the panels provided a viewof the weld that was present at the interface between the top and bottom sheets. The amount of porosity
exhibited at the interface could be directly related to the degree of chemical milling performed on the
sheets prior to laser beam welding.
The level of porosity at the interface associated with the welds produced from material that was
chemically milled by Chemtronic Corporation to remove 0.005 and 0.010 in. (0.13 and 0.25 mm) perside ___ _quantified by _'isually determining the number of pores present per linear inch of weld at a 10X
magnification. This was also performed on panels chemically treated by Chem-Tron Company
representing material that was chemically milled 0.001 in. (0.02 ram) per side. These measurements
represented the amount of porosity per inch over a total of 7.0 in. (17.8 cm) of weld. The results of
these determinations are shown in Figure 8 and support the supposition that elimination of the hydrogen
enriched layer by removing 0.010 in. (0.25 mm) per side dramatically reduced porosity at the weld
interface. The panels were also dye penetrant inspected to readily illustrate the amount of porosity
present along the weld. Photographs of the weld interface of the welded panels representing the 0.120in. (3.0 nun) thick bottom-sheet that were produced from the material chemically milled 0.001 in. (0.02
ram) per side by Chem-Tron Company and chemically milled 0.005 and 0.010 in. (0.13 and 0.25 mm)
per side by Chemtronics Corporation after dye penetrant inspection are shown in Figures 9 and 10.
2.2 Production of Test Specimens
Autogenous welds were produced on lap-configurations selected to simulate stiffener to skin conditionsfor determination of critical properties. Critical properties that were of interest included strength across
the partial penetration welds of the skin and shear strength at the weld interface between the stiffener and
skin. Results of the chemical pretreating evaluations had indicated that chemical milling of material was
required to produce welds having minimal porosity at the interface. Therefore, material that was utilized
for producing test specimens was chemically milled to remove either 0.005 in. or 0.010 in. (0.13 or 0.25

ram)persideprior to welding. Thethicknessesdiscussedbelowrepresentmaterialthicknesses prior tochemical milling. Panels of 0.050 in. (1.3 mm) thick sheet welded to 0.120 in. 0.0 ram) thick sheet that
had both been chemically milled 0.010 in. (0.25 mm) per side for each alloy combination were used for
measuring strength across the partial penetration welds of the skin, the 0.120 in. 0.0 mm) thick material.
For weld shear strength determinations it was decided that the effect of chemical milling on weld
porosity, and hence shear strength at the weld interface, be ascertained. Therefore, material that was
chemically milled 0.001 in., 0.005 in., and 0.010 in. (0.02, 0.13, and 0.25 mm) per side was used to
produce weld shear strength specimens. Since chemical milling of 0.010 in. (0.25 ram) per sidedramatically reduced the thickness of the 0.050 in. (1.3 mm) thick material used to simulate the stiffeners,
additional sheet material of 2095-T6 being 0.068 in. (1.7 mm) in thickness was obtained for producingweld shear strength specimens. Thicker sheet of 8090-T6 was not readily available; therefore, the
original 0.050 in. (1.3 ram) thick 8090-T6 material was utilized to produce weld shear strength samplesfor the combination of 8090-T6 to 2090-T83.
2.2.1 S_imens for Determ_ingStrength AcrossP_alPenetration
The panels representing the 0.050 in. (1.3 mm) thickness to 0.120 in. 0.0 mm) thickness produced from
the material chemically milled to remove 0.010 in. (0.25 mm) per side by Chemtronics Corporation wereutilized for obtaining mechanical properties across the partial penetration welds of the bottom sheet. This
condition was chosen because the welds produced from the material that had been chemically milled to
remove 0.010 in. (0.25 mm) per side prior to welding exhibited minimal porosity at the interface. After
carefully removing the top-sheet, tensile test specimens were removed from the bottom sheet representingthe partial penetration welds on the 0.120 in. 0.0 mm) thick 2090-T83 and 2095-T8 material. Five test
samples 0.50 in. (12.7 mm) in width were removed from samples BI (representing the 0.120 in. thick
2090-T83) and B4 (representing the 0.120 in. thick 2095-T8). The welds were at the center of the
samples and transverse to the direction of testing. Three additional samples of the 0.120 in. 0.0 ram)
thick 2090-T83 and 2095oT8 that had not been welded were also obtained for base metal strength
determinations. The base metal samples represented material that was not chemically milled.
2.2.2 Welds Shear Strength Specimens
Weld shear strength specimens were produced on material that had been chemically milled 0.001, 0.005,
and 0.010 in. (0.02, 0.13, and 0.25 mm) per side to ascertain the effect of porosity on weld shearstrength. Material representing the thicknesses and alloys of interest for simulating the stiffener to skin
welds were forwarded to Chemtronics Corporation, E! Cajon, CA for chemical millingl Sheet specimens4.0 by 6.0 in. (10.2 by 15.2 cm) in size and representing 0.050 in. (1.3 ram) thick 8090-T6, 0.068 in.
(1.7 ram) thick 2095-T6, 0.095 and 0.120 in. (2.4 and 3.0 mm) thick 2090-T83, and 0.095 and 0.120
in. (2.4 and 3.0 mm) thick 2095-T80 were forwarded to Chemtronics Corporation. As discussed
previously, it was decided to utilize the 0.068 in. (1.7 mm) thick 2095-T6 material in lieu of the 0.050
in. (1.3 mm) thickness due to the relatively large amount of material that would be removed by chemical
milling. Thicker sheet of 8090-T6 was not readily available; therefore, the 0.050 in. (1.3 mm) thick

8090-T6 was utilized for producing weld shear strength specimens for the 8090-T6 to 2090-T83
combination. Specimens were chemically milled by immersion in a 32 percent NaOH aqueous solution
at 210"F (99"C) for 1 to 10 minutes. Thickness measurements were performed on material prior to
shipment and after return from Chemtronics Corporation to confirm the amount of material removed bychemical milling. The milled specimens were wrapped in paper and stored at ambient temperature prior
to welding.
After chemical milling of the material weld specimens were produced for obtaining weld shear strength"
at the interface. The 4.0 by 6.0 in. (10.2 by 15.2 cm) panels were welded to produce an autogenous lap-
weld along the center of a 4.0 (10.2 cm) overlap. The weld specimen configuration used for obtaining
weld shear strengths are shown in Figure 11. Three welded panels were produced for each thickness and
alloy combination having 0.001, 0.005, and .010 in. (0.02, 0.13, and 0.25 mm) removed per side bychemical milling prior to welding. Clamping of the sheet during welding was similar to the arrangement
discussed earlier. A stand-off distance of approximately 6.0 in. (15.2 cm) between the welding head and
the part was utilized. Helium shielding gas at a flow rate of 200 CFH (94.4 l/rain.) was supplied by a
0.375 in. (9.5 mm) inside-diameter nozzle mounted at a 35° angle from the vertical and directed at the
front edge of the weld pool opposite the welding direction. Welding parameters used to produce the
partial penetration welds were also utilized for producing the shear strength specimens; however, minor
changes in beam power were made based on depth of penetration observations from weld cross-sections.
Parameters were adjusted to obtain a nominal penetration of 50 percent into the bottom-sheet. Welding
parameters utilized for these specimens are shown in Table VII and Table VIII for the 8090-T6 to 2090-T83 and 2095-T6 to 2095-'1"8 combinations, respectively.
2.3 Characterization
Characterization of laser beam welds entailed determining critical mechanical properties necessary for
determining the viability of the process for cryogenic tankage applications and limited metallurgical
analysis. Strength across the partial penetration weld of the face-sheet and weld shear strength at theinterface were considered critical for ascertaining the applicability of the process. Metallurgical analysis
was used to support the results of mechanical property testing. This included measuring the natural aging
response of the fusion zone and heat affected zone for both alloy combinations and the examination of
fracture surfaces of mechanical property samples.
2.3.1 Mechanical Property Characterization
The panels produced during the chemical pretreating evaluation representing the 0.120 in. 0.0 nun) thickbottom-sheets of 2090-T83 and 2095-'1"8 were utilized for obtaining strengths across the partial penetration
welds. These samples were forwarded to Westmoreland Mechanical Testing Laboratory, Latrobe, PAfor transverse determinations of ultimate tensile strength, yield strength, and percent elongation associated
with the partial penetration welds in the 2090-T83 and 2095-T8 bottom-sheet. Subsize mechanical
property specimens, having a 1.0 in. (2.5 cm) gage length with the weld transverse to the specimen, weremachined from the samples. This resulted in tensile test specimens having a reduced section width of
9

0.50in. (1.3 cm) and a 1.0 in. (2.5 cm) gage length for material representing partial penetration weldsin 0.120 in. 0.0 mm) thick 2090-T83 and 2095-T8, as well as unwelded base metal. Tensile testing of
the subsize specimens was conducted according to ASTM Specification E8. A minimum period of 220
hours elapsed between welding and testing to ensure that sufficient precipitation strengthening (naturalaging) in the fusion zone and heat affected zone had occurred. Results of the tensile tests across the
partial penetration welds of 2090-T83 and 2095-T8, as well as base metal strengths, are shown in TableIX and Table X, respectively.
Welded specimens representing both alloy and thickness combinations that had been chemically milled0.001, 0.005, 0.010 in. (0.02, 0.13, and 0.25 mm) per side prior to welding were sectioned to obtain
samples for weld shear strength determinations. One-inch (2.5 cm) wide sections were removed from
the welded panels with the lap-weld at the middle of the section and transverse to the length. These
sections were then machined to provide samples being 0.750 in. (1.91 cm) wide and 7.75 in. (19.7 cm)
long. Samples representing 0.050 in. (1.3 mm) thick 8090-T6 to 0.095 in. (2.4 mm) thick 2090-T83 and
0.068 in. (1.7 mm) thick 2095-T6 to 0.095 in. (2.4 mm) thick 2095-T8 were forwarded to NASA
Langley Research Center for determination of weld shear strengths. Samples representing 0.050 in. (1.3
mm) thick 8090-T6 to 0.120 in. (3.0 ram) 2090-T83 and 0.068 in. (1.7 ram) thick 2095-T6 to 0.120 in.
(3.0 mm) thick 2095-T8 were retained by ARL Penn State for testing.
Shear strength testing of ARL Penn State samples representing 0.050 in. (1.3 nun) thick 8090-T6 to
0.120 in. 0.0 ram) thick 2090-T83 and 0.068 in. (1.7 mm) thick 2095-T6 to 0.120 in. (3.0 ram) thick
2095-T8 was performed at Westmoreland Mechanical Testing Laboratory, Latrobe, PA. The shear area
was obtained by measuring the weld width at the interface on the edges of the samples and the length of
the weld prior to shipment to Westmoreland Mechanical Testing Laboratory. A width measurement was
made on each edge and the average weld width in conjunction with the measured weld length was usedto calculate the shear area. Shear tension tests were performed in accordance with ASTM Specification
D1002-72. The samples were shimmed during testing to prevent an off-set of the grips. The shear test
was performed on a 30,000 lb. Instron tensile test machine using a cross-head speed of 0.05 in. per
minute (1.3 mm/min.). A minimum period of 220 hours elapsed between welding and testing to ensure
sufficient precipitation in the fusion zone had occurred. Results of shear tension tests on the lap-welds
are shown in Table XI and Table XII for both alloy combinations. Radiographic analysis was performed
at NASA Langely Research Center on the shear tension test specimens after testing. The broken tensile
shear test specimens were overlapped with the remaining skin-sheet during radiography to obtain weldsoundness associated with the interface and the partial penetration weld of the skin-sheet. Contact prints
of the radiographs representing the 0.050 in. (1.3 mm) thick 8090-T6 to 0.120 in. (3.0 mm) thick 2090-
T83 weld produced from material that had been chemically milled 0.001, 0.005, and 0.010 in. (0.02,
0.13, and 0.25 mm) are shown in Figures 12 through 14, respectively. The contact prints of the
radiographs representing the 0.068 in. (1.3 mm) thick 2095-1"6 to 0.120 in. (3.0 mm) thick 2095-T8
welds produced from material that had been chemically milled 0.001, 0.005, and 0.010 in. (0.02, 0.13,and 0.25 mm) are shown in Figures 15 through 17, respectively.
10

2.3.2 Metallurgical Characterization
Limited metallurgical characterization was also conducted on weld specimens obtained for strength
determinations across the partial penetration welds. Optical microscopy was used to determine the depth
of penetration associated with the partial penetration welds. Cross-sections of the welds, adjacent to the
mechanical property specimens, were removed and prepared for macrographic analysis. This involved
grinding to 600 grit silicon-carbide paper and polishing it with 0.05/zm alumina powder suspended inwater. Etching was performed by immersion in Keller's Reagent. Photomacrographs of the 0.050 in_
(1.3 nun) thick 8090-T6 to 0.120 in. (3.0 mm) thick 2090-T83 welds and 0.050 in. (1.3 mm) thick 2095-
T6 to 0.120 (3.0 mm) thick 2095-T8 welds are shown in Figure 18. Microhardness measurements across
the welds in the 0.120 in. (3.0 ram) thick 2090-T83 and 2095-T8 material welded under similar condition
were performed at 4, 24, 72, and 220 hours after welding. These measurements would be used to
determine the degree of degradation in the heat affected zone and the ability of the base metal and weld
to precipitation strengthen (naturally age) after welding. Microhardness profiles across the partial
penetration welds of the 0.120 in. (3.0 mm) thick 2090-T83 and 0.120 in. (3.0 mm) thick 2095-T8 are
shown in Figure 19 and Figure 20, respectively. Fracture surfaces of the returned tensile test specimenswere also examined by scanning electron microscopy and the interface area of the returned tension shear
test specimens were visually examined for the presence of weld porosity.
2.4 Fabrication of Prototype Panels
Prototype panels were produced by autogenously laser beam welding 3.0 in. (7.6 cm) wide by 1.15 in
(2.9 cm) high by 22.5 in. (57.2 cm) long stepped-hat stiffeners to 5.0 in. (12.7 cm) wide by 24 in. (61
cm) long sheet specimens. The stepped-hat stiffeners were superplastically formed at NASA LangleyResearch from 0.090 in. (2.3 mm) thick 8090-T6 and 2095-T6 material. The skin-sheet represented
0.120 in. 0.0 mm) thick 2090-T83 and 2095-T8 material. The thickness and alloy combinations ofinterest were 0.090 in. (2.3 mm) thick 8090-T6 to 0.120 in. 0.0 mm) thick 2090-T83 and 0.090 in. (2.3
mm) thick 2095-T6 to 0.120 in. (3.0 mm) thick 2095-T8. Because of the drastic reduction in thicknessof the stiffeners that would result from chemically milling 0.010 in. (0.25 ram) per side, it was decided
by NASA Langley Research to produce the prototype panels from material that was chemically milled0.001 and 0.005 in. (0.02 and 0.13 mm) per side prior to welding. This would also offer the opportunity
to assess the effect of chemical milling on weld porosity and reduction of weld properties. Material
representing the stepped-hat stiffeners and skin sheet for both alloy combinations were forwarded to
Chemtronics Corporation, El Cajon, CA for chemical milling of 0.001 and 0.005 in. (0.02 and 0.13 mm)
per side. Specimens were chemically milled by immersion in a 32 percent NaOH aqueous solution at
210"F (99"C) for I to 5 minutes. Thickness measurements were performed on material prior to shipmentand after return from Cl_emtronics Corporation to confirm the amount of material removed by chemical
milling. Material that was chemically milled was wrapped in paper and stored at ambient temperature
prior to welding.
The chemically milled material was laser beam welded using parameters established during process
development. Minor changes in beam power were attempted based on depth of penetration observationsfrom weld cross-sections; however, welds on two of the panels were later observed to exhibit marginal
penetration in the face-sheet. Welding parameters and estimated depth of penetration into the skin for
11
theprototypepanelsareshownin Table XIII. Weld path was programmed by pendant-teaching throughthe use of an in-line He-Ne laser. The welding path was established to produce the weld as-near to the
vertical member of the stiffener as possible; although, the basic fixturing arrangement utilized for the
prototypes did not provide maximum accessibility to the edge of the vertical member. After welding,cross-sections at approximately 1 inch (2.5 cm) from the end of the panels were obtained to determine
extent of penetration into the face-sheet. Clamping arrangement utilized for producing the panels wasmodified to accommodate the larger size of the prototypes. Hand-clamps and 0.375 in. (9.5 mm) thick
by 1.0 in. (2.5 cm) wide by 20 in. (51 cm) long steel bars were used to provide clamping force between
the stiffener flange and the face-sheet. An auxiliary 0.375 in. (9.5 ram) thick by 1.0 in. (2.5 cm) wid_
by 20 (51 cm) in. long steel bar was positioned at the top of the stiffener and used to provide additional
clamping force between the stiffener and skin-sheet. The clamping arrangement utilized during weldingof the prototypes is shown in Figure 21. Note that the auxiliary bar along the top of the stiffeners are
not shown in the photographs of Figure 21 for clarity. Because of reduced accessibility for welding of
the prototype, the shielding gas arrangement was also modified. This required the use of a 0.250 in. (6.4
mm) inside diameter copper nozzle to be positioned at a 35" angle from the vertical, opposite the weldingdirection and directed at the leading edge of the weld. A stand-off distance of 0.250 in. (6.4 ram) in
front and 0.250 in. (6.4 ram) ahead of the focused beam was maintained. Helium shielding gas was
supplied at a flow rate of 200 CFH (94.4 l/min.). Figure 22 are photographs of a completed prototypepanel and Figure 23 contains macrographs of the panel cross-section for both alloy combinations that had
been chemically milled 0.005 in. (1.3 ram) per side prior to welding. Radiographic analysis of the
completed panels were performed at NASA Langely Research Center. Contact prints of the radiographs
that had been reduced by a factor of approximately three for each panel condition are shown in Figures24 through 27.
3.0 DISCUSSION OF RESULTS
3.1 Process Parameters
Process parameter were identified to attain good penetration into the skin and positive weld bead
reinforcement at processing speeds offering potentially high productivity; however, concurrent changes
in material thicknesses and surface conditions hindered establishment of def'mitive laser beam weldingparameters. Adequate penetration was easily achieved when autogenously welding the various thicknesses
of 8090-T6 to 2090-T83 at a beam power of 5.2 to 5.8 kW and travel speeds of 160 IPM (6.8 cm/s).Adequate penetration was also readily accomplished when autogenously welding the various thickn_ses
of 2095-T6 to 2095-T8 with between 6.0 and 6.7 kW of beam power and travel speeds of 150 IPM (6.4
cm/s). These parameters were identified during the early stages of process development and typicallyresulted in the weld crown exhibiting positive reinforcement without the addition of filler material.
Although these parameters attained the necessary requirements established for the program, it is believed
that higher welding speeds, approaching 200 IPM (8.5 cm/s), may be possible through the use of greaterbeam power and filler metal additions. Processing speeds demonstrated during this program would
directly effect the efficiency of producing large panels, having multiple stiffeners, and requiring extensivewelding. ..........
12
Asindicatedbytherangeof processingparametersdiscussedabove,lower power levels and higher travel
speeds were initially utilized to achieve comparable penetration when welding the alloy combination of
8090-T6/2090-T83 when compared to 2095-T6/2095-T8. This was necessary for welding material that
was pretreated by wire brushing or mild chemical milling in NaOH to remove 0.001 in. (0.02 ram) per
side. It was initially speculated that the higher level of copper contained in alloy 2095 either increasedits thermal diffusivity or caused fluid flow conditions that reduced penetration; however, observations of
welds on material that was chemically milled to remove 0.005 and 0.010 in. (0.13 and 0.25 mm) per sidesuggests the difference in penetration may be attributed to the differences in mill-finish. Welds of 2095-
T6 to 2095-T8 material that had been aggressively chemically milled tended to have deeper penetration.
at the higher power levels and slower travel speeds as compared to the 8090-T6 to 2090-T83 that had
been chemically milled. As mentioned earlier, concurrent changes in material thicknesses and pretreating
conditions precluded the establishment of definitive welding parameters to achieve constant penetration
for both alloy combinations. However, based on observations of welds from material that had been
chemically milled 0.005 and 0.010 in. (0.13 and 0.25 mm) per side, the difference in heat input required
to achieve constant penetration for both alloy combinations may be less than what was initially believed.
Clamping of the top-sheet or stiffener to the face-sheet was found to be critical in achieving good weld
quality. The arrangement shown in Figure 7 allowed adequate clamping force along the length of the
sheet used for process development and production of mechanical property test specimens. These panels,
which involve complete overlap of two 4 in. (10.2 cm) wide by 6.0 in. (15.2 cm) long sheets, presented
little difficulty for obtaining adequate clamping force between the top and bottom sheets. This resulted
in consistent weld bead uniformity having positive reinforcement for the vast majority of these specimens.However, it was readily observed that the configuration of the prototype panels consisting of a SPF
stepped-hat stiffener to the skin presented greater difficulty for achieving adequate clamping force. The
clamping arrangement utilized for the prototype panels and shown in Figure 21 did not provide consistentclamping force along the length of the stiffener flange. The resultant welds of the prototype panels
exhibited intermittent burn-through along the weld in the stiffener flange and is believed due to
insufficient clamping force at those points. The limited scope of this program did not enable the
development of a clamping fixture for the prototype panels. However, it is believed that utilization ofa fixturing arrangement designed to provide sufficient force between the stiffener flange and skin would
provide repeatable weld bead quality similar to that exhibited by the mechanical property specimens.
3.2 Chemical Cleaning
Various cleaning treatments were evaluated for minimizing porosity during laser beam welding of these
alloys. These included:
1) mechanically wire brushing followed by acetone cleaning prior to welding (performed at ARL
Penn State),
2) chemical milling using a 8% NaOH solution at 170"F (77"C) for 60 min. to remove 0.001 in.
(0.02 mm) per side (performed at ARL Penn State),
3) chemically milling using a 20% NaOH solution at 81 "F (27"C) for 45 rain. to remove 0.001 in.
(0.02 ram) per side (performed at Chem-Tron Company, Danbury CT),
13

4) chemically milling using a 32 percent NaOH solution at 210"F (99"C) for 5 min. to remove
0.005 in. (0.13 mm) per side (performed at Chemtronics Corporation, El Cajon, CA), and
chemical milling using a 32 percent NaOH solution at 210"F (99"C) for 10 rain. to remove 0.010
in. (0.25 ram) per side (performed at Chemtronics Corporation, El Cajon, CA).
Laser beam welds produced on lap configurations for material that was pretreated using the first four"
cleaning techniques exhibited large amounts of porosity. Metallographic analysis of numerous
longitudinal and transverse specimens removed from these welds had shown the vast majority of the pores
to be spherical with a shiny internal surface and approximately 0.005 to 0.030 in. (0.12 to 0.76 mm) in
diameter. The inability to produce porosity-free welds was also confirmed during analysis of the factorial
experiment conducted during process development on material treated by the frst two methods. Multipleregression analysis, at a 90 percent probability, showed that alloy combination had a major impact on
medium, large, and total porosity found in the laser welds. The analysis indicated that the alloycombination of 8090-T6 to 2090-T83 produced less porosity than the 2095-T6 to 2095-T8 combination.
Laser beam welds produced with material pretreated by the fifth cleaning treatment showed minimal
porosity based on metallographic analysis. These characteristics led to the belief that the porosity wasdue to entrapped hydrogen.
In conventional welding of aluminum it is generally agreed that weld porosity is due to hydrogen gas
being entrapped during solidification (Refs. 15). It has also been determined that a systems analysis maybe used to describe and control the amount of porosity in aluminum arc welds based on available
hydrogen sources (Ref. 16). This analysis has been extensively applied to various systems and typicallyresults in a primary source of hydrogen being responsible for weld porosity. Examples are the surface
of filler wire for gas metal arc welding of conventional wrought products and internal hydrogen for
powder metallurgy alloys and castings. This model for porosity is based on a relatively stable weld poolthat is governed by the extent of hydrogen absorbed from available sources and its ability to expelhydrogen pores prior to solidification. However, when a focused, high power laser beam is utilized for
welding, the material under the beam evaporates and forms a cavity referred to as a keyhole. As the heat
source moves along the base material the keyhole continually melts material at the front edge withsolidification occurring at the rear. The keyhole is maintained by balancing the hydrodynamic forces of
the pool with the vapor pressure within the cavity. Al_ough a complete treatise does not exist, results
of prior investigations have indicated that vaporization of volatile alloying elements, such as magnesium
and lithium, and keyhole instability may also be responsible for porosity during laser beam welding ofaluminum (Refs.17 and 18).
Thermally induced o_dafion during primary processing of aluminum-lithium alloys results in surface
reactions between metal and water vapor or H2. The reaction product, atomic hydrogen, is available fordissolution into the metal (Ref. 19). This results in increasing concentrations of hydrogen near the metal
surface until the maximum mutual solubility of H and Li is exceeded, and LiH is precipitated at grain
boundaries (Refs. 20-23). Lithium is also consumed in the near-surface metal creating a lithium depletedzone in conjunction with the formation of an atomic hydrogen and/or LiH enriched zone (Ref. 24). The
lithium depleted zone has been reported to be approximately 0.004 in. (100/_m) for alloy 8090; however,
since the process is diffusion controlled the width of the lithium depleted zone would be dependent on thethermal treatments used during processing, such as solution heat treatment (Ref. 25).
14
Variousprior investigatorshaveshownstrongcause-aM-effect relationships between the zone of atomic
hydrogen and/or LiH enrichment inherent in aluminum-lithium alloys and weld porosity. The earliest
indications of propensity for weld porosity for aluminum-lithium alloys was reported on the Soviet alloy 01420
(AI-5.0Mg-2.2Li) which was reviewed by Pickens (Ref. 26). Pickens reported that many of the Soviet weldinginvestigations determined the reason for high weld porosity associated with alloy 01420 is the surface reactivity
with ambient moisture, making pre-welding surface preparation critically important (Refs. 27-30). Similarresults have been reported in the United States for alloys 2090 and 2095. Martulcanitz, et al., found during
gas tungsten arc welding evaluations on 2090 alloy that porosity increased as the thickness of the material
decreased which he attributed to a hydrogen-enriched layer near the surface (Ref. 31). He also found that the
amount of porosity of butt welds in 0.063 in. (1.6 mm) thick 2090 decreased as the amount of surface was
removed by both chemical milling with NaOH and dry machining. Using reduction in joint strength andradiographic analysis as criteria, Martukanitz, et al., recommended removing 0.010 in. (0.25 mm) from each
side when welding 0.063 in. (1.6 mm) thick material and 0.004 in. (0.1 mm) from each side when welding
thicknesses approaching 0.126 in. (3.2 mm). Kerr and Merino found that dry mechanical milling to remove0.010 in. (0.25 mm) per side on 0.126 in. and 0.248 in. (3.2 mm and 6.3 mm) thick 2090 resulted in variable
polarity plasma arc welds that were radiographically acceptable (Ref. 32). They also found that theeffectiveness of the cleaning process was maintained for welds produced within 10 days of cleaning. Results
of welding investigations for alloy 2095 indicate that a standard chemical milling treatment, 30% NaOH
aqueous solution at 212"F (100"C) to remove the surface layer, may be used to produce porosity-free weldsby the gas tungsten arc welding process (Ref. 33). These earlier findings strongly support the contention that
the primary source of porosity formed at the interface during laser beam welding of these aluminum-lithium
alloys was the hydrogen-enriched region near the surface of the material. Removing this region by chemicalmilling 0.010 in. (0.25 ram) per side eliminated the primary source of hydrogen, and reduced the porosityfound at the interface.
It was also observed by metallographic analysis dtring this investigation that lap welds produced by laserbeam welding of the ahoy combination of 2095/2095 exhibit a greater number of pores at the interface than
the combination of 8090/2090 when insufficient pretreatments were used, such as with the first four cleaningtechniques described above. However, results of subsequent evaluations utilizing chemical milling of 0.010
in. (0.25 mm) per side indicated that the difference in weld porosity at the interface between the two alloy
combinations was greatly reduced when sufficient material was removed prior to welding. This is illustrated
in Figure 8 which shows the reduction of porosity at the interface for both alloy combinations when 0.010in. (0.25 mrn) per side was removed by chemical milling prior to welding. Since surface enrichment ofhydrogen is through diffusion it may be effected by both time and temperature during elevated processing,
such as solution heat-treating. Higher processing temperatures at longer times would result in a thicker
surface layer being enriched in hydrogen. A possible explanation for the greater amount of porosity at theinterface associated with the 2095-1'6 welded to 2095-T8 specimens may be the thermal processing used to
produce the material.
The results of radiographic analysis of shear tension test specimens and prototype panels showed linear
porosity at the root of all of the laser beam welds. Radiographic analysis of the fractured shear tension test
specimens indicated that although porosity at the interface of the stiffener and skin was dramatically reduced
by chemical milling 0.010 in. (0.25 mm) per side prior to welding, linear porosity continued to be exhibitedin the root of the weld. This is illustrated in Figures 12 flu'ough 17, which represent photographs of
radiographs for the fractured shear tension test specimens of both alloy combinations that were chemicallymilled 0.001, 0.005, and 0.010 in. (0.02, 0.13, and 0.25 mm) prior to welding. The radiographic image
to the right in the photographs represent the weld through the stiffener-sheet, and the image on the left isof the partial penetration of the skin. As seen in the photographs, chemical milling of 0.005 in (0.13 mm)
15
for the 8090/2090 combinations and 0.010 in (0.25 mm) for the 2095/2095 greatly reduced porosity at theinterface (images on h_e right). However, gross, linear porosity was evident in the root of the welds (images
to the left) regardless of alloy combinafon or amount that had been chemically milled prior to welding. Itappears that the linear porosity associated with the weld-root in the skin is process related. The dark
coloration and non-symmetrical shaped exhibited by some of these pores during subsequent metallographicanalysis suggest that the linear porosity may be due to vaporization of low-vapor point constituents such as
lithium, which may lead to keyhole instability. Further investigations would be required to determine therelationship between the primary process variables and the linear porosity found in the weld-roots.
3.3 Mechanical Properties
The results of tensile tests performed on the 0.120 in. (3.0 mm) thick 2090-183 and 2095-I"8 face-sheet
having partial penetration welds are shown in Table VIII and Table IX for both alloys. Also included in theTables are tensile test results for unwelded base metal. The mean of five samples for ultimate tensile
strength across the partial penetration welds of 2090-183 was 61.6 KSI (425 MPa) as compared to the
average base metal strength of 80.4 KSI (555 MPa) for 2090-183. The mean of five samples representingpartial penetration in the 2095-18 was 58.8 KSI (406 MPa) and exhibited an average base metal strengthof 89.9 KSI (620 MPa). The standard deviation around the mean values of ultimate tensile strength across
the partial penetration welds for both alloys were approximately 3 KSI (23 MPa). The percent elongation,
in 1.0 in. (2.54 cm) gage length, measured across the partial penetration welds were significantly less thanthe unweided base metal. The mean elongation for the welds on 2095-18 material was 0.8 percent and noappreciable elongation was observed for the partial penetration welds on 2090-18 material. In all cases for
the 2090-183, and one case for the 2095-18, yield strength was not obtained due to failure occurring priorto reaching the 0.2 percent off-set. All failures occurred at the interface between the fusion zone of the
partial penetration weld and the heat affected zone and is representative of these alloys. The low elongation
measured in these samples is not surprising, since aluminum alloys containing high levels of copper typicallyexhibit low elongations across the weld. Also, the percent elongation measured from tensile tests is notalways a good indication of joint ductility.
The values for ultimate tensile strength discussed above represent a joint efficiency of 77 percent for 2090-
183 and 65 percent for 2095-T8 for the partial penetration welds; however, comparison of joint efficiencies
should not be made between the two alloys based on these values. The strength across the partial penetration
welds of the 2090-183 represented penetration of 40 percent of the thickness; whereas, the partial penetration
of the 2095-18 exhibited 60 percent penetration. This is illustrated in the photomacrographs of the lap-weldsprior to removal of the top-sheet in Figure 18. The deeper penetration associated with the 2095-18 would
be indicative of higher thermal profiles in the heat affected zone and greater degradation of properties in this
region. Because of this, a valid comparison of joint efficiencies associated with the partial penetration weldsof both alloys could not be made.
Results of shear tension tests to measure shear strength at the interface for lap-welds of both alloyscombinations are shown in Tables XI and XII for samples retained by ARL Penn State. As mentioned earlier,alloy combinations of 8090-T6 to 2090-183 and 2095-T6 to 2095-18 in two face-sheet thicknesses were
produced from material that had been chemically milled 0.001, 0.005, and 0.010 in. (0.02, 0.13, 0.25 mm)
prior to welding. The test results shown in tables XI and XII represent the 0.050 in. (1.3 ram)thick 8090-T6to 0.120 in. (3.0 mm) thick 2090-183 and 0.068 in. (1.7 mm) thick 2095-'I"6 to 0.120 in. (3.0 mm) thick 2095-
16
I"8specimensretainedby ARL Penn State. The 0.050 in.91.3mm) thick8090-T6 to0.095 in.(2.4mm)
thick2090-I"83and 0.068 in.(1.7ram)thick2095-T6 to0.095 in.(2.4mm) thick2095-I"8specimenswere
forwarded to NASA Langley Research Center for tension shear tests.
The results indicate appreciably higher weld shear strengths are achieved with the 2095-T6 to 2095-T8 alloycombination when compared to 8090-T6 to 2090-T83. Regression analysis at a 90 percent probability showedno discernible differences in shear strength of the lap-welds that could be attributed to the amount of material
removed by chemical milling for either alloy combination. Therefore, the shear strength values for all samples
representing each alloy combination were grouped for comparison. The mean value, representing ninesamples, for shear strength of the 0.050 in. (1.3 nun) thick 8090-T6 to 0.120 in. (3.0 ram) thick 2090-'1"83was 11.7 KSI (81 MPa) with a standard deviation of 1.1 KSI (8 MPa). The mean shear strength for nine
samples of 0.068 in. (1.7 nun) thick 2095-'1"6 to 0.120 in. (3.0 ram) thick 2095-1"8 was 18.8 KSI (130 MPa)with a standard deviation of 2.4 KSI (17 MPa). The mean shear strength of 18.8 KSI (130 MPa) for the 2095-
T6 to 2095-I'8 alloy combination is comparable to the minimum shear strength of 16 KSI (110 MPa) reportedfor aluminum alloy 2319 (Ref. 30). The high shear strength displayed by the 2095-T6/2095-T8 combinationis believed to be attributed to the ability of the alloy to precipitation strengthen after welding.
3.4 Weld Characterization
The hardness measurements across the partial penetration welds at various times after welding for 2090-T83
and 2095-1"8 are shown in Figure 13 and Figure 14, respectively. It appears from the profiles that a minorincrease in hardness occurs after welding the 2090-I'83 alloy; however, the increase in hardness after welding
of 2095-T8 is appreciable. The fusion zone of the 2095-'1"8 had increased from approximately 75 VHN to 100
VHN within 220 hours after welding. A similar increase was found in the heat affected zone of alloy 2095-T8after 220 hours. This is due to the ability of 2095-T8 to precipitation strengthen, or naturally age, after
welding. Within the fusion zone and at positions in the heat affected zone experiencing high elevated
temperatures, strengthening precipitate undergo dissolution. Upon cooling, strengthening particles will
continue to precipitate within the matrix and the degree of strengthening will be primarily governed by thekinetics of the precipitation reaction. The ability of alloy 2095-1"8 to nalm'ally age after welding is greatlyresponsible for the increased weld shear strength exhibited by this alloy. This phenomena should also result
in higher strength across the partial penetration welds of 2095-I'8 when compared to 2090-'I'83; however,because of unequal penetration between the two alloys evaluated, this was not confirmed.
Analysis of fraetttre surfaces of the samples used to measure strength across the partial penetration of the face-sheet and weld shear strength of the interface was conducted. Scanning electron microscopy was utilized to
examine the fracture surfaces of the partial penetration welds that were tensile tested. The scanning electron
microscope images of the fusion zone appeared similar for 2090-T83 and 2095-T8; however, the appearanceof the fracture surface encompassing the heat affected zone beneath the partial penetration varied between the
alloys. Representative scanning electron photomicrographs are shown in Figure 18 and Figure 19 for 2090-'I"83 and 2095-'1"8, respectively. The heat affected zone, shown below the fusion zone in the figures, tendedto exhibit a striated structure for 2090-'1"8; whereas, the heat affected zone for the 2095-T8 displayed a
granular appearance with some evidence of striations near the fusion zone interface. Microporosity was
present in the partial penetration welds representing both alloys.
17
Visualexamination of the fracture surfaces of the samples used to determine weld shear strength was used to
ascertain the effectiveness of chemical milling 0.001, 0.005, 0.010 in. (0.02, 0.13, and 0.25 nun) foreliminating porosity. This examination indicated that weld porosity at the interface was virtually eliminated
for all degrees of chemical milling of welds representing 8090-T8 to 2090-T83. One pore, greater
approximately 0.020 in. (0.51 mm) in diameter, was found in each group of 8090-T6 to 2090-'1"83 samplesthat had been chemical milled 0.001, 0.005, and 0.010 in. (0.02, 0.13, and 0.25 nun) per side. All othersamples of 8090-'1"6 to 2090-T83 showed no porosity. Conversely, the 2095-T6 to 2095-T8 welds exhibited
an average of 3 pores at the interface, approximately 0.020 in. (0.51 nun) in diameter, per sample whenchemically milled to remove 0.001 and 0.005 in. (0.02 and 0.13 ram) per side. The number of pores at thefracture surface of the 2095-T6 to 2095-T8 was seen to decrease when chemically milled to remove 0.010 in.
(0.25 mm) per side to an average of one pore per sample. The level of porosity associated with the fracture
surfaces of the 2095-T6 to 2095-'1"8 tension shear test samples did not appear to dramatically effect the shearstrength. Multiple regression analysis of shear strength (as the dependent variable) as a function of weld shear
area and number of pores (as independent variables) could not establish a strong statistical relationship for the2095-T6 to 2095-T8 tension shear test samples.
4.0 CONCLUSIONS
An evaluation to determine the feasibility of laser beam welding of aluminum-lithium alloys for cryogenictankage alloys has been completed. Conclusions based on the results of this evaluation are shown below forthe three major categories investigated:
4.1 Laser Beam Welding Process Evaluation
1)
2)
3)
4)
Laser beam welding is a feasible joining technique for producing ahuninum-lithium built-up structures.
Adequate penetration may be produced on the alloys at power levels of 5 to 7 kW and travel speedsof 150 to 160 IPM (6.4 to 6.8 cm/s),
The laser beam welding process provided accessibility such that lap-welds may be produced very nearthe edge of the vertical member on the stepped-hat stiffeners of the prototype panels,
The high processing speeds demonstrated during the program may be directly related to highproduction rates and low cost operations,
Adequate clamping force between the stiffener and skin was critical in achieving consistent weld
quality along the length of the stiffeners. Adequate clamping force improves the quality of the weldsurface but does not eliminate internal porosity.
18

4.2 Pretreatment and Porosity Evaluation
1)
2)
3)
Aggressive pretreatment in the form of alkaline chemical milling was required to reduce porosity at
the weld interface (between the stiffener and skin) but does not eliminate porosity associated with theroot of the weld.
The porosity at the weld interface (between the stiffener and skin) appears to be due to the hydrogen
enriched layer associated with these alloys while the porosity at the weld-root appears to be processrelated.
Removing 0.001, 0.005, and 0.010 in. (0.02, 0.13, and 0.25 ram) per side by chemical milling didnot appear to affect the overall shear strength of the weld.
4.3 Mechanical Property Characterization
1)
2)
3)
Tensile tests of laser beam welds representing partial penetration of the face-sheet provided a joint
efficiency of 77 percent (at 40 percent through-thickness penetration) for 2090-T83 and 65 percent (at60 percent through-thickness penetration) for 2095-T8.
The alloy combination of 2095-T6 to 2095-T8 exhibited much higher weld shear strength at the
interface when compared to the combination of 8090-'1"6 to 2090-T83. The average shear strength ofwelds between 2095-T6 to 2095-T8 was 18.8 KSI (130 MPa) as compared to an average shear strength
of 11.7 KSI (81 MPa) for 8090-T6 to 2090-'1"8 combination,
The improved shear strength of the 2095-T6 to 2095-T8 combination is believed to be due to the
ability of alloy 2095 to precipitation strengthen or mlurally age after welding,
RECOMMENDATIONS
Based on the results of this initial investigation to determine the feasibility of laser beam welding aluminum-
lithium alloys for cryogenic tankage applications, it is recommended that further evaluations be conducted.
Laser beam welding has demonstrated the ability of offering high production rates, and possibly lower cost,for joining of stiffeners to face-sheet. Extrinsic pro_ss development, such as fixture and joint design, should
be optimized for laser beam welding of larger prototype panels. Modification of processing parameters, suchas the addition of filler metal and alternate shielding gas arrangements, should be investigated for reducing
weld-root porosity.
Direct comparison of laser beam welded and resistance welded structures should then be performed to ascertain
structural integrity, quality, and costs assoeiated with these processes. The need to aggressively, chemically
pretreat aluminum-lithium alloys for minimizing weld porosity at the interface should also be quantified if theyare to be accepted for welded, aerospace applications.
19
6.0 REFERENCES
.
.
.
.
.
.
.
.
.
10.
11.
12.
13.
14.
Proceedin_ of the Conference on Advanced Aluminum Technoiozy for Cryogenic Tank Application_,NASA Langley Research Center, Hampton, VA, 1987.
General Dynamics Space Systems, "Space Transportation Architecture Study," Report GDSS-STAS-87-002, 1987. -
Tack, W. T. and L. W. Loechel, "Weldalite" 049: Applicability of a New High Strength, WeldableAl-Li-Cu Alloy," Aluminum-Lithium Alloys. Proceedinzs of the Fifth International Aluminum-Lithium
Conference, Vol. HI, Materials and Component Engineering Publication Ltd., Birmingham, UK, 1989,p. 1462.
Anton, C. E., Rasmussen, P., Thompson, C., Latham, R., Hamilton, H., Ren, B., Gandhi, C, andHardwick, D., "Low Cost, SPF Aluminum Cryogenic Tank Structure for ALS," NASA Contractor
Report 189654, Under Contract NAS1-18590 to Rockwell International North American Aircraft,NASA Langley Research Center, Hampton VA, 1992.
Cross, C. E., Tack, W. T., "Selection and Weldability of Aluminum-Lithium Alloys,"Handbook-Vol. _i, ASM International, Materials Park, OH, 1993.
W. E. Quist and G. H. Narayanan, "Aluminum-Lithium Alloys," Treatise on Mat. Sci. and Tech.,vol. 31, pp. 219-254, 1989.
T. J. Langan and J. R. Pickens, "Idenlification of Strengthening Phases in the Ai-Cu-Li AlloyWeldaliteTM 049," Proc. 5th Int. Al-Li Conf., Williamsburg, pp. 691-700, 1989.
Martukanitz, R. P., Natalie, C. A., and Kax_fel, J. O., "The Weldability of an Al-Cu-Li Alloy,"_, Vol. 39 (11), 1987, p. 42.
Molian, P. A. and T. S. Srivatsan, "Weldability of AI-Li-Cu Alloy Using Laser Welding,"Proceedings of the Fifth International Aluminum-Lithium Confererl¢_, Vol. III, Materials andComponent Engineering Publication, Ltd., UK 1989, p. 1439.
Martuimnitz, R. P., Natalie, C. A., and Knoefel, J. O., "The Weldability of 2090 (An AI-Li-CuAlloy)," ].9.1Kllal._9..f.._, Vol. 39 (11), 1987, p. 38.
Pickens, J. R., "The Weldability of Lithium-Containing Aluminum Alloys," Journal of Matcri_llScien_, Vol. 20, 1985, p. 4247.
Fridlyander, I. N., et al., Translated from Metallovendenie i Termicheskaya Obrabotim Metallov (3),1975, p.53.
Pickens, J. R., "The Weldability of Lithium-Containing Aluminum Alloys," Journal of MaterialSeien_, Vol. 20, 1985, p. 4247.
Martulmnitz, R. P., Natalie, C. A., and Knoefel, J. O., "The Weldability of 2090 (An Al-Li-CuAlloy),"/I/It[IIaL.9.LI_, Vol. 39 (11), 1987, p. 38.
20
15.
16.
17.
18.
19.
26.
27.
28.
9,
0.
Howden, D. G. and MiMer, D. R., "Hydrogen Absorption in Arc Welding," British Welding _I0_'nal, Vol.
10, 1963, p. 304.
Martukanitz, R. P. and Michnuk, P. R., "Sources of Porosity in Gas Metal Arc Welding of Aluminum,"
_num, Vol. 58 (5), 1982, p.276.
Marsico, T. A. and Kossowsky, R., "Physical Properties of Laser Welded Aluminum-Lithium Alloy 2090,"
Proceedin_ of the Fifth International Aluminum-Lithium Conference, Materials and ComponentsEngineering Publications, Ltd., Birmingham (UK), 1989, p. 1447.
Katayama, S., Ludwin, C. D., Danko, L C., and McKay, T. D., "Laser Weldability of Aluminum Alloys,"Conference Proceedin_ of Recent Trends in Welding Science and Technology, ASM, 1990, p.687.
Dickenson, R. C., Wefers, K., and Lawless, K. R., "Internal Lithium Hydride Precipitation in AI-
Li Alloys," Proceedin_ of the Fifth International Aluminum-Lithium Conference, Materials andComponent Engineering Publications Ltd., Birmingham (UK), 1989, p. 1337.
Dickenson, et al., op cir., p. 1339.
Bavarian, B., Becket, J., Parikh, S. N., and Zamanzadeh, M., "Localized Corrosion of 2090 and
2091 Al-Li Alloys," proceedin_ of the Fifth International Aluminum-Lithium Conference, Materialsand Component Engineering Publications Ltd., Birmingham (UK), 1989, p. 1231.
Fridlyander, I. N., Metal Oved. Term. Obrab. Met., (4), 1970, p. 44.
Wefers, K and Mozelewski, F. A., "Surface Chemistry of Al-Li-Cu Alloys," Proceedin_ of the 8thInternational Light Metals Conference, 1987.
Dickenson, op cit., p. 1339.
Roth,A. and Kaesche,H. "ElectrochemicalInvestigationofTechnicalAluminum-LithiumAlloys,"
Proceedin_ of theFifthInternationalAluminum-Lithium Conference,Materialsand Component
EngineeringPublicationsLtd.,Birmingham (UK), 1989,p. 1215.
Pickens,J.R., "The Weldabilityof Lithium-ContainingAluminum Alloys,"Journalof Materials
Science,Vol.20, 1985,4247.
Mironenko, V. N., Evstifeev,V. S., Lubenets,Karshukova,S. A., Zakherov, V. V., and
Litvintsev,A. I.,Welding Production,EnglishTranslation),Vol.26 (I),1979,p. 30.
Mironenko, V. N., Evstifeev,V. S.,and Korshunkova,S. A., Welding Production,Vol.24 (12),
1977, p. 44.
Fedoseev, V. A., Ryazansev, V. I., Shiyaesa, N. V., and Arbuzov, Yu. P., ibid., Vol. 12 1979)19, Translation of Svar. Proizvod. (No. 6, 1978) p. 15.
Kainova, G. E. and Malinkim, T. I., Metal Science of Heat Treating Metall. Oved. Termi. Obrab.
Met.) (No. 2 1968)22, Translationp. 104.
21
31.
32.
33.
4.
Martukanitz, R. P., Natalie, C. A., and Knoefel, J. O., "The Weldability of 2090 (An Al-Li-CuAlloy),"_, (ll),1987,p. 38.
Kerr, J. R. and Merino, R. E., "CryogenicPropertiesof VPPA Welded Aluminum-Lithium
Alloys,"Proceedin_ of the FifthInternationalAluminum-Lithium Conferenc:_,Materialsand
Component EngineeringPublicationsLtd.,Birmingham (UK), 1989,p. 1491.
Kramer, L. S. and Pickens, J. R., "Microstructure and Properties of a Welded Al-Cu-Li Alloy,"Welding Journal-Research Supplement, Vol. (4), 1992, p. 115-s. ..
Nelson, F. G. and R. L. Rolf, "Shear Strength of Al Alloy Fillet Welds," Weldine Journal-ResearchSupplement, Vol. 45 (2), 1966, p. 82s.
22
:: :_ ::_: _ 7.0 HGURES AND TABLES
23
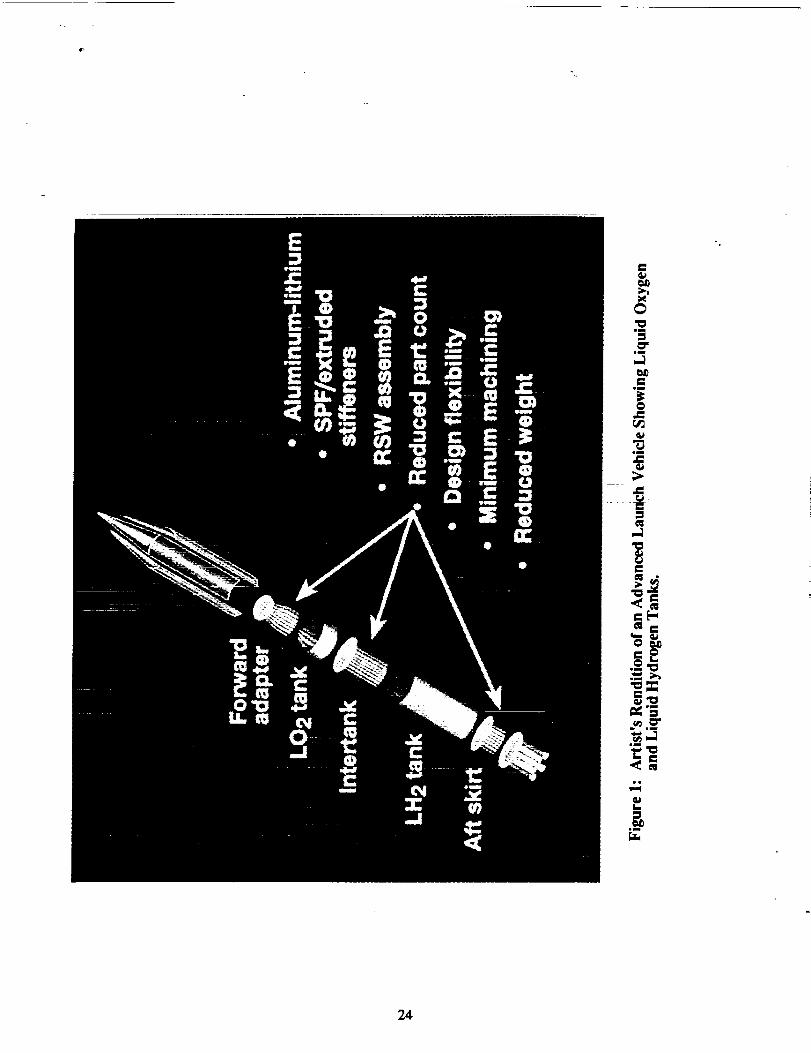
_JD
II
Jm
Im
0
r_
m
am
mm
r_
24

SUPERPLASTICALLY FORMED (SPF)STIFFENERS
JOINT DETAILS
\SKIN
Figure 2: Cross-section of One Concept That Has Been Proposed forProducing the Built-Up Structure.
25

if)
t-
r-
E
r-.n
O
60
50m
40 m
ElectronBeam Welds
I Laser Beam IWelds
Gas TungstenArc Welds Gas Metal 1
Arc Welds
Welding Conditions
Figure 3: A Comparison of Ultimate Tensile Strength of Butt-Welds in Alloy2090-T83 Produced Using Various Welding Processes (Refs. 8 and 9).
26

I-
_CI-
I-
J _.r
I-
27

TROUGH
FLEX.COVER
MS
BEAM
I
SUPPORTS
Figure S: Schematic of Laser Articulating Robotic System (LARS) Used forLaser Beam Welding Program.
28

IncomingBeam
fl 0 SphericalFocusing Mirror
Yaw Axis
Pitch Axis
Turning MirrorBeam Positioning
Mirror
Figure 6: Optical Arrangement Used for the Laser Articulating RoboticSystem (LARS).
29

Inconel ClampingBars
"_ Clamping Force
Bronze Backing PlateSheet Specimens forProducing Lap Welds
Figure 7: Clamping Arrangement Utilized for Initial Process ParameterDevelopment for Lap-Welds.
30

30
25
"_ 20f=o_ 15_,1
13.10
o5
8090-T6/2090-T83
2095-T6/2095-T8
I I • I I "t"
0.000 0.002 0.004 0.00S 0.008 _ 0.0!0
Amount Removed Per Side (in.)
0.012
Figure 8: Amount of Porosity Associated With the Interface of Laser BeamWelded Samples that had been Chemically Milled VariousAmounts Prior to Welding.
31

Figure 9: Photographs of 2095-T6 to 2095-T8 Laser Beam Weld SpecimensAfter Dye Penetrant Testing Showing Degree of Porosity at theInterface Associated With Chemical Milling of 0.001, 0.005,and 0.010 Inch (0.02, 0.13, and 0.25 ram) Per Side.
32
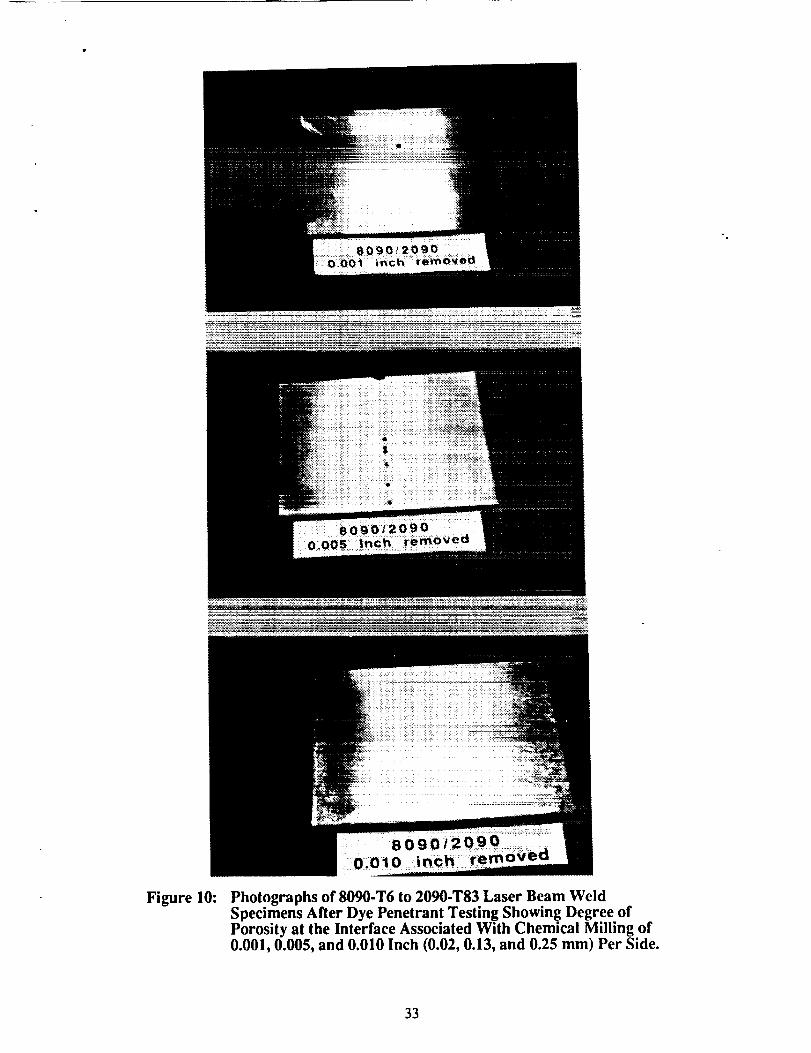
Figure 10: Photographsof 8090-T6to 2090-T83Laser BeamWeldSpecimensAfter DyePenetrantTestingShowingDegreeofPorosity at the Interface AssociatedWith Chemical Milling of0.001,0.005,and 0.010Inch (0.02,0.13,and 0.25ram) Per Side.
33

T
¢_1
I-"
!
_o
Iex.
E ..
_Dg_
i.
z_
om_m
o
E
mm
0
0,g
cIIr._
_D
0
lm
uq
llam
If,
34

o
35

....... z:._:J2--__
..... L'7 ...........
- _ H v
Ii i '_
N

37

el
om t_
-t_ Dm
im
1_ tm
|
38

J
_:_-.-
E_
"T..=
39
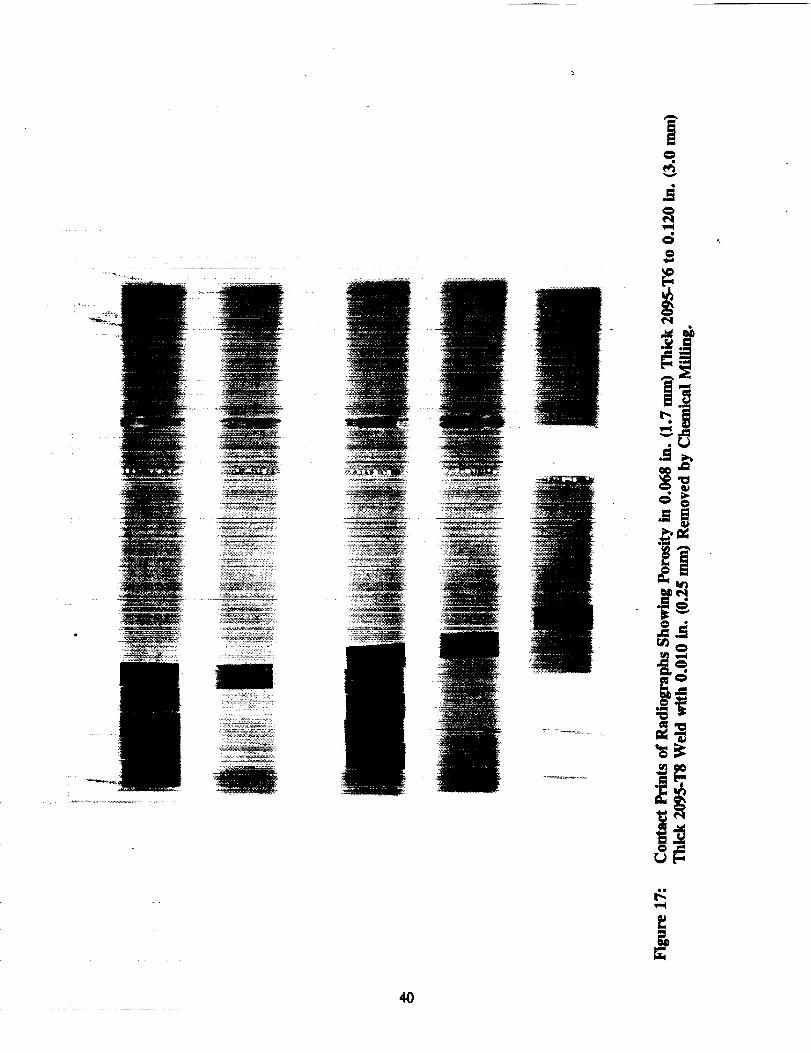
_g
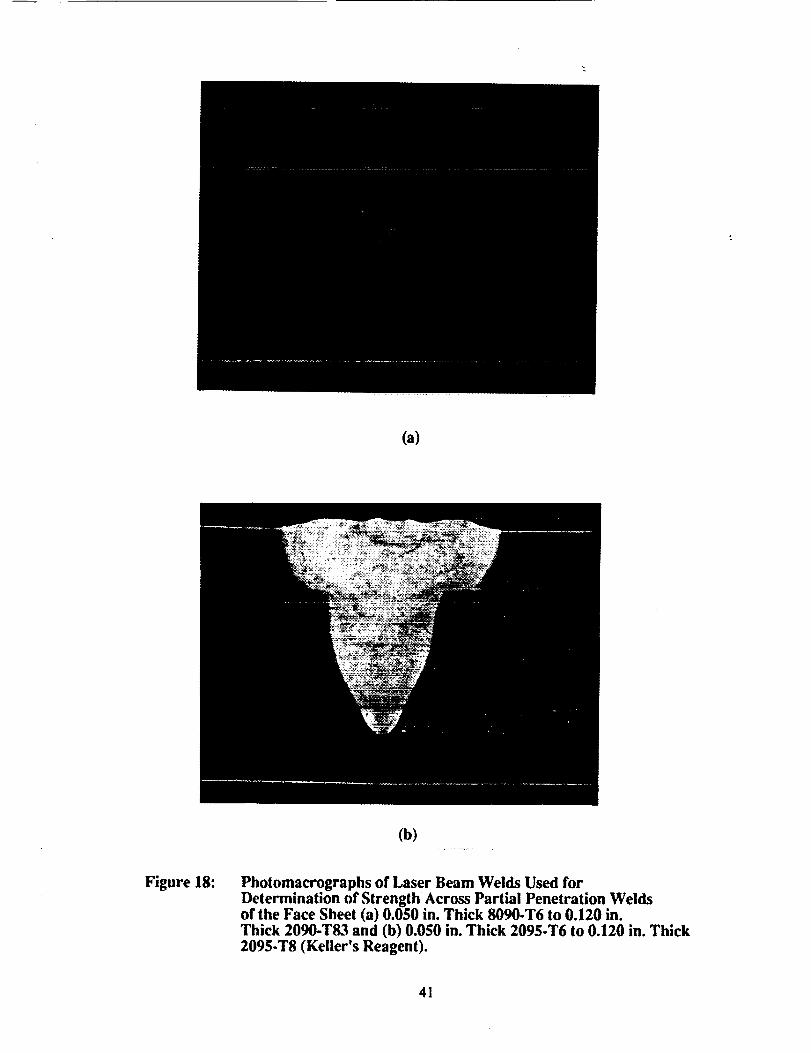
(a)
Figure 18:
(b)
Photomacrographs of Laser Beam Welds Used for
Determination of Strength Across Partial Penetration Weldsof the Face Sheet (a) 0.050 in. Thick 8090.T6 to 0.i20 in.Thick 2090-T83 and (b) 0.050 in. Thick 2095-T6 to 0.120 in. Thick
2095-T8 (Keller's Reagent).
41

A
z-1-
2
I[
240
200
160
120
8O
4O
t FZ
HAZ
-'-"='-- 2090-T83 (4 Hrs.)
--'--'e,-- 2090-T83 (24 Hrs.)
----o--- 2090-T83 (72 Hrs.)
2090-T83 (220Hrs.)
I I I I
0 1 2 3 4 5
Distance (ram)
Figure 19: Hardness Profile Across Fusion Zone (FZ) and Heat Affected Zone(HAZ) of the Partial Penetration Weld in 2090-T83 at Various
Times After Welding.
42
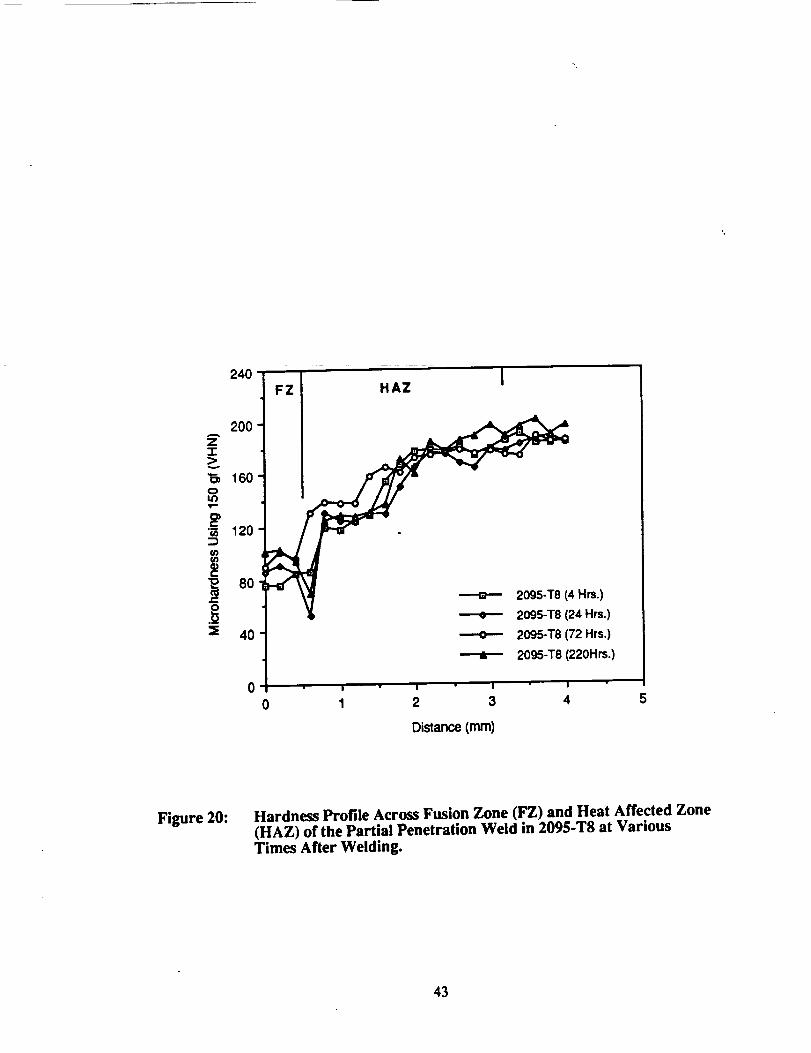
A
Z"i-
v
ot_1"
6
240
200
160
120
8O
4O
FZ HAZ
---=--- 2095-T8 (4 Hrs.)
---e--- 2095-T8 (24 Hrs.)
---o--- 2095-T8 (72 Hrs.)
2095-T8 (220Hrs.)
; I I I I
0 1 2 3 4 5
Distance (mm)
Figure 20: Hardness Profile Across Fusion Zone (FZ) and Heat Affected Zone
(HAZ) of the Partial Penetration Weld in 2095-T8 at VariousTimes After Welding.
43
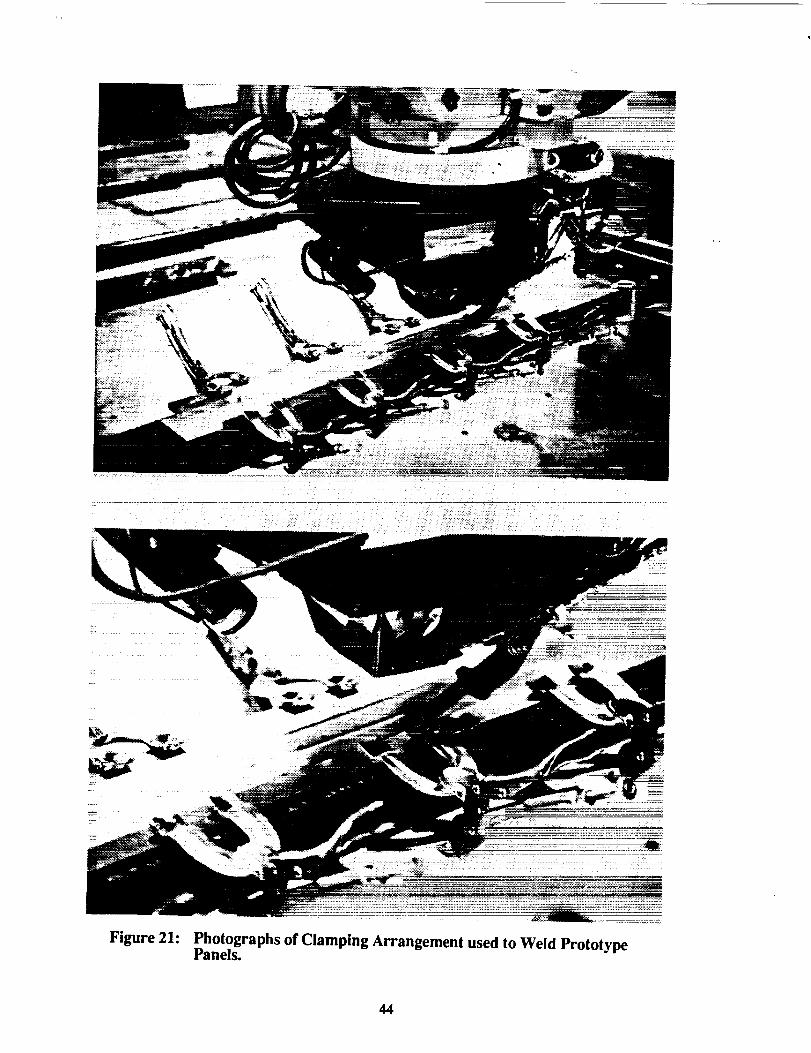
Figure 21: Photographs of Clamping Arrangement used to Weld PrototypePanels.
44
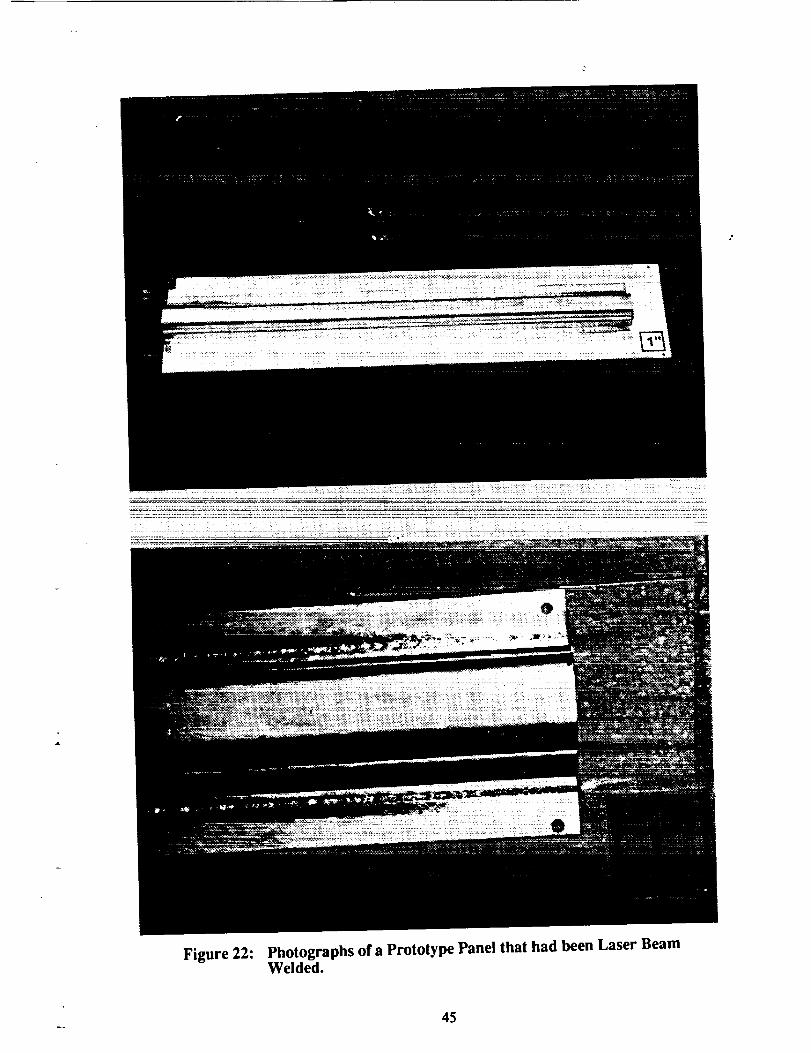
Figure 22: Photographsof a PrototypePanel that had beenLaser BeamWelded.
45--.

(a)
)p
(b)
Figure 23: Macrographs of Cross-Sections of Prototype Panels: (a) 8090-T6 to2090-T83 and (b) 2095.T6 to 2095-T8.
46

47
i
w _
llm
• b. oI_D _nO
romp

48
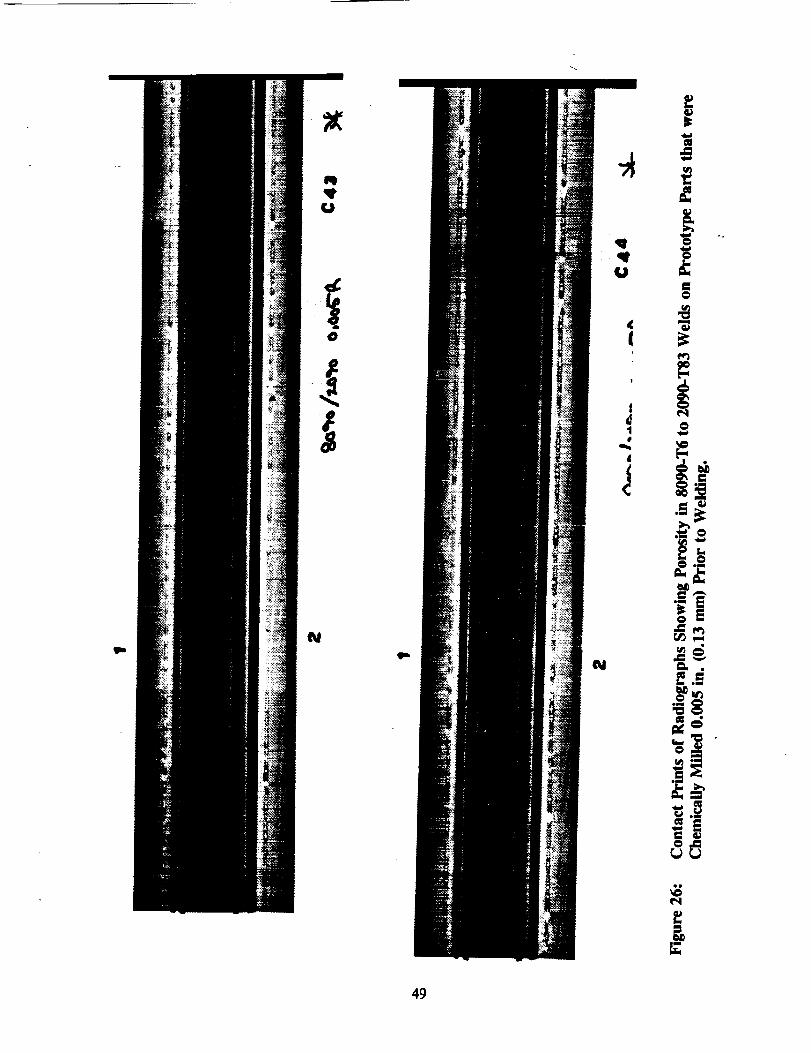
N
!
N
o=
o
iml
_D
49

1.,
.,_q_
C_ mimu_mu
oum
_u
5O

p
Figure 28: Scanning Electron Micrographs of Fracture Surface of PartialPenetration Welds of 2090-T83 After Tensile Testing.
51
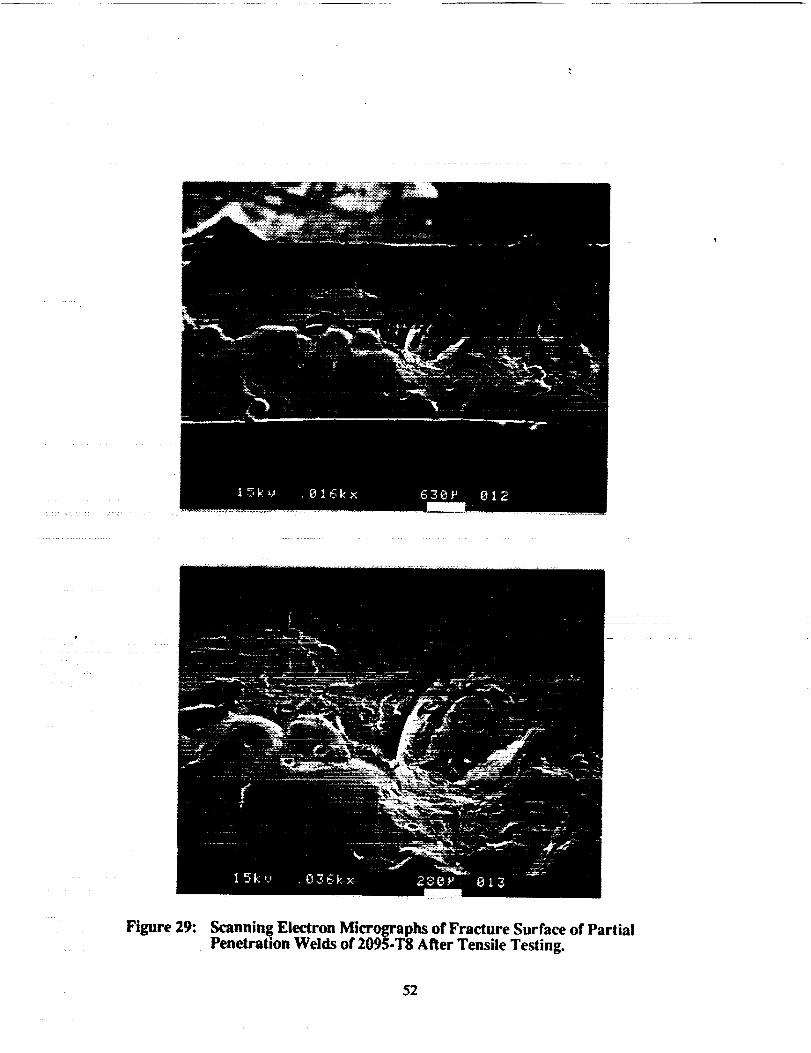
¢
Figure 29: Scanning Electron Micrographs of Fracture Surface of Partial
Penetration Welds of 2095-T8 After Tensile Testing.
52
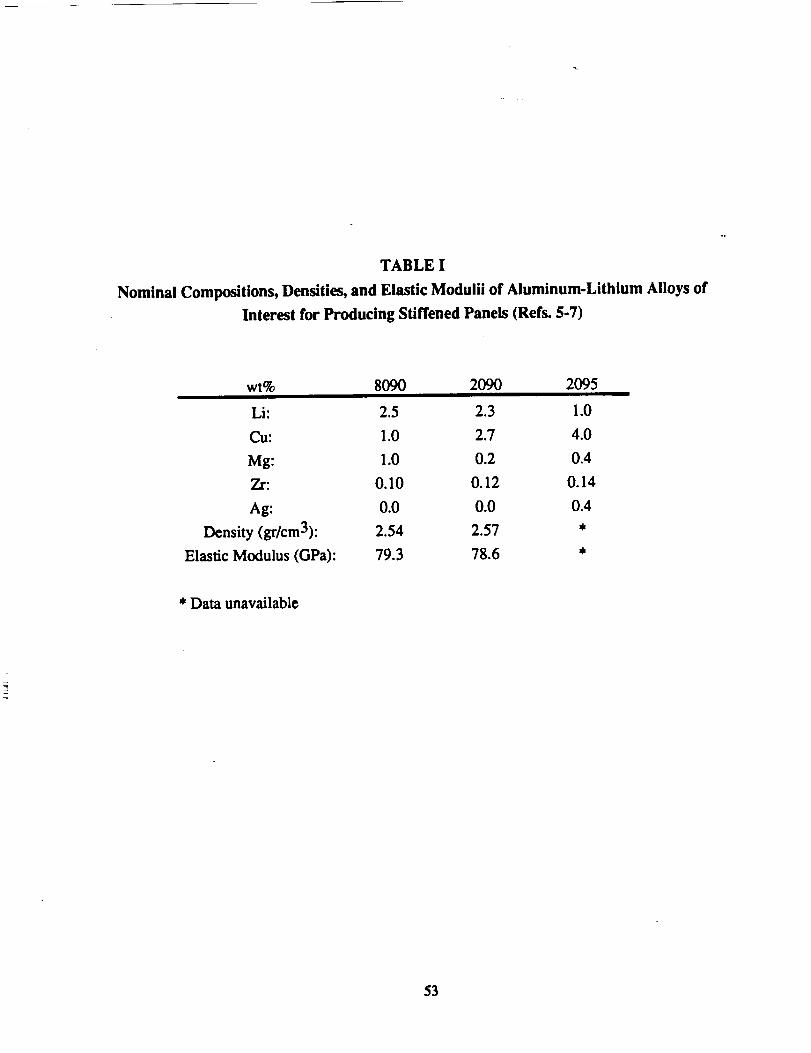
TABLE I
Nominal Compositions, Densities, and Elastic Modulii of Aluminum-Lithium Alloys of
Interest for Producing Stiffened Panels (Refs. 5-7)
wt% 8090 2090 2095
Li: 2.5 2.3 1.0
Cu: 1.0 2.7 4.0
Mg" 1.0 0.2 0.4
Zr: 0.10 0.12 0.14
Ag: 0.0 0.0 0.4
Density (gr/cm3): 2.54 2.57 *
Elastic Modulus (GPa): 79.3 78.6 *
* Data unavailable
53

TABLE II
Alloy and Thickness Combinations for Stiffeners and Skin-Sheet
That Were Initially of Interest
StiffenerAlloy
8090-T6
8090-T6
2095-T6
2095-T6
Stiffener Thickness Face-Sheet Alloy
in. (mm) in.
0.050 (1.3) 2090-T83 0.095
0.050 (1.3) 2090-T83 0.120
0.050 (1.3) 2095-T8 0.095
0.050 (1.3) 2095-T8 0.120
Face-Sheet Thickness
(ram)
(2.4)
(3.2)
(2.4)
(3.2)
54

TABLE III
Welding Parameters Identified During Initial Process Development
Beam Power:
Processing Speed:
Shielding Gas:
Shielding Arrangement:
Optical Parameters:
Stand-off Distance:
6.5 to 7 kW at the source
150 to 170 IPM (6.4 to 7.2 cm/s)
200 CFH (94.4 1/min.) Helium
Helium supplied by a 0.375 in. (9.5 ram)inside-diameter nozzle at leading edge
fl0 p_bolic focus lens
6.0 in. (15.2 cm) from work-piece to weldinghead
55

56

! °°
57
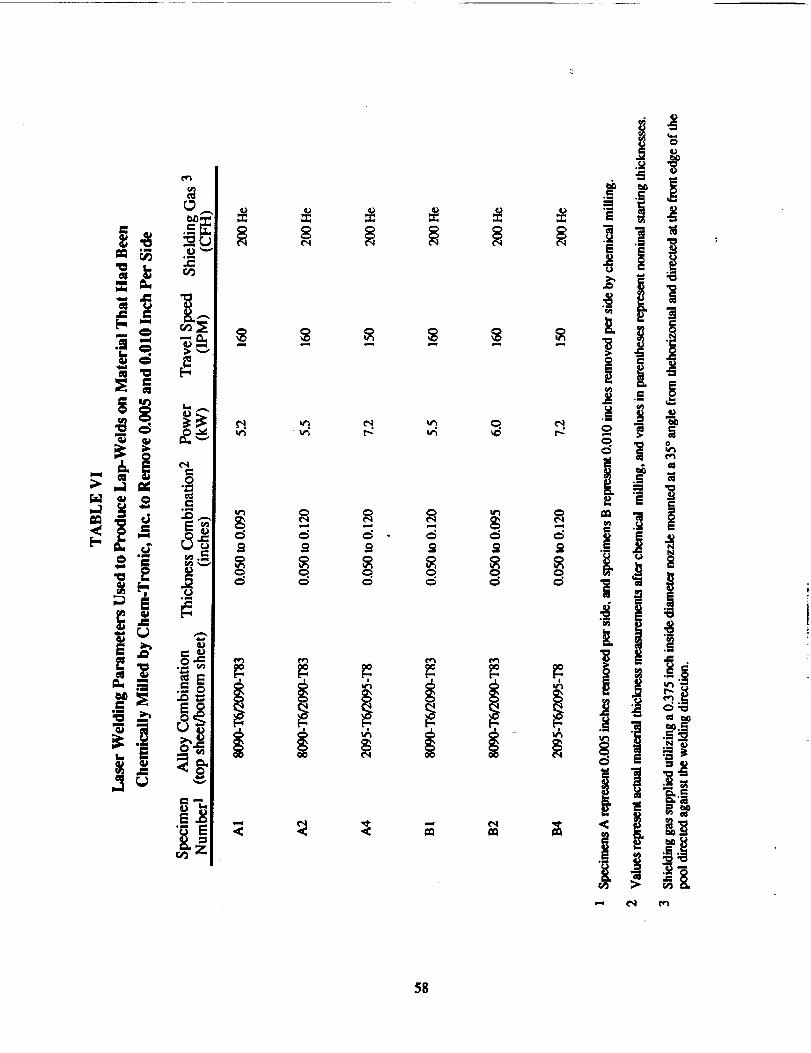
58

TABLE VII
Laser Beam Welding Parameters for Producing Specimens Used to Obtain
Weld Shear Strength of 8090-T6 to 2090-T83
SpecimenNumber
C-1-1"
C-1-2"
C-1-3"
C-2-1"
C-2-2"
C-2-3"
C-3-1"
C-3-2"
C-3-3"
C-1-4
C-1-5
C-1-6
C-2-4
C-2-5
C-2-6
C-3-4
C-3-5
C-3-6
Alloy CombinationTop Sheet/
Bottom Sheet
8090-Tt/2090-T83
8090-T6/2090-T83
8090-T6/2090-T83
8090-T6/2090-T83
8090-T6/2090-T83
8090-T6/2090-T83
8090-T6/2090-T83
8090-T6/2090-T83
8090-T6/2090-T83
8090-T6/2090-T83
8090-T6r2090-T83
8090-T6
8090-T6
8090-T6
8090-T6
8090-T6
r2090-T83
r2090-T83
r2090-T83
r2090-T83
r2090-T83
8090-T6/2090-T83
8090-T6/2090-T83
Thickness Amount Power SpeedCombination Removed per (kW) (IPM)
(in.) Side (in.)
0.050 to 0.095 0.001 5.7 160
0.050 to 0.095 0.001 5.3 160
0.050 to 0.095 0.001 5.3 160
0.050 to 0.095 0.005 5.0 160
0.050 to 0.095 0.005 5.0 160
0.050 to 0.095 0.005 5.0 160
0.050 to 0.095 0.010 5.0 160
0.050 to 0.095 0.010 5.0 160
0.050 to 0.095 0.010 5.0 160
0.050 to 0.120 0.001 5.3 160
0.050 to 0.120 0.001 5.3 160
0.050 to 0.120 0.001 5.3 160
0.050 to 0.120 0.005 5.1 160
0.050 to 0.120 0.005 5.6 160
0.050 to 0.120 0.005 5.6 160
0.050to0.120 0.010 5.5 160
0.050to0.120 0.010 5.5 160
0.050to0.120 0.010 5.5 160
* Samples forwarded to NASA Langely Research Center. All other specimens retainedat ARL Penn State for tension shear testing.
Note: Shielding gas supplied utilizing a 0.375 inch inside diameter nozzle mounted at a 35 ° anglefrom the horizontal and directed at the front edge of the pool directed against the weldingdirection.
59

TABLE VHI
Laser Beam Welding Parameters for Producing Specimens Used to Obtain
Weld Shear Strength of 2095-T6 to 2095-T8
SpecimenNumber
C-1-7"
C-1-8"
C-1-9"
C-2-7"
C-2-8"
C-2-9"
C-3-7"
C-3-8"
C-3-9"
C-1-10
C-I-11
C-1-12
C-2-10
C-2-11
C-2-12
_C'3-10
C-3-11
C-3-12
Alloy CombinationTop Sheet/
Bottom Sheet
2095-T6/2095-T8
2095-T6/2095-T8
2095 -T6/2095 -T8
2095-T6/2095-T8
2095-T6/2095-T8
2095-T6/2095-T8
2095-T6/'2095-T8
2095-T6/2095-T8
2095-T6/2095-T8
2095-T6/'2095-T8
2095-T6/2095-T8
2095-T6/2095-T8
2095-T6/2095 -T8
2095-T6/2_5-T8
2095 -T6/2-095--T8
2095-T6/'2095-T8
2095-T6/2095-'I"8
Thickness Amount Power SpeedCombination Removed per (kW) (IPM)
(in.) Side (in.)
0.068 to 0.095 0.001 6.0 150
0.068 to 0.095 0.001 6.5 150
0.068 to 0.095 0.001 6.5 150
0.068 to 0.095 0.005 6.5 150
0.068 to 0.095 0.005 6.2 150
0.068 to 0.095 0.005 6.2 150
0.068 to 0.095 0.010 6.0 150
0.068 to 0.095 0.010 6.0 150
0.068 to 0.095 0.010 6.0 150
0.068 to 0.120 0.001 6.5 150
0.068 to 0.120 0.001 6.5 150
0.068 to 0.120 0.001 6.5 150
0.068 to 0.120 0.005 6.3 150
0.068 to 0.]20:: 0.005 _ 6.4 150
0.068 to 0.120 0.005 6.4 150
0.068 to 0.120 _ _0_0i0 _ : ' 6.3 150
0.068 to O.120 0.010 6.3 150
0.068 to O. 120 0.010 6.3 150
* Samples forwarded to NASA Langely Research Center. All other specimens retainedat ARL Penn State for tension shear testing.
Note: Shielding gas supplied utilizing a 0.375 inch inside diameter nozzle mounted at a 35 ° anglefrom the horizontal and directed at the front edge of the pool directed against the weldingdirection.
6O

TABLE IX
Results of Tensile Tests for Base Metal and Partial Penetration Welds of 2090-T83
0.120 in. Thick 2090-T83
Partial Penetration Welds a
SpecimenID
BI-I
Ultimate Yield Elongation inTensile Strength 1.0 in. gageStrength
KSI KSI %
_a_ _vlPa)
67.11 b 0(462.8)
B 1-2 59.68 b 0
(411.6)
B1-3 58.55 b 0
(403.8)
B1-4 60.85 b 0
(419.7)
BI-5 61.81 b 0(426.3)
Mean 61.60 c 0(424.8)
Standard 3.31 ¢ 0Deviation (22.8)
0.120 in. Thick 2090-T83Base Metal
Specimen Ultimate Yield Elongation inID Tensile Strength 1.0 in. gage
StrengthKSI KSI %
_Pa_ _MPa_
2090-1 80.59 75.01(555.8) (517.3)
2090-2 80.23 74.78(553.3) (515.7)
2090-3 80.43 74.36(554.7) (512.8)
80.42 74.7
(554.6) (515.2)
0.177 0.331(1.22) (2.28)
7.0
7.0
a Lap welds produced on 0.050 in. thick 2090-T6 to 0.120 in. thick 2090-1"83 at5.5 kW power and 160 IPM travel speed. Average weld penetration of the 2090-T83was approximately 40 percenL
b Yield strength not obtained; failed before reaching 0.2% offset.¢ Mean and standard deviation not calculated.
6.0
6.7
0.6
61

TABLE X
Results of Tensile Tests for Base Metal and Partial Penetration Welds of 2095-T8
0.120 in. Thick 2095-T8
Partial Penetration Welds a
Specimen Ultimate Yield Elongation inID Tensile Strength 1.0 in. gage
StrengthKSI KSI %
9_O'a) .9_,_
B4-1 62.78 b 0(433.0)
B4-2 56.67 54.85 1.0
(390.8) (378.3)
B4-3 56.90 54.29 1.0(392.4) (374.4)
B4-4 61.89 58.25 1.0(426.8) (401.7)
B4-5 55.70 51.48 1.0(384.1) (355.O)
Mean 58.79 54.72 0.8(405.5) (377.4)
Standard 3.28 2.78 0.4Deviation (22.6) (19.2)
0.120 in. Thick 2095-T8Base Metal
Specimen Ultimate Yield Elongation inID Tensile Strength 1.0 in. gage
StrengthKSI KSI %
2095-1 90.22 84.57 10.0(622.2) (583.2)
2095-2 89.50 83.79 10.0(617.2) (577.9)
2095-3 89.92 84.20 l1.0
(620.1) (580.7)
89.88 84.19 10.3(619.9) (580.6)
0.36 0.39 0.6(2.48) (2.69)
a Lap weldsproducedon0.050in.thick2095-T6to0.120in.thick2095-T8at
7.2 kW power and 150 IPM travel speed. Average weld penelration of the 2095-T8was approximately 60 percenL
b Yield slrength not obtained;failed beforereaching0.2%offset
62

Table XI
Results of Tension Shear Tests on 0.050 inch Thick 8090-T6 Stiffener to
0.120 inch Thick 2090-T83 Face-Sheet
SampleNumber
C-1-4-1
C-1-4-2
C-1-5-1
C-1-5-2
C-1-5-3
C-2-5-1
C-2-5-2
C-2-6-1
C-2-6-2
C-2-6-3
C-3-4-1
C-3-4-2
C-3-4-3
C-3-5-1
C-3-5-2
Amount
Removed per Weld Length Weld Weld Area Load
Side (in.) (in.) Width (in.) !_.in.) (lb.)
0.001 0.724 0.090 0.065 902
0.001 0.752 0.084 0.063 802
0.001 0.748 0.088 0.066 755
0.001 0.751 0.090 0.068 823
0.001 0.749 0.082 0.061 733
0.005 0.759 O.110 0.084 950
0.005 0.755 O.123 0.093 926
0.005 0.750 0.105 0.079 904
0.005 0.756 O.1I0 0.083 907
0.005 0.746 0.090 0.067 860
0.010 0.749 O.106 0.079 879
0.010 0.748 0.088 0.066 717
0.010 0.755 0.090 0.068 643
0.010 0.754 0.093 0.070 878
0.010 0.733 0.085 0.062 765
Shear StrengthKSI (MPa)
13.9 (95.7)
12.7 (87.8)
11.4 (78.8)
12.1 (83.4)
12.0 (82.8)
11.3 (77.9)
10.0 (68.6)
11.4 (78.9)
10.9 (77.1)
12.8 (88.4)
11.1 (76.7)
10.9 (74.9)
9.5 (65.2)
12.5 (86.5)
12.3 (85.1)
63

Table XII
Results of Tension Shear Tests on 0.068 inch Thick 2095-T6 Stiffener to
0.120 inch Thick 2095-T8 Face-Sheet
SampleNumber
C-l-10-1
C-1-10-2
C-1-10-3
C-1-12-1
C-1-12-2
C-2-11-1
C-2-11-2
(2-2-11-3
C-2-12-1
C-2-12-2
C-3-10-1
C-3-10-2
C-3-11-1
C-3-11-2
C-3-11-3
Amount
Removed
Side (in.)
0.001
0.001
0.001
0.001
0.001
0.005
0.005
0.005
0.005
0.005
0.010
0.010
0.010
O.OlO
O.OlO
Weld Length Weld Weld Area Load(in.) Width (in.) (sq.in.) (lb.)
0.756 0.057 0.043 857
0.758 0.064 0.049 974
0.754 0.066 0.050 987
0.754 0.062 0.047 1003
0.756 0.065 0.049 955
0.756 (}.065 0.049 997
0.759 0.066 0.050 942
0.754 0.066 0.050 933
0.755 0.070 0.053 797
0.752 0.066 0.050 984
0.756 0.060 0.045 976
0.740 0.070 0.052 1005
0.757 0.065 0.049 892
0.760 0.065 0.049 888
0.760 0.065 0.049 941
Shear StrengthKSI (IVlPa)
19.9 (137.4)
19.9 (137.1)
19.7 (136.1)
21.3 (147.1)
19.5 (134.3)
20.4 (140.3)
18.8 (129.9)
18.7 (128.6)
15.0 (103.6)
19.7 (135.7)
21.7 (149.5)
19.3 (133.2)
18.2 (125.5)
18.1 (124.9)
19.2 (132.4)
64

6S

REPORT DOCUMENTATION PAGE Approved oM8No o7o,-o18a
Public feDorting burden for this collecl[ion of information is estimated to average 1 hour Der resoonse, including the time for review ng instructions searchi exlstigat.herlng an d ,mainta!ntn_ the data needed, and completing and reviewing the colfe_ion of informat on Send commen_ rM_,,_;-- .k;. =. ....... ".... n_ng_ ._n<j data sources,
co,ectlon Ot mrocmatJofl, including suggestions for reducing this burden tO Wash naton Headaua_e_ Servlc_ ni-_^.'_*-_._-'--'_-'--'"-=-.-'_-'_'-_'_--_:-m-eL_ any otr_..._a,t_-'t 0T tntsDay s H ghway Su te 1204 Arlirlotof_ VA 22202.4302 a_l to the Office _,f M=n----;'--- --_ a._._ ...... -"':" _'" _'-_'."'_- ,v; ,,.,v_maLiv. uio_rauQns a¢'_ _epor'l_, I/1_ Jefl_
• ' -- = .... _j_,,,_-L a,_ auu_J_t, raperworK I'seouctlOn I'ro|ect _0704-01_). Wa_ington. DC 20503.
1. AGENCY USE ONLY (Leave blank) 2. REPORT DATE I 3. REPORT TYPE AND DATES COVERED
April 1993 I Contractor Report4. TITLE AND SUBTITLE S. FUNDING NUMBERS
The Feasibility of Producing Aluminum-Lithium Structures for CryogenicTankage Applicationsby Laser Beam Welding
6. AUTHOR(S)
R. P. MartukaritzK. G. Lysher
7. PERFORMING ORGANIZATION NAME(S) AND ADDRESS(ES)
Applied Research LaboratoryThe Pennsylvania State UniversityP.O. Box 30State College, PA 16804
g. SPONSOR;NG/MONITORING AGENCY NAME(S) AND ADDRESS(ES)
National Aeronautics and Space AdministrationLangley Research CenterHampton, VA 23681-0001
11. SUPPLEMENTARY NOTES
_4409D
505-63-50-03
8. PERFORMING ORGANIZATIONREPORT NUMBER
TM 93-067
10. SPONSORING / MONITORINGAGENCY REPORT NUMBER
NASA CR-191527
This report was prepared for Langley Research Center under an Interagency Agreement between NASA,L_u___!ei/Rese.arch.Centerarl.d.theDepar__ent of the Navy, Space andNaval Warfare Systems Command(_t-'AWP,H). Langley lecnnical Monitor: Cynthia L Lach. _ __
12a. DISTRIBUTION/AVAILABILITY STATEMENT
Unclassified - UnlimitedSubject Category - 29
13. ABSTRACT (Maximum 200 words)
12b. DISTRIBUTION CODE
Aluminum-lithium alloys exhibit high strength, high elastic modulus, and low density as well as excellentcryogenic mechanical properties making them ideal material candidates for cryogenic tanks. NASA hasproposed the use of "built-up" structure for panels fabricated into cryogenic tanks replacing currentconventional machining. Superplastically formed stiffeners would be joined to sheet (tank skin) that had beenroll formed to the radius of the tank in order to produce panels. Aluminum-lithium alloys of interest for producingthe built-up structure include alloy 2095-T6 stiffeners to 2095-T8 sheet and alloy 8090-T6 stiffeners to 2090-T83 sheet.
Laser welding, with comparable joint properties, offers the following advantages over conventional welding:higher production rates, minijnal'degradation within the heat affected zones, and full process automation. Thisstudy established process parameters for laser beam welding, mechanical property determinations,rnetallographiccharacterization, and fabrication of prototype panels.
Tensile tests representing partial penetration of the skin alloys provided joint efficiencies between 65 and 77percent, depending upon alloy and degree of penetration. Results of tension shear tests of lap welds indicatedthat the combination of 2095-T6 to 2090-T8 exhibited significantly higher weld shear strength at the interface incomparison to welds of 8090-T6 to 2090-T83. The increased shear strength associated with 2095 is believedtn h_. dH_ tn th_ hilly'c: nhilltv tn nr_t.init_tinn etr_r_th=n /n_t, ,r_ll,/ =___) _r u._l_!.r_o14. SUBJECTTERMS
Laser WeldingAluminum-lithium alloys (2090, 8090, 2095)Built-up structure17. SECURITYCLASSIFICATION18. SECURITYCLASSIFICATION
OFREPORT . OFTHISPAGE
LJN(_IARS;IFII::r) I IN_I A_IFIFI'INSN7540-01-280-5500
19. SECURITY CLASSIFICATIONOF ABSTRACT
15. NUMBER OF PAGES
7316. PRICE CODE
_'" A04
20. LIMITATION OF ABSTRACT
Standard Form 298 (Rev 2-89)Prescribed by ANS! Std Z]g-18298-102