Embed Size (px)
Citation preview

The feasibility and application of multi-layer vacuum
insulation for cryogenic hydrogen storage
Jacobus Henry Hodgman
B.Eng (Mechanical) North West University Potchefstroom Campus
Dissertation submitted in partial fulfilment of the requirements for the degree of
Masters in Engineering
of the North-West University at the Potchefstroom Campus
Supervisor: Prof. J. Markgraaff
Potchefstroom
2011

i
ABSTRACT
A need was identified to test multi-layer vacuum super insulation (MLVSI) used in
cryogenic applications for hydrogen storage. The study focuses on the application of
commercially available MLVSI to a locally patented liquid hydrogen cryogenic storage
system. This led to an investigation of different types of multi-layer vacuum insulation
configurations, as well as further research on tank inlet coupling configurations. It
includes the manufacturing of a liquid nitrogen testing cryostat to be able to test and
evaluate the system performance.
The first set of tests was based on the development of an inlet coupling configuration to
limit heat transfer through the inner tank inlet, of a double cryogenic tank system in
order to reduce gas boil-off. The couplings were manufactured in the form of a bellow to
handle cryogenic vacuum levels, while ensuring low heat transfer rates between inner
and outer tanks. It was found that various coupling designs can be considered to limit
gas boil-off.
The second set of tests was conducted on a specific MLVSI configuration to determine
its effectiveness to insulate the spherical header surface of a typical hydrogen storage
vessel. The installation procedure, to limit heat transfer and boil-off due to edge effects
in this configuration was investigated. It was found that insulation-overlap-edge effects
will always have an impact on insulation performance when a spherical header of a
storage vessel is insulated, due to its specific geometry. A time efficient way to install
MLVSI on such a spherical header is presented and evaluated.
Further investigations were carried out by combining findings into one single system to
determine the performance of an optimised insulated cryogenic system. It was found
that copper plate discs installed between the vanes of a bellowed inlet/outlet nozzle is
the most promising to limit heat transfer to the cryogenic fluid.
Keywords: multi-layer, vacuum insulation, super insulation, cryogenic, hydrogen
storage.
______________________________
ii
DECLARATION
I, Jacobus Henry Hodgman (Identity Number: 8612225059082) hereby declares that the
work contained in this dissertation is my own work. Some of the information contained in
this dissertation has been gained from various journal articles; text books etc, and has
been referenced accordingly.
________________ ______________
Initial & Name Witness
______________________________

iii
ACKNOWLEDGEMENTS
Special thanks to all the people and companies involved making this project possible.
To Prof. Johan Markgraaff who stood by me during the fulfilment of this project as my
supervisor, my special thanks. I would also like to thank the North West University for
their facilities, whose assistance ensured that this project is successful, and lastly, a
special thanks to HySA (DST Hydrogen S.A.) for the financial support.
______________________________

iv
CONTENTS
List of Figures ............................................................................................................................ vi
List of Tables ............................................................................................................................. ix
Abbreviations .............................................................................................................................. x
Chapter 1: Introduction ............................................................................................................... 1
1 General ........................................................................................................................... 1
1.1 Problem Statement ...................................................................................................... 4
1.1.1 Aim ...................................................................................................................... 4
Chapter 2: Literature Survey ...................................................................................................... 5
2 MLVSI Components ........................................................................................................ 5
2.1.1 Shield Material ..................................................................................................... 5
2.1.2 Spacer Material .................................................................................................... 7
2.1.3 Film Material ........................................................................................................ 9
2.2 Common Behavior of MLVSI ........................................................................................ 9
2.3 Testing Methods for MLVSI .........................................................................................12
2.4 MLVSI Installation .......................................................................................................14
2.5 Summary ....................................................................................................................15
Chapter 3: Experimental Design ...............................................................................................16
3 Introduction ....................................................................................................................16
3.1 Experimental Cryogenic System .................................................................................16
3.2 Operational Requirements ..........................................................................................18
Chapter 4: Detail Design ...........................................................................................................20
4 Background ...................................................................................................................20
4.1 Cryostat Externals.......................................................................................................21
4.1.1 Cryostat Outer Tank ........................................................................................... 21
4.1.2 Vacuum Pipeline ................................................................................................ 23
4.2 Cryostat Internals ........................................................................................................24
4.2.1 Cryostat Inner Tank ........................................................................................... 24
4.2.2 Inlet Coupling/Nozzle ......................................................................................... 25
Chapter 5: Manufacturing and Assembly ...................................................................................28
5 Introduction ....................................................................................................................28
5.1 Inner Tank and Coupling Manufacturing .....................................................................28
5.2 Application of MLVSI ...................................................................................................33
Chapter 6: Experimental Setup and Procedure .........................................................................35

v
6 Experimental Setup .......................................................................................................35
6.1 Configuration Testing Procedure .................................................................................39
6.2 Assembly Testing........................................................................................................41
6.2.1 Inner Tank Coupling Testing .............................................................................. 43
Chapter 7: Assembly Modifications ...........................................................................................47
7 Background ...................................................................................................................47
7.1 Coupling Modifications ................................................................................................47
7.1.1 Coupling Modification A ..................................................................................... 47
7.1.2 Coupling Modification B ..................................................................................... 51
7.1.3 Coupling Modification C ..................................................................................... 52
7.1.4 FEM Coupling Steady State Simulation ............................................................. 54
7.2 MLVSI Application Modifications .................................................................................58
7.2.1 Elimination of Edge Effects by Changing Tank Geometry .................................. 58
7.3 Discussion ..................................................................................................................60
Chapter 8: Optimum System .....................................................................................................62
8 Introduction ....................................................................................................................62
8.1 Optimum System Performance ...................................................................................62
Chapter 9: Conclusions .............................................................................................................66
9 Bibliography ...................................................................................................................68
Appendix A: Theoretical Model .................................................................................................72
Appendix B: Safety ...................................................................................................................74
Appendix C: Calculations ..........................................................................................................76
Appendix D: Experimental Data ................................................................................................79
Appendix E: Part List and Suppliers ..........................................................................................83
Appendix F: Design Drawings ...................................................................................................84

vi
List of Figures
Figure 1: Hydrogen density vs. temperature at certain pressures, modified after [6] ................................... 2
Figure 2: Illustration of MLVSI layers ............................................................................................................ 5
Figure 3: Absorption and reflection processes associated with a non-transparent medium, modified after
[9] .......................................................................................................................................................... 6
Figure 4: Spacer Matrix Configurations: a) randomly orientated, b) parallel structure c) staggered beam
structure [10] ......................................................................................................................................... 8
Figure 5: Illustration of liquid nitrogen calorimeter for testing the effectiveness of MLVSI, modified after
[17] ...................................................................................................................................................... 13
Figure 6: Illustration of a boil-off calorimeter for testing MLVSI, modified after [17] ................................... 14
Figure 7: Schematic illustration of the required experimental cryogenic system ........................................ 17
Figure 8: Transparent CAD model of the experimental system .................................................................. 20
Figure 9: Schematic of the cross section view of the O-ring gland flanges ................................................ 22
Figure 10: CAD model exploded view of the cryogenic system outer tank ................................................ 22
Figure 11: Exploded view of the CAD model of the vacuum pipeline ......................................................... 23
Figure 12: Exploded view of the CAD model of the experimental system internal components ................ 24
Figure 13: CAD model illustrating the heat path through a thin walled bellow ........................................... 26
Figure 14: Inner tank dome male and female die manufacturing ............................................................... 28
Figure 15: Inner Tank Male and Female Dies............................................................................................. 29
Figure 16: Inner tank dome pressing process............................................................................................. 29
Figure 18: Cross sectional schematic view of the redesigned female die .................................................. 30
Figure 17: Manufactured dome indicating buckling .................................................................................... 30
Figure 20: Illustration of the cryogenic inner tank mounted to a stand to facilitate MLSVI installation. ...... 31
Figure 19: Manufactured 150mm Ø domes from various billet sizes.......................................................... 31
Figure 21: Photo of the assembled and weld-joined inner coupling provided with flanges ........................ 32
Figure 22: Illustration of MLVSI cutting using a jig over-lay on the insulation with a newspaper page as
intermediate layer ................................................................................................................................ 33
Figure 23: A single layer of MLVSI ready to be installed to the inner tank ................................................. 34
Figure 24: Illustration of the folding process in order to limit edge effects .................................................. 34
Figure 25: Photo of the experimental cryogenic system for measuring the performance of MLVSI around a
vessel with spherical shaped end caps ............................................................................................... 35
Figure 26: E2M18 and E1M18 vacuum pumps performance chart ............................................................ 36
Figure 28: Thyracont high vacuum sensor and control unit ........................................................................ 37
Figure 27: E2M18 vacuum pump experimental performance chart ............................................................ 37
Figure 29: Schematic of temperature measurement positions ................................................................... 38
Figure 30: Photo of the temperature analogue interface ............................................................................ 38

vii
Figure 31: Schematic of the PWR high precision bench scale used to measure system weight loss (boil-
off) ....................................................................................................................................................... 39
Figure 32: System weight vs. time indicating an increased boil-off weight for old insulation ..................... 41
Figure 33: System weight vs. time illustrating deviations between alternative system setup tests ............ 42
Figure 34: System weight vs. time for a conventional inlet pipe. ................................................................ 43
Figure 35: Photo of the coupling installed with top and bottom thermocouples shown .............................. 44
Figure 36: System weight vs. time measurement for the bellowed coupling .............................................. 44
Figure 37: Liquid nitrogen boil-off rates for bellowed coupling and inlet pipe ............................................. 45
Figure 38: Graph of the temperature differences between the “hot” and “cold” sides of the inlet pipe and
the bellowed coupling configuration .................................................................................................... 45
Figure 39: MLVSI surface temperature ....................................................................................................... 46
Figure 40: A CAD model of the assembled Coupling A .............................................................................. 47
Figure 41: Exploded view of the CAD model of Coupling A ....................................................................... 48
Figure 42: Heat flow path through modified column support ...................................................................... 49
Figure 43: Photo of the manufactured and assembled coupling A ............................................................. 50
Figure 44: Photo of the manufactured and assembled coupling B ............................................................. 51
Figure 45: A schematic illustration of a ZAL 45 part for coupling C to limit radiation ................................. 52
Figure 46: Photo of the manufactured and assembled Coupling C with wrapped MLSVI to limit radiation to
the bellow. ........................................................................................................................................... 52
Figure 47: FEA result of the heat flux through Coupling B ......................................................................... 55
Figure 48: FEA of the steady state temperature distribution (ºC) through modified couplings: a) stainless
steel columns and b) glass fibre columns ........................................................................................... 56
Figure 49: Temperature distribution through Coupling B for various copper heat sinks positions; a) Evenly
spaced, b) evenly spaced on the high temperature side, c) evenly spaced on the low ..................... 57
Figure 50: Exploded view of a CAD model of the inner tank and the ZAL45 insulation end caps ............. 58
Figure 51: CAD model illustration of end cap and MLSVI installation to a pressure vessel ....................... 59
Figure 52: System weight vs. time for folding and end cap configurations respectively............................. 59
Figure 53: System weight vs. time for different coupling configurations tested .......................................... 60
Figure 54: Model of optimum coupling ........................................................................................................ 62
Figure 55: Photo of the manufactured and assembled optimised coupling (Coupling D) .......................... 63
Figure 56: Temperature difference over the optimised coupling (Coupling D) ........................................... 63
Figure 57: Optimised System Weight vs. Time Measurement .................................................................... 64
Figure 58: Evaporated mass (boil-off) for ten minute increments vs. time showing how steady state
conditions is reached .......................................................................................................................... 65
Figure 59: Thin-walled insulated nitrogen tank ........................................................................................... 72
Figure 60: Multi-Layer Insulation Wrapping Machine (NASA) [25] ............................................................. 73
Figure 61: Fabricating Apparatus for Multilayer Insulation Blankets [29] ................................................... 73
viii
Figure 62: Gas Boil-off vs. Insulation Thickness ......................................................................................... 77
Figure 63: Gas Boil-off vs. Tank Radius ..................................................................................................... 77
Figure 64: Top and bottom coupling temperatures vs. time for inlet pipe ................................................... 79
Figure 65: Top and bottom coupling temperatures vs. time for coupling .................................................... 79
Figure 66: Top and bottom coupling temperatures vs. time for improved Coupling A................................ 80
Figure 67: System weight vs. time for the coupling compared to the improved Coupling A ...................... 80
Figure 68: System weight vs. time for coupling A compared to Coupling B ............................................... 81
Figure 69: System weight vs. time for coupling B compared to Coupling C ............................................... 81
Figure 71: Top and bottom coupling temperatures vs. time for ZAL 45 insulation ..................................... 82
Figure 72: Top and bottom coupling temperatures vs. time for optimum system ....................................... 82

ix
List of Tables
Table 1: Emissivity of various shield materials [ [9]] ..................................................................................... 7
Table 2: Thermal conductivities of typical MLI sample configurations of materials tested at 13mbar,
modified after [12] ............................................................................................................................... 11
Table 3: Considered materials to manufacture cryogenic inner vessels .................................................... 25
Table 4: Thermal properties for components used in the FEM model ........................................................ 54
Table 5: ANSYS probe temperatures for heat sink configurations of Coupling B ...................................... 57
Table 6: Boil-off improvements for modified couplings ............................................................................... 60
Table 7: Boil-off rate for various Insulation materials used to insulate a thin walled nitrogen container .... 72

x
Abbreviations
CAD _ Computer Aided Design
CBT – Cold Boundary Temperature
CNC _ Computer Numerically Controlled
CVP – Cold Vacuum Pressure
EES – Engineering Equation Solver
FEM _ Finite Element Modelling
MLI – Multi-layer Insulation
MLIB – Multi-layer Insulation Blankets
MLVSI – Multi-layer Vacuum Super Insulation
PMLIB – Perforated Multi-layer Insulation Blankets
PPE _ Personal Protection Equipment
WBT – Warm Boundary Temperature

1
Chapter 1: Introduction
1 General
Fossil fuels are the modern world’s primary and most important energy source. The
main type of which is oil, used to generate heat for cooking and lighting applications
during the beginning of the nineteen century. Today, it is mostly used as a fuel for
internal combustion engines and provides mobility for planes, cars, trains, trucks and
boats.
Fossil fuels consist of carbon and hydrogen atoms and by burning these fuels, carbon
dioxide and other products are being produced that are harmful to the environment.
Scientists believe the amount of fossil fuels that has already been burnt has produced
enough carbon dioxide to develop a rapid climate change, and that in the year 2060, the
world will be consuming three times the energy of today [1]. Consequently alternative
energy sources have to be developed that are cost effective and need to fill the modern
world’s energy requirements without further increasing carbon dioxide levels. It is
believed that hydrogen can be used as an alternative energy carrier for the use in
internal combustion engines in order to alleviate the problem [2].
Hydrogen is the lightest gas in the universe with no smell, colour or taste and burns
cleanly producing very little or no harmful emissions [3] [4]. Another advantage of
hydrogen is that it can be produced by a number of feedstocks like fossil fuels, water
and organic matter. Hydrogen has some disadvantages such as high production cost,
storage problems and the high explosiveness of the gas which makes it dangerous to
work with. Some of the most common processes to produce hydrogen are electrolysis
of water, coal gasification and steam reformation.
It is claimed that hydrogen can be stored in four different ways namely: compressed, by
liquefaction, physisorption and as an element in compound, metallic hydrides.
According to Zhou (2004), compressing hydrogen as a gas is the simplest way to store
it up to 20 MPa, however, it is claimed that the energy density is too low for transport

2
applications. For transport applications the pressure must be at least 70 MPa, which is
four times higher than where use is made of internal combustion engines.
Hydrogen is also stored as a liquid at very low temperatures (-253 oC) but at high
pressures (70 MPa) in cryogenic systems. Hydrogen in liquid phase has a more
promising density to be used in transport applications than in gas phase, but faces
certain challenges like cost and efficiency of the liquefaction process [5]. The hydrogen
density versus temperature at certain pressures is shown in Figure 1.
Figure 1 shows that 1.75 kWh/kg of energy is required to compress hydrogen to 350
atm. at ambient temperature. The density is between 20 kg/m3 and 30 kg/m3 and it
would take a volume of 200 litres to store 5 kg of this compressed hydrogen, whereas a
hydrogen density of between 65 kg/m3 and 70 kg/m2 can be reached when it is liquefied
at a temperature of 20K. However, to liquefy hydrogen cryogenically, 3.25 kWh/kg of
energy is required with the advantage that 5kg can be stored in a volume of only 80
litres.
Figure 1: Hydrogen density vs. temperature at certain pressures, modified after [6]

3
To store liquid hydrogen cryogenically, two times more energy is required than what is
required to store compressed hydrogen gas at ambient temperatures but with the added
advantage that a density of more than three times that of compressed hydrogen is
obtained [6]. Apart from the cost implications to liquefy hydrogen and store it
cryogenically this method of storage makes it possible to utilize hydrogen for vehicle
applications.
In order to store liquid hydrogen cryogenically, very sophisticated insulation materials
and configurations are required to mitigate hydrogen boil-off. This means cryogenic
systems must be well-insulated with a highly effective insulation material to prevent the
liquid hydrogen loss through boil-off to the atmosphere. Bulk fill insulation is the most
common type of insulation and is used in a vacuum space to limit heat transfer due to
conduction. Examples of these materials are inorganic compounds in their fibrous forms
such as fibreglass and aerogel, perlite powder or silica powder [7].
The above mentioned insulation materials were used in a spherical, thin walled
container to demonstrate the insulation effect on nitrogen boil-off theoretically. This thin
walled nitrogen container with theoretically calculated boil-off rates for different
insulation materials is presented in Appendix A. It is calculated that with a relatively
effective insulation material (silica powder in a vacuum) with a thermal conductivity of
0.0017 W/mK the nitrogen boil-off rate is 7 litres per day. Although this insulation has a
relatively low thermal conductivity, gas boil-off is still high.
It is believed that the most effective heat barrier for cryogenic applications is layered
composite insulation material operating in high vacuum. It is claimed that for cryogenic
applications MLVSI is the industry standard for insulating cryogenic containers. This
composite insulation material shows much better boil-off results than conventional
insulation.
4
1.1 Problem Statement
Conventional high temperature insulation does not limit and reduce boil-off or the loss of
hydrogen to acceptable limits when used for cryogenic storage systems. Use is made of
multi-layer vacuum super insulation to mitigate boil-off of hydrogen. Although multi-layer
insulation seems to deliver outstanding results the application method and installation is
not generally known nor is the feasibility in combination with vacuum, well documented.
1.1.1 Aim
The aim of this study is to review the components of MLVSI and their function and to
determine the feasibility of application of MLVSI to a spherical pressure vessel for
cryogenic hydrogen storage. It is also the aim to optimize inlet/outlet nozzle
configurations to reduce heat transfer to the cryogenic fluid in order to reduce
unnecessary loss of hydrogen through boil-off.

5
Chapter 2: Literature Survey
2 MLVSI Components
Typical multi-layer vacuum super insulation is composed of shield material, film material
and spacer material (Fig. 2). This assembly of the combination of materials is employed
in vacuum space to limit heat transfer to a cryogenic fluid. Heat can be transmitted in
three ways namely conduction, convection and radiation. The shields minimise heat
flow due to radiation and the spacer material minimises solid conduction between these
alternative shields. Generally, the shield material is plated on a film material to add
strength to the insulation for installation purposes. By installing this combination of
materials within vacuum space it is possible to further limit heat transfer due to
convection. In some applications only shield and spacer materials, without a film
material are used in a vacuum space.
Infrared radiation
Certain findings, characteristics and materials used for the components of MLVSI are
now discussed.
2.1.1 Shield Material
Cryogenic systems which operate between 300 K and 77 K or lower, make use of multi-
layer vacuum super insulation and almost the total heat flux is due to infrared light [8].
The wavelength of infrared light is between 0.7 and 300 micrometers (shorter than
those of microwaves but longer than visible light) with a frequency between
approximately 1 and 430 THz. Microscopically, infrared light is either absorbed or
Figure 2: Illustration of MLVSI layers

6
emitted when these rays strike an object, increasing the motion of its surface molecules.
The amount of infrared light absorbed or emitted is influenced by the temperature of the
surroundings (irradiation), the reflectivity as well as the absorptivity and emissivity
values of the material’s surface finish. Figure 3 illustrates how infrared light is absorbed
or emitted through a typical shield material.
Figure 3: Absorption and reflection processes associated with a non-transparent medium,
modified after [9]
Kirchhoff’s law states that: at thermal equilibrium, the emissivity of a black body equals
its absorptivity. Meaning emissivity is an irradiative property of a surface that provides a
measure of how efficiently a surface emits energy relative to a blackbody. In short a
poor reflector is a good emitter and vice versa. The symbol є is used for the emissivity
of a material and has values in the range 0 ≤ є ≤ 1. The emissivity value of a material
strongly depends on its surface finish [9]. A black body has an emissivity value of є = 1,
meaning a material cannot thermally radiate more energy than a black body.
According to Incropera et al. (2005), absorptivity is a property that determines the
fraction of the irradiation absorbed by a surface. The symbol for absorptivity is α, with
values in the range 0 ≤ α ≤ 1. If the absorptivity is smaller than one then some of the
irradiation is reflected. Shield materials used for MLVSI have low emissivity and
absorptivity values and radiate most of the infrared light while only absorbing a small
percentage of irradiated infrared light.

7
A typical shield material is a highly polished gold plated polymer film, which has an
emissivity of 0.01 and is likely to reflect almost all of the infrared light (Table 1). Highly
polished silver and aluminium foil also has promising emissivity values [9].
Table 1: Emissivity of various shield materials [ [9]]
2.1.2 Spacer Material
The spacer material is designed to limit heat transfer due to solid conduction between
alternative shields. According to Wei et al. (2009) spacer material in paper form is most
commonly used, whereas the composite paper is replaced with a polymer net, also
known as a screen, to further reduce heat transfer. In this way, the contact area through
which heat is transferred from one shield to another is much less than with ordinary
paper spacers. The tensile strength of the spacer materials has an effect on the
installation procedure.
Typical spacer materials used are fibre glass paper, crinkled polyester film and vinyl-
coated fibreglass screen although the glass fibre paper has a poor tensile strength.
Thus it would take much longer to install glass fibre spacers when compared with glass
fabric, which is a stronger material to work with. Spacer weight is of utmost importance
when designing cryogenic systems for vehicle applications as the system has to be
lightweight. It is believed that fibrous spacers are more promising for cryogenic
applications due to the longer heat paths between fibres, although it tends to have lower
tensile strength which makes the installation process time consuming [10].
Three main types of fibre matrices are used in spacer material applications and are
classified according to tensile strength, heat path and application (Figure 4).
Reflector Emissivity (є)
Aluminium foil 0.02
Copper Highly polished) 0.03
Silver (Polished) 0.02
Gold (Highly polished) 0.01
Stainless Steel ( AISI 347)
0.87
Chromium 0.05

8
a b c
It is believed that the effective thermal conductivity of a fibrous material is dependent on
the solid conductivity of the fibrous material, Young’s modulus, porosity, imposed
pressure and fibre orientation. According to Kwon et al. (2009) the longer the heat path
of the fibre the more difficult it is for heat to transfer between shields.
The first illustration (Fig. 4a) shows glass fibre paper where the fibres are oriented
randomly with respect to a perpendicular main heat flow direction. According to Fricke
et al. (1990) glass fibre paper with randomly orientated fibres can reach a thermal
conductivity of 1.5x10⁻³ if the external pressure is held below 1 bar.
The parallel fibre structure (Fig. 4b) illustrates fibres spaced so that a more extended
heat path can be generated. This kind of fibre spacing is known to have a lower thermal
conductivity than the randomly spaced fibres. Another way to reduce solid conduction is
by extending the heat path by the staggered beam method (Fig. 4c). This heat path
structure is obtained by placing the rectangular cross-section beams of the first layer at
right angles to those of the second layer [11]. The third layer beams are placed half
pitch to the first layer ones. The use of rectangular cross-section beams is also
beneficial to increasing the beam stiffness. The staggered beam structure will take an I-
beam pattern, which contributes to further improvement of tensile strength of the spacer
material. Various materials were examined by Kwon et al. (2009) for this configuration
and they found that polymers exhibit the best performance. It was discovered that the
solid conductivity was also dependent on the angle of the adjacent beams.
Figure 4: Spacer Matrix Configurations: a) randomly orientated, b) parallel structure c) staggered
beam structure [10]

9
2.1.3 Film Material
Film material is one of the most important components in layered insulation because it
adds strength to the shield material in order to be able to wind it around a cryogenic
tank. The number of film layers wound in a multi-layer application is called the layer
density of the MLVSI. Alternating layers of these film material, shields and low
conductivity spacer material, is called an insulation blanket.
According to Lebrun et al. (1992) typical film materials are Mylar, Kapton, Tedlar and
Teflon. A commonly used film and spacer material is Mylar with a vacuum deposited
aluminium coating on one or both sides of the polymer sheet and a fibreglass paper
spacer. This type of layered insulation represents the benchmark for comparison [12].
Mylar can be produced in sheets as thin as 3.8x10⁻⁴ m and has a thermal conductivity of
0.151 whereas Teflon sheets have a thickness of 12.7x10⁻⁴ m and a thermal
conductivity of 0.209 . Mylar also has the lowest density and thermal expansion
of these two materials.
2.2 Common Behavior of MLVSI
According to Wikstrom (1999) MLVSI is highly anisotropic and is very sensitive to
compressive loads. When multi-layer insulation is installed too tight the layers
compresses and the thermal conductivity increases due to a decrease in gap distance
between alternative layers. If the multi-layer insulation is too loose, thermal
conductivities will be influenced on the bottom side of the tank that is being insulated.
Multi-layer insulation requires careful attention during installation, and according to John
(2009) it is difficult or impossible to maintain the gap distance between the film layers
[13] [14].
Thermal behaviour of multi-layer insulation blankets (MLIB) was measured by Benda et
al. (2000). The measurements focussed on large MLI samples for use in industrial
plants. According to Benda et al. (2000) the research was done with the aim to optimize
MLI and their thermal behaviour. Two testing cryostats were used in measuring the
thermal performance of MLI [8]. The first was a vertical cylinder cryostat surrounded by

10
thermal insulation in a vacuum. A cold boundary temperature was generated inside the
cylinder making use of liquid helium at 4.2K. The warm boundary was gaseous nitrogen
at 78K. The second test apparatus was a flat plate configuration with cold and warm
boundary temperatures. Accordingly, this eliminates parameters like material emissivity
and the view factor. Film materials, shield material as well as spacer materials used in
cryogenic insulation blankets were tested. Results showed that the best combination for
a cryogenic blanket is double aluminized Mylar with a crinkled aluminium shield and a
fibre glass paper spacer. The overlap closing method used was aluminium tape or
Velcro which was used in more effective installation to join edges, and where
overlapping posed a problem. This resulted in more heat transfer, due to the stitching
and extra material added to the blanket. The problem was overcome by using a strip of
Mylar film between alternating Velcro layers to limit heat transfer.
The number of spacers varied from layer to layer: cold side, 3 spacers between 2
reflectors, warm side, 1 spacer between reflectors, for a total of 15 spacers. This
specific blanket generated the best low thermal conductivities at vacuum pressures
below 10-5 Pa. The reason for using crinkled aluminium shield is that only certain points
touches the spacer material, which leads to less heat transfer.
Lebrun et.al. (1992) worked on another project where thermal insulation was required
for the CERN Hadron Collider to operate as an effective thermal barrier under any
change in vacuum conditions. According to Lubren et.al. (1992) a promising
combination for MLVSI was a double aluminised polyester film with a polyester net
spacer material.
The performance of commercially available MLI was tested by S.D Augustynowicz and
J.E Fesmire (2005). Combinations of aluminium foil, fibreglass paper, polyester fabric,
silica aerogel composite blanket, fumed silica, silica aerogel as well as other novel
materials were tested with their results presented in Table 2.
11
Table 2: Thermal conductivities of typical MLI sample configurations of materials tested at
13mbar, modified after [12]
The insulation samples (Table 2) were tested at warm and cold boundary temperatures
of 90 K and 300 K respectively. It was concluded by these authors that aluminium foil
with no film material can be used with glass fibre paper spacers. Multi-layer insulation
blanket with a layer density of 40, at a vacuum of 13 mbar without any film material,
resulted in thermal conductivities as low as 13.6 A MLI (Aluminium foil and
fibreglass paper spacer.) blanket tested by Fesmire et.al consisting of 50 layers of
aluminium foil and glass fibre paper showed a remarkable low thermal conductivity of
0.06 at a vacuum pressure of 4x10⁻⁵ torr.
Further improvements were made to MLI by perforating the shield material. The thermal
performance of Perforated Multi-Layer Insulation Blankets (PMLIB) was experimentally
tested [15]. The cold boundary temperature of a calorimeter was insulated with layer
densities of 20, 30, 40 and 50 layers respectively. It was concluded by Wei et.al. (2009)
that the thermal performance of PMLIB was highly affected by the structure and shape.
An insulation blanket with a layer density of 50 allowed a heat flux of 0.77
Description of Insulation Vacuum (mbar)
Conductivity
( )
Layered composite insulation with fiberglass paper and fumed silica dispersion
13 6.07
MLI (aluminum foil and fiberglass paper spacer), 40 layers at 1.8 layers/mm
13 13.6
Layered composite insulation with polyester fabric and fumed silica dispersion
13 9.66
Layered composite insulation with fiberglass paper and fumed silica dispersion
13 7.71
Layered composite insulation with fiberglass paper and fumed silica dispersion
13 6.82
Layered composite insulation with polyester fabric and fumed silica dispersion
13 8.78
12
2.3 Testing Methods for MLVSI
It is believed that testing the insulation effectiveness of layered insulation is a
complicated process because of the extreme care that must be taken with fabrication
and installation. Most of the apparatus used for testing MLVSI at these low boundary
temperatures make use of the cryogen boil-off calorimeter method. A cold mass like
liquid nitrogen is poured into an insulated container and weighed. As heat is being
transferred through the insulation material, the liquid starts to warm up and evaporates
due to its low boiling temperature. The liquid mass evaporated is directly proportional to
the amount of heat being transferred through the insulation to the cryogenic fluid.
Bapat et al. (1990) believes that a cylindrical apparatus operating on the boil-off
measurement principle is the most preferable for testing the effectiveness of a MLVSI
configuration composite. According to Kagner et al. (1969) the cylindrical method has
advantages like maximum surface area and minimum edge effect area [16]. Using this
method it is easy to control secondary heat leaks but these cylindrical arrangements
cannot be used to test the influences of mechanical loads between alternating layers.
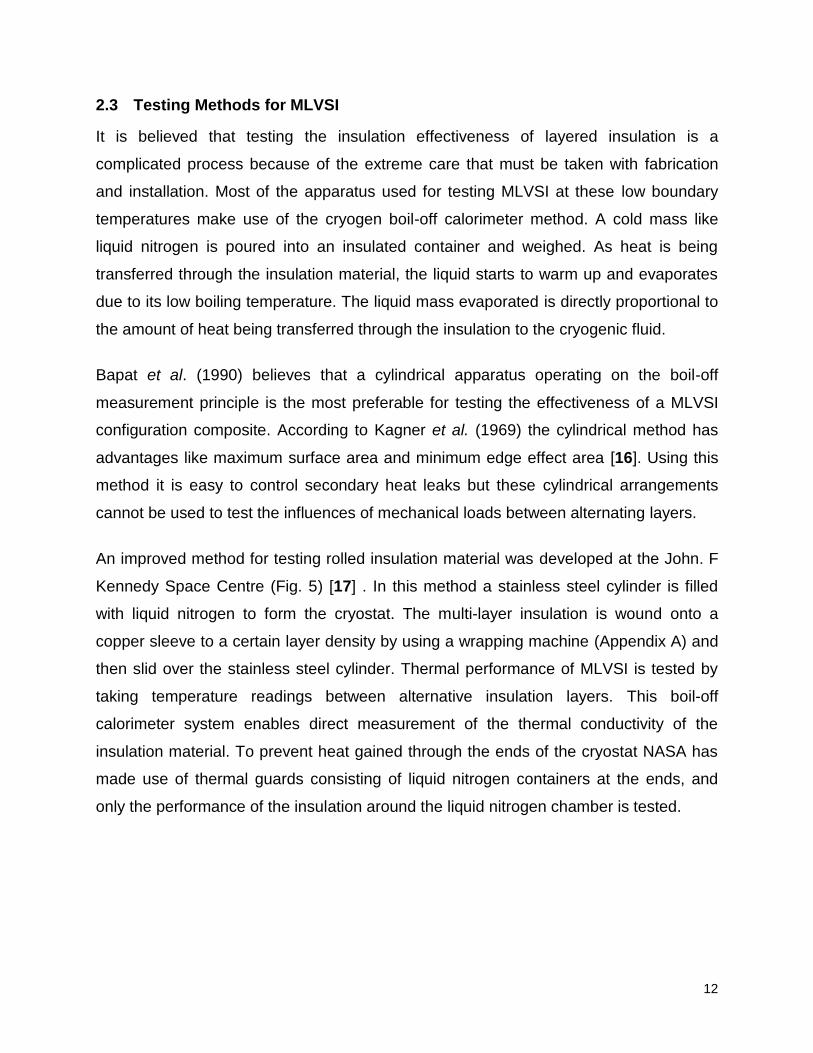
An improved method for testing rolled insulation material was developed at the John. F
Kennedy Space Centre (Fig. 5) [17] . In this method a stainless steel cylinder is filled
with liquid nitrogen to form the cryostat. The multi-layer insulation is wound onto a
copper sleeve to a certain layer density by using a wrapping machine (Appendix A) and
then slid over the stainless steel cylinder. Thermal performance of MLVSI is tested by
taking temperature readings between alternative insulation layers. This boil-off
calorimeter system enables direct measurement of the thermal conductivity of the
insulation material. To prevent heat gained through the ends of the cryostat NASA has
made use of thermal guards consisting of liquid nitrogen containers at the ends, and
only the performance of the insulation around the liquid nitrogen chamber is tested.

13
Figure 5: Illustration of liquid nitrogen calorimeter for testing the effectiveness of MLVSI, modified
after [17]
The problem with this system is that it required a liquid nitrogen supply that added
additional heat to the system by conduction through inlet pipes [17]. Fesmire et al.
(2008) however, carried out multiple tests on various composite insulation materials
using this method and it was found that the predicted results were consistent with their
experimental results.
NASA has designed another test apparatus at the Cryogenics Test Laboratory for the
measuring of MLVSI performances (Fig. 6). In this apparatus the setup consists of a
vacuum chamber with a stainless steel cylinder filled with liquid nitrogen.

14
Figure 6: Illustration of a boil-off calorimeter for testing MLVSI, modified after [17]
The inner assembly is easily removed and can also be placed in a wrapping machine
for installing MLI. Heat through the ends of the inner cylinder is minimized by thermal
guard discs made of aerogel with silver plated film material in between. The boil-off
weight is measured from which the insulation performance is calculated. This test
method provides more consistent measurements due to less heat transfer through inlet
piping.
2.4 MLVSI Installation
Shield and spacer material is normally supplied in rolls for purposes of installing onto
cryogenic containers. In the case of a cylindrical shape container, like the two test
methods discussed above, the insulation is wound around the container.
NASA used a wrapping machine (Appendix A) that consisted of three rollers which were
used for different multi-layer insulation test configurations. The cylinder to be filled with
a cryogenic fluid is placed on the machine and then a set of rollers applies MLI to the
container by rotating of the rollers. An improved method and apparatus was invented

15
by Gonczy et al. (1988) to fabricate multi-layer blankets. According to Gonczy et al.
(1988) this machine is able to wind multiple layers around a mandrel and to cut the
material along a line during winding or on completion of the winding procedure. The
blanket is removed after the edges are bound together along the circumference of the
mandrel. Specific layer densities can be achieved when the tension on the two materials
is adjusted [18].
2.5 Summary
The thermal behaviour of layered insulation blankets is not only a function of physical
properties such as thermal conductivity, emissivity and absorptivity but also of the type
of installation, compressive forces between layers as well as the joining method of the
inner and outer tanks.
The problem faced with the discussed MLVSI testing apparatus is that it only simulates
MLVSI performance around a cylinder and not the performance if installed around a
typical pressure vessel with more complicated geometries.

16
Chapter 3: Experimental Design
3 Introduction
To determine the effectiveness and degree of edge effects of application of MLVSI to a
typical cylindrical pressure vessel (for storage of liquid hydrogen or any other cryogenic
fluid) and to test fluid inlet/outlet coupling configurations an experimental cryogenic
system is required. It was thought that the experimental system based on the boil-off
calorimeter principle discussed in Section 2.3, would provide the base for such a
design.
Although this work is aimed at determining the effectiveness of application of MLVSI to
a typical pressure vessel containing liquid hydrogen, liquid nitrogen needs to be used as
the cryogenic fluid since the facilities to safely work with hydrogen is not available.
Although the thermal conductivity or heat flux into a cryogenic system is a function of
temperature (with liquid hydrogen at a lower storage temperature than liquid nitrogen) it
is thought that the results obtained would further guide MLVSI application to such
hydrogen containing cryogenic systems and their design – especially for vehicular
application. The following aspects needed to be addressed and are discussed in this
chapter:
Boil-off calorimeter method modifications
Operational requirements
Material and component requirements
3.1 Experimental Cryogenic System
The boil-off calorimeter method works on the evaporation of a liquid principle. An
insulated container is filled with a cryogenic fluid such as liquid nitrogen and as heat is
transferred through the insulation the liquid nitrogen (or for that matter liquid hydrogen)
warms up and evaporates. The amount of evaporated nitrogen gives an indication of
how much energy (heat) is required to evaporate the amount of liquid nitrogen. A largely
evaporated amount of liquid nitrogen indicates poor insulation performance and vice

17
versa. According to Bapat et al. (1990) this is a simple, but accurate method for
measuring thermal insulation properties at very low temperatures.
A schematic of the required experimental cryogenic system, based on the boil-off
calorimeter method, is shown in Figure 7. The experimental system needs to consist of
an inner and outer tank to provide for essential vacuum insulation.
Figure 7: Schematic illustration of the required experimental cryogenic system
The inner tank is to be mounted to the outer tank by making use of a coupling that can
also act as an inlet/outlet nozzle. A vacuum supply system is to be connected to the
outer tank and the outer tank should also provide for protrusions and fittings for vacuum
and temperature instrumentation. The system needs to be provided with a convenient
top opening configuration so that the inner tank with insulation can be removed after
tests to easily change assembly configurations and/or insulation layers.
18
3.2 Operational Requirements
The function of the test system is to determine the thermal performance of certain
insulation and coupling configurations by measuring nitrogen boil-off. This means that
the inner vessel should hold enough liquid nitrogen for effective testing and that material
weight should be kept to a minimum as the apparatus needs to be weighed on a high
precision bench scale to determine boil-off. For testing to be accurate and safe, the
experimental location should be well ventilated and at constant ambient temperature
and pressure. A vacuum system and gate valve needs to be selected as the vacuum
pipeline is required to be closed off after vacuum pumping.
Testing should be done in the shortest time period possible, which means the inner
vessel must be easily separated from the outer vessel to ensure fast insulation
replacement. The coupling has to carry the total weight of the inner tank to prevent it
from failing under tensile loads; however it should also limit heat transfer between the
cryogenic fluid and the outer tank.
Liquid nitrogen at a cryogenically low temperature can embrittle structural materials and
they can also undergo a ductile-brittle transformation. Because of this characteristic
attention had to be given to the selection of materials. Material which comes into contact
with moist can form ice causing the pipes and fittings to be plugged which can result in
an explosion. The pipes and fittings have to be selected so that it does not fail under
these cryogenic conditions.
High vacuum levels require a vessel with acceptable hoop strength and components to
ensure integrity while testing proceeds. Due to system vacuum requirements, the
pipeline components should prevent particles from being sucked in by the vacuum
pump and should ensure efficient sealing properties. For sealing purposes, it is
necessary that all the pipeline components have a very fine surface finish to be able to
seal properly. Also, they should not corrode as this will form metal particles which can
damage the vacuum pump vanes.

19
Nitrogen gas is harmful when inhaled and gas extraction fans are required to vent the
gas to an unoccupied space. A stand is required to add stability to the system, ensuring
practical and safe system installations and analysis. The stand needs to be modifiable
so that it can be used for various practical experimental purposes. It should keep the
extraction fan in place while testing and also set the height of the extraction fan.
Between tests the extraction fan needs to be removed, whilst the stand is used to hold
the upper dome in place to mount thermocouples to the coupling. The stand should also
be able to hold the inner tank in place in order to install the insulation layer by layer
while also avoiding compression

20
Chapter 4: Detail Design
4 Background
This part of the report describes the mechanical design of the experimental cryogenic
system and its components for testing MLVSI and coupling nozzle configurations
applied to a spherical shaped pressure vessel as based on the requirements presented
in Chapter 3. Section 4.1 and Section 4.2 address the following aspects of the design:
Cryostat externals
Cryostat internals
The components of the final design are illustrated in Figure 8.
Figure 8: Transparent CAD model of the experimental system

21
4.1 Cryostat Externals
The cryostat externals consist of the:
Cryostat outer tank and the
Vacuum pipeline
4.1.1 Cryostat Outer Tank
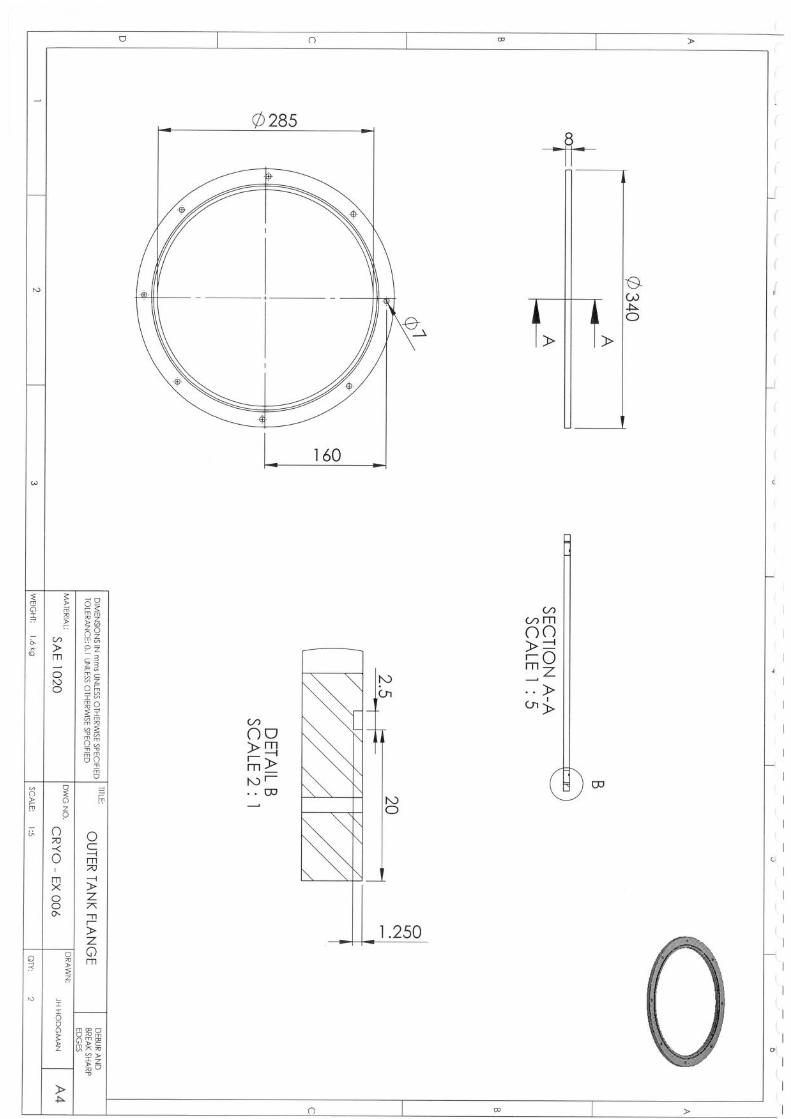
The outer tank is a 50 litre, 11 bar pressure vessel with an outside diameter of 285mm
and a wall thickness of 2mm, obtained of-the-shelf. The experimental cryogenic system
operates at a pressure difference of 1 bar and no calculations were required regarding
safe outer tank stresses because of the rated vessel obtained. The tank operates at a
higher temperature than the inner tank although the neck area, near to the inlet
coupling, can reach temperatures as low as 240K. This makes it possible to
manufacture the outer tank and flanges from plain carbon steel as the brittle transition
temperature of plain carbon steels is in the range of 225 K which is lower than the
expected operational temperature.
The flange and sensor protrusions are manufactured from plain carbon steel as it is
welded to the outer tank. Flanges are coupled using a 5 mm vinyl O-ring to create an air
tight seal by using 8x6 mm stainless steel bolts. Figure 9 illustrates a modelled cross
section of the assembled gland flanges design.
O-rings were selected because they are relatively inexpensive and requires lower
seating stresses than flat gaskets. Note was taken of the direction in which pressure is
applied. The internal diameter dimensions of the groove were designed to fit the internal
diameter of the O-ring for pressure applied from the outside since a vacuum is
generated. For a 5mm O-ring the width and height of the groove was calculated to be
6.5mm and 4mm respectively. For the groove height a tolerance of ±0.05mm was
allowed.

22
A threaded flange welded to the outer tank dome is provided for, in order to mount the
inner tank supply coupling to the outer tank dome. An exploded view of the model of the
outer tank is shown in Figure 10.
Figure 10: CAD model exploded view of the cryogenic system outer tank
Figure 9: Schematic of the cross section view of the O-ring gland flanges

23
4.1.2 Vacuum Pipeline
An exploded view of the vacuum pipeline is shown in Figure 11 and consists of
components that are obtainable off-the-shelf.
Swing clamp Polymer centring ring Bellowed hose Gate valve
Figure 11: Exploded view of the CAD model of the vacuum pipeline
For weighing purposes, the vacuum pipeline can be disconnected from the system. If
not the weight and stiffness of this pipeline will have an influence on scale
measurements. After weight measurements are taken the pipeline is connected again to
generate vacuum if leaks are a problem during testing. To be able to disconnect the
pipeline after sufficient vacuum levels have been reached a vacuum gate valve with the
smallest leakage rate possible, is provided for. This gate valve is connected to the outer
tank vacuum flange protrusion using the aluminium swing clamp and Viton O-ring seal
such as illustrated in Figure 11. A bellowed hose is installed between the pump and the
gate valve to prevent it from damaging the scale by vibrations transferred from the
vacuum pump in operation. Vacuum grease is added to the sealing surface of each
component to ensure optimum sealing.

24
4.2 Cryostat Internals
The cryostat internals consist of the:
Cryostat inner tank
Inlet nozzle coupling
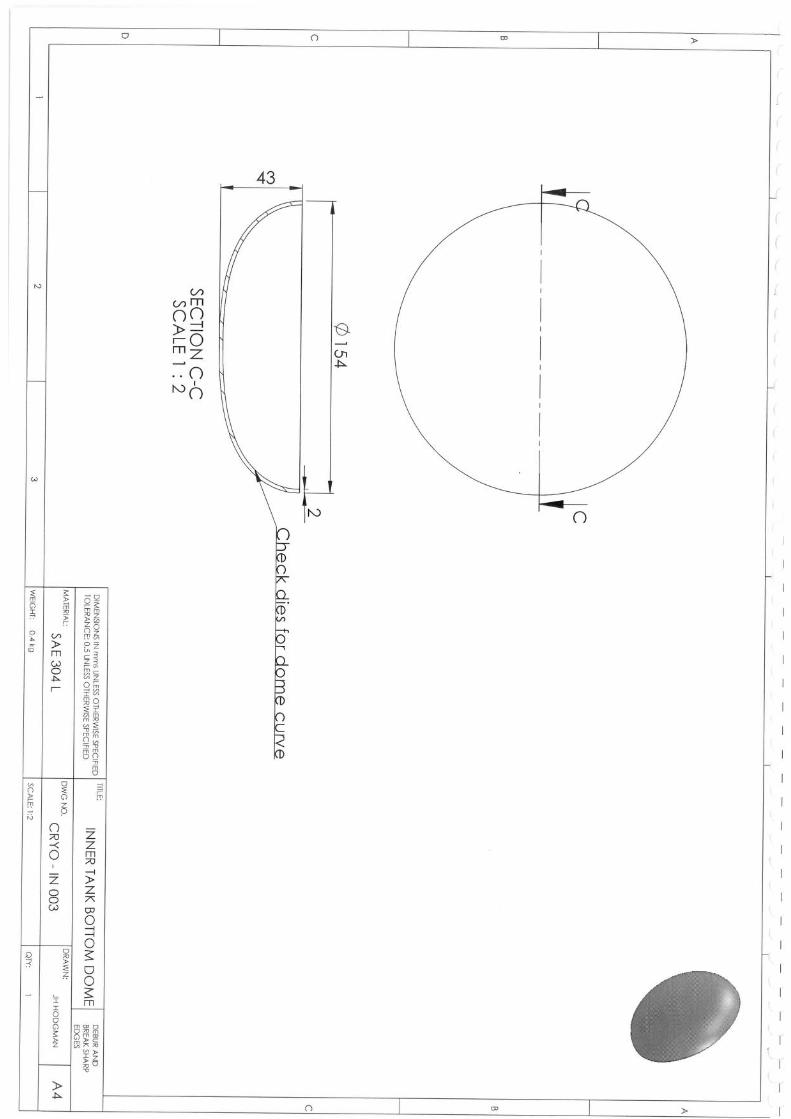
4.2.1 Cryostat Inner Tank
A CAD model of the designed system internals is shown in Figure 12. The design
(Design and manufacturing drawings presented, Appendix F) provided for a cylindrical
gap between the inner and outer tanks of 60mm to be able to install enough MLVSI to
the inner tank and still have a reasonable vacuum space between the outer tank wall
and the MLVSI.
Top supply coupling
Copper seal
Coupling
Bottom supply coupling
Inner tank
Figure 12: Exploded view of the CAD model of the experimental system internal components
With an outer tank inner diameter and length of 280mm and 570mm respectively, the
inner tank diameter is calculated to be 155mm with a length of 330mm. The inner tank

25
needs to be 80% filled during testing in order to prevent liquid nitrogen being pushed out
during gas evaporation. The amount of liquid nitrogen used per test conducted is
calculated to be 3.5 litres. The inner tank is operating at 77 K and materials such as
ferritic stainless steel and polymers have been identified as non favorable materials due
to its ductile to brittle transition at this low temperature. Polymers cannot handle these
temperatures either and were therefore not employed. Materials considered for the
inner tank is shown in Table 3.
Table 3: Considered materials to manufacture cryogenic inner vessels
According to Fesmire et al. (2005) heavy wall stainless steel construction provides
maximum thermal stability and minimum temperature gradients for such tanks.
Austenitic stainless steels are useful at cryogenic temperatures and are also used in
plants handling liquefied gas. SAE 316 and SAE 304 were considered for this design
due to their unique combination of properties. Based on relative cost, 2mm stainless
steel SAE 304 sheet was selected for the inner tank manufacturing. The maximum
operating pressure is 1bar with the result that the tank cannot be seen as a pressure
vessel (ASME standards, Division 1 of Section 8 for pressure vessels operating above
103.4 kPa).
A bottom supply flange made from stainless steel was provided and welded to the inner
tank. With the top and bottom supply flanges it should be possible to change and
improve coupling designs without removing some system components.
4.2.2 Inlet Coupling/Nozzle
The inner tank inlet coupling is a critical component in the experimental cryogenic
system and was designed to limit conduction through the neck area of the cryostat.
When making use of cryogenic systems it is thought that most of the transferred heat to
Aluminum 2014-
T6
Ti-6Al-4V 70Cu-30Zn Stainless steel 316
Aluminum 5052-O Inconel 718 Composites Stainless steel 304

26
a cryogenic liquid is due to radiation from the outer tank wall and conduction through the
inner coupling. To ensure limited heat transfer, a coupling was designed to replace the
conventional straight inlet pipe also employed in the experimental work.
According to Fourier’s law, the heat flux through an object is given by.
where - Material’s thermal conductivity,
- Heat transfer path and
- Temperature difference
The heat flux is given in W/m2 which means that the heat flux has to be multiplied by the
heat transfer area to calculate the total transferred heat. Thus, the heat transfer is
influenced by the length of the inlet coupling, through which heat has to be transferred,
as well as the cross sectional area. This acted as a starting point for coupling design.
With the above taken into consideration it was decided to design the coupling in the
form of a bellow. With the specific geometry of a bellow it is possible to minimize the
gross sectional area but still have a strong enough coupling under high vacuum to avoid
failure due to implosion as vacuum is generated. The heat path through a bellow is
illustrated in Figure 13.
Figure 13: CAD model illustrating the heat path through a thin walled bellow

27
Due to the specific form of the bellow, a longer heat path is generated than with an
ordinary inlet pipe. In order to mount the bellow between the inner and outer tank, it was
decided to make use of two flanges welded to both ends of the bellow. Such a design
would enable easy fitment and dismantling of the coupling during configuration
changes.

28
Chapter 5: Manufacturing and Assembly
5 Introduction
The majority of components used for the experimental cryogenic system were
manufactured by the author. Assembly was carried out in the Mechanical Engineering
workshop. Manufacturing drawings are presented in Appendix F.
5.1 Inner Tank and Coupling Manufacturing
The inner tank consists of a rolled sheet metal cylinder welded to two self-manufactured
domes. In order to produce these domes a male and female die was designed and
produced. The cutting of the dies on a CNC milling machine, for the production of the
header domes, is shown in Figure 14. These dies were manufactured from mild steel as
only a few domes needed to be produced.
In order to remove the dome from the die after forming and to ensure the dome radius
was correctly manufactured, compensation was made for material elastic springback by
allowing for clearance between the male and female dies to be about the billet
thickness. In most cases, the clearance between a male and female die is calculated as
the billet thickness plus twenty percent of this thickness. The clearance between
alternative dies for a 2mm billet was therefore calculated to be 2.4mm. Figure 15
Figure 14: Inner tank dome male and female die manufacturing

29
demonstrates the final products obtained after machining. The centre hole in the female
die facilitated the removal of the product after pressing was carried out.
Figure 15: Inner Tank Male and Female Dies
Accurate work was of utmost importance to ensure good material flow while pressing
continued. A 900kN press was used and the hydraulic force to produce a single dome
was calculated to be approximately 9 tons. Figure 16 shows the beginning and end of
the pressing process.
Figure 16: Inner tank dome pressing process

30
It was important to centre the male die as well as the billet before the pressing started in
order to ensure a perfectly symmetric shaped dome. Figure 17 illustrates a dome that
was manufactured from a 200mm diameter billet with a thickness of 2mm.
Buckling
The dome was buckled at the outer radius and it was established that the female die
was too shallow and that the material deformed before the final radius bend was
generated. It was essential that the final radius bend should be parallel to the cylinder
wall. The dies were redesigned and machined deeper in order to achieve the final
radius bend. A cross sectional schematic view of the re-machined female die is shown
in Figure 18.
Figure 18: Cross sectional schematic view of the redesigned female die
A fillet was machined in the female die to hold a 180mm diameter billet in place when
pressed. This diameter billet was chosen because no excess material was present to
give an unshaped finish. Various billet sizes were produced and formed with and
without the use of grease as lubricant. The results of such produced dome sizes is
illustrated in Figure 19.
Figure 17: Manufactured dome indicating buckling
180mm
150mm

31
Although both the 230mm and the 180mm diameter billets produced with grease,
provided promising results, the 180mm diameter billet was preferred as the extra
material on the edges of the 230mm diameter billet had to be removed before it could
be welded to the inner tank wall. It was also found that with the use of grease the
production process provided a smooth surface finish. Tungsten inert gas (TIG) welding
was used to weld the domes to the cylinder to produce the vessel.
The assembled inner tank on a stand, that was also manufactured, is shown in Figure
20.
Figure 20: Illustration of the cryogenic inner tank mounted to a stand to facilitate MLSVI
installation.
Figure 19: Manufactured 150mm Ø domes from various billet sizes

32
The bellow with the calculated dimensions could be obtained off-the-shelf and was
welded to machined flanges. A photo of the manufactured coupling is shown in Figure
21.
Figure 21: Photo of the assembled and weld-joined inner coupling provided with flanges

33
5.2 Application of MLVSI
It was decided to use MLVSI that consists of aluminum foil shield materials and glass
paper spacers with randomly spaced fibers. These materials have a combined layer
thickness of 1.8 layers/mm and a thermal conductivity of 13.6 at 13mbar. It
was provided in sheets by Cryoshield (Pty) Ltd and had to be cut before application.
In order to reduce heat transfer due to edge effects when installing MLVSI on the
pressure vessel with spherical headers, special attention was given to the application
process of the acquired insulation. It was required to cut the insulation material layer by
layer when installing it to the inner tank. The aluminium foil and spacer material (one
layer) had a combined thickness of less than one millimetre with very low tensile stress
properties. This complicated process of cutting was very time consuming and a jig was
manufactured out of Maysonite to cut the insulation material. The cutting process using
the jig is illustrated in Figure 22.
Figure 22: Illustration of MLVSI cutting using a jig over-lay on the insulation with a newspaper
page as intermediate layer
The aluminium foil together with the paper spacer was placed face down on a table’s
surface. Due to the small layer thickness and low tensile strength of the insulation the
aluminium foil piled up when cut. This was prevented by placing paper or newspaper
over the aluminium foil and by cutting from the inside outwards along the template
edges which prevented the insulation layer from tearing. For limitation of radiation it was

34
critical that the reflective side of the aluminium foil faced up to the outside of the tank.
Figure 23 illustrates the cut configuration of one layer of insulation after the cutting
template and pile-up precaution paper layer, was removed.
Figure 23: A single layer of MLVSI ready to be installed to the inner tank
In order to insulate the inner tank alternative layers were folded over the dome ends of
the inner tank (Fig. 24). Layers were placed one over the other to cover the entire
surface area. The folding was managed in such way to eliminate possible edge effects
and the second layer was rotated 30° with respect to the previous one to overlap parting
lines of the covered layer. The gap distance between overlapping layers influences
thermal conductivities of a MLVSI assembly; therefore, the stand was used to hold the
inner tank in place while applying MLVSI to assist with the folding technique (Fig. 24).
Figure 24: Illustration of the folding process in order to limit edge effects

35
Chapter 6: Experimental Setup and Procedure
6 Experimental Setup
The experimental setup to test the effectiveness of the MLVSI application and the
coupling configurations is illustrated in Figure 25.
Figure 25: Photo of the experimental cryogenic system for measuring the performance of MLVSI
around a vessel with spherical shaped end caps
It consists of three sub-assemblies: The vacuum supply, the cryogenic vessel and the
measuring instrumentation. The vacuum supply consisted of a pipeline connected to a
vacuum pump in order to generate sufficient vacuum in the insulation space.
Gas extraction fan
Scale
Cryogenic vessel
Vacuum gauge
Vacuum pump
Vacuum pipeline
Ambient pressure
User interface
Ambient temperature

36
Vacuum pumps are widely available in different sizes and designs. A two stage rotary
vane vacuum pump (Edwards E2M18 ATEX) was selected, based on the low vacuum
pressures that could be reached with this vacuum pump. The E2M18 ATEX rotary vane
pump used has an overload device with air tight pumping chambers and gas ballast
control. These functions enable the pump to reach vacuum up to 10-3 torr. The
performance chart of two models namely the E2M18 and E1M18 vacuum pumps
respectively with and without gas ballast, is illustrated in Figure 26.
The vacuum pumping rate indicates (Fig. 26) how fast a certain volume container can
reach a vacuum and is given in cubic feet per minute (ft3/min). Due to the small volume
in the insulation space between the two tanks, it was calculated using this chart that the
required vacuum could be reached in just a few minutes. The solid line indicates the
pump’s performance with gas ballast.
Figure 27 illustrates the results obtained from experimental tests carried out on pumping
speed vs. vacuum pressure for the E2M18 model. The results show that a vacuum level
of 10-4 torr could be obtained by this model. Thus practically this pump had the capacity
to generate higher vacuum levels than theoretically required. With the experimental
setup having an insulation space of 0.015m3 it would take less than a minute to
generate a vacuum of 10-3 torr by making use of this pump.
Figure 26: E2M18 and E1M18 vacuum pumps performance chart

37
Vacuum and temperature readings were logged throughout testing and therefore it was
important to use accurate and reliable measuring instruments. It was decided to
measure vacuum with a piezo-resistive ceramic sensor. This sensor can measure
vacuum levels from 0.001mbar to 100mbar and was connected to the tank using a c-
clamp with polymer seal. The instrument functions in such way, that when it is under the
influence of pressure a thin diaphragm is bent with a resistor bridge on its back. The
bending force causes the measurement bridge to come out of tune, which creates the
measurement reading, for the applied pressure. The instrument makes use of a 9 volt
battery which makes it possible to attach it to the tank without coupling to an external
supply. The calibrated vacuum sensor is shown in Figure 28.
Figure 28: Thyracont high vacuum sensor and control unit
Figure 27: E2M18 vacuum pump experimental performance chart

38
Various temperature readings were taken mostly inside the cryogenic vessel.
Temperature measurement positions are shown in Figure 29.
Figure 29: Schematic of temperature measurement positions
The top and bottom coupling temperatures were measured making use of two type T-
thermocouples whereas three type K-thermocouples were used for the MLVSI surface
temperature, the vacuum space temperature and the ambient temperature. These
thermocouples were fitted through the wall of the outer vessel. Due to the small gaps
between the thermocouple wire and insulation material, vacuum leaks were detected.
This problem was resolved by using specially designed fittings involving thin copper
wires which were fed through a stainless steel fitting filled with resin. Thermocouple
wires were subsequently connected on both sides of the fitting to the copper wires.
Thermocouples and sensors were calibrated before any measurements were taken. An
analogue converter transferred the thermocouple resistance to a voltage signal which
was sent to a computer and converted to temperature measurements. The analogue
converter interface is shown in Figure 30.
Analogue
Figure 30: Photo of the temperature analogue interface
MLVSI
Vacuum
Coupling
From tank
To PC

39
The Scale Tronic Services, PRW model series is a high precision bench scale that was
used for boil-off measurements. This scale has the unique capability to measure up to
30kg in 0.1g divisions ensuring the feasibility to measure gas boil-off accurately. The
metal platform prevents the scale from being damaged by the cryostat (Fig. 31).
Figure 31: Schematic of the PWR high precision bench scale used to
measure system weight loss (boil-off)
6.1 Configuration Testing Procedure
In order to test a MLVSI and/or coupling configurations, it was necessary to attach the
inner tank to the stand and insulate it with a specific layer density of MLI. This insulation
installation process, in order to eliminate dome edge effects, was discussed in Section
5.3. The insulated inner tank was then carefully removed from the stand and mounted to
the bottom flange of the coupling using the copper seal. It was then mounted to the top
supply flange of the outer tank dome. After connecting the thermocouples the inner tank
was placed inside the outer tank and the assembly was closed up using the 8 hexagon
bolts provided. The system was then ready for vacuum pumping and the vacuum
sensor was used to indicate when the desired vacuum levels were reached. As soon as
the system reached vacuum pressures below 2 mbar the gate valve was closed and the
pipeline disconnected. By using the fill pipe and the scale reading, 3kg of liquid
nitrogen was carefully poured into the cryogenic vessel.

40
In order to vent boil-off gas the small extraction fan connected to the pipeline was used
(Fig. 25). The connected extraction fan was mounted on the now “empty” stand. For
safety purposes another more powerful extraction fan was installed in the room and the
electrical supply of these extraction fans was connected to the main power supply.
Temperature and pressure measurements were taken every second out relayed
through the analogue converter to the PC. When the vacuum level reached 6 mbar the
vacuum pipeline was connected again between weight readings to generate the
required vacuum level. The system’s weight was taken every minute and data saved
throughout the testing period for later processing. The discussed procedure was
followed for every test conducted as well as testing of the set-up prior to the scheduled
experimental work.
41
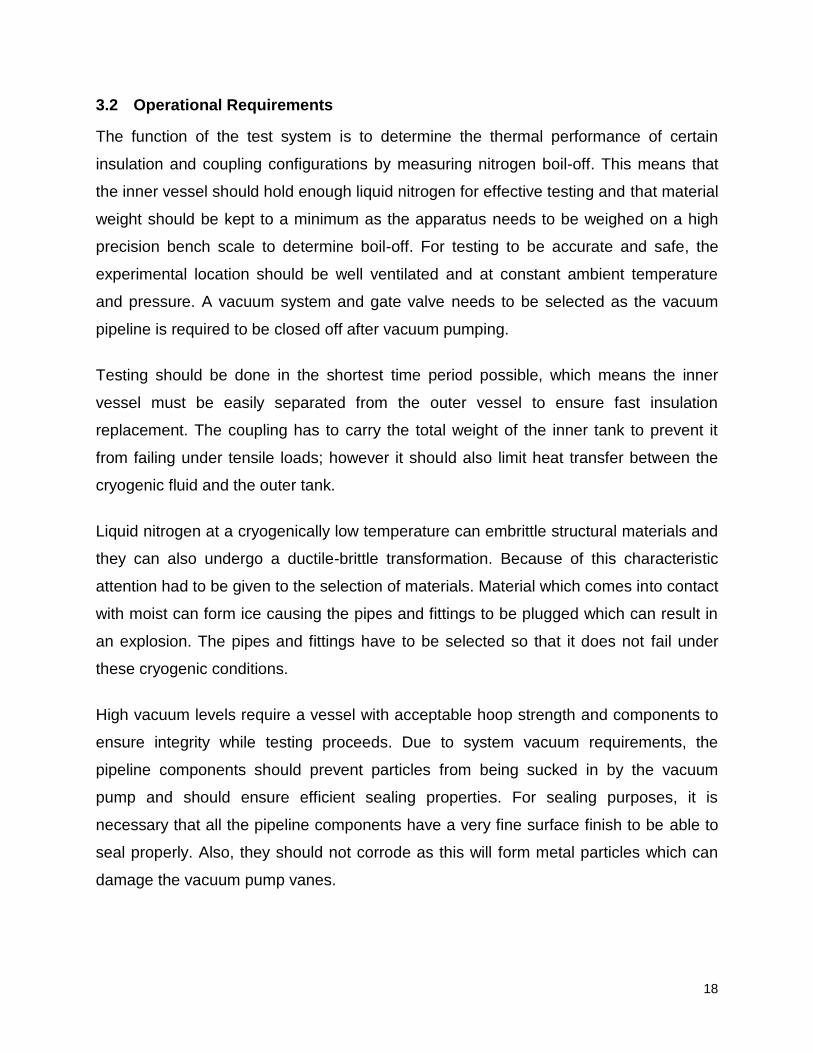
6.2 Assembly Testing
In order to test the setup a configuration of ten layers of MLVSI was installed on the
pressure vessel shaped inner tank and the performance based on nitrogen boil-off
tested using the procedure described in section 6.1. The system was tested with a
conventional straight inlet pipe configuration. This same configuration was tested the
following day for a second time and a rapidly increased boil-off rate was noticed.
One could conclude that either the cryostat was not functioning properly or the
insulation properties have changed. New insulation was installed and tested in the same
manner to determine what caused the high boil-off rate. If the cryostat functioned
properly, the test results should have been similar. Boil-off results obtained for both the
old and the new installed insulation is shown in Figure 32.
Figure 32: System weight vs. time indicating an increased boil-off weight for old insulation
The results obtained indicated a 6.5% variation in boil-off weight between the old and
the new insulation for a period of 43 minutes and the following conclusion was made.
The system was designed to test MLVSI configuration samples for short periods;
consequently the system only operated for a short period of time after which the gate
valve was opened. The nitrogen still present in the system caused ice to form on the
surface and between MLVSI layers due to the presence of moist air that entered the
23.2
23.3
23.4
23.5
23.6
23.7
23.8
1 3 5 7 9 11 13 15 17 19 21 23 25 27 29 31 33 35 37 39 41 43
Syst
em
We
igh
t (
kg )
Time ( min )
Old Insulation New Insulation

42
system. As the system reached ambient temperatures after a few hours the ice melted
forming moisture between alternative layers of the MLVSI which was absorbed by the
glass fibre spacer material. This moisture acted as a direct conduction path between
alternative layers of the MLVSI which decreased insulation performance when tested a
second time.
To confirm that moisture did form between alternative layers the insulation was removed
from the inner tank, weighed and kept in a dry place for several days. Subsequently a
second weighing was carried out and a weight loss of 2.7 grams was established. The
difference of 2.7 grams can only be ascribed to loss of moisture.
The deviation between alternative tests and the performance of the experimental
system was further tested by conducting three tests with the same configuration as
previously tested. All three tests were carried out for a period of 2 hours and the boil-off
results obtained is shown in Figure 33. The system delivered very much the same boil-
off measurements with every test conducted. A maximum variation of 0.5% was
obtained over a testing period of 110 minutes which indicated that the experimental
system was delivering reliable results. With the installation process known and the
system operating as it should, the bellowed coupling configuration was now ready to be
further evaluated.
Figure 33: System weight vs. time illustrating deviations between alternative system setup tests
22
22.1
22.2
22.3
22.4
22.5
22.6
22.7
22.8
22.9
23
0 10 20 30 40 50 60 70 80 90 100 110
We
igh
t (k
g)
Time (min)

43
6.2.1 Inner Tank Coupling Testing
Before testing the bellowed coupling performance, another test was carried out without
any coupling mounted between the inner and outer tank. The obtained results from this
test were used to compare performances of later inlet coupling configurations. Figure
34 illustrates the reworked system test results to system weight vs. time variation for the
conventional straight cylindrical inlet pipe.
Figure 34: System weight vs. time for a conventional inlet pipe.
A system weight decrease from 23.7 kg to 23.1 kg was obtained for a period of 50
minutes, indicating that 600 grams of liquid nitrogen evaporated.
The designed bellowed coupling was mounted using the provided flanges welded to the
inner and outer tank respectively (Fig 35). Thermocouples were fitted in 3mm Ø holes
provided in the top and bottom flanges. The assembled system was again filled with
liquid nitrogen as described and the boil-off as weight loss of the system determined
during subsequent tests.
23.1
23.2
23.3
23.4
23.5
23.6
23.7
23.8
1 3 5 7 9 11 13 15 17 19 21 23 25 27 29 31 33 35 37 39 41 43 45 47
Syst
em
We
igh
t (k
g)
Time (min)

44
Figure 35: Photo of the coupling installed with top and bottom thermocouples shown
This coupling was tested and the following system weight vs. time measurements was
obtained (Fig. 36).
Figure 36: System weight vs. time measurement for the bellowed coupling
The system weight results obtained indicate that 21% (130 grams) less liquid nitrogen
boiled off using the bellowed coupling. One could also make use of the boil-off rate
processed from the system weight measurements to estimate if an improvement was
made. This boil-off rate for both the inlet pipe as well as the bellowed coupling is
illustrated in Figure 37.
23.2
23.3
23.4
23.5
23.6
23.7
23.8
1 3 5 7 9 11 13 15 17 19 21 23 25 27 29 31 33 35 37 39 41 43
Syst
em
We
igh
t (
kg )
Time ( min )
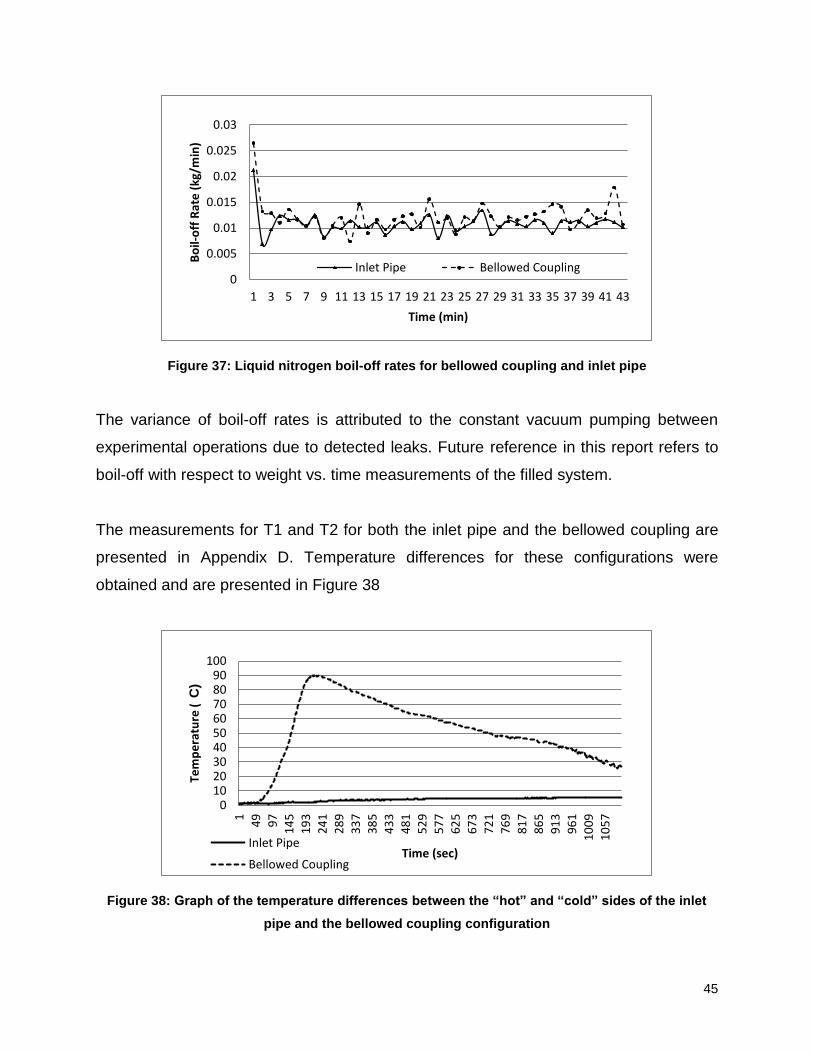
45
Figure 37: Liquid nitrogen boil-off rates for bellowed coupling and inlet pipe
The variance of boil-off rates is attributed to the constant vacuum pumping between
experimental operations due to detected leaks. Future reference in this report refers to
boil-off with respect to weight vs. time measurements of the filled system.
The measurements for T1 and T2 for both the inlet pipe and the bellowed coupling are
presented in Appendix D. Temperature differences for these configurations were
obtained and are presented in Figure 38
Figure 38: Graph of the temperature differences between the “hot” and “cold” sides of the inlet
pipe and the bellowed coupling configuration
0
0.005
0.01
0.015
0.02
0.025
0.03
1 3 5 7 9 11 13 15 17 19 21 23 25 27 29 31 33 35 37 39 41 43
Bo
il-o
ff R
ate
(kg
/min
)
Time (min)
Inlet Pipe Bellowed Coupling
0102030405060708090
100
1
49
97
14
5
19
3
24
1
28
9
33
7
38
5
43
3
48
1
52
9
57
7
62
5
67
3
72
1
76
9
81
7
86
5
91
3
96
1
10
09
10
57
Tem
pe
ratu
re (
C
)
Time (sec) Inlet Pipe
Bellowed Coupling

46
The temperature difference over the inlet pipe was almost constant throughout the
testing period, indicating a higher heat transfer rate. The temperature difference for the
bellowed coupling reached a maximum value in the first few minutes and then steadily
declined as T1 dropped. From the results obtained it is concluded that the employed
method to limit heat transfer by making use of a thin walled bellow delivered better
performance although boil-off rates were still high.
The MLVSI surface temperature (T4) was plotted vs. time and shown in the Figure 39.
The insulation surface temperature decreased from about -32°C in the first 250
seconds. From this point further on the temperature alternated between temperature
differences of 10°C.
Figure 39: MLVSI surface temperature
The specific shape of the curve can be attributed to the vacuum pump constantly being
switched on and off to keep the desired vacuum level. This also indicates the effect
vacuum levels had on the surface temperature of MLVSI. It was concluded that for
every 1 mbar vacuum lost, the insulation surface temperature would rise with 2.5°C to
3°C. This means that at a vacuum pressure of 6 mbar the tank’s insulation surface
temperature was 10°C more than at 2 mbar which may drastically influence heat
transfer to the cryogenic fluid.
-45
-40
-35
-30
-25
-20
-15
19
21
83
27
43
65
45
65
47
63
87
29
82
09
11
10
02
10
93
11
84
12
75
13
66
14
57
15
48
16
39
17
30
18
21
19
12
20
03
20
94
21
85
Surf
ace
Te
mp
era
ture
(
C)
Time (sec)

47
Chapter 7: Assembly Modifications
7 Background
This chapter reports on modifications applied to the inlet/outlet coupling design in effort
to further reduce boil-off. To further investigate heat transfer through the coupling an
ANSYS finite element analysis (FEA) was carried out. The results of this analysis are
reviewed and the resulting additional modifications to the coupling are presented.
Modifications with respect to the MLVSI installation procedure involving tank geometry
changes to further reduce edge effects and boil-off are presented.
7.1 Coupling Modifications
7.1.1 Coupling Modification A
Analysis of the bellowed coupling indicated that heat transfer through the bellowed
coupling could be reduced by reducing the cross sectional area and the heat flux path of
the bellow. Since space requirements excluded further lengthening of the bellow it was
decided to reduce the cross sectional area thickness of the bellow from 0.4 mm to 0.25
mm. A CAD model of the modified coupling (Coupling A) is shown in Figure 40.
Figure 40: A CAD model of the assembled Coupling A
Due to the reduction in material thickness of the bellow (from 0.4mm to 0.25 mm) the
circumferential stresses would have been too high when carrying the inner tank load.

48
This problem was addressed by implementing a support system to handle the weight of
the inner tank without adding unnecessary heat flow paths to the system (Fig. 40). An
exploded view of the modified design is shown in the Figure 41.
Coupling A was produced from a SAE 316L (0.25 mm) stainless steel bellow and the
support system consists of 3 mm diameter stainless steel rods and two triangular
shaped bases. The triangular bases were manufactured from 2 mm thick stainless steel
plates using a CNC milling machine and were welded to the flanges using tungsten inert
gas welding. The use of the rods would have caused unacceptable heat transfer
between flanges when welded directly to the triangular bases giving rise to the use of
ZAL 45 fibrous alumina insulation (Thermal Ceramics Inc., with a thermal conductivity of
0.23 W/m.K at 100 °C) to manufacture small cylindrical insulation spacers to limit this
heat transfer. Due to the fragile nature of this insulation material aluminium spacers
were required to align these cylindrical insulation spacers and the support rods
(Drawing CRYO - IN 0011, Appendix F).
Top insulation spacer
ZAL 45 insulation cylinder
Thin walled bellow
Triangular shaped bases
Flange
Connecting rod
Bottom insulation spacer
Figure 41: Exploded view of the CAD model of Coupling A

49
The two column supports were aligned perfectly to ensure an equal stress distribution
through the ZAL 45 insulation and the support rods on loading. The envisaged heat
transfer paths through the modified supports are illustrated in the cross sectional view
shown in Figure 42.
Figure 42: Heat flow path through modified column support
The ZAL 45 insulation as well as the bottom spacer has larger inner diameters than the
connecting rods to avoid direct contact that would otherwise defeat the purpose. The
top and bottom spacers position the connecting rod so that the rod does not touch the
inner sidewall of the insulation nor the bottom spacer material. Heat is transferred
through the connecting rod to the top spacer then back through the ZAL 45 insulation to
the bottom spacer from where it is then transferred through the support base to the
bottom flange. An illustration of the modified assembled coupling (Coupling A) is shown
in Figure 43.
Low temperature
High temperature Stainless steel support base
Aluminium spacers
ZAL45 insulation spacer
Stainless steel connecting rod

50
Set screws
Bellow vanes
The alignment as well as the axial stability of Coupling A was set using the connecting
rod set crews. The connecting rods were set to a specific length to ensure that the
bellow vanes did not touch which otherwise could lead to heat being transferred as a
result of conduction between alternative below vanes.
Coupling A was tested in the manner described in Section 6.2 and results obtained
(Data presented in Appendix D) indicate that a 32% (190 grams) reduction in boil-off
was realised when compared to the conventional straight inlet nozzle systems test data.
Figure 43: Photo of the manufactured and assembled coupling A

51
7.1.2 Coupling Modification B
Coupling A was further modified by installing high conductivity copper plates to the
bellow to act as heat sinks. These copper plates were manufactured in a concave dome
form and were installed between the vanes of the thin walled bellow (Fig 44).
Figure 44: Photo of the manufactured and assembled coupling B
This assembly of heat sinks is composed of two halves per disc which were soldered to
each other and to the bellow. The copper heat sinks were provided with 3 x 10mm Ø
holes spaced triangularly to allow the protrusion of the coupling connecting rods and to
eliminate heat transfer through contact with the rods. The domed discs had a bright
surface finish to reduce radiation effects.
This coupling (Coupling B) was tested in the manner described in Section 6.2. The
results of this configuration test indicate that a 38 % (230 grams) reduction in boil-off
weight was obtained when compared to the results of the conventional inlet pipe
systems test (Data presented in Appendix D).
UNS C12220
Cu heat sink

52
7.1.3 Coupling Modification C
To determine if heat transfer due to radiation between the bellow and the surrounding
external tank could be reduced, a modification was made to Coupling B. A schematic of
this modification to Coupling B is presented in Figure 45.
Figure 45: A schematic illustration of a ZAL 45 part for coupling C to limit radiation
For this purpose a cylindrical insert (85mm diameter with a circular recess to a depth of
12 mm was machined from ZAL 45 insulation board to accommodate 10 wrapped layers
of MLVSI. To accommodate this modification (Coupling C) one of the copper heat sink
discs was removed (Fig.46)
Figure 46: Photo of the manufactured and assembled Coupling C with wrapped MLSVI to limit
radiation to the bellow.
Heat sink
ZAL 45 insulation
10 layers of MLVSI
Bellow
Vacuum Gap

53
Coupling C was tested in the same manner as before. The data obtained indicate that
by using the Coupling C configuration a 45% (270 grams) reduction in boil-off weight,
when compared to using a conventional inlet pipe, can be realised. However, it was
found that the use of the ZAL 45 base material in this configuration (Coupling C) was
prone to fracturing when handled on completion of test runs. This phenomenon can
possibly be ascribed to the freeze fracturing during service due to residual moist
contained in interconnected pores typical of this type of fibrous insulation material.

54
7.1.4 FEM Coupling Steady State Simulation
In order to further optimise the design of Coupling B, the heat transfer through the
assembly was modelled with the aid of FEM using the ANSYS code (ANSYS). In
addition, a FEM was also applied to the assembly to find the optimum positions of the
copper heat sinks.
The material properties presented in Table 4 were assigned to the components of the
Coupling B CAD model imported to ANSYS as required for simulation purposes.
Table 4: Thermal properties for components used in the FEM model
Component Isotropic
Conductivity (Wm-
1C-1)
Specific Heat
(Jkg-1C-1)
Stainless steel 15.1 480
ZAL 45 insulation 1.4 750
Aluminium 114 875
Copper 400 385
This coupling configuration was simulated using a boundary temperature difference of
40°C between the top and bottom flanges of the coupling.
Figure 47 illustrates a colour distribution of the modelled heat flux through Coupling B.
These results indicate a maximum heat flux through the support plates and the
aluminium spacers. In other words more heat was transferred through the support
columns than the bellow itself and therefore confirms the design consideration and the
effective reduction in heat surface area that would inhibit conductivity. These results
indicate that heat flux through the coupling can be further reduced through selection of
support rod material with a lower conductivity.

55
Figure 47: FEA result of the heat flux through Coupling B
By taking note of the temperature colour legend (Fig. 48) of both Figure 48a and Figure
48b it is clear that the temperature difference t, between the top and bottom insulation
spacers of Coupling C (glass fibre composite) has increased compared to that of the
Coupling B configuration (with stainless steel rods). Furthermore, software probes
applied to both ANSYS simulations (Fig 48a and 48b) show that the support rods had a
temperature of -53°C underneath the middle copper plate for Coupling C whereas for
Coupling B this temperature was determined to be -46°C indicating an “insulation”
improvement of 13ºC.

56
a b
Figure 48: FEA of the steady state temperature distribution (ºC) through modified couplings: a)
stainless steel columns and b) glass fibre columns
Additional simulations were run to determine the optimum positioning of the installed
heat sinks. Three simulations were run on modified models (based on the Coupling B
configuration) with the copper heat sinks placed at various vertical positions on the
bellow. Results obtained for each of these simulations are presented in Figure 49.

57
Figure 49: Temperature distribution through Coupling B for various copper heat sinks positions;
a) Evenly spaced, b) evenly spaced on the high temperature side, c) evenly spaced on the low
The results of software controlled temperature probes placed in the centre of the bellow
circumference of each temperature distribution simulation result (Fig. 49 a, b and c) are
shown in Table 5.
Table 5: ANSYS probe temperatures for heat sink configurations of Coupling B
Position of heat sink discs Evenly
Spaced
High Temperature
Side
Low Temperature
Side
Maximum Temperature (°C) -20 -20 -20
Minimum Temperature (°C) -80 -80 -80
Probe Temperature (°C) -51 -45 -54
The model of Coupling B simulated in this manner, returned a circumference probe
temperature of -51°C when the copper heat sinks were evenly spaced. A temperature of
-54°C was returned with the copper heat sinks placed at the low temperature side of this

58
coupling configuration. It is thus concluded that for optimum system performance the
heat sinks should be evenly spaced on the low temperature side of the bellow.
7.2 MLVSI Application Modifications
The effective geometry of the inner tank was changed with the aim to limit installation
time. It was also aimed at reducing heat transfer through the spherical shaped headers.
7.2.1 Elimination of Edge Effects by Changing Tank Geometry
In this section a modification to further reduce heat transfer edge effects resulting from
the required application technique of MLVSI over the pressure vessel header sections,
is presented.
The inner tank outside geometry was changed by using ZAL 45 insulation end caps to
flatten the dome surfaces in order to get an external cylindrically shaped pressure
vessel (Fig 50) that would simplify the application of the MLSVI over the headers.
Figure 50: Exploded view of a CAD model of the inner tank and the ZAL45 insulation end caps
An illustration of the assembly procedure is shown in Figure 51a, b and c.
MLVSI
ZAL 45 end cap
Inner tank

59
a b c
Figure 51: CAD model illustration of end cap and MLSVI installation to a pressure vessel
ZAL 45 end caps with the same diameter as the inner tank were machined and were
placed at the ends of the inner tank (Fig.51a). MLI was then cut in circular discs that
overlapped the diameter of vessel. These discs were then laid over the end caps and
then cut along radials to the circumference of the vessel in order to fold the cut
segments as required underneath the MLI as rectangular shaped MLVSI layers were
applied(Fig.51a,b).
The boil-off test results (Fig. 52) obtained show that this modification had no effect on
boil-off rate over a period of 45 minutes.
Figure 52: System weight vs. time for folding and end cap configurations respectively
23
23.1
23.2
23.3
23.4
23.5
0 5 10 15 20 25 30 35 40 45
Syst
em
We
igh
t (
C
)
Time (min)
End Caps Folded

60
7.3 Discussion
A graph showing the comparative system weight (boil-off) of the cryogenic systems with
different inlet/outlet coupling configurations (Straight inlet pipe, Coupling A and B) is
presented in Figure 53. All tests were conducted with a MLVSI layer density of 10.
Figure 53: System weight vs. time for different coupling configurations tested
Table 6 presents the reduction in boil-off weight for the different coupling configurations
calculated from the data of Figure 53.
Table 6: Boil-off improvements for modified couplings
No Connection Boil-off
Weight
(g/45min )
Weight
saved (g)
Reduction with
respect to base (1)
(%)
1 Inlet Pipe 600 - -
2 Bellowed Coupling 470 130 23
3 Coupling A 410 190 32
4 Coupling B 370 230 38
23.1
23.2
23.3
23.4
23.5
23.6
23.7
1 3 5 7 9 11 13 15 17 19 21 23 25 27 29 31 33 35 37 39 41 43
Syst
em
We
igh
t (k
g)
Time (min)
Inlet Pipe Bellowed Coupling
Coupling A Coupling B
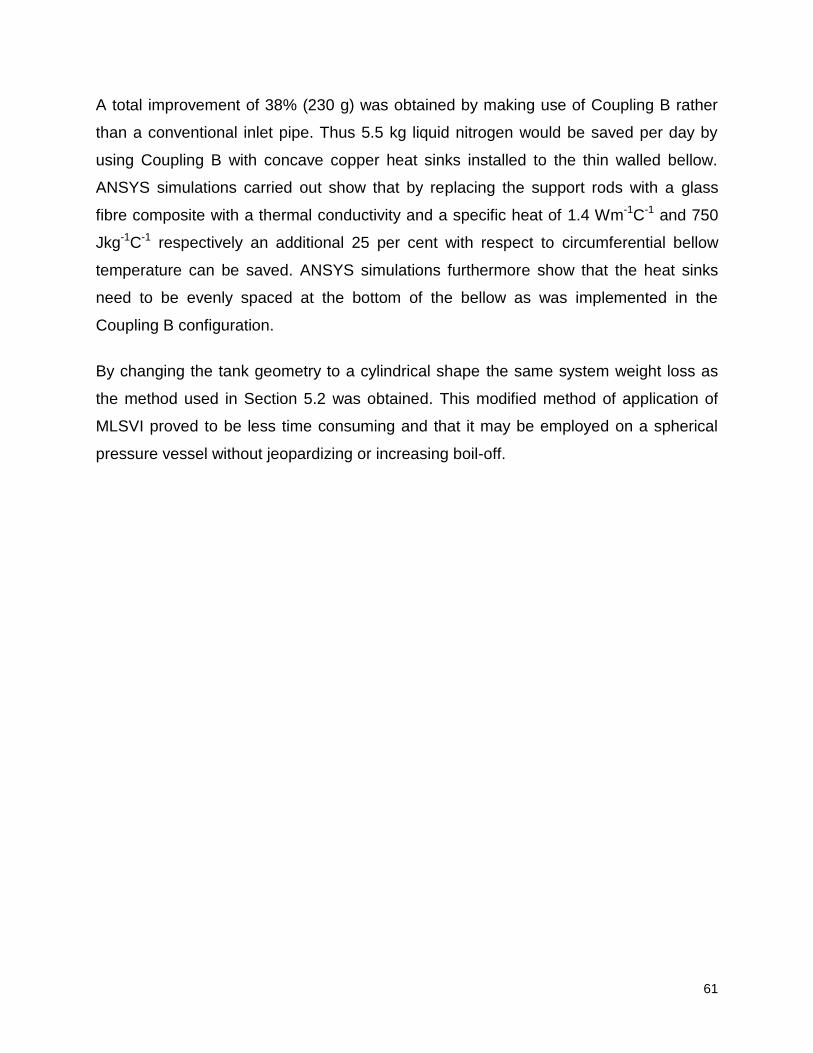
61
A total improvement of 38% (230 g) was obtained by making use of Coupling B rather
than a conventional inlet pipe. Thus 5.5 kg liquid nitrogen would be saved per day by
using Coupling B with concave copper heat sinks installed to the thin walled bellow.
ANSYS simulations carried out show that by replacing the support rods with a glass
fibre composite with a thermal conductivity and a specific heat of 1.4 Wm-1C-1 and 750
Jkg-1C-1 respectively an additional 25 per cent with respect to circumferential bellow
temperature can be saved. ANSYS simulations furthermore show that the heat sinks
need to be evenly spaced at the bottom of the bellow as was implemented in the
Coupling B configuration.
By changing the tank geometry to a cylindrical shape the same system weight loss as
the method used in Section 5.2 was obtained. This modified method of application of
MLSVI proved to be less time consuming and that it may be employed on a spherical
pressure vessel without jeopardizing or increasing boil-off.

62
Chapter 8: Optimum System
8 Introduction
In this section all modifications that had a positive impact to reduce boil-off and that
were finally integrated in one single system and tested to evaluate the performances of
selected redesigned coupling and MLVSI configurations, are presented.
8.1 Optimum System Performance
A model of the optimum coupling is shown in Figure 54.
Figure 54: Model of optimum coupling
The shape of the copper heat sinks were however modified to the shape shown in
Figure 54 but were installed as concluded in the ANSYS simulation carried out to find
the optimum positioning on the bellow at the low temperature side of the coupling - that
is nearest to the cryogen vessel. For this test the stainless steel supports rods were
replaced by 3mm diameter fiber glass. The coupling (Coupling D) was assembled and
installed as shown in Figure 55.

63
Figure 55: Photo of the manufactured and assembled optimised coupling (Coupling D)
A layer density of 25 was applied to the inner tank using the method discussed in
Section 5.2.
A test was conducted for a boil-off period of two hours to enable the system to reach
steady state conditions. The temperature difference between the top and bottom sides
of Coupling D measured is plotted in Figure 56.
Figure 56: Temperature difference over the optimised coupling (Coupling D)
0
10
20
30
40
50
60
70
17
41
47
22
02
93
36
64
39
51
25
85
65
87
31
80
48
77
95
01
02
31
09
61
16
91
24
21
31
51
38
81
46
11
53
41
60
71
68
01
75
31
82
61
89
91
97
22
04
52
11
8
Tem
pe
ratu
re D
iffe
ren
ce (
C
)
Time (sec)

64
A temperature difference of 60°C was obtained over Coupling D which indicated a 25%
increase in t between the lower and upper parts of this coupling compared to the t
generated when using the Coupling B configuration during configurations tests.
The system weight measurements vs. time representing boil-off for the optimized
system are shown in Figure 57.
Figure 57: Optimised System Weight vs. Time Measurement
The results indicate that a 250 grams boil-off for a period of 45 minutes has taken place
(Figure 57). This was a 58% (350grams) decrease in system weight indicating that 8.5
liters of liquid nitrogen were saved per day with respect to the conventional inlet pipe.
One should keep in mind that this test was conducted with 25 layers of MLVSI instead
of the 10 used for other tests and can also be attributed to the lower boil-off weight.
Figure 58 gives the boil-off rate (kg/10min) vs. time and illustrates that it takes 80
minutes for the system to reach steady state conditions. The amount of liquid nitrogen
evaporated per day can also be calculated using this boil-off rate graph. After steady
state conditions were reached the boil-off rate was approximately 0.06kg/10min. This
indicates that when the system reaches steady state conditions the nitrogen loss will be
360g per hour (what the boil-off will be with liquid hydrogen is still not known)
22
22.1
22.2
22.3
22.4
22.5
22.6
22.7
22.8
22.9
0 10 20 30 40 50 60 70 80 90 100 110
We
igh
t (k
g)
Time (min)
45 min
Δ weight

65
Figure 58: Evaporated mass (boil-off) for ten minute increments vs. time showing how steady
state conditions is reached
0.05
0.055
0.06
0.065
0.07
0.075
10 20 30 40 50 60 70 80 90 100 110Evap
ora
ted
Mas
s fo
r 1
0 m
inu
tes
(kg)
Time (min)
Steady State

66
Chapter 9: Conclusions
The application of MLVSI to cryogenic storage systems is the most promising insulation
for these applications. MLVSI performance goes hand in hand with coupling
performance and together these two critical components can limit boil-off of gas.
A method used to insulate the spherical header, with MLVSI, of a typical pressure
vessel by making use of a jig to cut the insulation before application, was tested and
documented. This method delivered promising results although it was a very time
consuming installation process. Another method was implemented where the spherical
headers of such a pressure vessel was covered with ZAL 45 material in order to
achieve a cylindrical surface without changing the actual pressure vessel geometry.
This method was tested and the same boil-off weight was obtained as for the previous
method although the installation process was less time consuming.
The conventional inlet pipe used in cryogenic systems to limit heat transfer between the
inner and outer tanks was replaced with a specially designed bellowed coupling and
tests indicate that a 21% reduction in boil-off weight with respect to the inlet pipe was
obtained. This bellowed coupling was improved by further decreasing the bellow wall
thickness and a 32% improvement was obtained with respect to the conventional inlet
pipe.
Further modifications were made by installing concave copper discs between alternative
bellow vanes in order to act as heat sinks and limit heat transfer. This coupling showed
a remarkable boil-off weight decrease of 38% with respect to the inlet pipe.
The above mentioned coupling was simulated by making use of a FEM using ANSYS
code and it was found that it would be possible to further improve the coupling by
replacing the support bases and the rods with a glass fibre composite material. It was
also found that for best coupling performance the copper heat sinks had to be installed
at the low temperature side of the bellow.
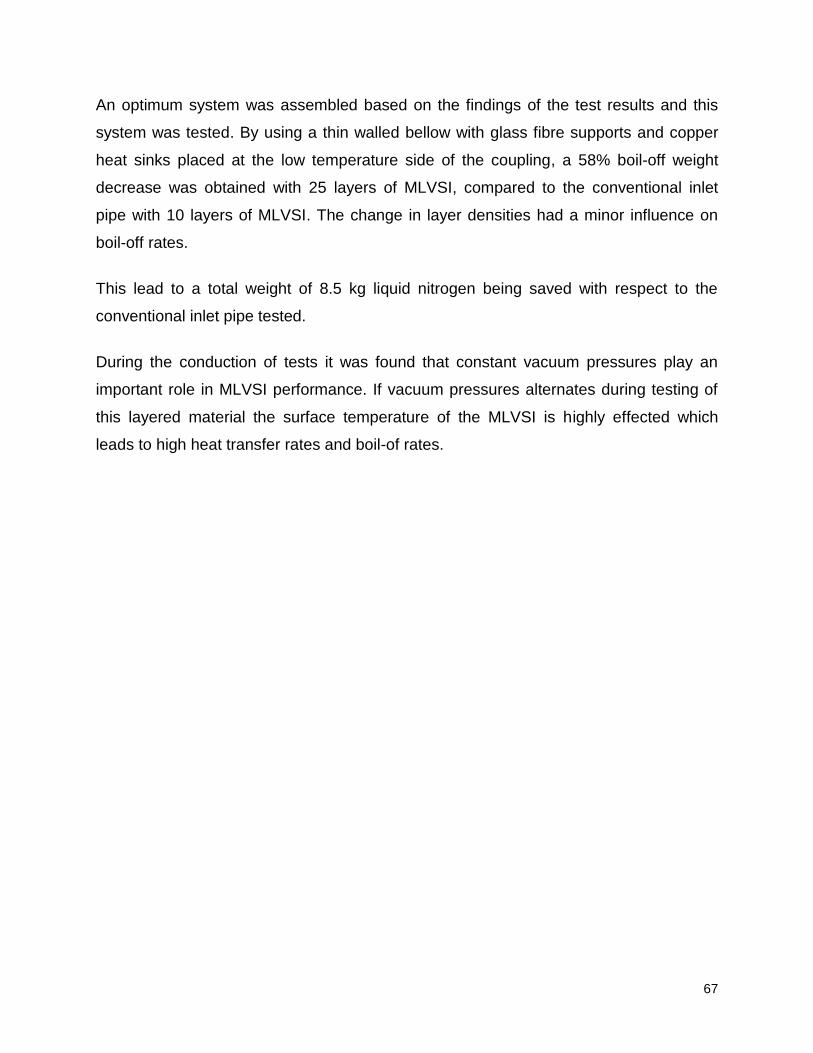
67
An optimum system was assembled based on the findings of the test results and this
system was tested. By using a thin walled bellow with glass fibre supports and copper
heat sinks placed at the low temperature side of the coupling, a 58% boil-off weight
decrease was obtained with 25 layers of MLVSI, compared to the conventional inlet
pipe with 10 layers of MLVSI. The change in layer densities had a minor influence on
boil-off rates.
This lead to a total weight of 8.5 kg liquid nitrogen being saved with respect to the
conventional inlet pipe tested.
During the conduction of tests it was found that constant vacuum pressures play an
important role in MLVSI performance. If vacuum pressures alternates during testing of
this layered material the surface temperature of the MLVSI is highly effected which
leads to high heat transfer rates and boil-of rates.

68
9 Bibliography
[1] Shell International Limited, "The evolution of the worlds energy systems," 1996.
[2] Yaung Seo Kim and Byung Ha Kang, "Thermal design analysis of a liquid hydrogen
vessel," International Journal of Hydrogen Energy, pp. 133-141, 1999.
[3] Sulliva and Laurence, "Hydrogen as an AlternativeEnergy," 2008.
[4] Heiserman and L. David, Exploring Chemical Elements and their compounds.: TAB
Books, 1992.
[5] Li Zhou, "Progress and Problems in Hydrogen Storage Methods," Renewable and
Sustainable Energy Reviews, pp. 395-408, 2004.
[6] M Salvador Aceves, Espinosa Francisco Loza, and Ledesma Elias Orozco, "High
density outomotive hydrogen storage with cryogenic capable pressure vessels,"
International Journal of Hydrogen Energy, pp. 1219-1226, 2009.
[7] James E. Fesmire, "Cryogenic Test Laboratory," 2005.
[8] V Benda, B Bozzini, G Riddone, and G Vandoni, "Measurement on different MLI
systems between 77 K and 4 K and their application in cryogenic engineering,"
European Organization for Nuclear Engineering, 2000.
[9] Frank P Incropera, David P Dewitt, Theodore L Bergman, and Adrienne S Lavine,
Fundamentals of Heat and Mass Transfer. Hoboken: John Wiley & Sons, 2005.
[10] Wei Wei, Li Xiangdong, Wang Rongshun, and Li Yang, "Effects of structure and
shape on thermal performance of Perforated Multi-Layer Insulation Blankets,"
Applied Thermal Engineering, pp. 1264-1266, 2009.
[11] G Kawaguchi and K Nagai, "Vacuum insulation spacer," 4409770, 1983.

69
[12] J.E. Fesmire and S.D. Augustynowicz, "Cryogenic Thermal Insulation Systems,"
Cryogenics Test Laboratory, NASA Kennedy Space Center, Orlando, Florida, 2005.
[13] J P Wikstrom, J E Fesmire, and S D Augustynowicz, "Cryogenic insulation
systems," Florida, 1999.
[14] H. John. (2009, April) NASA Tech Briefs. [Online].
http://www.techbriefs.com/component/content/article/5050
[15] Wei Wei, Li Xiangdong, Wang Rongshun, and Li Yang, "Effects of structure and
shape on thermal performance of Perforated Multi-Layer Insulation Blankets,"
Applied Thermal Engineering, pp. 1264-1266, 2009.
[16] M G Kagner, "Thermal Insulation in Crygenic Engineering," Isreal Program for
Scientific Translation, pp. 152 - 166, 1969.
[17] James E Fesmire et al., "Improved Methods of Testing Cryogenic Insulation
Materials," Florida, 2008.
[18] John D Gonczy, Ralph C Niemann, and William N Boroski, 5,143,770, 1988.
[19] "Guide to The Safe Use of Liquid Nitrogen," University College Dublin, 2010.
[20] Frederick J Edeskuty and Walter F Stewart, Safety in the Handeling of Cryogenic
Fluids. New York: Plenum Press, 1996.
[21] Valdis Wish, "The Long Farewell," 2009.
[22] Fromal. (2010) Alternative fuel source. [Online].
http://hubpages.com/hub/Alternative-Fuel-Sources

70
[23] Jae-Sung Kwon, Choong Hyo Jang, and Tae-Ho Song, "Effective thermal
conductivity of varies filling materials for vacuum insulation panels," International
Journal of Heat and Mass Transfer, pp. 5525-5532, July 2008.
[24] J E Fesmire and S D Augustynowicz, "Cryogenic insulation system for soft
vacuum," Florida,.
[25] Thomas M Flynn, Cryogenic Engineering.: Marcel Dekker Press, 2005.
[26] R. Immel and M. Stadie, "Construction for multi-layered vacuum super insulated
cryogenic tank," US 20070114233A1, May 24, 2007.
[27] Subodh K. Mital and Roy M. Sullivan, "Preliminary design for unmanned aerial
vehicle applications evaluated," 2007.
[28] Jae Sung Kwon, Hyo Choong Jang, Haeyong Jung, and Tae Ho Song, "Effective
thermal conductivity of various filling materials for vacuum insulation panels,"
International Journal of Heat and Mass Transfer, pp. 5525-5532, 2009.
[29] Fricke, Buttner, Gaps, Gross, and Nilsson, "Solid conductivity of laoded fibrious
insulations," Insul. Mater. Test. Alli., pp. 66-78, 1990.
[30] K W Heckle, B E Scholtens, S D Augustynowicz, and J E Fesmire, "Equipment and
Methods for Cryogenic Thermal Insulation Testing," Florida, USA, 2004.
[31] S L Bapat, KG Narayankhedlar, and T P Lukose, "Experimental inverstigations of
multilayerinsulation," Cryogenics, pp. 711 - 719, 1990.
[32] Ph Lebrun, L Mazzone, V Sergo, and B Vullierme, "Investigation and qualification of
thermal insulation systems between 80 K and 4.2 K.," European organization for
nuclear research, 1992.

71
[33] Benjamin S Blanchard and Wolter J Fabrycky, System Engineering and Analysis,
4th ed., Eric Svendsen, Ed. New Jersey: Pearson Prentice Hall, 2006.
[34] Hanser Vieweg and Verlag Vieweg. (2010) The Vacuum Technology Book.
[Online]. www.pfeifer-vacuum.net

72
Appendix A: Theoretical Model
Theoretical Model Used for Testing Various Insulation Materials.
The spherical thin walled container used to calculate boil-off rates for liquid nitrogen
using different insulation material is shown in Figure 68. The container has a diameter
of 0.5 m and an insulation thickness of 25 mm. The nitrogen is kept at 77K and the
container has a vent for boil-off purposes and the ambient air is at 300K. The heat
transfer rate and the nitrogen boil-off are calculated for every type of insulation. Results
are shown in Table 7.
Table 7: Boil-off rate for various Insulation materials used to insulate a thin walled nitrogen
container
Insulation Material Thermal
Conductivity
(W/mK)
Heat Transfer
(W)
Boil-off rate
(l/day)
Boil-off time
day(s)
Perlite powder 0.4 1785 958.9 0.07
Polyurethane Foam 0.17 1001 537.7 0.12
Hollow Glass Spheres 0.047 333.7 179.3 0.37
Expanded Perlite 0.036 260.4 139.9 0.47
Air 0.024 177.2 95.22 0.69
Extruded Polystyrene ( R-12) 0.023 170.1 91.41 0.72
Glass Microsphere (100 torr) 0.018 134.3 72.17 0.91
Aerogel (10 torr) 0.008 60.77 32.65 2.01
Silica Powder in a Vacuum 0.0017 13.06 7.018 9.33
Figure 59: Thin-walled insulated nitrogen tank

73
Cylindrical MLVSI winding machines
1) Frame 4) Spacer material
2) Sleeve 5) Handle
3) Metalized film roll 6) Copper sleeve
Convex Outer Surface
Mandrel
Axle
Reflective Material
Spacer Material Frame
Figure 60: Multi-Layer Insulation Wrapping Machine (NASA) [25]
Figure 61: Fabricating Apparatus for Multilayer Insulation Blankets [29]

74
Appendix B: Safety
Liquid Nitrogen and Its Health Effects
On April 1883 nitrogen was first liquefied at the Jagiellonian University by Zygmunt
Wróblewski and Karol Olszewski. It is produced by fractional distillation of liquid air.
Liquid nitrogen boils at 77 K (−196 °C) at atmospheric pressure which causes rapid
freezing when in contact with living tissue. It is odourless, tasteless, colourless and even
not irritating. This means it has no warning properties which make it very dangerous to
work with. When nitrogen is boiling off in a closed space it will replace the air to levels
lower than required by a human being. It has been discovered by OSHA that 19.5%
oxygen is the minimum concentration of air to survive. When inhaling large amounts of
nitrogen with limited oxygen, symptoms like dizziness, vomiting, loss of consciousness
and death may occur. Death is usually a result of bad judgment which leads to
unconsciousness that prevents self rescue. According to the University College Dublin
safety office the oxygen concentration following a spill can be determined using the
equation [19]:
Where
is the volume of the room in m3
is the volume of the liquid in m3 x expansion coefficient – 682

75
Cryostat Safety Requirements
Disobeying safety rules can result in injuries such as cold burns and frostbite when body
parts get in contact with cryogens. Some other injury incidents that can occur is when
gas vaporises and there is a sudden volume change which can cause the vessel to
burst violently [20]. The reason for this is because of the instant volume expansion with
a factor up to 1000. Consequently, cryogenic liquids require specialized storage
containers. In addition to the above safety risks mentioned, Stewart et.al is of the
opinion that structural embrittlement is also a hazard at these low temperatures.
Recommended safety wear when handling cryogenic equipment is as follows:
Cryo-gloves
Face Shield
Safety Goggles
Lab Coat
Long Pants
This PPE (personal protection equipment) is recommended by the Department of
environmental Health and Safety. Furthermore, all metal jewellery has to be removed
from hands and wrists when filling such cryostat or dewar. The cryogen must not splash
or left unattended and in the event of a cold burn the following should be kept in mind
[19].
Any restrictive clothing should be removed, but not from the frozen tissue. Flush the
affected area with tap water less than 40 °C to return to normal body temperature. Heat
should not be applied to affected area and do not rub and cover with a loose, sterile
dressing until medical assistance.

76
Appendix C: Calculations
Calculations for percentage boil-off per day for various insulation materials. The
program EES (Engineering Equation Solver) was used for calculations.
"Spherical, thin walled metallic container” T_in = 77 " Liquid nitrogen" r_in = 0.25 "Radius of inside container" t = l/1000 "Silica powder insulation thickness" T_out = 300 "Ambient air" h_air = 20 "Convective coefficient of air" r_out = r_in + t "Radius of outside container" rho_N = 804 "Nitrogen density" h_fg = 2 * 10^ 5 "latent heat of evaporation" {k = 0.0017} "Evacuated silica conduction" l = 25 Rt_cond = 1/(4*pi*k) * (1/r_in - 1/r_out) Rt_conv = 1/((h_air * 4 * pi)*r_out^2) R_tot = Rt_cond + Rt_conv deltaT = (T_out - T_in) q_1 = deltaT/R_tot q_1 = m_dot_ps * h_fg m_dot_pd = m_dot_ps * 3600 * 24 V_1 = (m_dot_pd / rho_N) * 1000 "l/day" P_days = (V_volume/V_1) "days to total boil-off" V_volume = ((4/3)*pi*r_in^3)*1000 Z = (V_1/V_volume) * 100 "percentage per day of total capacity"
Results

77
The following boil-off vs. insulation graph shows how gas boil-off decreases as
insulation thickness increases.
Figure 62: Gas Boil-off vs. Insulation Thickness
The following boil-off vs. tank radius graph shows how gas boil-off decreases as the
tank radius increases.
Figure 63: Gas Boil-off vs. Tank Radius

78
Calculations for determining the cryostat’s inner and outer tank dimensions.
"Inner Tank 1................................................................................................................................." "Variables" rho = 808.607 r_1 = 0.08 "Sperical Volume" V_sp_1 = ((4/3)) * pi * (r_1^3) "Cylinder Volume" V_sil_1 = pi*(r_1^2)*h_sil_1 V_tot_1 = V_sp_1 + V_sil_1 V_tot_1 = 0.005 "Weight Nitrogen" M_1 = rho * (V_tot_1 - (V_sp_1/2)) "Outer Tank 2..............................................................................................................................." "Variables" t = 0.0223 "Insulation Thickness" s = 0.020 "Vacuum Space" r_2 = t + s + r_1 h_sil_2 = h_sil_1 + a "Aerogel Thickness" a = 0.060 "Sperical Volume" V_sp_2 = ((4/3)) * pi * (r_2^3) "Cylinder Volume" V_sil_2 = pi*(r_2^2)*h_sil_2 V_tot_2 = V_sp_2 + V_sil_2
Results

79
Appendix D: Experimental Data
Figure 64: Top and bottom coupling temperatures vs. time for inlet pipe
Figure 65: Top and bottom coupling temperatures vs. time for coupling
-40
-35
-30
-25
-20
-15
-10
-5
01
33
65
97
12
9
16
1
19
3
22
5
25
7
28
9
32
1
35
3
38
5
41
7
44
9
48
1
51
3
54
5
57
7
60
9
64
1
67
3
70
5
73
7
76
9
80
1
83
3
86
5
89
7
Tem
pe
ratu
re (
C
)
Time (sec) Top
Bottom
-60
-50
-40
-30
-20
-10
0
10
1
35
69
10
3
13
7
17
1
20
5
23
9
27
3
30
7
34
1
37
5
40
9
44
3
47
7
51
1
54
5
57
9
61
3
64
7
68
1
71
5
74
9
78
3
81
7
85
1
88
5
91
9
95
3
Tem
pe
ratu
re (
C )
Time ( sec ) Bottom
Top

80
Figure 66: Top and bottom coupling temperatures vs. time for improved Coupling A
Figure 67: System weight vs. time for the coupling compared to the improved Coupling A
-50-45-40-35-30-25-20-15-10
-50
1
44
87
13
0
17
3
21
6
25
9
30
2
34
5
38
8
43
1
47
4
51
7
56
0
60
3
64
6
68
9
73
2
77
5
81
8
86
1
90
4
94
7
99
0
10
33
10
76
11
19
Tem
pe
ratu
re (
C )
Time ( sec ) Bottom
Top
23.2
23.3
23.4
23.5
23.6
23.7
23.8
1 3 5 7 9 11 13 15 17 19 21 23 25 27 29 31 33 35 37 39 41 43
Syst
em
We
igh
t (
kg )
Time ( min ) Designed Coupling
Improved Coupling A

81
Figure 68: System weight vs. time for coupling A compared to Coupling B
Figure 69: System weight vs. time for coupling B compared to Coupling C
23.2
23.3
23.4
23.5
23.6
23.7
23.8
1 3 5 7 9 11 13 15 17 19 21 23 25 27 29 31 33 35 37 39 41 43
Syst
em
We
igh
t (
kg )
Time ( min ) Coupling A
Coupling B
23
23.1
23.2
23.3
23.4
23.5
0 5 10 15 20 25 30 35 40 45
Tem
pe
ratr
e (
C
)
Coupling B
Coupling C

82
Figure 70: Top and bottom coupling temperatures vs. time for ZAL 45 insulation
Figure 71: Top and bottom coupling temperatures vs. time for optimum system
-60
-50
-40
-30
-20
-10
0
1
90
17
9
26
8
35
7
44
6
53
5
62
4
71
3
80
2
89
1
98
0
10
69
11
58
12
47
13
36
14
25
15
14
16
03
16
92
17
81
18
70
19
59
20
48
21
37
22
26
23
15
Tem
pe
ratu
re (
C
)
Time (sec)
top
bottom
-90
-80
-70
-60
-50
-40
-30
-20
-10
0
1
76
15
1
22
6
30
1
37
6
45
1
52
6
60
1
67
6
75
1
82
6
90
1
97
6
10
51
11
26
12
01
12
76
13
51
14
26
15
01
15
76
16
51
17
26
18
01
18
76
19
51
20
26
21
01
Tem
pe
ratu
re (
C
)
Time (sec)

83
Appendix E: Part List and Suppliers
The following parts were obtained off the shelf.
Description Supplier Item No Qty
DN 25 ISO-KF Corrugated Hose, Flexible Air & Vacuum Technologies (Pty) Ltd 120SWN025-0500 1
DN 25 ISO-KF Centering Ring Air & Vacuum Technologies (Pty) Ltd 112ZRG025 3
DN 25 ISO-KF Clamp Air & Vacuum Technologies (Pty) Ltd 110BSR025 3
DN 25 Gate Valve Air & Vacuum Technologies (Pty) Ltd 110VSM025 1
COF Elastomer Seal Air & Vacuum Technologies (Pty) Ltd 602DOR300-S1 1
M6 Hexagon Head Screw with Nut Air & Vacuum Technologies (Pty) Ltd 420BSC025-35 14
DN 25 CF Half Nipple Fixed Top / Bottom Air & Vacuum Technologies (Pty) Ltd 420FRA025-25-52 2
DN 25 CF Copper Gasket Air & Vacuum Technologies (Pty) Ltd 490DFL025-S10 20
ISO-KF Diaphragm Bellows Air & Vacuum Technologies (Pty) Ltd 120SFM025-10 1

84
Appendix F: Design Drawings
The following manufacturing drawings were included for parts not obtained off the shelf.
ASSEMBLIES SUB-ASSEMBLIES ITEM NO. DRAWING NO.
CRYOSTAT CRYO
CRYOSTAT EXTERNALS CRYO - EX
Outer Tank Wall 1 CRYO - EX 001
Outer Tank Dome 2 CRYO - EX 002
Stand 3 CRYO - EX 003
DN 25 Vacuum Fitting 4 CRYO - EX 004
DN 25 ISO-KF Corrugated Hose 5 -
DN 25 ISO-KF Centering Ring 6 -
DN 25 ISO-KF Clamp 7 -
DN 25 Gate Valve 8 -
E2M18 Edwards Vacuum Pump 9 -
DN 16 Vacuum Coupling 10 CRYO - EX 005
Outer Tank Flange 11 CRYO - EX 006
COF Elastomer Seal 12 -
M6 Hexagon Head Screw 13 -
M6 Hexagon Nut 14 -
CRYOSTAT INTARNALS CRYO - IN
DN 25 CF Half Nipple Fixed Top 1 -
Coupling 2 CRYO - IN 001
Improved Coupling A 20 CRYO - IN 0011
Improved Coupling B 21 CRYO - IN 0012
Optimum Coupling Design 22 CRYO - IN 0013
Inner Tank Cylinder 3 CRYO - IN 002
Inner Tank Top Dome 4 CRYO - IN 003
Inner Tank Bottom Dome 5 CRYO - IN 004
DN 25 CF Half Nipple Fixed Bottom 6 -
M6 Hexagon Head Screw 7 -
M6 Hexagon Nut 8 -
DN 25 CF Copper Gasket 9 -
MANUFACTURING Male and Female Dies - CRYO - MA
PARTS
DRAWING CONTENTS
Drawings of parts obtained from the shelf is not included - please check parts list and suppliers