Embed Size (px)
Citation preview

The FDA: The Key to Moving The FDA: The Key to Moving Forward. An overview of the Forward. An overview of the Letter of Intent and the SPPBLetter of Intent and the SPPB
Jack M. Guralnik, MD, PhDJack M. Guralnik, MD, PhD
FDA and Drug Indications:
•Most indications are for the treatment, prevention or diagnosis of recognized diseases or conditions, or treatment of manifestations or symptoms of recognized conditions
•Are sarcopenia, weakness or limited function in the older population potential indications for drug approvals?
•When indication is established, need outcome measure that reflects benefit for that indication.
FDA Clinical Trial Outcome Assessments (COAs)
•Used to provide substantiation for treatment benefit claims
•Two processes for FDA submission and review
– As part of a drug application review
– Under the Drug Development Tool (DDT) Qualification Process
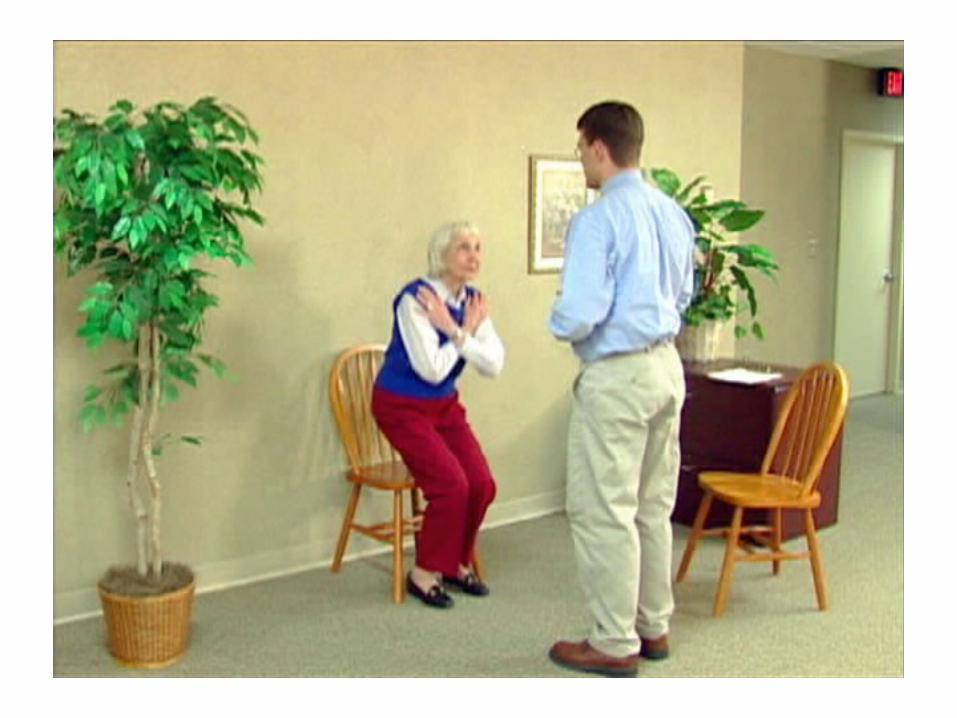
Objective Performance Measure Objective Performance Measure of Physical Functioningof Physical Functioning
Assessment instrument in which an individual Assessment instrument in which an individual is asked to perform a specific task and is evaluated is asked to perform a specific task and is evaluated in an objective, standardized manner using in an objective, standardized manner using predetermined criteria, which may include counting predetermined criteria, which may include counting of repetitions or timing of the activity of repetitions or timing of the activity as appropriate.as appropriate.
Examples of Objective Performance Tests Used to Examples of Objective Performance Tests Used to Evaluate Functional LimitationsEvaluate Functional Limitations
Pegboard testPegboard test
Picking up objectPicking up object
Lifting 10 poundsLifting 10 pounds
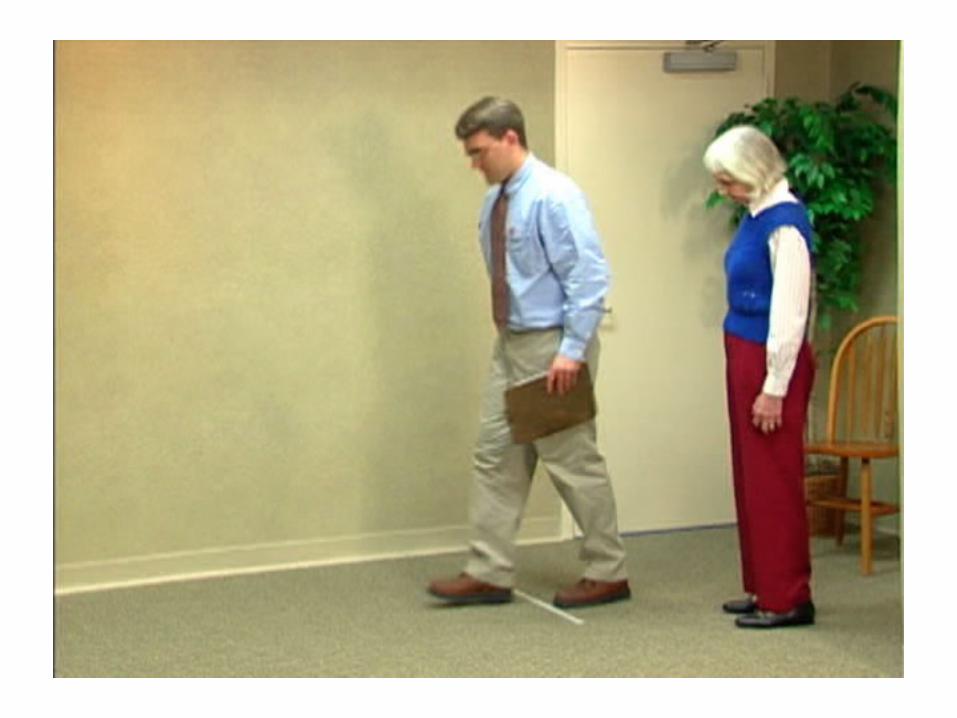
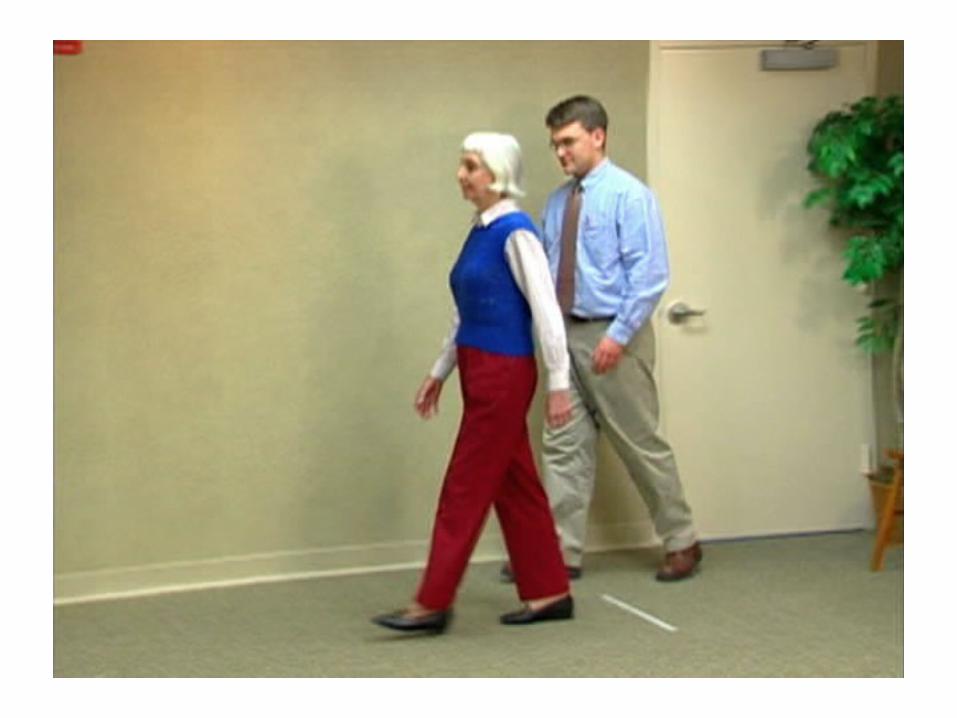
Gait speedGait speed
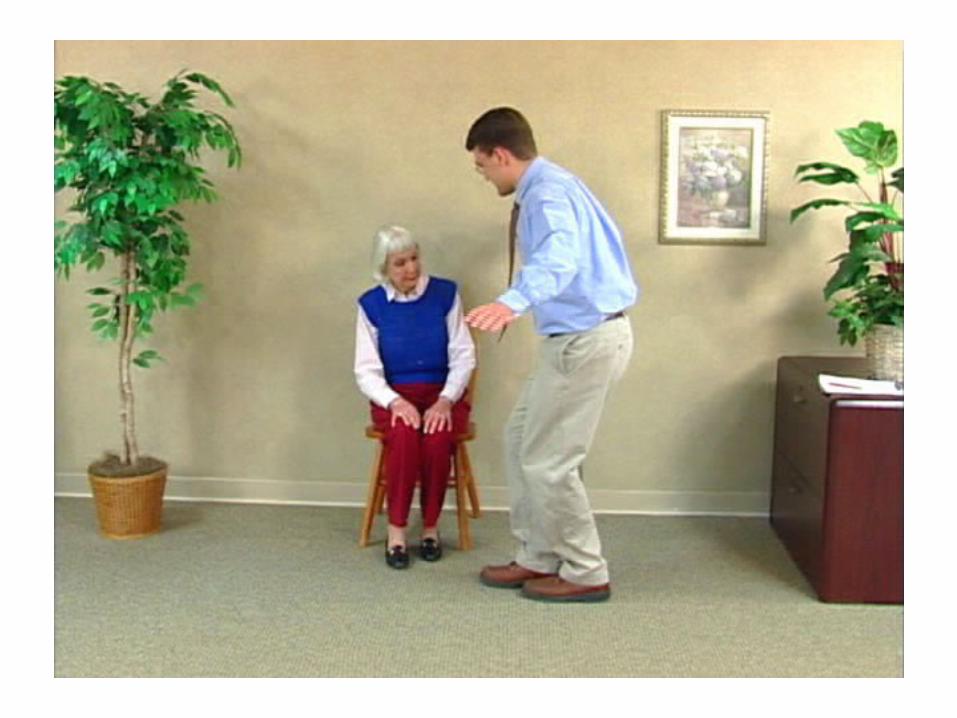
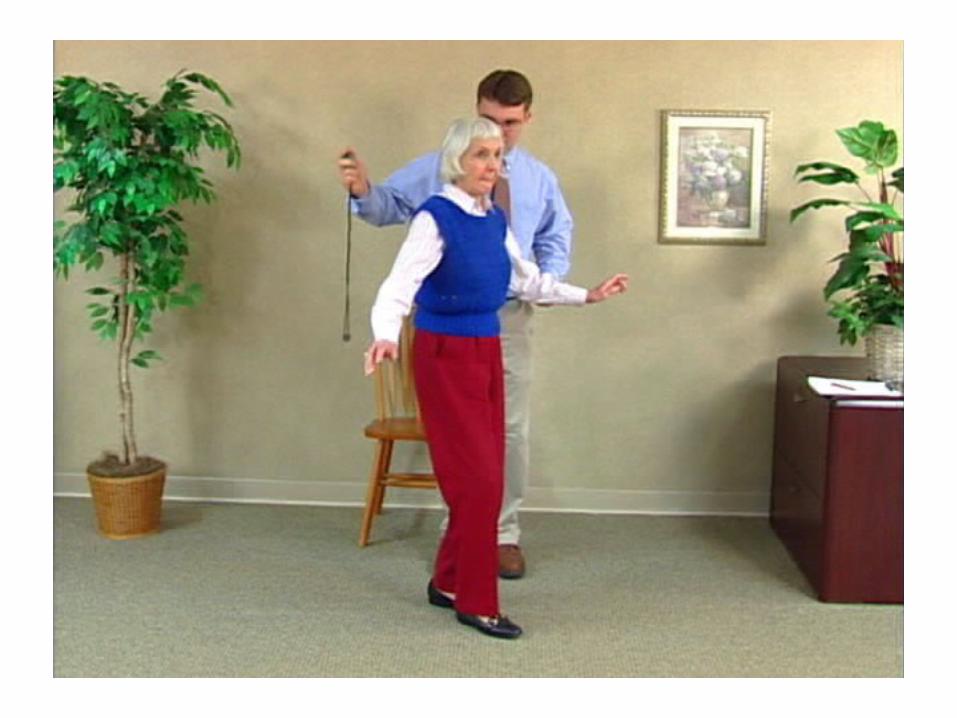
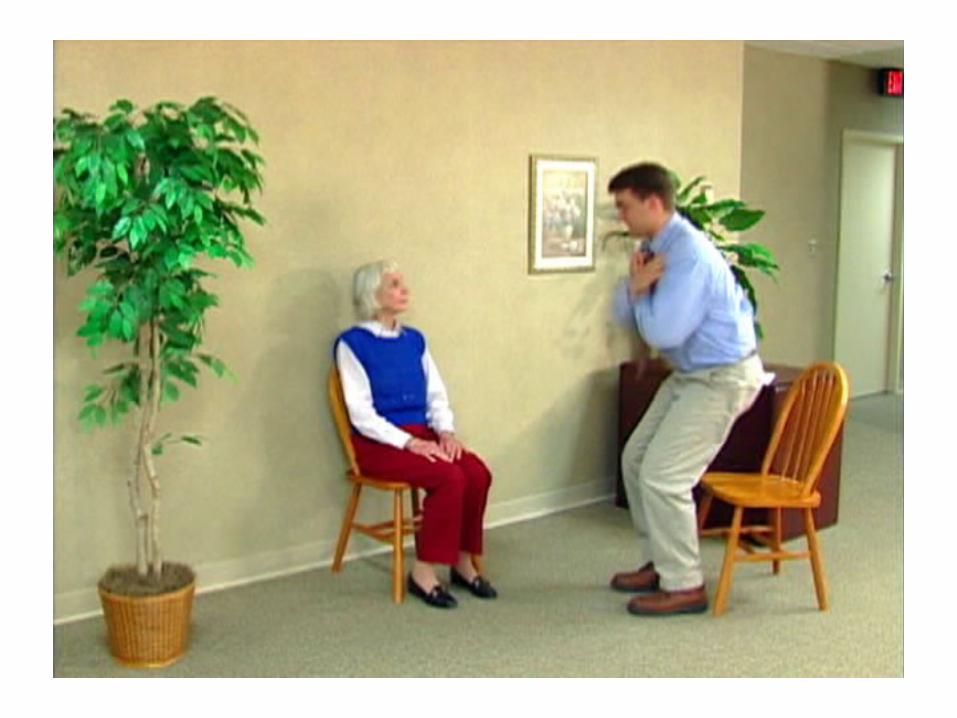
Chair rise – single and repeatedChair rise – single and repeated
Stair climbStair climb
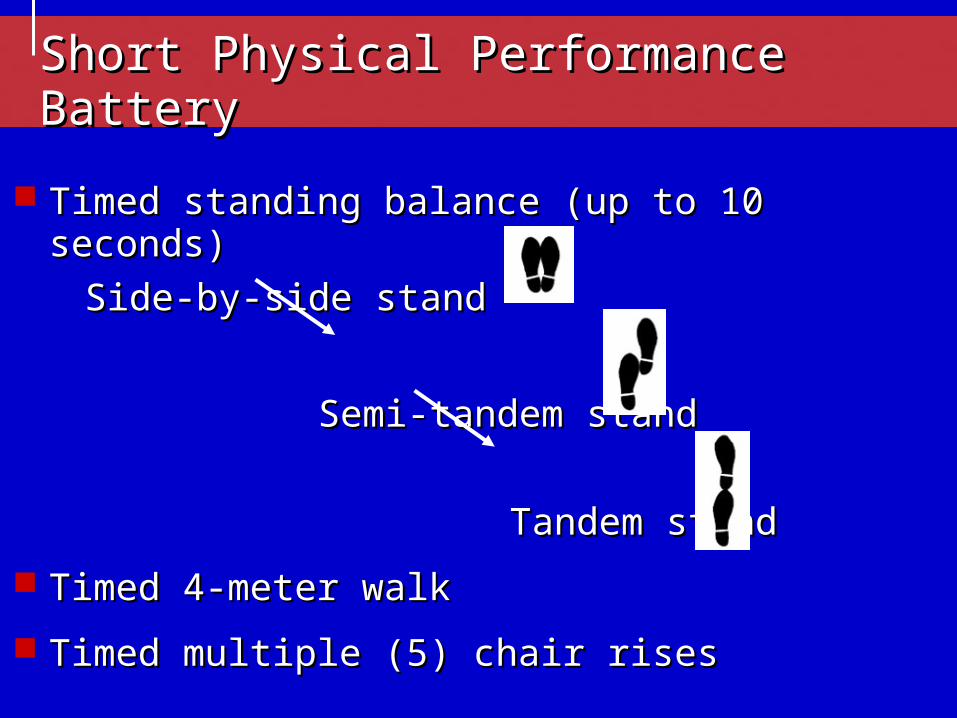
Short Physical Performance BatteryShort Physical Performance Battery
Timed standing balance (up to 10 seconds)Timed standing balance (up to 10 seconds)
Side-by-side standSide-by-side stand
Semi-tandem standSemi-tandem stand
Tandem standTandem stand
Timed 4-meter walkTimed 4-meter walk
Timed multiple (5) chair risesTimed multiple (5) chair rises
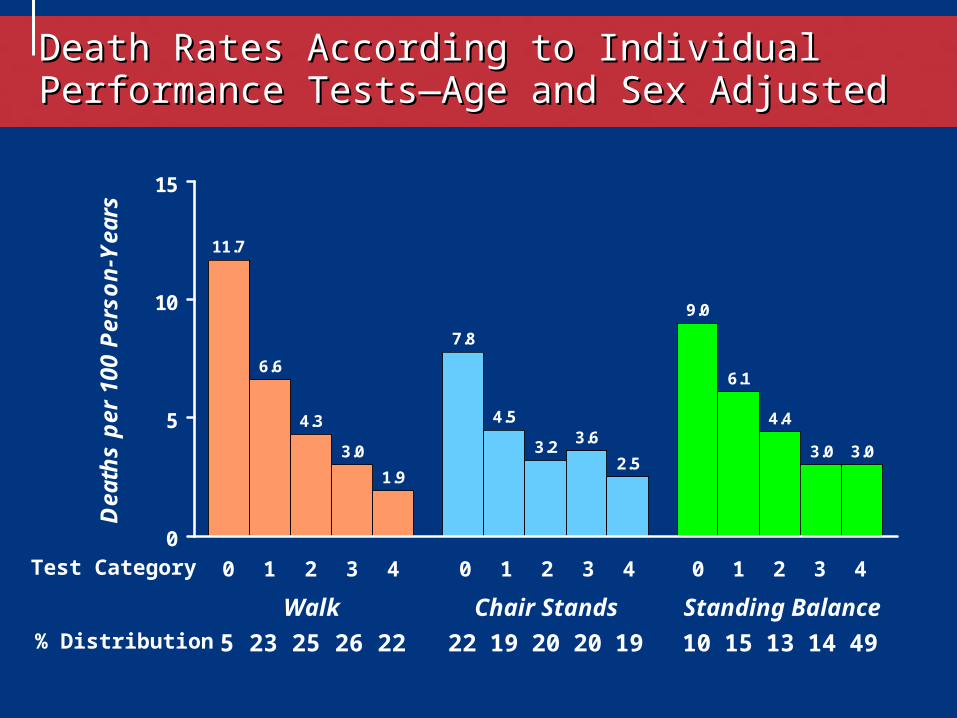
Death Rates According to Individual Performance Death Rates According to Individual Performance Tests—Age and Sex AdjustedTests—Age and Sex Adjusted
11.7
7.8
9.0
6.6
4.5
6.1
4.3
3.2
4.4
3.03.6
3.0
1.92.5
3.0
0
5
10
15
Dea
ths
per
100
Per
son
-Yea
rs
Walk Chair Stands Standing Balance% Distribution 5 23 25 26 22 22 19 20 20 19 10 15 13 14 49
0 1 2 3 4Test Category 0 1 2 3 4 0 1 2 3 4
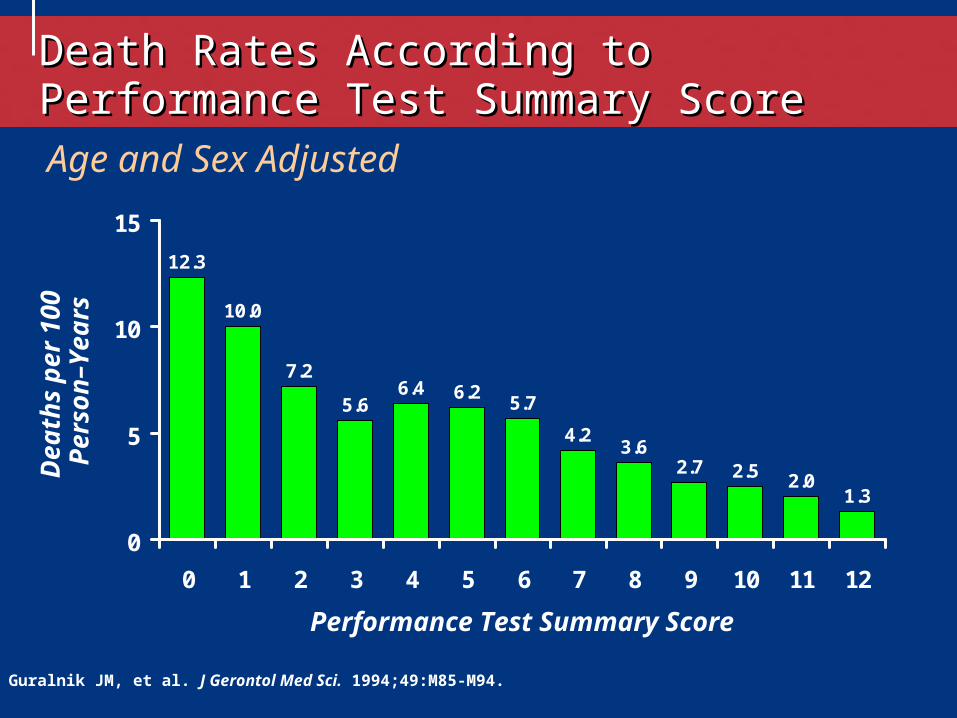
10.0
7.2
5.66.4 6.2
5.7
4.23.6
2.7 2.5 2.01.3
12.3
0
5
10
15
0 1 2 3 4 5 6 7 8 9 10 11 12
Age and Sex Adjusted
De
ath
s p
er 1
00
Pe
rso
n–
Yea
rs
Performance Test Summary Score
Guralnik JM, et al. J Gerontol Med Sci. 1994;49:M85-M94.
Death Rates According to Performance Test Death Rates According to Performance Test Summary ScoreSummary Score
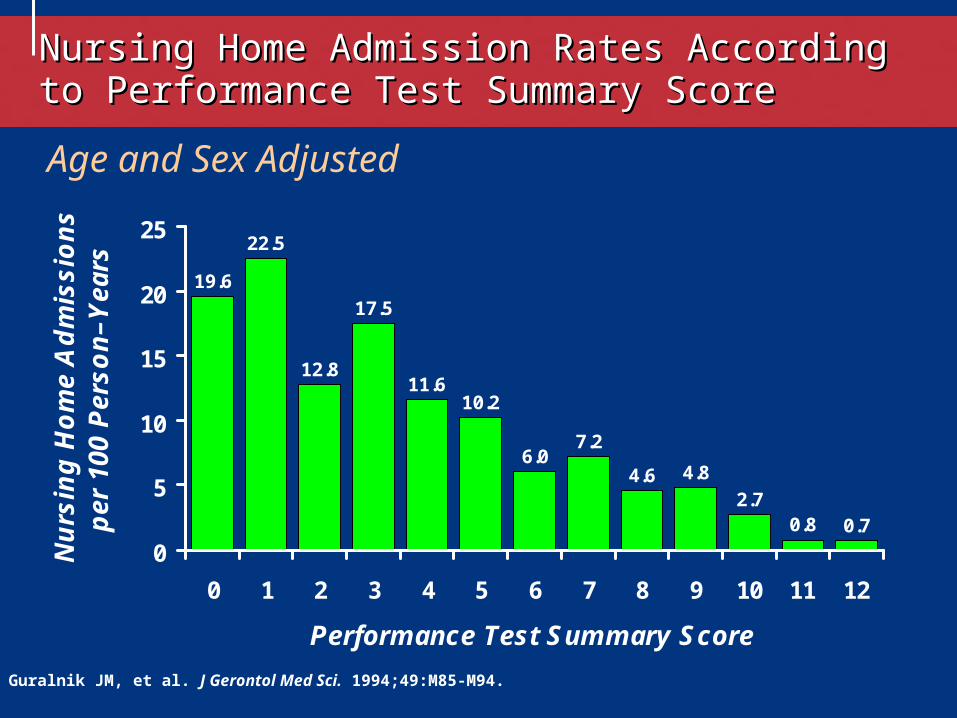
19.6
22.5
12.8
17.5
11.610.2
6.07.2
4.6 4.8
2.70.8 0.7
0
5
10
15
20
25
0 1 2 3 4 5 6 7 8 9 10 11 12
Performance Test Summary Score
Nu
rsin
g H
om
e A
dm
issi
on
s p
er 1
00 P
erso
n–Y
ears
Age and Sex Adjusted
Guralnik JM, et al. J Gerontol Med Sci. 1994;49:M85-M94.
Nursing Home Admission Rates According to Nursing Home Admission Rates According to Performance Test Summary ScorePerformance Test Summary Score
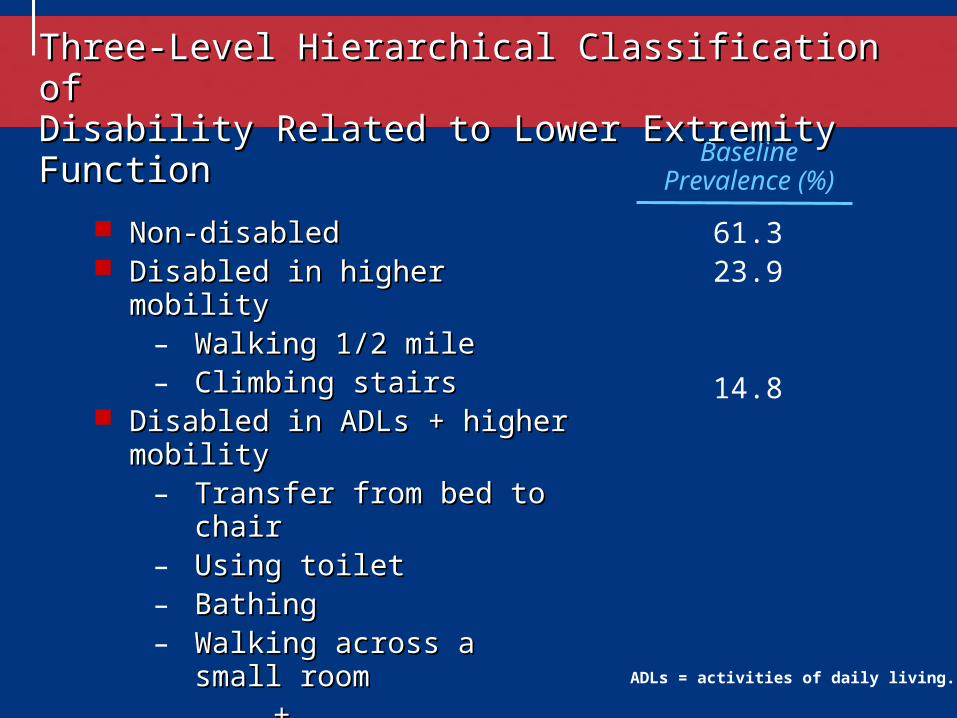
61.323.9
14.8
BaselinePrevalence (%)
Three-Level Hierarchical Classification of Three-Level Hierarchical Classification of Disability Related to Lower Extremity FunctionDisability Related to Lower Extremity Function
Non-disabledNon-disabled Disabled in higher mobilityDisabled in higher mobility
– Walking 1/2 mileWalking 1/2 mile– Climbing stairsClimbing stairs
Disabled in ADLs + higher mobilityDisabled in ADLs + higher mobility– Transfer from bed to chairTransfer from bed to chair– Using toiletUsing toilet– BathingBathing– Walking across a small roomWalking across a small room
++– Walking 1/2 mileWalking 1/2 mile– Climbing stairsClimbing stairs
ADLs = activities of daily living.
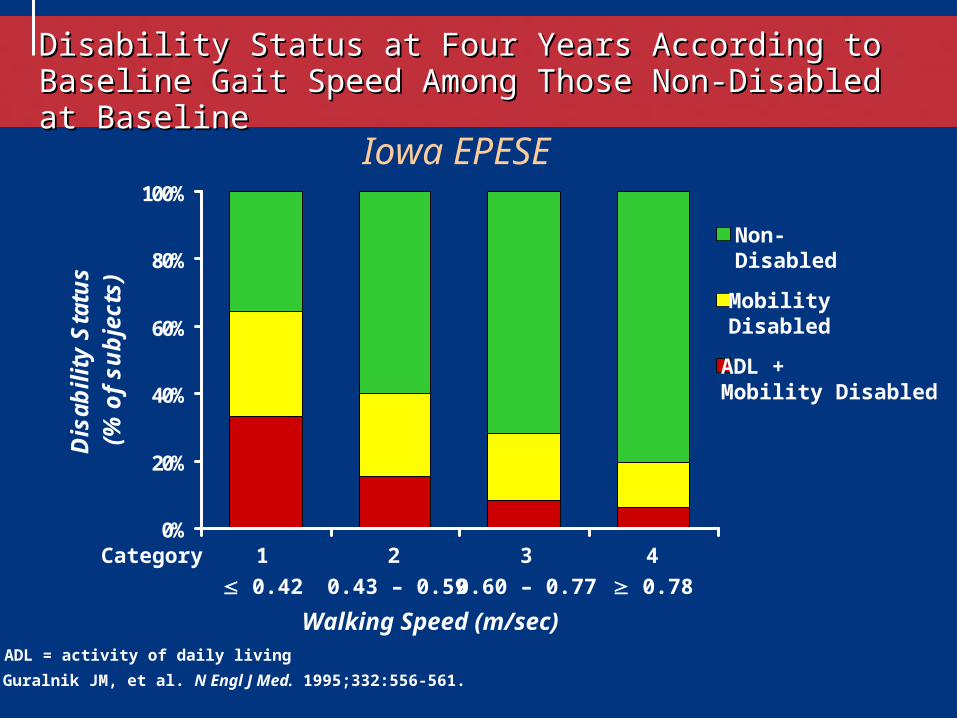
Disability Status at Four Years According to Baseline Gait Disability Status at Four Years According to Baseline Gait Speed Among Those Non-Disabled at BaselineSpeed Among Those Non-Disabled at Baseline
0%
20%
40%
60%
80%
100%
Dis
abil
ity
Sta
tus
(% o
f su
bje
cts)
Guralnik JM, et al. N Engl J Med. 1995;332:556-561.
0.42 0.43 – 0.59 0.60 – 0.77 0.78
Walking Speed (m/sec)
Iowa EPESE
ADL = activity of daily living
Category 1 2 3 4
Non-Disabled
Mobility Disabled
ADL + Mobility Disabled
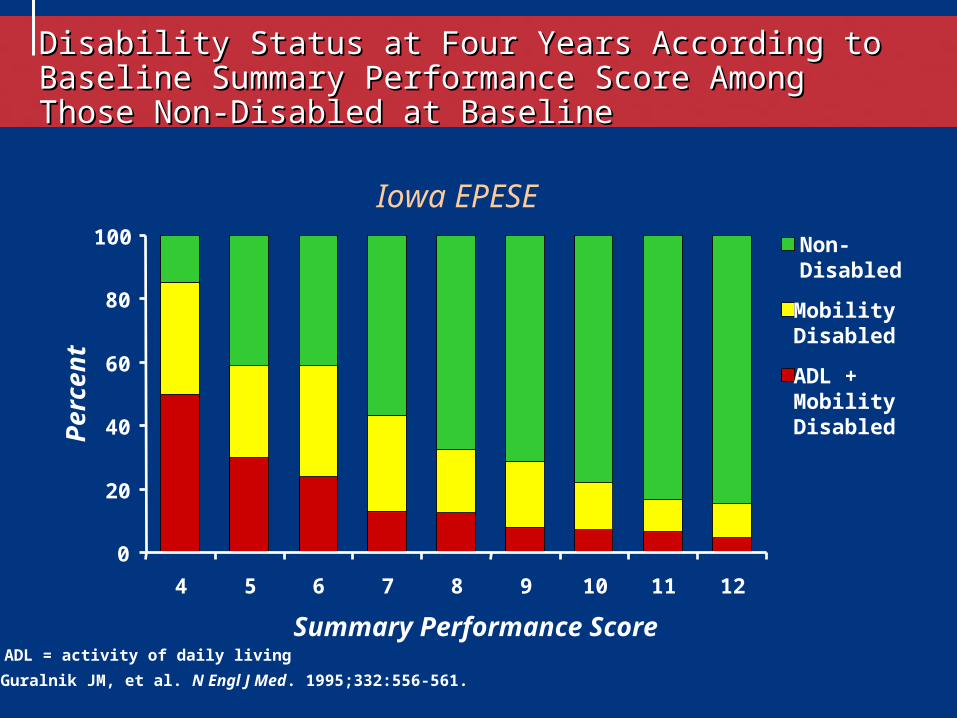
Guralnik JM, et al. N Engl J Med. 1995;332:556-561.
Iowa EPESE
Disability Status at Four Years According to Baseline Disability Status at Four Years According to Baseline Summary Performance Score Among Those Non-Disabled at Summary Performance Score Among Those Non-Disabled at BaselineBaseline
0
20
40
60
80
100
4 5 6 7 8 9 10 11 12
Summary Performance Score
Pe
rce
nt
ADL = activity of daily living
Non-Disabled
Mobility Disabled
ADL + Mobility Disabled
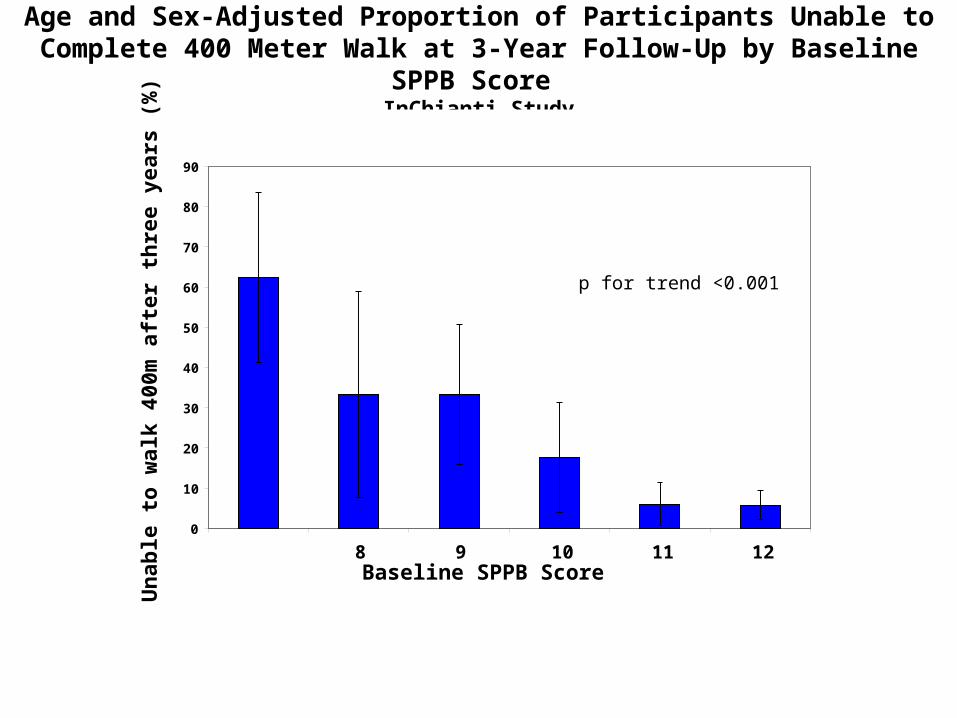
Age and Sex-Adjusted Proportion of Participants Unable to Complete 400 Meter Walk at 3-Year Follow-Up by Baseline SPPB Score
InChianti Study
Baseline SPPB Score
Un
able
to
wal
k 40
0m a
fter
th
ree
year
s (%
)
0
10
20
30
40
50
60
70
80
90
< 7 8 9 10 11 12
p for trend <0.001
n 18 18 40 47 126 284
Source: Vasunilashorn et al. J Gerontol Med Sci, in press.
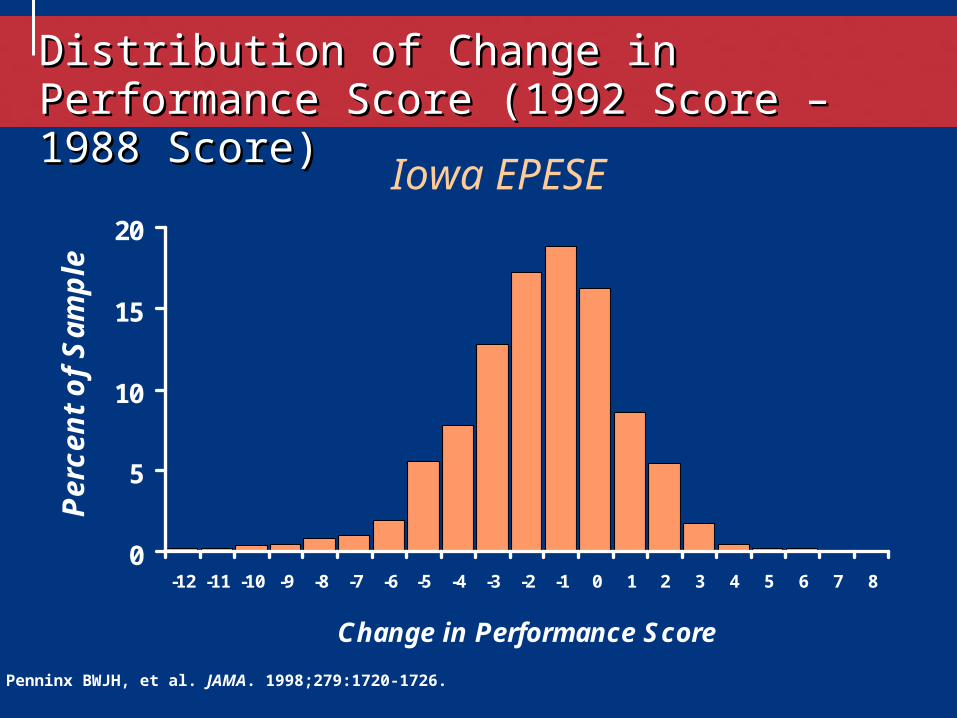
0
5
10
15
20
-12 -11 -10 -9 -8 -7 -6 -5 -4 -3 -2 -1 0 1 2 3 4 5 6 7 8
Change in Performance Score
Per
cen
t o
f S
amp
le
Iowa EPESE
Penninx BWJH, et al. JAMA. 1998;279:1720-1726.
Distribution of Change in Performance Score Distribution of Change in Performance Score (1992 Score – 1988 Score)(1992 Score – 1988 Score)
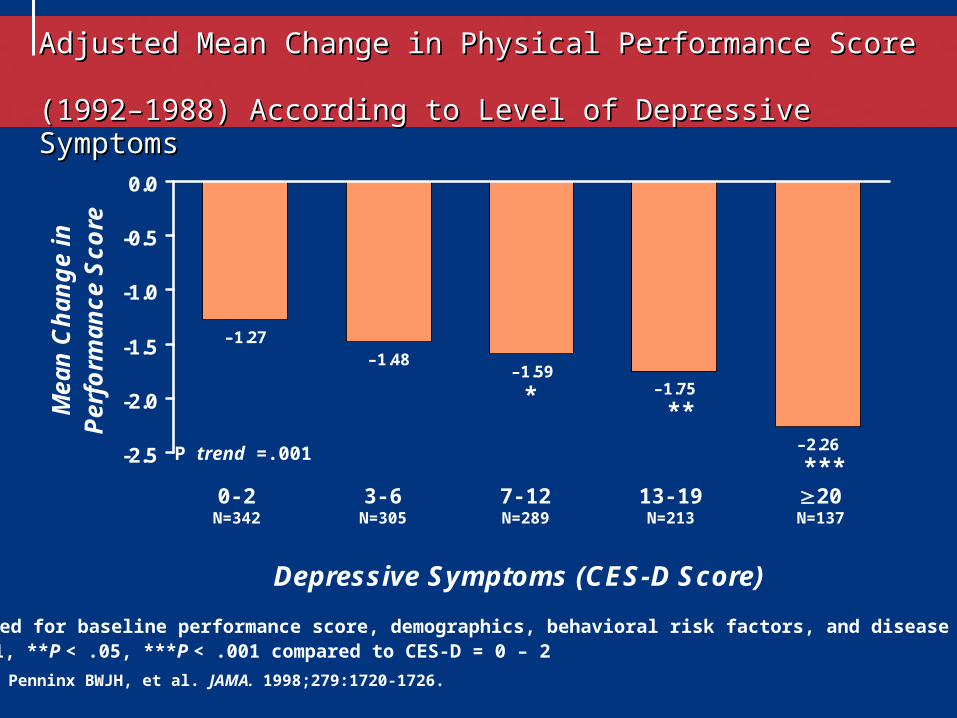
Adjusted Mean Change in Physical Performance Score Adjusted Mean Change in Physical Performance Score (1992–1988) According to Level of Depressive Symptoms(1992–1988) According to Level of Depressive Symptoms
–2.26
–1.75–1.59
–1.48–1.27
-2.5
-2.0
-1.5
-1.0
-0.5
0.0
Depressive Symptoms (CES-D Score)
Mea
n C
han
ge
in
Per
form
ance
Sco
re
0-2N=342
3-6N=305
7-12N=289
13-19N=213
20N=137
Adjusted for baseline performance score, demographics, behavioral risk factors, and disease status.*P < .1, **P < .05, ***P < .001 compared to CES-D = 0 – 2
Penninx BWJH, et al. JAMA. 1998;279:1720-1726.
***P trend =.001
***
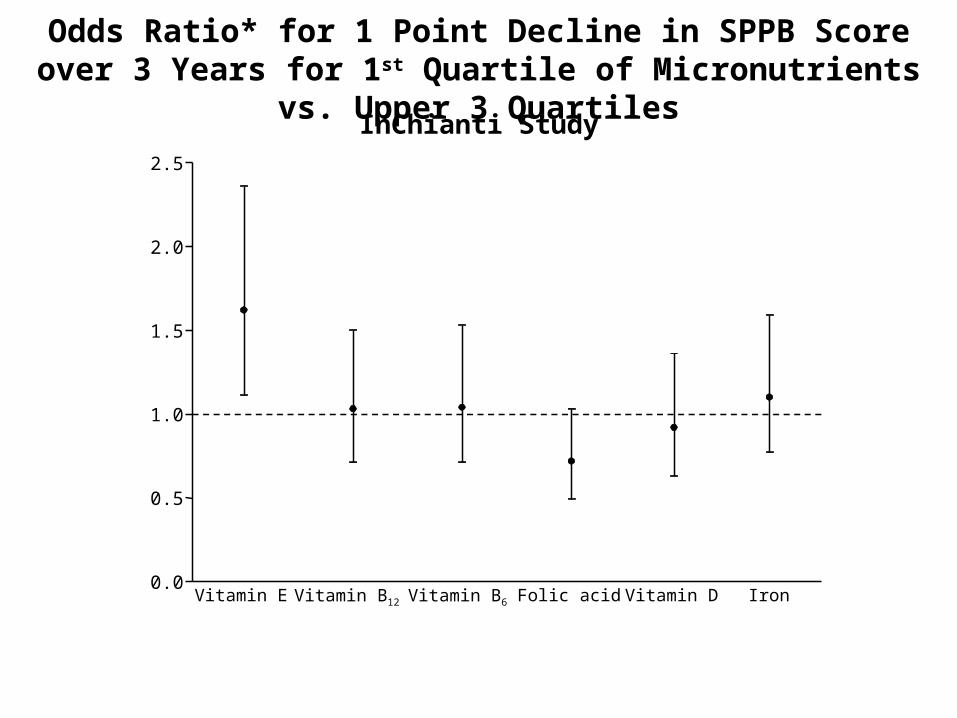
Odds Ratio* for 1 Point Decline in SPPB Score over 3 Years for 1st Quartile of Micronutrients vs. Upper 3 Quartiles
InChianti Study
*Adjusted for age, sex, education, marital status, household composition, smoking, physical activity, number of diseases, BMI, depression, MMSE.
Source: Bartali et al. JAMA 2008;299:308-15.
0.0
0.5
1.0
1.5
2.0
2.5
Vitamin E Vitamin B12 Vitamin B6 Folic acid Vitamin D Iron
Lifestyle Interventions and Independence For Elders
A Randomized Clinical Trial of Exercise to Prevent Mobility Disability
in Non-disabled Older Persons with Functional Limitations

To download: http://www.grc.nia.nih.gov/branches/ledb/sppb/index.htm

Age-Adjusted Hazard Ratio for Death per 0.1-m/s Higher Gait Speed
Studenski, S. et al. JAMA 2011;305:50-58
Copyright restrictions may apply.
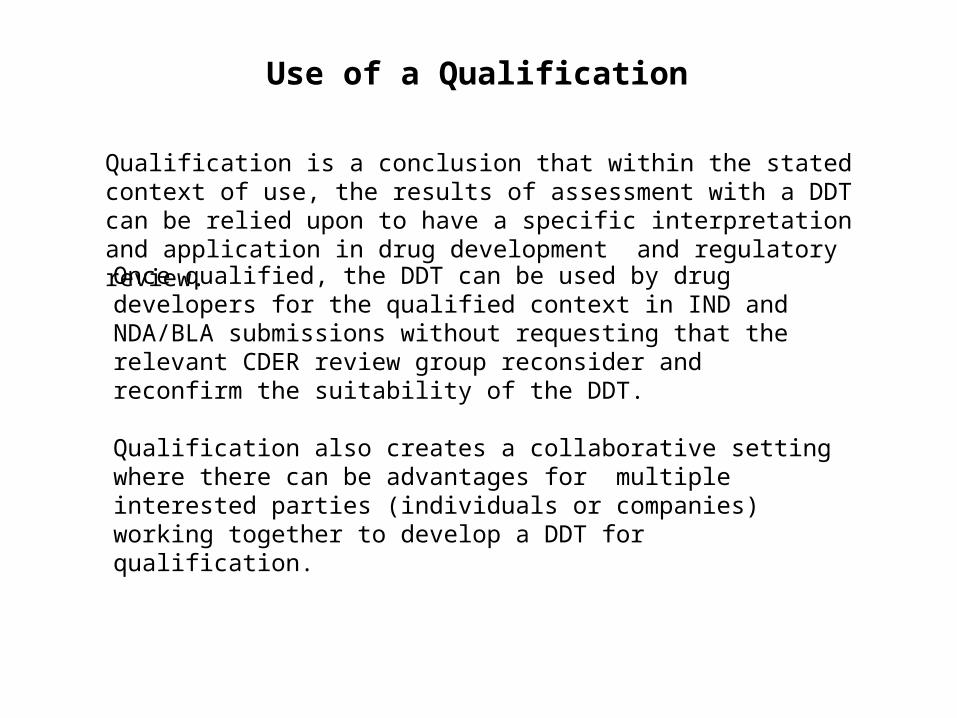
Qualification is a conclusion that within the stated context of use, the results of assessment with a DDT can be relied upon to have a specific interpretation and application in drug development and regulatory review.
Once qualified, the DDT can be used by drug developers for the qualified context in IND and NDA/BLA submissions without requesting that the relevant CDER review group reconsider and reconfirm the suitability of the DDT.
Qualification also creates a collaborative setting where there can be advantages for multiple interested parties (individuals or companies) working together to develop a DDT for qualification.
Use of a Qualification
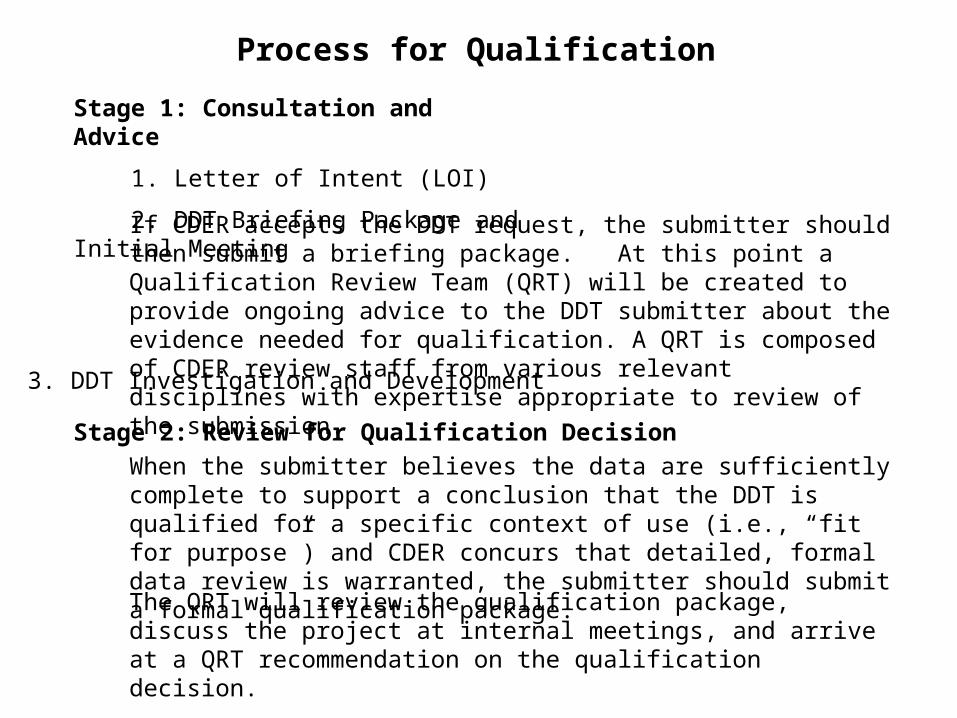
Stage 1: Consultation and Advice
1. Letter of Intent (LOI)
2. DDT Briefing Package and Initial Meeting
Process for Qualification
If CDER accepts the DDT request, the submitter should then submit a briefing package. At this point a Qualification Review Team (QRT) will be created to provide ongoing advice to the DDT submitter about the evidence needed for qualification. A QRT is composed of CDER review staff from various relevant disciplines with expertise appropriate to review of the submission.
3. DDT Investigation and Development
Stage 2: Review for Qualification DecisionWhen the submitter believes the data are sufficiently complete to support a conclusion that the DDT is qualified for a specific context of use (i.e., “fit for purpose”) and CDER concurs that detailed, formal data review is warranted, the submitter should submit a formal qualification package.
The QRT will review the qualification package, discuss the project at internal meetings, and arrive at a QRT recommendation on the qualification decision.