Embed Size (px)
Citation preview
The FCO Cockpit Global Bubble Status ReportApril 2021
Dr. Jan-Christian Gerlach Dr. Ke Wu Dongshuai ZhaoProf. Didier Sornette
The FCO Cockpit - Global Bubble Status Report
Contents
1. Introduction
2. Results per Asset Class
3. Appendix
4. Contact
1
The FCO Cockpit - Global Bubble Status Report
Purpose and Benefits
4 The Financial Crisis Observatory (FCO) monthly report discusses the historical evolution of bubbles in and between different asset classes and geographies. The purpose of the FCO report is to ascertain which asset classes and sectors are crowded and to what degree they develop contagion risks.
4 Today, the report is used by 600+ institutions world-wide, including universities, think tanks, sovereign wealth funds, hedge funds, family offices, private banks and pension funds.
4 It delivers the big picture in terms of growing bubbles and instabilities in today’s financial markets for Chief Investment Officers, Senior Researchers, Fund Managers, and Independent Financial Advisors, and all parties with investment performance responsibility or managing financial risks.
4 The report is the result of an extensive analysis applied to the historical time series of about 450 systemic assets and about 850 single stocks. The systemic assets are bond, equity and commodity indices, as well as a selection of currency pairs. The single stocks are mainly US and European equities. The data is from Thomson Reuters.
4 To new readers, we recommend proceeding to the appendix for more detailed information about the methodology and procedures applied in this report.
2
The FCO Cockpit - Global Bubble Status Report
General Results - The Big Picture

The FCO Cockpit - Global Bubble Status Report
General Results as of 2021-03-31
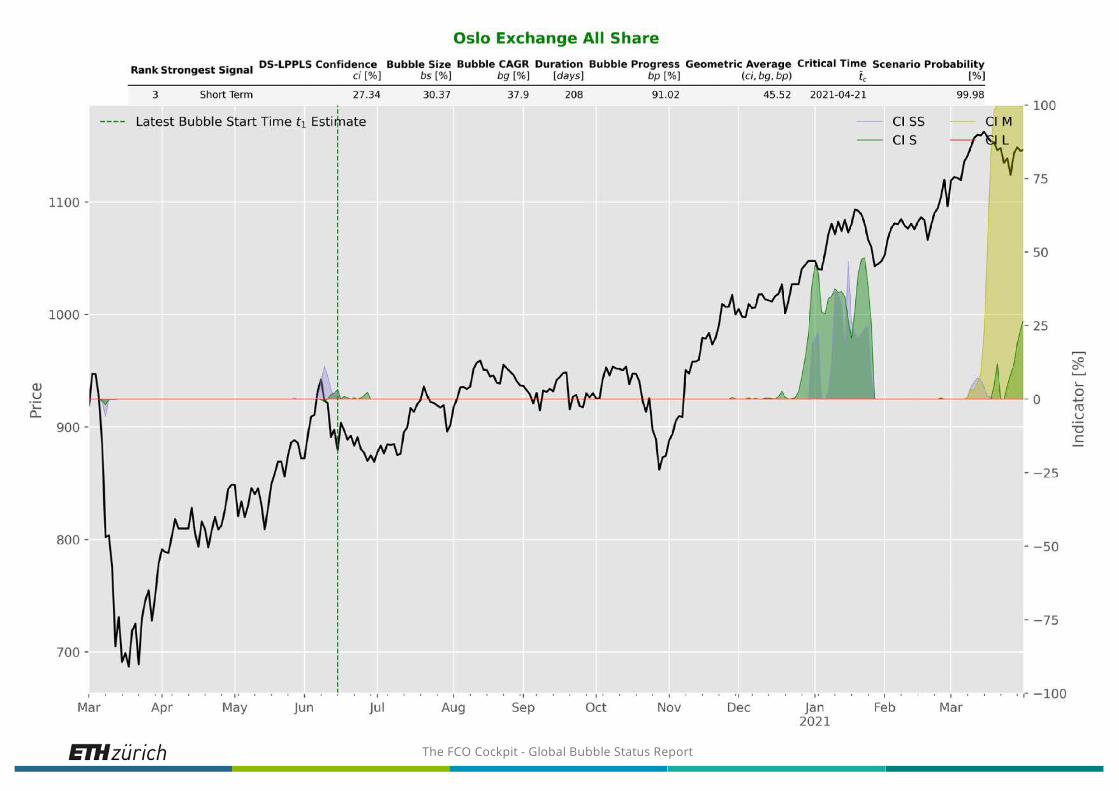
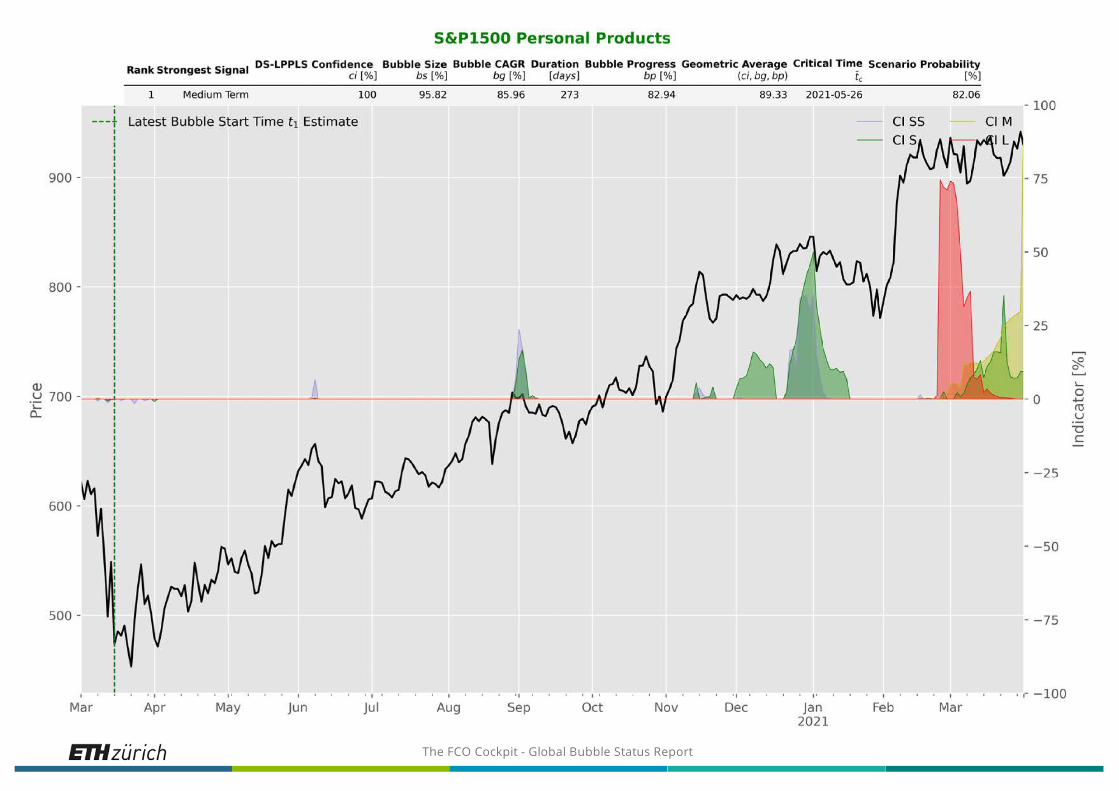
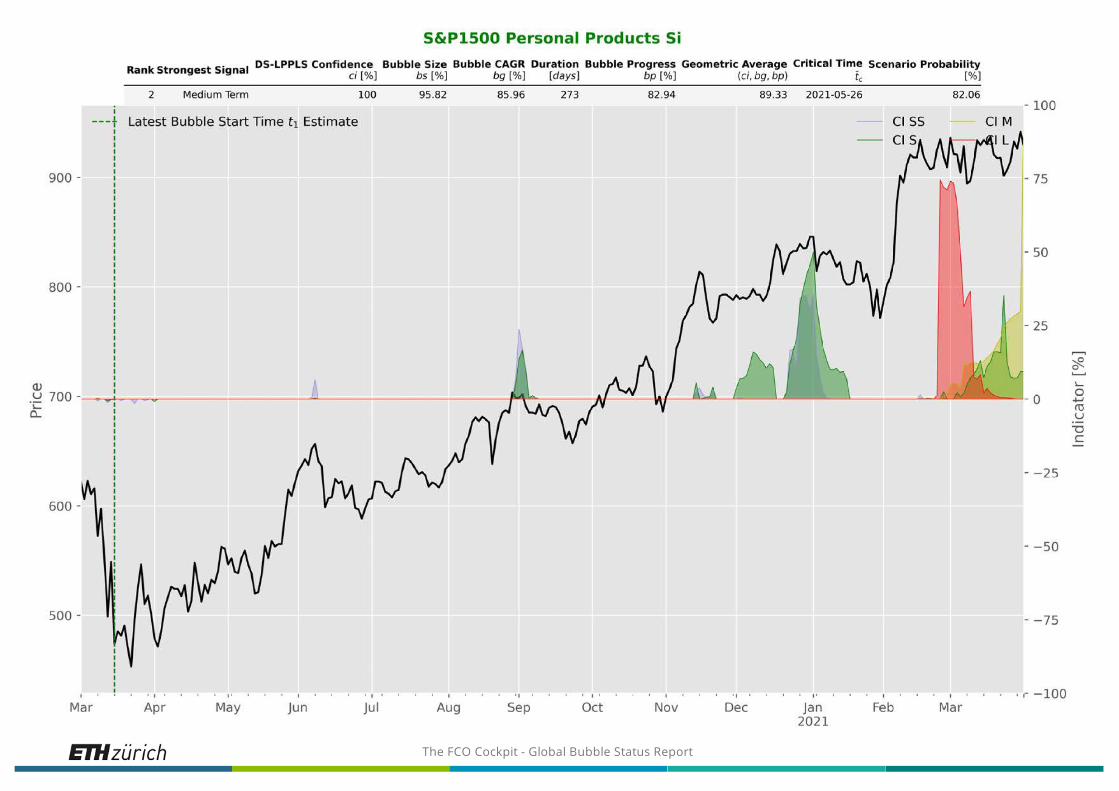
4 This month, we introduce some further structural improvements to the first part of the report. Bubble Signals are now listed above the respective indicator plots. As usual, while the indicator series are reported over time, the bubble characteristics listed in the tables represent a snapshot of the estimated bubble characteristics at the latest available date, i.e. in this report 31st March 2021.
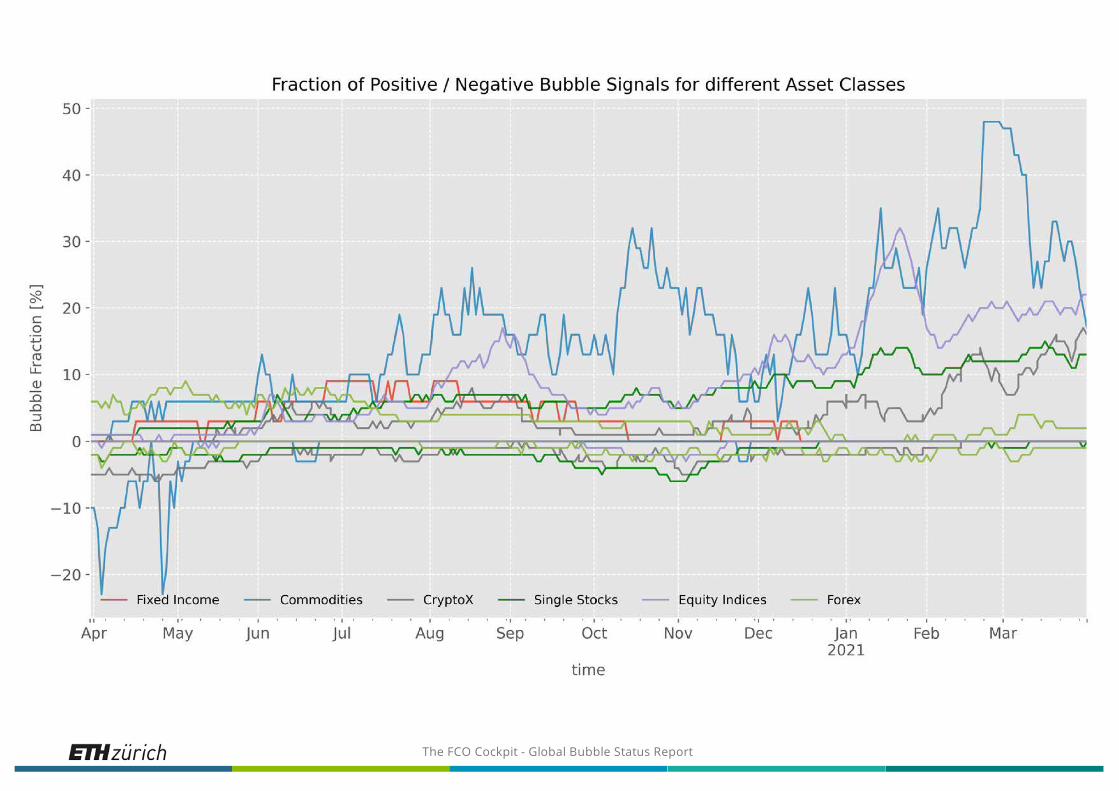
4 In the fixed income sector, at the beginning of April 21, the bubble activity remains zero, as in the previous month.
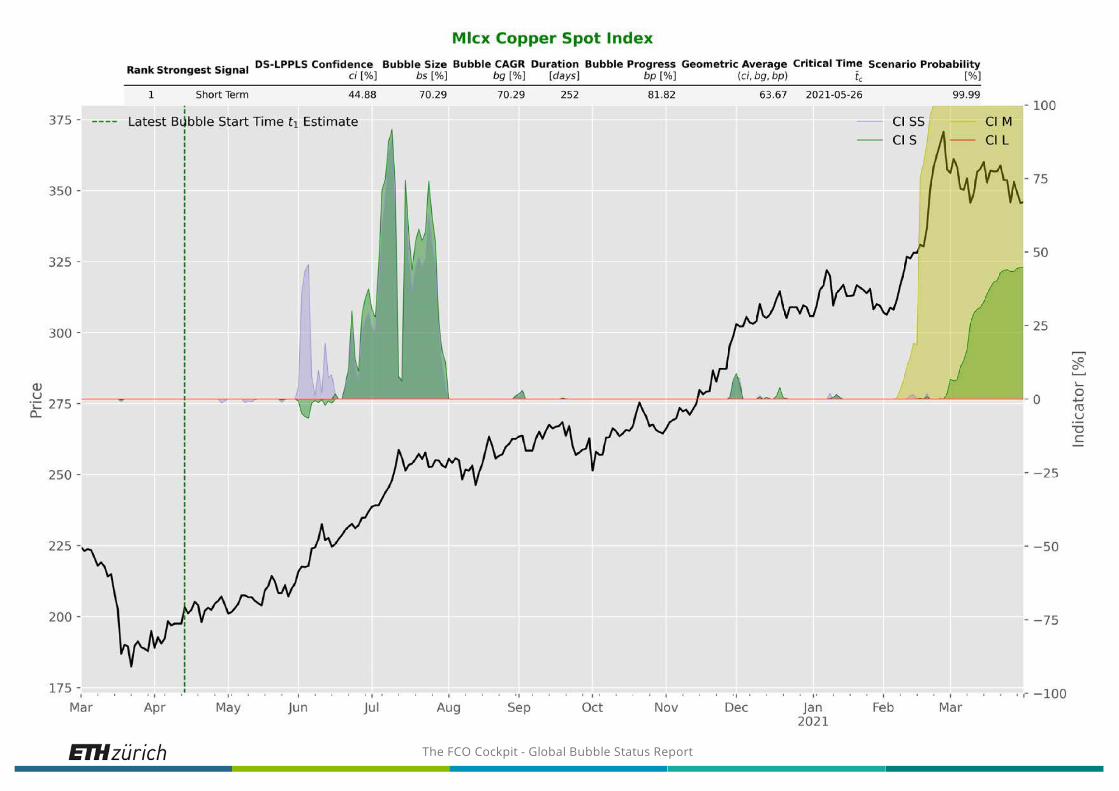
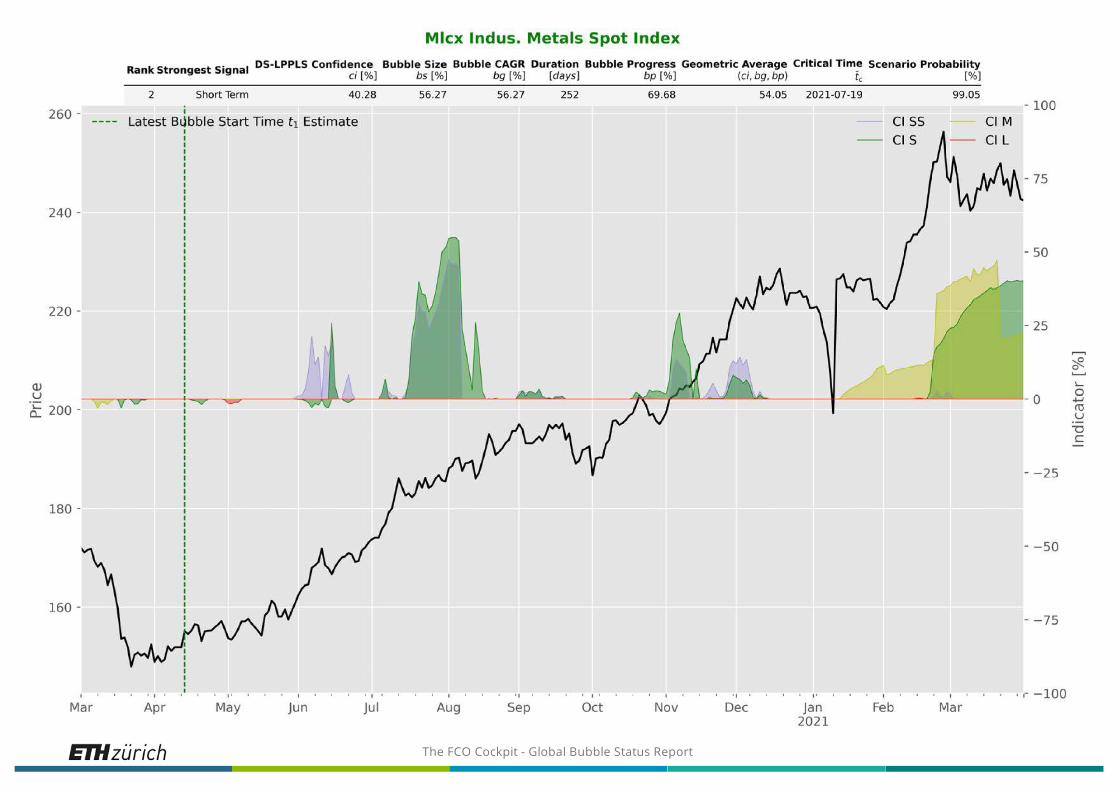
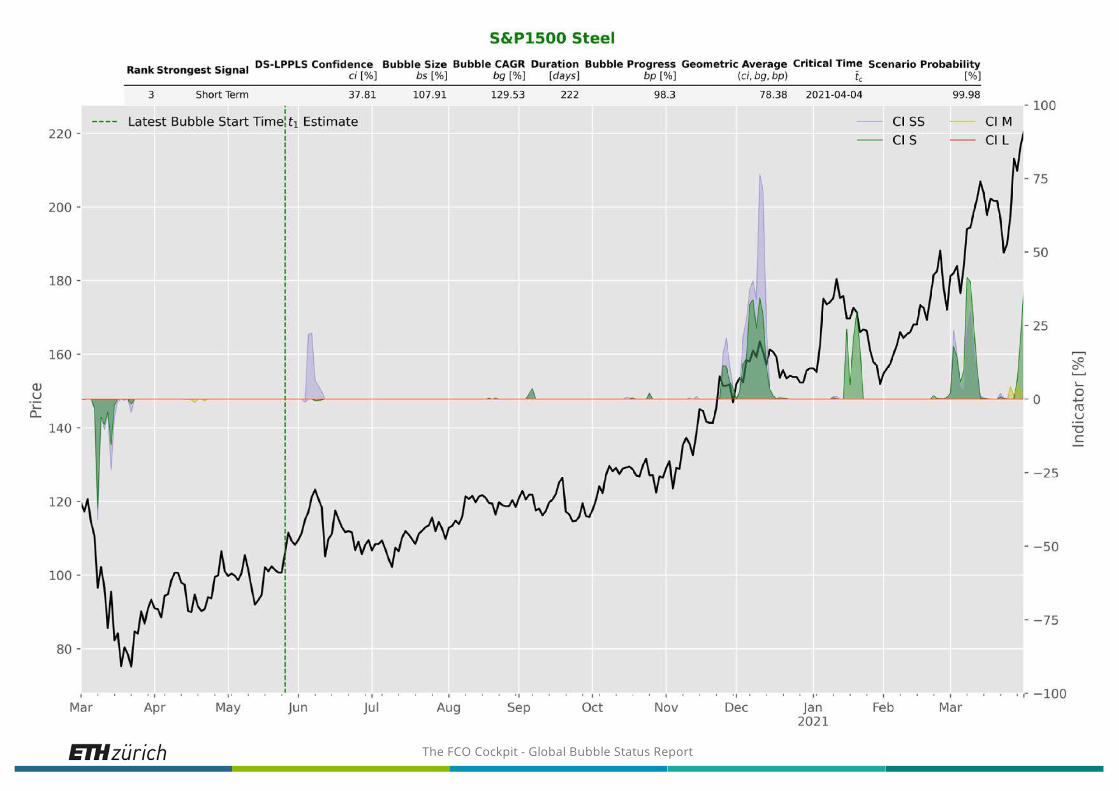
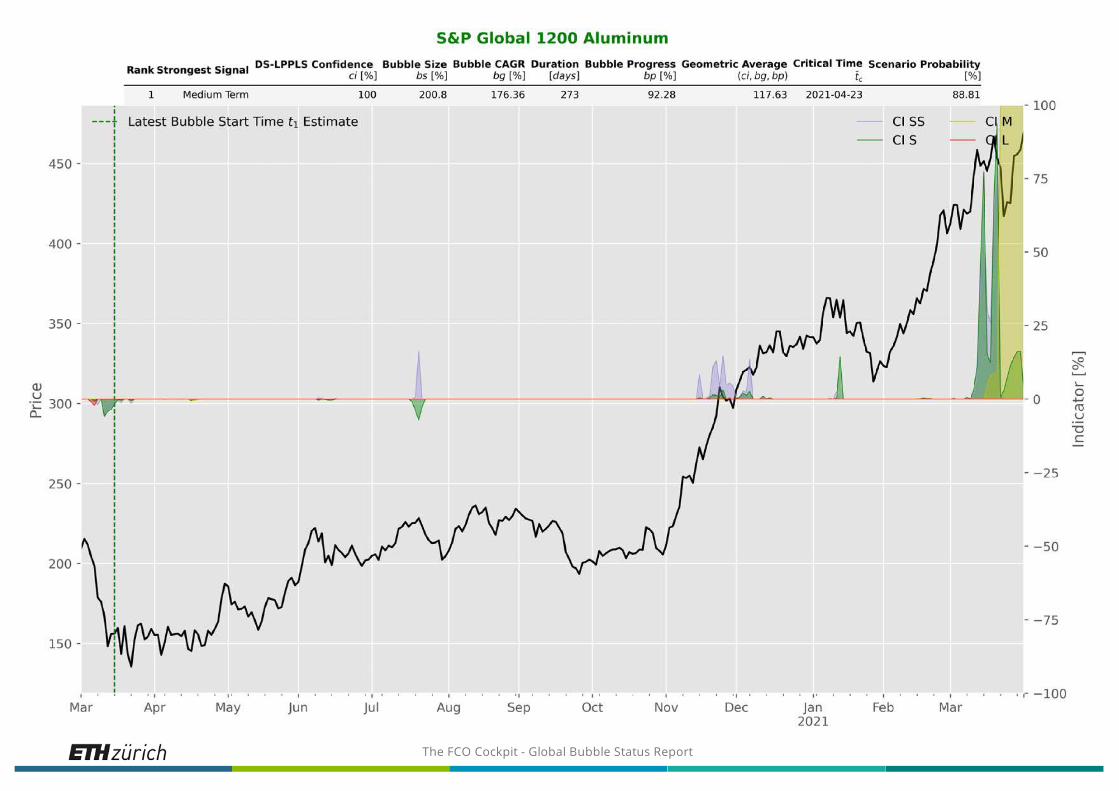
4 The fraction of positive bubbles in the commodities sector has deflated from almost 50% to 17% during the past thirty days.
4 In both the single stocks and equity index asset classes, we observe unchanged overall bubble activity month-to-month. The observed fraction of market bubble activity thus remains stable. However, the individual bubbles are likely to continue growing.
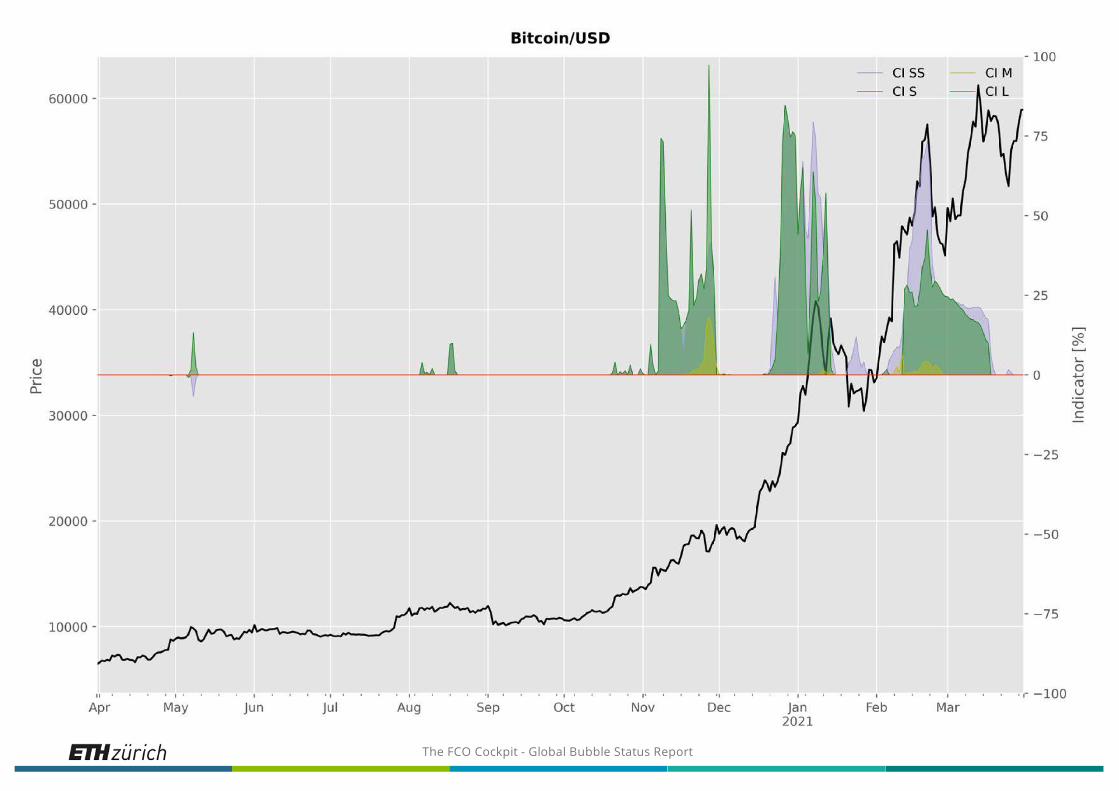
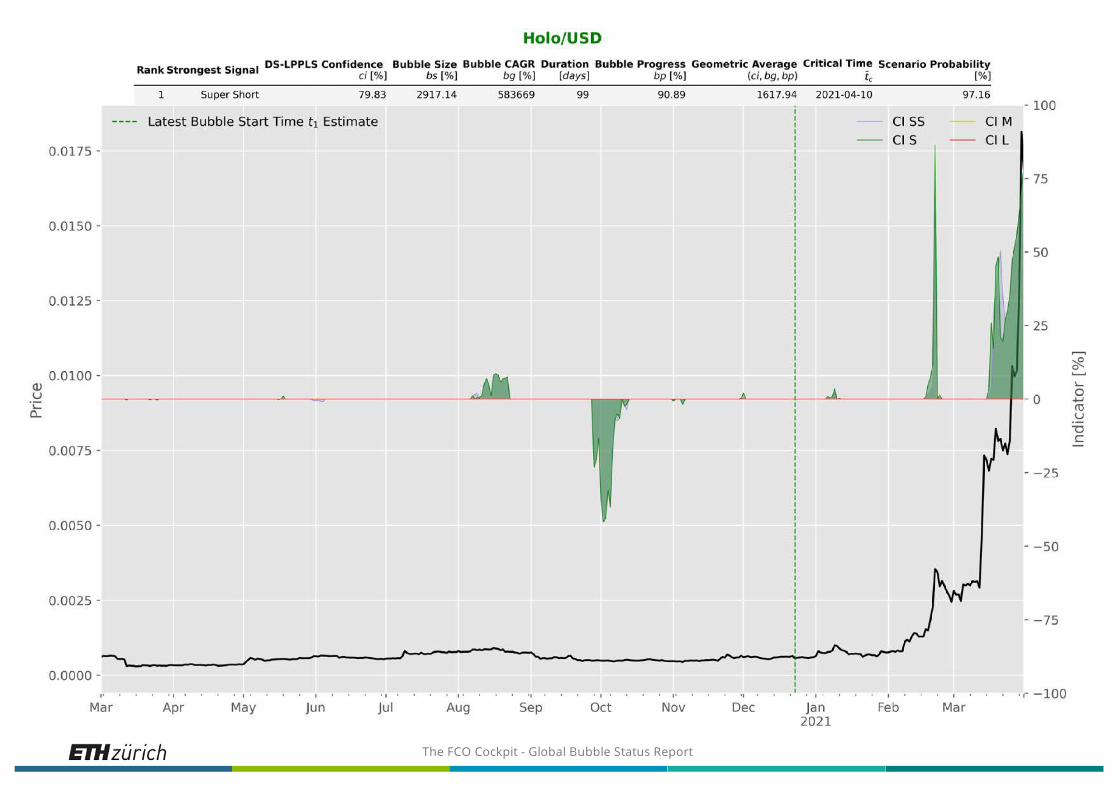
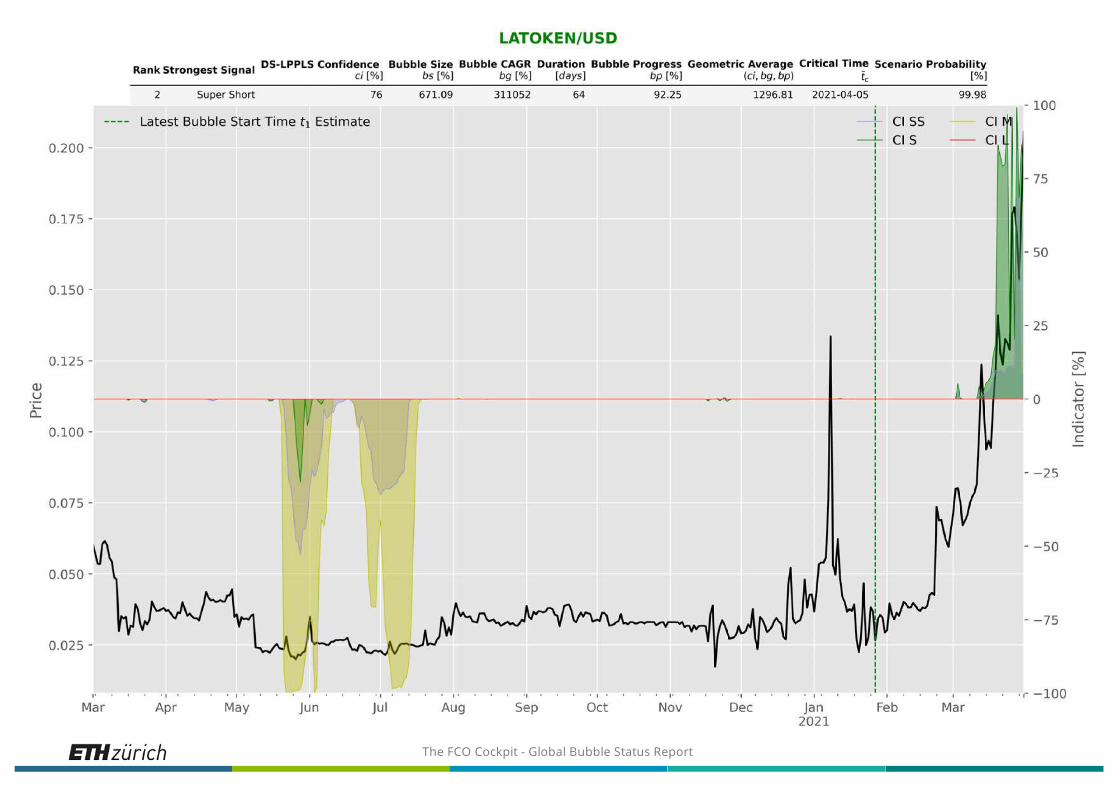
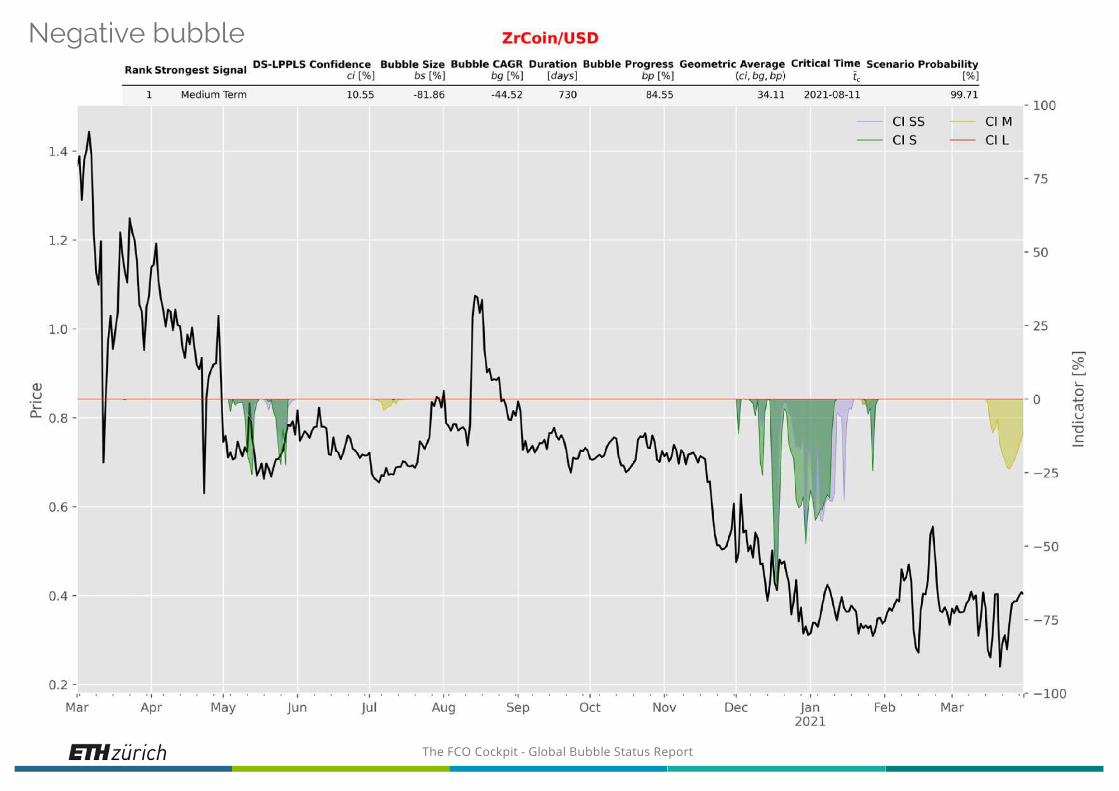
4 Finally, the forex and cryptoX sectors also remain steady, with a slight increase in positive bubble activity from 10% to 16% compared to the previous month for crypto assets.

The FCO Cockpit - Global Bubble Status Report 5
FCO Market OutlookBiden’s infrastructure plan:President Joe Biden just unveiled his more than $2 trillion infrastructure package, trying to bolster the post-pandemic economy. The plan covers: $621 billion dollars to rebuild the infrastructure such as roads, bridges,highways, airports, and electric vehicle development; $400 billion on home care for the elderly and thedisabled; $300 billion for housing infrastructure; $300 billion for improving drinking-water infrastructure andupgrading electric grids; $580 billion for reviving US manufacturing. The eight-year plan will be funded by 1)raising the U.S. corporate tax from 21% to 28%; 2) setting a new global minimum corporate tax, i.e. 21%; 3) taxhikes for the wealthy, most likely via changing the top rates.Coronavirus sweeps across Europe again?:The euro zone’s second-largest economy, France, just enters into lockdown, after its death toll reaches100,000. The daily new infections in France have doubled since February to average nearly 40,000 and theintensive care units in the hardest-hit regions are at saturation point. Germany also imposed strict lockdown inearlier weeks, trying to flatten the third wave of coronavirus variants and it is believed that further measureswill be taken. In line with our previous report, Brazil’s situation is still deteriorating and the daily new deathswere close to 4,000 people per day (on 31 March) compared with a decadal average of about 3000 deaths perday (thus a 33% increase due to Covid related direct and undirect causes). This is reported by the media out ofcontext with the 4000 deaths figure seemingly all Covid, which has to be understood by investors as part of aglobal psychology of fear that will continue to impact policies and economic recovery, Italy, East-Europe,Chile, India, and other countries are also having signs of a new wave of infections. We reckon many countrieswill react by taking more actions in attempts ot curb the spread, i.e. lockdown, vaccinations, or strict stay-at-home policies. Thus, the potential lockdown risks will slow the pace of global recovery from last year’s slump.
Fix income: We notice that the U.S. 10 year treasury bond yield is about 1.7%, after reaching a four-month high early this week. In line with our previous report, the increase of thecommodity prices (lack of critical basic materials) as well as the logistics (including but not limited to the Suez Canal event) and labor issues, put more pricing pressures on the uppermanufactory supply chain. In addition, the survey from the Institute of Supply Management (ISM ) indicates that the pressures may not be temporary. Since Fed Chairman Jerome Powellhas said he anticipates the next several months to see substantially higher CPI readings, the market might not be too worried about the temporary overshoot of the short-term inflation.U.S. equity: In line with our March report, the volatility of the long-term yield disturbs the anchor of the stock market valuation, especially the technology sector. The graph above showsthe relationship between the Nasdaq 100 index and the 5-Year Treasury Real Yield. From the graph, we can clearly see the mid-term real yield’s strong (anti-)correlation with theNasdaq index and we can therefore roughly conclude that a further correction in the tech sector may be mainly determined by the liquidity and risk profile of the bond market. Besides,the recent margin call on Archegos, the family office of Bill Hwang, records the highest single-day loss of human history and also evaporated some investment banks’ annual profit suchas Credit Suisse, Nomura, and a little bit of UBS while Goldman and Morgan Stanley “escaped the fire” quickly by selling the collateral early (or earlier, in typical forerunning style as inLTCM in 1998). Bill Hwang, who used to work in Tiger capital under Julian Robertson, lost more than 10 billion (his entire fund) in one single day due to the price crash of some of hismajor traded stocks (he controlled more than $100 billion stocks’ position through SWAP and Contract For Difference (CDF) and similar related derivatives). We reckon that hisaggressive speculative trading strategies and high leverage position had some similarly to that of Long-Term Capital Management (LTCM) two decades ago, whose partners includedtwo Nobel Price-Winning economists Myron Scholes and Robert Merton, vice chairman of Federal reserve David Mullions, etc. This is truly another classical example showing howimportant dynamical risk management (that we advocate here) is for financial institutions and investment management to prevent extreme risks to occur.Emerging market: The Chinese People’s Political Consultative Conference (CPPCC) last month set a strict Carbon Neutrality target, which will hammer the Chinese demand for iron orebut will increase the production cost of steel, Aluminum and other industry mid-products. Besides, the price corrections of the crown stocks in China for the past few weeks is also aninteresting observation: i.e. it might be the first time that many retail investors realize that the unit prices of the mega fund products plummet more than their own stock portfolio sinceChinese retail investors traditionally do not like those crown head stocks or do not have the capital amount required for buying those expensive stocks. 100 stocks as minimumtransaction amount. for example (The Maotai stock price at its peak is around 2600 RMB so you need at least a quarter-million RMB to build the position) is higher than most of the retailinvestor’s capital amount.Commodities and currency: Biden’s infrastructure plan still supports Aluminum, Copper, Lithium, and many hard commodities’ prices since the automotive, packaging, andconstruction sectors are benefiting from the fiscal stimulus. However, the commodity demand from China is still unclear for the rest of the year since the central government's currentfocus is on credit risk, which is the major driver of the demand for hard commodities. Moreover, the food commodities still have price pressures due to shortages of supply. In addition,we also notice that the US dollar index rebound recently due to the hike of the U.S. bond yield and it might put some pressure on the emerging counties' currency.

The FCO Cockpit - Global Bubble Status Report
Fixed IncomeNo bubbles to report
The FCO Cockpit - Global Bubble Status Report
Commodities
The FCO Cockpit - Global Bubble Status Report
The FCO Cockpit - Global Bubble Status Report
The FCO Cockpit - Global Bubble Status Report
Single StocksEurope
The FCO Cockpit - Global Bubble Status Report
The FCO Cockpit - Global Bubble Status Report
The FCO Cockpit - Global Bubble Status Report
The FCO Cockpit - Global Bubble Status Report
Negative bubble
The FCO Cockpit - Global Bubble Status Report
Negative bubble
Negative bubble
The FCO Cockpit - Global Bubble Status Report
Negative bubble
The FCO Cockpit - Global Bubble Status Report
Single StocksUnited States
The FCO Cockpit - Global Bubble Status Report
The FCO Cockpit - Global Bubble Status Report
The FCO Cockpit - Global Bubble Status Report
The FCO Cockpit - Global Bubble Status Report

The FCO Cockpit - Global Bubble Status Report
Equity IndicesBy Country
The FCO Cockpit - Global Bubble Status Report

The FCO Cockpit - Global Bubble Status Report
The FCO Cockpit - Global Bubble Status Report
The FCO Cockpit - Global Bubble Status Report
Equity IndicesUnited States Indices
The FCO Cockpit - Global Bubble Status Report
The FCO Cockpit - Global Bubble Status Report
The FCO Cockpit - Global Bubble Status Report

The FCO Cockpit - Global Bubble Status Report
Equity IndicesS&P Global Indices
The FCO Cockpit - Global Bubble Status Report
The FCO Cockpit - Global Bubble Status Report
The FCO Cockpit - Global Bubble Status Report
The FCO Cockpit - Global Bubble Status Report
ForexNo bubbles to report
The FCO Cockpit - Global Bubble Status Report
CryptoX
The FCO Cockpit - Global Bubble Status Report
The FCO Cockpit - Global Bubble Status Report
The FCO Cockpit - Global Bubble Status Report

The FCO Cockpit - Global Bubble Status Report
The FCO Cockpit - Global Bubble Status Report
Negative bubble
The FCO Cockpit - Global Bubble Status Report
Sectors
41
GICS Industry Group Name Yearly Return Bubble Size Bubble Score Value Score Growth ScoreApr 1st Mar 1st Apr 1st Mar 1st Apr 1st Mar 1st Apr 1st Mar 1st Apr 1st Mar 1st
Pharmaceuticals, Biotechnology & Life Sciences 10.0% 26.5% 0.0% 0.0% 0.0% 0.0% 63.8% 66.7% 56.6% 56.8%Consumer Services 49.4% 56.2% 0.0% 0.0% 0.0% 0.0% 19.4% 19.4% 59.8% 59.8%Retailing 47.5% 72.4% 0.0% 0.0% 0.0% 0.0% 21.0% 19.4% 43.9% 43.4%Transportation 52.2% 62.2% 0.0% 0.0% 0.0% 0.0% 43.6% 46.7% 54.4% 52.9%Consumer Durables & Apparel 58.5% 72.1% 0.0% 0.0% 0.0% 0.0% 34.9% 37.7% 54.7% 53.9%Semiconductors & Semiconductor Equipment 71.4% 106.6% 0.0% 37.7% 0.0% 34.9% 60.0% 60.9% 38.5% 38.1%Technology Hardware & Equipment 61.0% 81.6% 0.0% 0.0% 0.0% 0.0% 65.9% 64.2% 49.1% 49.1%Automobiles & Components 121.0% 125.9% 0.0% 0.0% 0.0% 0.0% 64.3% 65.6% 36.6% 50.3%Telecommunication Services 14.7% 19.7% 19.1% 0.0% 2.9% 0.0% 57.5% 62.7% 44.1% 43.5%Energy 33.5% 54.0% 26.2% 0.0% 15.6% 0.0% 49.8% 49.6% 70.4% 70.5%Software & Services 39.5% 65.7% 0.0% 13.7% 0.0% 17.4% 29.8% 30.4% 53.4% 53.5%Materials 51.2% 73.5% 0.0% 0.0% 0.0% 0.0% 48.4% 48.9% 50.1% 49.1%Health Care Equipment & Services 31.6% 43.3% 0.0% 0.0% 0.0% 0.0% 49.7% 52.2% 53.9% 53.0%Capital Goods 56.9% 56.8% 16.9% 0.0% 100.0% 0.0% 46.9% 46.7% 49.8% 50.4%Media & Entertainment 60.0% 81.5% 45.6% 44.1% 28.4% 25.5% 29.3% 29.7% 28.5% 28.3%Commercial & Professional Services 34.9% 34.2% 0.0% 0.0% 0.0% 0.0% 28.3% 26.7% 51.3% 51.4%Food & Staples Retailing 14.5% 24.2% 0.0% 0.0% 0.0% 0.0% 41.2% 45.7% 61.3% 62.6%Household & Personal Products 13.1% 22.2% 0.0% 0.0% 0.0% 0.0% 28.7% 31.7% 54.4% 51.7%Food, Beverage & Tobacco 11.7% 18.1% 0.0% 0.0% 0.0% 0.0% 47.6% 47.8% 57.3% 57.7%Utilities 11.7% 14.9% 0.0% 0.0% 0.0% 0.0% 47.3% 47.1% 57.2% 56.0%Insurance 36.2% 42.9% 13.8% 0.0% 40.5% 0.0% - - - -Real Estate 16.3% 14.1% 7.8% 11.7% 30.9% 16.8% - - - -Diversified Financials 49.2% 62.1% 39.4% 0.0% 10.5% 0.0% - - - -Banks 56.5% 56.0% 32.9% 0.0% 47.7% 0.0% - - - -
The FCO Cockpit - Global Bubble Status Report
Sectors
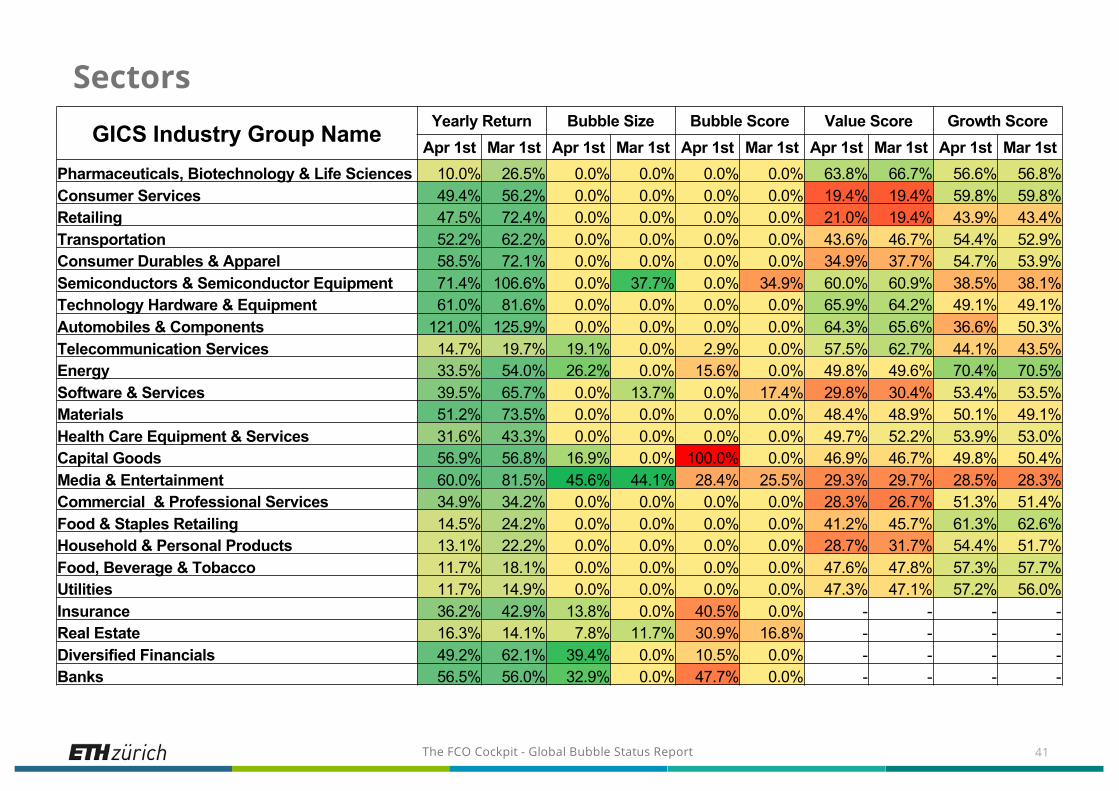
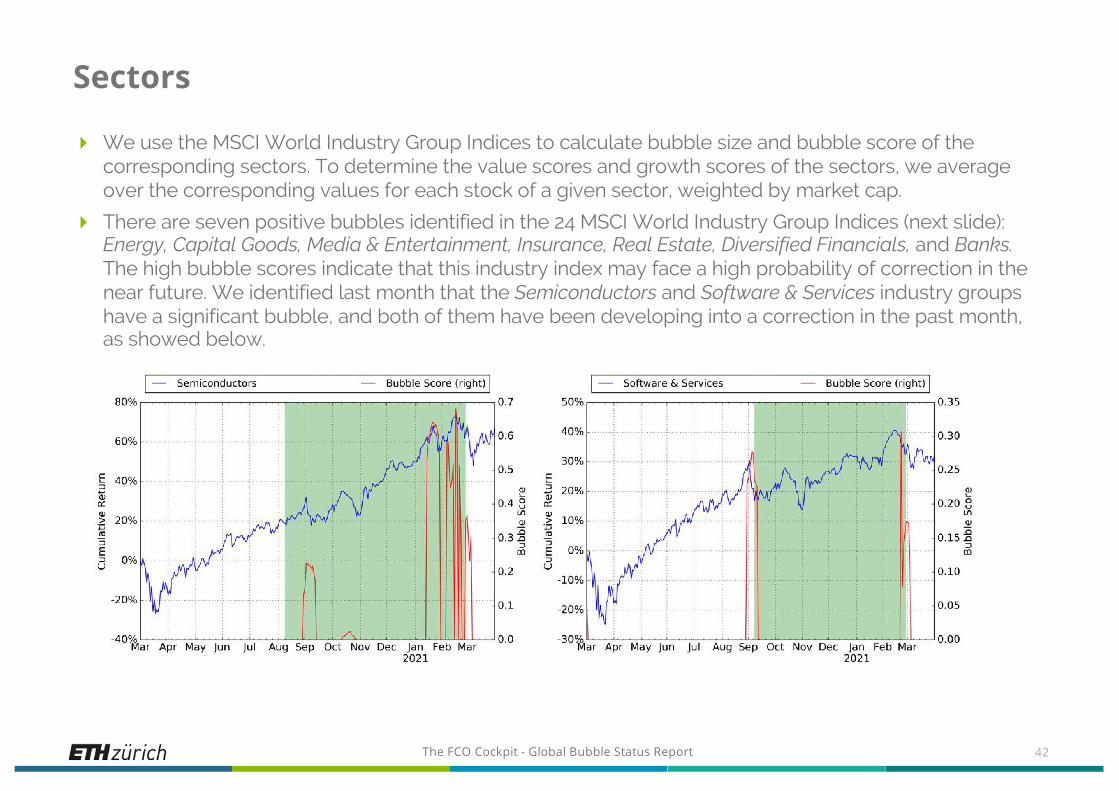
4 We use the MSCI World Industry Group Indices to calculate bubble size and bubble score of the corresponding sectors. To determine the value scores and growth scores of the sectors, we average over the corresponding values for each stock of a given sector, weighted by market cap.
4 There are seven positive bubbles identified in the 24 MSCI World Industry Group Indices (next slide): Energy, Capital Goods, Media & Entertainment, Insurance, Real Estate, Diversified Financials, and Banks.The high bubble scores indicate that this industry index may face a high probability of correction in the near future. We identified last month that the Semiconductors and Software & Services industry groups have a significant bubble, and both of them have been developing into a correction in the past month, as showed below.
42

The FCO Cockpit - Global Bubble Status Report
Sectors
43
The FCO Cockpit - Global Bubble Status Report
Portfolio Construction & Performance
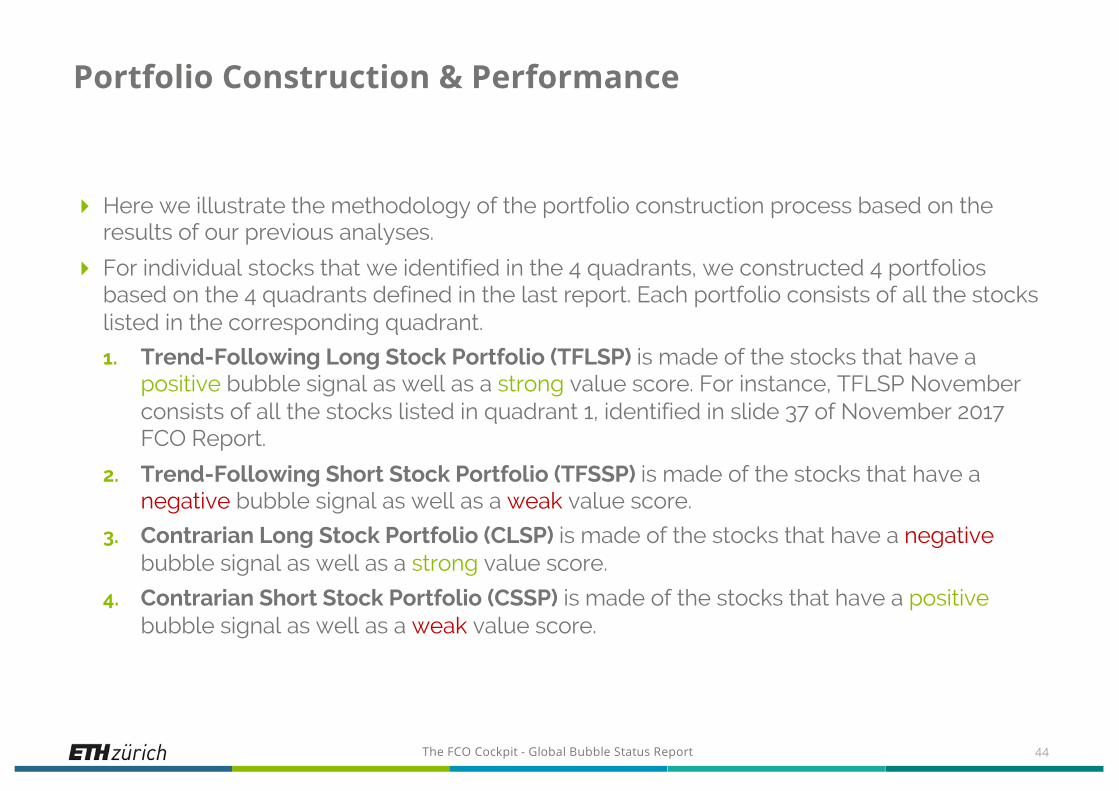
4 Here we illustrate the methodology of the portfolio construction process based on the results of our previous analyses.
4 For individual stocks that we identified in the 4 quadrants, we constructed 4 portfolios based on the 4 quadrants defined in the last report. Each portfolio consists of all the stocks listed in the corresponding quadrant.
1. Trend-Following Long Stock Portfolio (TFLSP) is made of the stocks that have a positive bubble signal as well as a strong value score. For instance, TFLSP November consists of all the stocks listed in quadrant 1, identified in slide 37 of November 2017 FCO Report.
2. Trend-Following Short Stock Portfolio (TFSSP) is made of the stocks that have a negative bubble signal as well as a weak value score.
3. Contrarian Long Stock Portfolio (CLSP) is made of the stocks that have a negativebubble signal as well as a strong value score.
4. Contrarian Short Stock Portfolio (CSSP) is made of the stocks that have a positivebubble signal as well as a weak value score.
44
The FCO Cockpit - Global Bubble Status Report
Portfolio Construction & Performance
4 At the same time, we also classified 20 industries into 4 quadrants, and constructed 4 type of industry portfolios based on the 4 industry quadrants. Each portfolio consists of all the stocks in the industries listed in the corresponding quadrant. Following the same definitions as above, we have Trend-Following Long Industry Portfolio (TFLIP), Trend-Following Short Industry Portfolio (TFSIP), Contrarian Long Industry Portfolio (CLIP), and Contrarian Short Industry Portfolio (CSIP).
4 In each month, we initiated 8 new portfolios based on the updated results. The performance of every 8 portfolios we initiated since November 2017 are presented in the next slide. All of the stocks in our portfolios are weighted by their market capitalizations and we don’t consider transaction cost in the portfolio performance.
45
The FCO Cockpit - Global Bubble Status Report
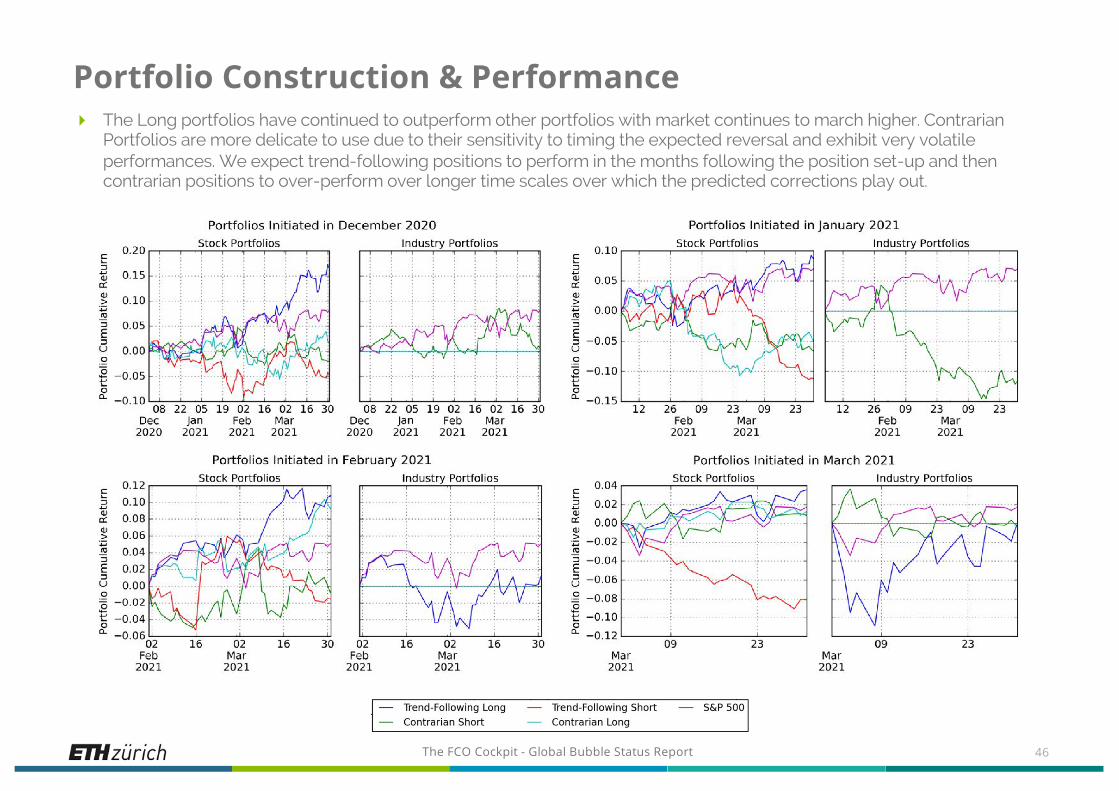
Portfolio Construction & Performance4 The Long portfolios have continued to outperform other portfolios with market continues to march higher. Contrarian
Portfolios are more delicate to use due to their sensitivity to timing the expected reversal and exhibit very volatile performances. We expect trend-following positions to perform in the months following the position set-up and then contrarian positions to over-perform over longer time scales over which the predicted corrections play out.
46
The FCO Cockpit - Global Bubble Status Report
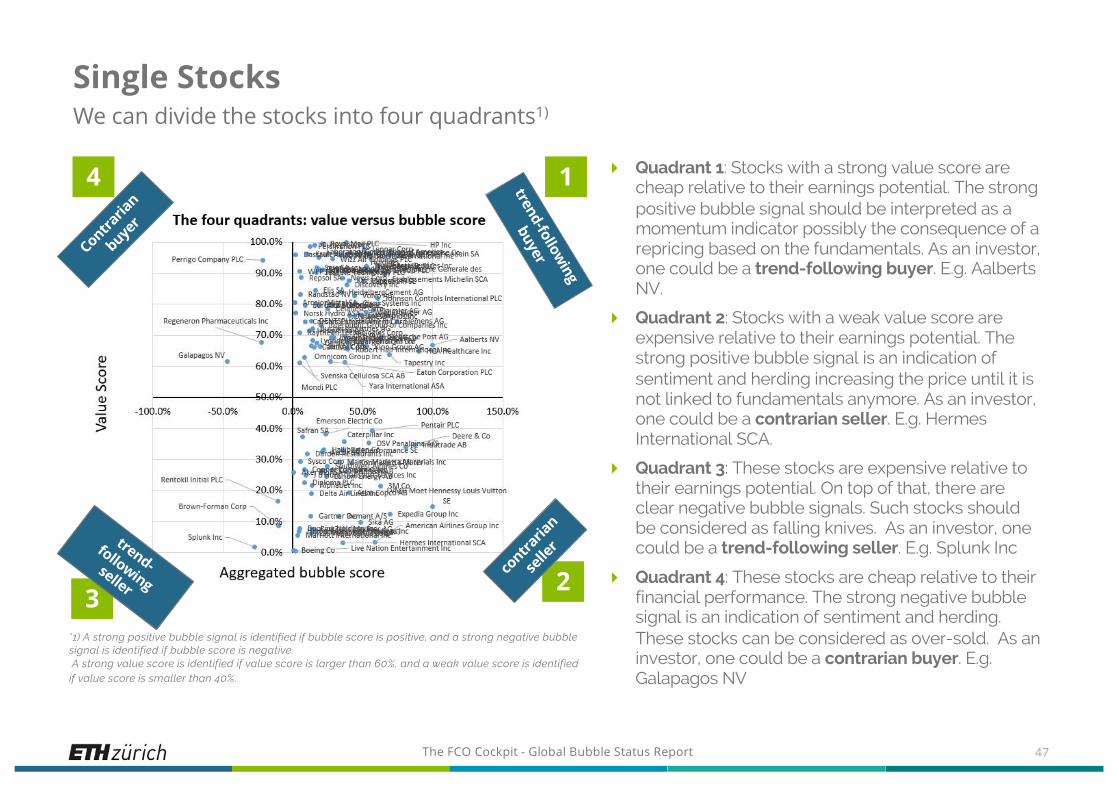
Single StocksWe can divide the stocks into four quadrants1)
4 Quadrant 1: Stocks with a strong value score are cheap relative to their earnings potential. The strong positive bubble signal should be interpreted as a momentum indicator possibly the consequence of a repricing based on the fundamentals. As an investor, one could be a trend-following buyer. E.g. AalbertsNV.
4 Quadrant 2: Stocks with a weak value score are expensive relative to their earnings potential. The strong positive bubble signal is an indication of sentiment and herding increasing the price until it is not linked to fundamentals anymore. As an investor, one could be a contrarian seller. E.g. Hermes International SCA.
4 Quadrant 3: These stocks are expensive relative to their earnings potential. On top of that, there are clear negative bubble signals. Such stocks should be considered as falling knives. As an investor, one could be a trend-following seller. E.g. Splunk Inc
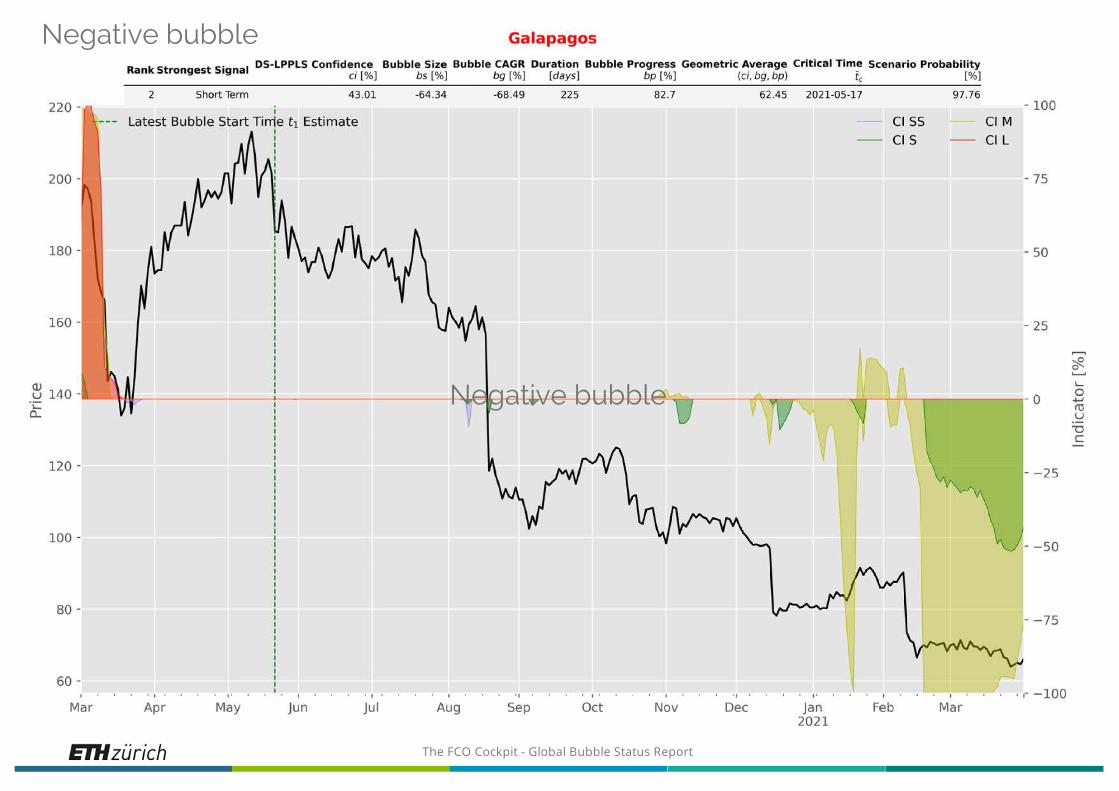
4 Quadrant 4: These stocks are cheap relative to their financial performance. The strong negative bubble signal is an indication of sentiment and herding. These stocks can be considered as over-sold. As an investor, one could be a contrarian buyer. E.g. Galapagos NV
47
*1) A strong positive bubble signal is identified if bubble score is positive, and a strong negative bubble signal is identified if bubble score is negative.A strong value score is identified if value score is larger than 60%, and a weak value score is identified
if value score is smaller than 40%.
2contra
rian
selle
r
1
3
4 trend-following
buyerContraria
nbuye
r
trend-following seller
The FCO Cockpit - Global Bubble Status Report
Single Stocks
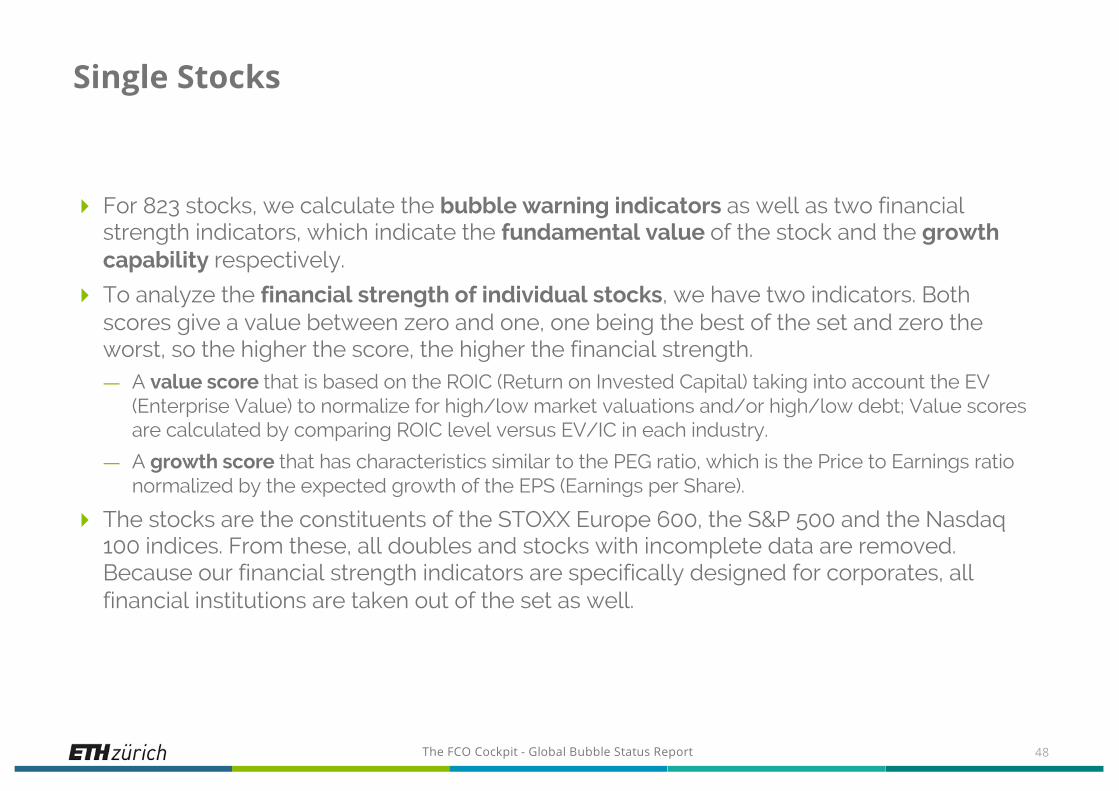
4 For 823 stocks, we calculate the bubble warning indicators as well as two financial strength indicators, which indicate the fundamental value of the stock and the growth capability respectively.
4 To analyze the financial strength of individual stocks, we have two indicators. Both scores give a value between zero and one, one being the best of the set and zero the worst, so the higher the score, the higher the financial strength.— A value score that is based on the ROIC (Return on Invested Capital) taking into account the EV
(Enterprise Value) to normalize for high/low market valuations and/or high/low debt; Value scores are calculated by comparing ROIC level versus EV/IC in each industry.
— A growth score that has characteristics similar to the PEG ratio, which is the Price to Earnings ratio normalized by the expected growth of the EPS (Earnings per Share).
4 The stocks are the constituents of the STOXX Europe 600, the S&P 500 and the Nasdaq 100 indices. From these, all doubles and stocks with incomplete data are removed. Because our financial strength indicators are specifically designed for corporates, all financial institutions are taken out of the set as well.
48

The FCO Cockpit - Global Bubble Status Report
Single StocksQuadrant 1 stocks: strong positive bubble signals with strong fundamentals
49
Company Name Country of Headquarters GICS Industry Group NameYearly Return
Bubble Size
Bubble Start
Bubble Score
Value Score
Growth Score
Wienerberger AG Austria Materials 82.7% 30.8% Oct-20 52.3% 77.4% 5.7%
Bucher Industries AG Switzerland Capital Goods 77.1% 55.9% Aug-20 14.1% 72.1% 44.4%
LafargeHolcim Ltd Switzerland Materials 47.5% 45.6% May-20 38.8% 68.0% 88.4%
Deutsche Post AG Germany Transportation 82.0% 28.8% Aug-20 63.3% 69.5% 88.8%
HeidelbergCement AG Germany Materials 76.4% 37.7% Nov-20 34.3% 83.8% 91.9%
Daimler AG Germany Automobiles & Components 154.7% 49.9% Nov-20 57.4% 78.0% 4.4%
Siemens AG Germany Capital Goods 90.9% 27.3% Sep-20 74.2% 74.5% 93.2%
Evonik Industries AG Germany Materials 35.4% 32.0% Jun-20 27.7% 69.3% 30.1%
Kion Group AG Germany Capital Goods 91.1% 17.7% Oct-20 52.9% 66.3% 3.1%
Repsol SA Spain Energy 35.9% 53.5% Jul-20 6.0% 88.6% 5.3%
Compagnie Generale des Etablissements Michelin SCA France Automobiles & Components 46.7% 38.2% Jul-20 65.4% 89.7% 95.5%
Dassault Aviation SA France Capital Goods 15.0% 13.0% Jun-20 2.2% 96.0% 5.2%
Compagnie de Saint Gobain SA France Capital Goods 93.7% 55.5% Jun-20 54.2% 96.3% 13.8%
Capgemini SE France Software & Services 79.1% 24.3% Nov-20 50.5% 87.3% 10.6%
Publicis Groupe SA France Media & Entertainment 73.0% 102.7% May-20 18.6% 91.3% 7.8%
Rexel SA France Capital Goods 102.6% 60.9% Nov-20 69.0% 95.6% 5.6%
Elis SA France Commercial & Professional Services 52.5% 47.4% Apr-20 16.1% 84.5% 74.9%
Spie SA France Commercial & Professional Services 68.6% 55.9% May-20 17.1% 91.7% 82.2%
Eurofins Scientific SE Luxembourg Pharmaceuticals, Biotechnology & Life Sciences 73.4% 44.7% May-20 8.7% 79.6% 4.6%
Persimmon PLC United Kingdom Consumer Durables & Apparel 39.3% 34.3% Apr-20 12.5% 98.6% 30.8%
Travis Perkins PLC United Kingdom Capital Goods 57.4% 35.2% Jun-20 53.1% 92.3% 45.6%
Carnival PLC United Kingdom Consumer Services 64.2% 63.4% Jun-20 17.3% 67.5% 97.3%
Marks and Spencer Group PLC United Kingdom Retailing 36.5% 65.7% Apr-20 19.9% 90.8% 48.3%
Kaz Minerals PLC United Kingdom Materials 119.4% 88.1% Jun-20 40.1% 87.6% 2.6%
Mondi PLC United Kingdom Materials 37.0% 38.5% Apr-20 5.2% 61.1% 10.9%
The FCO Cockpit - Global Bubble Status Report
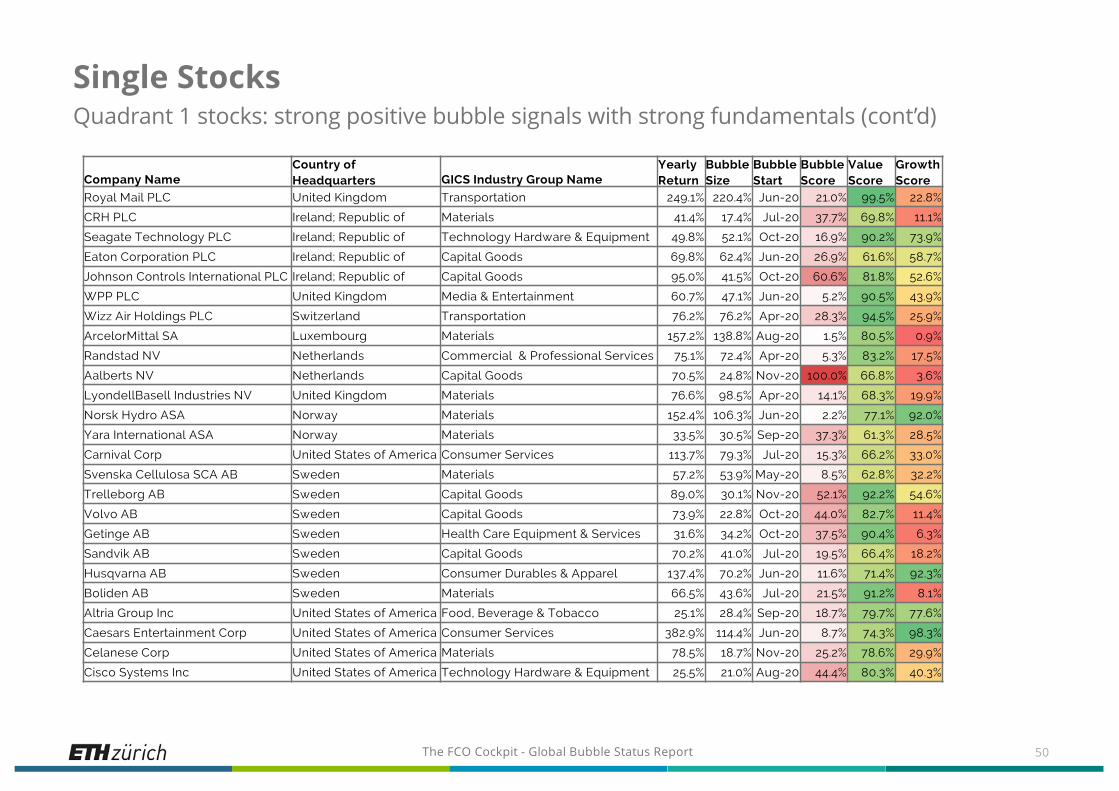
Single StocksQuadrant 1 stocks: strong positive bubble signals with strong fundamentals (cont’d)
50
Company NameCountry of Headquarters GICS Industry Group Name
Yearly Return
Bubble Size
Bubble Start
Bubble Score
Value Score
Growth Score
Royal Mail PLC United Kingdom Transportation 249.1% 220.4% Jun-20 21.0% 99.5% 22.8%
CRH PLC Ireland; Republic of Materials 41.4% 17.4% Jul-20 37.7% 69.8% 11.1%
Seagate Technology PLC Ireland; Republic of Technology Hardware & Equipment 49.8% 52.1% Oct-20 16.9% 90.2% 73.9%
Eaton Corporation PLC Ireland; Republic of Capital Goods 69.8% 62.4% Jun-20 26.9% 61.6% 58.7%
Johnson Controls International PLC Ireland; Republic of Capital Goods 95.0% 41.5% Oct-20 60.6% 81.8% 52.6%
WPP PLC United Kingdom Media & Entertainment 60.7% 47.1% Jun-20 5.2% 90.5% 43.9%
Wizz Air Holdings PLC Switzerland Transportation 76.2% 76.2% Apr-20 28.3% 94.5% 25.9%
ArcelorMittal SA Luxembourg Materials 157.2% 138.8% Aug-20 1.5% 80.5% 0.9%
Randstad NV Netherlands Commercial & Professional Services 75.1% 72.4% Apr-20 5.3% 83.2% 17.5%
Aalberts NV Netherlands Capital Goods 70.5% 24.8% Nov-20 100.0% 66.8% 3.6%
LyondellBasell Industries NV United Kingdom Materials 76.6% 98.5% Apr-20 14.1% 68.3% 19.9%
Norsk Hydro ASA Norway Materials 152.4% 106.3% Jun-20 2.2% 77.1% 92.0%
Yara International ASA Norway Materials 33.5% 30.5% Sep-20 37.3% 61.3% 28.5%
Carnival Corp United States of America Consumer Services 113.7% 79.3% Jul-20 15.3% 66.2% 33.0%
Svenska Cellulosa SCA AB Sweden Materials 57.2% 53.9% May-20 8.5% 62.8% 32.2%
Trelleborg AB Sweden Capital Goods 89.0% 30.1% Nov-20 52.1% 92.2% 54.6%
Volvo AB Sweden Capital Goods 73.9% 22.8% Oct-20 44.0% 82.7% 11.4%
Getinge AB Sweden Health Care Equipment & Services 31.6% 34.2% Oct-20 37.5% 90.4% 6.3%
Sandvik AB Sweden Capital Goods 70.2% 41.0% Jul-20 19.5% 66.4% 18.2%
Husqvarna AB Sweden Consumer Durables & Apparel 137.4% 70.2% Jun-20 11.6% 71.4% 92.3%
Boliden AB Sweden Materials 66.5% 43.6% Jul-20 21.5% 91.2% 8.1%
Altria Group Inc United States of America Food, Beverage & Tobacco 25.1% 28.4% Sep-20 18.7% 79.7% 77.6%
Caesars Entertainment Corp United States of America Consumer Services 382.9% 114.4% Jun-20 8.7% 74.3% 98.3%
Celanese Corp United States of America Materials 78.5% 18.7% Nov-20 25.2% 78.6% 29.9%
Cisco Systems Inc United States of America Technology Hardware & Equipment 25.5% 21.0% Aug-20 44.4% 80.3% 40.3%
The FCO Cockpit - Global Bubble Status Report
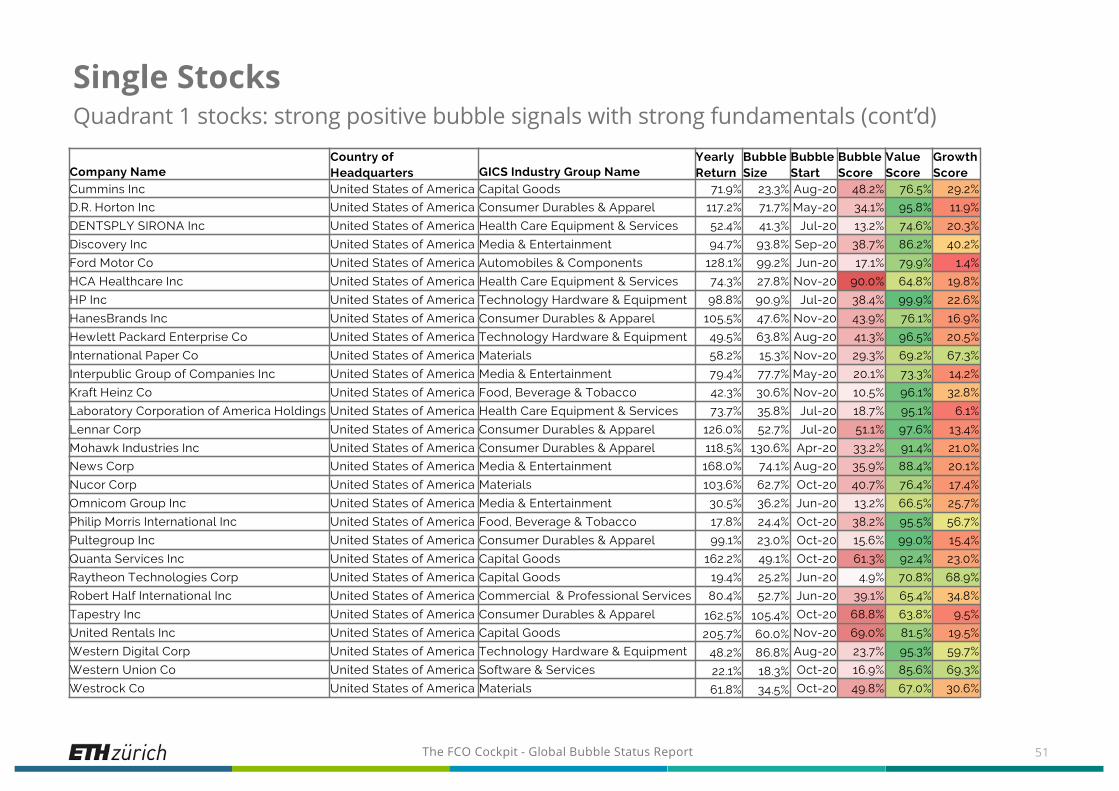
Single StocksQuadrant 1 stocks: strong positive bubble signals with strong fundamentals (cont’d)
51
Company NameCountry of Headquarters GICS Industry Group Name
Yearly Return
Bubble Size
Bubble Start
Bubble Score
Value Score
Growth Score
Cummins Inc United States of America Capital Goods 71.9% 23.3% Aug-20 48.2% 76.5% 29.2%
D.R. Horton Inc United States of America Consumer Durables & Apparel 117.2% 71.7% May-20 34.1% 95.8% 11.9%
DENTSPLY SIRONA Inc United States of America Health Care Equipment & Services 52.4% 41.3% Jul-20 13.2% 74.6% 20.3%
Discovery Inc United States of America Media & Entertainment 94.7% 93.8% Sep-20 38.7% 86.2% 40.2%
Ford Motor Co United States of America Automobiles & Components 128.1% 99.2% Jun-20 17.1% 79.9% 1.4%
HCA Healthcare Inc United States of America Health Care Equipment & Services 74.3% 27.8% Nov-20 90.0% 64.8% 19.8%
HP Inc United States of America Technology Hardware & Equipment 98.8% 90.9% Jul-20 38.4% 99.9% 22.6%
HanesBrands Inc United States of America Consumer Durables & Apparel 105.5% 47.6% Nov-20 43.9% 76.1% 16.9%
Hewlett Packard Enterprise Co United States of America Technology Hardware & Equipment 49.5% 63.8% Aug-20 41.3% 96.5% 20.5%
International Paper Co United States of America Materials 58.2% 15.3% Nov-20 29.3% 69.2% 67.3%
Interpublic Group of Companies Inc United States of America Media & Entertainment 79.4% 77.7% May-20 20.1% 73.3% 14.2%
Kraft Heinz Co United States of America Food, Beverage & Tobacco 42.3% 30.6% Nov-20 10.5% 96.1% 32.8%
Laboratory Corporation of America Holdings United States of America Health Care Equipment & Services 73.7% 35.8% Jul-20 18.7% 95.1% 6.1%
Lennar Corp United States of America Consumer Durables & Apparel 126.0% 52.7% Jul-20 51.1% 97.6% 13.4%
Mohawk Industries Inc United States of America Consumer Durables & Apparel 118.5% 130.6% Apr-20 33.2% 91.4% 21.0%
News Corp United States of America Media & Entertainment 168.0% 74.1% Aug-20 35.9% 88.4% 20.1%
Nucor Corp United States of America Materials 103.6% 62.7% Oct-20 40.7% 76.4% 17.4%
Omnicom Group Inc United States of America Media & Entertainment 30.5% 36.2% Jun-20 13.2% 66.5% 25.7%
Philip Morris International Inc United States of America Food, Beverage & Tobacco 17.8% 24.4% Oct-20 38.2% 95.5% 56.7%
Pultegroup Inc United States of America Consumer Durables & Apparel 99.1% 23.0% Oct-20 15.6% 99.0% 15.4%
Quanta Services Inc United States of America Capital Goods 162.2% 49.1% Oct-20 61.3% 92.4% 23.0%
Raytheon Technologies Corp United States of America Capital Goods 19.4% 25.2% Jun-20 4.9% 70.8% 68.9%
Robert Half International Inc United States of America Commercial & Professional Services 80.4% 52.7% Jun-20 39.1% 65.4% 34.8%
Tapestry Inc United States of America Consumer Durables & Apparel 162.5% 105.4% Oct-20 68.8% 63.8% 9.5%
United Rentals Inc United States of America Capital Goods 205.7% 60.0% Nov-20 69.0% 81.5% 19.5%
Western Digital Corp United States of America Technology Hardware & Equipment 48.2% 86.8% Aug-20 23.7% 95.3% 59.7%
Western Union Co United States of America Software & Services 22.1% 18.3% Oct-20 16.9% 85.6% 69.3%
Westrock Co United States of America Materials 61.8% 34.5% Oct-20 49.8% 67.0% 30.6%
The FCO Cockpit - Global Bubble Status Report
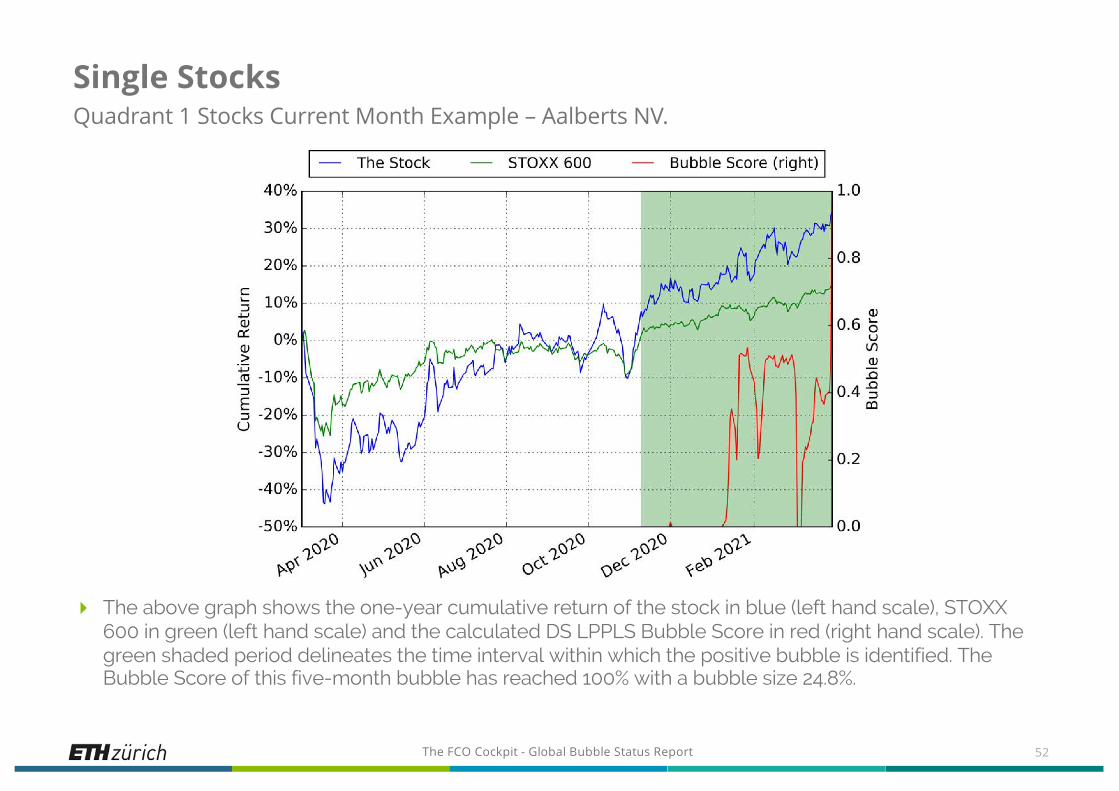
Single Stocks Quadrant 1 Stocks Current Month Example – Aalberts NV.
52
4 The above graph shows the one-year cumulative return of the stock in blue (left hand scale), STOXX600 in green (left hand scale) and the calculated DS LPPLS Bubble Score in red (right hand scale). The green shaded period delineates the time interval within which the positive bubble is identified. The Bubble Score of this five-month bubble has reached 100% with a bubble size 24.8%.
The FCO Cockpit - Global Bubble Status Report
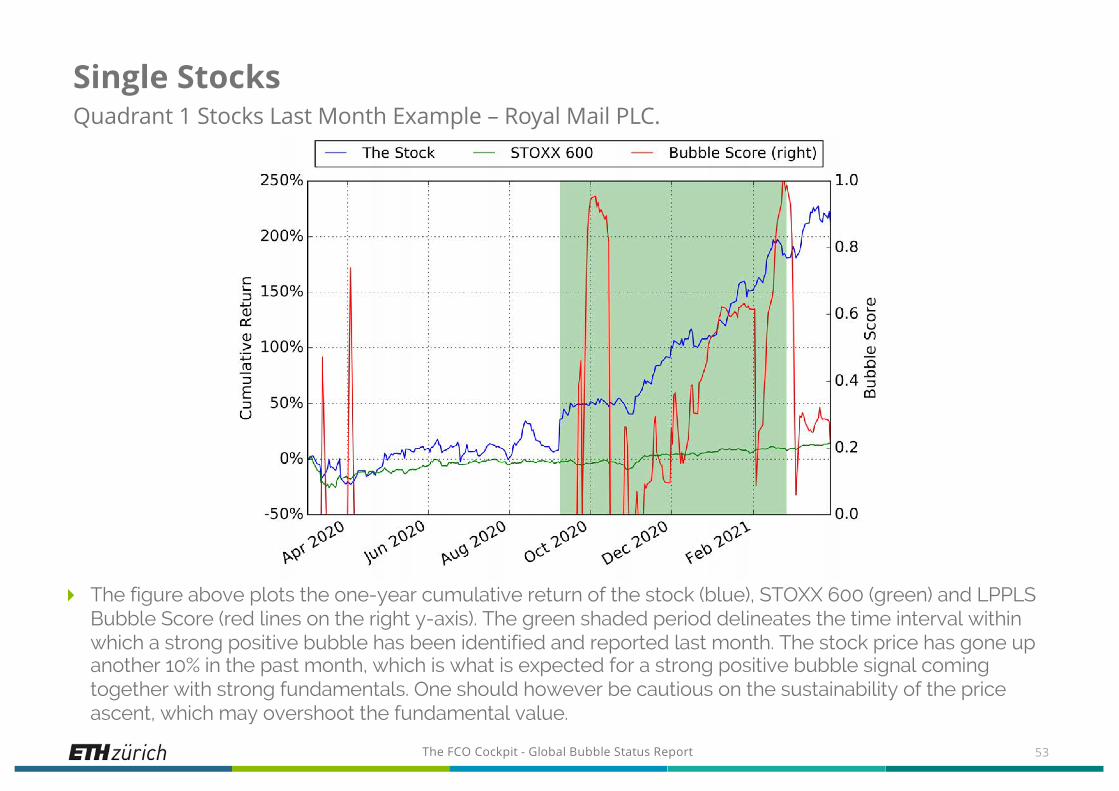
Single Stocks Quadrant 1 Stocks Last Month Example – Royal Mail PLC.
4 The figure above plots the one-year cumulative return of the stock (blue), STOXX 600 (green) and LPPLS Bubble Score (red lines on the right y-axis). The green shaded period delineates the time interval within which a strong positive bubble has been identified and reported last month. The stock price has gone up another 10% in the past month, which is what is expected for a strong positive bubble signal coming together with strong fundamentals. One should however be cautious on the sustainability of the price ascent, which may overshoot the fundamental value.
53
The FCO Cockpit - Global Bubble Status Report
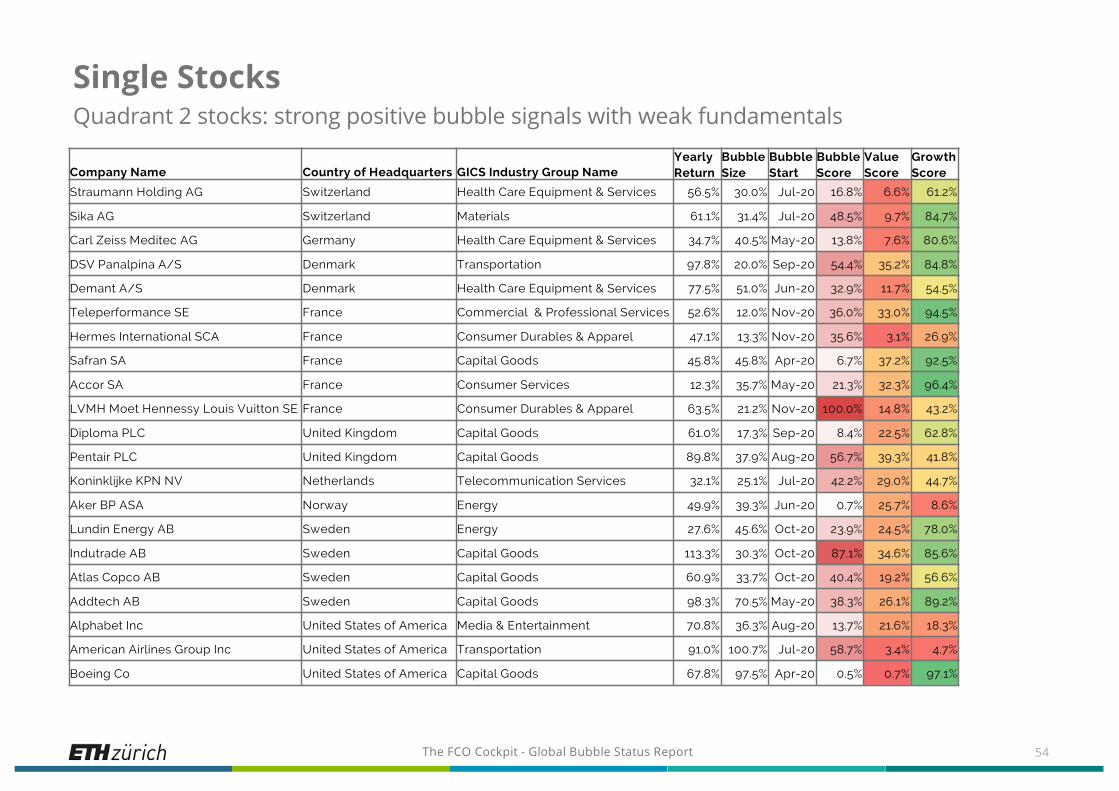
Single StocksQuadrant 2 stocks: strong positive bubble signals with weak fundamentals
54
Company Name Country of Headquarters GICS Industry Group NameYearly Return
Bubble Size
Bubble Start
Bubble Score
Value Score
Growth Score
Straumann Holding AG Switzerland Health Care Equipment & Services 56.5% 30.0% Jul-20 16.8% 6.6% 61.2%
Sika AG Switzerland Materials 61.1% 31.4% Jul-20 48.5% 9.7% 84.7%
Carl Zeiss Meditec AG Germany Health Care Equipment & Services 34.7% 40.5% May-20 13.8% 7.6% 80.6%
DSV Panalpina A/S Denmark Transportation 97.8% 20.0% Sep-20 54.4% 35.2% 84.8%
Demant A/S Denmark Health Care Equipment & Services 77.5% 51.0% Jun-20 32.9% 11.7% 54.5%
Teleperformance SE France Commercial & Professional Services 52.6% 12.0% Nov-20 36.0% 33.0% 94.5%
Hermes International SCA France Consumer Durables & Apparel 47.1% 13.3% Nov-20 35.6% 3.1% 26.9%
Safran SA France Capital Goods 45.8% 45.8% Apr-20 6.7% 37.2% 92.5%
Accor SA France Consumer Services 12.3% 35.7% May-20 21.3% 32.3% 96.4%
LVMH Moet Hennessy Louis Vuitton SE France Consumer Durables & Apparel 63.5% 21.2% Nov-20 100.0% 14.8% 43.2%
Diploma PLC United Kingdom Capital Goods 61.0% 17.3% Sep-20 8.4% 22.5% 62.8%
Pentair PLC United Kingdom Capital Goods 89.8% 37.9% Aug-20 56.7% 39.3% 41.8%
Koninklijke KPN NV Netherlands Telecommunication Services 32.1% 25.1% Jul-20 42.2% 29.0% 44.7%
Aker BP ASA Norway Energy 49.9% 39.3% Jun-20 0.7% 25.7% 8.6%
Lundin Energy AB Sweden Energy 27.6% 45.6% Oct-20 23.9% 24.5% 78.0%
Indutrade AB Sweden Capital Goods 113.3% 30.3% Oct-20 87.1% 34.6% 85.6%
Atlas Copco AB Sweden Capital Goods 60.9% 33.7% Oct-20 40.4% 19.2% 56.6%
Addtech AB Sweden Capital Goods 98.3% 70.5% May-20 38.3% 26.1% 89.2%
Alphabet Inc United States of America Media & Entertainment 70.8% 36.3% Aug-20 13.7% 21.6% 18.3%
American Airlines Group Inc United States of America Transportation 91.0% 100.7% Jul-20 58.7% 3.4% 4.7%
Boeing Co United States of America Capital Goods 67.8% 97.5% Apr-20 0.5% 0.7% 97.1%
The FCO Cockpit - Global Bubble Status Report
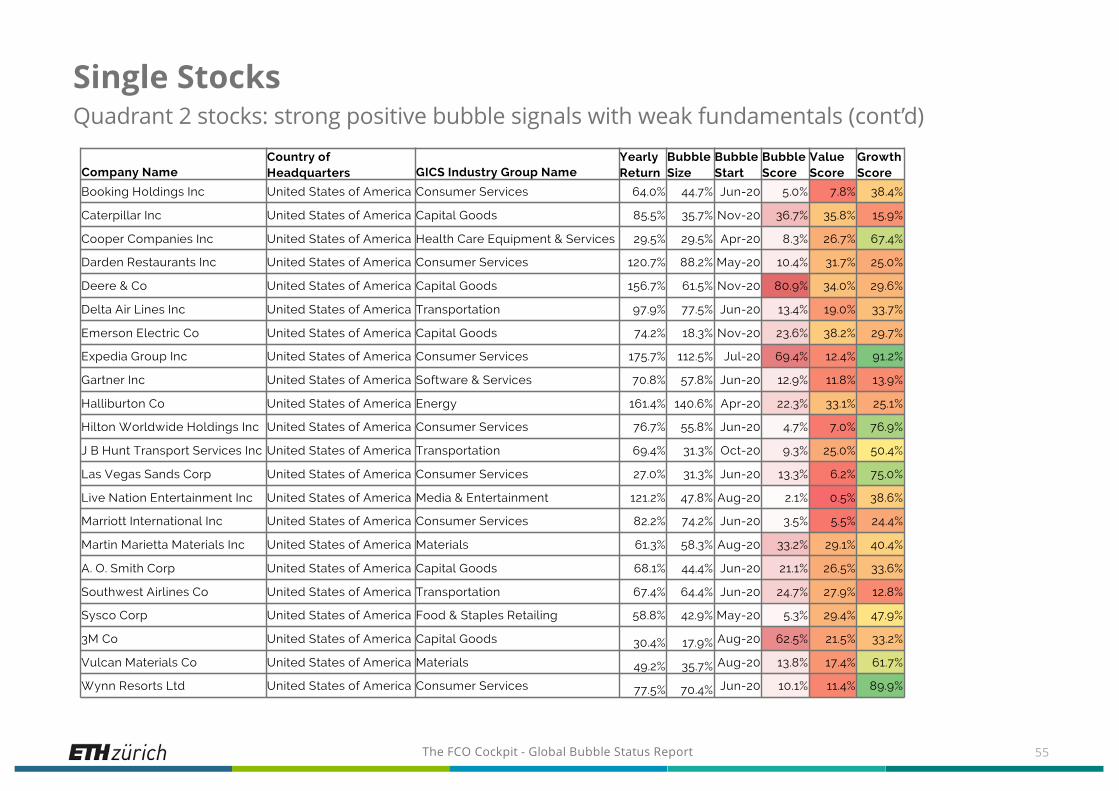
Single StocksQuadrant 2 stocks: strong positive bubble signals with weak fundamentals (cont’d)
55
Company NameCountry of Headquarters GICS Industry Group Name
Yearly Return
Bubble Size
Bubble Start
Bubble Score
Value Score
Growth Score
Booking Holdings Inc United States of America Consumer Services 64.0% 44.7% Jun-20 5.0% 7.8% 38.4%
Caterpillar Inc United States of America Capital Goods 85.5% 35.7% Nov-20 36.7% 35.8% 15.9%
Cooper Companies Inc United States of America Health Care Equipment & Services 29.5% 29.5% Apr-20 8.3% 26.7% 67.4%
Darden Restaurants Inc United States of America Consumer Services 120.7% 88.2% May-20 10.4% 31.7% 25.0%
Deere & Co United States of America Capital Goods 156.7% 61.5% Nov-20 80.9% 34.0% 29.6%
Delta Air Lines Inc United States of America Transportation 97.9% 77.5% Jun-20 13.4% 19.0% 33.7%
Emerson Electric Co United States of America Capital Goods 74.2% 18.3% Nov-20 23.6% 38.2% 29.7%
Expedia Group Inc United States of America Consumer Services 175.7% 112.5% Jul-20 69.4% 12.4% 91.2%
Gartner Inc United States of America Software & Services 70.8% 57.8% Jun-20 12.9% 11.8% 13.9%
Halliburton Co United States of America Energy 161.4% 140.6% Apr-20 22.3% 33.1% 25.1%
Hilton Worldwide Holdings Inc United States of America Consumer Services 76.7% 55.8% Jun-20 4.7% 7.0% 76.9%
J B Hunt Transport Services Inc United States of America Transportation 69.4% 31.3% Oct-20 9.3% 25.0% 50.4%
Las Vegas Sands Corp United States of America Consumer Services 27.0% 31.3% Jun-20 13.3% 6.2% 75.0%
Live Nation Entertainment Inc United States of America Media & Entertainment 121.2% 47.8% Aug-20 2.1% 0.5% 38.6%
Marriott International Inc United States of America Consumer Services 82.2% 74.2% Jun-20 3.5% 5.5% 24.4%
Martin Marietta Materials Inc United States of America Materials 61.3% 58.3% Aug-20 33.2% 29.1% 40.4%
A. O. Smith Corp United States of America Capital Goods 68.1% 44.4% Jun-20 21.1% 26.5% 33.6%
Southwest Airlines Co United States of America Transportation 67.4% 64.4% Jun-20 24.7% 27.9% 12.8%
Sysco Corp United States of America Food & Staples Retailing 58.8% 42.9% May-20 5.3% 29.4% 47.9%
3M Co United States of America Capital Goods 30.4% 17.9% Aug-20 62.5% 21.5% 33.2%
Vulcan Materials Co United States of America Materials 49.2% 35.7% Aug-20 13.8% 17.4% 61.7%
Wynn Resorts Ltd United States of America Consumer Services 77.5% 70.4% Jun-20 10.1% 11.4% 89.9%

The FCO Cockpit - Global Bubble Status Report
Single Stocks Quadrant 2 Stocks Current Month Example – LVMH Moet Hennessy Louis Vuitton SE.
4 The above graph shows the one-year cumulative return of the stock in blue (left hand scale), STOXX 600 in green (left hand scale) and the calculated DS LPPLS Bubble Score in red (right hand scale). The green shaded period delineates the time interval within which the positive bubble is identified. The Bubble Score of this five-month bubble has reached 100% with a bubble size 21.2%. The strong positive bubble signal and weak fundamentals may indicate a high probability of correction in the future.
56
The FCO Cockpit - Global Bubble Status Report
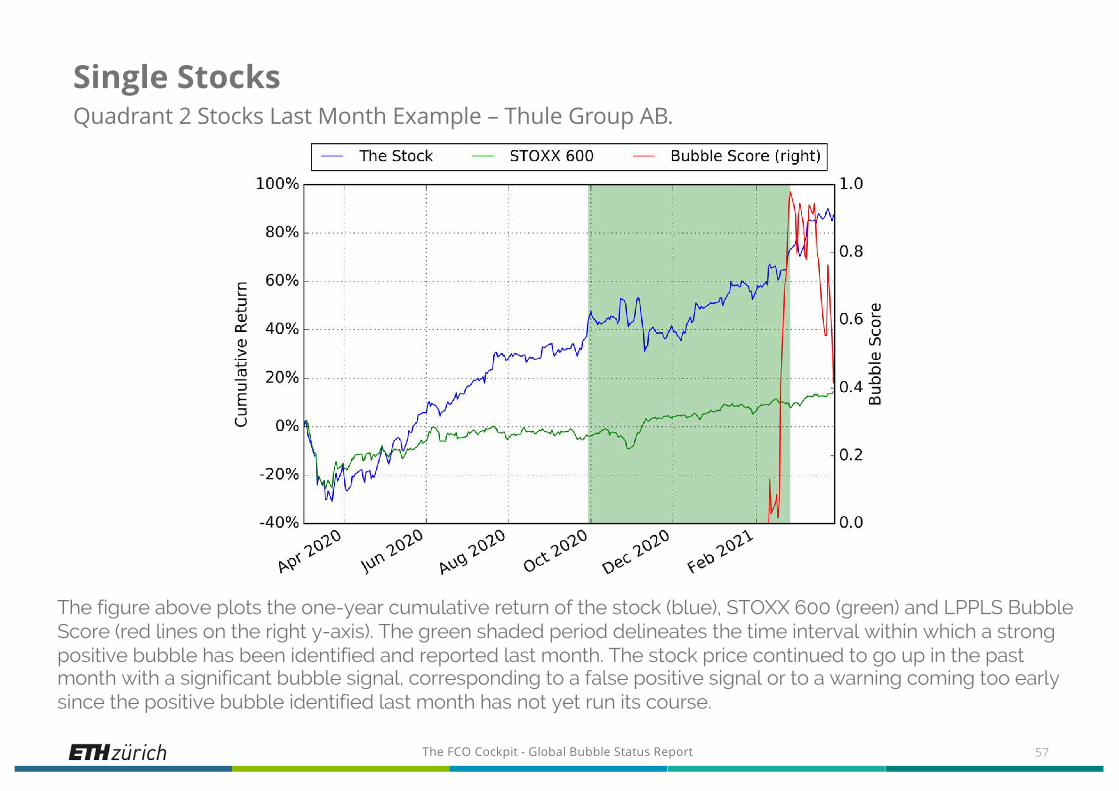
Single Stocks Quadrant 2 Stocks Last Month Example – Thule Group AB.
The figure above plots the one-year cumulative return of the stock (blue), STOXX 600 (green) and LPPLS Bubble Score (red lines on the right y-axis). The green shaded period delineates the time interval within which a strong positive bubble has been identified and reported last month. The stock price continued to go up in the past month with a significant bubble signal, corresponding to a false positive signal or to a warning coming too early since the positive bubble identified last month has not yet run its course.
57

The FCO Cockpit - Global Bubble Status Report
Single StocksQuadrant 3 stocks: strong negative bubble signals with weak fundamentals
58
Company Name Country of Headquarters GICS Industry Group NameYearly Return
Bubble Size
Bubble Start
Bubble Score
Value Score
Growth Score
Rentokil Initial PLC United Kingdom Commercial & Professional Services 23.5% -10.3% Jul-20 -10.6% 16.7% 34.5%
Brown-Forman Corp United States of America Food, Beverage & Tobacco 9.7% -10.4% Nov-20 -10.2% 8.6% 71.5%
Splunk Inc United States of America Software & Services 10.0% -31.2% Jun-20 -27.5% 1.7% 25.6%

The FCO Cockpit - Global Bubble Status Report
Single Stocks Quadrant 3 Stocks Current Month Example – Splunk Inc.
4 The above graph shows the one-year cumulative return of the stock in blue (left hand scale), NASDAQ 100 in green (left hand scale) and the calculated DS LPPLS Bubble Score in red (right hand scale). The red shaded period delineates the time interval within which the negative bubble is identified. The Bubble Score of this ten-month bubble has reached 27.5% with a bubble size -31.2%. This negative bubble is not yet matured completely and may continue to develop.
59
The FCO Cockpit - Global Bubble Status Report
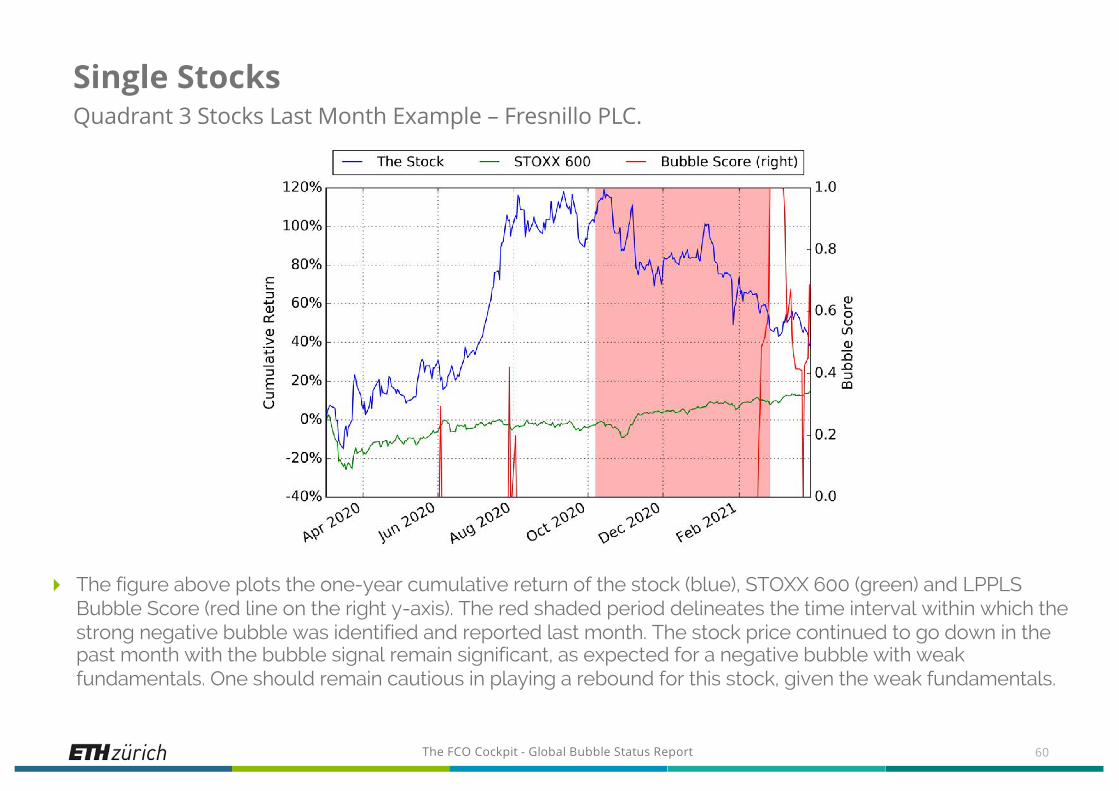
Single Stocks Quadrant 3 Stocks Last Month Example – Fresnillo PLC.
4 The figure above plots the one-year cumulative return of the stock (blue), STOXX 600 (green) and LPPLS Bubble Score (red line on the right y-axis). The red shaded period delineates the time interval within which the strong negative bubble was identified and reported last month. The stock price continued to go down in the past month with the bubble signal remain significant, as expected for a negative bubble with weak fundamentals. One should remain cautious in playing a rebound for this stock, given the weak fundamentals.
60
The FCO Cockpit - Global Bubble Status Report
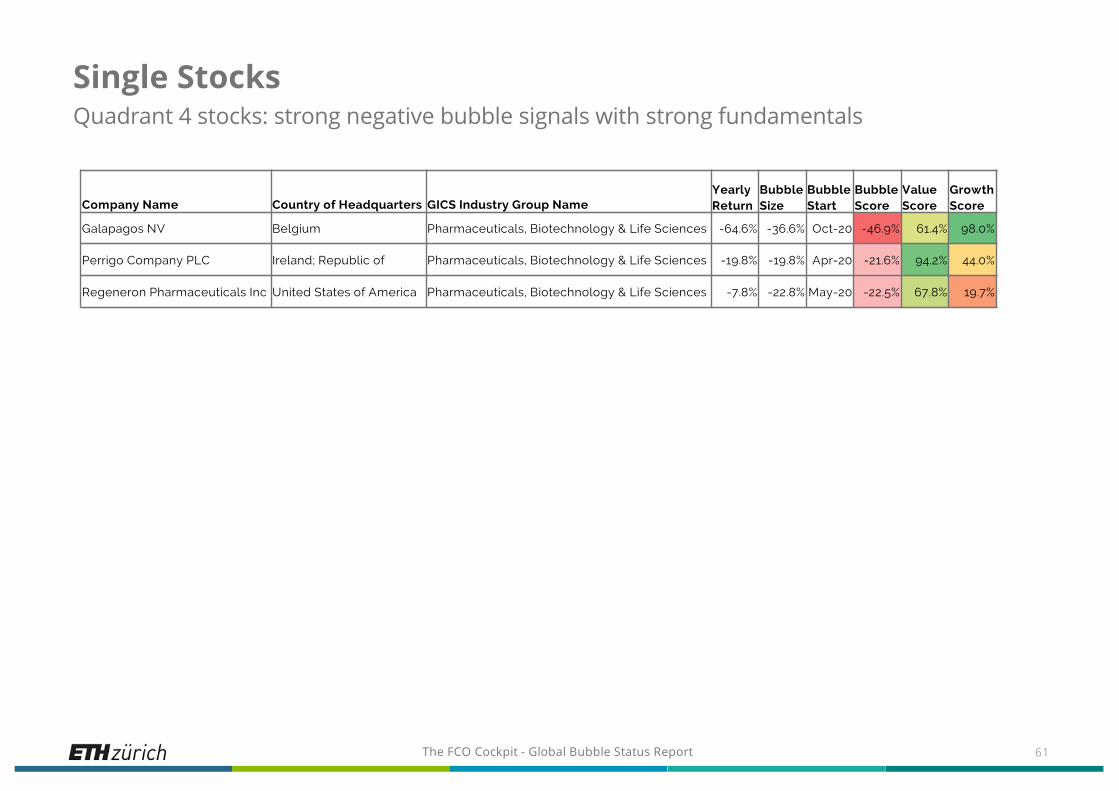
Single StocksQuadrant 4 stocks: strong negative bubble signals with strong fundamentals
61
Company Name Country of Headquarters GICS Industry Group NameYearly Return
Bubble Size
Bubble Start
Bubble Score
Value Score
Growth Score
Galapagos NV Belgium Pharmaceuticals, Biotechnology & Life Sciences -64.6% -36.6% Oct-20 -46.9% 61.4% 98.0%
Perrigo Company PLC Ireland; Republic of Pharmaceuticals, Biotechnology & Life Sciences -19.8% -19.8% Apr-20 -21.6% 94.2% 44.0%
Regeneron Pharmaceuticals Inc United States of America Pharmaceuticals, Biotechnology & Life Sciences -7.8% -22.8% May-20 -22.5% 67.8% 19.7%
The FCO Cockpit - Global Bubble Status Report
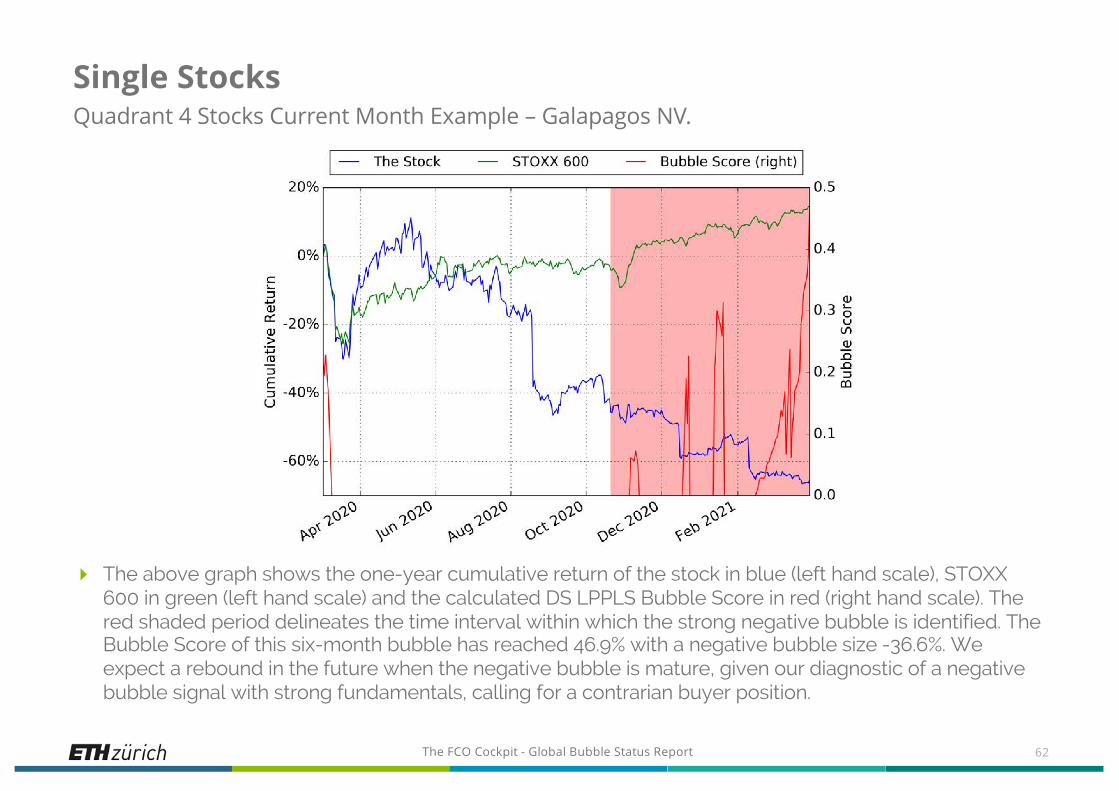
Single Stocks Quadrant 4 Stocks Current Month Example – Galapagos NV.
4 The above graph shows the one-year cumulative return of the stock in blue (left hand scale), STOXX 600 in green (left hand scale) and the calculated DS LPPLS Bubble Score in red (right hand scale). The red shaded period delineates the time interval within which the strong negative bubble is identified. The Bubble Score of this six-month bubble has reached 46.9% with a negative bubble size -36.6%. We expect a rebound in the future when the negative bubble is mature, given our diagnostic of a negative bubble signal with strong fundamentals, calling for a contrarian buyer position.
62
The FCO Cockpit - Global Bubble Status Report
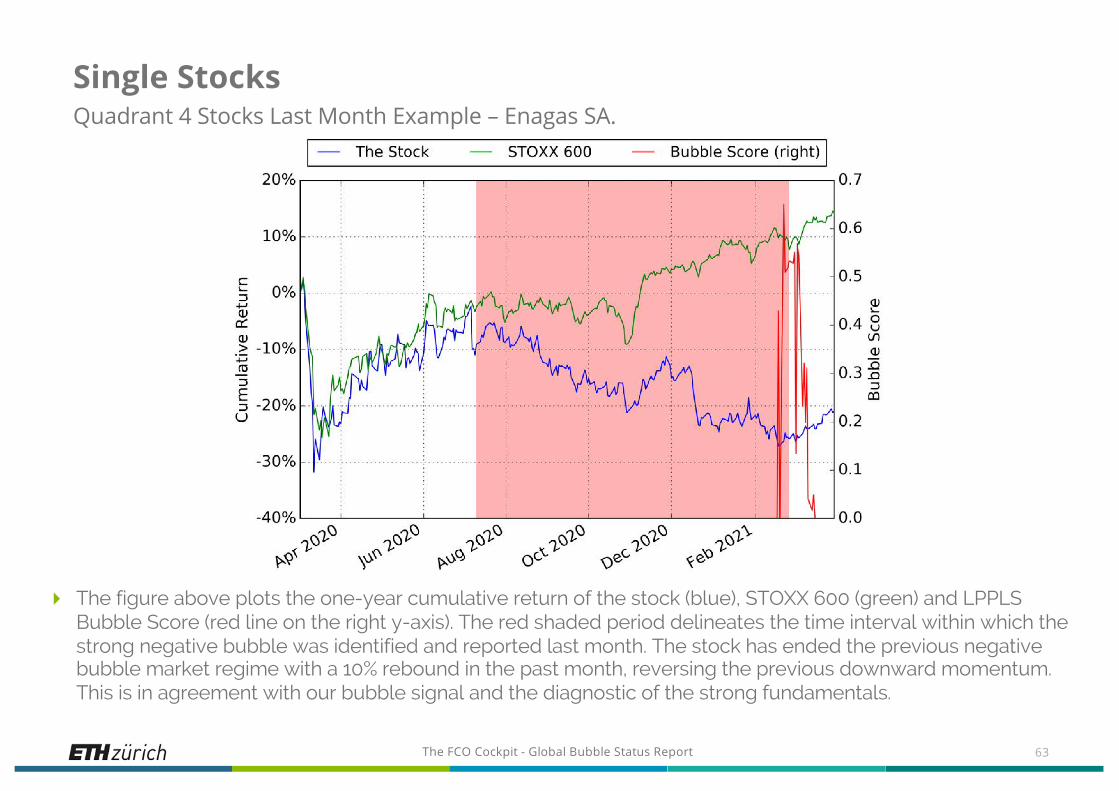
Single Stocks Quadrant 4 Stocks Last Month Example – Enagas SA.
4 The figure above plots the one-year cumulative return of the stock (blue), STOXX 600 (green) and LPPLS Bubble Score (red line on the right y-axis). The red shaded period delineates the time interval within which the strong negative bubble was identified and reported last month. The stock has ended the previous negative bubble market regime with a 10% rebound in the past month, reversing the previous downward momentum. This is in agreement with our bubble signal and the diagnostic of the strong fundamentals.
63

The FCO Cockpit - Global Bubble Status Report
More Information
4 Visit the Financial Crisis Observatory for more information
http://www.er.ethz.ch/financial-crisis-observatory.html
4 Contacts ETH Zurich
Jan-Christian Gerlach, Didier Sornette, Ke Wu & Dongshuai Zhao
Chair of Entrepreneurial RisksDepartment of Management, Technology and Economics
ETH ZurichScheuchzerstrasse 78092 Zurich, Switzerland
64