Embed Size (px)
Citation preview

University of New MexicoUNM Digital Repository
Biology ETDs Electronic Theses and Dissertations
Summer 7-28-2018
The fate of xylem-transported CO2 in plantsSamantha S. StutzUniversity of New Mexico
David T. HansonUniversity of New Mexico - Main Campus
Follow this and additional works at: https://digitalrepository.unm.edu/biol_etds
Part of the Biology Commons, Botany Commons, and the Other Plant Sciences Commons
This Dissertation is brought to you for free and open access by the Electronic Theses and Dissertations at UNM Digital Repository. It has beenaccepted for inclusion in Biology ETDs by an authorized administrator of UNM Digital Repository. For more information, please [email protected].
Recommended CitationStutz, Samantha S. and David T. Hanson. "The fate of xylem-transported CO2 in plants." (2018). https://digitalrepository.unm.edu/biol_etds/275

i
Samantha S. Stutz Candidate
Biology
Department
This dissertation is approved, and it is acceptable in quality and form for publication:
Approved by the Dissertation Committee:
David Hanson, Chairperson
Nate McDowell
Robert Teskey
Kathy Steppe

ii
THE FATE OF XYLEM-TRANSPORTED CO2 IN PLANTS
by
SAMANTHA S. STUTZ
B.S. Botany, University of Wyoming, 2010
M.Sc. Botany, Washington State University, 2012
DISSERTATION
Submitted in Partial Fulfillment of the
Requirements for the Degree of
Doctor of Philosophy
Biology
The University of New Mexico
Albuquerque, New Mexico
July, 2018

iii
Acknowledgments
Many people have aided me in the dissertation process, and I am grateful to all of them. I
thank my advisor Dr. Dave Hanson for his time, patience, encouragement, and advice
along with many laughs over the years. It has been a wonderful experience of learning
science and writing from you, Dave. I also thank you for expanding my comfort zone by
encouraging me to apply for different grants and providing so many opportunities for me
to grow as a scientist and extend collaborations. I thank the other members of my
committee, Drs. Bob Teskey, Nate McDowell and Kathy Steppe. Thank you for your
encouragement and enthusiasm for my projects and your expertise. I thank my family
and friends for being there through all the ups and downs and supporting me all the way.
In particular my dear friends Gabi, Maria and Peter Herczeg who have supported me
through the years by attending many concerts, providing many meals and many rides to
various places over the years. I would also like to thank my dear friends Duane and
Esther Harder along with Bruce and Nancy Townsend. It has been great to learn from
you over the years.
I am thankful for two wonderful labmates, Jeremiah Anderson and John Roesgen. The
two of you have been so supportive of me over the years. From listening to presentations,
to teaching me how to change LI-6400 mixing fans, I have learned so much from both of
you. I have greatly enjoyed having Dr. Patrick Hudson in the lab over the last year. I
have learned so much about R, stats, and how to explain things in a simple yet easy to
understand way. Patrick you have been such an example to look up to.
I am also thankful to Dr. Lucas Cernusak for encouraging me over the last few years. I
will always remember my discussion with Dr. Meisha Holloway-Phillips about my
dissertation research while wading at Cape Tribulation Beach in Queensland, Australia, I
could not get over how foolish I was for wading in saltwater crocodile infested water at
high tide 6 weeks after a women had been eaten about 40 km south of where we were
talking.

iv
The fate of xylem-transported CO2 in plants
by
Samantha S. Stutz
B.S. Botany, University of Wyoming, 2010
M.Sc. Botany, Washington State University, 2012
Ph.D. Biology, University of New Mexico, 2018
Abstract The concentration of carbon dioxide in tree stems can be ~30-750 times
higher than current atmospheric [CO2]. Dissolved inorganic carbon enters the
xylem from root and stem respiration and travels with water through the plant.
However, the fate of much of this xylem-transported CO2 is unknown. In these
studies I examined the fate of xylem-transported CO2 traveling through the petiole
and leaf. This was accomplished by placing cut leaves from a woody and
herbaceous C3 species, and a Kranz-type C4 species, in a solution of dissolved
NaH13
CO3 at concentrations similar to those measured in nature. This allowed me
to track the efflux of 13
CO2 using tunable diode laser absorption spectroscopy and
compare this with 12
CO2 fluxes derived from plant metabolism.
The objective of the first study was to measure the efflux of xylem-
transported CO2 out of the woody species Populus deltoides and the herbaceous C3
species Brassica napus in the dark by testing the relationship among the
concertation of bicarbonate in the xylem, the rate of transpiration, and the rate of
gross CO2 efflux. I found when the concentration of CO2 in the xylem is high and
when the rate of transpiration is also high, the magnitude of 13
CO2 efflux can
approach half of the rate of respiration in the dark.

v
The second study extends measurements of the fate of xylem-transported
CO2 into lighted conditions where photosynthesis is active. I measured 12
CO2 and
13CO2 fluxes across light- and CO2-response curves with the objectives of: 1)
determining how much and under what conditions xylem-transported CO2 exited
cut leaves in the light, and 2) determining how much xylem-transported CO2 was
used for photosynthesis and when the overall contribution to photosynthesis was
most important. I found that in the light the contribution of xylem-transported CO2
is most important when intercellular [CO2] is low which occurs under high
irradiance and low [CO2].
The last study focused on the efflux and use of xylem-transported CO2 in the
Kranz-type C4 species, Amaranthus hypochondriacus. Species with Kranz anatomy
have highly active photosynthetic cells surrounding the vascular bundle, which is
where xylem-transported CO2 would first interact with photosynthetic cells. The
objectives of this study were to determine: 1) the rate and total efflux of xylem-
transported CO2 exiting a cut leaf of the Kranz-type C4 species, A. hypochondriacus,
in the dark and 2) the rate and contribution of xylem-transported CO2 to total
assimilation in the light for A. hypochondriacus. Rates of dark efflux of xylem-
transported CO2 out of A. hypochondriacus leaves were lower in the dark compared
to rates observed in B. napus across the same rates of transpiration and bicarbonate
concentrations. In the light a higher portion of xylem-transported CO2 was used for
photosynthesis in A. hypochondriacus compared to B. napus suggesting that Kranz
anatomy influences how C4 plants use xylem-transported CO2 for photosynthesis.
vi
Table of Contents
List of Figures ........................................................................................................................x
List of Tables .........................................................................................................................xi
Chapter 1. Introduction……………………………………………………………….......... 1
References ..............................................................................................................................4
Chapter 2. Inside out: efflux of carbon dioxide from leaves represents more than leaf
metabolism ........................................................................................................................6
Abstract .............................................................................................................................7
Introduction .......................................................................................................................8
Materials and Methods .......................................................................................................11
Growth conditions and plant propagation ..................................................................11
Tunable diode laser absorbance spectroscopy and leaf gas exchange
measurements .............................................................................................................11
Anaplerotic reaction calculations ...............................................................................13
Stem [CO2*] ...............................................................................................................14
Statistical analyses .....................................................................................................15
Results ...............................................................................................................................16
Magnitude of xylem derived inorganic carbon efflux and retention in leaves ..........16
Stem [CO2*] ...............................................................................................................17
Discussion .........................................................................................................................18
Magnitude of xylem derived inorganic carbon efflux ...............................................18
Retention of xylem-transported CO2 in darkened leaves ...........................................20
Implications for understanding leaf and stem carbon fluxes .....................................21

vii
What would it take for this flux to be significant globally? ......................................23
Conclusions .......................................................................................................................23
Acknowledgements ...........................................................................................................24
References .........................................................................................................................24
Figure Legends...........................................................................................................30
Figures........................................................................................................................32
Chapter 3. Contribution and consequences of xylem-transported CO2 assimilation for C3
plants .................................................................................................................................37
Summary ...........................................................................................................................38
Introduction .......................................................................................................................39
Materials and Methods ......................................................................................................43
Plant propagation and growth ....................................................................................43
Light-response curves ................................................................................................43
CO2-response curves ..................................................................................................44
Estimating the rate of xylem-transported CO2 assimilation ......................................45
Statistical analysis ......................................................................................................46
Results ...............................................................................................................................46
Rates of assimilation ..................................................................................................46
Efflux of xylem-transported CO2 exiting the leaf in the light ...................................49
How do rates of 13
Ax compare to rates of 13
Clight efflux? ..............................................50
Contribution of xylem-transported CO2 assimilation to total assimilation ................50
Discussion .........................................................................................................................52
How large and is it possible to measure xylem-transported CO2 exiting a leaf in
the light ......................................................................................................................53

viii
When is xylem-transported CO2 assimilation most important ..................................55
Does xylem-transported CO2 matter for photosynthesis? ..........................................56
Conclusion .........................................................................................................................58
Acknowledgments .............................................................................................................59
Author contributions ..........................................................................................................59
References ..........................................................................................................................59
Table ..........................................................................................................................62
Figure Legends...........................................................................................................63
Figures........................................................................................................................66
Chapter 4. What is the fate of xylem-transported CO2 in Kranz-type C4 plants? .................73
Summary ...........................................................................................................................74
Introduction .......................................................................................................................75
Materials and Methods ......................................................................................................78
Plant propagation and growth ....................................................................................78
Dark efflux measurements .........................................................................................79
Estimating the consumption rate of xylem-transported CO2 in the dark ...................80
Light-response curves ................................................................................................81
CO2-response curves ..................................................................................................82
Estimating the amount of xylem-transported CO2 entering the cut leaves and rate
of consumption of xylem-transported CO2 in the light ..............................................83
Statistical analyses .....................................................................................................83
Results ...............................................................................................................................84
Retention and magnitude of xylem-transported CO2 in the dark ...............................84

ix
Xylem-transported CO2 that exited the leaf in the dark .............................................85
Did xylem-transported CO2 reach the leaf in the light? .............................................86
How much xylem-transported CO2 entered the leaf? ................................................87
Rates of 12
Aobs ............................................................................................................89
Rates of carbon fixation in the light ...........................................................................89
Discussion .........................................................................................................................90
Efflux of xylem-transported CO2 in the dark .............................................................91
Did the Kranz-type C4 plant use xylem-transported CO2 for photosynthesis? ..........93
Significance for the evolution to C4 photosynthesis? ................................................96
Conclusion .........................................................................................................................97
Acknowledgments.............................................................................................................98
Author contributions .........................................................................................................98
References .........................................................................................................................98
Figure Legends...........................................................................................................102
Figures........................................................................................................................105
Chapter 5. Conclusions .........................................................................................................112

x
List of Figures
Chapter 2 Figures ..............................................................................................................32
Figure 1. Fluxes of CO2 from plants ..........................................................................32
Figure 2. Effluxes at the same rate of transpiration ...................................................33
Figure 3. Xylem-transported CO2 exiting and consumed in the leaf .........................34
Figure 4. Transpiration dependence of xylem-transported CO2 ................................35
Figure 5. 12
CO2 and 13
Cefflux across a range of transpiration ......................................36
Chapter 3 ...........................................................................................................................66
Figure 1. Fate of xylem-transported CO2 in the light ................................................66
Figure 2. Rates of assimilation across light-response curves ....................................67
Figure 3. Rates of assimilation across CO2-response curves .....................................68
Figure 4. 13
Clight efflux and 13
Ax across light-response curves ......................................69
Figure 5. 13
Clight efflux and 13
Ax across CO2-response curves.......................................70
Figure 6. Contribution of 13
Ax to total A, 13
Clight efflux compared to respiration
light-response curves ................................................................................................71
Figure 7. Contribution of 13
Ax to total A, 13
Clight efflux compared to respiration CO2-
response curves ..........................................................................................................72
Chapter 4 Figures ..............................................................................................................105
Figure 1. Rates of 12
CO2 and 13
Cefflux vs. transpiration in the dark ............................105
Figure 2. Effluxes at the same rate of transpiration ...................................................106
Figure 3. Xylem-transported CO2 exiting and consumed in the leaf .........................107
Figure 4. Photosynthetic discrimination across light- and CO2-response curves ......108
Figure 5. 13
CO2 entering the leaf................................................................................109
Figure 6. Rates of assimilation across light- and CO2-response curves ....................110

xi
List of Tables
Chapter 2 Tables ....................................................................................................................62
Table 1. Definition and units for symbols in the text. .......................................................62

1
Chapter 1
Introduction
Concentrations of dissolved inorganic carbon in tree stems range from ~0.05 to ~13
mmol l-1
(Teskey et al., 2008); ~30-750 times higher than current atmospheric [CO2]. Dissolved
inorganic carbon (the sum of [CO2]aq, [HCO3-], [H2CO3], and [CO3
2-]) enters the xylem from root
and stem respiration and travels through the plant body in the transpiration stream. Xylem-
transported CO2 has two fates 1) it can exit the plant through the stem, branches or leaves or 2) it
can be used for photosynthesis by corticular and woody stem tissue (Teskey et al., 2008), branch
tissue (Teskey & McGuire, 2002; McGuire et al., 2009; Bloemen et al., 2013a, b), or leaves
(Stringer & Kimmerer, 1993: McGuire et al., 2009: Bloemen et al., 2013a, b; Bloemen et al.,
2015). In the dark, xylem-transported CO2 travels through a plant and exits from tissues far from
the point of origin, thus changing estimates for the rate of respiration for different plant organs
(i.e. if xylem-transported CO2 generated from root respiration effluxes from the stem then rates
of stem respiration would be overestimated while rates of root respiration would be
underestimated). In the light, assimilation of xylem-transported CO2 represents carbon fixation
invisible to standard measurements of photosynthetic activity, and may contribute significantly
to total plant carbon capture. Therefore, the objectives of this dissertation are to achieve a better
understanding of 1) how xylem-transported CO2 changes our understanding of respiration, by
measuring the efflux of xylem-transported CO2 from cut leaves in the dark, 2) how cut leaves
utilize xylem-transported CO2 for photosynthesis and contribute to measurements of CO2 efflux
from leaves in the light, and 3) how Kranz anatomy associated C4 metabolism impacts utilization
of xylem-transported CO2.

2
Models estimate that the current global contribution of leaf respiration accounts for 21-28
Pg C yr-1
, which is approximately 3-4 times larger than all emissions from fossil fuel burning
globally (Atkins et al. 2007, 2014). Models for leaf respiration assume that the CO2 generated
from respiration is produced in the mitochondria of leaf cells (Farquhar et al., 1980); however, if
CO2 is transported to leaves in the xylem this may change the estimates of the rate of leaf
respiration. Prior studies suggest this could be an important source of error. Bloemen et al.
(2013a) placed cut Populus deltoides branches in a 13
CO2 solution in the dark and measured how
much xylem-transported CO2 was taken up by the branch in the dark under two [13
CO2*] and
across high and low vapor pressure differences (VPD). They found that more 13
CO2 effluxed out
of the branch when the 13
CO2* was higher and when rates of transpiration were higher, which
occurred under high VPD. Stringer & Kimmerer (1993) placed cut leaves of P. deltoides in a
solution of NaH14
CO3 and found in the dark that 83% of the label exited the leaves as 14
CO2 in
the dark. However, in the light, it is likely that the efflux of xylem-transported CO2 exiting
leaves is lower since xylem-transported CO2 is consumed for photosynthesis.
Bloemen et al. (2013b) added 13
CO2 to the base of stems of P. deltoides saplings in the
field and found in a low-label treatment that only 17.4% of the label was incorporated into plant
tissue and in a high label treatment that only 5.6% of the label was incorporated into the plant
tissue. The bulk of what was used for photosynthesis was located in the stem and branches.
Leaves accounted for the smallest portion of xylem-transported CO2 fixed in both the low- and
high-labels. Using a leaf cutting and feeding approach, Stringer & Kimmerer (1993) also
determined that only a small portion of xylem-transported CO2 is used by a plant for
photosynthesis. They found that not accounting for the contribution of xylem-transported CO2 to
photosynthesis underestimated net photosynthesis by 0.5% and that the contribution of xylem-

3
transported CO2 to photosynthesis accounted for 2.2% of the atmospheric uptake by the leaf
under a low concentration of xylem-transported CO2.
Xylem-transported CO2 research has focused on C3 species; however, it is not known
how Kranz-type C4 plants use xylem-transported CO2 for photosynthesis. Vascular bundles in
Kranz-type C4 plants are surrounded by two layers of specialized cells containing carboxylation
enzymes, bundle-sheath cells which contain ribolose-1,5-bisphosphate-carboxylase/oxygenase
(Rubisco) and mesophyll cells which contain phosphoenolphyruvate carboxylase (PEPC). In
Kranz-type C4 species there is a high probability that xylem-transported CO2 will be captured by
Rubisco or PEPC before exiting the leaf as CO2. This is in contrast to C3 leaf anatomy where
vascular bundles are loosely surrounded by photosynthetic cells with intercellular air spaces,
allowing more opportunities for xylem-transported CO2 to exit the vascular bundle and then the
leaf without interacting with photosynthetic cells. Kranz anatomy may represent a mechanism
by which C4 plants increase their carbon use efficiency over their C3 counterparts, further
improving C4 water use efficiency in the light.
Xylem-transported CO2 is an emerging area of research that has the potential to change
our understanding of plant respiration and photosynthesis. For instance, in the dark, if the efflux
of xylem-transported CO2 out of the leaf is large, rates of leaf respiration maybe over estimated.
While in the light, if the concentration of xylem-transported CO2 is high current models of leaf
intercellular [CO2] may not be accurate, or if the contribution of xylem-transported CO2 to leaf
photosynthesis is high then models for leaf photosynthesis may need to be adjusted. Xylem-
transported CO2 has not been studied in C4 plants and may have a large impact on understanding
how Kranz-type C4 plants increase their water and carbon use efficiencies. While previous
studies have only been able to determine where xylem-transported CO2 is consumed and

4
incorporated into plant tissues; the method used in these studies allows for real-time
measurements of xylem-transported CO2 assimilation using a tunable diode laser coupled to a
portable photosynthesis machine to measure the efflux of xylem-transported CO2 out of a plant
along with the rate of assimilation using 13
C labeled xylem-transported CO2. The first study
sought to measure the efflux of xylem-transported CO2 exiting cut leaves of the woody P.
deltoides or the herbaceous plant Brassia napus in the dark in real-time. In the second study the
objective was to measure the efflux of xylem-transported CO2 out of a cut leaf in real-time and
measure how much xylem-transported CO2 is used for leaf photosynthesis in P. deltoides and B.
napus across both a light- and CO2-response curve. The final study estimated how much xylem-
transported CO2 exits Kranz-type C4 leaves in the dark and how Kranz-type C4 plants use xylem-
transported CO2 for photosynthesis.
References
Atkin OK, Meir P, Turnbull MH. 2014. Improving representation of leaf respiration in
largescale predictive climate-vegetation models. New Phytologist 202, 743-748.
Atkin OK, Scheurwater I, Pons TL. 2007. Respiration as a percentage of daily photosynthesis
in whole plants is homeostatic at moderate, but not high, growth temperatures. New Phytologist
174, 367-380.
Bloemen JB, McGuire MA, Aubrey DP, Teskey RO, Steppe K. 2013a. Assimilation of
xylem-transported CO2 is dependent on transpiration rate but is small relative to atmospheric
fixation. Journal of Experimental Botany 64, 2129-2138.
Bloemen JB, McGuire MA, Aubrey DP, Teskey RO, Steppe K. 2013b. Transport of
rootrespired CO2 via the transpiration stream affects aboveground carbon assimilation and CO2
efflux in trees. New Phytologist 197, 555-565.
Bloemen JB, McGuire MA, Aubrey DP, Teskey RO, Steppe K. 2015. Assimilation of xylem-
transported CO2 is dependent on transpiration rate but is small relative to atmospheric fixation.
Journal of Experimental Botany 64, 2129-2138.

5
Farquhar GD, von Caemmerer S, Berry JA. 1980. A biochemical model of photosynthetic
CO2 assimilation in leaves of C3 species. Planta 149: 78-90.
McGuire MA, Marshall JD, Teskey RO. 2009. Assimilation of xylem-transported 13
C-
labelled CO2 in leaves and branches of sycamore (Platanus occidentalis L.). Journal of
Experimental Botany 60, 3809-3817.
Stringer JW, Kimmerer TW. 1993. Refixation of xylem sap CO2 in Populus deltoides.
Physiologia Plantarum 89, 243-251.
Teskey RO, McGuire MA. 2002. Carbon dioxide transport in xylem causes errors in estimation
of rates of respiration in stems and branches of trees. Plant, Cell & Environment 25: 1571-1577.
Teskey RO, Saveyn A, Steppe K, McGuire MA. 2008. Origin, fate and significance of CO2 in
tree stems. New Phytologist 117, 17-32.

6
Chapter 2
This is the peer reviewed version of the following article: Inside out: efflux of carbon dioxide
from leaves represents more than leaf metabolism. Journal of Experimental Botany: 68, 2849-
2857. doi:10.1093/jxb/erx155
Samantha S. Stutz, Jeremiah Anderson, Rachael Zulick, David T. Hanson; Inside out: efflux of
carbon dioxide from leaves represents more than leaf metabolism, Journal of Experimental
Botany, Volume 68, Issue 11, 17 May 2017, Pages 2849–2857
https://doi.org/10.1093/jxb/erx155
Inside out: efflux of carbon dioxide from leaves represents more than leaf
metabolism
SAMANTHA S. STUTZ1, JEREMIAH ANDERSON
1, RACHAEL ZULICK
1,
DAVID T. HANSON1
1Department of Biology, University of New Mexico, MSC03-2020, 1 University of
New Mexico, Albuquerque, NM 87131, USA
Highlight
Respired CO2 is transported through xylem and effluxes far from its point of origin. We supplied
13C to leaves to show the effect of transported CO2 on measured leaf respiration.

7
Abstract
High concentrations of inorganic carbon in the xylem, produced from root, stem, and branch
respiration, travel via the transpiration stream and eventually exit the plant through distant tissues
as CO2. Unlike previous studies that focused on the efflux of CO2 from roots and woody tissues,
we focus on efflux from leaves and the potential effect on leaf respiration measurements. We
labeled transported inorganic carbon, spanning reported xylem concentrations, with 13
C and then
manipulated transpiration rates in the dark in order to vary the rates of inorganic carbon supply to
cut leaves from Brassica napus and Populus deltoides. We used tunable diode laser absorbance
spectroscopy to directly measure the rate of gross 13
CO2 efflux, derived from inorganic carbon
supplied from outside of the leaf, relative to gross 12
CO2 efflux generated from leaf cells. These
experiments showed that 13
CO2 efflux was dependent upon the rate of inorganic carbon supply to
the leaf and the rate of transpiration. Our data show that the gross leaf efflux of xylem-
transported CO2 is likely small in the dark when rates of transpiration are low. However, gross
leaf efflux of xylem-transported CO2 could approach half the rate of leaf respiration in the light
when transpiration rates and branch inorganic carbon concentrations are high, irrespective of the
grossly different petiole morphologies in our experiment.
Key words: Brassica napus, carbon cycle, CO2 efflux, internally transported CO2, leaf
respiration, Populus deltoides, stem [CO2*], terrestrial carbon sink, tunable diode laser
absorbance spectroscopy, xylem-transported CO2.

8
INTRODUCTION
Environmental control of leaf-level respiration is poorly understood and the global flux of
respired CO2 from leaves is massive. Current estimates indicate that global leaf respiration is 21-
28 Pg C yr-1
, which is approximately 3-4 times larger than all emissions from fossil fuel burning
globally (Atkin et al., 2007; Atkin et al., 2014). The combination of uncertainty and small errors
in the measurement of respiration can have large consequences (Hanson et al., 2016). For
example, a 1% error in predictions of leaf respiration (i.e. 0.21-0.28 Pg C yr-1
) would account for
about a third of the 0.7 Pg C yr-1
uncertainty in global carbon models (Canadell et al., 2007).
Such a large role of leaf respiration is consistent with analyses showing that behavior of the
carbon cycle is the second greatest source of uncertainty in climate model predictions of global
temperature. Over 15% of this uncertainty can be attributed to temperature feedbacks on
respiration and net primary productivity (Bodman et al., 2013). Coupled climate Earth System
Models and Terrestrial Biosphere Models have made some advances that improve the modeling
of respiration (King et al., 2006; Atkin et al., 2008; Wythers et al., 2013; Atkin et al. 2015;
Wullschleger et al., 2015), while also highlighting the need for more data (King et al., 2006;
Atkin et al., 2008; Reich, 2010; Atkin et al., 2015; Wullschleger et al., 2015).
All methods for measuring or modeling the rate of gross non-photorespiratory CO2 efflux
(respiration) from leaves implicitly assume that all CO2 efflux is derived from metabolism
occurring in leaf cells (e.g. Farquhar et al. 1980). Similarly, it has often been assumed that in
roots, internally generated CO2 diffuses into the soil before diffusing into the atmosphere
(Kuzyakov, 2006). However, studies with woody plants show that a large fraction of CO2
generated by root and stem respiration can be transported through the xylem and efflux from the
plant to the atmosphere through the stem and branches at a point remote from its production

9
(Levy et al., 1999; McGuire and Teskey, 2002; McGuire et al., 2009; Aubrey and Teskey, 2009;
Bloemen et al., 2013a, b; Bloemen et al., 2015a; Steppe et al., 2015) (Fig. 1). The efflux of
xylem-transported CO2 can be large because the total inorganic carbon concentration ([CO2*],
the sum of [CO2]aq, [H2CO3], [HCO3-] and [CO3
2-]) in the xylem ranges from ~0.05 mmol l
-1 to
~13 mmol l-1
, levels that are ~30-750 times higher than if equilibrated with current atmospheric
[CO2] (Teskey et al., 2008). Previous studies have found xylem-transported CO2* is recycled by
photosynthesis in corticular and woody stem tissue (Teskey et al., 2008), branch tissue (McGuire
and Teskey, 2002; McGuire et al., 2009; Bloemen et al., 2013a, b) and even leaves (Stringer and
Kimmer, 1993; McGuire et al., 2009; Bloemen et al., 2013a, b; Bloemen et al., 2015a). The
relative magnitude of this recycling in each part of the tree was demonstrated by Bloemen et al.
(2013b). They added 13
CO2* to the stems of Populus deltoides in the field under a low (1.4
mmol l-1
[13
CO2*]) and high (12 mmol l
-1 [
13CO2
*]) treatments, and used destructive sampling for
mass balance calculations to track the fate of the labeled carbon. They concluded that 82.6% and
94.4% of 13
CO2* added to the stems of the low and high treatment, respectively, was transported
through the transpiration stream and diffused into the atmosphere through some combination of
the stem and branches over a period of two days. Most of the 13
CO2* retained by the plant was
recycled by photosynthesis in the stem and branches, with a small fraction recycled by leaves
(2.7% and 0.5% under the low- and high-labels, respectively—Bloemen et al., 2013b). Very
little data exist to assess if the low rates of re-capture of xylem-transported CO2 by leaves is the
result of little xylem-transported CO2* reaching the leaves, or because only a small amount of
what reaches leaves is captured before diffusing away. When supplying a solution of H14
CO3- in
water to excised leaves, Stringer and Kimmerer (1993) estimated that 0.14% and 0.38% diffused
out of the leaf as 14
CO2 under 660 μmol quanta m-2
s-1
and 70 μmol quanta m-2
s-1
, respectively,
10
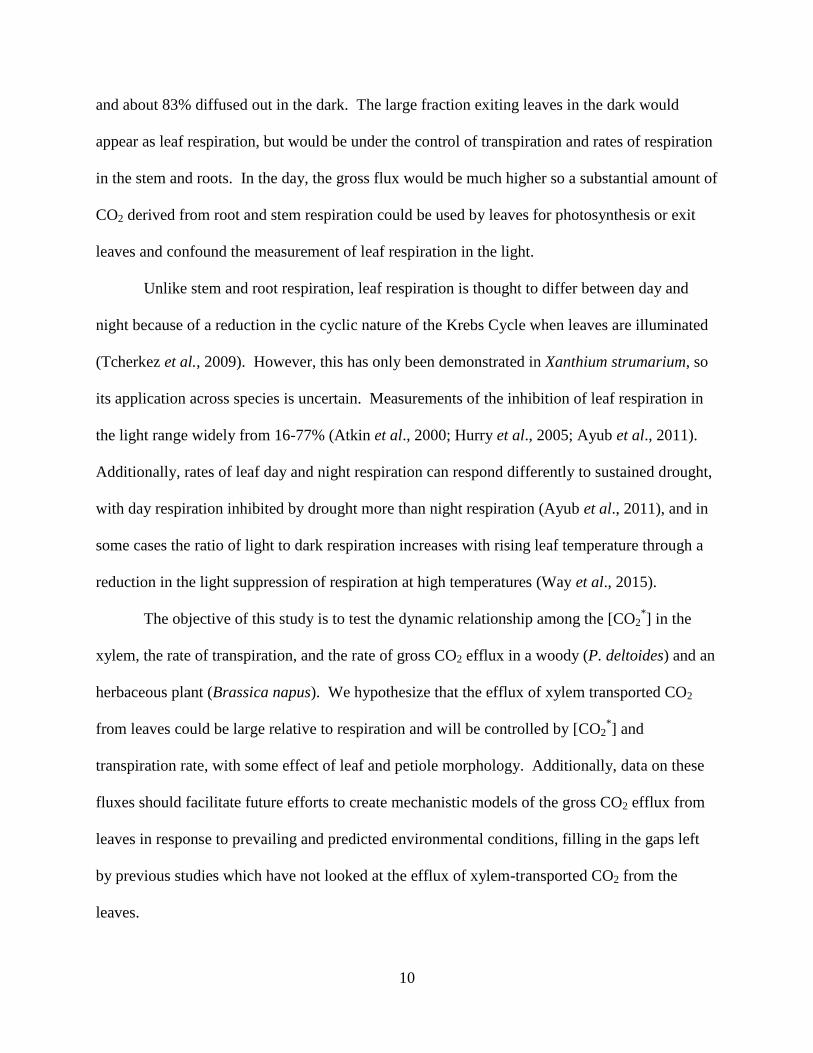
and about 83% diffused out in the dark. The large fraction exiting leaves in the dark would
appear as leaf respiration, but would be under the control of transpiration and rates of respiration
in the stem and roots. In the day, the gross flux would be much higher so a substantial amount of
CO2 derived from root and stem respiration could be used by leaves for photosynthesis or exit
leaves and confound the measurement of leaf respiration in the light.
Unlike stem and root respiration, leaf respiration is thought to differ between day and
night because of a reduction in the cyclic nature of the Krebs Cycle when leaves are illuminated
(Tcherkez et al., 2009). However, this has only been demonstrated in Xanthium strumarium, so
its application across species is uncertain. Measurements of the inhibition of leaf respiration in
the light range widely from 16-77% (Atkin et al., 2000; Hurry et al., 2005; Ayub et al., 2011).
Additionally, rates of leaf day and night respiration can respond differently to sustained drought,
with day respiration inhibited by drought more than night respiration (Ayub et al., 2011), and in
some cases the ratio of light to dark respiration increases with rising leaf temperature through a
reduction in the light suppression of respiration at high temperatures (Way et al., 2015).
The objective of this study is to test the dynamic relationship among the [CO2*] in the
xylem, the rate of transpiration, and the rate of gross CO2 efflux in a woody (P. deltoides) and an
herbaceous plant (Brassica napus). We hypothesize that the efflux of xylem transported CO2
from leaves could be large relative to respiration and will be controlled by [CO2*] and
transpiration rate, with some effect of leaf and petiole morphology. Additionally, data on these
fluxes should facilitate future efforts to create mechanistic models of the gross CO2 efflux from
leaves in response to prevailing and predicted environmental conditions, filling in the gaps left
by previous studies which have not looked at the efflux of xylem-transported CO2 from the
leaves.

11
MATERIALS AND METHODS
Growth conditions and plant propagation
Brassica napus (L. stellar DH GT060615) and Populus deltoides (W. Bartram ex
Marshall) were grown under natural light in an unshaded greenhouse in February and March
2013 and 2014, with mid-day photosynthetically active radiation (PAR) at pot level of 1200
mol m-2
s-1
at the University of New Mexico in Albuquerque, NM, under ambient CO2,
21ºC/18ºC and 24ºC/21ºC day/night for B. napus and P. deltoides, respectively.
B. napus was started from seed, and P. deltoides was clonally propagated by cuttings. B.
napus was sown in 500 mL pots with Metro-Mix 300 potting soil (Sun Gro Horticulture, Seba
Beach, AB, Canada). P. deltoides cuttings were initially placed in cone-tainers filled with
Metro-Mix 300 potting soil and allowed to grow for approximately two months before the soil
was washed off the roots and cuttings were transplanted into 3.8 L pots with a mixture of
approximately two parts vermiculite (Therm-O-Rock West Inc., Chandler, AZ, USA) to one part
perlite (Therm-O-Rock West Inc., Chandler, AZ, USA) and less than 5% Agrosoke crystals
(Agrosoke International Arlington, TX, USA). B. napus and P. deltoides were fertilized twice
weekly with Peters 20-20-20 fertilizer (Scotts Miracle-Gro, Marysville, OH, USA) and once
weekly with chelated liquid iron (ferti-lome, Bonham, TX, USA). B. napus plants were
measured between 14 and 25 days after geminating.
Tunable diode laser absorbance spectroscopy and leaf gas exchange measurements
A LI-6400 (LI-COR Biosciences, Lincoln, NE, USA) was coupled to a tunable diode
laser (TDL) absorbance spectrometer (model TGA 100; Campbell Scientific, Inc., Logan, UT,
USA) to measure online 12
CO2 and 13
CO2 exchange. Isotope calibration consisted of a high and a

12
low CO2 tank that spanned the expected range of [CO2] of each isotopologue for the LI-COR
reference and sample (Barbour et al., 2007). The TDL cycled between calibrations of the high
and low CO2 tank along with the LI-COR reference and sample line measuring for one minute at
each site; however, only the last 10 seconds of data from each site were used for calculations via
the tdllicor processing package (Erhardt and Hanson, 2013) in R (R Core Development Team,
2011). The TDL measures [12
CO2] and [13
CO2], so the net fluxes of each were calculated as in
normal gas exchange, where total [CO2] is measured in the air supplied to the leaf chamber and
within the well-mixed leaf chamber. All data presented below reflects the 12
CO2 and 13
CO2
effluxes measured with the TDL.
The entire, highest, fully expanded B. napus leaf, with a petiole length between 6.5 cm
and 8.5 cm, or a fully expanded P. deltoides leaf, with a petiole length between 4 cm and 7 cm,
was placed in a large (80 cm2) custom clear topped chamber attached to a LI-6400 (LI-COR
Biosciences, Lincoln, NE, USA). An RGB LED light source (LI-COR Biosciences) set at 1200
μmol quanta m-2
s-1
or 1500 μmol quanta m-2
s-1
for B. napus and P. deltoides, respectively, was
placed over the custom LI-6400 leaf chamber with 25ºC (leaf temperature) and 3.8 Pa (380 μmol
mol-1
) CO2 reference. The leaves were photographed, and projected leaf area was estimated
using ImageJ (US National Institutes of Health, Bethesda, MD, USA).
Once photosynthesis reached a steady state, the leaf was detached from the plant and the
petiole was placed in a 40 mmol l-1
KCl solution. The detached leaf remained in the KCl
solution for ~10 minutes while rates of transpiration and photosynthesis were monitored.
Photosynthesis did not change when the leaf was cut, while transpiration increased by ~0.2 mmol
H2O m-2
s-1
. The KCl solution was swapped for a solution containing 99 atom % 13
C sodium
bicarbonate dissolved in 40 mmol l-1
KCl at one of three [13
CO2*]: 1.19, 5.95, or 11.9 mmol l
-1.

13
Individual leaves were only provided a single [13
CO2*]. These concentrations span the range of
observed values from previous field studies for tree xylem [CO2*]. Approximately 90 seconds
after adding the 13
CO2* solution, a sharp increase in
13CO2 efflux started and the light on the LI-
6400 was turned off. Throughout the measurement period, the rate of transpiration was
manipulated by switching the LI-COR desiccant between full scrub (i.e., high VPD and higher
rates of transpiration) and full bypass (i.e., low VPD and lower rates of transpiration). To further
increase the relative humidity when the desiccant was on full bypass, a condensing tube in a
water bath (VWR Scientific products, West Chester, PA, USA) was attached to the LI-COR inlet
to decrease VPD to 0.5 kPa or less.
The desiccant was left on full scrub or full bypass for approximately one hour. The
measurement cycle consisted of approximately 3-4 alternating high and low VPD periods. This
procedure was used to gain the widest range of transpiration values possible in the dark for
comparisons of transpiration and 13
CO2 efflux. Data consist of four replicates for each
bicarbonate concentration from four different individuals for each species.
Anaplerotic reactions calculations
The average natural abundance of 13
CO2 in the atmosphere is ~1.1% (Griffis et al., 2004)
and we assumed the background rate of 13
C leaf respiration, i.e. the rate of 13
CO2 respiration
from an unlabeled leaf (13
CRL), would be proportional to the rate of 12
CO2 respiration (12
CRL)
according to the natural abundance for each isotopologue. Therefore, we approximated 13
CRL as
1.1% of the total respiration rate (12
CRL + 13
CRL) and used the measured 12
CRL as the basis for
calculations. This approach gave data consistent with 12
CO2 and 13
CO2 respiration measured
from an unlabeled leaf. We calculated an expected 13
C efflux (13
Ccal efflux) that would occur if all

14
the 13
CO2 added to the cut leaf exited the leaf as 13
CO2. This was accomplished by multiplying
the [13
CO2*] in the solution fed to the leaves by the rate of transpiration and adding it to the
background 13
CRL. After supplying 13
CO2 to the leaf we used the ratio of observed 13
CO2 efflux
(13
Cefflux) to 13
Ccal efflux to determine the fraction of supplied 13
CO2 exiting the leaf and expressed
it as a percentage. We estimated the rate of anaplerotic reactions by taking the difference
between 13
Ccal efflux and observed 13
Cefflux. For these calculations we assumed the transpiration
rate, along with the rate of 12
C and 13
C effluxes were constant across one TDL/LI-COR cycle (4
or 6 minutes). We excluded the first 30 minutes after the light was turned off for these
calculations to avoid potential complications from light enhanced dark respiration (LEDR) and to
allow the water in the leaf to be replaced with the water supplied to the petiole.
Stem [CO2*]
In situ stem CO2 concentration and pH were measured according to McGuire and
Teskey (2002). To calibrate the CO2 microelectrode (GS-136CO-1 Micro Carbon dioxide
electrode, Lazar Research Laboratories Inc., Los Angeles, CA, USA) four calibration tanks of 0,
0.33, 2.10, and 7.0% [CO2] were dissolved into Milli-Q water with a glass bubbler for at least
one hour. Percent CO2 gas by volume in stems is the value calculated in the airspace around the
xylem tissue that would exist when it is equilibrated with the total dissolved inorganic carbon in
xylem sap ([CO2*] = [CO2]aq + [H2CO3] + [HCO3
-] + [CO3
2-]). The pH of the calibration water
in the glass bubblers was measured in order to calculate all forms of inorganic carbon in solution.
Insertion of the CO2 microelectrode was accomplished by making a hole slightly larger
than the microelectrode diameter in plant stems using a drill bit. For B. napus a hole was drilled
into the main stem, ~1.5 cm in diameter with well-developed secondary tissue growth. The drill

15
tip was inserted into the first layer of the stem (~0.25 cm, assumed to be phloem tissue) and hit a
stiff inner section at ~0.50 cm, which was assumed to be secondary xylem tissue. For P.
deltoides the drill was placed in a woody stem that was approximately 5 cm in diameter and was
drilled until reaching woody tissue (~1 cm into the stem). For both plants, a micro pH electrode
(0.1 mm immersion depth—PHR-146S micro pH electrode, Lazar Research Laboratories Inc.,
Los Angeles, CA, USA) was placed in the hole in the stem, and the pH was measured prior to
insertion of the CO2 microelectrode. Measurements with the CO2 microelectrode were recorded
every minute until the mV reading was stable for ten minutes. Following the measurement with
the CO2 microelectrode, pH was again measured to see if the stem sap pH had changed. Stem
measurements were collected to provide data on the range of values to expect in small potted
plants grown in a greenhouse. We believe these represent a minimum value for what would be
found in branch tips throughout a tree canopy (if no xylem-transported CO2 from roots and stems
arrived from outside the branch) and should be roughly similar to stem [CO2] in a field-grown B.
napus. The stem [CO2] data were collected separately from the detached leaf measurements,
using the same P. deltoides individuals and a separate cohort of B. napus plants.
Statistical Analyses
Statistical analyses were performed using R. Linear regression models were produced for
rates of 12
CRL and 13
Cefflux for all [13
CO2*] and both species. ANCOVAs were performed to
detect any significant difference among [13
CO2*] treatments for the rates of
12CRL and
13Cefflux for
both species. Two-way ANOVAs were used for percentage of 13
CO2 exiting the leaf, estimated
rate of anaplerotic reactions and 13
Cefflux at a given rate of transpiration for both [13
CO2*] and
species. Post-hoc analysis was performed using a Tukey HSD test.

16
RESULTS
Magnitude of xylem derived inorganic carbon efflux and retention in leaves
The gross rate of 13
Cefflux was dependent on the [13
CO2*] supplied to the leaf when
compared at a transpiration rate of 0.5 mmol H2O m-2
s-1
in both B. napus (P<0.001) and P.
deltoides (P<0.001) (Fig. 2). Over-all the 13
Cefflux was significantly higher in P. deltoides than B.
napus (P=0.03), but not for pairwise comparisons at each [CO2*]. The gross rate of
12CRLwas not
significantly affected by [13
CO2*] (Fig. 2B) in either B. napus (P=0.80) or P. deltoides (P=0.72).
13CO2
* provided to the petioles entered the darkened leaves through the xylem via the
transpiration stream and exited the leaves as 13
CO2 (Fig. 3A, B). Approximately 50% of 13
CO2*
at 1.19 mmol l-1
and 5.95 mmol l-1
, and ~70% at 11.9 mmol l-1
exited the leaf as 13
CO2 in B.
napus. In B. napus the percent of 13
CO2* exiting the leaf at 11.9 mmol l
-1 was significantly
higher than both 1.19 mmol l-1
(P<0.001) and 5.95 mmol l-1
(P<0.01) (Fig. 3A). The percent
13CO2
* exiting the leaf as
13CO2 for P. deltoides was ~80% across all bicarbonate concentrations
(Fig. 3B). It was significantly different between 1.19 mmol l-1
and 5.95 mmol l-1
(P<0.05) but
not between other concentrations (Fig. 3B). The percent efflux was higher overall in P. deltoides
than B. napus (P=0.001) though not for the pairwise comparison at high [CO2*] (P=0.43) (Fig.
3A, B).
The estimated retention rate of 13
CO2* by an individual leaf was similar across the higher
[13
CO2*] in B. napus (~0.05 μmol CO2 m
-2 s
-1) and was slightly lower in the lower [
13CO2
*]
(~0.02 μmol CO2 m-2
s-1
) (Fig. 3C). The estimated retention rate was significantly different
between 1.19 mmol l-1
and 5.95 mmol l-1
(P<0.05) and 11.9 mmol l-1
(P<0.01) in B. napus. The
retention rate increased between the lowest and highest [13
CO2*] for P. deltoides (~0.01 μmol
CO2 m-2
s-1
to ~0.03 μmol CO2 m-2
s-1
) (P<0.01) (Fig. 3D); however, differences between the

17
other concentrations were not significant. The retention rate differed overall between species
(P<0.001) but did not show any consistent differences with respect to [CO2*] (they are only
significantly different at 5.95 mmol l-1
(P<0.005, using pairwise comparisons).
Transpiration decreased rapidly after turning off the light. This generated a range of
transpiration rates where we could examine the relative magnitudes of 12
CRL and 13
Cefflux (Fig. 4,
5). The gross rate of 13
Cefflux was dependent on both the [13
CO2*] supplied to the xylem
(P<0.005) (Fig. 4) and transpiration rate (P<0.005) (Fig. 4, 5). In contrast gross 12
CRL was not
significantly correlated with the transpiration rate in B. napus (P=0.54) or P. deltoides (P=0.74)
(Fig. 5). Gross 12
CRL was significantly higher during the first 30 minutes of the dark period
where light enhanced dark respiration (LEDR) occurs in both B. napus and P. deltoides (Fig. 5)
(P<0.005). As expected, the LEDR response did not affect the gross 13
Cefflux in either B. napus
or P. deltoides (P<0.0001) (Fig. 5). We also found that 13
Cefflux approached ½ 12
CRL in both
species during our experiments. The rate of dark respiration when excluding LEDR was 1.26 ±
0.23 μmol CO2 m-2
s-1
and 1.33 ± 0.21 μmol CO2 m-2
s-1
in B. napus and P. deltoides,
respectively. Linear regressions (R2=0.97 for B. napus and R
2=0.93 for P. deltoides) show that
for leaves supplied with 11.9 mmol l-1
[13
CO2*], the gross efflux of xylem-transported CO2 will
equal ½Rd at a transpiration rate of 4 mmol H2O m-2
s-1
and 3.69 mmol H2O m-2
s-1
for B. napus
and P. deltoides, respectively (Fig. 5). At all [13
CO2*] for both species, gross
13Cefflux was
undetectable when transpiration was <0.1 mmol H2O m-2
s-1
.
Stem [CO2*]
In greenhouse grown plants, the average [13
CO2*] in the stem was 0.7 ± 0.2 mmol l
-1 and
2.8 ± 3.5 mmol l-1
for B. napus and P. deltoides, respectively. Stem pH in P. deltoides ranged

18
between 5.1 and 6.4, with an average of 5.9 ± 0.3 and stem pH in B. napus ranged between 5.3
and 6.1 with an average of 5.7 ± 0.3.
DISCUSSION
Magnitude of xylem derived inorganic carbon efflux
Our experimental approach allows simultaneous measurements of the gross efflux of
xylem-transported 13
CO2* (exiting leaves as
13CO2) with transpiration, as well as the efflux of
12CO2 from leaf respiration in real-time. We applied this approach to excised leaves in order to
eliminate complications from radial diffusion through stems and branches. We also focused our
data collection on the dark conditions immediately after the light was turned off, in order to
compare CO2 efflux with a wide range of transpiration rates, from typical night-time rates
through the low end of typical daytime rates. We demonstrated that transport of labeled 13
CO2*
in xylem was highest when both the [13
CO2*] (Fig. 2) and transpiration (Fig. 4) were high. The
broad range of transpiration values also allowed us to generate a robust relationship between
gross efflux of xylem-transported 13
CO2* (
13Cefflux) and transpiration that can be used to predict
13Cefflux in conditions where transpiration rate and xylem [CO2
*] are known. Considering the
very different petiole and leaf anatomies of P. deltoides and B. napus, we were surprised at how
similar this relationship was between species (Fig. 4).
When [CO2*] in stems is high (11.9 mmol l
-1) and when transpiration rates are high (>3
mmol H2O m-2
s-1
) our estimates indicate the gross efflux of xylem-transported CO2* approaches
half the rate of leaf respiration (Fig. 5). Therefore, this efflux could account for some of the
variation observed in measurements of leaf respiration in the light. Measurements of stem
[CO2*] in field grown P. deltoides have been reported to range from the low end between 2.8-9.5

19
mmol l-1
(Saveyn et al., 2008) to the high end between 20 and 35 mmol l-1
(Aubrey and Teskey,
2009) while reported transpiration rates in P. deltoides ranged from 3.4 mmol H2O m-2
s-1
(Bassman and Zwier, 1991) to 4.5 mmol H2O m-2
s-1
(Barron-Gafford et al., 2007), indicating our
selection of [13
CO2*] were within the range of available data for P. deltoides. However, it should
be noted that measurements of [13
CO2*] in P. deltoides are on the high end of reported tree values
(Teskey et al. 2008).
However, most leaves are attached to small branches on trees or to the relatively small
stems and branches of herbaceous plants, where [13
CO2*] has not been well characterized.
Models of [CO2*] distribution throughout trees predict it increasing with distance from the
ground since CO2 is generated at higher rates than it diffuses out of a tree or shrub (Hölttä and
Kolari, 2009). These predictions were supported by measurements in Quercus pyrenaica
(Salomon et al., 2016a). Hölttä and Kolari (2009) also modeled that [CO2*] declines as the stem
tapers towards the top of the tree and may only end up around 5% of the basal [CO2*] at the leaf
level. Surprisingly, no study has measured [CO2*] in the main stem near tree bases
simultaneously with terminal branch data in order to validate these model predictions.
Furthermore, there is almost no information on xylem [CO2*] in small tree branches or
herbaceous plants. One study did find that terminal branch measurements of xylem [CO2*] in
large P. deltoides trees were between 0.5 mmol l-1
and 0.9 mmol l-1
when growing in well
drained soils and up to 9.4 mmol l-1
in water logged soils (Stringer and Kimmerer, 1993). Our
small potted plants grown in a greenhouse contained 0.7 ± 0.2 mmol l-1
and 2.8 ± 3.5 mmol l-1
[CO2*] for B. napus and P. deltoides, respectively. This is on the low end of our experimental
design and may be a reasonable value for similarly sized plants in the field. However, terminal
branches of mature trees would also contain high [CO2*] transported from respiration of larger

20
branches, stem, and even roots. Modeling the effect from the rest of the tree is not currently
possible because there is very little data on long-term (diurnal and seasonal) variation in stem
[CO2*] in mature trees, and what data do exist show high variability (Etzold et al., 2013;
Salomón et al., 2016b). Therefore, using our approach to calculate gross efflux rates of the
xylem transported [CO2*] arriving at a leaf would also require measurement of the [CO2
*] in the
branches near the leaf as well as the rate of transpiration.
Retention of xylem-transported CO2 in darkened leaves
At high [13
CO2*], the percentage of xylem-transported
13CO2
* exiting the leaf was fairly
high for both species (Fig. 3), and near the 83% Stringer and Kimmerer (1993) observed when
they supplied 1 mmol l-1
14
CO2* to P. deltoides leaves. However, at lower [
13CO2
*] the percent
exiting the leaf was reduced in B. napus (P=0.001). As these results show, all 13
CO2* entering
the leaf did not exit as 13
CO2 during our measurements even though leaves were darkened during
labeling. Therefore, we used a mass balance approach to determine the rate of retention of
13CO2
* supplied to the leaf to facilitate comparison with other fluxes. Interestingly, the retention
rate only gradually increases with higher supplied [13
CO2*] (Fig. 3C, D). We hypothesize that
this retention represents the rate that anaplerotic reactions consumed the supplied 13
CO2*. Our
estimated rate of retention by anaplerotic reactions for P. deltoides (0.003 μmol m-2
s-1
) at 1.19
mmol l-1
[13
CO2*] is similar to the rate (0.002 μmol m
-2 s
-1) calculated from data in Stringer and
Kimmerer (1993) for leaves supplied with 1 mmol l-1
[14
CO2*]. However, our estimated rate of
anaplerotic reactions is only about 1% the rate of phosphoenolpyruvate carboxylase (PEPC)
activity in previously published studies with P. deltoides plants exposed to ozone or varying light
treatments (Loreto et al., 2007).

21
We also calculated a significantly higher overall apparent rate of retention in B. napus
than in P. deltoides (P<0.001), though not for pairwise comparisons (Fig. 3). It is possible that
the thick, green petioles and the blade of the B. napus leaf have slightly higher rates of
anaplerotic respiration, and the B. napus petioles have a little higher radial efflux of CO2 than the
thin, waxy petiole of P. deltoides. Measuring how much of the retained 13
C is acid stable, which
parts of the leaf have label, and what compounds are labeled will be necessary to fully determine
the fate of xylem-transported CO2*. If petiole efflux of
13CO2 is large, we would expect that the
percent 13
CO2 exiting the leaf would decrease with increasing [13
CO2*] due to a higher
concentration gradient between the petiole and the atmosphere; however, the percent 13
CO2
exiting the leaf does not show consistent patterns with [13
CO2*] supplied to the leaf.
Implications for understanding leaf and stem carbon fluxes
Leaf efflux of xylem-transported CO2* is controlled by the rate of transpiration and the
xylem [CO2*] (Fig. 4), but this is not accounted for when characterizing leaf respiration. We
believe a significant amount of the uncertainty in plant respiration could be due to limited efforts
to quantify the effects of xylem-transported CO2*. There is potential for further characterization
to improve our understanding of a wide range of leaf-level processes that have been hard to
quantify such as: gross photosynthesis, the extent to which day respiration is down regulated in
the light (Atkin et al., 2000; Hurry et al., 2005; Ayub et al., 2011), the response of respiration to
stressors (e.g. drought) (Ayub et al., 2011; Rowland et al., 2015), the acclimation to
environmental conditions (e.g. temperature) (Vanderwel et al., 2015), night respiration for
species whose night-time transpiration is high and/or variable (Snyder et al., 2003; Resco de
Dios et al. 2015), variation in the acclimation rates of respiration and photosynthesis to
22
temperature between plant functional types (Campbell et al., 2007), the amount of CO2 recycling
in leaves (including the potential recycling of xylem-transported CO2*) (Busch et al., 2013), the
diffusion of CO2 in leaves (Evans and von Caemmerer, 2013), and the activity of alternative
decarboxylations associated with photorespiration (Cousins et al., 2008; Cousins et al., 2011).
Essentially, any measurement of leaf respiration that induces or includes changes in
transpiration is susceptible to this error for species where xylem [CO2*] is high (Fig. 1). For
example, the efflux of xylem-transported CO2* may interfere with methods for measuring day
respiration in leaves. The two most common methods require varying photosynthesis at low
light or low [CO2] (Kok, 1949; Laisk, 1977). These measurements are time consuming and
require highly accurate measurements of small fluxes that would be compromised if transpiration
varies during the measurement (e.g. due to light or CO2 affecting stomatal aperture).
Measurements of leaf photosynthesis are also directly affected since some of the xylem-
transported CO2* is recycled by leaves (Stringer and Kimmerer, 1993; McGuire and Teskey,
2002; Bloemen et al., 2013a, b; Bloemen et al., 2015b) and model assumptions would be
violated if some escaped the leaf without passing through chloroplasts (von Caemmerer, 2013).
In addition, any changes in root, stem, or branch respiration occurring during the
measurement of small leaf fluxes would cause errors in leaf respiration when transpiration is
sufficient. There are significant uncertainties surrounding the efflux of CO2 from stems as well
as the rate of anaplerotic reactions, and the effects of both on the measurement of stem
respiration (Teskey et al., 2008; Bloemen et al., 2015a). These uncertainties include diurnal
variation in stem and root respiration, which is well documented but poorly understood, showing
some linkage to diurnal patterns of carbon supply from shoots as well as other drivers (Bloemen
et al., 2015b; Snell et al., 2015; Steppe et al., 2015). Our method of adding labeled bicarbonate

23
to leaves could be applied to stems to improve estimates of the gross efflux of CO2 and the rates
of gross stem photosynthesis in real-time by helping to partition the rates of radial efflux through
the stem relative to the vertical transport of CO2* away from the site of respiration.
What would it take for this flux to be significant globally?
Although we have point data on stem [CO2*] for over two dozen tree species (Teskey et
al., 2008) we still need more data on the relationship between stem and branch tip [CO2*] as well
as their diurnal and seasonal patterns before we can make a solid prediction of what the
contribution is from the ~3 trillion trees on Earth (Crowther et al., 2015). However, if [CO2*]
averages near 1 mmol l-1
(a common value on the low end reported for tree stems – see Teskey et
al., 2008) at the point where petioles attach to the stem or branch, and if average transpiration
rates are around 0.5 mmol H2O m-2
s-1
(much closer to night-time than daytime rates, though see
Rescos de Dios et al. 2015 for regulation of night-time transpiration), then our data (Fig. 2) and
those from Stringer and Kimmerer (1993) predict the efflux to be just over 1.5% of respiration.
At the global scale, an error in respiration this size would account for a large portion of the error
in global carbon cycle models (Hanson et al., 2016).
CONCLUSIONS
Using our novel online TDL gas exchange method paired with 13
CO2* labeling, we found that
when xylem [CO2*] and transpiration are high, the efflux of xylem-transported CO2
* could cause
large errors in observed leaf respiration. This would be most likely in the daytime when stomata
are open, complicating the measurement of day respiration. We observed a fairly similar efflux
of xylem-transported CO2* from P. deltoides and B. napus leaves, which suggests the effect of

24
leaf and petiole morphology on the efflux is modest. However, data from many more species
that include the diurnal and seasonal patterns of xylem [CO2*] in branch tips (where leaves
attach) are needed to ascertain how often xylem-transported CO2* interferes with measurements
of leaf respiration or estimations of regional or global carbon fluxes. Future work with this
approach will allow examination of the dynamics of the rate of xylem [CO2*] transport, radial
efflux, and internal re-fixation by stem, branches, and leaves relative to rates of respiration and
photosynthesis occurring in each organ.
ACKNOWLEDGEMENTS
Joy Avritt and Lindsey Kaufman for greenhouse and plant maintenance. Lynn Beene and three
anonymous reviewers for helpful comments on previous drafts. This research was supported in
part by instrumentation obtained (TDL) through NSF funding (IOS 0719118) and the United
States National Institutes of Health NIH-NCRR P20RR18754 (controlled environment chamber).
Additional support was provided by the University of New Mexico and the NSF EPSCoR
Program under Award #IIA-1301346 (New Mexico). Any opinions, finding, and conclusions or
recommendations expressed in this material are those of the author(s) and do not necessarily
reflect the views of the National Science Foundation or the US NIH. Source for the B. napus
seeds (J. Chris Pires, University of Missouri-Columbia).
REFERENCES
Atkin OK, Atkinson LJ, Fisher RA, Campbell CD, Zaragoza-Castells J, Pitchford JW,
Woodward FI, Hurry V. 2008. Using temperature-dependent changes in leaf scaling
relationships to quantitatively account for thermal acclimation of respiration in a coupled global
climate-vegetation model. Global Change Biology 14, 2709-2726.

25
Atkin OK, Bloomfield KJ, Reich PB, Tjoelker MG, Asner GP, Bonal D, Bönisch G,
Bradford MG, Cernusak LA, Cosio EG, et al. 2015. Global variability in leaf respiration in
relation to climate, plant functional types and leaf traits. New Phytologist 206, 614-636.
Atkin OK, Edwards EJ, Loveys BR. 2000. Response of root respiration to changes in
temperature and its relevance to global warming. New Phytologist 147, 141-154.
Atkin OK, Meir P, Turnbull MH. 2014. Improving representation of leaf respiration in
largescale predictive climate-vegetation models. New Phytologist 202, 743-748.
Atkin OK, Scheurwater I, Pons TL. 2007. Respiration as a percentage of daily photosynthesis
in whole plants is homeostatic at moderate, but not high, growth temperatures. New Phytologist
174, 367-380.
Aubrey DP, Teskey RO. 2009. Root-derived CO2 efflux via xylem stream rivals soil CO2
efflux. New Phytologist 184, 35-40.
Ayub G, Smith RA, Tissue DT, Atkin OK. 2011. Impacts of drought on leaf respiration in
darkness and light in Eucalyptus saligna exposed to industrial-age atmospheric CO2 and growth
temperature. New Phytologist 190, 1003-1018.
Barbour MM, McDowell NG, Tcherkez G, Bickford CP, Hanson DT. 2007. A new
measurement technique reveals rapid post-illumination changes in the carbon isotope
composition of leaf-respired CO2. Plant, Cell & Environment 30, 469-482.
Barron-Gafford GA, Griever KA, Murthy R. 2007. Leaf- and stand-level responses of a
forested mesocosm to independent manipulations of temperature and vapor pressure deficit. New
Phytologist 174, 614-625.
Bassman JH, Zwier JC. 1991. Gas exchange characteristics of Populus trichocarpa, Populus
deltoides and Populus trichocarpa x P. deltoides clones. Tree Physiology 8, 145-159.
Bloemen J, Bauweraerts I, De Vos F, Vanhove C, Vanderberghe S, Boeckx P, Steppe K.
2015a. Fate of xylem-transported 11
C- and 13
C-labeled CO2 in leaves of poplar. Physiologia
Plantarum 153, 555-564.
Bloemen JB, McGuire MA, Aubrey DP, Teskey RO, Steppe K. 2013a. Assimilation of
xylem-transported CO2 is dependent on transpiration rate but is small relative to atmospheric
fixation. Journal of Experimental Botany 64, 2129-2138.
Bloemen JB, McGuire MA, Aubrey DP, Teskey RO, Steppe K. 2013b. Transport of
rootrespired CO2 via the transpiration stream affects aboveground carbon assimilation and CO2
efflux in trees. New Phytologist 197, 555-565.
26
Bloemen J, Teskey RO, McGuire MA, Aubrey DP, Steppe K. 2015b. Root xylem CO2 flux:
an important but unaccounted-for component of root respiration. Trees DOI 10.1007/s00468-
015-1185-4.
Bodman RW, Rayner PJ, Karoly DJ. 2013. Uncertainty in temperature projections reduced
using carbon cycle and climate observations. Nature Climate Change 3, 725-729.
Busch FA, Sage TL, Cousins AB, Sage RF. 2013. C3 plants enhance rates of photosynthesis by
reassimilating photorespired and respired CO2. Plant Cell and Environment 36, 200-212.
von Caemmerer 2013. Steady-state models of photosynthesis. Plant, Cell & Environment 36,
1617-1630.
Campbell C, Atkinson L, Zaragoza-Castells J, Lundmark M, Atkin O, Hurry V. 2007.
Acclimation of photosynthesis and respiration is asynchronous in response to changes in
temperature regardless of plant functional group. New Phytologist 176, 375-389.
Candell JG, Le Quere C, Raupach MR, Field CB, Buitenhuis ET, Ciais P, Conway TJ,
Gillett NP, Houghton RA, Marland G. 2007. Contributions to accelerating atmospheric CO2
growth from economic activity, carbon intensity, and efficiency of natural sinks. Proceedings of
the National Academy of Sciences 104, 18866-18870.
Cousins AB, Pracharoenwattana I, Zhou W, Smith SM, Badger MR. 2008. Peroxisomal
malate dehydrogenase is not essential for photorespiration in Arabidopsis but its absence causes
an increase in the stoichiometry of photorespiratory CO2 release. Plant Physiology 148, 786-
795.
Cousins AB, Walker BJ, Pracharoenwattana I, Smith SM, Badger MR. 2011. Peroxisomal
hydroxypyruvate reductase is not essential for photorespiration in Arabidopsis but its absence
causes an increase in the stoichiometry of photorespiratory CO2 release. Photosynthesis
Research 108, 91-100.
Crowther TW, Glick HB, Covey KR, Bettigole C, Maynard DS, Thomas SM, Smith JR,
Hintler G, Duguid MC, Amatulli G. 2015. Mapping tree density at a global scale. Nature 525,
201-205.
Erhardt EB, Hanson, DT. 2013. tdllicor: TDL/Licor processing. R package version 0.1-22.
Etzold S, Zweifel R, Ruehr NK, Eugster W, Buchmann N. 2013. Long-term stem CO2
concentration measurements in Norway spruce in relation to biotic and abiotic factors. New
Phytologist 197, 1173–1184.
Evans JR von Caemmerer S. 2013. Temperature response of carbon isotope discrimination
and mesophyll conductance in tobacco. Plant, Cell & Environment 36, 200-212.
Farquhar G, von Caemmerer S, Berry JA. 1980. A biochemical model of photosynthetic CO2
assimilation in leaves of C3 species. Planta 149, 78–90.

27
Griffis T, Baker J, Sargent S, Tanner B, Zhang J. 2004. Measuring field-scale isotopic fluxes
with tunable diode laser absorption spectroscopy and micrometeorological techniques.
Agricultural and Forest Meteorology 124, 15–29.
Hanson DT, Stutz SS, Boyer JS. 2016. Why small fluxes matter: the case and approaches for
improving measurements of photosynthesis and (photo)respiration. Journal of Experimental
Botany 67, 3027-3039.
Hölttä T, Kolari, P. 2009. Interpretation of stem CO2 efflux measurements. Tree Physiology
29, 1447-1456.
Hurry V, Igamberdiev AU, Keerberg O, Parnik T, Atkin OK, Zaragoza-Castells J,
Gardestrom P. 2005. Respiration in photosynthetic cells: gas exchange components,
interactions with photorespiration and the operation of mitochondria in the light. In Lambers H,
Ribas-Carbo M, eds. Plant Respiration: From Cell to Ecosystem. Dordrecht, The Netherlands:
Springer 43-61.
King AW, Gunderson CA, Post WM, Weston DJ, Wullschleger SD. 2006. Plant respiration
in a warmer world. Science 536, 2005-2007.
Kok B. 1949. On the interrelation of respiration and photosynthesis in green plants. Biochimica
et Biophysica Acta 3, 625-631.
Kuzyakon Y. 2006. Sources of CO2 efflux from soil and review of partitioning methods. Soil
Biology & Biochemistry 38, 425-448.
Laisk AK. 1977. Kinetics of photosynthesis and photorespiration in C3 plants. Nauka,
Moscow, Russia.
Levy PE, Meir P, Allen SJ, Jarvis PG. 1999. The effect of aqueous transport of CO2 in xylem
sap on gas exchange in woody plants. Tree Physiology 19, 53-58.
Loreto F, Centritto M, Barta C, Calfapietra C, Fares S, Monson RK. 2007. The relationship
between isoprene emission rate and dark respiration rate in white poplar (Populus alba L.)
leaves. Plant, Cell & Environment 30, 662-669.
McGuire MA, Marshall JD, Teskey RO. 2009. Assimilation of xylem-transported 13
C-
labelled CO2 in leaves and branches of sycamore (Platanus occidentalis L.). Journal of
Experimental Botany 60, 3809-3817.
McGuire MA, Teskey RO. 2002. Microelectrode technique for in situ measurement of carbon
dioxide concentrations in xylem sap of trees. Tree Physiology 22, 807-811.
R Core Development Team. 2012. R: A Language and Environment for Statistical Computing.
R Foundation for Statistical Computing, Vienna, Austria. ISBN 3-900051-07-0. Available at:
http://www.R-project.org (accessed 19 August 2012).

28
Reich PB. 2010. The carbon dioxide exchange. Science 329, 774-776.
Resco de Dios V, Roy J, Ferrio JP, Alday JG, Landais D, Milcu A, Gessler A. 2015. Processes driving nocturnal transpiration and implications for estimating land evapotranspiration.
Scientific Reports, 5:10975.
Rowland L, Lobo-do-Vale RL, Cristoffersen BO, Melem EA, Kruijt B, Vasconcelos SS,
Domingues T, Binks OJ, Oliveira AAR, Metcalfe D, et al. 2015. After more than a decade of
soil moisture deficit, tropical rainforest trees maintain photosynthetic capacity, despite increased
leaf respiration. Global Change Biology 21, 4462-4672.
Salomón R, Valbuena-Carabaña M, Gil L, McGuire, MA, Teskey RO, Aubrey DP,
González-Doncel I, Rodríguez-Calcerrada J. 2016a. Temporal and spatial patterns of internal
and external stem CO2 fluxes in a sub-Mediterranean oak. Tree Physiology 36, 1409-1421.
Salomón R, Valbuena-Carabaña M, Teskey R, McGuire MA, Aubrey D, González-Doncel
I, Gil L, Rodríguez-Calcerrada J. 2016b. Seasonal and diel variation in xylem CO2
concentration and sap pH in sub-Mediterranean oak stems. Journal of Experimental Botany 67,
2817–2827.
Saveyn A, Steppe K, McGuire M, Lemeur R, Teskey RO. 2008. Stem respiration and carbon
dioxide efflux of young Populus deltoides trees in relation to temperature and xylem carbon
dioxide concentration. Oecologia 154, 637-649.
Snell HSK, Robinson D, Midwood AJ. 2015. Sampling root-respired CO2 in-situ for 13
C
measurement. Plant and Soil 393, 259-271.
Snyder KA, Richards JH, Donovan LA. 2003. Night-time conductance in C3 and C4 species:
do plants lose water at night? Journal of Experimental Botany 54, 861-865.
Steppe K, Sterck F, Deslauriers A. 2015. Diel growth dynamics in tree stems: linking anatomy
and ecophysiology. Trends in Plant Science 20, 335-343.
Stringer JW, Kimmerer TW. 1993. Refixation of xylem sap CO2 in Populus deltoides.
Physiologia Plantarum 89, 243-251.
Tcherkez G, Mahe A, Gauthier P, Mauve C, Gout E, Bligny R, Comic G, Hodges M. 2009.
In folio respiratory fluxomics revealed by 13
C isotope labeling and H/D isotope effects highlight
the noncyclic nature of the tricarboxylic acid “cycle” in illuminated leaves. Plant Physiology
151, 620-630.
Teskey RO, Saveyn A, Steppe K, McGuire MA. 2008. Origin, fate and significance of CO2 in
tree stems. New Phytologist 117, 17-32.

29
Vanderwel MC, Slot M, Lichstein JW, Reich PB, Kattge J, Atkin OK, Bloomfield KJ,
Tjoelker MG, Kitajima K. 2015. Global convergence in leaf respiration from estimates of
thermal acclimation across time and space. New Phytologist 117, 17-32.
Way DA, Holly C, Bruhn D, Ball MC, Atkin OK. 2015. Diurnal and seasonal variation in
light and dark respiration in field-grown Eucalyputs pauciflora. Tree Physiology 35, 840-849.
Wullschleger SD, Warren JM, Thornton PE. 2015. Commentary leaf respiration
(GlobResp)-global trait database supports Earth System Models. New Phytologist 206, 483-485.
Wythers KR, Reich PB, Bradford JB. 2013. Incorporating temperature-sensitive Q10 and
foliar respiration acclimation algorithms modifies modeled ecosystem responses to global
change. Journal of Geophysical Research: Biogeosciences 118, 77-90.

30
FIGURES
Fig. 1 Conceptual illustration of relative fluxes for respiration, transpiration, and transported CO2
between day and night. Respiration in the root (Rroot) causes high concentrations of CO2 to
accumulate in the roots and stem (large black oval) relative to the surroundings while the
accumulation should be much lower in smaller roots (small black circle) due to lower resistance
to efflux. Some CO2 from Rroot effluxes into the surrounding soil, joining the pool of soil
respired CO2 (Rsoil). In small roots, some CO2 from Rsoil could enter the root if the root CO2
concentration is lower than the soil concentration. A large fraction of the CO2 from Rroot is
transported up the stem in the transpiration stream (blue lines). During the day, transpiration is
large (Eday) and carries a large amount of xylem dissolved CO2 to the leaf that can efflux into the
atmosphere (xylem CO2 day) if not captured by photosynthesis. Respiration of leaf cells (green
lines) in the day (Rday) is thought to be much smaller than in the night (Rnight). However, in the
night transpiration (Enight) is much smaller than Eday so the efflux of xylem dissolved CO2 (xylem
CO2 night) should be proportionately smaller than xylem CO2 day.
Fig. 2 Response of gross 13
Cefflux and 12
CRL in B. napus (closed triangle) and P. deltoides (open
triangle) at a transpiration rate of 0.5 mmol H2O m-2
s-1
for each [13
CO2*]. (A) response of gross
13Cefflux to [
13CO2
*], R
2 of 0.91 and 0.67 in B. napus and P. deltoides, respectively, (B)
simultaneous response of 12
CRL to [13
CO2*], R
2 of <0.01 and 0.02 in B. napus and P. deltoides,
respectively. Measurements were made on cut leaves of B. napus and P. deltoides placed in one
of the three 13
CO2* solutions. Measurements represent averages and standard deviation of four
replicates at each [13
CO2*].

31
Fig. 3 The percentage of gross 13
CO2* exiting the leaf in the transpiration stream in (A) B.
napus and (B) P. deltoides across three different [13
CO2*]. Estimated rate of anaplerotic
reactions (i.e., retention of 13
C in the dark) in (C) B. napus and (D) P. deltoides across three
different [13
CO2*]. Measurements represent averages and standard deviation of four replicates.
Fig. 4 Transpiration dependence of gross 13
Cefflux for three [13
CO2*] measured with the TDL. (A)
B. napus and (B) P. deltoides. In both panels grey circles represent 1.19 mmol l-1
[13
CO2*] (B.
napus y= 0.008x + 0.001, R2=0.68; P. deltoides y=0.02x +0.01, R
2=0.98), closed circles are 5.95
mmol l-1
[13
CO2*] (B. napus y= 0.07x – 0.01, R
2=0.82; P. deltoides y= 0.09x + 0.02, R
2=0.98),
and open circles are 11.9 mmol l-1
[13
CO2*] (B. napus y=0.15x + 0.02, R
2 =0.97; P. deltoides y=
0.18x +0.00, R2=0.93). Measurements were made on excised leaves of B. napus and P. deltoides
placed in one of the three [13
CO2*] solutions. Measurements represent averages and standard
deviation of four replicates. Transpiration was averaged over 0.1 mmol H2O m-2
s-1
increments.
Fig. 5 Comparison of leaf respiration (12
CRL – closed squares) and gross 13
Cefflux (open circles)
(A) B. napus and (B) P. deltoides leaves fed with 11.9 mmol l-1
13
CO2*.
12LEDR (grey squares)
and 13
LEDR (grey circles) represent the light enhanced dark respiration rate (the first 30 minutes
after the light was turned off). The dotted line represents ½ steady leaf respiration, observed in
(Fig. 2) of 0.63 μmol ± 0.12 CO2 m-2
s-1
and 0.67 ± 0.11 μmol CO2 m-2
s-1
in B. napus and P.
deltoides, respectively. Measurements represent averages and standard deviation of four
replicates. Transpiration was averaged over 0.1 mmol H2O m-2
s-1
increments.

32
Figure 1

33
Figure 2
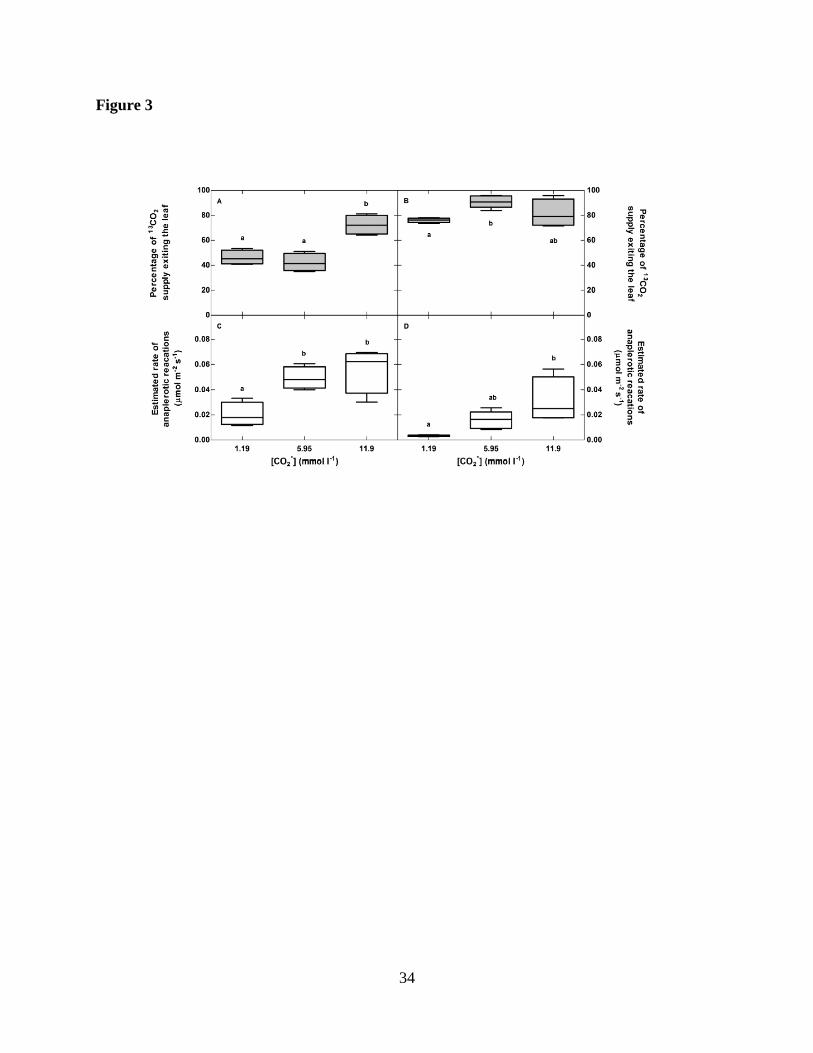
34
Figure 3

35
Figure 4

36
Figure 5

37
Chapter 3
Contribution and consequences of xylem-transported CO2 assimilation for C3
plants
Samantha S. Stutz1
1University of New Mexico, Department of Biology, MSC03-2020, Albuquerque,
NM 87131, USA

38
Summary
Traditionally plants were thought to only use CO2 derived from the atmosphere for
photosynthesis; however, recent studies show that high concentrations of inorganic
carbon dissolved in xylem water moves in bulk flow through a plant to the leaf where it is
either used for photosynthesis or exits as CO2 with the transpiration stream. However,
the rate of assimilation and efflux of xylem-transported CO2 out of leaves in the light are
not known.
Cut leaves of Populus deltoides and Brassica napus were placed in either a KCl solution
or one of three [NaH13
CO3] solutions dissolved in water; simultaneously the efflux of
xylem-transported CO2 exiting the leaf across light- and CO2-response curves were
measured in real-time using a tunable diode laser absorption spectroscope.
Rates of assimilation and efflux of xylem-transported CO2 increased with increasing
xylem [13
CO2*]. Both the rate of assimilation and the efflux were highest when rates of
transport were highest. Under saturating irradiance, rates of xylem-transported CO2
assimilation accounted for ~2.5% of the total assimilation in both species in the highest
[13
CO2*] treatment.
It is unlikely that xylem-transported CO2 changes current leaf-level models of
photosynthesis; however, over the life of a plant, xylem-transported CO2 assimilation
may contribute greatly to carbon gain and allow plants to photosynthesize with lower
stomatal conductance.

39
Key words: Brassica napus, CO2 efflux, internally transported CO2, leaf photosynthesis models,
leaf respiration, Populus deltoides, stem [CO2*], tunable diode laser absorption spectroscopy,
xylem-transported CO2
INTRODUCTION
Traditionally, aside from mitochondrial respiration in the same cell, CO2 for
photosynthesis was assumed to diffuse from the atmosphere through the stomata into the
intercellular air space. This CO2 then diffuses into the mesophyll cells eventually making it to
the site of ribulose-1,5-bisphosphate-carboxylase/oxygenase (Rubisco) where it will be used for
photosynthesis. However, recent work has shown that the concentration of total dissolved
inorganic carbon ([CO2*], the sum of [CO2]aq, [HCO3
-], [H2CO3], and [CO3
2-]) in the xylem
ranges from ~0.05 to ~13 mmol l-1
(<1 to 26% CO2 gas by volume in air equilibrated with xylem
sap). These, levels are ~30-750 times higher than current atmospheric [CO2] (Teskey et al.,
2008). Dissolved CO2 in the stem is derived from root and stem respiration and moves in bulk
flow along with water through the plant to the leaf where it is either recaptured or exits via
transpiration (Fig. 1). If the concentration of xylem-transported CO2 is high and reaches the
foliage it could provide a major substrate for Rubisco in leaf cells; it also has the potential to
change the intercellular CO2 (Ci) of a leaf, thus changing the current understanding of the
Farquhar et al. (1980) model of leaf photosynthesis (Hanson & Gunderson, 2009). However, if
little xylem-transported CO2 is recaptured by photosynthesis, xylem-transported CO2 exiting the
leaf in the light may account for some of the variation seen in estimates of respiration in the
light.
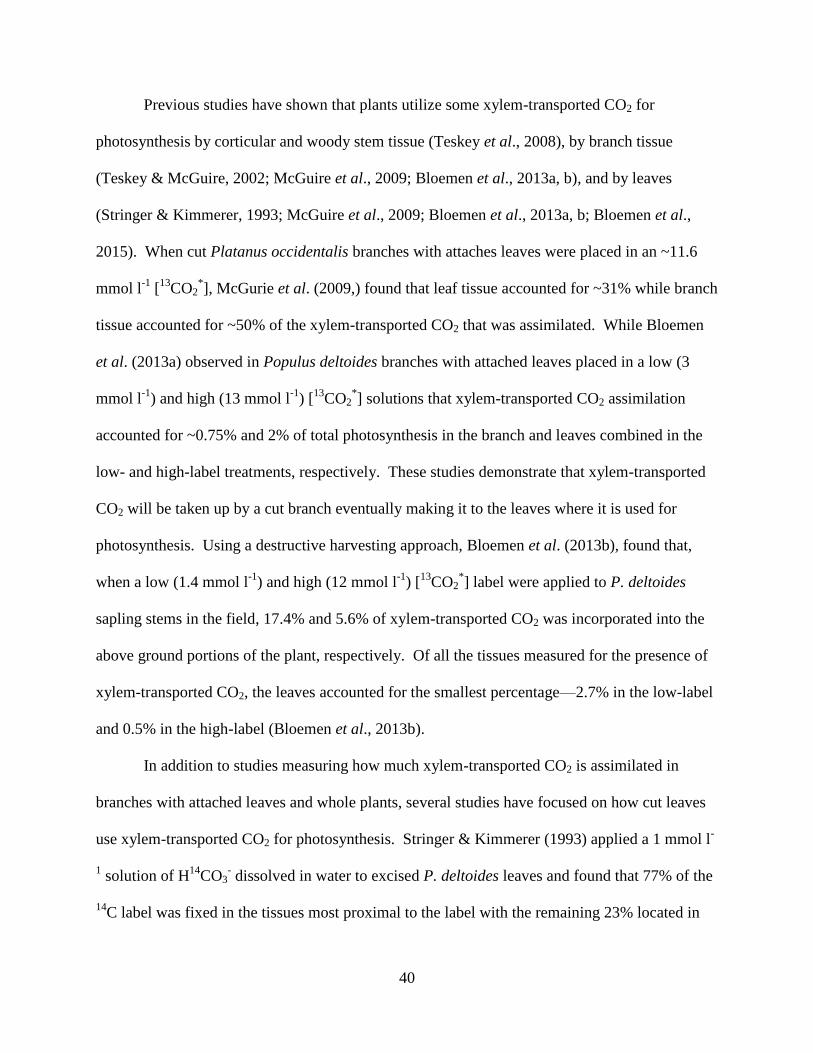
40
Previous studies have shown that plants utilize some xylem-transported CO2 for
photosynthesis by corticular and woody stem tissue (Teskey et al., 2008), by branch tissue
(Teskey & McGuire, 2002; McGuire et al., 2009; Bloemen et al., 2013a, b), and by leaves
(Stringer & Kimmerer, 1993; McGuire et al., 2009; Bloemen et al., 2013a, b; Bloemen et al.,
2015). When cut Platanus occidentalis branches with attaches leaves were placed in an ~11.6
mmol l-1
[13
CO2*], McGurie et al. (2009,) found that leaf tissue accounted for ~31% while branch
tissue accounted for ~50% of the xylem-transported CO2 that was assimilated. While Bloemen
et al. (2013a) observed in Populus deltoides branches with attached leaves placed in a low (3
mmol l-1
) and high (13 mmol l-1
) [13
CO2*] solutions that xylem-transported CO2 assimilation
accounted for ~0.75% and 2% of total photosynthesis in the branch and leaves combined in the
low- and high-label treatments, respectively. These studies demonstrate that xylem-transported
CO2 will be taken up by a cut branch eventually making it to the leaves where it is used for
photosynthesis. Using a destructive harvesting approach, Bloemen et al. (2013b), found that,
when a low (1.4 mmol l-1
) and high (12 mmol l-1
) [13
CO2*] label were applied to P. deltoides
sapling stems in the field, 17.4% and 5.6% of xylem-transported CO2 was incorporated into the
above ground portions of the plant, respectively. Of all the tissues measured for the presence of
xylem-transported CO2, the leaves accounted for the smallest percentage—2.7% in the low-label
and 0.5% in the high-label (Bloemen et al., 2013b).
In addition to studies measuring how much xylem-transported CO2 is assimilated in
branches with attached leaves and whole plants, several studies have focused on how cut leaves
use xylem-transported CO2 for photosynthesis. Stringer & Kimmerer (1993) applied a 1 mmol l-
1 solution of H
14CO3
- dissolved in water to excised P. deltoides leaves and found that 77% of the
14C label was fixed in the tissues most proximal to the label with the remaining 23% located in

41
the minor veins and mesophyll cells. Bloemen et al. (2015) placed cut leaves in different
[13
CO2*] and found rates of assimilation using xylem-transported CO2 were highest when the
vapor pressure difference was highest and under the high-label treatment. Similar to Stringer &
Kimmerer (1993), Bloemen et al. (2015), found that most of the xylem-transported CO2 used for
photosynthesis was found in the petiole and the proximal primary veins with decreasing amounts
found in the more distal primary and secondary veins.
Presumably, if xylem-transported CO2 is not used for photosynthesis, it will exit the leaf
in the light. If this flux is large it may account for some of the variation observed in rates of day
respiration. Current models of leaf photosynthesis incorporate CO2 evolution from the
mitochondria in the light not associated with photorespiration (Rd) (Farquhar et al., 1980);
additionally, models assume that all fluxes of CO2 exiting a leaf are derived from metabolism
occurring in leaf cells. While it is known that rates of respiration are lower in the light compared
to the dark (Kok, 1948, 1949; Tcherkez et al., 2017a), it is difficult to measure rates of
respiration in the light while leaves are photosynthesizing. This inhibition of leaf respiration in
the light is thought to be due to reductions in the TCA cycle (von Caemmerer, 2000; Tcherkez et
al., 2009). One explanation for the variation in the inhibition of leaf respiration in the light
maybe an efflux of xylem-transported CO2 exiting a leaf. For instance, when rates of
assimilation are low, as occurs under low irradiance or low CO2, the overall proportion of day
respiration is greater than under high irradiance and high CO2 (Tcherkez et al., 2017b). If the
efflux of xylem-transported CO2 out of a leaf is large when irradiance or [CO2] are low this
efflux may change our current understanding of respiration in the light. Additionally, if the
efflux of xylem-transported CO2 out of the leaf is high when irradiance is low, this efflux may
account for a portion of the Kok effect (Kok, 1949). Stringer & Kimmerer (1993) estimated that

42
less than 1% of xylem-transported CO2 exited cut leaves in the light but found under low
irradiance that a higher percentage of xylem-transported CO2 exited the leaf compared to under
high irradiance. Bloemen et al. (2015) found that xylem-transported CO2 could exit labeled
leaves in the light and then diffuse through the stomata of unlabeled leaves and be used for
photosynthesis. However, neither of these studies had ways to estimate the dynamics of the
efflux xylem-transported CO2 exiting a leaf in the light.
While previous studies have used radio carbon or mass spectroscopy to determine how
much labeled xylem-transported CO2 is used for photosynthesis, these destructive techniques
allow only a snapshot at a discrete point in time and do not allow for real-time measurements of
rates of xylem-transported CO2 assimilation or the efflux of xylem-transported CO2 out of a leaf.
Therefore, the goals of this study are to: 1) determine how much and under what conditions
xylem-transported CO2 is most important for leaf photosynthesis in excised leaves and if these
fluxes change the modeling parameter for leaf-level photosynthesis, and 2) determine how much
xylem-transported CO2 (13
Clight efflux) exits a leaf in the light and if 13
Clight efflux has the potential to
change estimates of day respiration in excised leaves of a woody and herbaceous C3 plant, P.
deltoides and Brassica napus, respectively. These objectives were accomplished by adding one
of three [NaH13
CO3] solutions to cut leaves of P. deltoides and B. napus and measuring rates of
12C and
13C assimilation and the efflux of xylem-transported CO2 exiting the leaf across light-
and CO2-response curves in real-time using a tunable diode laser absorption spectroscope (TDL).
We hypothesized that rates of assimilation using xylem-transported CO2 would be greatest when
intercellular [CO2] were low and that the 13
Clight efflux would be highest when rates of transpiration
were high.

43
MATERIALS & METHODS
Plant propagation and growth
Brassica napus (L. stellar DH GT060615) and Populus deltoides (W. Bartram ex
Marshall) were propagated according to Stutz et al. (2017). All plants were grown under natural
light in an unshaded greenhouse, with mid-day photosynthetically active radiation (PAR) at pot
level of approximately 1200 mol m-2
s-1
at the University of New Mexico in Albuquerque, NM,
USA, under ambient CO2, 24ºC/21ºC day/night.
Light-response curves
A LI-6400 (LI-COR Biosciences, Lincoln, NE, USA) was coupled to a tunable diode
laser absorption spectroscope (TDL—model TGA 100; Campbell Scientific, Inc., Logan, UT,
USA) to measure online 12
CO2 and 13
CO2 exchange. Isotope calibration consisting of a high and
low CO2 tank spanning the expected range of [CO2] of each isotopologue for the LI-COR
reference and sample was completed as previously described in Barbour et al. (2007) and Stutz
et al. (2017). The TDL cycled among calibrations of the high and low CO2 tank along with the
LI-COR reference and sample line measuring for one minute at each site. However, only the last
10 seconds of data were used for calculations via the TDL LI-COR processing package (Erhardt
& Hanson, 2013) in R (R Core Development Team, 2011). The highest fully expanded leaf for
B. napus or a fully expanded P. deltoides leaf was placed in a clear topped, custom leaf chamber
38.5 cm2 made to fit an RGB LED light source (LI-COR Biosciences, Lincoln, NE, USA)
attached to a LI-6400 at 23ºC (leaf temperature), 380 mol mol-1
CO2 reference at 1200 mol
quanta m-2
s-1
or 1500 mol quanta m-2
s-1
for B. napus and P. deltoides, respectively. Leaves
were left in the chamber for approximately 30 minutes before being cut and placed in a 40 mmol

44
l-1
KCl solution. The KCl solution was swapped for 99% 13
C sodium bicarbonate (NaH13
CO3—
Cambridge Isotope Laboratories, Inc. Andover, MA, USA) dissolved in 40 mmol l-1
KCl at one
of three [13
CO2*]: 1.19 (low-carbon—LC), 5.95 (medium-carbon—MC), or 11.9 (high-carbon—
HC) mmol l-1
[13
CO2*], or the leaf was left in the KCl solution for the measurement. Individual
leaves were only provided a single [13
CO2*] or left in the 40 mmol l
-1KCl solution according to
Stutz et al. (2017). Once cut and placed in the [13
CO2*] the leaf remained at the starting
irradiance (1200 mol quanta m-2
s-1
B. napus or 1500 mol quanta m-2
s-1
P. deltoides) until
13
C and [13
CO2] peaked and either plateaued or decreased, which took approximately 20-30
minutes, before continuing with the light-response curve. The light-response curves were
measured in the following order for B. napus: 1200, 1000, 800, 500, 350, 250, 200, 175, 150,
125, 100, 75, 50, 35, 0 mol quanta m-2
s-1
and the following order for P. deltoides: 1500, 1000,
800, 500, 250, 200, 175, 150, 125, 100, 75, 50, 35, 0 mol quanta m-2
s-1
. Five measurements
were made at each irradiance. Five leaves from each species were measured in the KCl and each
[13
CO2*].
CO2-response curves
For the CO2-response curves, the highest fully expanded leaf for B. napus or a fully
expanded P. deltoides leaf, was placed in the same LI-6400 custom leaf chamber as was used for
the light-response curves at 23ºC (leaf temperature) at 1200 mol quanta m-2
s-1
or 1500 mol
quanta m-2
s-1
for B. napus and P. deltoides, respectively. The CO2 reference on the LI-6400 was
set so the [CO2] at the leaf level was approximately 400 mol mol-1
, which was between 500 and
600 mol mol-1
CO2 reference [CO2] for both species. As with the light-response curves, leaves
were left in the chamber for approximately 30 minutes before being cut and placed in a 40 mmol

45
l-1
KCl solution for approximately 16 minutes. The leaves were then transferred to a single 99%
13C sodium bicarbonate (NaH
13CO3) solution (LC, MC, or HC) or remained in the KCl solution,
as in the light-response curves. The leaf was left at the starting [CO2] until the 13
C and [13
CO2]
readings on the TDL stabilized approximately 20 to 30 minutes for each leaf. The [CO2] on the
LI-6400 reference were applied to the leaf in the following order: starting [CO2], 200, 100, 50,
150, 300, starting [CO2], 1000, 2000, 1500, 700 and starting [CO2]. The leaf was left at each
[CO2] for three cycles on the TDL except for the starting [CO2] where the leaf was left until it
reached the starting rate of photosynthesis. Following the CO2-response curve the light was
turned off and respiration was measured when the leaf had been in the dark for at least 30
minutes, to avoid light enhanced dark respiration (LEDR). Fives leaves from each species were
measured for each [13
CO2*] and the KCl solution.
Estimating the rate of xylem-transported CO2 assimilation
The assimilation rate of xylem-transported CO2 (13
Ax) was calculated as (Table 1, Fig. 1):
𝐴𝑥 = 𝐶𝑝𝑟𝑒𝑑 𝑒𝑓𝑓𝑙𝑢𝑥 − 𝐶𝑜𝑏𝑠𝑒𝑟𝑣𝑒𝑑 𝑙𝑖𝑔ℎ𝑡 𝑒𝑓𝑓𝑙𝑢𝑥131313 Equation 1
where 13
Cpred efflux (Table 1) is the predicted rate of xylem-transported CO2 exiting the leaf if there
is no photosynthesis of xylem-transported CO2, and is estimated from linear regression models of
xylem-transported CO2 effluxes in the dark for both species (see Stutz et al., 2017). 13
Clight efflux
is the efflux of xylem- transported 13
CO2 in the light and is calculated as:
𝐶𝑙𝑖𝑔ℎ𝑡 𝑒𝑓𝑓𝑙𝑢𝑥13 = 𝐴𝑝𝑟𝑒𝑑 − 𝐴𝑜𝑏𝑠
1313 Equation 2

46
where 13
Aobs is the rate of 13
CO2 assimilation measured with the TDL and 13
Apred is the predicted
background rate of 13
C assimilation based on the atmospheric concentration of 13
CO2 and is
estimated as:
𝐴13𝑝𝑟𝑒𝑑 = 𝐴12
𝑜𝑏𝑠 ∗ 0.011 Equation 3
where 12
Aobs is the observed rate of 12
CO2 assimilation measured with the TDL. The natural
abundance of 13
CO2 is 1.1% of 12
CO2 in the atmosphere; therefore, the rate of 13
CO2 assimilation
will be approximately 0.011 of the rate of 12
CO2 assimilation under normal conditions (Griffis et
al., 2004).
Statistical analysis
Linear mixed effects models were produced for the following variables: 12
Aobs, 13
Ax,
13Clight efflux and the percentage of
13Ax to total A, for both the light- and CO2-response curves.
The fixed effects were species and [13
CO2*] while the random effects were irradiance and [CO2],
for the light- and CO2-response curves, respectively. Results were deemed significant at P<0.05.
No data were transformed based on the distribution of the residuals. All statistical analyses were
performed in R (version 3.4.2, R Development Core Team 2017).
RESULTS
Rates of assimilation
As expected, rates of photosynthesis using atmospheric CO2 (12
Aobs) increased with
increasing irradiance and intercellular [CO2] (Fig. 2c, d, Fig. 3c, d) for both species. In B. napus,
rates of assimilation saturated at ~18 mol CO2 m-2
s-1
in the HC (high-carbon—11.9 mmol l-1
)

47
and KCl treatments; while rates of saturation were ~22 mol CO2 m-2
s-1
in the LC (low-
carbon—1.19 mmol l-1
) and MC (medium-carbon—5.95 mmol l-1
) treatments (Fig. 2c). In P.
deltoides, rates of 12
Aobs saturated at ~18 mol CO2 m-2
s-1
across all treatments (Fig. 2d). In the
CO2-response curves, saturated rates of 12
Aobs in B. napus were ~30 mol CO2 m-2
s-1
in the HC
and KCl treatments and ~40 mol CO2 m-2
s-1
in the LC and MC treatments (Fig. 3c). In P.
deltoides the saturated rate of assimilation was ~13 mol CO2 m-2
s-1
(Fig. 3d) across all
treatments.
Rates of xylem-transported CO2 assimilation (13
Ax) increased with increasing irradiance
and [13
CO2*] for both species (Fig. 2a, b). In B. napus rates of
13Ax under saturating irradance
were ~0.03 mol CO2 m-2
s-1
, ~0.22 mol CO2 m-2
s-1
, and ~0.42 mol CO2 m-2
s-1
in the LC,
MC, and HC treatments, respectively (Fig. 2a); rates of 13
Aobs in the KCl treatment was ~0.18
mol CO2 m-2
s-1
. The rates of 13
Ax were significantly different among the three [13
CO2*]
(P<0.001); the rate of 13
Ax and 13
Aobs in the MC and KCl treatments were significantly different
(P<0.05). In P. deltoides, rates of 13
Ax were ~0.08 mol CO2 m-2
s-1
, ~0.25 mol CO2 m-2
s-1
,
and ~0.44 mol CO2 m-2
s-1
in the LC, MC, and HC treatments, respectively; the rate of 13
Aobs in
the KCl treatment was ~0.23 mol CO2 m-2
s-1
(Fig. 2b). Under saturating irradiance, rates of
13Ax were significantly different among the three [
13CO2
*] treatments (P<0.001). However, rates
of 13
Ax and 13
Aobs were not significantly different between the MC and the KCl treatments
(P=0.062) (Fig. 2b). Mean rates of 13
Ax in the LC treatment were more than five times greater in
P. deltoides compared to B. napus when irradiance was saturating but were boardline
significantly different (P=0.051). Rates of 13
Ax were similar and not significantly different
between species in either the MC (P=0.071) or the HC (P=0.370) treatments. Rates of 13
Aobs in
the KCl treatment were similar to to rates of 13
Ax in the MC treatment for both species,

48
indicating that under LC there is little additional contribution of 13
Ax compared to the
background rate of photosynthesis using 13
CO2 derived from the atmosphere; however, when
[13
CO2*] is at least 5.95 mmol l
-1, not accounting for rates of xylem-transported CO2, assimilation
would underestimate total assimilation by approximately 1.1% (the rate of normal background
assimation using 13
CO2), and this error would increase with increasing xylem [CO2*].
In the CO2-repsonse curves, rates of 13
Aobs in the KCl treatment increased with increasing
[CO2] and saturated at an intercellular [CO2] of ~700 mol mol-1
CO2 for both species.
However, in both species, across all [13
CO2*], rates of
13Ax increased with decreasing [CO2] and
peaked at an intercellular [CO2] of ~150 mol mol-1
(Fig. 3a, b). In B. napus the highest rates of
13Ax were ~0.02 mol CO2 m
-2 s
-1, ~0.14 mol CO2 m
-2 s
-1, and ~0.28 mol CO2 m
-2 s
-1, in the
LC, MC, and HC treatments, respectively; the rate of 13
Aobs in the KCl treatment was ~0.36 mol
CO2 m-2
s-1
(Fig. 3a). Rates of 13
Ax and 13
Aobs were significantly different among all treatments
(P<0.001). In P. deltoides the highest rates of 13
Ax ~0.04 mol CO2 m-2
s-1
, ~0.17 mol CO2 m-2
s-1
, and ~0.28 mol CO2 m-2
s-1
, in the LC, MC, and HC treatments, respectively (Fig. 3b); rates
of 13
Aobs were ~0.16 mol CO2 m-2
s-1
in the KCl treatment (Fig. 3b). However, rates of 13
Ax or
13Aobs were only signficantly different in the MC treatment compared to the LC, HC and KCl
treatments (P<0.001) (Fig. 3b). The saturating rate of 13
Aobs in the KCl treatment was similar to
the highest observed rate of 13
Ax in the MC treatment; however, occuring at a different Ci. For
both species, at an intercellular [CO2] of about 400 mol mol-1
rates of 13
Ax started to decline
and continued to decline once saturation was reached for 12
CO2. Rates of 13
Ax increased with
increaing [13
CO2*] and were significantly different among [
13CO2
*] (P<0.001). When [CO2] was
saturating in P. deltoides, rates of 13
Ax in the LC, MC and HC were significantly lower than rates

49
of 13
Aobs in the KCl treatment (P<0.05) while rates of 13
Ax were significantly lower in B. napus
in all [13
CO2*] compared to the KCl treatment (P<0.001).
Efflux of xylem-transported CO2 exiting the leaf in the light
Rates of 13
Clight efflux varried little across irradiance in both species (Fig. 4). In B. napus
the highest rates of 13
Clight efflux were ~0.007 mol CO2 m-2
s-1
, ~0.11 mol CO2 m-2
s-1
, and ~0.2
mol CO2 m-2
s-1
in the LC, MC and HC treatments, respectively (Fig. 4a, c, e). In B. napus
below the light-compensation point (<75 mol quanta m-2
s-1
), 13
Clight efflux was not significantly
different among treatments (Fig. 4a, c, e). However, above the light-compensation point the LC
treatment was significantly different from the MC and HC treatments (P<0.05); while the MC
and HC treatmentments were not significantly different across any irradiance.
The maximum rates of 13
Clight efflux in P. deltoides were ~0.013 mol CO2 m-2
s-1
, ~0.12
mol CO2 m-2
s-1
, and ~0.24 mol CO2 m-2
s-1
in the LC, MC and HC treatments, respectively
(Fig. 4b, d, f). There were significant differences between the LC and HC treatments (P<0.001)
and between the LC and MC treatments (P<0.05) across all irradiances. However, the LC and
MC treatments were only significantly different under low (<175 mol quanta m-2
s-1
) and high
(>500 mol quanta m-2
s-1
) irradiances (Fig. 4b, d). Higher rates of 13
Clight efflux were observed in
leaves with higher transpiration rates within the MC and HC treatments compared to leaves with
lower rates of transpiration within a single [13
CO2*], leading to large error bars observed in P.
deltoides (Fig. 4d, f). The 13
Clight efflux was significantly different among [13
CO2*] (P<0.001) but
not between species (P=0.43). Differences in 13
Clight efflux were most pronounced under low
irradiance both among [13
CO2*] and between species (Fig. 4). The rate of
13Clight efflux was similar
between species in the LC treatment; however maximum rates of 13
Clight efflux were higher in P.

50
deltoides compared to B. napus (P<0.001) in the MC treatment (Fig. 4c, d); while rates of 13
Clight
efflux were higher in B. napus in the HC treatment compared to P. deltoides (P<0.001) (Fig. 4e, f).
In the CO2-response curves, the maximum rates of 13
Clight efflux in B. napus were ~0.007
mol CO2 m-2
s-1
, ~0.07 mol CO2 m-2
s-1
, and ~0.24 mol CO2 m-2
s-1
in the LC, MC and HC
treatments, respectively (Fig. 5a, c, e). The maximum rates of 13
Clight efflux in P. deltoides were
~0.014 mol CO2 m-2
s-1
, ~0.12 mol CO2 m-2
s-1
, and ~0.23 mol CO2 m-2
s-1
in the LC, MC
and HC treatments, respectively (Fig. 5b, d, f). Rates of 13
Clight efflux were ten times higher going
from the LC to the MC treatments for both species (Fig. 5a, b, c, d). 13
Clight efflux increased
slightly with increasing intercellular [CO2] for both species in the LC, and MC treatments and for
P. deltoides in the HC treatment (Fig. 5a, b, c, d, f). In B. napus in the HC treatment 13
Clight efflux
decreased with increasing intercellular [CO2] (Fig. 5e). There were significant differences
between species (P<0.001) and among [13
CO2*] (P<0.001).
How do rates of 13
Ax compare to rates of 13
Clight efflux?
The rate of 13
Clight efflux was lower than the rate of 13
Ax across all irradiances in the LC and
HC treatments, in B. napus (Fig. 4a, e). However, in the MC treatment, the rate of 13
Clight efflux
was greater than the rate of 13
Ax when irradance was less than 800 mol quanta m-2
s-1
but under
higher irradiances, this reversed (Fig. 4c).
In P. deltoides, in the MC and HC treatments, the rate of 13
Clight efflux was greater than 13
Ax
when the irradiance was under 500 mol quanta m-2
s-1
; however, when irradiance was greater
than 500 mol quanta m-2
s-1
rates of 13
Ax were greater (Fig. 4d, f). In the LC treatment, above
the light-compensation point rates of 13
Ax were greater than the rate of 13
Clight efflux (Fig. 4b).

51
In the CO2-response curves, rates of 13
Ax were always equal to or greater than rates of
13Clight efflux across all [
13CO2
*] and Ci for both species (Fig. 5). With increasing Ci the rate of
13Ax and
13Clight efflux approached each other in the LC and MC treatments, in B. napus (Fig. 5a,
c). However, in the HC treatment for B. napus both 13
Ax and 13
Clight efflux declined with
increasing Ci (Fig. 5e).
Contribution of xylem-transported CO2 assimilation to total assimiation
In both species the percentage of 13
Ax as a total contribution to photosynthesis increased
with decreasing irradiance and peaked near the light-compensation point (Fig. 6a, b). In B.
napus, the contrubution of 13
Ax to total photosynthesis increased with increasing [13
CO2*]. The
highest percentage of 13
Ax to total photosynthesis were 0.98% (LC), 4.9% (MC) and 5.9% (HC)
(Fig. 6a) which occurred near the light-compensation point. The contribution of xylem-
transported CO2 to total photosynthesis saturated at 0.3% (LC), 1% (MC), and 2.5% (HC); the
contribution of xylem-transported CO2 to total photosynthesis saturated at an irradiance of 250
mol quanta m-2
s-1
in all treatments (Fig. 6a). In P. deltoides the contribution of 13
Ax to total
photosynthesis was highest in the MC treatment with a total contribution of 8% while the
contribution in the LC and HC treatments were 1.6% and 3.4%, respectively, which occurred
near the light-compensation point (Fig. 6b). The contribution of xylem-transported CO2 to total
photosynthesis saturated at an irradiance of 250 mol CO2 m-2
s-1
(Fig. 6b) the contribution of
13Ax to total photosynthesis were 0.4% (LC), 1.4% (MC) and 2.2% (HC) (Fig. 6b).
In the CO2-response curves the percentage of 13
Ax as a total contribution of
photosynthesis increased with decreasing [CO2] and peaked at the lowest [CO2] for both species
acorss all [13
CO2*]. In B. napus the contribution of
13Ax to total photosynthesis was 0.65% (LC),

52
3.6% (MC) and 8% (HC) (Fig. 7a); while in P. deltoides the contribution of 13
Ax to total
photosynthesis was 3.6% (LC), 6.9% (MC) and 10% (HC) (Fig. 7b).
In order to determine if the 13
Clight efflux could ever reach the rate of respiration in the dark
(Rd) or ½*Rd in the light, the rate of 13
Clight efflux from all [13
CO2*] was plotted with the average
rate of dark respiration across all [13
CO2*] for each species (black line) and ½*Rd (dotted line)
(Figs. 6c, d, 7c, d) for both the light- and CO2-response curves. In the light-response curves, the
rate of 13
Clight efflux is well below the rate of ½*Rd and Rd even under the HC for both species
(Fig. 6c, d). Across all [CO2] and [13
CO2*] the rate of
13Clight efflux was well below the Rd and
½*Rd (Fig. 7c, d).
DISCUSSION
Our method, of placing a cut leaf in a solution of [13
CO2*] and measuring gas exchange
using a LI-6400 leaf chamber coupled to a tunable diode laser absorption spectroscope (TDL),
allowed for real-time measurements of rates of assimilation of xylem-transported CO2 (13
Ax) and
the efflux of xylem-transported CO2 (13
Clight efflux) out of the leaf in the light for both a woody
species, Populus deltoides and a herbaceous species, Brassica napus. We found that xylem-
transported CO2 was most important when the intercellular [CO2] was low, which occurred under
high irradiance and low [CO2] (Fig. 2a, b, 3a, b). While a portion of the xylem-transported CO2
was used for photosynthesis, the contribution of 13
Ax to total photosynthesis in the light-response
curves was only about 2.5% in B. napus and 2.2% in P. deltoides when the rates of 13
Ax were
highest in the HC treatment (Fig. 6a, b); however, the percentage contribution of 13
Ax to total
photosynthesis increased to 6% (high-carbon—HC) and 8% (medium-carbon—MC) in B. napus
and P. deltoides, respectively, under low irradiance (Fig. 6a, b). In the CO2-response curves the

53
contribution of 13
Ax to total photosynthesis was 0.9% (HC) and 1.5% (HC) at saturating [CO2]
but increased with decreasing [CO2] to 8% (HC) and 10% (HC) in B. napus and P. deltoides,
respectively (Fig. 7a, b). Rates and contributions of 13
Ax increased with increasing [13
CO2*] for
both species in both the light- and CO2-response curves. Across all [13
CO2*] in both the light-
and CO2-response curves, there was a small, but measurable efflux of 13
CO2 exiting the leaf (Fig.
6c, d, 7c, d) for both species in the light- and CO2-response curves. The 13
Clight efflux increased
with increasing [13
CO2*] for both species in the light- and CO2-response curves (Fig. 4, 5), with
the maximum rate of 13
Clight efflux occurring in the HC treatments in both the light- (~0.2 mol
CO2 m-2
s-1
in B. napus and ~0.3 mol CO2 m-2
s-1
in P. deltoides) and CO2-response (~0.3 mol
CO2 m-2
s-1
in B. napus and ~0.2 mol CO2 m-2
s-1
in P. deltoides) curves (Fig. 4e, f, 5e, f).
How large and is it possible to measure xylem-transported CO2 exiting a leaf in the light?
Bloemen et al. (2013b) hypothesized that any xylem-transported CO2 that reached the
leaves of P. deltoides saplings would be inconsequential compared to the CO2 that would enter
the leaves from the atmosphere, thus, resulting in no net loss of xylem-transported CO2 from
leaves. However, when Bloemen et al. (2015) placed cut P. deltoides leaves either in a solution
labeled with 13
CO2 or a solution of KCl in the same Plexiglass box for a 2 hour length of time
they detected that between 6% and 15% of the total assimilates in unlabeled leaves originated
from xylem-transported CO2 that effluxed from the labeled leaves. Additionally, Stringer &
Kimmerer (1993) measured the efflux of 14
CO2 in cut P. deltoides leaves and found that less than
1% of the 14
CO2 label escaped out the leaves in the light. We also observed a small but
measurable efflux of xylem-transported CO2 out of cut leaves in the light in the low-carbon (LC),
MC and HC treatments ranging from <0.01 mol CO2 m-2
s-1
in the LC treatment for B. napus to

54
0.3 mol CO2 m-2
s-1
in the HC treatment for B. napus and P. deltoides (Fig. 4, 5) across both
light- and CO2-response curves. The 13
Clight efflux was dependent upon [13
CO2*] and rates of
transpiration. The highest rates of 13
Clight efflux in the light- and CO2-reponse curves occurred
under high irradiance and low [CO2] when rates of transpiration and stomatal conductance were
highest, which occurred when vapor pressure difference (VPD) and Ci were lowest (Fig. 4, 5).
Bloemen et al. (2013a) and Bloemen et al. (2015) observed VPD along with transpiration were
the most important drives for how much xylem-transported CO2 was assimilated in cut branches
and leaves. We found that it was the rate of transpiration, controlled by stomatal conductance
and VPD that indicated how much xylem-transported CO2 exited the leaf in the light, which was
also true for the dark (Stutz et al., 2017).
Rates of 13
Cefflux out of cut Platanus occidentalis branches were 52% lower in the light
compared to the dark (McGuire et al., 2009) while Stringer & Kimmerer (1993) observed an
83% decrease in 14
CO2 efflux exiting cut leaves under an irradiance of 70 mol quanta m-2
s-1
in
the light compared to the dark. We observed a decline in 13
Clight efflux of 44% in the HC and 65%
in the LC in the light compared to the dark in P. deltoides and a 9% in the HC and 39% in the LC
in B. napus. With increasing [13
CO2*], the amount of xylem-transported CO2 used for
photosynthesis declined while the amount of 13
CO2 exiting the leaf increased. Unlike previous
studies we were able to measure in real-time the efflux of xylem-transported CO2 exiting the leaf
along with rates of xylem-transported CO2 assimilation. High rates of 13
Clight efflux are not
exclusive of low rates of 13
Ax, instead the highest rates of 13
Clight efflux coincide with the highest
rates of 13
Ax. This indicates that the supply of xylem-transported CO2 for photosynthesis, which
is controlled by the rate of transpiration, is critical for controlling how much xylem-transported
CO2 is used for photosynthesis.

55
When is xylem-transported CO2 assimilation most important
Rates of 13
Ax were measurable in all [13
CO2*] and increased with increasing [
13CO2
*]
provided through the xylem. High rates of 13
Ax occurred when the rate of transpiration was high
and the intercellular [CO2] was low for both species. This occurs in the light-response curves,
under high irradiance, and in the CO2-response curves, under low [CO2]. Xylem-transported
CO2 utilization followed similar patterns to 13
CO2 originating from the atmosphere in the light-
response curves; however, the pattern of xylem-transported CO2 utilization was completely
different in the CO2-response curves, indicating a balance of the supply and demand of xylem-
transported CO2 to photosynthesis. In B. napus rates of 12
Aobs were lower in the HC treatment
compared to all other treatments in both the light- and CO2-responses while there was no
difference in P. deltoides. Suggesting a threshold of bicarbonate concentration was reached in B.
napus which caused stomatal closure.
The balance of how much xylem-transported CO2 is used for photosynthesis is dependent
upon how much xylem-transported CO2 is supplied to the leaf by the transpiration stream and the
demand for CO2. When rates of transpiration are high the [CO2*] in the stem declines (Aubrey &
Teskey, 2009); however, this increases the amount of xylem-transported CO2 that reaches the
leaves and is available for leaf photosynthesis. Bloemen et al. (2013a) found in cut branches
with attached leaves that more 13
C was incorporated into leaf tissues when transpiration and VPD
were both high. Our light-response curves showed a similar pattern, with a high supply rate of
xylem-transported CO2 to a leaf when irradiance and stomatal conductance were high as well a
high demand for CO2.
In the CO2-response curves xylem-transported CO2 was most important to overall
photosynthesis when Rubisco was CO2 limited (Sharkey et al., 2007). The CO2-limited region

56
of a CO2-response curve is considered to be below 200 mol mol-1
CO2 (Sharkey et al., 2007).
Rates of 13
Ax were highest below 200 mol mol-1
CO2, with the peak of 13
Ax occurring when
[CO2] was 100 mol mol-1
CO2 across all [13
CO2*] and both species (Fig. 5). Below this [CO2]
there was a decline in 13
Ax which is likely a result of deactivation of Rubisco (Sharkey et al.,
2007). The combination of low supply of atmospheric CO2 (low intercellular CO2) and high
rates of transpiration and stomatal conductance supplying high quantities of [CO2*] to the leaf
resulted in the observed high rates of 13
Ax when the [CO2] was low. As the atmospheric [CO2]
increased, the rate of transpiration supplying xylem-transported CO2 to the leaf and stomatal
conductance declined. This diluted a proportion of xylem-transported CO2 in the intercellular air
space and decreased the possibility of the xylem-transported CO2 being used for photosynthesis.
Does xylem-transported CO2 matter for photosynthesis?
The percentage of xylem-transported CO2 contributing to total photosynthesis increased
with increasing [13
CO2*] while also increasing with decreasing irradiance. When light was
saturating 13
Ax accounted for ~2.5% for B. napus and ~2.2% for P. deltoides in the HC
treatment. As irradiance decreased the contribution increased to ~5.8% in B. napus and ~9% in
P. deltoides. The same pattern is repeated across all [13
CO2*]. Stringer & Kimmerer (1993)
estimated that for an individual leaf not including xylem-transported CO2 assimilation led to a
0.5% underestimation of net photosynthesis and that 13
Ax accounted for 2.2% of the atmospheric
uptake in intact leaves under a [14
CO2*] of 1 mmol l
-1. Bloemen et al. (2013a) estimated that
xylem-transported CO2 assimilation accounted for about 2.0% and 0.75% in their high- and low-
label treatments of cut P. deltoides branches and leaves combined. McGuire et al. (2009) found

57
that the assimilation of xylem-transported CO2 accounted for 6% of the assimilation from the
atmosphere.
It is well established that cut branches with attached leaves, as well as cut leaves can use
xylem-transported CO2 for photosynthesis (McGuire et al., 2009; Stringer & Kimmerer, 1993;
Bloemen et al., 2015); however, when labeled xylem-transported CO2 is applied to the roots or
shoots of a plant only small quantities of xylem-transported CO2 is used for leaf photosynthesis
(Bloemen et al., 2013a, b) or not observed in leaf tissue (Powers & Marshall, 2011). However,
no studies have measured [CO2*] in the stem and branch tips simultaneously in order to
determine how much xylem-transported CO2 maybe reaching the leaves and available for leaf
photosynthesis in a large tree. The real-time rates of xylem-transported CO2 assimilation are low
compared to assimilation rates using CO2 from the atmosphere, especially when considering that
most plants have [CO2*] in the xylem near our LC treatment. On the high end of supplied
[CO2*], we observed a difference of less than 20 mol mol
-1 CO2 in intercellular [CO2] (data not
shown). Therefore, it is unlikely that xylem-transported CO2 would significantly change our
estimations of parameters for leaf-level photosynthesis models as Hanson & Gunderson (2009)
postulated. However, when looking over the life-time of a plant xylem-transported CO2 may
play a significant role in total net photosynthesis. The carbon fixed using xylem-transported CO2
can be used for a plant to grow a little more, for upkeep of respiring tissues or to put more energy
into reproduction.
The rates of 13
Clight efflux in the HC treatment was approximately a tenth of the rate of dark
respiration in B. napus and about a fifth the rate of dark respiration in P. deltoides therefore,
xylem-transported CO2 exiting the leaf will only affect estimates of respiration in the light for
plants on the high end of measured xylem CO2 concentrations. However, if assuming that rates

58
of day respiration being half the rate of dark respiration, the rate of 13
Clight efflux in the HC
treatment would account for 40% of the efflux of CO2 out of a leaf in the light in B. napus and
20% in P. deltoides.
CONCLUSION
Our technique of using an LI-6400 coupled to a TDL allows for real-time measurements
of the rates of xylem-transported CO2 assimilation and the efflux of xylem-transported CO2 out
of a cut leaf from both a herbaceous and woody C3 plant leaves placed in a [13
CO2*] solution.
Rates of 13
Ax and 13
Clight efflux increased with increasing [13
CO2*] for both the light- and CO2-
response curves. Both the woody species, P. deltoides and the herbaceous species, B. napus
responded similarly to each other indicating that the effects of petiole morphology had little
impact on how xylem-transported CO2 was used for photosynthesis. The highest rates of 13
Ax
and 13
Clight efflux occurred when the rate of transpiration was high which occurred when irradiance
was high and [CO2] was low. The contribution of 13
Ax to total assimilation accounted for ~2.5%
in B. napus and ~2.2% in P. deltoides of the total rate of assimilation under saturating irradiance
in the HC treatment; however, the contribution of xylem-transported CO2 to total photosynthesis
was ~5.95% B. napus and ~8% in P. deltoides under low irradiance. It is unlikely that the
contribution of xylem-transported CO2 changes estimates of current models of leaf-level
photosynthesis. However, xylem-transported CO2 likely plays an important role and
contribution to photosynthesis over the life of an individual plant and may allow a plant to
survive adverse conditions and be helpful as climate change progresses.
59
ACKNOWLEDGMENTS
Hossein Goudarzi designed and created figure 1 from conceptual illustrations. Joy Avritt and
Lindsey Kaufman for greenhouse and plant maintenance. This research was supported in part by
instrumentation obtained (TDL) through NSF funding (IOS 0719118). Additional support was
provided by the University of New Mexico and the NSF EPSCoR Program under Award #IIA-
1301346 (New Mexico). Any opinions, finding, and conclusions or recommendations expressed
in this material are those of the author(s) and do not necessarily reflect the views of the National
Science Foundation or the US NIH. Source for the B. napus seeds (J. Chris Pires, University of
Missouri-Columbia). Support for SSS was provided by the Dr. Harry Wayne Springfield
Fellowship through the Department of Biology, University of New Mexico.
AUTHOR CONTRIBUTIONS
S.S.S. performed experiments and analyzed data. D.T.H. provided conceptual framework.
S.S.S. and D.T.H. wrote the manuscript.
REFERENCES Aubrey DP, Teskey RO. 2009. Root-derived CO2 efflux via xylem stream rivals soil CO2
efflux. New Phytologist 184: 35-40.
Barbour MM, McDowell NG, Tcherkez G, Bickford CP, Hanson DT. 2007. A new
measurement technique reveals rapid post-illumination changes in the carbon isotope
composition of leaf-respired CO2. Plant, Cell & Environment 30: 469-482.
Bloemen J, McGuire MA, Aubrey DP, Teskey RO, Steppe K. 2013a. Assimilation of xylem-
transported CO2 is dependent on transpiration rate but small relative to atmospheric fixation.
Journal of Experimental Botany 64: 2129-2138.
Bloemen J, McGuire MA, Aubrey DP, Teskey RO, Steppe K. 2013b. Transport of root-
respired CO2 via the transpiration stream affects aboveground carbon assimilation and CO2
efflux in trees. New Phytologist 197: 555-565.

60
Bloemen J, Bauweraerts I, De Vos F, Vanhove C, Vandenberghe S, Boeckx P, Steppe K.
2015. Fate of xylem-transported 11
C- and 13
C-labeled CO2 in leaves of poplar. Physiologia
Plantarum 153: 555-564.
von Caemmerer S. 2000. Biochemical models of leaf photosynthesis. Collingwood, Vic.,
Austrailia: CSIRO Publishing.
Erhardt EB, Hanson DT. 2013. Tdllicor: TDL/Licor processing. R package version 0.1-22.
Farquhar GD, von Caemmerer S, Berry JA. 1980. A biochemical model of photosynthetic
CO2 assimilation in leaves of C3 species. Planta 149: 78-90.
Griffis T, Baker J, Sargent S, Tanner B, Zhang J. 2004. Measuring field-scale isotopic fluxes
with tunable diode laser absorption spectroscopy and micrometeorological techniques.
Agricultural and Forest Meterology 124: 15-29.
Hanson PJ, Gunderson CA. 2009. Root carbon flux: measurements versus mechanisms. New
Phytologist 184: 4-6.
McGuire MA, Marshall JD, Teskey RO. 2009. Assimilation of xylem-transported 13
C-labelled
CO2 in leaves and branches of sycamore (Platanus occidentalis L.). Journal of Experimental
Botany 60: 3809-3817.
Kok B. 1948. A critical consideration of the quantum yield of Chlorella photosynthesis.
Enzymologia 13: 1-56.
Kok B. 1949. On the interrelation of respiration and photosynthesis in green plants. Biochimica
et Biophysica Acta 2: 625-631.
Powers EM, Marshall JD. 2011. Pulse labeling of dissolved 13
C-carbonate into tree xylem:
developing a new method to determine the fate of recently fixed photosynthate. Rapid
communications in mass spectrometry 25: 33-40.
R Core Development Team. 2012. R: A language and environment for statistical computing.
Vienna, Austria: Ro Foundation for Statistical Computing. ISBN 3-900051-0700. Aviailable at:
http://www.R-project.org (Accessed 19 August 2012).
Sharkey TD, Bernacchi CJ, Farquhar GDD, Singsaas EL. 2007. Fitting photosynthetic
carbon dioxide response curves for C3 leaves. Plant, Cell & Environment 30: 1035-1040.
Stringer JW, Kimmerer TW. 1993. Refixation of xylem sap CO2 in Populus deltoides.
Physiologia Plantarum 89: 243-251.
Stutz SS, Anderson J, Zulick R, Hanson DT. 2017. Inside out: efflux of carbon dioxide from
leaves represents more than leaf metabolism. Journal of Experimental Botany 68: 2849-2857.

61
Tcherkez G, Mahe A, Gauthier P, Mauve C, Gout E, Bligny R, Cornic G, Hodges M. 2009.
In folio respiratory fluxomics revealed by 13
C isotopic labeling and H/D isotope effects highlight
the noncyclic nature of the tricarboxylic acid “cycle” in illuminated leaves. Plant Physiology
151: 620-630.
Tcherkez G, Gauthier P, Buckley TN, Busch FA, Barbour MM, Bruhn D, Heskel MA,
Gong XY, Crous K, Griffin KL, Way DA, Turbull MH, Adams MA, Atkin OK, Bender M,
Farquhar GD, Cornic G. 2017a. Tracking the origins of the Kok effect, 70 years after its
discovery. New Phytologist 214: 506-510.
Tcherkez G, Gauthier P, Buckley TN, Busch FA, Barbour MM, Bruhn D, Heskel MA,
Gong XY, Crous KY, Griffin K, Way D, Turnbull M, Adams MA, Atkin OK, Farquhar
GD, Cornic G. 2017b. Leaf day respiration: low CO2 flux but high significance for metabolism
and carbon balance. New Phytologist 216: 986-1001.
Teskey RO, McGuire MA. 2002. Carbon dioxide transport in xylem causes errors in estimation
of rates of respiration in stems and branches of trees. Plant, Cell & Environment 25: 1571-1577.
Teskey RO, Saveyn A, Steppe K, McGuire MA. 2008. Origin, fate and significance of CO2 in
tree stems. New Phytologist 177: 17-32.

62
TABLES Table 1 Definitions and units for symbols in the text.
All units are mol CO2 m-2
s-1
.
Symbol Definition Equations/notes 12
Aobs Net 12
CO2
assimilations
Measured with
the TDL 13
Aobs Net 13
CO2
assimilations
Measured with
the TDL 13
Apred Predicted
atmospheric 13
CO2
assimilation
Equation 3
13Cpred efflux
Predicted rate of
xylem 13
CO2
efflux assuming
no xylem
transported CO2
is used for
photosynthesis
See Stutz et al.
2017
13Clight efflux
Calculated 13
Cefflux in the
light
Equation 2
13Ax Assimilation of
xylem
transported CO2
Equation 1

63
FIGURES
Fig 1 Experimental set up showing the different fluxes of xylem-transported CO2 (blue, red and
purple arrows) with the competing process of leaf photosynthesis with atmospheric CO2 (purple
arrow) and the net loss of CO2 from respiration in the light (red arrow). CO2 from root and stem
respiration dissolves in xylem water and moves through the plant along with the bulk flow of
water. Some of this xylem-transported CO2 is used for photosynthesis in the stem and branches
while some of it reaches the leaves (blue). This CO2 is either used for leaf photosynthesis
(purple arrow) or exits the leaf with the transpiration stream (blue arrow).
Fig. 2 Light-response curves for rates of photosynthesis with 13
CO2 (13
Ax—photosynthesis using
xylem-transported CO2, or background rates of 13
Aobs in KCl treatment) and 12
CO2 (12
Aobs—
photosynthesis using CO2 derived from the atmosphere). 13
Ax in (a) B. napus and (b) P.
deltoides, KCl (open circles), LC (light gray circles), MC (dark gray circles), and HC (closed
circles), and 12
Aobs for (c) B. napus and (d) P. deltoides, KCl (open triangles), LC (light gray
triangles), MC (dark gray triangles) and HC (closed triangles). Measurements represent means
and ±1 SD of five replicates for each treatment. The low-carbon (LC) was 1.19 mmol l-1
,
medium-carbon (MC) was 5.95 mmol l-1
, and high-carbon (HC) was 11.9 mmol l-1
.
Fig. 3 CO2-response curves for rates of photosynthesis with 13
CO2 (13
Ax—photosynthesis using
xylem-transported CO2 or background rates of 13
Aobs in KCl treatment) and 12
CO2 (12
Aobs—
photosynthesis using CO2 derived from the atmosphere). Rates of xylem-transported
photosynthesis in (a) B. napus and (b) P. deltoides, KCl (open circles), LC (light gray circles),
MC (dark gray), and HC (closed circles), and rates of 12
Aobs for (c) B. napus and (d) P. deltoides,
64
KCl (open triangles), LC (light gray triangles), MC (dark gray triangles) and HC (closed
triangles). Measurements represent means and ±1 SD of five replicates for each treatment. The
low-carbon (LC) was 1.19 mmol l-1
, medium-carbon (MC) was 5.95 mmol l-1
and high-carbon
(HC) was 11.9 mmol l-1
. In the KCl treatment rates of 13
Aobs were measured in place of rates of
13Ax.
Fig. 4 Light-response curve for rates of xylem-transported CO2 assimilation (13
Ax) (circles) and
the efflux of 13
CO2 exiting the leaf in the light (13
Clight efflux) (upside down triangles) measured
under (a, b) LC (light gray), (c, d) MC (dark gray) and (e, f) HC (closed). Measurements
represent means and ±1 SD of five replicates for each treatment. The low-carbon (LC) was 1.19
mmol l-1
, medium-carbon (MC) was 5.95 mmol l-1
and high-carbon (HC) was 11.9 mmol l-1
.
Fig. 5 CO2-response curve for rates of xylem-transported CO2 assimilation (13
Ax) (circles) and
the efflux of 13
CO2 exiting the leaf in the light (13
Clight efflux) (upside down triangles) measured
under (a, b) LC (light gray), (c, d) MC (dark gray), and (e, f) HC (closed). Measurements
represent means and ±1 SD of five replicates for each treatment. The low-carbon (LC) was 1.19
mmol l-1
, medium-carbon (MC) was 5.95 mmol l-1
and high-carbon (HC) was 11.9 mmol l-1
.
Fig. 6 Light-response curves for percentage of xylem-transported CO2 assimilation (13
Ax) to total
rates of photosynthesis under LC (gray hexagons), MC (closed hexagons) and HC (open
hexagons) for (a) B. napus and (b) P. deltoides. Light-response curves for the efflux of 13
CO2
exiting the leaf in the light (13
Clight efflux) under LC (gray diamonds), MC (closed diamonds) and
HC (open diamonds) for (c) B. napus and (d) P. deltoides. In plots c and d the black line

65
represents the average respiration in the dark (Rd) across all treatments for each species, 2.07
mol CO2 m-2
s-1
and 1.56 mol CO2 m-2
s-1
for B. napus and P. deltoides, respectively. While
the dotted lines represent ½*Rd averaged across all treatments for each species, 1.04 mol CO2
m-2
s-1
and 0.78 mol CO2 m-2
s-1
, for B. napus and P. deltoides, respectively. Measurements
represent means and ±1 SD of five replicates for each treatment. The low-carbon (LC) was 1.19
mmol l-1
, medium-carbon (MC) was 5.95 mmol l-1
and high-carbon (HC) was 11.9 mmol l-1
.
Fig. 7 CO2-response curves for percentage of xylem-transported CO2 assimilation (13
Ax) to total
rates of photosynthesis under LC (light gray hexagons), MC (dark gray hexagons) and HC
(closed hexagons) for (a) B. napus and (b) P. deltoides. Light-response curves for the efflux of
13CO2 exiting the leaf in the light (
13Clight efflux) under LC (light gray diamonds), MC (dark gray
diamonds), HC (closed diamonds) for (c) B. napus and (d) P. deltoides. In plots c and d the
black line represents the average respiration in the dark (Rd) across all treatments for each
species, 2.08 mol CO2 m-2
s-1
and 1.86 mol CO2 m-2
s-1
for B. napus and P. deltoides,
respectively. While the dotted lines represent ½*Rd averaged across all treatments for each
species, 1.04 mol CO2 m-2
s-1
and 0.93 mol CO2 m-2
s-1
, for B. napus and P. deltoides,
respectively. Measurements represent means and ±1 SD of five replicates for each treatment.
The low-carbon (LC) was 1.19 mmol l-1
, medium-carbon (MC) was 5.95 mmol l-1
and high-
carbon (HC) was 11.9 mmol l-1
.

66
FIGURE 1
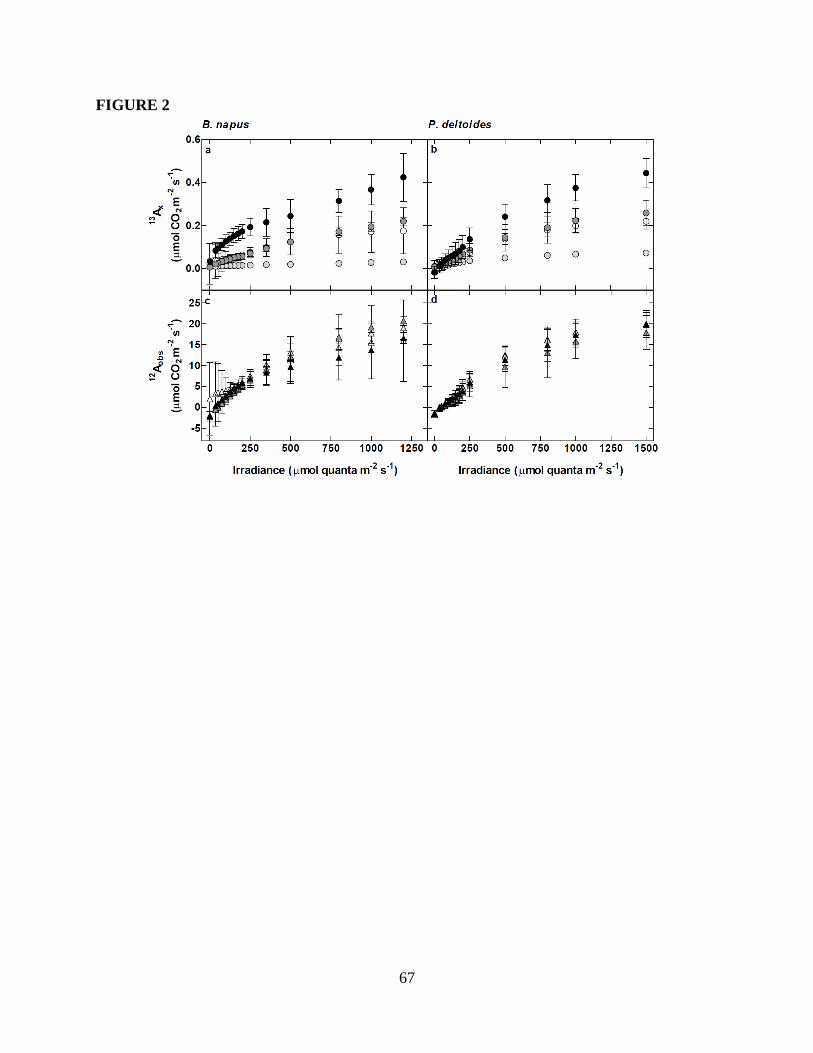
67
FIGURE 2

68
FIGURE 3

69
FIGURE 4

70
FIGURE 5

71
FIGURE 6

72
FIGURE 7

73
Chapter 4
What is the fate of xylem-transported CO2 in Kranz-type C4 plants?
Samantha S. Stutz1
1University of New Mexico, Department of Biology, MSC03-2020, Albuquerque,
NM 87131, USA

74
SUMMARY
Concentrations of dissolved inorganic carbon are high in stems of trees and herbaceous
C3 plants; this inorganic carbon can exit the plant in the dark, contributing errors to
measurements of leaf respiration. However, it is unknown if xylem-transported CO2 will
also affect plants with Kranz anatomy. C3 species use a small portion of xylem-
transported CO2 for leaf photosynthesis; however, Kranz-type C4 species may use more
xylem-transported CO2 for photosynthesis due to the tight junctions around the vascular
bundles.
In the dark cut leaves of Amaranthus hypochondriacus were placed in one of three
solutions of [NaH13
CO3] dissolved in water while simultaneously measuring the efflux of
xylem-transported CO2 exiting the leaf in the dark in real-time using a tunable diode laser
absorption spectroscope. The same method was used in the light to determine how much
xylem-transported CO2 was used for photosynthesis across light- or CO2-response curves.
In the dark the efflux of xylem-transported CO2 increased with increasing rates of
transpiration and [13
CO2*]; however, rates of
13Cefflux in A. hypochondriacus were lower
compared to C3 species. Rates of xylem-transported CO2 assimilation were higher in A.
hypochondriacus compared to the C3 species.
Kranz anatomy likely influences the efflux of xylem-transported CO2 out of cut leaves of
A. hypochondriacus in the dark and likely rates of assimilation using xylem-transported
CO2 are high in the light. This may increase the carbon use efficacy of Kranz-type C4
species over C3 species.
Key words: Amaranthus hypochondriacus, CO2 efflux, C4 photosynthesis, internally transported
CO2, Kranz anatomy, tunable diode laser absorption spectroscopy, xylem-transported CO2

75
INTRODUCTION
In Kranz-type C4 species vascular bundles in the leaves are surrounded by bundle-sheath
cells, which in turn are surrounded by mesophyll cells (Sage, 2004). Kranz anatomy allows C4
species to compartmentalize and concentrate CO2 around ribulose-1,5-bisphosphate-
carboxylase/oxygenase (Rubisco), in the bundle-sheath cells, while isolating
phosphoenolpyruvate carboxylase (PEPC), to the mesophyll cells (Hatch, 1987). CO2 is moved
from the mesophyll cells into the bundle-sheath cells as C4 acids (Hatch et al., 1967). This
biochemical pump reduces rates of photorespiration while increasing rates of photosynthesis
(Hatch, 1987; von Caemmerer & Furbank, 1999) but at the energetic cost of regenerating
phosphoenolpyruvate (PEP) (Hatch, 1987; Kanai & Edwards, 1999; Ubierna et al., 2011). In
order for Kranz-type C4 plants to reduce the energetic cost of regenerating PEP they must have
high bundle-sheath resistance to CO2 diffusion, or low leakiness (). Leakiness is the proportion
of carbon fixed by PEPC that subsequently diffuses out of the bundle-sheath cells instead of
being fixed by Rubisco (Farquhar, 1983; Hatch et al., 1995). The traditional understanding of
photosynthesis in Kranz-type C4 species is that CO2 diffuses through the stomata into the
substomatal cavity of the leaf where it will then diffuse into the mesophyll cells to be
carboxylated into C4 acids by PEPC before being shuttled into and decarboxylated in the bundle-
sheath cells (Hatch et al., 1967). However, studies in C3 species show that CO2 can be
transported in the xylem and used for photosynthesis by stems (Teskey et al., 2008, Bloemen et
al., 2013a), branches (McGuire et al., 2009; Bloemen et al., 2013a, b), and leaves (Stringer &
Kimmerer, 1993; McGuire et al., 2009; Bloemen et al., 2013a, b; Bloemen et al., 2015, Stutz,
Chapter 3).

76
Concentrations of dissolved inorganic carbon ([CO2*], the sum of [CO2]aq, [H2CO3],
[HCO3-] and [CO3
2-]) in the stems of trees can be between ~0.05 mmol l
-1 and ~13 mmol l
-1
(Teskey et al., 2008). This inorganic carbon is generated from cellular respiration and dissolves
in the xylem and moves in bulk flow along with water through the plant to the leaf where it is
either used for photosynthesis (Stringer & Kimmerer, 1993; Teskey & McGuire, 2002; Teskey et
al., 2008; Bloemen et al., 2013a, b; Bloemen et al., 2015) or exits via transpiration (Stringer &
Kimmerer, 1993; Bloemen et al., 2013a; Stutz et al., 2017). However, it is not just trees that
have high [CO2] in stems, Stutz et al. (2017) found [CO2] in bolted stems of Brassica napus
were 0.7 mmol l-1
, indicating that xylem-transported CO2 is also concentrated in stems of
herbaceous plants.
In Populus deltoides the efflux of xylem-transported CO2 out of branches and stems of
labeled saplings ranges from 82.6% in a low-label treatment (1.4 mmol l-1
[13
CO2*]) to 94.4% in
a high-label treatment (12 mmol l-1
[13
CO2*]) (Bloemen et al., 2013a) while Stringer &
Kimmerer (1993) found that 83% of the labeled H14
CO3- diffused out of cut P. deltoides leaves
in the dark. Stutz et al. (2017) found in cut leaves of P. deltoides across three [13
CO2*] that
~80% of the added xylem-transported CO2 exited the leaf as 13
CO2. However, the amount of
xylem-transported CO2 that exited cut leaves of the herbaceous C3 plant B. napus were only
between 50% and 75% across the range of [13
CO2*]. As expected, the consumption of xylem-
transported CO2 in the dark was about two times higher in B. napus compared to P. deltoides
(Stutz et al., 2017). However, in C4 species: 1) higher concentrations of PEPC may lead to
higher consumption of xylem-transported CO2, in particular bicarbonate, 2) Kranz anatomy may
hinder the amount of xylem-transported CO2 exiting the leaf in the dark compared to C3 species

77
and 3) any xylem-transported CO2 exiting the leaf in the light could cause an overestimation of
leakiness.
In C3 plants, rates and utilization of xylem-transported CO2 were mostly low compared to
the amount of xylem-transported CO2 available for photosynthesis in the light. Bloemen et al.
(2013a) found only 17.4% and 5.6% of a low- and high-label 13
CO2 were assimilated by plant
tissues over the course of 48 hours; the highest concentrations of the label were found in the
branch and stem tissues while only a small portion was found in the leaf tissues from both
treatments. When rates of xylem-transported CO2 assimilation are studied on the scale of an
individual leaf most of the label is found in the petiole and the tissues most proximal to the label
with a small portion found in minor veins and mesophyll cells (Stringer & Kimmerer, 1993;
Bloemen et al., 2015). When intercellular [CO2] was low (i.e. high irradiance or low [CO2]),
rates of assimilation using xylem-transported CO2 were highest in cut leaves of B. napus and P.
deltoides; however, when the total rate of assimilation was lowest (i.e. low irradiance or low
[CO2]) the percentage of xylem-transported CO2 to total assimilation was highest (Stutz, chapter
3).
Previous studies have focused on how trees utilize xylem-transported CO2 while ignoring
C4 species. Therefore, the objectives of this study were to estimate: 1) the rate and total efflux of
xylem-transported CO2 exiting a cut leaf of the Kranz-type C4 species, Amaranthus
hypochondriacus, in the dark and 2) the rate and contribution of xylem-transported CO2 to total
assimilation in the light for A. hypochondriacus. These goals were accomplished using a LI-
6400 with a custom leaf chamber coupled to a tunable diode laser absorption spectroscope (TDL)
to measure how much xylem-transported CO2 entered a cut leaf and exited the leaf in the dark or
was used for photosynthesis in the light using light- and CO2-response curves (Stutz et al., 2017;

78
Stutz, chapter 3). We hypothesized that Kranz-type anatomy found in A. hypochondriacus
would prohibit much of the xylem-transported CO2 from exiting cut leaves in the dark; in the
light we hypothesized that the rate of xylem-transported CO2 assimilation would be higher in A.
hypochondriacus compared to the rate of xylem-transported CO2 assimilation in B. napus.
MATERIALS & METHODS
Plant propagation and growth
Amaranthus hypochondriacus (L.) was grown under SPYDR 1200 GROW-MAX LED
lights (Fluence Bioengineering, Austin, TX, USA) with 500 mol quanta m-2
s-1
and a day/night
cycle of 12 hours, in a greenhouse at the University of New Mexico in Albuquerque, NM in
ambient CO2. The greenhouse temperature varied between 20ºC-23.9ºC across a day. A.
hypochondriacus was started from seed. The seeds were sowed in 500 mL pots with Metro-Mix
300 potting soil (Sun Gro Horticulture, Seba Beach, AB, Canada). Once the seedlings were
larger they were transferred to 3.7 L pots filled with Metro-Mix 300 potting soil approximately
30 days after germination. Plants were fertilized twice weekly with Peter 20-20-20 fertilizer
(Scotss Miracle-Gro, Marysville, OH, USA) and once weekly with chelated liquid iron (ferti-
lome, Bonham, TX, USA). Plants were measured between 50 and 80 days after geminating.
Brassica napus (L. stellar DH GT060615) was propagated according to Stutz et al.
(2017). B. napus was grown under natural light in an unshaded greenhouse, with mid-day
photosynthetically active radiation (PAR) at pot level of 1200 mol m-2
s-1
at the University of
New Mexico in Albuquerque, NM, USA, under ambient CO2, 24ºC/21ºC day/night.

79
Dark efflux measurements
A LI-6400 (LI-COR Biosciences, Lincoln, NE, USA) was coupled to a tunable diode
laser absorption spectroscope (TDL—model TGA 100; Campbell Scientific, Inc., Logan, UT,
USA) to measure online 12
CO2 and 13
CO2 exchange. Isotope calibration consisted of a high and
low CO2 tank that spanned the expected range of [CO2] of each isotopologue for the LI-COR
reference and sample (Barbour et al., 2007; Stutz et al., 2017). The TDL cycled among
calibrations of the high and low CO2 tank along with the LI-COR reference and sample line
measuring for one minute at each site. However, only the last 10 seconds of data were used for
calculations via the TDL LI-COR processing package (Erhardt & Hanson, 2013) in R (R Core
Development Team, 2011). The TDL measures [12
CO2] and [13
CO2], so the net fluxes of each
were calculated as in normal gas exchange where total [CO2] is measured in the air supplied to
the leaf chamber and within the well-mixed leaf chamber.
The highest fully expanded leaf was placed in a large (80 cm2) clear toped, custom leaf
chamber with an RGB LED light source (LI-COR Biosciences) attached to a LI-6400 at 25ºC
(leaf temperature) and 380 mol mol-1
CO2 reference with the RGB light source set at 1600
mol quanta m-2
s-1
. The leaves were photographed, and projected leaf area was estimated using
ImageJ (US National Institutes of Health, Bethesda, MD, USA). The leaves fit width-wise in the
chamber but extended ~4-7 cm beyond the edge of the chamber. The petiole length was between
5 and 10 cm.
Once photosynthesis reached a steady state, the leaf was cut under water and the petiole
was placed in a 40 mmol l-1
KCl solution. Stomatal conductance and photosynthesis decreased
when the leaf was cut. The leaf remained in the KCl solution for ~30 minutes till the rate of
photosynthesis reached the rate before the leaf was cut. The KCl solution was swapped for 99%

80
13C sodium bicarbonate dissolved in 40 mmol l
-1 KCl at one of three [
13CO2
*]: 1.19 (low-
carbon—LC), 5.95 (medium-carbon—MC), or 11.9 mmol l-1
(high-carbon—HC). Individual
leaves were only provided a single [13
CO2*] (see Stutz et al., 2017). These concentrations span
the range of observed values for tree xylem inorganic carbon concentration (CO2 + HCO3-). In
the HC and MC treatments approximately 8 minutes after adding the 13
CO2* a small increase in
13CO2 efflux was observed with the TDL and the light on the LI-6400 was turned off. There was
no increase in 13
CO2 efflux under the LC treatment so the light was turned off after
approximately 10-15 minutes. Throughout the measurement period, the rate of transpiration was
manipulated by switching the LI-COR desiccant between full scrub (i.e., high VPD and higher
rates of transpiration) and full bypass (i.e., low VPD and lower rates of transpiration). To further
increase the relative humidity when the desiccant was on full bypass, a condensing tube in a
water bath (VWR Scientific products, West Chester, PA, USA) was attached to the LI-COR inlet
to decrease VPD to 0.5 kPa or less. The desiccant was left on full scrub or full bypass for
approximately one hour. The measurement cycle consisted of approximately 3-4 alternating dry
and wet periods. This procedure was used to gain the widest range of transpiration values
possible in the dark for comparisons of transpiration and 13
CO2 efflux. Each treatment consists
of five replicates.
Estimating the consumption rate of xylem-transported CO2 in the dark
The rate of consumption of xylem-transported CO2 was calculated according to Stutz et
al. (2017) by multiplying the rate of 12
C leaf respiration (12
CRL) by 1.1%, the natural abundance
of 13
CO2 in the atmosphere compared to 12
CO2 in the atmosphere (Girffis et al., 2004). We
calculated an expected 13
C efflux (13
Ccal efflux) that would occur if all the 13
CO2 added to the cut

81
leaf exited the leaf as 13
CO2. This was accomplished by multiplying the [13
CO2*] in the solution
fed to the leaves by the rate of transpiration and adding it to the background 13
CRL. We used the
ratio of observed 13
CO2 efflux (13
Cefflux) to 13
Ccal efflux to determine the fraction of supplied 13
CO2
exiting the leaf and expressed it as a percentage. We estimated the rate of consumption of
xylem-transported CO2 by taking the difference between the 13
Ccal efflux and observed 13
Cefflux.
For these calculations we assumed the transpiration rate along with the rate of 12
C and 13
C
effluxes were constant across one TDL/LI-COR cycle i.e. 4 minutes. We excluded the first 45
minutes after the light was turned off for these calculations to see that enzymes were deactivated
in the C3 species, Brassica napus but not fully deactivated in the C4 species A. hypochondriacus
and to allow the water in the leaf to be replaced with the water supplied to the petiole. Data from
B. napus were modified from Stutz et al. (2017).
Light-response curves
The highest fully expanded leaf was placed in a clear toped, 38.5 cm2, circular custom
leaf chamber made to fit an RGB LED light source (LI-COR Biosciences, Lincoln, NE, USA)
attached to a LI-6400 at 23ºC (leaf temperature), 380 mol mol-1
CO2 reference at 1600 mol
quanta m-2
s-1
. Leaves were left in the chamber for approximately 60 minutes before being cut
and placed in a 40 mmol l-1
KCl solution. The leaf remained in the KCl solution for ~30 minutes
till the rate of photosynthesis reached the rate before the leaf was cut. As with the dark efflux
measurements the KCl solution was swapped for 99% 13
C sodium bicarbonate dissolved in 40
mmol l-1
KCl at one of three [13
CO2*]: LC, MC, or HC. As with the dark efflux measurements,
an individual leaf was only provided a single [13
CO2*]. There was an additional treatment where
the cut leaves remained in the KCl solution instead of being transferred to a [13
CO2*] solution.

82
The light response curves were measured in the following order: 1600, 1300, 1000, 800, 500,
250, 200, 175, 150, 125, 100, 75, 50, 35, 0 mol quanta m-2
s-1
. Five measurements were made
at each irradiance except for the highest irradiance where we waited for the 13
CO2 efflux to level
out and only took the last five measurements for the averages. Five replicate leaves were
measured for each [13
CO2*] and KCl solutions. The measurements for B. napus are described in
Stutz (Chapter 3).
CO2-response curves
For the CO2-response curves, an attached leaf was placed in the same LI-6400 custom
leaf chamber as was used for the light-response curves at 23ºC (leaf temperature) at 1600 mol
quanta m-2
s-1
. The CO2 reference on the LI-6400 was set so the [CO2] at the leaf level was
approximately 400 mol mol-1
, which was between 500 and 650 mol mol-1
CO2 reference
[CO2]. As with the light-response curves, leaves were left in the chamber for approximately 60
minutes before being cut and placed in a 40 mmol l-1
KCl solution for ~30 minutes. The KCl
solution was swapped for 99% 13
C sodium bicarbonate (NaH13
CO3) dissolved in 40 mmol l-1
KCl at one of three [13
CO2*]: LC, MC, HC or remaining in the KCl solution for the
measurement. As with the light-response curves the individual leaves were only provided a
single [13
CO2*] or left in the 40 mmol l
-1 KCl solution according to Stutz et al. (2017). As with
the light-response curves, the leaf was left at the starting [CO2] till the 13
C and [13
CO2] reading
on the TDL stabilized approximately 20 to 30 minutes for each leaf. The [CO2] on the LI-6400
reference were applied to the leaf in the following order: starting [CO2], 200, 100, 50, 150, 300,
starting [CO2], 1000, 2000, 1500, 700 and starting [CO2]. The leaf was left at each [CO2] for
three cycles on the TDL except for the starting [CO2] where the leaf was left until it reached the

83
starting rate of photosynthesis. Following the CO2-response curve the light was turned off and
respiration was measured when the leaf had been in the dark for at least 30 minutes, to avoid
light enhanced dark respiration (LEDR). Fives leaves from each species were measured for each
[13
CO2*] and the KCl solution. The measurements for B. napus are described in Stutz (Chapter
3).
Estimating the amount of xylem-transported CO2 entering the cut leaves and rate of
consumption of xylem-transported CO2 in the light
The rate of xylem-transported CO2 consumption in the light in the Kranz-type C4 species,
A. hypochondriacus was calculated as:
𝐶𝑜𝑛𝑠𝑢𝑚𝑝𝑡𝑖𝑜𝑛 𝑖𝑛 𝑡ℎ𝑒 𝑙𝑖𝑔ℎ𝑡 = 𝑅𝑎𝑡𝑒 𝑜𝑓 𝐶𝑂2 𝑒𝑛𝑡𝑒𝑟𝑖𝑛𝑔 𝑙𝑒𝑎𝑓 − 𝐶𝑝𝑟𝑒𝑑 𝑙𝑖𝑔ℎ𝑡 𝑒𝑓𝑓𝑙𝑢𝑥1313 (Equation
1)
where, the rate of 13
CO2 entering the leaf is estimated based on the rate of transpiration
and the [13
CO2*] added to the cut leaf and where
13Cpred light efflux is the predicted rate of xylem
transported CO2 exiting the leaf in the absence of assimilation and is estimated from linear
regression models of xylem CO2 effluxes in the dark across the three different [13
CO2*] from the
first part of this study.
Statistical analyses
Analysis of covariance (ANCOVA) was used to compare slopes among [13
CO2*]
treatments in A. hypochondriacus, followed by Tukey post-hoc multiple comparisons of means
to determine which slopes were significantly different among the three treatments. The
percentage of xylem-transported CO2 exiting the leaf and the rate of consumption of xylem-

84
transported CO2 were compared between species, B. napus and A. hypochondriacus and among
treatments (LC, MC and HC) using a two-way analysis of variance (ANOVA) followed by
Tukey HSD post-hoc comparisons.
Linear mixed effects models were produced for the following variables: 12
Aobs,
consumption in the light, and photosynthetic discrimination (13
C) for both the light- and CO2-
response curves. The fixed effects were A. hypochondriacus and [13
CO2*] while the random
effects were irradiance and [CO2], for the light- and CO2-response curves, respectively. The
amount of xylem-transported CO2 entering the leaf and consumption in the light were compared
to the C3 species, B. napus, the fixed effects were species and [13
CO2*] while the random effects
were irradiance and [CO2], for the light- and CO2-response curves respectively. Results were
deemed significant at P<0.05. All statistical analyses were performed in R (version 3.4.2, R
Development Core Team 2012).
RESULTS
Retention and magnitude of xylem-transported CO2 in the dark
In the Kranz-type C4 species, Amaranthus hypochondriacus, rates of xylem-transported
CO2 dark efflux (13
Cefflux) increased with increasing rates of transpiration and [13
CO2*] (Fig. 1b).
There were significant differences between the low-carbon (LC) and high-carbon (HC)
treatments (P<0.001), however, there were no significant differences between the medium-
carbon (MC) and HC treatments (P=0.34), or between the LC and MC treatments (P=0.097).
The rate of leaf respiration (12
CRL) increased slightly with increasing rates of transpiration (Fig.
1a), but was not significantly different across the range of transpiration (P=0.05). When rates of
13Cefflux were compared to the herbaceous C3 species, Brassica napus following the light being

85
off for forty-five minutes rates of transpiration were similar between the two species but the rates
of 13
Cefflux were considerably lower in A. hypochondriacus compared to B. napus (Fig. 1c), in the
HC treatment.
When the 12
CRL and 13
Cefflux rate were compared at a single rate of transpiration, 0.75
mmol H2O m-2
s-1
, the rate of 12
CRL was ~1.4 mol CO2 m-2
s-1
across all [13
CO2*] (Fig. 2b) and
were not significantly different among [13
CO2*] (P=0.89). However, the rate of
13Cefflux
increased from ~0.015 mol CO2 m-2
s-1
in the LC treatment to ~0.04 mol CO2 m-2
s-1
in the
MC and HC treatments (Fig. 2a) there were no significant differences among rates of 13
Cefflux
across [13
CO2*] (P=0.08).
Xylem-transported CO2 that exited the leaf in the dark
The calculated amount of [13
CO2*] that entered the darkened leaf and subsequently exited
the leaf as CO2 in the dark was calculated following the first 90 minutes after turning off the light
across all [13
CO2*] in the dark for both B. napus and A. hypochondriacus. The percentage of
xylem-transported CO2 exiting the leaf in the dark increased with increasing [13
CO2*], in both
species (P<0.001) and was significantly different among [13
CO2*] (P<0.001). In the LC
treatment there was a significant difference in the percentage of xylem-transported CO2 that
exited cut A. hypochondriacus (~4%) compared to cut B. napus leaves (~8%) (P<0.001) (Fig. 3a,
b). There was also a significant difference in the percentage of xylem-transported CO2 that
exited the leaves in the MC treatment ~20% and ~21% in A. hypochondriacus and B. napus,
respectively (P<0.001). In A. hypochondriacus the percentage of xylem-transported CO2 exiting
the leaf was similar between the MC (~20%) and HC (~23%) but was significantly different

86
between the treatments (P<0.001) (Fig. 3a); however, the percentage of xylem-transported CO2
that exited the leaf in B. napus increased 43% going from the MC to HC treatment (P<0.001)..
The rate of consumption of xylem-transported CO2 was ~5 times higher in A.
hypochondriacus compared to B. napus across all [13
CO2*] and was significantly different
between species (P<0.001) and among [13
CO2*] (P<0.001) (Fig. 3c, d). In A. hypochondriacus
the estimated retention rate of xylem-transported CO2 was ~0.25 mol CO2 m-2
s-1
in the LC and
MC treatments and was ~0.20 mol CO2 m-2
s-1
in the HC treatment (Fig. 3c). The rate of
xylem-transported retention was significantly different among all [13
CO2*] (P<0.01). In B. napus
the rate of consumption of xylem-transported CO2 was ~0.02 mol CO2 m-2
s-1
in the LC
treatment and significantly different from the other [13
CO2*] treatments (P<0.001), but the rates
in the MC and HC treatments were similar ~0.06 mol CO2 m-2
s-1
and not significantly different
(P=0.99) (Fig. 3d).
Did xylem-transported CO2 reach the leaf in the light?
As expected, photosynthetic discrimination (13
C), in the KCl and LC treatments was
~4‰ under high irradiance and increased with decreasing irradiance to ~8‰ in the KCl
treatment and ~5‰ in the LC treatment (Fig. 4a). Before placing the cut leaf in the MC or HC
treatments 13
Cobs was ~4‰ (data not shown) but after placing the leaf in the [13
CO2*] solution
13
Cobs was ~49‰ and ~141‰ (Fig. 4c) under high irradiance in the MC and HC treatments,
respectively. As in the KCl and LC treatments, 13
Cobs increased with decreasing irradiance to
~107‰ and ~420‰ (Fig. 4c) at the lowest irradiance in the MC and HC treatments, respectively.
Based on 13
Cobs in the MC and HC treatments xylem-transported CO2 exited the leaf as 13
CO2.

87
However, there were no significant differences among treatments across irradiance (P=0.66) or
among [13
CO2*] (P=0.96).
In the CO2-response curves, 13
C in the KCl and LC treatments were ~4‰ under high
[CO2]; and increased to ~13‰ under the lowest [CO2] (Fig. 4b). There were no significant
differences between the LC and KCl treatments across any intercellular [CO2] in the CO2-
response curves. Photosynthetic discrimination in the MC and HC treatments was ~4‰ before
cutting the leaf (data not shown) but increased to ~90‰ in the MC and ~450‰ in the HC
treatment (Fig. 4d). The HC treatment was significantly different from the KCl, LC and MC
treatments (P<0.001) when intercellular [CO2] was less than 200 mol mol-1
. The MC and LC
treatments were only significantly different under the lowest intercellular [CO2] (P<0.05).
How much xylem-transported CO2 entered the leaf?
By knowing the rate of transpiration, and the concentration of [13
CO2*] added to a cut leaf
we were able to calculate how much xylem-transported CO2 entered the leaf in both the
herbaceous C3 species, B. napus, and the C4 A. hypochondriacus. Rates of xylem-transported
CO2 entering the leaf increased with increasing transpiration and increasing [13
CO2*] for both
species (Fig. 5). In the light-response curves the highest rates of xylem-transported CO2 entering
the leaf occurred when irradiance and stomatal conductance were high, this also coincided with
higher rates of carbon fixation in the light (13
Ax) (Fig. 6a, b). The highest rate of 13
CO2 entering
the leaf in A. hypochondriacus were ~0.07 mol CO2 m-2
s-1
, ~0.42 mol CO2 m-2
s-1
, and ~0.68
mol CO2 m-2
s-1
in the LC, MC and HC treatments, respectively (Fig. 5a). Rates of xylem-
transported CO2 entering the leaf was significantly different among treatments when irradiance
was greater than 500 mol quanta m-2
s-1
(P<0.001). In B. napus the highest rates of 13
CO2

88
entering the leaf were ~0.09 mol CO2 m-2
s-1
, ~0.52 mol CO2 m-2
s-1
and ~0.84 mol CO2 m-2
s-1
(Fig. 5c). The amount of xylem-transported CO2 entering the leaf was significantly different
between LC and HC treatments above the light compensation point (75 mol quanta m-2
s-1
);
when irradiance was above 800 mol quanta m-2
s-1
there were significant differences among all
[13
CO2*]. In A. hypochondriacus the highest rate of transpiration was ~3.5 mmol H2O m
-2 s
-1
across all [13
CO2*]; however in B. napus the highest rate of transpiration was ~4.5 mmol H2O m
-2
s-1
allowing more xylem-transported CO2 to enter the cut leaves of B. napus compared to A.
hypochondriacus. The amount of xylem-transported CO2 entering the cut leaves was
significantly different between the species in the MC and HC treatments across all irradiances
above the light compensation point (P<0.001); however, the LC treatment was not significantly
different between species across any irradiance.
In the CO2-response curves, for both species, rates of 13
CO2 entering the leaf were highest
when the rate of transpiration and stomatal conductance were highest (Fig. 5b, d). Rates of
13CO2 entering the leaf for A. hypochondriacus were ~0.08 mol CO2 m
-2 s
-1, ~0.40 mol CO2
m-2
s-1
, and ~0.58 mol CO2 m-2
s-1
, in the LC, MC and HC treatments, respectively. The
amount of 13
CO2 entering the leaf was significantly different in the LC treatment compared to the
MC and HC treatments across all intercellular [CO2] (P<0.05). The MC and HC treatments were
significantly different when the [CO2] was sub-saturating (P<0.001); however, these treatments
were not significantly different when [CO2] was saturating. Rates of 13
CO2 entering the leaf in
B. napus were ~0.06 mol CO2 m-2
s-1
, ~0.31 mol CO2 m-2
s-1
, and ~0.71 mol CO2 m-2
s-1
in
the LC, MC and HC treatments, respectively (Fig. 5d). The amount of xylem-transported CO2
entering the leaf in the LC treatment was significantly different from the MC and HC treatments
across all [CO2] (P<0.001). The amount of xylem-transported CO2 entering the leaf was

89
significantly different in the HC treatment between the species (P<0.01) but not significantly
different between the species in the LC treatment across any [13
CO2*].
Rates of 12
Aobs
Rates of assimilation using the 12
C isotope (12
Aobs) increased with increasing irradiance
across the KCl, LC, MC and HC treatments, the saturating rate of assimilation was ~22 mol
CO2 m-2
s-1
which occurred at an irradiance of 1600 mol quanta m-2
s-1
(Fig. 6c). There were no
significant differences among rates of 12
Aobs across the light-response curve in the four
treatments (P=0.84). As expected, in the CO2-response curves, rates of 12
Aobs increased with
increasing rates of intercellular [CO2] and saturated at an intercellular [CO2] of ~200 mol CO2
mol-1
at a rate of ~30 mol CO2 m-2
s-1
(Fig. 6d), there were no significant differences in 12
Aobs
among the four treatments (P=0.66).
Rates of carbon fixation in the light
Rates of carbon fixation in the light increased with increasing irradiance and [13
CO2*]
(Fig. 6a). Rates of carbon fixation were 0.05 mol CO2 m-2
s-1
, 0.24 mol CO2 m-2
s-1
, and 0.47
mol CO2 m-2
s-1
in the LC, MC, and HC treatment, respectively (Fig. 6a). The rate of
photosynthesis of 13
CO2 in the KCl treatment was and 0.30 mol CO2 m-2
s-1
(Fig. 6a). Rates of
carbon fixation were significantly different between the LC and HC treatments across all
irradiances (P<0.001) and all treatments were significantly different when irradiance was greater
than 800 mol quanta m-2
s-1
(P<0.001). The rate of 13
Aobs in the KCl treatment are 1.1% the
rate of 12
Aobs, the rate that would be expected based on the background [13
CO2] in the atmosphere
(Griffiths et al., 2004).

90
In the CO2-response curves, rates of 13
Aobs increased with increasing intercellular [CO2]
in the KCl treatment saturating at a rate of ~0.35 mol CO2 m-2
s-1
(Fig. 6b), again this rate was
~1.1% the rate of 12
Aobs. Rates of carbon fixation in the light increased with increasing [13
CO2*]
and were highest when intercellular [CO2] was low but decreased with increasing intercellular
[CO2] (Fig. 6b). The highest rates of non-Rubisco activity in the light were ~0.06 mol CO2 m-2
s-1
, ~0.23 mol CO2 m-2
s-1
, and ~0.4 mol CO2 m-2
s-1
in the LC, MC and HC treatments,
respectively. The decrease in non-Rubisco activity occurred when intercellular [CO2] was 200
mol mol-1
, which was near the CO2 saturation point for 12
Aobs (Fig. 6b). There were significant
differences in rates of carbon fixation in the light across [CO2] (P<0.05) and among [13
CO2*]
(P<0.001). The rates of carbon fixation in the light were significantly different between the LC
and MC treatments (P<0.01) across all [CO2].
DISCUSSION
Efflux of xylem-transported CO2 in the dark
Our method, of placing a cut leaf of the Kranz-type C4 species, Amaranthus
hypochondriacus, in a solution of [13
CO2*] in a LI-6400 leaf chamber coupled to a tunable diode
laser absorption spectroscope (TDL), allowed us to measure the rate of 13
CO2 efflux out of the
leaf in the dark among all [13
CO2*]. As with the herbaceous C3 species, Brassica napus, rates of
13Cefflux in A. hypochondriacus, were dependent upon the rate of transpiration and the [
13CO2
*],
with the highest rates of 13
Cefflux occurring when both the rate of transpiration and [13
CO2*] were
high (Fig. 1b). However, compared to B. napus (Stutz et al., 2017), rates of 13
Cefflux were ~1.5
and ~2 times lower when at the same rate of transpiration in A. hypochondriacus in the medium-
carbon (MC) and high-carbon (HC) treatments, respectively (Fig. 1b, c).

91
The highest percentage of xylem-transported CO2 that exited the leaf of A.
hypochondriacus was 30%, which occurred in the MC and HC treatments; while the highest
percentage of xylem-transported CO2 that exited the leaf in B. napus was 75%, which occurred
in the HC treatment (Fig. 3a, b). Stringer & Kimmerer (1993) and Stutz et al. (2017) observed
that ~83% of xylem-transported CO2 exited cut leaves of Populus deltoides in the dark. Rates of
xylem-transported CO2 consumption were higher in the Kranz-type C4 species (~0.25 mol CO2
m-2
s-1
) compared to B. napus (~0.08 mol CO2 m-2
s-1
), in the first 90 minutes after turning off
the light, indicating one of several possibilities: 1) it takes longer and there are more
photosynthetic enzymes to be deactivated in the dark in A. hypochondriacus, 2) lower stomatal
conductance in A. hypochondriacus which lead to lower efflux of xylem-transported CO2
entering and exiting the leaf, or 3) Kranz anatomy prevented xylem-transported CO2 from exiting
the leaf.
Following deactivation of photosynthetic enzymes, 90 to 120 minutes in C4 species and
30 to 60 minutes in C3 species (Rajagopalan et al., 1993), the rate of consumption of xylem-
transported CO2 should decrease. Rates of xylem-transported CO2 consumption in the dark were
similar between B. napus (~0.07 mol CO2 m-2
s-1
) and A. hypochondriacus (~0.07 mol CO2 m-
2 s
-1) when rates of xylem-transported CO2 consumption were averaged following the light being
turned off for at least 120 minutes; indicating that deactivation of PEPC took longer in the C4
species but once PEPC was deactivated the consumption rate of xylem-transported CO2 were
similar between the C3 and C4 species. Additionally, Alanso-Cantabrana & von Caemmerer
(2016) found in vitro PEPC activities were 32 times higher in Flaveria bidentis (C4 species)
compared to F. pringlei (C3 species). It is likely that a combination of the quantity of PEPC and

92
the time to deactivate PEPC in the Kranz-type C4 species that caused the higher consumption of
xylem-transported CO2 observed in A. hypochondriacus compared to B. napus in the dark.
Another possibility for why A. hypochondriacus has a lower 13
Cefflux compared to B.
napus could be stomatal conductance in the dark. In B. napus and A. hypochondriacus stomatal
conductance was ~0.5 mol H2O m-2
s-1
before cutting the leaf. When the light was turned off
stomatal conductance dropped in B. napus to between ~0.01 mol H2O m-2
s-1
and ~0.02 mol H2O
m-2
s-1
(data not shown) and remained at these conditions throughout the experiment. However,
when the A. hypochondriacus leaf was cut stomatal conductance declined to ~0.1 mol H2O m-2
s-
1 before the light was turned off; but once the light was turned off stomatal conductance declined
to ~0.008 mol H2O m-2
s-1
within an hour (data not shown). The low stomatal conductance in the
dark observed in A. hypochondriacus may have contributed to the low amount of xylem-
transported CO2 that exited the leaf in the dark. Snyder et al. (2003) observed that stomatal
conductance at night was between 0.012 mmol H2O m-2
s-1
and 0.025 mmol H2O m-2
s-1
in two
Kranz-type C4 Atriplex shrubs and a Kranz-type C4 grass in a warm desert habitat. However, in
the same location stomatal conductance was higher in the C3 species 0.1 mmol H2O m-2
s-1
compared to the C4 species. The dark stomatal conductance we observed in A. hypochondriacus
was considerably lower than stomatal conductance on attached leaves from closely related C4
species. Possibly the low stomatal conductance observed in our experiment is the result of
cutting the leaf. Recent work shows night stomatal conductance and rates of dark transpiration
are higher than previously thought in both C3 and C4 species (Caird et al., 2007; Resco de Dios et
al. 2015). However, a third possibility is that Kranz anatomy impedes the flow of xylem-
transported CO2 out of the leaf.

93
In Kranz-type C4 species the vascular bundle is surrounded by a ring of bundle-sheath
cells which are surrounded by a ring of mesophyll cells. If xylem-transported CO2 travels
symplastically through the plasmodesmata or plasma membrane then the CO2 has the potential to
interact with enzymes located in the mesophyll and bundle-sheath cells. Instead, if water travels
apoplastically, it will not have an opportunity to interact with the cellular enzymes. When rates
of transpiration are compared between A. hypochondriacus and B. napus 45 minutes after turning
off the light, rates of transpiration are similar between the two species but the efflux of xylem-
transported CO2 is two times greater in B. napus compared to A. hypochondriacus (Fig 1c),
indicating that it is likely Kranz anatomy and not stomatal conductance or deactivation of
photosynthetic enzymes in the dark that is responsible for the lower rate of 13
Cefflux observed in
A. hypochondriacus in the dark.
Did the Kranz-type C4 plant use xylem-transported CO2 for photosynthesis?
Our method, of placing a cut Kranz-type C4 leaf in a solution of [13
CO2*] in a LI-6400
leaf chamber coupled to a TDL, allowed us to estimate how much xylem-transported CO2 was
used for carbon fixation in the light. Little if any xylem-transported CO2 exited the leaf in the
light; however, it is impossible to know if xylem-transported CO2 was captured by Rubisco or
PEPC. Photosynthetic discrimination confirms that little if any xylem-transported CO2 exited
the leaf in the low-carbon (LC) treatment in either the light- or CO2-response curves (Fig. 4a, b).
However, some xylem-transported CO2 exited the leaf in the MC and HC treatments as
evidenced by the high 13
C values observed in both the light- and CO2-response curves (Fig. 4c,
d).

94
We know the rate of transpiration, which allows us to calculate the amount of [13
CO2*]
entering the cut leaf for both B. napus and A. hypochondriacus (Fig. 5). As expected, the rate of
xylem-transported CO2 entering the leaf was dependent upon the rate of transpiration and
[13
CO2*] for both species. Since rates of transpiration were higher in B. napus compared to A.
hypochondriacus the rate of xylem-transported CO2 entering the leaf was also higher (Fig. 5);
however, we detected little xylem-transported CO2 exiting the leaf of A. hypochondriacus in the
light but a large amount of xylem-transported CO2 exiting B. napus in the light indicating that
the capacity for B. napus to utilize xylem-transported CO2 is lower than the capacity for A.
hypochondriacus. If none of the xylem-transported CO2 that enters the leaf exits the leaf then
xylem-transported CO2 is consumed by enzymes in the light. Little if any xylem-transported
CO2 exited the leaves of A. hypochondriacus in the LC treatment (Fig. 4) indicating that all
added xylem-transported CO2 was used for photosynthesis; however, it is impossible to detect if
the xylem-transported CO2 was captured by Rubisco or PEPC. In the MC and HC treatments
13
C indicates that some xylem-transported CO2 exited the leaf, however, based on calculations
using data from the TDL the efflux of xylem-transported CO2 was minimal in both the MC and
HC treatments.
Concentrations of CO2 are high in stems of trees (Teskey et al., 2008), yet prior work has
shown that little of the xylem-transported CO2 is used for photosynthesis compared to what is
available (Bloemen et al., 2013a). Our data show that this is not the same for Kranz-type C4
plants, especially at lower concentrations. We found it was hard to detect any efflux of xylem-
transported CO2 from A. hypochondriacus such that labeled leaves in the LC treatment had
photosynthetic discrimination values which are identical to the KCl control. However, in the
MC and HC treatments 13
C values are different from the KCl values indicating that some

95
xylem-transported CO2 exited the leaves. Compared to B. napus very little xylem-transported
CO2 exited the Kranz-type C4 leaf.
In order for xylem-transported CO2 to exit the leaf of the Kranz-type C4 plant CO2 must
exit the vascular bundle and then exit through the ring of bundle-sheath and mesophyll cells.
The water with the dissolved CO2 has three possibilities for exiting the leaf: 1) traveling
apoplastically, traveling along the cells walls, 2) traveling symplastically, crossing the plasma
membrane of the cell, or 3) traveling in gas phase (Buckley, 2015). While it was traditionally
thought that water traveled apoplastically (Strugger, 1943); recent work has shown the existence
of aquaporins (Chrispeels & Agre, 1994) and tracer studies show the accumulation of a tracer at
the proximal margins of living cells and the xylem (Canny, 1986, 1990) indicating that water
may move symplastically through cells. Aquaporins allow water, CO2 and other small
uncharged molecules to quickly and easily pass through membranes (Uehlein et al., 2003; Flexas
et al., 2006; Maurel et al., 2008; Sade et al., 2013). In order for water to move symplastically it
must cross two sets of membranes per cell as well as diffuse through the cytoplasm of the cell
(Buckley, 2015). However, if water traveled out of the xylem and symplastically into the
bundle-sheath cells it will likely add to the high concentration of CO2 around Rubisco or it could
travel apoplastically through the layer of bundle-sheath cells and be carboxylated by PEPC in the
mesophyll cell and travel into to the bundle-sheath cell as a C4 acids. If water with dissolved
xylem-transported CO2 traveled symplastically through the cells then very little xylem-
transported CO2 would exit the leaf and a high percentage of xylem-transported CO2 would be
used for photosynthesis but not be detected with our TDL technique. If water with dissolved
CO2 traveled apoplastically through the leaf before reaching the intercellular air spaces where the
water will evaporate and either the CO2 will move out of solution and remain in the intercellular

96
air space or exit the leaf as CO2. A third possibility is that water will enter the gas phase
between the bundle-sheath cell and xylem interphase and then enter the leaf in the vapor phase.
If this was the case then the CO2 would also be in gas phase and would either be captured in the
bundle-sheath cells or mesophyll cells or exit the leaf as CO2. Buckley (2015), in modeling the
three possibilities of water movement through the leaf concluded that most of the water traveled
apoplastically through the leaf. Based on how little xylem-transported CO2 exited the Kranz-
type C4 leaf it appears that much of the water could have traveled symplastically through the
leaf. However, our method does not allow us to determine how water with dissolved CO2
traveled through a leaf and the only conclusion that can be drawn is that most xylem-transported
CO2 was captured and used for carbon fixation.
Significance for the evolution to C4 photosynthesis?
C4 photosynthesis is spread across 19 plants families reflecting 61 independent origins
(Sage, 2016) in both eudicots and monocots. In order for C4 photosynthesis to work a separation
of enzymes is required. Separation of C3 and C4 enzymes occurs in one of two ways: 1) Kranz-
type C4 plants that separate Rubisco and PEPC into two distinct cells, bundle-sheath and
mesophyll respectively, termed Kranz anatomy (Edwards et al., 2004) or 2) single-cell C4 plants
that use a single-cell with partitions for C3 and C4 enzymes (Voznesenskaya et al., 2001;
Edwards et al., 2004). Both anatomical types of C4 photosynthesis effectively concentrate CO2
around Rubisco while reducing rates of photorespiration. In Kranz-type C4 plants the bundle-
sheath cells have low conductance to CO2 (high resistance to CO2 diffusion and low ). Several
anatomical features are required to advance to Kranz-type C4 photosynthesis such as increased
vein densities, and enhancement of bundle-sheath organelles in addition to the biochemical

97
requirements such as photorespiratory CO2 pumps and increased PEPC activity before the finial
optimization can occur (Monson, 1999; Sage, 2004). While increasing vein densities may only
increase structural integrity or enhance leaf water status (Sage, 2004) it may also allow xylem-
transported CO2 to be utilized for photosynthesis by reducing the distance between vascular
bundles and photosynthetic cells. Many C3 and intermediate C3-C4 species have developed
Kranz anatomy with closely spaced veins and development of bundle-sheath cells which may
provide these plants an advantage that was previously overlooked, the ability to utilize and
recycle xylem-transported CO2 for leaf photosynthesis.
CONCLUSION
Our technique, of using an LI-6400 coupled to a TDL, allowed us to measure the efflux
of xylem-transported CO2 out of cut leaves in the Kranz-type C4 species, Amaranthus
hypochondriacus in the dark. Rates of 13
Cefflux in the dark increased with increasing rates of
transpiration and [13
CO2*], however, when compared to a herbaceous C3 species, Brassica napus,
rates of 13
Cefflux were lower in A. hypochondriacus when compared at the same rates of
transpiration and [13
CO2*] indicating that leaf anatomy or enzymatic activity in the dark was
decreasing the flux of xylem-transported CO2 out of the leaf. Because of the high carbon
fixation in the dark, we cannot prove that carbon fixation in the light utilized the full C4 cycle,
though we think it is likely as even less xylem-transported CO2 exited the leaf in the light. Since
the amount of xylem-transported CO2 that entered the leaf was dependent upon the rate of
transpiration and [13
CO2*], more
13C entered the leaf in the light, but less than in B. napus.
However, the low efflux rate of xylem-transported CO2 means that leaves of A. hypochondriacus

98
likely use more of it. Potentially Kranz anatomy is one way C4 species are able to increase
photosynthetic efficiency over their C3 counterparts.
ACKNOWLDEGEMENTS
Wes Noe, Andrea McArdle, Joy Avritt and Lindsey Kaufman for greenhouse and plant
maintenance. This research was supported in part by instrumentation obtained (TDL) through
NSF funding (IOS 0719118). Additional support was provided by the University of New
Mexico and the NSF EPSCoR Program under Award #IIA-1301346 (New Mexico). Source for
the B. napus seeds (J. Chris Pires, University of Missouri-Columbia). Support for SSS was
provided by the Dr. Harry Wayne Springfield Fellowship through the Department of Biology,
University of New Mexico. Any opinions, finding, and conclusions or recommendations
expressed in this material are those of the author(s) and do not necessarily reflect the views of
the National Science Foundation or the US NIH.
AUTHOR CONTRIBUTIONS
S.S.S. performed experiments and analyzed data. D.T.H. provided conceptual framework.
S.S.S. and D.T.H. wrote the manuscript.
REFERENCES Alonso-Cantabrana H, von Caemmerer S. 2016. Carbon isotope discrimination as a
diagonostic tool for C4 photosynthesis in C3-C4 intermediate species. Journal of Experimental
Botany 67: 3109-3121.
Barbour MM, McDowell NG, Tcherkez G, Bickford CP, Hanson DT. 2007. A new
measurement technique reveals rapid post-illumination changes in the carbon isotope
composition of leaf-respired CO2. Plant, Cell & Environment 30: 469-482.
Bloemen J, McGuire MA, Aubrey DP, Teskey RO, Steppe K. 2013a. Transport of root-
respired CO2 via the transpiration stream affects aboveground carbon assimilation and CO2
efflux in trees. New Phytologist 197: 555-565.

99
Bloemen J, McGuire MA, Aubrey DP, Teskey RO, Steppe K. 2013b. Assimilation of xylem-
transported CO2 is dependent on transpiration rate but small relative to atmospheric fixation.
Journal of Experimental Botany 64: 2129-2138.
Bloemen J, Bauweraerts I, De Vos F, Vanhove C, Vandenberghe S, Boeckx P, Steppe K.
2015. Fate of xylem-transported 11
C- and 13
C-labeled CO2 in leaves of poplar. Physiologia
Plantarum 153: 555-564.
Buckley TN. 2015. The contributions of apoplastic, symplastic and gas phase pathways for
water transport outside the bundle sheath in leaves. Plant, Cell & Environment 38: 7-22.
von Caemmerer S, Furbank RT. 2003. The C4 pathway: an efficient CO2 pump.
Photosynthesis Research 77: 191-207.
Caird MA, Richards JH, Donovan LA. 2007. Nighttime stomatal conductance and
transpiration in C3 and C4 plants. Plant Physiology 143: 4-10.
Canny M. 1986. Water pathways in wheat leaves. III. The passage of the mestome sheath and
the function of the suberized lamellae. Physiologia Plantarum 66: 637-647.
Canny M. 1990. What becomes of the transpiration stream? New Phytologist 114: 341-368.
Chrispeels MJ, Agre P. 1994. Aquaporins: water channel proteins of plant and animal cells.
Trends in Biochemical Sciences 19: 421-425.
Erhardt EB, Hanson DT. 2013. Tdllicor: TDL/Licor processing. R package version 0.1-22.
Edwards GE, Franceschi VR, Voznesenskaya EV. 2004. Single cell C4 photosynthesis
versus the dual-cell (Kranz) paradigm. Annual Review of Plant Biology 55: 173-196.
Farquhar GD. 1983. On the nature of carbon isotope discrimination in C4 species. Australian
Journal of Plant Physiology 10: 205-226.
Flexas J, Ribas-Carbo M, Hanson DT, Bota J, Otto B, Cifre J, McDowell N, Medrano H,
Kaldenhoff R. 2006. Tobacco aquaporin NtAQP1 is involved in mesophyll conductance to CO2
in vivo. Plant Journal 48: 427-439.
Griffis T, Baker J, Sargent S, Tanner B, Zhang J. 2004. Measuring field-scale isotopic
fluxes with tunable diode laser absorption spectroscopy and micrometeorological techniques.
Agricultural and Forest Meterology 124: 15-29.
Hatch MD. 1987. C4 photosynthesis—a unique blend of modified biochemistry, anatomy and
ultrastructure. Biochimica et Biophysica Acta 895: 81-106.

100
Hatch MD, Agostino A, Jenkins CLD. 1995. Measurement of the leakage of CO2 from
bundle-sheath cells of leaves during C4 photosynthesis. Plant Physiology 108: 173-181.
Hatch MD, Slack CR, Johnson HS. 1967. Further studies on a new pathway of photosynthetic
carbon dioxide fixation in sugarcane and its occurrence in other plant species. Biochemical
Journal 102: 417-422.
Kanai R, Edwards GE. 1999. The biochemistry of C4 photosynthesis in: Sage RF, Monson
RK, eds. C4 plant biology. London: Academic Press, 49-87.
Maurel C, Verdoueq L, Luu DT, Santoni V. 2008. Plant aquaporins: membrane channels
with multiple integrated functions. Annual Review of Plant Biology 59: 595-624.
McGuire MA, Marshall JD, Teskey RO. 2009. Assimilation of xylem-transported 13
C-
labelled CO2 in leaves and branches of sycamore (Platanus occidentalis L.). Journal of
Experimental Botany 60: 3809-3817.
Monson RK. 1999. The origins of C4 genes and evolutionary pattern in the C4 metabolic
phenotype. In Sage RF, Monson RK, eds. C4 plant biology. San Diego, CA, USA: Academic
Press, 377-410.
R Core Development Team. 2012. R: A language and environment for statistical computing.
Vienna, Austria: Ro Foundation for Statistical Computing. ISBN 3-900051-0700. Aviailable at:
http://www.R-project.org (Accessed 19 August 2012).
Rajagopalan AV, Devi MT, Raghavendra AS. 1993. Patterns of phosphoenolpyruvate
carboxylase activity and cytosolic pH during light activation and dark deactivation in C3 and C4
plants. Photosynthesis Research 38: 51-60.
Resco de Dios V, Roy J, Ferrio JP, Alday JG, Landais D, Milcu A, Gessler A. 2015. Processes driving nocturnal transpiration and implications for estimating land evapotranspiration.
Scientific Reports 5: 10975.
Sade N, Galle A, Flexas J, Lerner S, Peleg G, Yaaran A, Moshelion M. 2013. Differential
tissue-specific expression of NtAQP1 in Arabidopsis thaliana reveals a role for this protein in
stomatal and mesophyll conductance of CO2 under standard and salt-stress conditions. Planta
239: 357-366.
Sage RF. 2004. The evolution of C4 photosynthesis. New Phytologist 161: 341-370.
Sage RF. 2016. A portrait of the C4 photosynthetic family on the 50th
anniversary of its
discovery: species number, evolutionary lineages, and Hall of Fame. Journal of Experimental
Botany 67: 4039-4056.
Snyder KA, Richards JH, Donovan LA. 2003. Night-time conductance in C3 and C4 species:
do plants lose water at night? Journal of Experimental Botany 54: 861-865.

101
Stringer JW, Kimmerer TW. 1993. Refixation of xylem sap CO2 in Populus deltoides.
Physiologia Plantarum 89: 243-251.
Strugger S. 1943. Der aufsteigende Saftstrom in der Pflanze. Naturwisenschaft 31: 181-191.
Stutz SS, Anderson J, Zulick R, Hanson DT. 2017. Inside out: efflux of carbon dioxide from
leaves represents more than leaf metabolism. Journal of Experimental Botany 68: 2849-2857.
Teskey RO, McGuire MA. 2002. Carbon dioxide transport in xylem causes errors in estimation
of rates of respiration in stems and branches of trees. Plant, Cell and Environment 25: 1571-
1577.
Teskey RO, Saveyn A, Steppe K, McGuire MA. 2008. Origin, fate and significance of CO2 in
tree stems. New Phytologist 177: 17-32.
Ubierna N, Sun W, Cousins AB. 2011. The efficiency of C4 photosynthesis under low light
conditions: assumptions and calculations with CO2 isotope discrimination. Journal of
Experimental Botany 62: 3119-3134.
Uehlein, Lovisolo C, Siefritz F, Kaldenhoff R. 2003. The tobacco aquaporin NtAQP1 is a
membrane CO2 pore with physiological functions. Nature 425: 734-737.
Voznesenskaya EV, Franceschi VR, Kiirats O, Freitag H, Edwards GE. 2001. Kranz
anatomy is not essential for terrestrial C4 plant photosynthesis. Nature 414: 543-546.
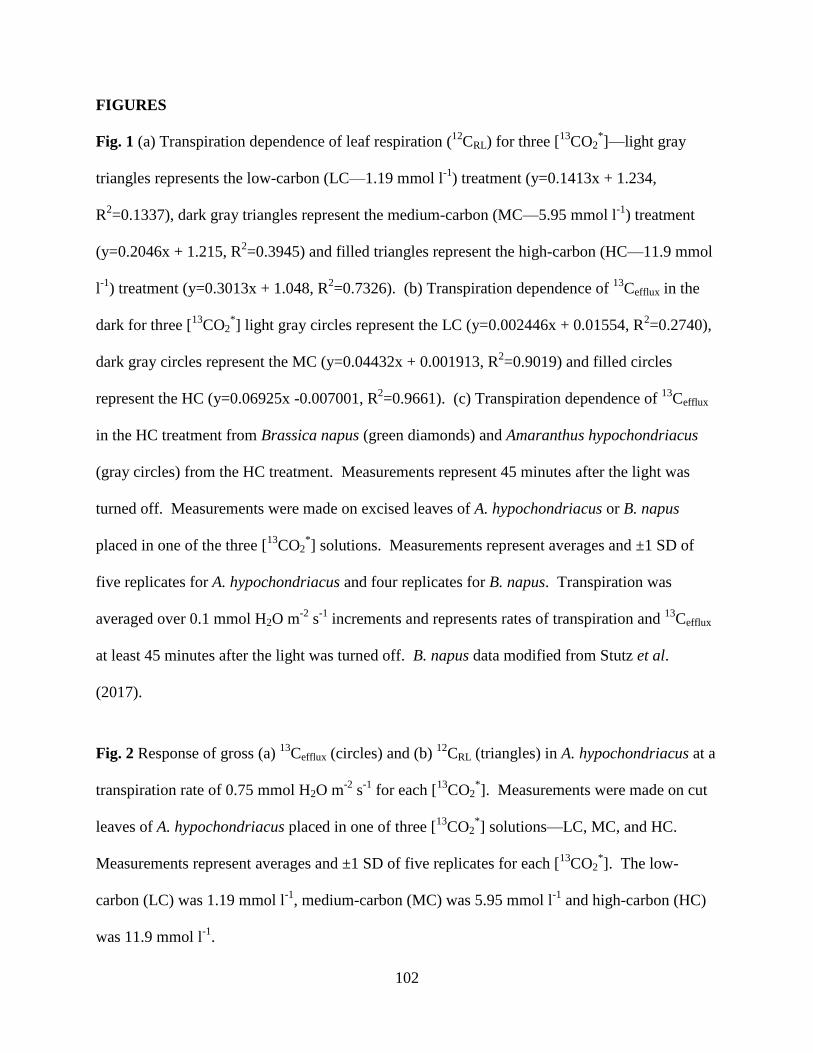
102
FIGURES
Fig. 1 (a) Transpiration dependence of leaf respiration (12
CRL) for three [13
CO2*]—light gray
triangles represents the low-carbon (LC—1.19 mmol l-1
) treatment (y=0.1413x + 1.234,
R2=0.1337), dark gray triangles represent the medium-carbon (MC—5.95 mmol l
-1) treatment
(y=0.2046x + 1.215, R2=0.3945) and filled triangles represent the high-carbon (HC—11.9 mmol
l-1
) treatment (y=0.3013x + 1.048, R2=0.7326). (b) Transpiration dependence of
13Cefflux in the
dark for three [13
CO2*] light gray circles represent the LC (y=0.002446x + 0.01554, R
2=0.2740),
dark gray circles represent the MC (y=0.04432x + 0.001913, R2=0.9019) and filled circles
represent the HC (y=0.06925x -0.007001, R2=0.9661). (c) Transpiration dependence of
13Cefflux
in the HC treatment from Brassica napus (green diamonds) and Amaranthus hypochondriacus
(gray circles) from the HC treatment. Measurements represent 45 minutes after the light was
turned off. Measurements were made on excised leaves of A. hypochondriacus or B. napus
placed in one of the three [13
CO2*] solutions. Measurements represent averages and ±1 SD of
five replicates for A. hypochondriacus and four replicates for B. napus. Transpiration was
averaged over 0.1 mmol H2O m-2
s-1
increments and represents rates of transpiration and 13
Cefflux
at least 45 minutes after the light was turned off. B. napus data modified from Stutz et al.
(2017).
Fig. 2 Response of gross (a) 13
Cefflux (circles) and (b) 12
CRL (triangles) in A. hypochondriacus at a
transpiration rate of 0.75 mmol H2O m-2
s-1
for each [13
CO2*]. Measurements were made on cut
leaves of A. hypochondriacus placed in one of three [13
CO2*] solutions—LC, MC, and HC.
Measurements represent averages and ±1 SD of five replicates for each [13
CO2*]. The low-
carbon (LC) was 1.19 mmol l-1
, medium-carbon (MC) was 5.95 mmol l-1
and high-carbon (HC)
was 11.9 mmol l-1
.

103
Fig. 3 The percentage of gross xylem-transported 13
CO2 exiting the leaf in the transpiration
stream in (a) A. hypochondriacus and (b) Brassica napus across three [13
CO2*] averaged over the
first 90 minutes after turning off the light. Estimated rates xylem-transported 13
CO2 consumption
in cut leaves of (c) A. hypochondriacus and (d) B. napus across three [13
CO2*] averaged over the
first 90 minutes after turning off the light. Measurements represent averages and ±1 SD of five
replicates for A. hypochondriacus and four replicates for B. napus made on cut leaves under the
following concentrations: LC, MC, and HC. The low-carbon (LC) was 1.19 mmol l-1
, medium-
carbon (MC) was 5.95 mmol l-1
and high-carbon (HC) was 11.9 mmol l-1
. B. napus data
modified from Stutz et al. (2017).
Fig. 4 Photosynthetic discrimination (13
C) across (a,c) light- and (b, d) CO2-response curves in
Amaranthus hypochondriacus. Light-response curves (a) KCl control (open diamonds) and LC
(light gray diamonds) and (c) MC (dark gray diamonds) and HC (filled diamonds) treatments.
CO2-response curves (b) KCl control (open diamonds) and LC (light gray diamonds) and (d) MC
(dark gray diamonds) and HC (filled diamonds) treatments. Measurements represent means and
±1 SD of five replicates for each treatment on cut leaves of A. hypochondriacus. The low-carbon
(LC) was 1.19 mmol l-1
, medium-carbon (MC) was 5.95 mmol l-1
and high-carbon (HC) was
11.9 mmol l-1
.
Fig. 5 Calculated rates of 13
CO2 entering cut leaves of the (a, b) C4 species A. hypochondriacus
and (c, d) the C3 species B. napus in (a, c) light- and (b, d) CO2-response curves. LC (light gray
diamonds), MC (dark gray diamonds) and HC (closed diamonds) for both species.
Measurements represent means and ±1 SD of five replicates for each treatment in A.

104
hypochondriacus and B. napus. The low-carbon (LC) was 1.19 mmol l-1
, medium-carbon (MC)
was 5.95 mmol l-1
and high-carbon (HC) was 11.9 mmol l-1
.
Fig. 6 Light- and CO2-response curves for rates of photosynthesis with (a, b) 13
Carbon (13
Ax—
photosynthesis using xylem-transported CO2, or background rates of 13
Aobs in KCl treatment)
and (c, d) 13
Carbon (12
Aobs—photosynthesis CO2 derived from the atmosphere). 13
Ax in A.
hypochondriacus KCl (open circles), LC (light gray circles), MC (dark gray circles) and HC
(closed circles) and 12
Aobs for A. hypochondriacus, for KCl (open triangles), LC (light gray
triangles), MC (dark gray triangles) and HC (closed triangles). Measurements represent means
and ±1 SD of five replicates for each treatment. The low-carbon (LC) was 1.19 mmol l-1
,
medium-carbon (MC) was 5.95 mmol l-1
and high-carbon (HC) was 11.9 mmol l-1
.

105
FIGURE 1

106
FIGURE 2

107
FIGURE 3

108
FIGURE 4

109
FIGURE 5

110
FIGURE 6

111
Chapter 5
Conclusions
The aims of this study were to utilize a novel method that couples a tunable diode
absorption spectroscope (TDL) to a portable photosynthesis machine (LI-6400) to
explore: 1) how much xylem-transported CO2 effluxes through cut leaves in the dark, 2)
how much xylem-transported CO2 is used for photosynthesis and 3) how much xylem-
transported CO2 effluxes out of a leaf in the light in a woody and herbaceous C3 species
and Kranz-type C4 species. Previous methods for measuring rates of xylem-transported
CO2 assimilation have utilized radioactive or stable isotopes. However, these methods
only allow measurements of xylem-transported CO2 assimilation at discrete time points;
require complete destruction of the tissues, followed by lengthy work to determine how
much xylem-transported CO2 is incorporated into plant tissues. Using a LI-6400 coupled
to a TDL allows for real-time measurements of respiration (chapters 2 and 4) or
assimilation (chapters 3 and 4) for both 12
CO2 and 13
CO2. In this study, the petiole of a
cut leaf was placed in a solution of 13
C sodium bicarbonate dissolved in potassium
chloride to simulate uptake and utilization of xylem-transported CO2. However, with
leaf, branch and stem chambers it would be possible to measure rates of xylem-
transported CO2 assimilation and efflux across an entire plant using non-destructive
techniques.
In the dark, the efflux of xylem-transported CO2 was greatest when both the rate
of transpiration and [13
CO2*] were high. Despite differences in leaf and stem anatomies
the efflux of xylem-transported CO2 assimilation was similar between the woody and
herbaceous C3 species; but it was lower in the Kranz-type C4 species. However, several

112
unknowns still exist, such as stem [CO2] across the height of woody and herbaceous
plants and how branch CO2 concentrations with attached leaves compare to the
concentration of CO2 in stems.
The LI-6400 coupled to the TDL can also be used to estimate rates of
consumption of xylem-transported CO2 in the dark. By knowing how much CO2 is
supplied to the leaf along with the rate of CO2 entering and exiting the leaf it is possible
to estimate how much xylem-transported CO2 is consumed by enzymes in the dark.
Rates of consumption of xylem-transported CO2 were similar between the C3 species;
however, the rate of consumption was higher in the Kranz-type C4 species following
turning off the light. These differences are likely a result of the higher concentrations and
slower deactivation of phosphoenolpyruvate carboxylase (PEPC). Enzyme assays could
be used to determine the concentrations of PEPC in the C3 and C4 species and activity of
PEPC going from illumination to darkness in C3 and C4 plants.
In the light, the flux of atmospheric CO2 entering the leaf and the efflux of CO2
generated from mitochondrial respiration are coupled with the addition of xylem-
transported CO2 entering the leaf with the water stream. In the C3 species, rates of
photosynthesis using xylem-transported CO2 were highest when the intercellular CO2
concentration was lowest, which occurred under high irradiance and low CO2
concentrations in the light- and CO2-response curves, respectively. However, in the
Kranz-type C4 species, it was only possible to determine how much xylem-transported
CO2 entered the leaf and estimate how much of the xylem-transported CO2 would be used
in the dark and equate that to enzymatic processes occurring in the light. Despite
differences in leaf structure and petiole anatomy the woody and herbaceous C3 species

113
had similar rates of assimilation using xylem-transported CO2. However, it is likely that
Kranz anatomy increased rates of xylem-transported CO2 assimilation in the C4 species
compared to the C3 species.
In the C3 species, the highest rates of 13
Clight efflux occurred when rates of
transpiration were highest, which coincided with the highest rates of xylem-transported
CO2 assimilation. However, very little xylem-transported CO2 exited the Kranz-type C4
leaf in the light compared to what exited the leaf in the dark. Kranz anatomy maybe
another way C4 species are able to increase photosynthetic efficiency over their C3
counter parts. The first way to test this would be to label Kranz-type C4 leaves with 14
C
xylem-transported CO2, collect the efflux and radiograph a labeled leaf to see how much
xylem-transported CO2 exited or remained in the leaf. Another way to test the influence
of Kranz anatomy on xylem-transported CO2 would be to use the single-cell C4 species
Suaeda aralocaspica. In Suada anatomy, the vascular bundles surround water storage
cells which are surrounded by photosynthetic cells. However, both ribulose-1,5-
bisphosphate-carboxylase/oxygenase (Rubisco) and PEPC are located in the same cell,
with Rubisco located in the proximal and PEPC located in the distal end of the cell thus
eliminating Kranz anatomy, but as in Kranz anatomy, xylem-transported CO2 would first
interact with Rubisco before interacting with PEPC.
The first project demonstrated that xylem-transported CO2 effluxes from cut
leaves of a woody and herbaceous C3 species with different leaf anatomies, as well as
Kranz-type C4 species; however the rates of 13
CO2 efflux were lower in Kranz-type C4
species compared to both C3 species. Rates of 13
CO2 efflux in the dark, assuming low
rates of transpiration and low [CO2*], are just over 1.5% of the rate respiration in the C3
114
species. While this efflux is small on the scale of an individual leaf, when scaling to
include all the trees on Earth it may have a profound impact on models for the global
carbon cycle. The second project demonstrated that the contribution of xylem-
transported CO2 to total photosynthesis in C3 plants is considerably smaller than the
contribution of atmospheric CO2 to photosynthesis; however, xylem-transported CO2
maybe like compound interest in a bank account. The amount of xylem-transported CO2
that the plant uses is small at any given time but through time the contribution of xylem-
transported CO2 to total assimilation will be significant. The addition of xylem-
transported CO2 to photosynthesis may allow a plant to grow more in a season, allow a
plant to produce more seeds or use the fixed carbon for respiration. The second project
was also able to measure the efflux of xylem-transported CO2 in the light. This efflux
was small but should be explored more to assess the implications for modeling rates of
respiration in the light. The third project demonstrated that Kranz-type C4 plants likely
use almost all xylem-transported CO2 for photosynthesis. It is possible to determine how
much xylem-transported CO2 entered the Kranz-type C4 leaves; however, little if any
xylem-transported CO2 exited the leaf indicating that nearly all of the xylem-transported
CO2 remained in the leaf. Kranz anatomy maybe another way C4 plants are able to
increase their carbon and water use efficiency over their C3 counterparts.
Future work on xylem-transported CO2 must determine the branch [CO2] near
attached leaves to determine how much xylem-transported CO2 reaches leaves in the light
and dark. This measurement has implications for understanding how xylem-transported
CO2 contributes to global models of leaf respiration and photosynthesis along with
implications for understanding and improving global carbon models to understand the

115
responses of respiration and photosynthesis to climate change. Xylem-transported CO2
has not previously been studied in C4 species but many important agricultural crops such
as maize, sugarcane, and sorghum are C4 species. Understanding how Kranz-type C4
plants improve their water and carbon use efficiency over C3 plants has implications for
improving photosynthesis in both C4 and C3 crop species.


![Visualizing Loops and Data Structures in Xylem: The …ejw/papers/VisualizingLoopsandData...Visualizing Loops and Data Structures in Xylem: ... objectives [16]; this work ... Xylem](https://img.pdfslide.us/doc/110x75/5ae3d7807f8b9a595d8ef8ac/visualizing-loops-and-data-structures-in-xylem-the-ejwpapersvisualizingloopsanddatavisualizing.jpg)