Embed Size (px)
Citation preview
Georgia State UniversityScholarWorks @ Georgia State University
Chemistry Theses Department of Chemistry
7-15-2008
The Fate and Transport of Chemical Warfare AgentSimulants in Complex MatricesCedrick M., [email protected]
Follow this and additional works at: https://scholarworks.gsu.edu/chemistry_theses
This Thesis is brought to you for free and open access by the Department of Chemistry at ScholarWorks @ Georgia State University. It has beenaccepted for inclusion in Chemistry Theses by an authorized administrator of ScholarWorks @ Georgia State University. For more information, pleasecontact [email protected].
Recommended CitationDaphney, Cedrick M.,, "The Fate and Transport of Chemical Warfare Agent Simulants in Complex Matrices." Thesis, Georgia StateUniversity, 2008.https://scholarworks.gsu.edu/chemistry_theses/13
THE FATE AND TRANSPORT OF CHEMICAL WARFARE AGENT SIMULANTS
IN COMPLEX MATRICES
by
CEDRICK M. DAPHNEY
Under the direction of Dr. Tambra M. Dunams
ABSTRACT
Experiments to determine the fate and transport of the chemical warfare
agent (CWA) simulants diisopropyl fluorophosphate (DIFP), O,S-diethyl
methylphosphonothioate (OSDEMP), and 2-Chloroethyl ethyl sulfide (CEES)
exposed to complex matrix systems are reported here. The aforementioned
simulants were used in place of O-isopropyl methylphosphonofluoridate (GB), O-
Ethyl S-(2-diisopropylaminoethyl) methylphosphonothiolate (VX), and Bis (2-
chloroethyl) sulfide (HD), respectively. At ambient temperature, simulant pH
(2.63 to 12.01) and reaction time (1 minute to 24 hours) were found to have
significant influence on the recovery of simulants from charcoal, plastic, and TAP
(butyl rubber gloves) in aqueous media. Buffer systems used included,
phosphate, acetate, borate, and disodium tetraborate. Organic extractions were
carried out using a 90:10 (v/v) dichloromethane / 2-propanol solution. All extracts
were analyzed with a gas chromatograph equipped with flame ionization and
flame photometric detectors (GC-FID-FPD). The FPD was used to determine the
amount of simulant recovery.
INDEX WORDS: Chemical warfare agents, Diisopropyl fluorophosphate, O,S-
diethyl methylphosphonothioate, 2-chloroethyl ethylsulfide,
O-isopropyl methylphosphonofluoridate, O-Ethyl S-(2-
diisopropylaminoethyl) methylphosphonothiolate, Bis (2-
chloroethyl) sulfide, Gas chromatography, Flame ionization
detector, flame photometric detector, Demilitarization,
Chemical demilitarization facilities
THE FATE AND TRANSPORT OF CHEMICAL WARFARE AGENT SIMULANTS
IN COMPLEX MATRICES
by
CEDRICK M. DAPHNEY
A Thesis Submitted in Partial Fulfillment of the requirement for the Degree of
Master of Science
In the College of Arts and Sciences
Georgia State University
2008

Copyright by CEDRICK MACEO DAPHNEY
2008
THE FATE AND TRANSPORT OF CHEMICAL WARFARE AGENT SIMULANTS
IN COMPLEX MATRICES
by
CEDRICK M. DAPHNEY
Committee Chair: Tambra Dunams Ph. D. Committee: Alfons Baumstark Ph. D. Shahab A. Shamsi Ph. D. Gabor Patonay Ph. D.
Electronic Version Approved: Office of Graduate Studies
College of Arts and Sciences
Georgia State University
August 2008

iv
DEDICATION
I would like to dedicate this degree to the memory of my beloved
grandmother Mrs. Sadie Mae Daphney, I love you, and I miss you. Because of
you, I was able to begin this journey so very long ago….
v
ACKNOWLEDGEMENTS
First and foremost I would like to thank the Almighty God for bestowing upon me
the wisdom to make the right decisions and enabling me with the strength and
fortitude to persevere.
I would like to thank Dr. Dunams for believing in me and training me in her own
special way. Thanks Doc.
I would like to thank Dr. Shahab A. Shamsi for his patience, guidance,
cooperative spirit and motivational conversation, and also his group members
Will Bragg and especially Bin Wang for all of their support and help throughout
this process.
I would very much like to thank my lab partner Gala Chapman for enduring. We
have been through both good and bad times but I would not trade any of them.
To my XBOX 360 and especially Gears of War, Halo 3, Bioshock, Call of Duty 4,
and Madden : Thank God for you helping me to relieve so much stress….
Last but certainly not least I would like to thank Rakeysha Pinkston who was
always there for me with kind words, a nice smile, the optional piece of laboratory
equipment (I offer no apologies for the pillaging though) and most importantly,
just being there. I love you.
vi
TABLE OF CONTENTS
DEDICATION iv
ACKNOWLEDGEMENTS v
LIST OF TABLES viii
LIST OF SCHEMES xi
LIST OF FIGURES xi
CHAPTER 1
1.1 INTRODUCTION 1
1.1.2 Background 9
1.2 EXPERIMENTAL 12
1.2.1 Materials 12
1.2.2 Analytical instrumentation and apparatus 13
1.2.3 Preparation of solutions 17
1.2.4 Instrument calibration 17
1.2.5 Spiking and extraction procedure 19
1.3 RESULTS AND DISCUSSION 22
1.3.1 Preliminary Testing 22
1.3.2 Buffer Selection 32
1.3.3 DIFP hydrolysis in multiple buffers 33
1.3.4 DIFP hydrolysis in charcoal 36
vii
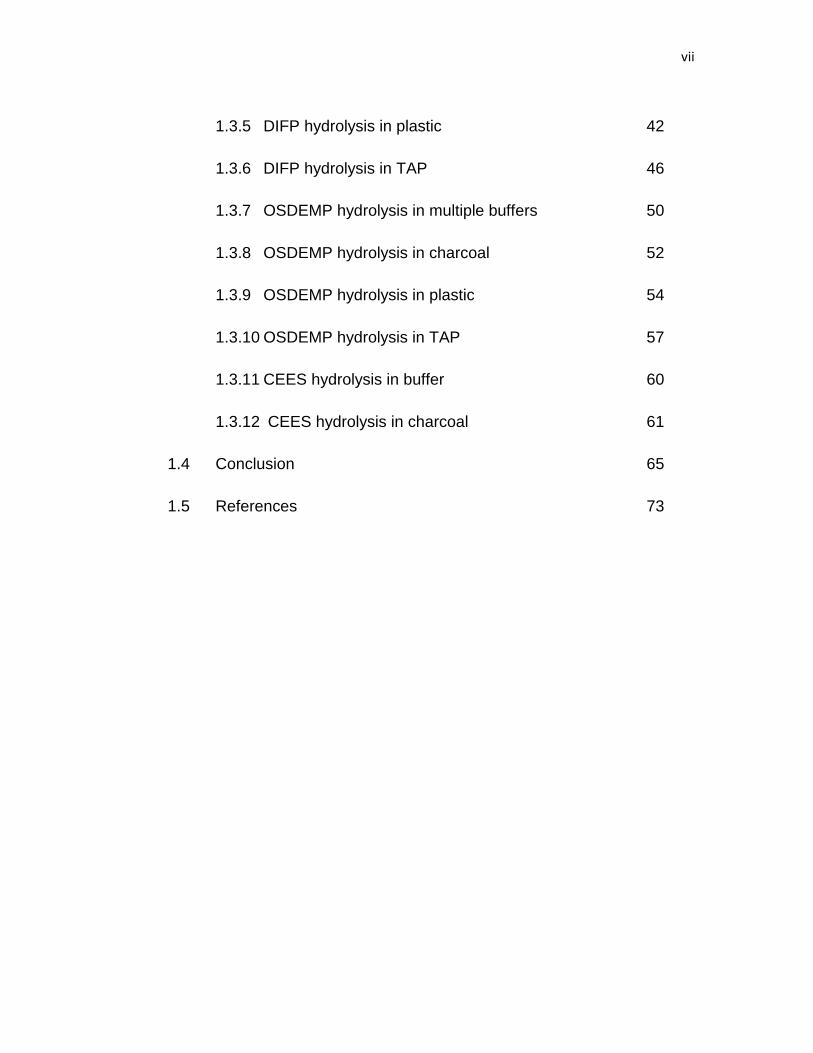
1.3.5 DIFP hydrolysis in plastic 42
1.3.6 DIFP hydrolysis in TAP 46
1.3.7 OSDEMP hydrolysis in multiple buffers 50
1.3.8 OSDEMP hydrolysis in charcoal 52
1.3.9 OSDEMP hydrolysis in plastic 54
1.3.10 OSDEMP hydrolysis in TAP 57
1.3.11 CEES hydrolysis in buffer 60
1.3.12 CEES hydrolysis in charcoal 61
1.4 Conclusion 65
1.5 References 73
viii
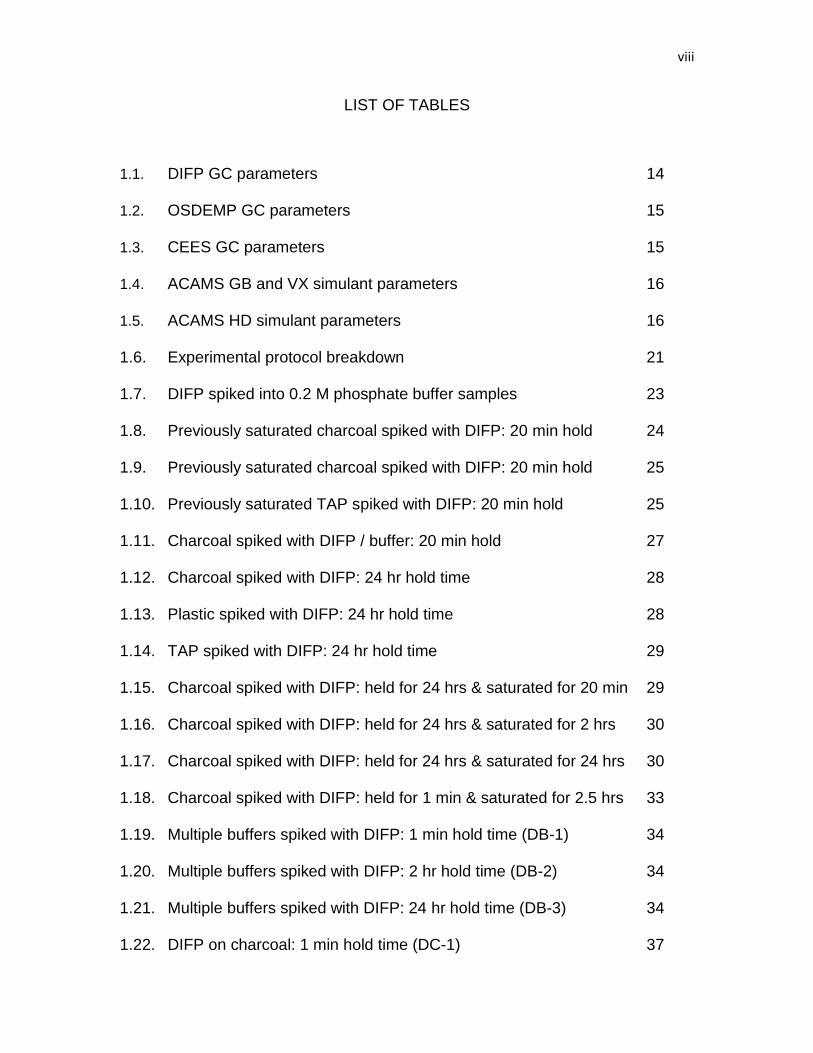
LIST OF TABLES
1.1. DIFP GC parameters 14
1.2. OSDEMP GC parameters 15
1.3. CEES GC parameters 15
1.4. ACAMS GB and VX simulant parameters 16
1.5. ACAMS HD simulant parameters 16
1.6. Experimental protocol breakdown 21
1.7. DIFP spiked into 0.2 M phosphate buffer samples 23
1.8. Previously saturated charcoal spiked with DIFP: 20 min hold 24
1.9. Previously saturated charcoal spiked with DIFP: 20 min hold 25
1.10. Previously saturated TAP spiked with DIFP: 20 min hold 25
1.11. Charcoal spiked with DIFP / buffer: 20 min hold 27
1.12. Charcoal spiked with DIFP: 24 hr hold time 28
1.13. Plastic spiked with DIFP: 24 hr hold time 28
1.14. TAP spiked with DIFP: 24 hr hold time 29
1.15. Charcoal spiked with DIFP: held for 24 hrs & saturated for 20 min 29
1.16. Charcoal spiked with DIFP: held for 24 hrs & saturated for 2 hrs 30
1.17. Charcoal spiked with DIFP: held for 24 hrs & saturated for 24 hrs 30
1.18. Charcoal spiked with DIFP: held for 1 min & saturated for 2.5 hrs 33
1.19. Multiple buffers spiked with DIFP: 1 min hold time (DB-1) 34
1.20. Multiple buffers spiked with DIFP: 2 hr hold time (DB-2) 34
1.21. Multiple buffers spiked with DIFP: 24 hr hold time (DB-3) 34
1.22. DIFP on charcoal: 1 min hold time (DC-1) 37
ix
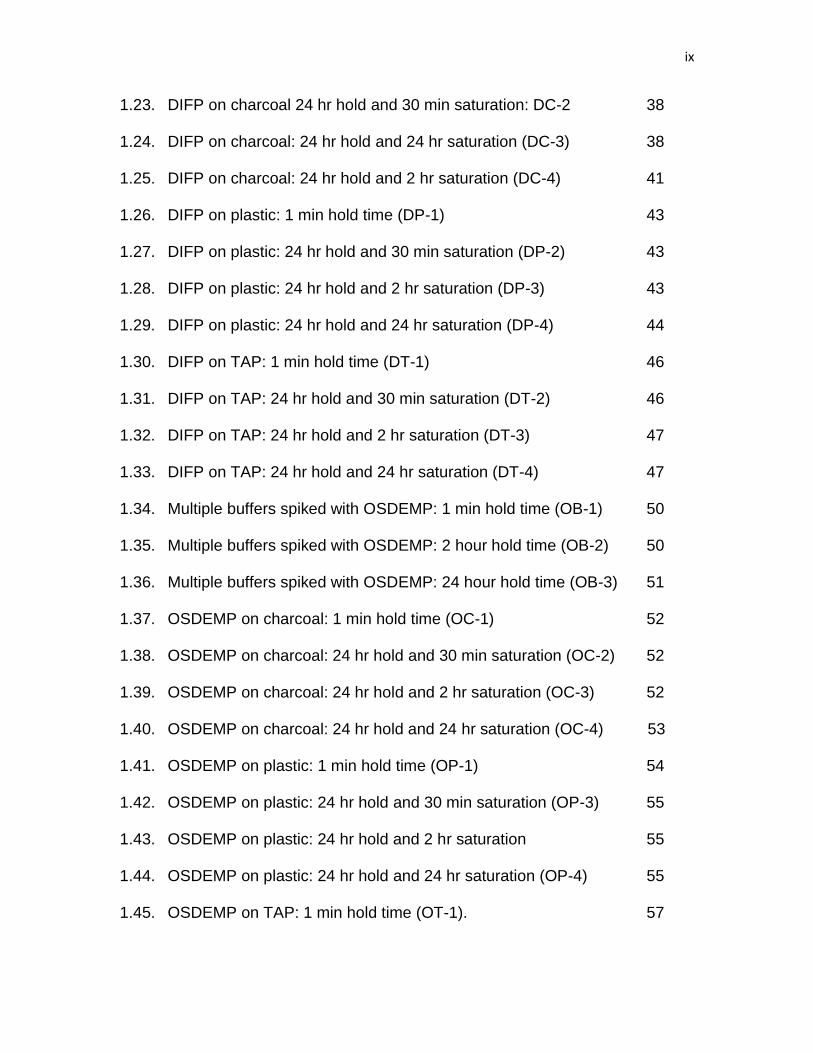
1.23. DIFP on charcoal 24 hr hold and 30 min saturation: DC-2 38
1.24. DIFP on charcoal: 24 hr hold and 24 hr saturation (DC-3) 38
1.25. DIFP on charcoal: 24 hr hold and 2 hr saturation (DC-4) 41
1.26. DIFP on plastic: 1 min hold time (DP-1) 43
1.27. DIFP on plastic: 24 hr hold and 30 min saturation (DP-2) 43
1.28. DIFP on plastic: 24 hr hold and 2 hr saturation (DP-3) 43
1.29. DIFP on plastic: 24 hr hold and 24 hr saturation (DP-4) 44
1.30. DIFP on TAP: 1 min hold time (DT-1) 46
1.31. DIFP on TAP: 24 hr hold and 30 min saturation (DT-2) 46
1.32. DIFP on TAP: 24 hr hold and 2 hr saturation (DT-3) 47
1.33. DIFP on TAP: 24 hr hold and 24 hr saturation (DT-4) 47
1.34. Multiple buffers spiked with OSDEMP: 1 min hold time (OB-1) 50
1.35. Multiple buffers spiked with OSDEMP: 2 hour hold time (OB-2) 50
1.36. Multiple buffers spiked with OSDEMP: 24 hour hold time (OB-3) 51
1.37. OSDEMP on charcoal: 1 min hold time (OC-1) 52
1.38. OSDEMP on charcoal: 24 hr hold and 30 min saturation (OC-2) 52
1.39. OSDEMP on charcoal: 24 hr hold and 2 hr saturation (OC-3) 52
1.40. OSDEMP on charcoal: 24 hr hold and 24 hr saturation (OC-4) 53
1.41. OSDEMP on plastic: 1 min hold time (OP-1) 54
1.42. OSDEMP on plastic: 24 hr hold and 30 min saturation (OP-3) 55
1.43. OSDEMP on plastic: 24 hr hold and 2 hr saturation 55
1.44. OSDEMP on plastic: 24 hr hold and 24 hr saturation (OP-4) 55
1.45. OSDEMP on TAP: 1 min hold time (OT-1). 57
x
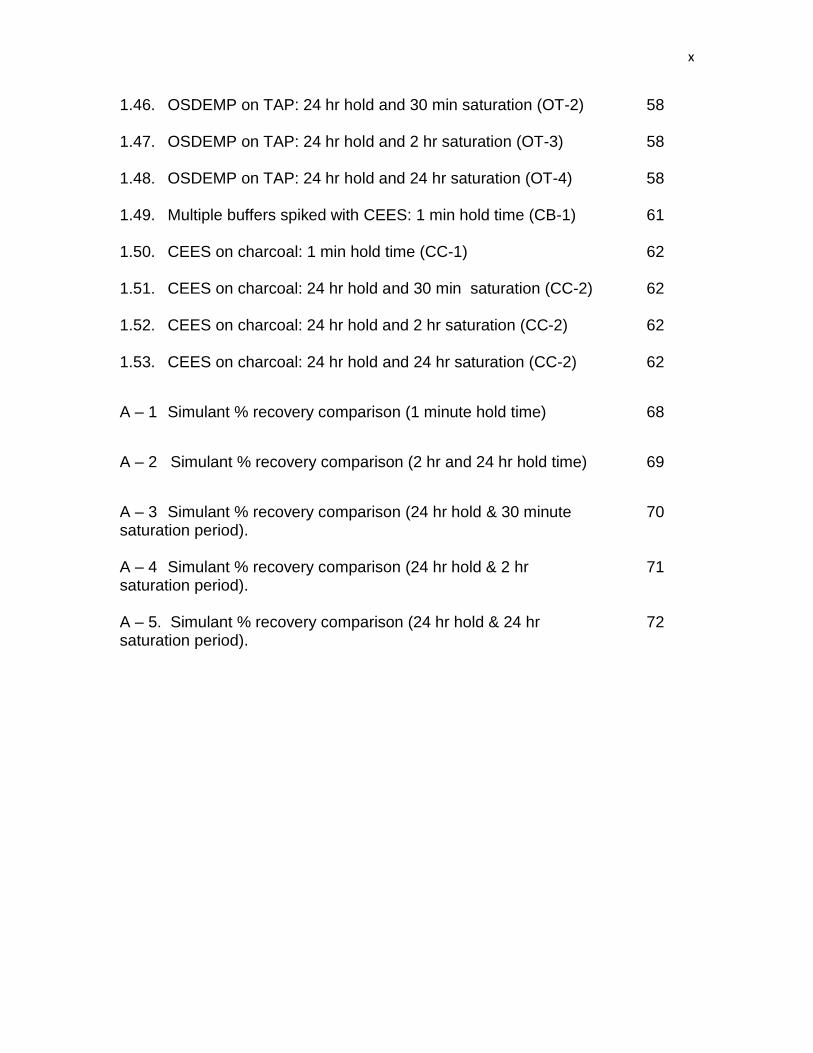
1.46. OSDEMP on TAP: 24 hr hold and 30 min saturation (OT-2) 58
1.47. OSDEMP on TAP: 24 hr hold and 2 hr saturation (OT-3) 58
1.48. OSDEMP on TAP: 24 hr hold and 24 hr saturation (OT-4) 58
1.49. Multiple buffers spiked with CEES: 1 min hold time (CB-1) 61
1.50. CEES on charcoal: 1 min hold time (CC-1) 62
1.51. CEES on charcoal: 24 hr hold and 30 min saturation (CC-2) 62
1.52. CEES on charcoal: 24 hr hold and 2 hr saturation (CC-2) 62
1.53. CEES on charcoal: 24 hr hold and 24 hr saturation (CC-2) 62
A – 1 Simulant % recovery comparison (1 minute hold time) 68
A – 2 Simulant % recovery comparison (2 hr and 24 hr hold time) 69
A – 3 Simulant % recovery comparison (24 hr hold & 30 minute 70 saturation period). A – 4 Simulant % recovery comparison (24 hr hold & 2 hr 71 saturation period). A – 5. Simulant % recovery comparison (24 hr hold & 24 hr 72 saturation period).
xi
LIST OF SCHEMES
1 The hydrolysis products of VX and GB 4
2 Hydrolysis products of HD 6
3 CWA simulants and their hydrolysis products 7
LIST OF FIGURES
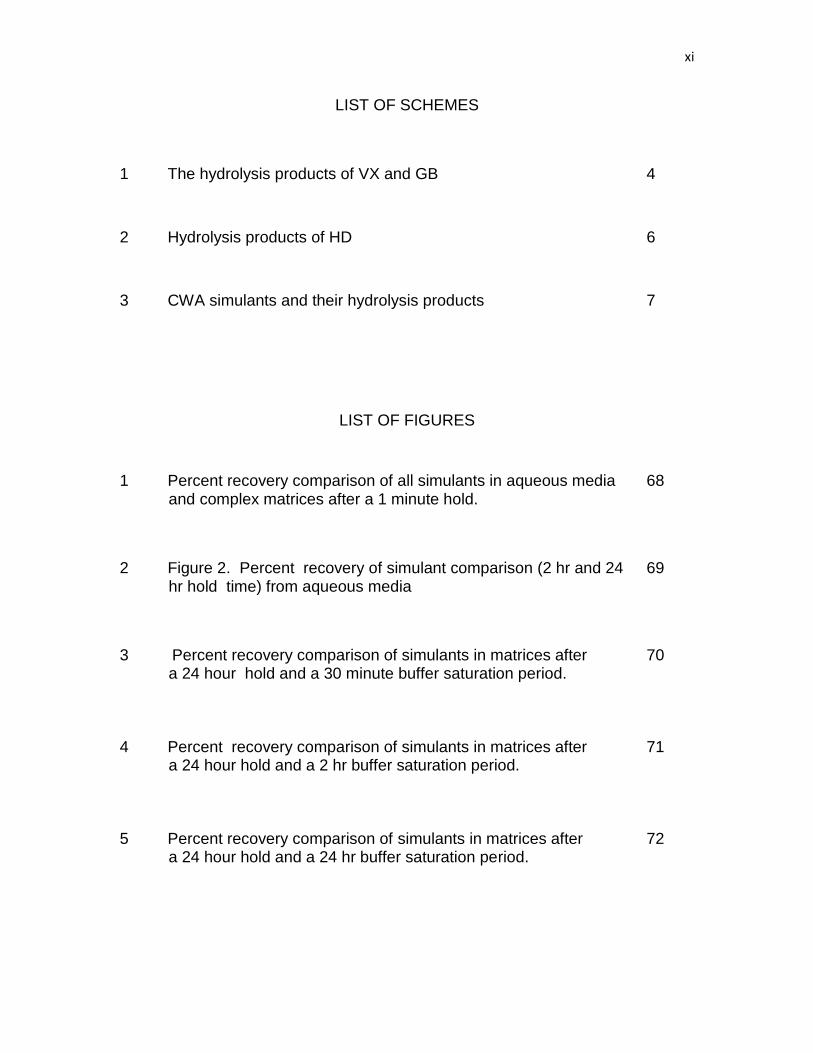
1 Percent recovery comparison of all simulants in aqueous media 68 and complex matrices after a 1 minute hold.
2 Figure 2. Percent recovery of simulant comparison (2 hr and 24 69 hr hold time) from aqueous media
3 Percent recovery comparison of simulants in matrices after 70 a 24 hour hold and a 30 minute buffer saturation period. 4 Percent recovery comparison of simulants in matrices after 71 a 24 hour hold and a 2 hr buffer saturation period. 5 Percent recovery comparison of simulants in matrices after 72 a 24 hour hold and a 24 hr buffer saturation period.
xii
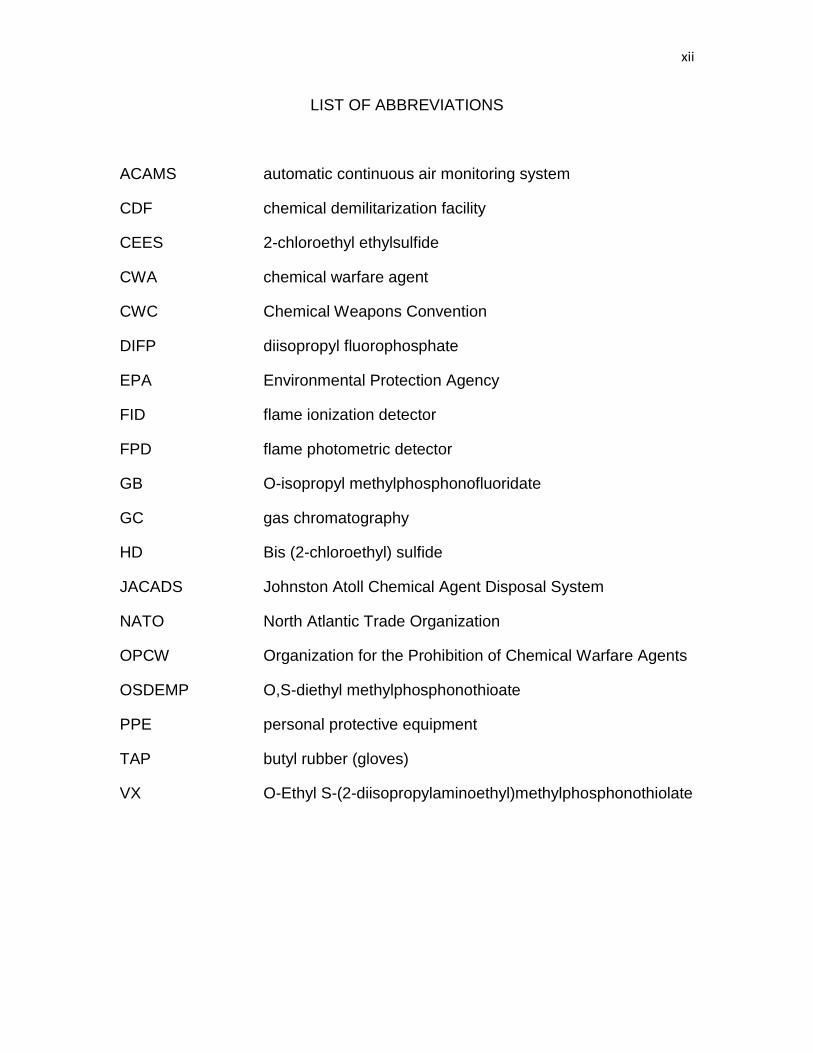
LIST OF ABBREVIATIONS
ACAMS automatic continuous air monitoring system
CDF chemical demilitarization facility
CEES 2-chloroethyl ethylsulfide
CWA chemical warfare agent
CWC Chemical Weapons Convention
DIFP diisopropyl fluorophosphate
EPA Environmental Protection Agency
FID flame ionization detector
FPD flame photometric detector
GB O-isopropyl methylphosphonofluoridate
GC gas chromatography
HD Bis (2-chloroethyl) sulfide
JACADS Johnston Atoll Chemical Agent Disposal System
NATO North Atlantic Trade Organization
OPCW Organization for the Prohibition of Chemical Warfare Agents
OSDEMP O,S-diethyl methylphosphonothioate
PPE personal protective equipment
TAP butyl rubber (gloves)
VX O-Ethyl S-(2-diisopropylaminoethyl)methylphosphonothiolate
1
1.1 Introduction
O-Ethyl S-(2-diisopropylaminoethyl) methylphosphonothiolate with the
chemical formula C11H26NO2PS is designated as VX by the North American
Trade Organization (NATO). VX and O-isopropyl methylphosphonofluoridate
with the chemical formula C4H10FO2P (designated as GB by NATO) are both
known chemically as organophosphates. Both agents were originally
synthesized for military purposes to incapacitate, seriously injure, or kill the
enemy and as such both are classified as either CWA or nerve agents. Both
compounds act biochemically by disrupting neurological regulation through
acetylcholine esterase inhibition. Exposure to both agents results in symptoms
ranging from nausea, convulsions, to coma and death1, 2. The reported
percutaneous lethal concentration of 50% of the test subjects (LC50) of GB for an
unclothed individual is 12 g-min/m3, and 15 g-min/m3 for fully clothed military
personnel3. The lethal dosage of 50% of the test subjects (LD50) for GB has
been reported at 2.5 mg/kg4. The high volatility of GB (22,000 mg/m3 at 25 oC)
enables this compound to exist as a prolonged vapor hazard under normal
atmospheric conditions. Because of its high miscibility in aqueous solutions,
groundwater contamination from GB is a possibility. VX, with a LD50 of 0.1
mg/kg, is over 100 times more toxic than GB when in contact with percutaneous
tissue, and twice as toxic as GB when inhaled at concentrations higher than the
short term exposure limit of 0.00001 mg/m3 5. The low volatility of VX (10.5
mg/m3 at 25 oC) and its high stability on and within several different types of
2
complex matrix systems enables this compound to exhibit a prolonged existence
in the environment under normal atmospheric conditions.
Previous research has shown that in ambient temperatures, VX rapidly
dissolves in dilute hypochlorite (HClO) solutions; this process occurs via
oxidation of the sulfur and protonation of the nitrogen6. In reactions of this type,
the mole ratio of active chlorine to VX is initially 3:1. In that same study, it was
also observed that the pH of the reaction mixture increased over time causing a
reduction of VX solubility in solution. The result is a 10:1 mole ratio increase of
active chlorine needed to degrade VX. Areas contaminated with VX, spills, and
personnel in demilitarization plants are often decontaminated using HClO. Base
catalyzed VX hydrolysis in aqueous solutions at ambient temperature and
pressure is a relatively slow process. Hydrolysis under these circumstances
depends heavily upon the pH and temperature of the solution7. In solutions
containing OH- ions ranging in concentration from 0.1 to 4.0M, VX has been
observed to undergo hydrolysis via several pathways; two of which produce S-(2-
Diisopropylaminoethyl) methyl phosphonothioate and ethanol (pH 7 – 10), and 2-
(diisopropylamino) ethanethiol and ethyl methyl phosphonic acid (pH < 6, pH >
10)7-9. Upon prolonged exposure to water, the first pathway ultimately leads to
the formation of methyl phosphonic acid and 2-(diisopropylamino) ethanethiol,
and the second pathway leads to the formation of methyl phosphonic acid and
methanol. However, all compounds remain in solution (Scheme 1). Additionally,
the hydrolysis product, S-(2-Diisopropylaminoethyl) methyl phosphonothioate,
known as EA2192 by the U.S. Army is known to be highly toxic8. This collectively
3
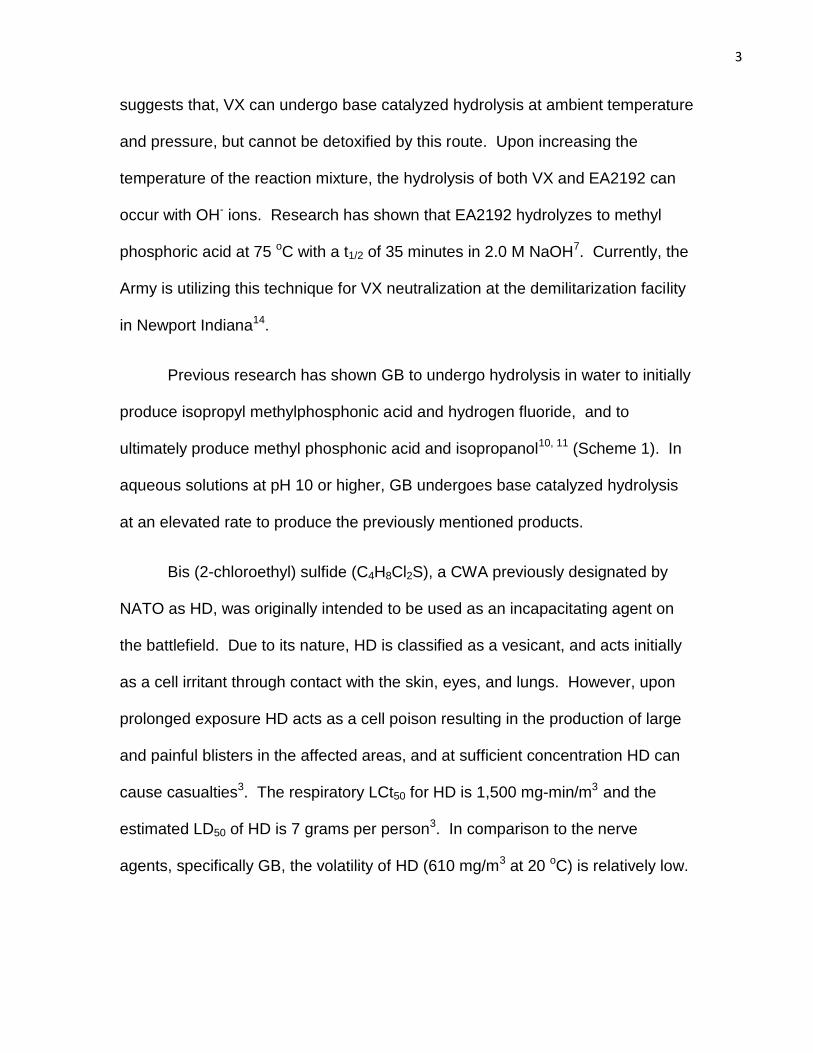
suggests that, VX can undergo base catalyzed hydrolysis at ambient temperature
and pressure, but cannot be detoxified by this route. Upon increasing the
temperature of the reaction mixture, the hydrolysis of both VX and EA2192 can
occur with OH- ions. Research has shown that EA2192 hydrolyzes to methyl
phosphoric acid at 75 oC with a t1/2 of 35 minutes in 2.0 M NaOH7. Currently, the
Army is utilizing this technique for VX neutralization at the demilitarization facility
in Newport Indiana14.
Previous research has shown GB to undergo hydrolysis in water to initially
produce isopropyl methylphosphonic acid and hydrogen fluoride, and to
ultimately produce methyl phosphonic acid and isopropanol10, 11 (Scheme 1). In
aqueous solutions at pH 10 or higher, GB undergoes base catalyzed hydrolysis
at an elevated rate to produce the previously mentioned products.
Bis (2-chloroethyl) sulfide (C4H8Cl2S), a CWA previously designated by
NATO as HD, was originally intended to be used as an incapacitating agent on
the battlefield. Due to its nature, HD is classified as a vesicant, and acts initially
as a cell irritant through contact with the skin, eyes, and lungs. However, upon
prolonged exposure HD acts as a cell poison resulting in the production of large
and painful blisters in the affected areas, and at sufficient concentration HD can
cause casualties3. The respiratory LCt50 for HD is 1,500 mg-min/m3 and the
estimated LD50 of HD is 7 grams per person3. In comparison to the nerve
agents, specifically GB, the volatility of HD (610 mg/m3 at 20 oC) is relatively low.
4
Scheme 1 The hydrolysis products of VX and GB.
Even though the volatility of HD is relatively low, this compound can exist in the
atmosphere as an inhalation hazard.
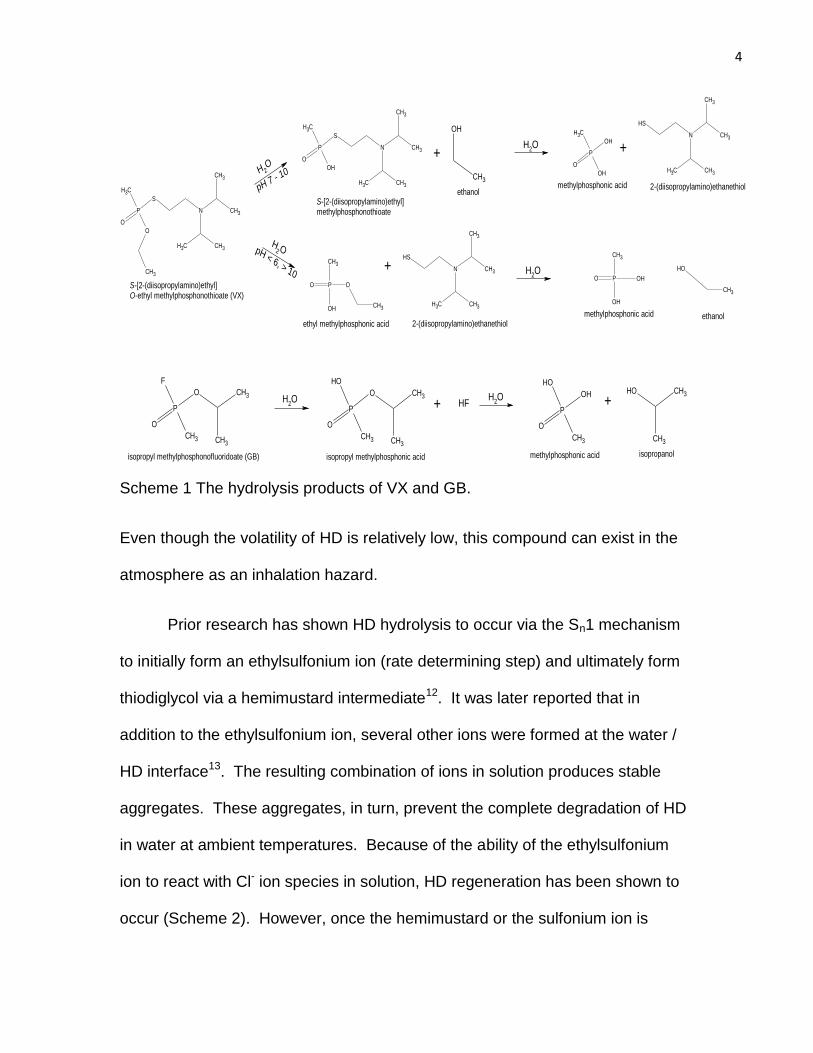
Prior research has shown HD hydrolysis to occur via the Sn1 mechanism
to initially form an ethylsulfonium ion (rate determining step) and ultimately form
thiodiglycol via a hemimustard intermediate12. It was later reported that in
addition to the ethylsulfonium ion, several other ions were formed at the water /
HD interface13. The resulting combination of ions in solution produces stable
aggregates. These aggregates, in turn, prevent the complete degradation of HD
in water at ambient temperatures. Because of the ability of the ethylsulfonium
ion to react with Cl- ion species in solution, HD regeneration has been shown to
occur (Scheme 2). However, once the hemimustard or the sulfonium ion is
P
O
O
CH3S
N
CH3 CH3
CH3
CH3
CH3
P
O
O
CH3
CH3
F
CH3
H2O
H2 OpH < 6, > 10
H 2O
pH 7 - 10
P
O
OH
CH3S
N
CH3 CH3
CH3
CH3 +
PO O
CH3
CH3OH
+
ethyl methylphosphonic acid
N
CH3 CH3
CH3
CH3
SH
2-(diisopropylamino)ethanethiol
P
O
O
CH3
CH3
CH3
OH
+ HF
isopropyl methylphosphonic acidisopropyl methylphosphonofluoridoate (GB)
S-[2-(diisopropylamino)ethyl] O-ethyl methylphosphonothioate (VX)
S-[2-(diisopropylamino)ethyl]methylphosphonothioate
H2O
P
O
CH3
OH
OH
CH3
CH3OH
+
H2O
H2O
CH3
OH
P
O
OH
CH3OH
N
CH3 CH3
CH3
CH3
SH
+
ethanolmethylphosphonic acid 2-(diisopropylamino)ethanethiol
methylphosphonic acid isopropanol
PO
CH3
OH
OH
CH3
OH
methylphosphonic acid ethanol
5
formed regeneration of HD does not occur. The formation at the interface may
also be responsible for the environmental persistence of HD6. In addition, the
hydrolysis of HD, which is controlled by the bulk transfer rate of HD into the
aqueous phase, was observed to be a slow process. Due to the production of
the highly toxic aggregate H-TG, Yang et al. has reported that basic hydrolysis of
HD in water at ambient temperature and pressure cannot be considered for
detoxification purposes6. It was also shown that the sulfonium ion aggregates
hydrolyze in steam and water at elevated temperatures thereby detoxifying HD.
Decontamination using steam was the method of neutralization used by the Army
to destroy HD at the Aberdeen Chemical Disposal Facility (ABCDF) in Maryland.
Although the physical properties and hydrolysis reactions of the previously
mentioned CWA have been studied extensively, much is still not known about
their behavior on complex matrices. Limited to no information is available on the
fate of all the aforementioned CWA on charcoal, plastic, TAP gear, and other
complex matrices such as air and seawater. The behavior of CWA simulants on
complex matrices in a controlled laboratory setting is intended as a guide to
determine how actual CWA may behave on those matrices.
Herein, we report studies on the fate and transport of three chemical
warfare agent simulants: O,S-Diethyl methylphosphonothioate (OSDEMP), which
is a VX impurity found to exist in drums of stored VX 14, diisopropyl
fluorophosphate (DIFP), which is a common GB substrate 14, 15 and 2-
Chloroethyl ethyl sulfide (CEES),which is an isomer of the HD degradation
product 2-Chlorobutane14. Working with CWA simulants affords several
6
advantages over working with the actual agents. Simulants are usually more
actively researched than actual agents. In addition, simulants share many of the
same chemical and physical properties of the actual agent while diminishing the
threat of high toxicity at low concentrations. Under normal conditions, DIFP has
been shown to react in buffered solutions to form diisopropyl hydrogen
phosphate and hydrofluoric acid16. Hydrolysis of DIFP in buffered solutions was
reported to occur by either acid or base catalysis.
S
Cl Clbis(2-chloroethyl) sulfide (HD)
S+
Cl
ethylsulfonium ion
S
Cl OHhemimustard
S
Cl
S+
OH
OH
H-TG
S
S+
OH
OH
S+
OH
OH
S
OHS+
OH
OH
S+
OH
ethylsulfonium ion
H-2TG
H2O HCl
H2O HCl
S+
S+
OH
OH
TG
1-{2-[bis(2-hydroxyethyl)sulfonio]ethyl}thiiranium
S+
S+
OH
OH
1-{2-[bis(2-hydroxyethyl)sulfonio]ethyl}thiiranium
H2 O
H2O
CH-TG
H 2O
TG
S
OH OH
thiodiglycol (TG)
2
TG
Scheme 2. Hydrolysis products of HD
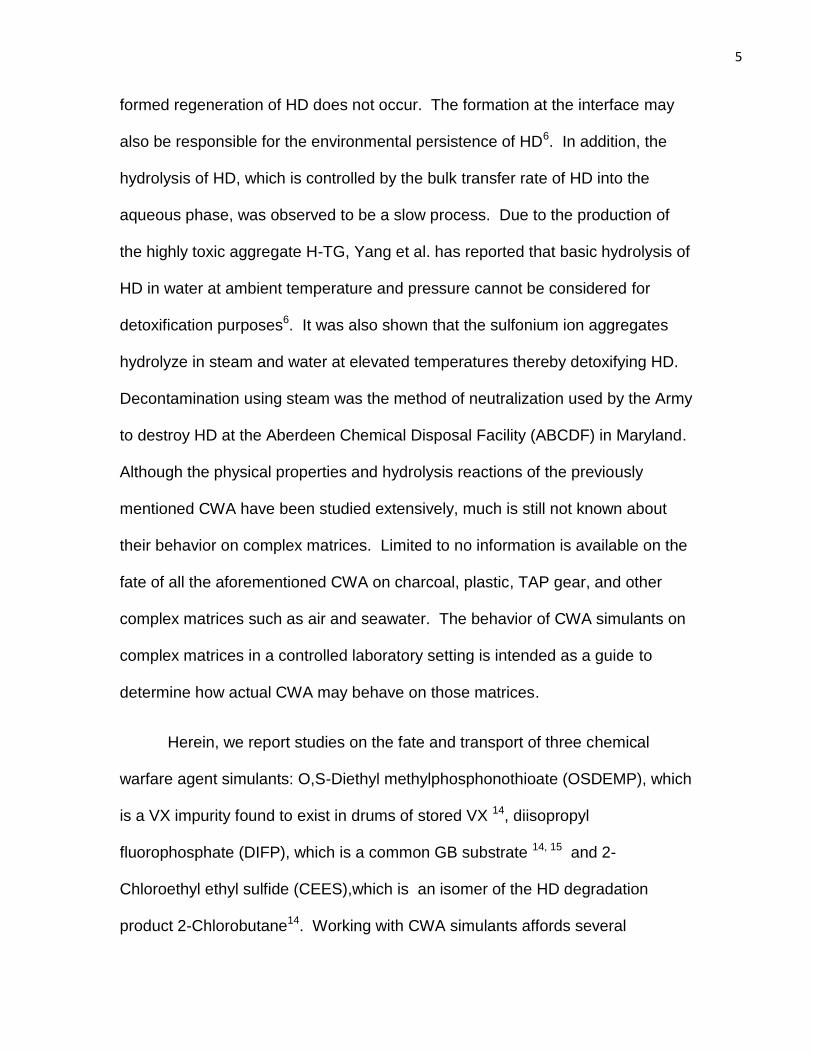
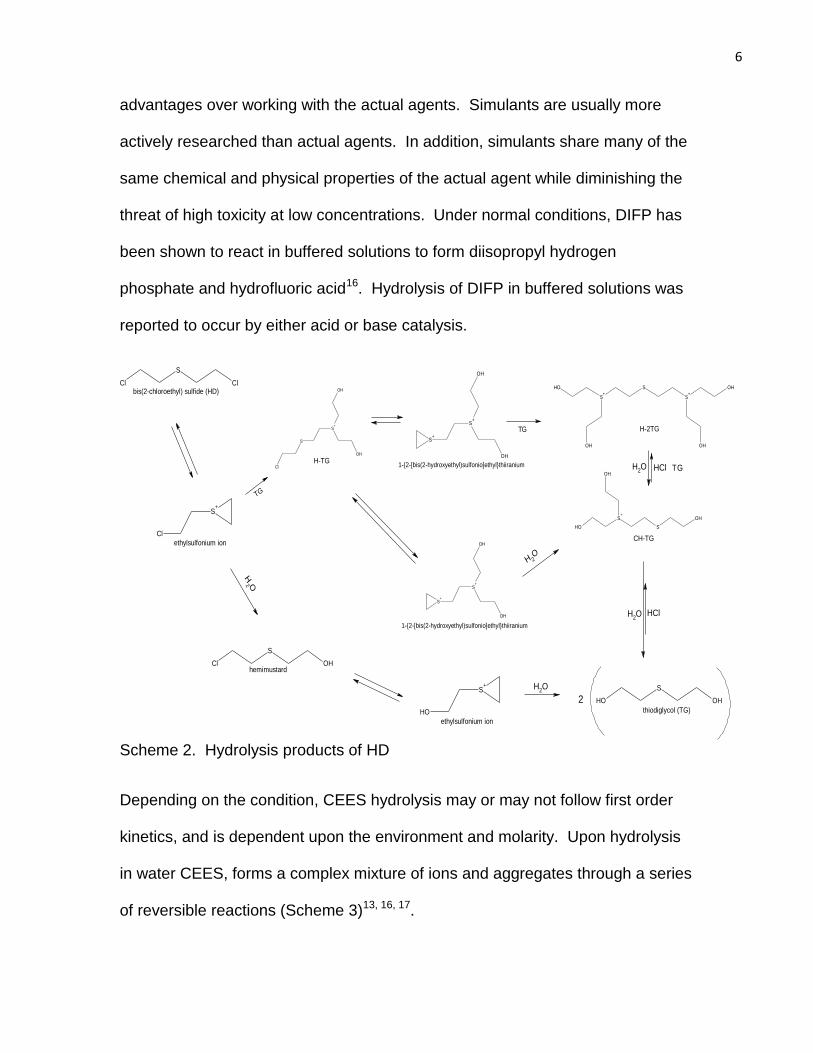
Depending on the condition, CEES hydrolysis may or may not follow first order
kinetics, and is dependent upon the environment and molarity. Upon hydrolysis
in water CEES, forms a complex mixture of ions and aggregates through a series
of reversible reactions (Scheme 3)13, 16, 17.
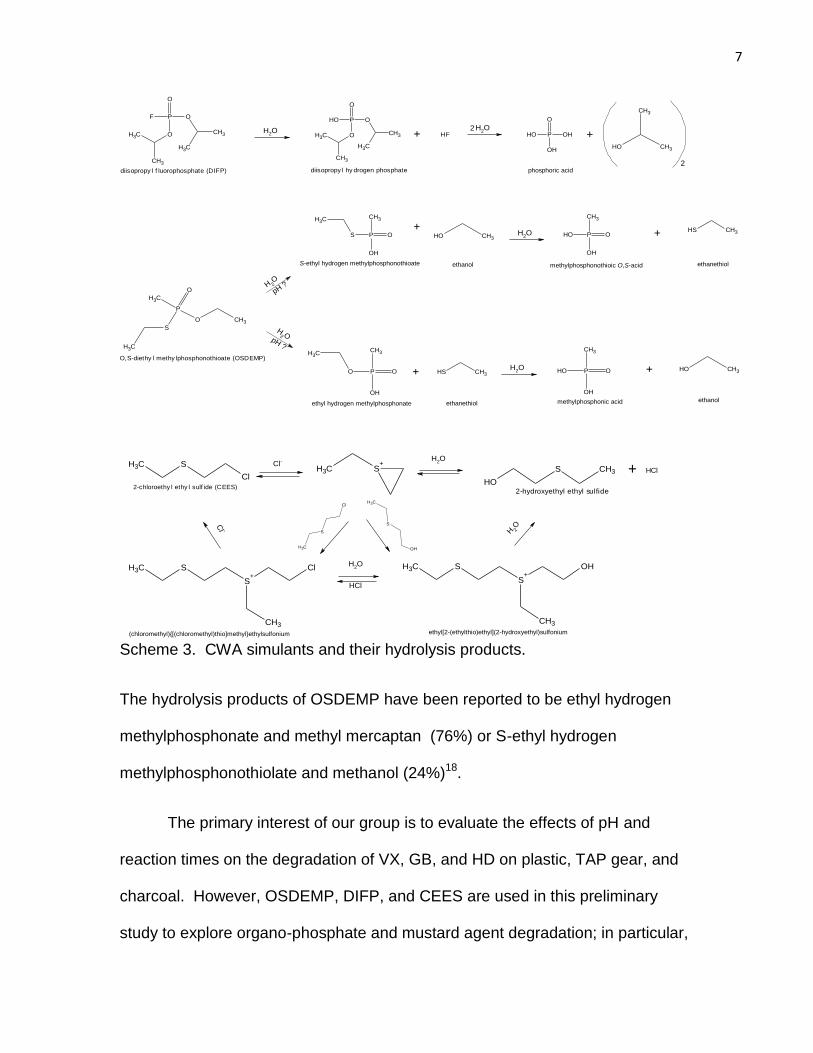
7
P
O
O
O CH3
CH3
CH3
CH3
FP
O
O
O CH3
CH3
CH3
CH3
OH
diisopropy l hy drogen phosphate
+ HF
diisopropy l f luorophosphate (DIFP)
H2O H
2O2
P
O
OHOH
OHOH CH3
CH3
+
2phosphoric acid
P O
OH
CH3
S
CH3
+
P
O
O
S
CH3
CH3
CH3
O,S-diethy l methy lphosphonothioate (OSDEMP)
OH CH3
H 2O
pH ?
H2 O
pH ?
P O
CH3
OH
O
CH3
S-ethyl hydrogen methylphosphonothioate
ethyl hydrogen methylphosphonate
+ SH CH3
ethanol
ethanethiol
H2O
H2O
P O
OH
CH3
OH
methylphosphonothioic O,S-acid
+ SH CH3
ethanethiol
P O
CH3
OH
OH + OH CH3
methylphosphonic acid ethanol
SCH3
Cl2-chloroethy l ethy l sulf ide (CEES)
S CH3
OH2-hydroxyethyl ethyl sulfide
+Cl-
S+
CH3
H2O
S
CH3
Cl
Cl -
S
CH3
OH
H2O
HCl
(chloromethyl){[(chloromethyl)thio]methyl}ethylsulfonium
H 2O
S+
CH3
SCH3 Cl
S+
CH3
SCH3 OH
ethyl[2-(ethylthio)ethyl](2-hydroxyethyl)sulfonium
HCl
Scheme 3. CWA simulants and their hydrolysis products.
The hydrolysis products of OSDEMP have been reported to be ethyl hydrogen
methylphosphonate and methyl mercaptan (76%) or S-ethyl hydrogen
methylphosphonothiolate and methanol (24%)18.
The primary interest of our group is to evaluate the effects of pH and
reaction times on the degradation of VX, GB, and HD on plastic, TAP gear, and
charcoal. However, OSDEMP, DIFP, and CEES are used in this preliminary
study to explore organo-phosphate and mustard agent degradation; in particular,
8
the effects of pH and reaction time upon the degradation of simulant. The matrix
systems studied here along with several others, i.e. dunnage, brine solutions,
and scrap metal are typical of the types of secondary waste streams generated
during the operation of existing Chemical Demilitarization Facilities (CDF).
Before off-site disposal of these matrices in a hazardous landfill can be
accomplished, it is necessary to verify that the residues of CWA and CWA
degradation products are below the U.S. Army waste control limit of 20 ppm for
GB and VX and 200 ppb for HD. In addition to the U.S. Army, the ability to
recover CWA, CWA degradation products and CWA simulants from the
environment is of primary interest to the Environmental Protection Agency (EPA)
and other special interest groups. The two goals of this study are to determine
the amount of simulant able to be recovered from aqueous media and to
determine the amount of simulant able to be recovered from complex matrices
saturated with aqueous media. The aqueous media involved consists of
phosphoric acid, acetate, borate, and disodium tetraborate buffers. The simulant
hold time and consequently the simulant reaction time will also be studied to
determine the amount of simulant recovery. Recovered CWA simulant from the
aforementioned complex matrices may shed insight into the actual fate and
transport of CWA in the environment. The CWA simulant extracts in this study
were analyzed using the flame photometric detector (FPD) on the gas
chromatograph. Further verification of simulant and air monitoring in the lab was
provided by the automatic continuous air monitoring system (ACAMS), also
equipped with a FPD.
9
1.1.2 Background
The Chemical Weapons Convention (CWC) has outlawed the
manufacturing, usage, and stockpiling of all CWA, and ordered the immediate
destruction of any existing CWA19. Previous studies on CWA have included the
following: extraction, hydrolysis, transport and eventual fate, degradation
products, simulants and simulant decomposition products in complex matrices18,
20-25. Because of the CWC mandate, the Organization for the Prohibition of
Chemical Weapons (OPCW) has outlined a verification process that is necessary
for the detection and identification of all CWA. In the U.S., the primary route of
demilitarization involves incineration. The Johnston Atoll Chemical Agent
Disposal System (JACADS) was one of the first pilot plants in the U.S. charged
with the demilitarization of onsite nerve and blister agent via incineration. During
the operation and eventual closure of this facility, several concerns were raised.
Two of which were the decontamination and the disposal of secondary waste
generated during the operation of the plant.
Currently, there are five chemical demilitarization facilities (CDF) located
in the United States that are responsible for destroying the U.S. Army’s stockpile
of CWA. These facilities are the Tooele Chemical Agent Disposal Facility
(TOCDF) in Utah, the Umatilla Chemical Agent Disposal Facility (UMCDF) in
Oregon, the Newport Chemical Agent Disposal Facility (NECDF) in Indiana, the
Anniston Chemical Agent Disposal Facility (ANCDF) in Alabama, and the Pine
Bluff Chemical Agent Disposal Facility (PBCDF) in Arkansas. Current CWA
stockpiles include but are not limited to GB, VX, and HD, and all agents are
10
either housed in munitions or stored ton containers. Because of the age of the
munitions and ton containers, in addition to the previously mentioned physical
properties of the CWA, the threat of leakage at each CDF is a top concern.
In addition to incineration, neutralization via chemical reactions has also
been designated as a demilitarization technique, and in currently employed at the
NECDF. This process was also previously used at the Aberdeen Chemical
Agent Disposal Facility (ABCDF) to hydrolyze HD. Both processes subject
complex matrices such as charcoal from the filter banks, TAP gear (protective
clothing consisting primarily of butyl rubber) worn by staff, and personal
protective equipment (PPE) to become contaminated with either the agent being
destroyed, agent degradation products generated from agent destruction, and /
or both26. During incineration, activated charcoal in the filter banks is exposed to
agent effluent from waste incinerators, steam, and other aqueous solutions that
are either mildly acidic or mildly basic in nature. During neutralization, vent
gases from the reaction process that contain contaminants (possible degradation
products) and particulates are passed through both air filters and activated
charcoal. Charcoal from both processes has to be decontaminated prior to
disposal. Slight differences in the pH values of CWA effluent exposed to
charcoal have been observed to have a significant impact upon the hydrolysis of
certain CWA. Upon the eventual closing of each CDF, it will then be necessary
to properly dispose of all existing contaminated items.
Because of the high sensitivity to carbon based compounds, an almost
zero response to carrier gas impurities, and an extended linear dynamic range
11
(107), the FID is a commonly used detector in the GC analysis of
hydrocarbons27,28. The operating principle of the FID is based on hydrocarbon
combustion in an oxygen rich flame. As effluent from the capillary column enters
a flame block, thermal energy from the flame ionizes the organic species. The
total amount of ionized organic species is directly proportional to the amount of
carbons contained in the species. In addition to ionization, alkyl radicals (CH●)
are formed that in turn react to oxygen radicals (O●). The resultant molecules
and electrons (-CHO+ + e-) maintain an electrical current as they flow to a
collector electrode. The signal is then amplified and converted to a digital
readout. Because of its high selectivity the FPD is primarily used for the analysis
of molecules containing sulfur and phosphorous. The selectivity ratio of both
sulfur and phosphorous based compounds compared to hydrocarbons for the
FPD is 104:1 In contrast to the FID, the operating principle of the FPD is based
on ionization in a hydrogen rich flame. As effluent containing phosphorous or
sulfur passes through the analytical column into the flame, chemiluminescence
occurs and the compounds are ionized. The hydrogen rich flame in the FPD is
relatively cooler than the oxygen rich FID flame and is responsible for the
increased production of the resulting ionic species28. Phosphorous compounds
decompose to PO species that eventually collide with protons to form HPO● and
sulfur atoms collide to form S2 diatomic species29. As the excited electrons from
the ionized species return to the ground state they emit photons; phosphorous
compounds emit radiation at 526 nm and compounds containing sulfur emit
radiation at 394 nm. Optical filters placed in the detector that are specific to both
12
compounds are used to differentiate between the compounds of interest and
photons from other molecules. A photomultiplier tube (PMT) amplifies and
directs the ionized emissions toward a detector. The detector in turn, converts
the incoming signals into peaks on a chromatogram; the resulting peaks correlate
to the concentration of analyte in solution.
At this time, the total FPD response process for both phosphorous and
sulfur based compounds is not completely understood, however the detector
response has been observed to be mass/flow rate sensitive28,29. The detector
response to the HPO● species by the FPD is linear, in contrast, the detector
response to the S2 species is quadratic. The sensitivity ratio of the FPD in
comparison to the FID is 104:1.
1.2 Experimental
1.2.1 Materials
All simulants were purchased in neat agent form: DIFP from Toronto
Research Chemicals (ON, Canada), OSDEMP from Carbocore (The Woodlands,
TX), and CEES from Sigma Aldrich (St. Louis, MO). All organic solvents and
reagents were obtained from Fisher Chemicals (Hampton, NH) and certified
optima grade. All buffer solutions were prepared using deionized water (3x
distilled). The organic matrices (charcoal, plastic, and TAP) were free of
contaminants and obtained from EG&G contractors.
13
1.2.2 Analytical instrumentation and apparatus
A Beckman-Coulter 350 pH meter (Fullerton, CA) was used to determine
the pH values of all buffer systems. Verification of all agent simulants: stock
solutions, working solutions and extracts were determined primarily on the
Agilent Systems 6890 gas chromatograph from Agilent Technologies (Waldbron,
Germany). The GC was equipped with a RTX-624 (6% cyanopropylphenyl, 94%
dimethyl polysiloxane) capillary column (Restek Bellefonte, PA) with the following
dimensions: 30.0 m length x 0.32 µm i.d. x 1.80 µm film thickness. The GC was
also equipped with a 1.0 m DB-5 (5% diphenyl/95% dimethyl polysiloxane, J&W
Scientific, Inc., Folsom, CA) guard column to protect the analytical column
against premature degradation and a column splitter that directed column effluent
to both an enhanced flame photometric detector (FPD) and a flame ionization
detector (FID) with a 3:1 ratio. The splitter was added for two purposes: to divert
most of the organic solvent to the FID and to monitor the organic solvent for the
presence of impurities. Breathable air (oxygen) and hydrogen were used as an
oxidizer and fuel, respectively for the flame in the FPD. Split injections are used
primarily to analyze compounds with high concentrations; a portion of the analyte
is vented to waste and the remaining goes to the detector. During splitless
injection, low concentrations (usually trace amounts) of substances are analyzed
and thus all the analyte travels to the detector. Splitless injections were used for
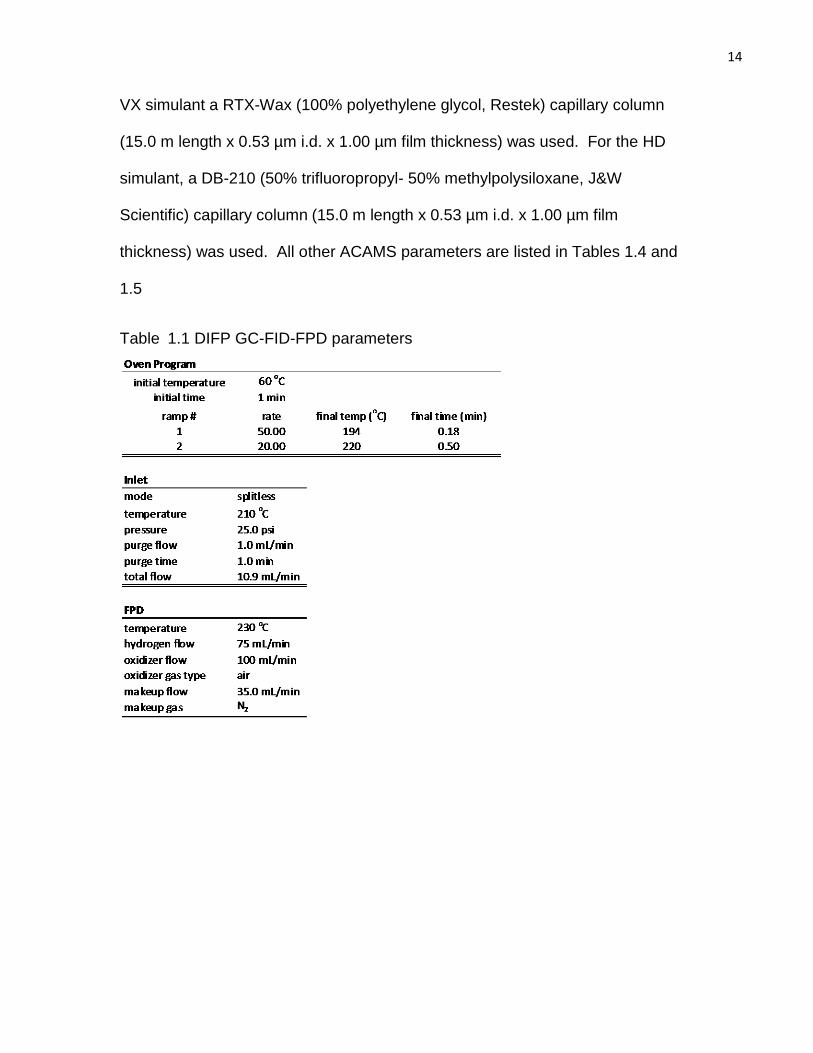
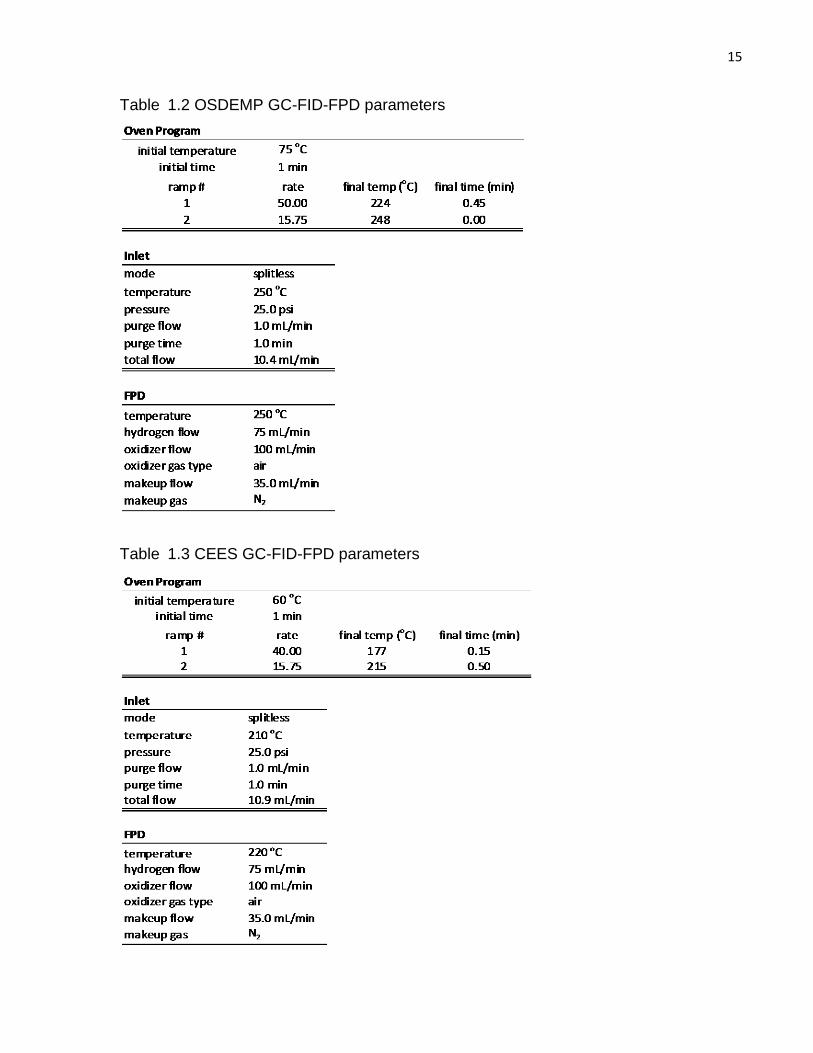
all analysis in this report. All other GC parameters are listed in Tables 1.1 – 1.3..
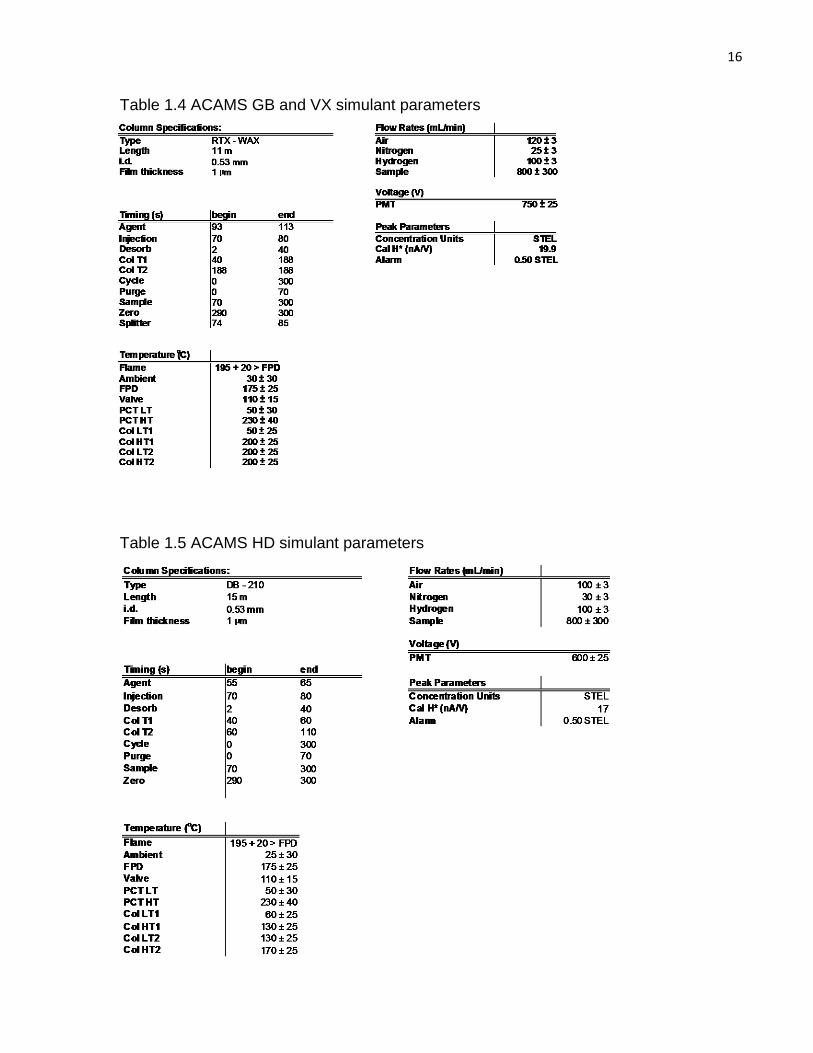
For area monitoring, two automatic continuous air monitoring systems
(ACAMS - ABB Process Analytics, Lewisburg, WV) were used. For the GB and
14
VX simulant a RTX-Wax (100% polyethylene glycol, Restek) capillary column
(15.0 m length x 0.53 µm i.d. x 1.00 µm film thickness) was used. For the HD
simulant, a DB-210 (50% trifluoropropyl- 50% methylpolysiloxane, J&W
Scientific) capillary column (15.0 m length x 0.53 µm i.d. x 1.00 µm film
thickness) was used. All other ACAMS parameters are listed in Tables 1.4 and
1.5
Table 1.1 DIFP GC-FID-FPD parameters
15
Table 1.2 OSDEMP GC-FID-FPD parameters
Table 1.3 CEES GC-FID-FPD parameters
16
Table 1.4 ACAMS GB and VX simulant parameters
Table 1.5 ACAMS HD simulant parameters
17
1.2.3 Preparation of solutions
Caution: simulants pose severe health risks if not handled properly, please
exercise extreme caution and wear the necessary protective clothing at all times
when working under the hood with these substances. An initial solution (Stock-
A) was gravimetrically prepared from neat simulant by weighing simulant (~0.01
g) placed into 40 mL borosilicate screw cap vials and diluting to volume with 2-
propanol. From the initial solution, serial dilutions were prepared in the same
manner. Working solutions were obtained by transferring aliquots of stock
solutions to separate 400 µL screw cap vials. For all simulants, the working
standard solution with a concentration of ~40 ng/µL was used for spiking. The
simulants were capped, sealed, and stored at 4 oC when not in use to maintain
integrity.
Phosphate buffers with a 0.2 M final concentration were prepared
from stock solutions of monobasic, dibasic, and tribasic potassium phosphate
and pH adjusted with HCl and NaOH respectively. Acetic acid, boric acid, and
sodium tetraborate buffers all with a final concentration of 5.00 mM were
prepared from stock solutions and pH adjusted with AcOH and NaOH,
respectively.
1.2.4 Instrument Calibration
The concentrations of the first calibration standards were verified against a
calibration curve generated on the GC. Once subsequent standards were made,
they were first verified against the last generated calibration curve. The
18
standards were then verified against a newly generated calibration curve to
ensure consistency between the old and new standards. All curves were
generated on the GC unless otherwise stated. The working standard solutions
were used to generate 6-point calibration curves for each agent simulant. The
concentrations of calibration standards used for each simulant were
approximately: 1.0, 3.0, 5.0, 7.5, 10.0, and 40.0 ng/µL and the R values for each
curve generated were at least 0.995 or better.
For DIFP and OSDEMP, the peak areas of each curve were fitted to the
standard line equation Eq. 1.
y = mx + b (1)
where x is the amount of agent recovered, y is the peak area, m is the slope, and
b is the y-intercept. For CEES, the peak areas of each curve were fitted into the
quadratic equation Eq. 2.
y = ax2 + bx + c (2)
where x and y have the same values as equation 1 and b is the slope. The b and
c values were determined by the GC based on a residual standard deviation
value for the six points used in generating the curve. Calibration curves were
generated monthly along with freshly prepared stock and working solutions.
Before the analysis of samples for the experiments, a solvent blank was injected
into the GC and the GC was verified by a 1.0 µL injection of the 5.0 ng/µL
standard. The purpose of the solvent blank was to ensure that the integrity of the
solvent was not compromised and the purpose of the verification was to ensure
19
consistency between the standard concentration and the instrumental response.
During the analysis of all extraction samples, the GC was verified a minimal of
two times: at the beginning of the analysis and either after every 8 samples or at
the end of the analysis to ensure the instrumental response maintained a ± 15%
efficiency range of the analytical standard. The analysis of all extraction samples
were allowed to continue if the instrumental response of the verification standard
ranged from ± 15% of the amount injected.
Two ACAMS units were used (one for CEES and one for both DIFP and
OSDEMP) and both were calibrated upon the preparation of a fresh set of
simulant standards or after a 1-day period of inactivity (whichever occurred first)
and challenged before, during, and near the end of a monitoring period.
Challenges to the ACAMS involved injecting a 1.0 STEL amount into the unit to
ensure the consistency of the response from the standard. Calibrating the
ACAMS involved injecting the instrument with a 1.0 short term exposure limit
(STEL) amount previously verified by a GC calibration curve. A minimum of two
and a maximum of four injections were required for ACAMS calibration. Area
monitoring was allowed to continue if the instrumental response of the
challenged standard ranged from ± 25% of the amount injected.
1.2.5 Spiking and extraction procedure
Scintillation vials were used to house all samples. Unless otherwise
stated, a laboratory blank was used in all experiments. The blanks were
exposed to the same conditions as the other samples with the exception of agent
20
simulant. In order to determine the simulant baseline hydrolysis, each buffer
(free of organic matrices) was initially spiked with agent simulant, vortexed, and
capped after spiking. For experiments in which organic matrices were tested,
empty vials were weighed, sample was added, and the vials were weighed again
to determine the weight of the sample. For samples involving charcoal, virgin
charcoal was dried at 114 oC for a period of 7 hours and allowed to cool in a
dessicator for 45 min. After removal from the dessicator and before spiking, the
samples were weighed again to determine the % volatile component loss and the
final weight. The average loss of volatiles of all charcoal samples was
approximately 2.00%. Unless otherwise stated, all samples for each study with
the exception of the laboratory blank were spiked with 250 µL of a 40.0 ng/µL
(approximately) standard simulant concentration for a final concentration of
10,000 ng/µL (approximately). Once samples were spiked with agent, the
samples were capped and monitored with the ACAMS to ensure that no off-
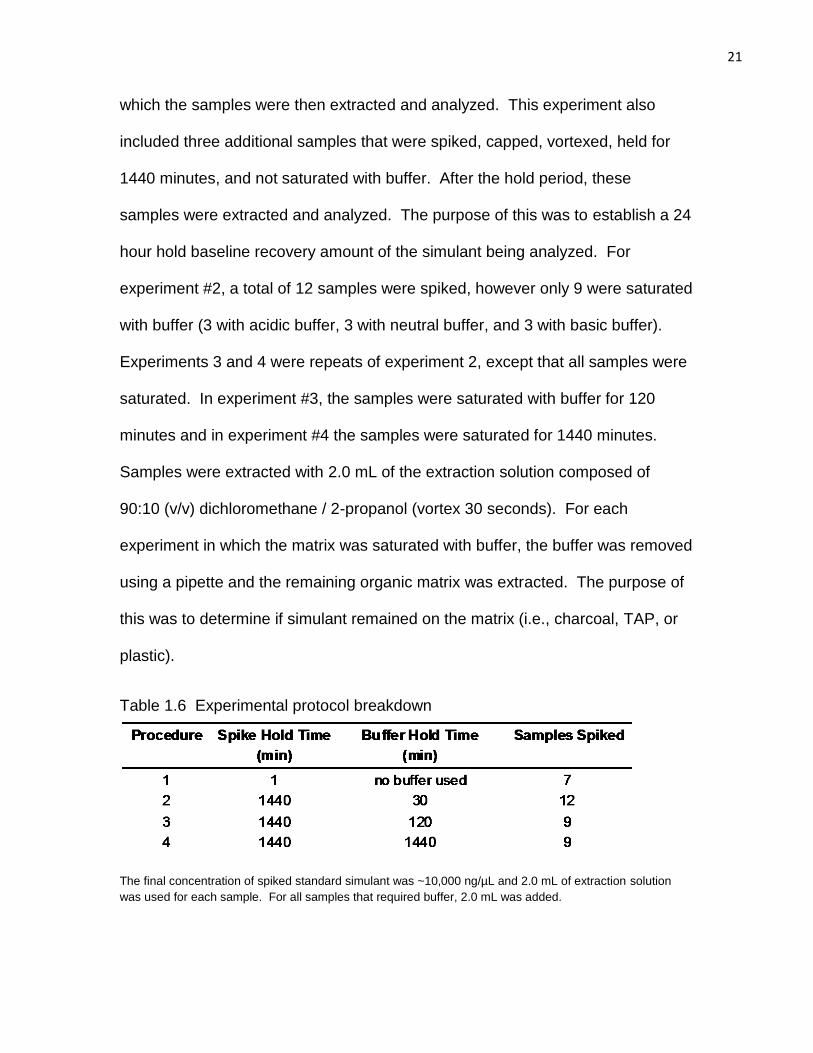
gassing occurred. For all experiments throughout this study, four procedure
types were used to determine the effect of the stimulants in different
environments. During experiment one, 7 samples were spiked, capped, vortexed
for 15 seconds and held for 1 min. The extract from the charcoal samples were
passed through glass wool filters before GC analysis to prevent syringe clogging
and capillary degradation. During experiment #2, 9 samples were spiked,
capped, vortexed (1 min) sealed, and set aside for 1440 min. The samples (in
triplicate) were then saturated with acidic, neutral, and basic buffers, each with a
2.0 mL final volume and a 5 mM final concentration for a 30 min period; after
21
which the samples were then extracted and analyzed. This experiment also
included three additional samples that were spiked, capped, vortexed, held for
1440 minutes, and not saturated with buffer. After the hold period, these
samples were extracted and analyzed. The purpose of this was to establish a 24
hour hold baseline recovery amount of the simulant being analyzed. For
experiment #2, a total of 12 samples were spiked, however only 9 were saturated
with buffer (3 with acidic buffer, 3 with neutral buffer, and 3 with basic buffer).
Experiments 3 and 4 were repeats of experiment 2, except that all samples were
saturated. In experiment #3, the samples were saturated with buffer for 120
minutes and in experiment #4 the samples were saturated for 1440 minutes.
Samples were extracted with 2.0 mL of the extraction solution composed of
90:10 (v/v) dichloromethane / 2-propanol (vortex 30 seconds). For each
experiment in which the matrix was saturated with buffer, the buffer was removed
using a pipette and the remaining organic matrix was extracted. The purpose of
this was to determine if simulant remained on the matrix (i.e., charcoal, TAP, or
plastic).
Table 1.6 Experimental protocol breakdown
The final concentration of spiked standard simulant was ~10,000 ng/µL and 2.0 mL of extraction solution
was used for each sample. For all samples that required buffer, 2.0 mL was added.
22
1.3 RESULTS AND DISCUSSION
1.3.1 Preliminary Testing
Unless otherwise stated, the aqueous solutions and organic matrices in
these trials were spiked with 250 µL of a 43.0 ng/µL solution of DIFP dissolved in
2-propanol, capped to prevent off-gassing, and stored under ambient conditions.
The final concentration and final volume of all phosphate buffers were 0.21 M
and 4.0 mL respectively. The simulant to phosphate buffer mole ratio was
determined to be 1:137 x 102 and all trial experiments were conducted at ambient
temperature and pressure under normal humidity. The extraction solution
consisted of 10% 2-proponal in dichloromethane and all analysis occurred using
the GC-FPD. Results from extraction samples that exceeded 100% are
attributed to differences in instrumental responses due to the humidity and
temperature of the lab. Both factors affect the density of 2-propanol (the solvent
used for all simulants)
Initially, DIFP was spiked into deionized water samples, vortexed for 1
minute and allowed to sit for 20 minutes. It was previously reported that the
hydrolysis of DIFP in water occurs at a reduced rate and is a relatively slow
process16. The purpose of this experiment was to determine if unbuffered water
would hydrolyze DIFP during the experimental period. The results show that
100% of the DIFP was recovered from all samples upon extraction and analysis.
In the next trial, phosphate buffer samples were spiked with DIFP for a period of
20 minutes. Seven buffer samples were used, two were acidic (pH = 2.63), two
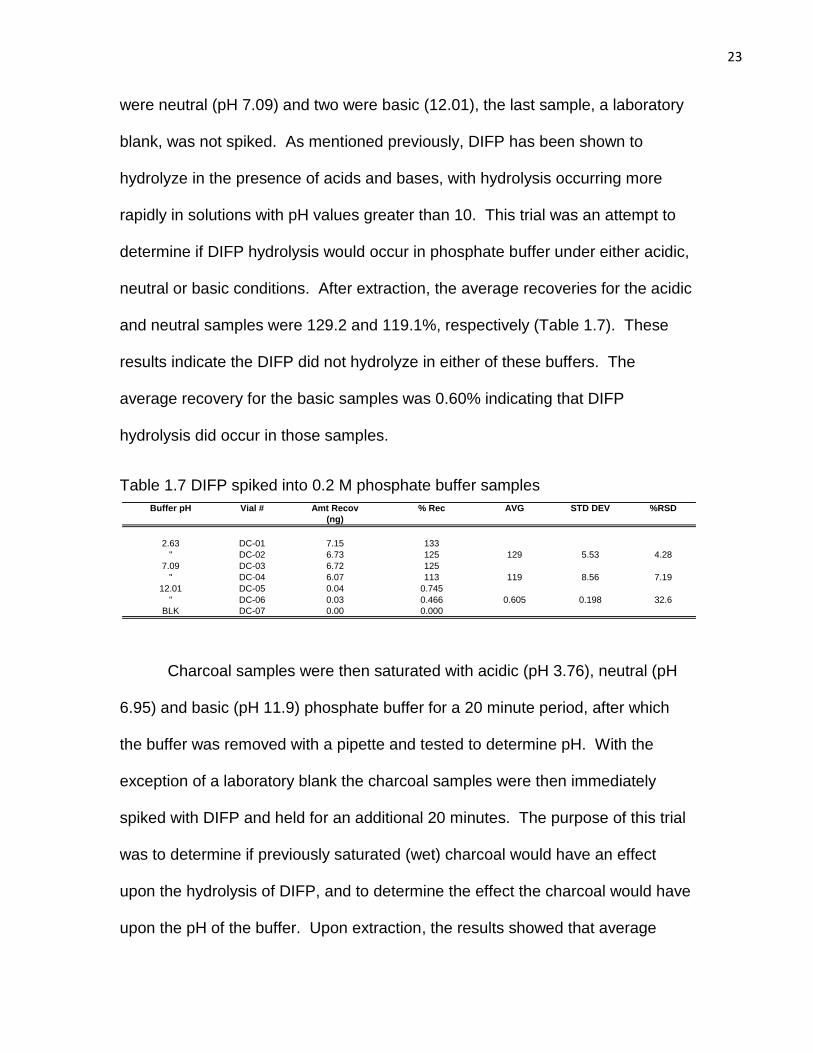
23
were neutral (pH 7.09) and two were basic (12.01), the last sample, a laboratory
blank, was not spiked. As mentioned previously, DIFP has been shown to
hydrolyze in the presence of acids and bases, with hydrolysis occurring more
rapidly in solutions with pH values greater than 10. This trial was an attempt to
determine if DIFP hydrolysis would occur in phosphate buffer under either acidic,
neutral or basic conditions. After extraction, the average recoveries for the acidic
and neutral samples were 129.2 and 119.1%, respectively (Table 1.7). These
results indicate the DIFP did not hydrolyze in either of these buffers. The
average recovery for the basic samples was 0.60% indicating that DIFP
hydrolysis did occur in those samples.
Table 1.7 DIFP spiked into 0.2 M phosphate buffer samples
Charcoal samples were then saturated with acidic (pH 3.76), neutral (pH
6.95) and basic (pH 11.9) phosphate buffer for a 20 minute period, after which
the buffer was removed with a pipette and tested to determine pH. With the
exception of a laboratory blank the charcoal samples were then immediately
spiked with DIFP and held for an additional 20 minutes. The purpose of this trial
was to determine if previously saturated (wet) charcoal would have an effect
upon the hydrolysis of DIFP, and to determine the effect the charcoal would have
upon the pH of the buffer. Upon extraction, the results showed that average
Buffer pH Vial # Amt Recov % Rec AVG STD DEV %RSD
(ng)
2.63 DC-01 7.15 133
" DC-02 6.73 125 129 5.53 4.28
7.09 DC-03 6.72 125
" DC-04 6.07 113 119 8.56 7.19
12.01 DC-05 0.04 0.745
" DC-06 0.03 0.466 0.605 0.198 32.6
BLK DC-07 0.00 0.000
24
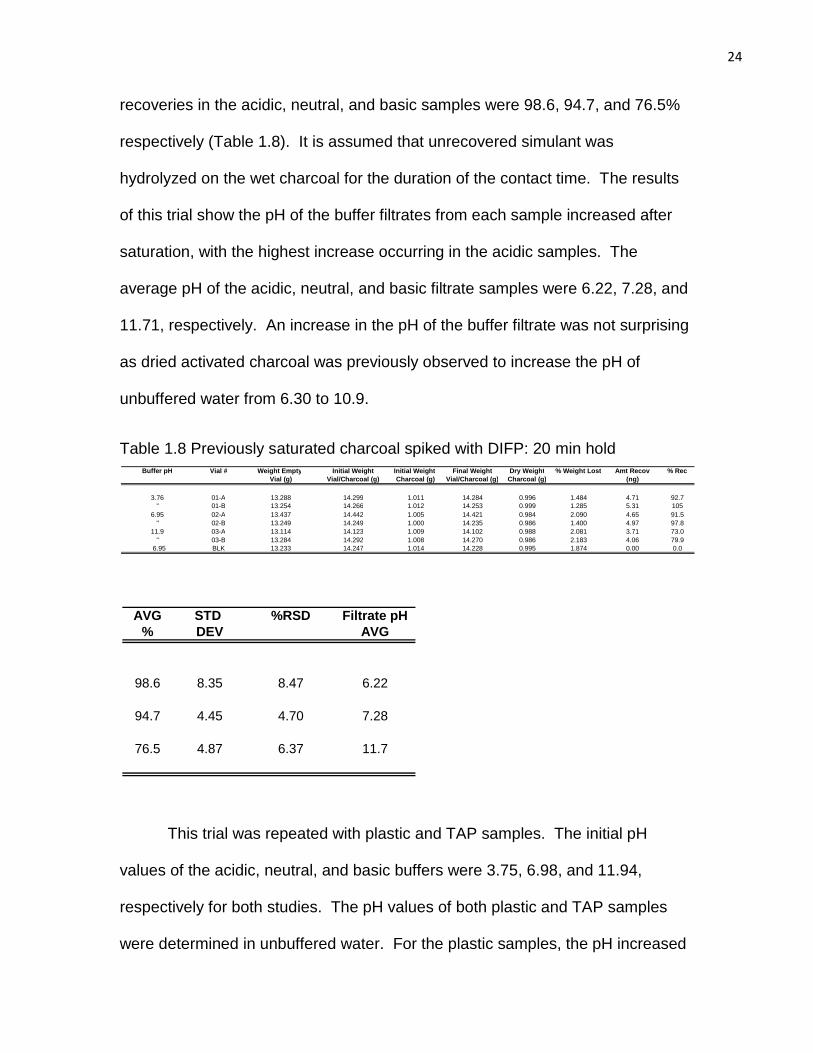
recoveries in the acidic, neutral, and basic samples were 98.6, 94.7, and 76.5%
respectively (Table 1.8). It is assumed that unrecovered simulant was
hydrolyzed on the wet charcoal for the duration of the contact time. The results
of this trial show the pH of the buffer filtrates from each sample increased after
saturation, with the highest increase occurring in the acidic samples. The
average pH of the acidic, neutral, and basic filtrate samples were 6.22, 7.28, and
11.71, respectively. An increase in the pH of the buffer filtrate was not surprising
as dried activated charcoal was previously observed to increase the pH of
unbuffered water from 6.30 to 10.9.
Table 1.8 Previously saturated charcoal spiked with DIFP: 20 min hold
This trial was repeated with plastic and TAP samples. The initial pH
values of the acidic, neutral, and basic buffers were 3.75, 6.98, and 11.94,
respectively for both studies. The pH values of both plastic and TAP samples
were determined in unbuffered water. For the plastic samples, the pH increased
AVG STD %RSD Filtrate pH
% DEV AVG
98.6 8.35 8.47 6.22
94.7 4.45 4.70 7.28
76.5 4.87 6.37 11.7
Buffer pH Vial # Weight Empty Initial Weight Initial Weight Final Weight Dry Weight % Weight Lost Amt Recov % Rec
Vial (g) Vial/Charcoal (g) Charcoal (g) Vial/Charcoal (g) Charcoal (g) (ng) 3.76 01-A 13.288 14.299 1.011 14.284 0.996 1.484 4.71 92.7 " 01-B 13.254 14.266 1.012 14.253 0.999 1.285 5.31 105
6.95 02-A 13.437 14.442 1.005 14.421 0.984 2.090 4.65 91.5 " 02-B 13.249 14.249 1.000 14.235 0.986 1.400 4.97 97.8
11.9 03-A 13.114 14.123 1.009 14.102 0.988 2.081 3.71 73.0 " 03-B 13.284 14.292 1.008 14.270 0.986 2.183 4.06 79.9
6.95 BLK 13.233 14.247 1.014 14.228 0.995 1.874 0.00 0.0
25
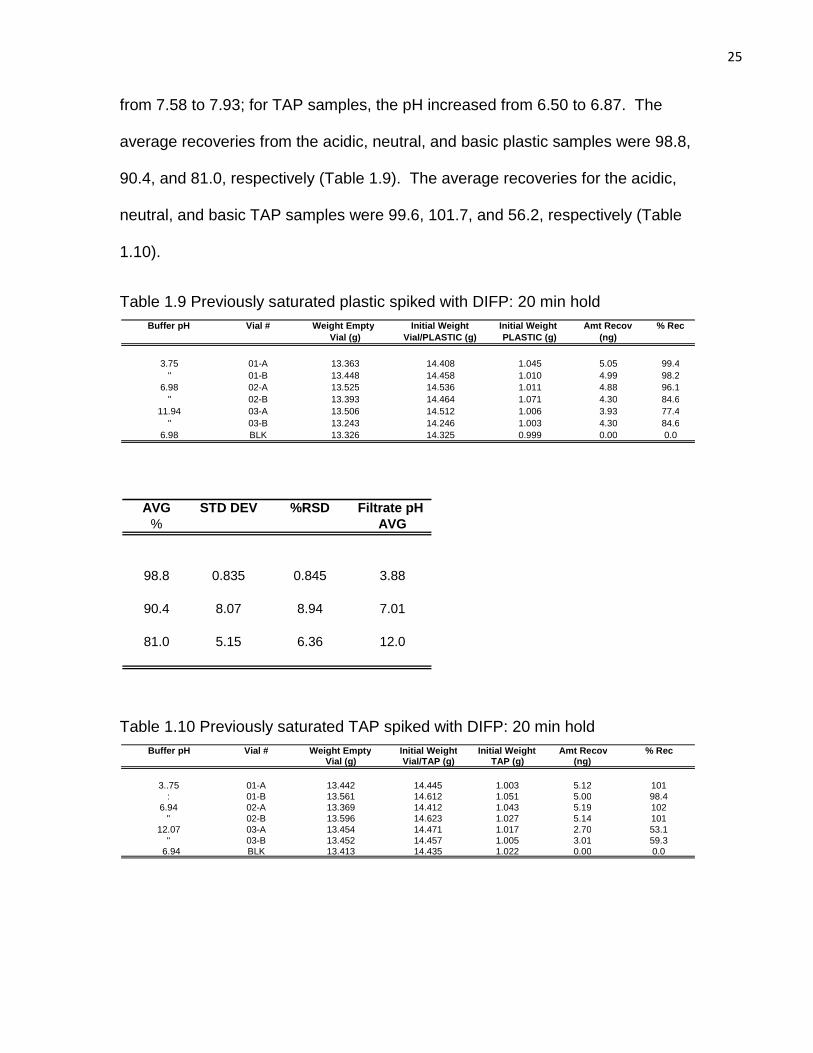
from 7.58 to 7.93; for TAP samples, the pH increased from 6.50 to 6.87. The
average recoveries from the acidic, neutral, and basic plastic samples were 98.8,
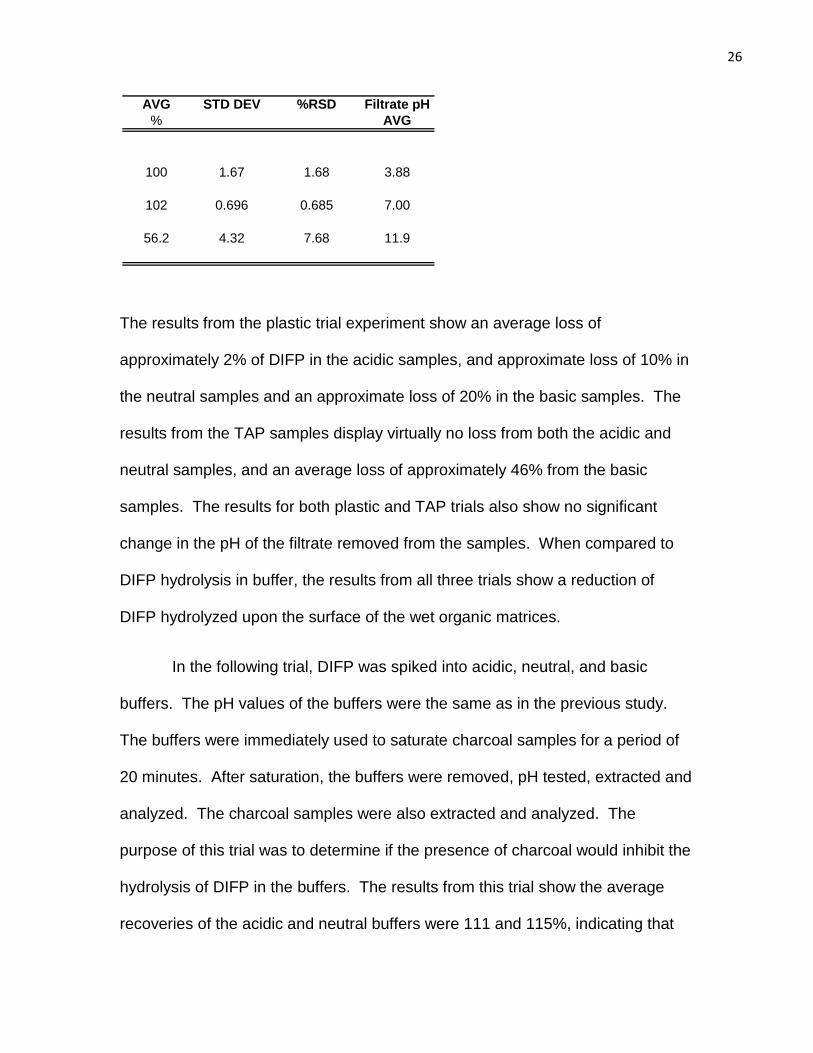
90.4, and 81.0, respectively (Table 1.9). The average recoveries for the acidic,
neutral, and basic TAP samples were 99.6, 101.7, and 56.2, respectively (Table
1.10).
Table 1.9 Previously saturated plastic spiked with DIFP: 20 min hold
Table 1.10 Previously saturated TAP spiked with DIFP: 20 min hold
AVG STD DEV %RSD Filtrate pH
% AVG
98.8 0.835 0.845 3.88
90.4 8.07 8.94 7.01
81.0 5.15 6.36 12.0
Buffer pH Vial # Weight Empty Initial Weight Initial Weight Amt Recov % Rec Vial (g) Vial/TAP (g) TAP (g) (ng)
3..75 01-A 13.442 14.445 1.003 5.12 101 : 01-B 13.561 14.612 1.051 5.00 98.4
6.94 02-A 13.369 14.412 1.043 5.19 102 " 02-B 13.596 14.623 1.027 5.14 101
12.07 03-A 13.454 14.471 1.017 2.70 53.1 " 03-B 13.452 14.457 1.005 3.01 59.3
6.94 BLK 13.413 14.435 1.022 0.00 0.0
Buffer pH Vial # Weight Empty Initial Weight Initial Weight Amt Recov % Rec Vial (g) Vial/PLASTIC (g) PLASTIC (g) (ng)
3.75 01-A 13.363 14.408 1.045 5.05 99.4
" 01-B 13.448 14.458 1.010 4.99 98.2 6.98 02-A 13.525 14.536 1.011 4.88 96.1
" 02-B 13.393 14.464 1.071 4.30 84.6 11.94 03-A 13.506 14.512 1.006 3.93 77.4
" 03-B 13.243 14.246 1.003 4.30 84.6 6.98 BLK 13.326 14.325 0.999 0.00 0.0
26
The results from the plastic trial experiment show an average loss of
approximately 2% of DIFP in the acidic samples, and approximate loss of 10% in
the neutral samples and an approximate loss of 20% in the basic samples. The
results from the TAP samples display virtually no loss from both the acidic and
neutral samples, and an average loss of approximately 46% from the basic
samples. The results for both plastic and TAP trials also show no significant
change in the pH of the filtrate removed from the samples. When compared to
DIFP hydrolysis in buffer, the results from all three trials show a reduction of
DIFP hydrolyzed upon the surface of the wet organic matrices.
In the following trial, DIFP was spiked into acidic, neutral, and basic
buffers. The pH values of the buffers were the same as in the previous study.
The buffers were immediately used to saturate charcoal samples for a period of
20 minutes. After saturation, the buffers were removed, pH tested, extracted and
analyzed. The charcoal samples were also extracted and analyzed. The
purpose of this trial was to determine if the presence of charcoal would inhibit the
hydrolysis of DIFP in the buffers. The results from this trial show the average
recoveries of the acidic and neutral buffers were 111 and 115%, indicating that
AVG STD DEV %RSD Filtrate pH
% AVG
100 1.67 1.68 3.88
102 0.696 0.685 7.00
56.2 4.32 7.68 11.9
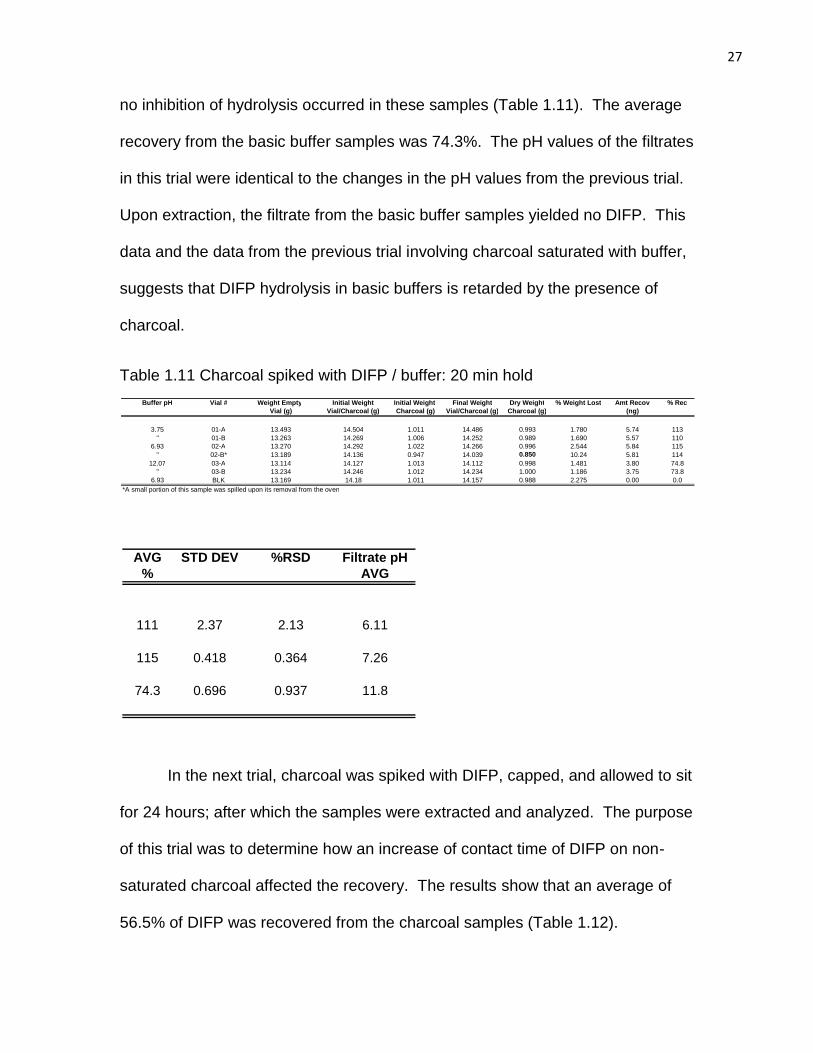
27
no inhibition of hydrolysis occurred in these samples (Table 1.11). The average
recovery from the basic buffer samples was 74.3%. The pH values of the filtrates
in this trial were identical to the changes in the pH values from the previous trial.
Upon extraction, the filtrate from the basic buffer samples yielded no DIFP. This
data and the data from the previous trial involving charcoal saturated with buffer,
suggests that DIFP hydrolysis in basic buffers is retarded by the presence of
charcoal.
Table 1.11 Charcoal spiked with DIFP / buffer: 20 min hold
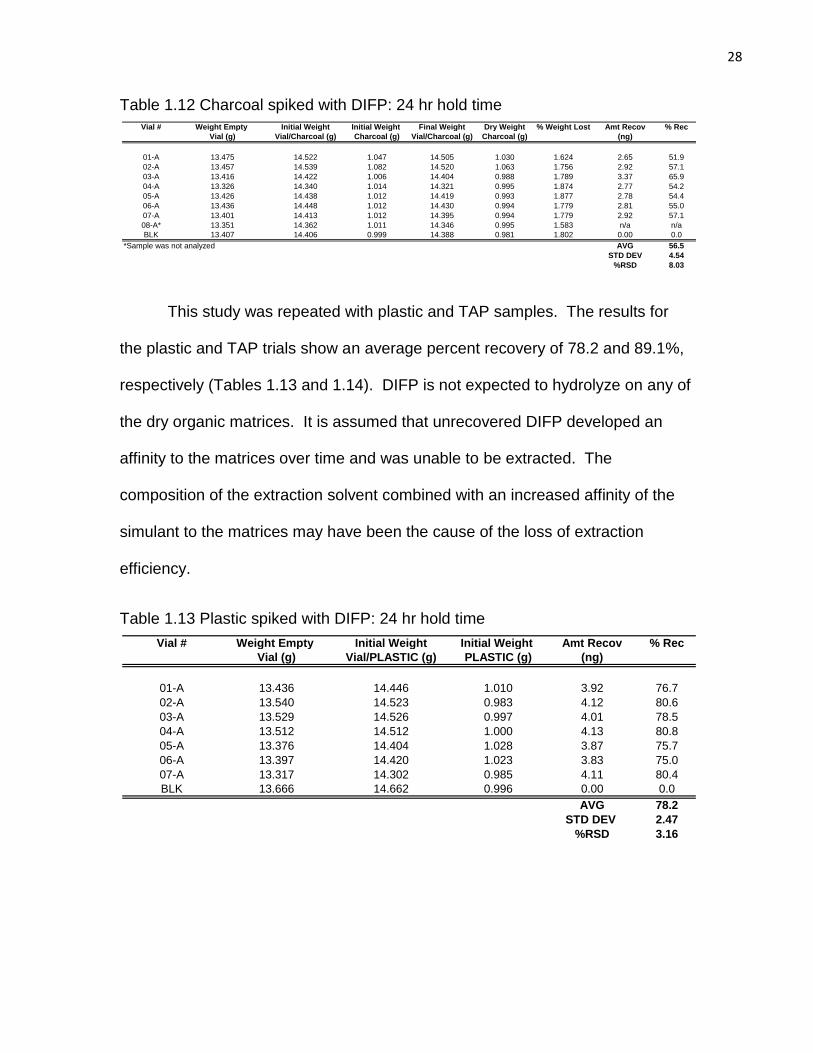
In the next trial, charcoal was spiked with DIFP, capped, and allowed to sit
for 24 hours; after which the samples were extracted and analyzed. The purpose
of this trial was to determine how an increase of contact time of DIFP on non-
saturated charcoal affected the recovery. The results show that an average of
56.5% of DIFP was recovered from the charcoal samples (Table 1.12).
AVG STD DEV %RSD Filtrate pH
% AVG
111 2.37 2.13 6.11
115 0.418 0.364 7.26
74.3 0.696 0.937 11.8
Buffer pH Vial # Weight Empty Initial Weight Initial Weight Final Weight Dry Weight % Weight Lost Amt Recov % Rec
Vial (g) Vial/Charcoal (g) Charcoal (g) Vial/Charcoal (g) Charcoal (g) (ng) 3.75 01-A 13.493 14.504 1.011 14.486 0.993 1.780 5.74 113 " 01-B 13.263 14.269 1.006 14.252 0.989 1.690 5.57 110
6.93 02-A 13.270 14.292 1.022 14.266 0.996 2.544 5.84 115 " 02-B* 13.189 14.136 0.947 14.039 0.850 10.24 5.81 114
12.07 03-A 13.114 14.127 1.013 14.112 0.998 1.481 3.80 74.8 " 03-B 13.234 14.246 1.012 14.234 1.000 1.186 3.75 73.8
6.93 BLK 13.169 14.18 1.011 14.157 0.988 2.275 0.00 0.0 *A small portion of this sample was spilled upon its removal from the oven
28
Table 1.12 Charcoal spiked with DIFP: 24 hr hold time
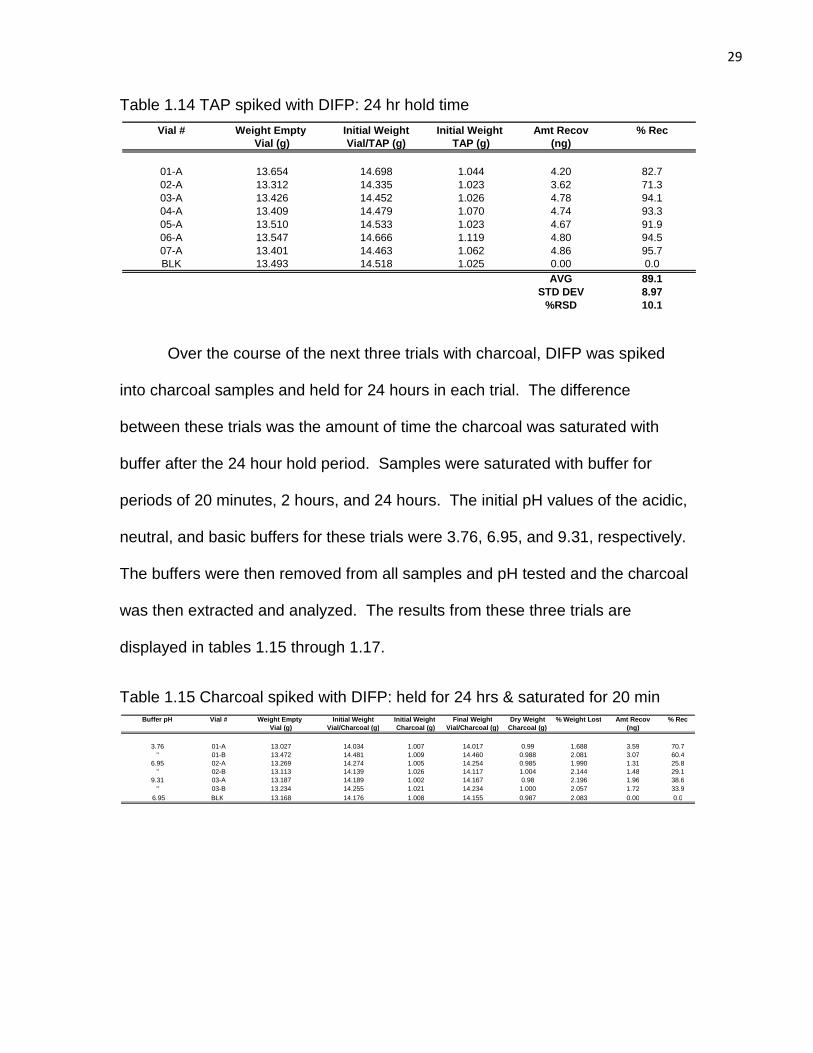
This study was repeated with plastic and TAP samples. The results for
the plastic and TAP trials show an average percent recovery of 78.2 and 89.1%,
respectively (Tables 1.13 and 1.14). DIFP is not expected to hydrolyze on any of
the dry organic matrices. It is assumed that unrecovered DIFP developed an
affinity to the matrices over time and was unable to be extracted. The
composition of the extraction solvent combined with an increased affinity of the
simulant to the matrices may have been the cause of the loss of extraction
efficiency.
Table 1.13 Plastic spiked with DIFP: 24 hr hold time
Vial # Weight Empty Initial Weight Initial Weight Final Weight Dry Weight % Weight Lost Amt Recov % Rec
Vial (g) Vial/Charcoal (g) Charcoal (g) Vial/Charcoal (g) Charcoal (g) (ng)
01-A 13.475 14.522 1.047 14.505 1.030 1.624 2.65 51.9
02-A 13.457 14.539 1.082 14.520 1.063 1.756 2.92 57.1
03-A 13.416 14.422 1.006 14.404 0.988 1.789 3.37 65.9
04-A 13.326 14.340 1.014 14.321 0.995 1.874 2.77 54.2
05-A 13.426 14.438 1.012 14.419 0.993 1.877 2.78 54.4
06-A 13.436 14.448 1.012 14.430 0.994 1.779 2.81 55.0
07-A 13.401 14.413 1.012 14.395 0.994 1.779 2.92 57.1
08-A* 13.351 14.362 1.011 14.346 0.995 1.583 n/a n/a
BLK 13.407 14.406 0.999 14.388 0.981 1.802 0.00 0.0
*Sample was not analyzed AVG 56.5
STD DEV 4.54
%RSD 8.03
Vial # Weight Empty Initial Weight Initial Weight Amt Recov % Rec
Vial (g) Vial/PLASTIC (g) PLASTIC (g) (ng)
01-A 13.436 14.446 1.010 3.92 76.7
02-A 13.540 14.523 0.983 4.12 80.6
03-A 13.529 14.526 0.997 4.01 78.5
04-A 13.512 14.512 1.000 4.13 80.8
05-A 13.376 14.404 1.028 3.87 75.7
06-A 13.397 14.420 1.023 3.83 75.0
07-A 13.317 14.302 0.985 4.11 80.4
BLK 13.666 14.662 0.996 0.00 0.0
AVG 78.2
STD DEV 2.47
%RSD 3.16
29
Table 1.14 TAP spiked with DIFP: 24 hr hold time
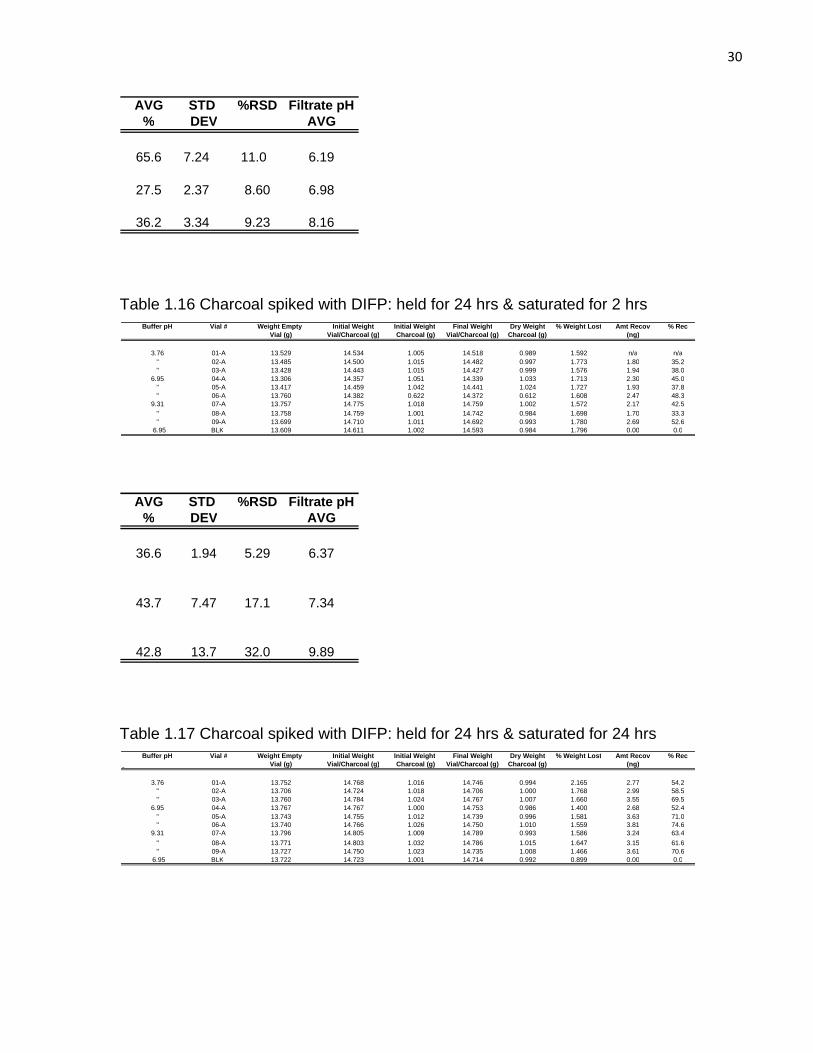
Over the course of the next three trials with charcoal, DIFP was spiked
into charcoal samples and held for 24 hours in each trial. The difference
between these trials was the amount of time the charcoal was saturated with
buffer after the 24 hour hold period. Samples were saturated with buffer for
periods of 20 minutes, 2 hours, and 24 hours. The initial pH values of the acidic,
neutral, and basic buffers for these trials were 3.76, 6.95, and 9.31, respectively.
The buffers were then removed from all samples and pH tested and the charcoal
was then extracted and analyzed. The results from these three trials are
displayed in tables 1.15 through 1.17.
Table 1.15 Charcoal spiked with DIFP: held for 24 hrs & saturated for 20 min
Vial # Weight Empty Initial Weight Initial Weight Amt Recov % Rec
Vial (g) Vial/TAP (g) TAP (g) (ng)
01-A 13.654 14.698 1.044 4.20 82.7
02-A 13.312 14.335 1.023 3.62 71.3
03-A 13.426 14.452 1.026 4.78 94.1
04-A 13.409 14.479 1.070 4.74 93.3
05-A 13.510 14.533 1.023 4.67 91.9
06-A 13.547 14.666 1.119 4.80 94.5
07-A 13.401 14.463 1.062 4.86 95.7
BLK 13.493 14.518 1.025 0.00 0.0
AVG 89.1
STD DEV 8.97
%RSD 10.1
Buffer pH Vial # Weight Empty Initial Weight Initial Weight Final Weight Dry Weight % Weight Lost Amt Recov % Rec
Vial (g) Vial/Charcoal (g) Charcoal (g) Vial/Charcoal (g) Charcoal (g) (ng) 3.76 01-A 13.027 14.034 1.007 14.017 0.99 1.688 3.59 70.7 " 01-B 13.472 14.481 1.009 14.460 0.988 2.081 3.07 60.4
6.95 02-A 13.269 14.274 1.005 14.254 0.985 1.990 1.31 25.8 " 02-B 13.113 14.139 1.026 14.117 1.004 2.144 1.48 29.1
9.31 03-A 13.187 14.189 1.002 14.167 0.98 2.196 1.96 38.6 " 03-B 13.234 14.255 1.021 14.234 1.000 2.057 1.72 33.9
6.95 BLK 13.168 14.176 1.008 14.155 0.987 2.083 0.00 0.0
30
Table 1.16 Charcoal spiked with DIFP: held for 24 hrs & saturated for 2 hrs
Table 1.17 Charcoal spiked with DIFP: held for 24 hrs & saturated for 24 hrs
Buffer pH Vial # Weight Empty Initial Weight Initial Weight Final Weight Dry Weight % Weight Lost Amt Recov % Rec
Vial (g) Vial/Charcoal (g) Charcoal (g) Vial/Charcoal (g) Charcoal (g) (ng) 3.76 01-A 13.752 14.768 1.016 14.746 0.994 2.165 2.77 54.2 " 02-A 13.706 14.724 1.018 14.706 1.000 1.768 2.99 58.5 " 03-A 13.760 14.784 1.024 14.767 1.007 1.660 3.55 69.5
6.95 04-A 13.767 14.767 1.000 14.753 0.986 1.400 2.68 52.4 " 05-A 13.743 14.755 1.012 14.739 0.996 1.581 3.63 71.0 " 06-A 13.740 14.766 1.026 14.750 1.010 1.559 3.81 74.6
9.31 07-A 13.796 14.805 1.009 14.789 0.993 1.586 3.24 63.4 " 08-A 13.771 14.803 1.032 14.786 1.015 1.647 3.15 61.6 " 09-A 13.727 14.750 1.023 14.735 1.008 1.466 3.61 70.6
6.95 BLK 13.722 14.723 1.001 14.714 0.992 0.899 0.00 0.0
AVG STD %RSD Filtrate pH % DEV AVG
36.6 1.94 5.29 6.37
43.7 7.47 17.1 7.34
42.8 13.7 32.0 9.89
Buffer pH Vial # Weight Empty Initial Weight Initial Weight Final Weight Dry Weight % Weight Lost Amt Recov % Rec
Vial (g) Vial/Charcoal (g) Charcoal (g) Vial/Charcoal (g) Charcoal (g) (ng) 3.76 01-A 13.529 14.534 1.005 14.518 0.989 1.592 n/a n/a " 02-A 13.485 14.500 1.015 14.482 0.997 1.773 1.80 35.2 " 03-A 13.428 14.443 1.015 14.427 0.999 1.576 1.94 38.0
6.95 04-A 13.306 14.357 1.051 14.339 1.033 1.713 2.30 45.0 " 05-A 13.417 14.459 1.042 14.441 1.024 1.727 1.93 37.8 " 06-A 13.760 14.382 0.622 14.372 0.612 1.608 2.47 48.3
9.31 07-A 13.757 14.775 1.018 14.759 1.002 1.572 2.17 42.5 " 08-A 13.758 14.759 1.001 14.742 0.984 1.698 1.70 33.3 " 09-A 13.699 14.710 1.011 14.692 0.993 1.780 2.69 52.6
6.95 BLK 13.609 14.611 1.002 14.593 0.984 1.796 0.00 0.0
AVG STD %RSD Filtrate pH % DEV AVG
65.6 7.24 11.0 6.19
27.5 2.37 8.60 6.98
36.2 3.34 9.23 8.16
31
Throughout the three trials, the results show the average amount of DIFP
recovered from the acidic samples after a 24 hour hold period was 65.6% (20
minute saturation), 36.6% (2 hour saturation), and 61.7% (24 hour saturation).
The average amount recovered from the neutral samples was 27.5% (20 minute
saturation), 43.7% (2 hour saturation), and 66.5% (24 hour saturation). The
average amount recovered from the basic samples was 36.2%, (20 minute
saturation), 42.8% (2 hour saturation), and 35.3% (24 hour saturation). The
results for the pH values of the filtrates show increases similar to previous trials,
with the highest increase occurring in the acidic samples. The results also show
that the pH of the charcoal samples and the amount of contact time of DIFP upon
the samples significantly affect the recovery of DIFP.
Based on the results, it is assumed that prolonged exposure to aqueous
environments may be responsible for the increased displacement of DIFP. The
result of this is an increased recovery of DIFP in the neutral samples over time.
Since the amount of DIFP recovered from dry charcoal after a 24 hour period
averaged approximately 57% (Table 1.7), the remaining 43% of DIFP remains
unaccounted. A closer examination of the data reveals that the acidic and
AVG STD %RSD Filtrate pH % DEV AVG
61.7 7.87 12.7 6.53
66.5 11.9 17.9 7.74
35.3 4.77 13.5 9.86
32
neutral samples had DIFP recoveries averaging 62 and 67%, respectively for
samples saturated for 24 hours. Combining these amounts with the 43% of DIFP
that is unaccounted for yields the total amount of DIFP spiked into these
samples. For the basic samples, this 43% combined with the 35% recovered
accounts for approximately 78% of DIFP, the other 22% is believed to be
hydrolyzed. This reasoning is based upon the results of a previous trial (Table
1.8) in which a similar amount of DIFP was hydrolyzed on wet charcoal.
1.3.2 Buffer selection
Because of the pH values of waste streams at the CDF, it was decided
that a buffer system encompassing the acidic, neutral, and basic range of the pH
scale would be used to investigate simulant hydrolysis. Initially, the decision to
use just one buffer system was made to keep to a minimal any extraneous and
interfering variables that may otherwise give way to suspect data. Because of
the tendency of phosphoric acid (H3PO4) to undergo three ionizations, in the
acidic, neutral, and basic ranges of the pH scale with pKa values of 2.0, 6.8,
12.0, respectively, this buffer system was the one chosen for use. However,
because of the availability of CE for fluoride detection, it was decided that any
buffer systems used for simulant hydrolysis would have to also be compatible
with CE. Because of low competition with UV detection during CE analysis 2.0
mL volumes of acetate, borate, and disodium tetraborate buffers, each at final
concentration of 5 mM, were tested for use in place of the phosphate buffer
system. The simulant to buffer mole ratio for the hydrolysis reaction was
determined to be 1:171. A preliminary test was completed using these buffer
33
systems as the acidic, neutral, and basic replacements. Eight samples were
spiked with DIFP, held for 1 minute, and saturated with buffers for 2.5 hours.
The results show approximately all of the DIFP was recovered from the samples
with the exception of the neutral samples (Table 1.18). The studies involving CE
are ongoing.
Table 1.18 Charcoal spiked with DIFP: held for 1 min & saturated for 2.5 hrs
1.3.3 DIFP hydrolysis in multiple buffers
In a series of three experiments titled DB-1, DB-2, and DB-3, the GB
analog DIFP was spiked into acetate, boric acid, and disodium tetraborate
buffers and the samples were allowed to sit for 1 minute, 2 hours, and 24, hours
respectively. After the samples were vortexed and set aside, all samples were
then extracted and the organic layer was analyzed using the GC-FPD. The
results of each experiment are displayed in tables 1.19 through 1.21. The goal
here was to compare the amount of time it took for DIFP to interact and ultimately
undergo hydrolysis in multiple buffered aqueous solutions with different pH
values.
Buffer pH Vial # Weight Empty Initial Weight Initial Weight Final Weight Dry Weight % Weight Lost Amt Recov % Rec AVG STD %RSD
Vial (g) Vial/Charcoal (g) Charcoal (g) Vial/Charcoal (g) Charcoal (g) (ng) % DEV
1.50 A-2 13.721 14.735 1.014 14.717 0.996 1.775 5.08 99.4
" A-3 13.794 14.800 1.006 14.783 0.989 1.690 5.35 104.7 102.0 3.76 3.69
3.88 B-2 13.778 14.786 1.008 14.768 0.990 1.786 4.75 93.0
" B-3 13.786 14.794 1.008 14.776 0.990 1.786 5.14 100.6 96.8 5.40 5.58
7.00 C-2 13.812 14.853 1.041 14.834 1.022 1.825 4.50 88.1
" C-3 13.786 14.798 1.012 14.779 0.993 1.877 4.80 93.9 91.0 4.15 4.56
9.45 D-2* 13.744 14.769 1.025 14.751 1.007 1.756 2.80 54.8
" D-3 13.746 14.750 1.004 14.731 0.985 1.892 5.36 104.9 104.9 0.00 0.00
7.00 BLK 13.722 14.735 1.013 14.718 0.996 1.678 0.00 0.00
*A portion of this sample was spilled upon extraction and was not averaged.
34
Table 1.19 Multiple buffers spiked with DIFP: 1 min hold time (DB-1)
Table 1.20 Multiple buffers spiked with DIFP: 2 hr hold time (DB-2)
Table 1.21 Multiple buffers spiked with DIFP: 24 hr hold time (DB-3)
*Sample was saturated with 1 mL of buffer
In experiment DB-1, the results show that that approximately 14% of DIFP
was hydrolyzed in all samples (Table 1.19). Because of the similarities in the
amounts hydrolyzed in each sample, it can be stated that initial DIFP degradation
Buffer pH Vial # Amt Recov % Rec AVG STD %RSD (ng) DEV
2.88 A-1 4.12 82.4 " A-2 4.20 84.0 " A-3 4.35 87.0 84.7 0.163 0.192
6.98 N-1 4.31 86.2 " N-2 4.22 84.4 " N-3 4.00 80.0 83.1 0.219 0.264
9.92 B-1 0.16 3.12 " B-2 0.20 3.92 " B-3* 0.32 6.40 3.52 0.028 0.804
6.98 BLK 0.00 0.0
Buffer pH Vial # Amt Recov % Rec AVG STD %RSD (ng) DEV
2.88 A-1 4.41 88.2 " A-2 4.49 89.8 " A-3 4.25 85.0 87.7 0.122 0.139
6.98 N-1 4.51 90.2 " N-2 4.53 90.6 " N-3 4.54 90.8 90.5 0.015 0.017
9.92 B-1 3.67 73.4 " B-2 3.41 68.2 " B-3 3.71 74.2 71.9 0.163 0.226
6.98 BLK 0.00 0.0
Buffer pH Vial # Amt Recov % Rec AVG STD %RSD (ng) DEV
2.88 A-1 4.31 86.2 " A-2 4.44 88.8 " A-3 4.18 83.6 86.2 2.60 3.02
6.98 N-1 4.44 88.8 " N-2 4.40 88.0 " N-3 4.12 82.4 86.4 3.49 4.04
9.92 B-1 4.47 89.4 " B-2 4.44 88.8 " B-3 4.42 88.4 88.9 0.503 0.566
6.98 BLK 0.00 0.0
35
during the first minute of exposure is independent of pH in the experimental
range tested. The results for DB-2 indicate that after a 2 hour period further
degradation of hydrolysis occurred in the basic buffer samples, with an average
loss of 28.1% (Table 1.20). The amount of degradation in the acidic and neutral
buffer samples averaged 12.3 and 9.5% respectively. Results for DB-3 show
that during this experiment, a 15% average of DIFP was hydrolyzed from the
acidic samples and an average of 17% of DIFP was hydrolyzed from the neutral
samples (Table 1.21). The basic buffer samples displayed the most degradation
with an average DIFP loss of 97%. These results seem to be consistent with the
previously reported results regarding elevated hydrolysis of GB at pH values of
10 or higher.
Upon comparing the results from DB-2, to the results from DB-1, it
becomes evident that the amount of DIFP degraded was slightly higher during
experiment DB-2 (2 – 4% higher) for both the acidic and neutral buffer samples.
Small fluctuations in the temperature and humidity of the lab may have been
responsible for this difference. The results of the basic buffer samples between
the two studies shows an increased amount of hydrolysis in experiment DB-2 by
a factor of 2. The hydrolysis increase may correlate with the increase of the hold
time for that experiment. A comparison of the results between experiments DB-
1and DB-3 shows that the amount of DIFP degradation in the acidic and neutral
samples remained relatively constant between the two experiments, while the
amount of degradation in the basic samples during experiment DB-3 exceeded
the amount of degradation in experiment DB-1 by a 7:1 ratio. The data also
36
shows that the amount of DIFP hydrolyzed in the basic samples of DB-3
exceeded the amount of hydrolysis in DB-2 by a 7:2 ratio. This evidence
suggests most DIFP hydrolysis occurred during the first few hours of exposure to
the basic buffer.
During experiment DB-3, all experimental vials except one contained 2 mL
of buffer to 250 µL of simulant for an 8:1 buffer to DIFP volume ratio and a
corresponding 171:1 mole ratio. One of the three basic sample vials was
accidently filled with only 1 mL of buffer for a 4:1 buffer to simulant ratio and a
corresponding 171:2. All other vials were filled with 2 mL of buffer. This sample
containing 1 mL was spiked with the same amount of DIFP as all other samples
(excluding the control) and allowed to sit for the same period and under the same
conditions as the other samples. This sample was also extracted and analyzed
under the same conditions as the other samples. Results show the percent
recovery for this sample was 6.4% or approximately twice as high as the other
two samples that were filled with 2 mL of buffer (Table 1.20). Collectively, this
evidence suggests that even in excess, the buffer: simulant mole ratio
significantly affects the amount of DIFP hydrolyzed in buffered solutions. The
other factors are contact time and buffer solution pH.
1.3.4 DIFP hydrolysis in charcoal samples
Three experiments in which DIFP was spiked into charcoal were titled DC-
1, DC-2, and DC-3. In each experiment, the organic layers of each extract were
analyzed on the GC-FPD and the amounts reported represent average
37
recoveries for the group (3 samples for each buffer type) unless otherwise stated.
In experiment DC-1, DIFP was spiked into 7 charcoal samples without buffer,
held for 1 minute, vortexed for 30 seconds, extracted, and analyzed. In DC-2,
DIFP was spiked into 12 charcoal samples, all were vortexed for 1 minute, and
held for 24 hours after which three of the samples were extracted and analyzed.
Of the remaining 9 samples, 3 were saturated with the acidic buffer, 3 were
saturated with the neutral buffer, and 3 were saturated with the basic buffer, all
were then vortexed for 1 minute and held for 30 minutes each. After this, a
pipette was used to remove the buffers and the remaining charcoal was
extracted and analyzed. In DC-3, all 9 charcoal samples were spiked with DIFP,
vortexed for 1 minute, and set aside for 24 hours. The samples were then
saturated with buffer (3 for each buffer type), vortexed for 1 minute, and set aside
for an additional 24 hours. The buffer was removed as before and the remaining
charcoal was then extracted and analyzed. The results for each experiment are
displayed in tables 1.22 – 1.24.
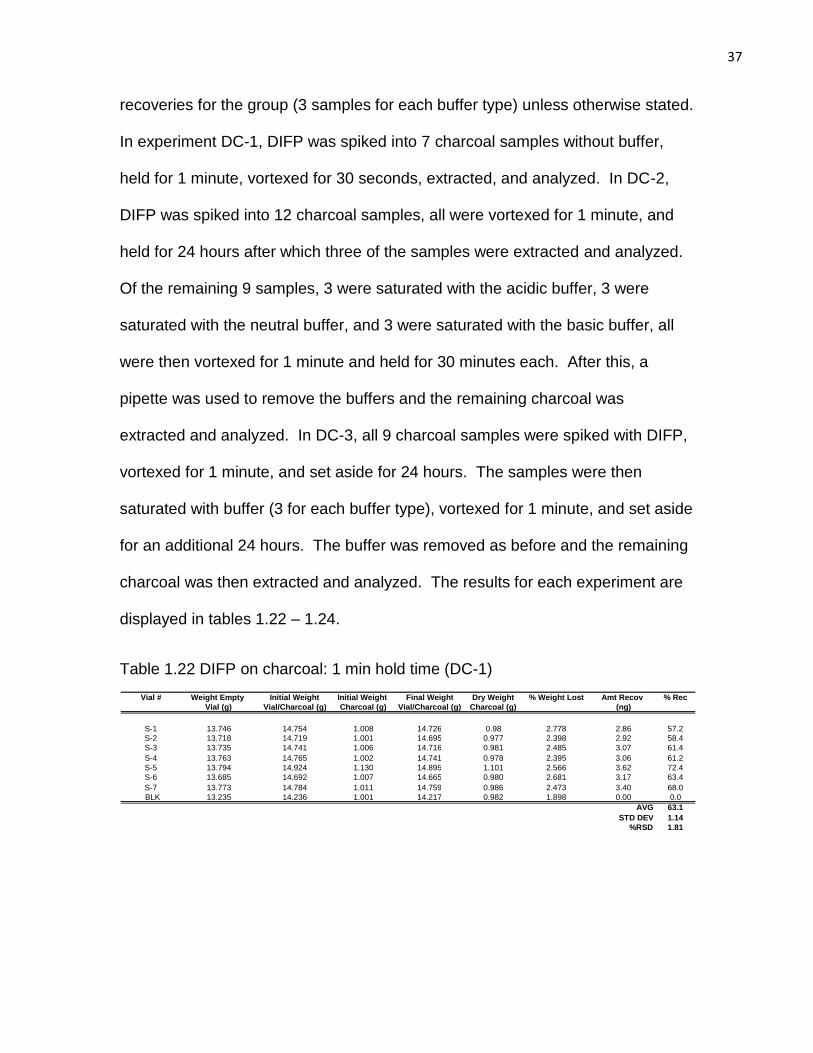
Table 1.22 DIFP on charcoal: 1 min hold time (DC-1)
Vial # Weight Empty Initial Weight Initial Weight Final Weight Dry Weight % Weight Lost Amt Recov % Rec Vial (g) Vial/Charcoal (g) Charcoal (g) Vial/Charcoal (g) Charcoal (g) (ng)
S-1 13.746 14.754 1.008 14.726 0.98 2.778 2.86 57.2 S-2 13.718 14.719 1.001 14.695 0.977 2.398 2.92 58.4 S-3 13.735 14.741 1.006 14.716 0.981 2.485 3.07 61.4 S-4 13.763 14.765 1.002 14.741 0.978 2.395 3.06 61.2 S-5 13.794 14.924 1.130 14.895 1.101 2.566 3.62 72.4 S-6 13.685 14.692 1.007 14.665 0.980 2.681 3.17 63.4 S-7 13.773 14.784 1.011 14.759 0.986 2.473 3.40 68.0
BLK 13.235 14.236 1.001 14.217 0.982 1.898 0.00 0.0 AVG 63.1
STD DEV 1.14 %RSD 1.81
38
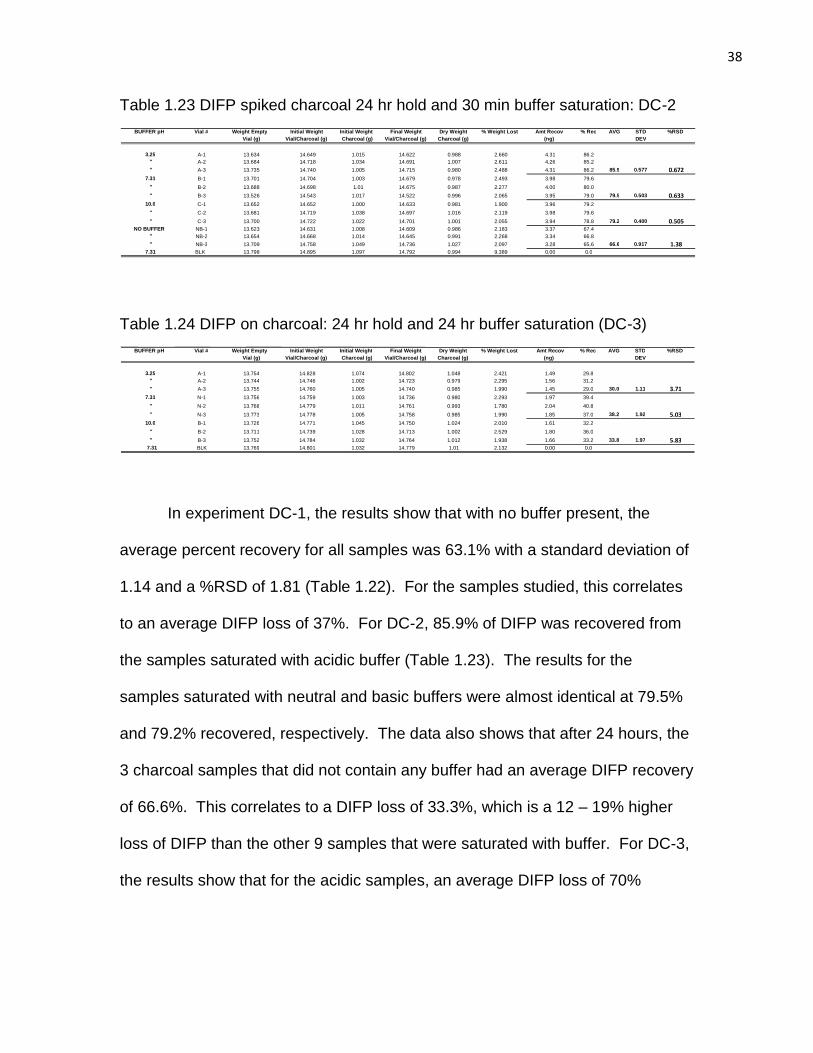
Table 1.23 DIFP spiked charcoal 24 hr hold and 30 min buffer saturation: DC-2
Table 1.24 DIFP on charcoal: 24 hr hold and 24 hr buffer saturation (DC-3)
In experiment DC-1, the results show that with no buffer present, the
average percent recovery for all samples was 63.1% with a standard deviation of
1.14 and a %RSD of 1.81 (Table 1.22). For the samples studied, this correlates
to an average DIFP loss of 37%. For DC-2, 85.9% of DIFP was recovered from
the samples saturated with acidic buffer (Table 1.23). The results for the
samples saturated with neutral and basic buffers were almost identical at 79.5%
and 79.2% recovered, respectively. The data also shows that after 24 hours, the
3 charcoal samples that did not contain any buffer had an average DIFP recovery
of 66.6%. This correlates to a DIFP loss of 33.3%, which is a 12 – 19% higher
loss of DIFP than the other 9 samples that were saturated with buffer. For DC-3,
the results show that for the acidic samples, an average DIFP loss of 70%
BUFFER pH Vial # Weight Empty Initial Weight Initial Weight Final Weight Dry Weight % Weight Lost Amt Recov % Rec AVG STD %RSD
Vial (g) Vial/Charcoal (g) Charcoal (g) Vial/Charcoal (g) Charcoal (g) (ng)
DEV 3.25 A-1 13.754 14.828 1.074 14.802 1.048 2.421 1.49 29.8 " A-2 13.744 14.746 1.002 14.723 0.979 2.295 1.56 31.2 " A-3 13.755 14.760 1.005 14.740 0.985 1.990 1.45 29.0 30.0 1.11 3.71
7.31 N-1 13.756 14.759 1.003 14.736 0.980 2.293 1.97 39.4 " N-2 13.768 14.779 1.011 14.761 0.993 1.780 2.04 40.8 " N-3 13.773 14.778 1.005 14.758 0.985 1.990 1.85 37.0 38.2 1.92 5.03
10.0 B-1 13.726 14.771 1.045 14.750 1.024 2.010 1.61 32.2 " B-2 13.711 14.739 1.028 14.713 1.002 2.529 1.80 36.0 " B-3 13.752 14.784 1.032 14.764 1.012 1.938 1.66 33.2 33.8 1.97 5.83
7.31 BLK 13.769 14.801 1.032 14.779 1.01 2.132 0.00 0.0
BUFFER pH Vial # Weight Empty Initial Weight Initial Weight Final Weight Dry Weight % Weight Lost Amt Recov % Rec AVG STD %RSD
Vial (g) Vial/Charcoal (g) Charcoal (g) Vial/Charcoal (g) Charcoal (g) (ng)
DEV 3.25 A-1 13.634 14.649 1.015 14.622 0.988 2.660 4.31 86.2 " A-2 13.684 14.718 1.034 14.691 1.007 2.611 4.26 85.2 " A-3 13.735 14.740 1.005 14.715 0.980 2.488 4.31 86.2 85.9 0.577 0.672
7.31 B-1 13.701 14.704 1.003 14.679 0.978 2.493 3.98 79.6 " B-2 13.688 14.698 1.01 14.675 0.987 2.277 4.00 80.0 " B-3 13.526 14.543 1.017 14.522 0.996 2.065 3.95 79.0 79.5 0.503 0.633
10.0 C-1 13.652 14.652 1.000 14.633 0.981 1.900 3.96 79.2 " C-2 13.681 14.719 1.038 14.697 1.016 2.119 3.98 79.6 " C-3 13.700 14.722 1.022 14.701 1.001 2.055 3.94 78.8 79.2 0.400 0.505
NO BUFFER NB-1 13.623 14.631 1.008 14.609 0.986 2.183 3.37 67.4 " NB-2 13.654 14.668 1.014 14.645 0.991 2.268 3.34 66.8 " NB-3 13.709 14.758 1.049 14.736 1.027 2.097 3.28 65.6 66.6 0.917 1.38
7.31 BLK 13.798 14.895 1.097 14.792 0.994 9.389 0.00 0.0
39
occurred (Table 1.24). The neutral samples averaged a 62% loss of DIFP and
the basic samples averaged a 66% loss of DIFP.
A closer examination of the data from DC-2 reveals that the average
amount of DIFP lost from the 3 samples with no buffer was approximately the
same as the average from samples in DC-1. There was only a 3% increase.
This indicates that under the reported experimental conditions, the amount of
DIFP able to be recovered from charcoal from the 1st minute to 24 hours later did
not increase. Since an average of 66.6% of DIFP was recovered from the 3
samples that were not saturated with buffer in DC-2, and DIFP has not previously
been observed to hydrolyze on dry charcoal, it is then assumed the unrecovered
34% has developed an affinity to and is tightly bound onto charcoal. To continue,
the samples saturated with buffer over the 30 minute period displayed lower
amounts of hydrolysis than those not saturated; there are two possibilities for
why this occurred. One possible but highly unlikely cause for this is that
hydrolyzed DIFP was regenerated after the addition of the buffer solutions and
over the 30 minute saturation period. In order for this scenario to be possible,
insufficient amounts of both hydrogen and hydroxide ions would have to be
present in the solution therefore inhibiting the DIFP reaction (Figure 2) to proceed
completely to the right. However, this was not the case as both ions were in
excess along with water. The second and more likely cause is that the 30 minute
saturation period allowed the buffer to displace a portion of the previously
unrecovered and tightly bound DIFP out of the charcoal. Upon its displacement,
40
the DIFP was subsequently extracted out of charcoal with the result being a
higher recovery of DIFP.
For DC-3, after the 24 hour saturation period, the amount of unrecovered
DIFP averaged 66% for all samples. Once DIFP was displaced from the
charcoal and allowed to interact with the buffer solutions over time, hydrolysis in
all buffer solutions may have occurred. The results of DC-3 do not clearly
indicate how much if any DIFP was still bound to the charcoal. Perhaps a portion
of DIFP may still be bound to the interior of the charcoal even after the 24 hour
saturation period. Interestingly, the basic buffer samples did not display an
elevated loss of DIFP apart from the other two buffers and additionally, the
hydrolysis potential of both acidic and neutral buffers seemed to increase as
elevated levels of DIFP degradation appear to have occurred. It is assumed that
a matrix effect based upon the alkaline nature of charcoal was responsible for
both of these occurrences.
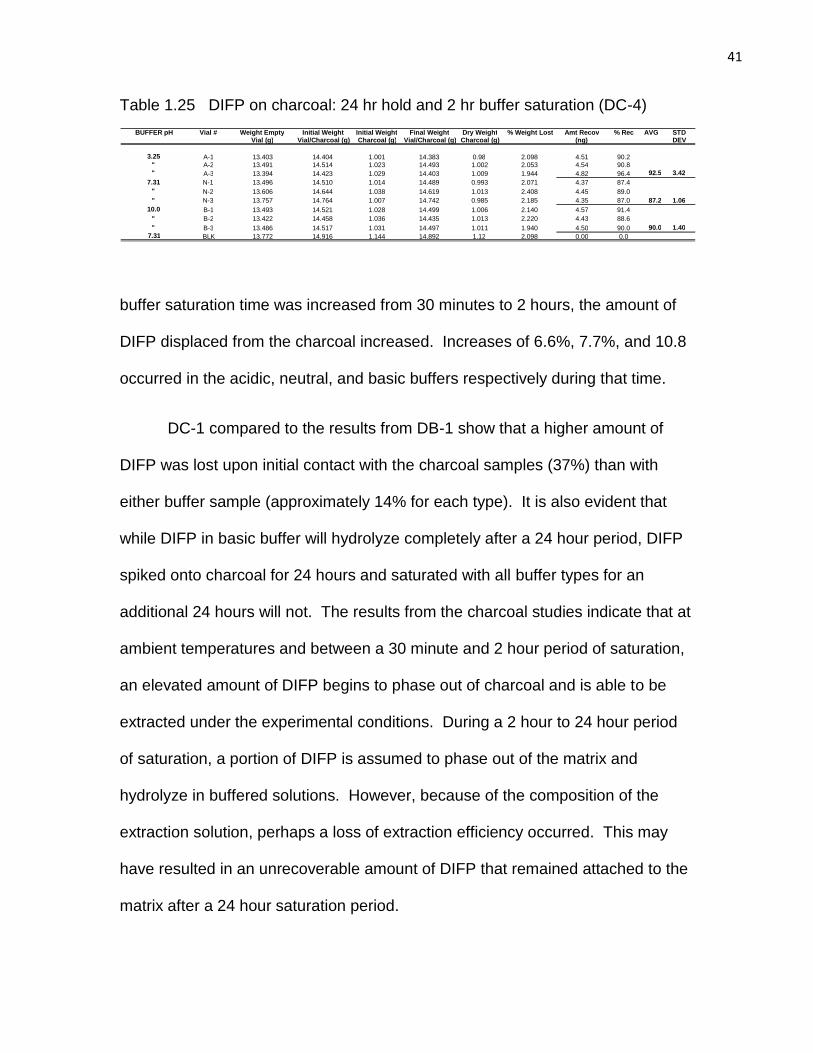
Based on the results from DC-2 another experiment was attempted in
which charcoal samples were spiked with DIFP, set aside for 24 hours, saturated
with all three buffer systems, and held for 2 hours. A pipette was used to remove
the buffers and the charcoal was extracted (experiment DC-4). The results of
this experiment are displayed in table 1.25. The results show that 92.5%, 87.2%
and 90.0% of DIFP was recovered from the acidic, neutral, and basic buffer
samples, respectively. In keeping with the assumption that DIFP displacement
from charcoal occurred, the data shows that when the
41
Table 1.25 DIFP on charcoal: 24 hr hold and 2 hr buffer saturation (DC-4)
buffer saturation time was increased from 30 minutes to 2 hours, the amount of
DIFP displaced from the charcoal increased. Increases of 6.6%, 7.7%, and 10.8
occurred in the acidic, neutral, and basic buffers respectively during that time.
DC-1 compared to the results from DB-1 show that a higher amount of
DIFP was lost upon initial contact with the charcoal samples (37%) than with
either buffer sample (approximately 14% for each type). It is also evident that
while DIFP in basic buffer will hydrolyze completely after a 24 hour period, DIFP
spiked onto charcoal for 24 hours and saturated with all buffer types for an
additional 24 hours will not. The results from the charcoal studies indicate that at
ambient temperatures and between a 30 minute and 2 hour period of saturation,
an elevated amount of DIFP begins to phase out of charcoal and is able to be
extracted under the experimental conditions. During a 2 hour to 24 hour period
of saturation, a portion of DIFP is assumed to phase out of the matrix and
hydrolyze in buffered solutions. However, because of the composition of the
extraction solution, perhaps a loss of extraction efficiency occurred. This may
have resulted in an unrecoverable amount of DIFP that remained attached to the
matrix after a 24 hour saturation period.
BUFFER pH Vial # Weight Empty Initial Weight Initial Weight Final Weight Dry Weight % Weight Lost Amt Recov % Rec AVG STD
Vial (g) Vial/Charcoal (g) Charcoal (g) Vial/Charcoal (g) Charcoal (g) (ng)
DEV 3.25 A-1 13.403 14.404 1.001 14.383 0.98 2.098 4.51 90.2 " A-2 13.491 14.514 1.023 14.493 1.002 2.053 4.54 90.8 " A-3 13.394 14.423 1.029 14.403 1.009 1.944 4.82 96.4 92.5 3.42
7.31 N-1 13.496 14.510 1.014 14.489 0.993 2.071 4.37 87.4 " N-2 13.606 14.644 1.038 14.619 1.013 2.408 4.45 89.0 " N-3 13.757 14.764 1.007 14.742 0.985 2.185 4.35 87.0 87.2 1.06
10.0 B-1 13.493 14.521 1.028 14.499 1.006 2.140 4.57 91.4 " B-2 13.422 14.458 1.036 14.435 1.013 2.220 4.43 88.6 " B-3 13.486 14.517 1.031 14.497 1.011 1.940 4.50 90.0 90.0 1.40
7.31 BLK 13.772 14.916 1.144 14.892 1.12 2.098 0.00 0.0
42
1.3.5 DIFP hydrolysis in plastic
DIFP was spiked into sample vials containing plastic over a series of four
experiments (DP-1 through DP-4). Experiments DP-1 and DP-2 were identical to
the procedures in the charcoal study. In DP-3, DIFP was spiked onto plastic for
24 hours, saturated with all three buffer types for 2 hours, a pipette was used to
remove the buffer, and the samples were extracted and analyzed. In DP-4, DIFP
was spiked onto plastic and held for 24 hours, the samples were then saturated
with all three buffer types and held for an additional 24 hours, after which the
buffer was removed via pipette and all samples were extracted. The organic
extracts from all samples were analyzed on the GC-FPD and the amounts
reported reflect averaged sample amounts unless otherwise stated. The results
from each experiment are displayed as tables 1.26 – 1.29.
The results from DP-1 show that after a 1 minute period, without any
buffer, 72.6 % of DIFP was recovered from the plastic samples (Table 1.26). The
standard deviation for this study was 0.134 with a %RSD value of 0.184. The
results from DP-2 show that over a 24 hour period, 79.1% of DIFP was recovered
from the plastic samples that did not contain buffer (Table 1.27). The remaining
samples from this study that were saturated with acidic and neutral buffers over a
30 minute period averaged a DIFP recovery of 55.8 and 58.4%,
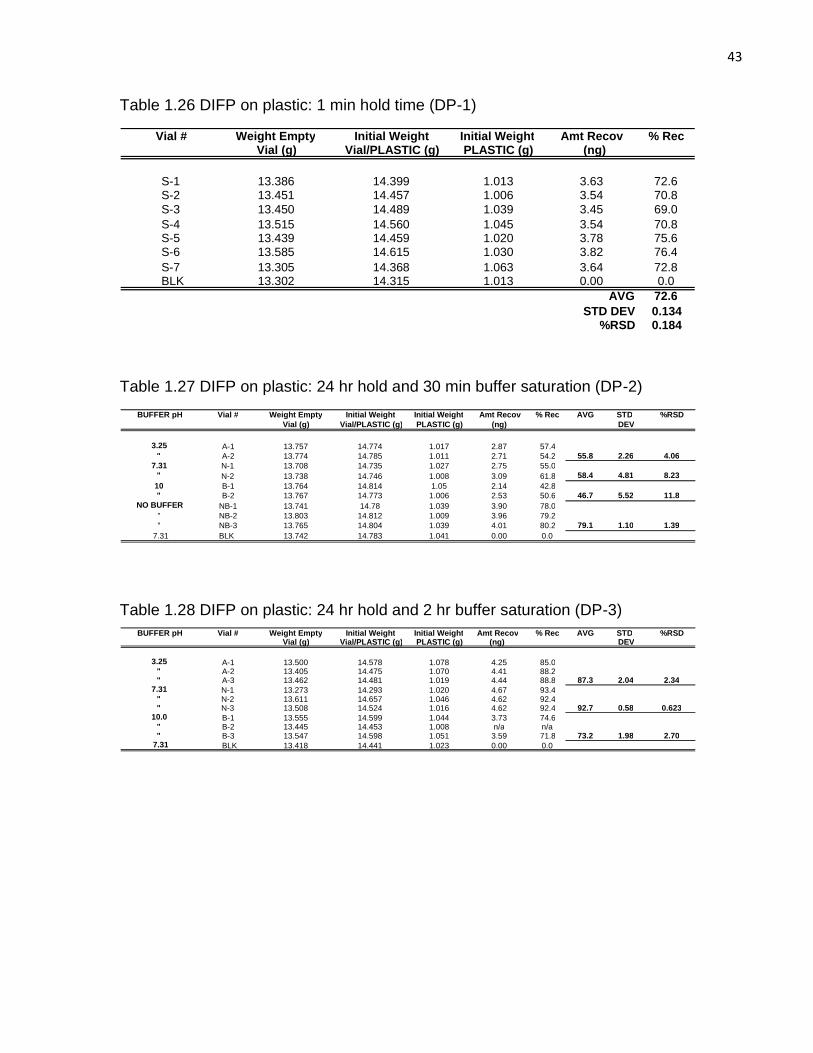
43
Table 1.26 DIFP on plastic: 1 min hold time (DP-1)
Table 1.27 DIFP on plastic: 24 hr hold and 30 min buffer saturation (DP-2)
Table 1.28 DIFP on plastic: 24 hr hold and 2 hr buffer saturation (DP-3)
BUFFER pH Vial # Weight Empty Initial Weight Initial Weight Amt Recov % Rec AVG STD %RSD Vial (g) Vial/PLASTIC (g) PLASTIC (g) (ng)
DEV 3.25 A-1 13.500 14.578 1.078 4.25 85.0 " A-2 13.405 14.475 1.070 4.41 88.2 " A-3 13.462 14.481 1.019 4.44 88.8 87.3 2.04 2.34
7.31 N-1 13.273 14.293 1.020 4.67 93.4 " N-2 13.611 14.657 1.046 4.62 92.4 " N-3 13.508 14.524 1.016 4.62 92.4 92.7 0.58 0.623
10.0 B-1 13.555 14.599 1.044 3.73 74.6 " B-2 13.445 14.453 1.008 n/a n/a " B-3 13.547 14.598 1.051 3.59 71.8 73.2 1.98 2.70
7.31 BLK 13.418 14.441 1.023 0.00 0.0
BUFFER pH Vial # Weight Empty Initial Weight Initial Weight Amt Recov % Rec AVG STD %RSD Vial (g) Vial/PLASTIC (g) PLASTIC (g) (ng)
DEV 3.25 A-1 13.757 14.774 1.017 2.87 57.4 " A-2 13.774 14.785 1.011 2.71 54.2 55.8 2.26 4.06
7.31 N-1 13.708 14.735 1.027 2.75 55.0 " N-2 13.738 14.746 1.008 3.09 61.8 58.4 4.81 8.23
10 B-1 13.764 14.814 1.05 2.14 42.8 " B-2 13.767 14.773 1.006 2.53 50.6 46.7 5.52 11.8
NO BUFFER NB-1 13.741 14.78 1.039 3.90 78.0 " NB-2 13.803 14.812 1.009 3.96 79.2 " NB-3 13.765 14.804 1.039 4.01 80.2 79.1 1.10 1.39
7.31 BLK 13.742 14.783 1.041 0.00 0.0
Vial # Weight Empty Initial Weight Initial Weight Amt Recov % Rec Vial (g) Vial/PLASTIC (g) PLASTIC (g) (ng)
S-1 13.386 14.399 1.013 3.63 72.6 S-2 13.451 14.457 1.006 3.54 70.8 S-3 13.450 14.489 1.039 3.45 69.0 S-4 13.515 14.560 1.045 3.54 70.8 S-5 13.439 14.459 1.020 3.78 75.6 S-6 13.585 14.615 1.030 3.82 76.4 S-7 13.305 14.368 1.063 3.64 72.8 BLK 13.302 14.315 1.013 0.00 0.0
AVG 72.6 STD DEV 0.134
%RSD 0.184
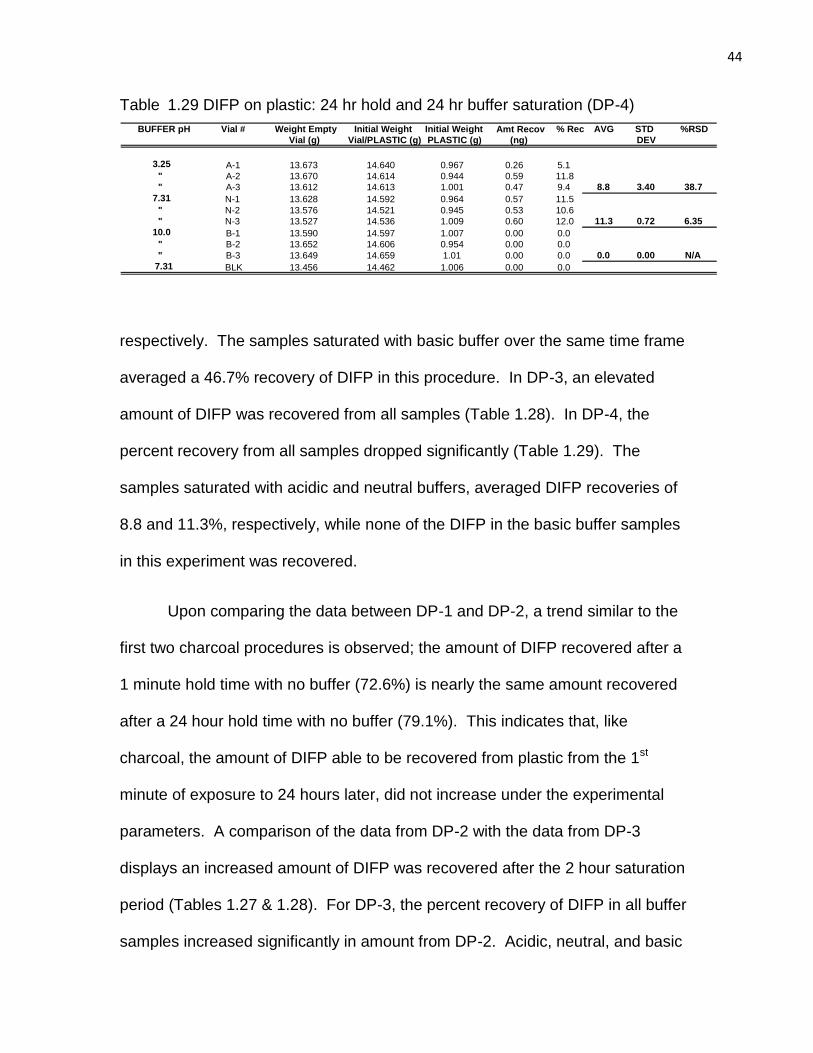
44
Table 1.29 DIFP on plastic: 24 hr hold and 24 hr buffer saturation (DP-4)
respectively. The samples saturated with basic buffer over the same time frame
averaged a 46.7% recovery of DIFP in this procedure. In DP-3, an elevated
amount of DIFP was recovered from all samples (Table 1.28). In DP-4, the
percent recovery from all samples dropped significantly (Table 1.29). The
samples saturated with acidic and neutral buffers, averaged DIFP recoveries of
8.8 and 11.3%, respectively, while none of the DIFP in the basic buffer samples
in this experiment was recovered.
Upon comparing the data between DP-1 and DP-2, a trend similar to the
first two charcoal procedures is observed; the amount of DIFP recovered after a
1 minute hold time with no buffer (72.6%) is nearly the same amount recovered
after a 24 hour hold time with no buffer (79.1%). This indicates that, like
charcoal, the amount of DIFP able to be recovered from plastic from the 1st
minute of exposure to 24 hours later, did not increase under the experimental
parameters. A comparison of the data from DP-2 with the data from DP-3
displays an increased amount of DIFP was recovered after the 2 hour saturation
period (Tables 1.27 & 1.28). For DP-3, the percent recovery of DIFP in all buffer
samples increased significantly in amount from DP-2. Acidic, neutral, and basic
BUFFER pH Vial # Weight Empty Initial Weight Initial Weight Amt Recov
Recov
% Rec AVG STD %RSD Vial (g) Vial/PLASTIC (g) PLASTIC (g) (ng)
DEV
3.25 A-1 13.673 14.640 0.967 0.26 5.1 " A-2 13.670 14.614 0.944 0.59 11.8 " A-3 13.612 14.613 1.001 0.47 9.4 8.8 3.40 38.7
7.31 N-1 13.628 14.592 0.964 0.57 11.5
" N-2 13.576 14.521 0.945 0.53 10.6
" N-3 13.527 14.536 1.009 0.60 12.0 11.3 0.72 6.35 10.0 B-1 13.590 14.597 1.007 0.00 0.0
" B-2 13.652 14.606 0.954 0.00 0.0
" B-3 13.649 14.659 1.01 0.00 0.0 0.0 0.00 N/A 7.31 BLK 13.456 14.462 1.006 0.00 0.0
45
samples averaged DIFP recoveries of 87.3, 92.7, and 73.2%, respectively. A
possible explanation for this is during the 24 hour hold period DIFP developed a
high affinity to and was tightly bound to plastic, both on the surface and the
interior. Since DIFP was previously bound for 24 hours, the 30 minute saturation
period was not enough time to cause a significant amount of DIFP to be
displaced from the interior of the plastic. The DIFP recovered at this time was
probably bound to the surface, and thus more easily removed. To continue,
because of the increase in DIFP recovery after the 2 hour saturation period, the
data suggests the 30 minute saturation period may have been responsible for an
elevated affinity of DIFP bound to the interior of the plastic. This would account
for the low recovery of DIFP after this time. However, prolonged saturation of the
plastic (a 2 hour period), may have caused elevated displacement of DIFP from
the interior of the plastic resulting in a higher recovery of DIFP after this time.
The data from DP-2 suggests that during the 30 minute saturation period, the
surface bound DIFP was recovered while a significant portion of DIFP remained
attached to the interior of the plastic and was not extracted. The results from DP-
4 suggest the following: if plastic is contaminated with DIFP for 24 hours and is
saturated long enough in a buffered aqueous environment (in this case 24
hours), then DIFP will be liberated from the interior of the plastic, transfer into the
buffer and ultimately undergo hydrolysis.
Alternatively, it can be inferred from the data that no hydrolysis of DIFP
occurred in DP-4 and the low percent recoveries indicate DIFP has become
attached to the plastic again. However, it seems unlikely that after a 24 hour
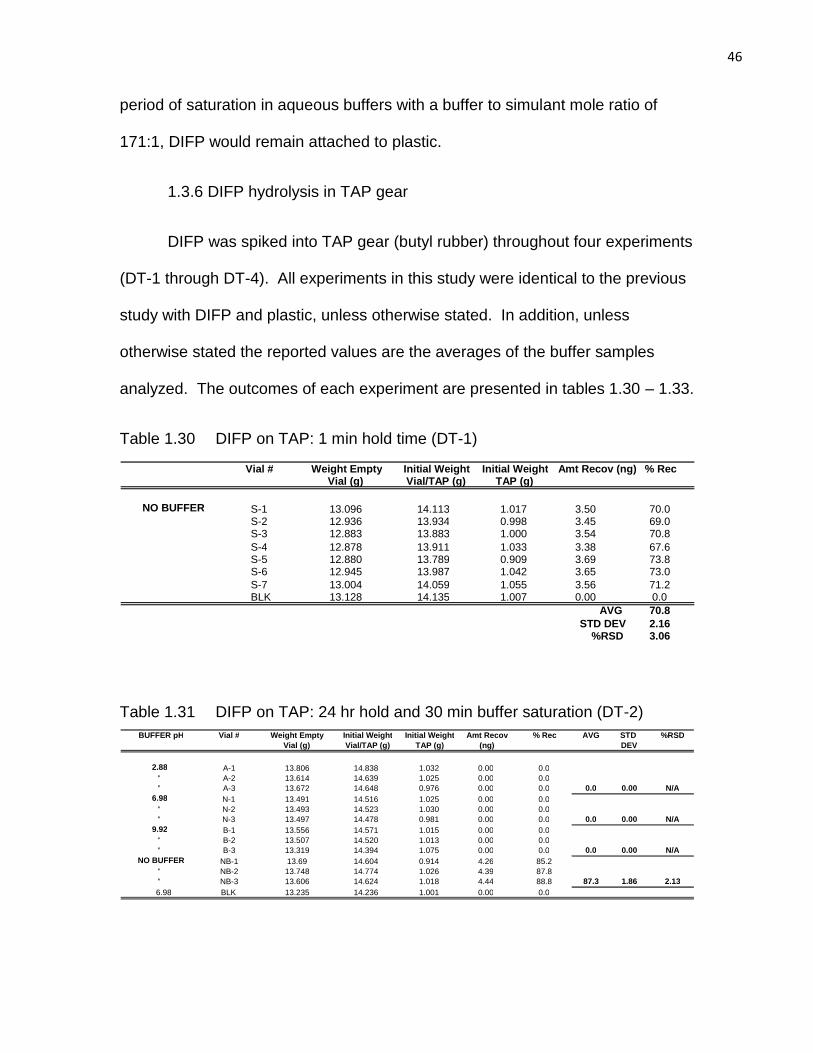
46
period of saturation in aqueous buffers with a buffer to simulant mole ratio of
171:1, DIFP would remain attached to plastic.
1.3.6 DIFP hydrolysis in TAP gear
DIFP was spiked into TAP gear (butyl rubber) throughout four experiments
(DT-1 through DT-4). All experiments in this study were identical to the previous
study with DIFP and plastic, unless otherwise stated. In addition, unless
otherwise stated the reported values are the averages of the buffer samples
analyzed. The outcomes of each experiment are presented in tables 1.30 – 1.33.
Table 1.30 DIFP on TAP: 1 min hold time (DT-1)
Table 1.31 DIFP on TAP: 24 hr hold and 30 min buffer saturation (DT-2)
BUFFER pH Vial # Weight Empty Initial Weight Initial Weight Amt Recov % Rec AVG STD %RSD Vial (g) Vial/TAP (g) TAP (g) (ng)
DEV 2.88 A-1 13.806 14.838 1.032 0.00 0.0
" A-2 13.614 14.639 1.025 0.00 0.0 " A-3 13.672 14.648 0.976 0.00 0.0 0.0 0.00 N/A
6.98 N-1 13.491 14.516 1.025 0.00 0.0 " N-2 13.493 14.523 1.030 0.00 0.0 " N-3 13.497 14.478 0.981 0.00 0.0 0.0 0.00 N/A
9.92 B-1 13.556 14.571 1.015 0.00 0.0 " B-2 13.507 14.520 1.013 0.00 0.0 " B-3 13.319 14.394 1.075 0.00 0.0 0.0 0.00 N/A
NO BUFFER NB-1 13.69 14.604 0.914 4.26 85.2 " NB-2 13.748 14.774 1.026 4.39 87.8 " NB-3 13.606 14.624 1.018 4.44 88.8 87.3 1.86 2.13
6.98 BLK 13.235 14.236 1.001 0.00 0.0
Vial # Weight Empty Initial Weight Initial Weight Amt Recov (ng) % Rec Vial (g) Vial/TAP (g) TAP (g)
NO BUFFER S-1 13.096 14.113 1.017 3.50 70.0 S-2 12.936 13.934 0.998 3.45 69.0 S-3 12.883 13.883 1.000 3.54 70.8 S-4 12.878 13.911 1.033 3.38 67.6 S-5 12.880 13.789 0.909 3.69 73.8 S-6 12.945 13.987 1.042 3.65 73.0 S-7 13.004 14.059 1.055 3.56 71.2
BLK 13.128 14.135 1.007 0.00 0.0 AVG 70.8 STD DEV 2.16
%RSD 3.06
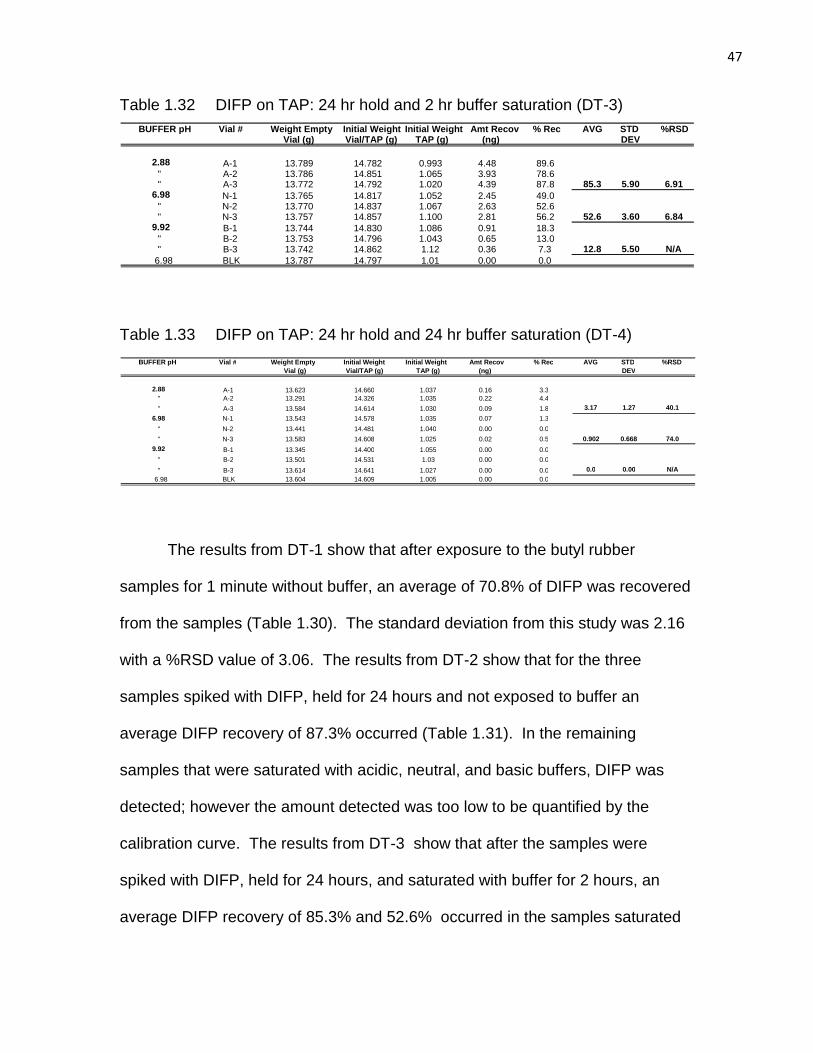
47
Table 1.32 DIFP on TAP: 24 hr hold and 2 hr buffer saturation (DT-3)
Table 1.33 DIFP on TAP: 24 hr hold and 24 hr buffer saturation (DT-4)
The results from DT-1 show that after exposure to the butyl rubber
samples for 1 minute without buffer, an average of 70.8% of DIFP was recovered
from the samples (Table 1.30). The standard deviation from this study was 2.16
with a %RSD value of 3.06. The results from DT-2 show that for the three
samples spiked with DIFP, held for 24 hours and not exposed to buffer an
average DIFP recovery of 87.3% occurred (Table 1.31). In the remaining
samples that were saturated with acidic, neutral, and basic buffers, DIFP was
detected; however the amount detected was too low to be quantified by the
calibration curve. The results from DT-3 show that after the samples were
spiked with DIFP, held for 24 hours, and saturated with buffer for 2 hours, an
average DIFP recovery of 85.3% and 52.6% occurred in the samples saturated
BUFFER pH Vial # Weight Empty Initial Weight Initial Weight Amt Recov % Rec AVG STD %RSD
Vial (g) Vial/TAP (g) TAP (g) (ng)
DEV 2.88 A-1 13.623 14.660 1.037 0.16 3.3
" A-2 13.291 14.326 1.035 0.22 4.4 " A-3 13.584 14.614 1.030 0.09 1.8 3.17 1.27 40.1
6.98 N-1 13.543 14.578 1.035 0.07 1.3 " N-2 13.441 14.481 1.040 0.00 0.0 " N-3 13.583 14.608 1.025 0.02 0.5 0.902 0.668 74.0
9.92 B-1 13.345 14.400 1.055 0.00 0.0 " B-2 13.501 14.531 1.03 0.00 0.0 " B-3 13.614 14.641 1.027 0.00 0.0 0.0 0.00 N/A
6.98 BLK 13.604 14.609 1.005 0.00 0.0
BUFFER pH Vial # Weight Empty Initial Weight Initial Weight Amt Recov % Rec AVG STD %RSD Vial (g) Vial/TAP (g) TAP (g) (ng)
DEV
2.88 A-1 13.789 14.782 0.993 4.48 89.6 " A-2 13.786 14.851 1.065 3.93 78.6 " A-3 13.772 14.792 1.020 4.39 87.8 85.3 5.90 6.91
6.98 N-1 13.765 14.817 1.052 2.45 49.0 " N-2 13.770 14.837 1.067 2.63 52.6
" N-3 13.757 14.857 1.100 2.81 56.2 52.6 3.60 6.84
9.92 B-1 13.744 14.830 1.086 0.91 18.3
" B-2 13.753 14.796 1.043 0.65 13.0
" B-3 13.742 14.862 1.12 0.36 7.3 12.8 5.50 N/A 6.98 BLK 13.787 14.797 1.01 0.00 0.0
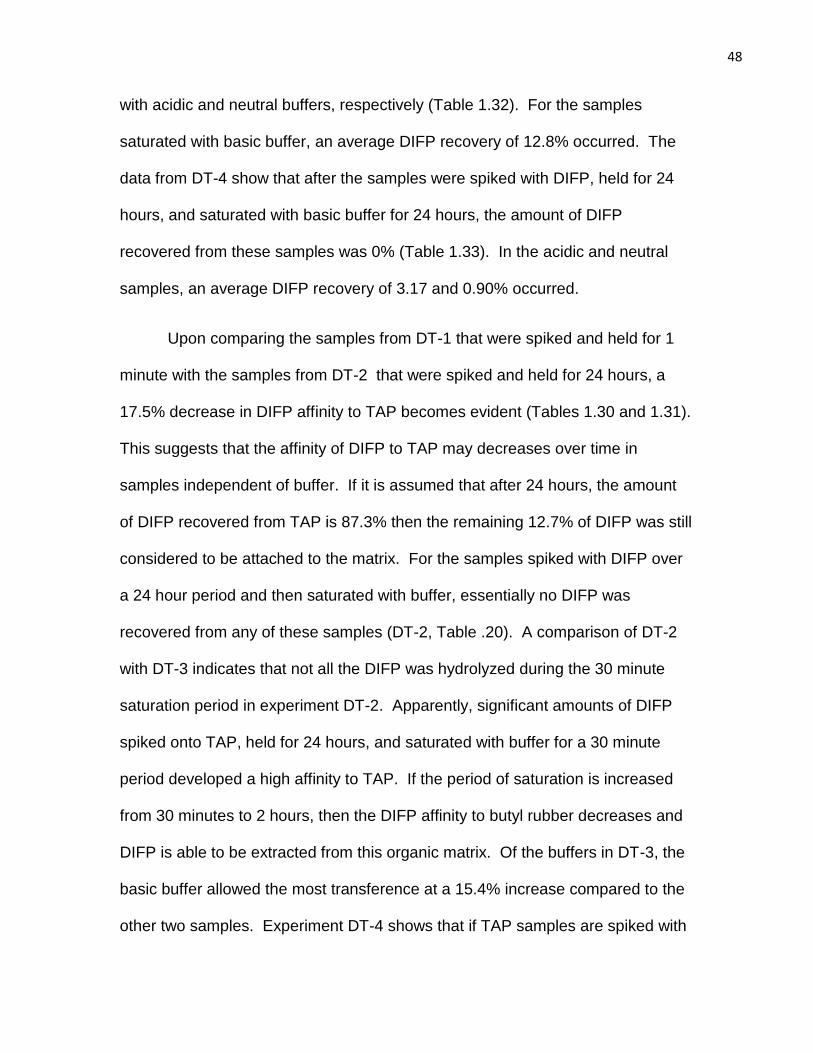
48
with acidic and neutral buffers, respectively (Table 1.32). For the samples
saturated with basic buffer, an average DIFP recovery of 12.8% occurred. The
data from DT-4 show that after the samples were spiked with DIFP, held for 24
hours, and saturated with basic buffer for 24 hours, the amount of DIFP
recovered from these samples was 0% (Table 1.33). In the acidic and neutral
samples, an average DIFP recovery of 3.17 and 0.90% occurred.
Upon comparing the samples from DT-1 that were spiked and held for 1
minute with the samples from DT-2 that were spiked and held for 24 hours, a
17.5% decrease in DIFP affinity to TAP becomes evident (Tables 1.30 and 1.31).
This suggests that the affinity of DIFP to TAP may decreases over time in
samples independent of buffer. If it is assumed that after 24 hours, the amount
of DIFP recovered from TAP is 87.3% then the remaining 12.7% of DIFP was still
considered to be attached to the matrix. For the samples spiked with DIFP over
a 24 hour period and then saturated with buffer, essentially no DIFP was
recovered from any of these samples (DT-2, Table .20). A comparison of DT-2
with DT-3 indicates that not all the DIFP was hydrolyzed during the 30 minute
saturation period in experiment DT-2. Apparently, significant amounts of DIFP
spiked onto TAP, held for 24 hours, and saturated with buffer for a 30 minute
period developed a high affinity to TAP. If the period of saturation is increased
from 30 minutes to 2 hours, then the DIFP affinity to butyl rubber decreases and
DIFP is able to be extracted from this organic matrix. Of the buffers in DT-3, the
basic buffer allowed the most transference at a 15.4% increase compared to the
other two samples. Experiment DT-4 shows that if TAP samples are spiked with
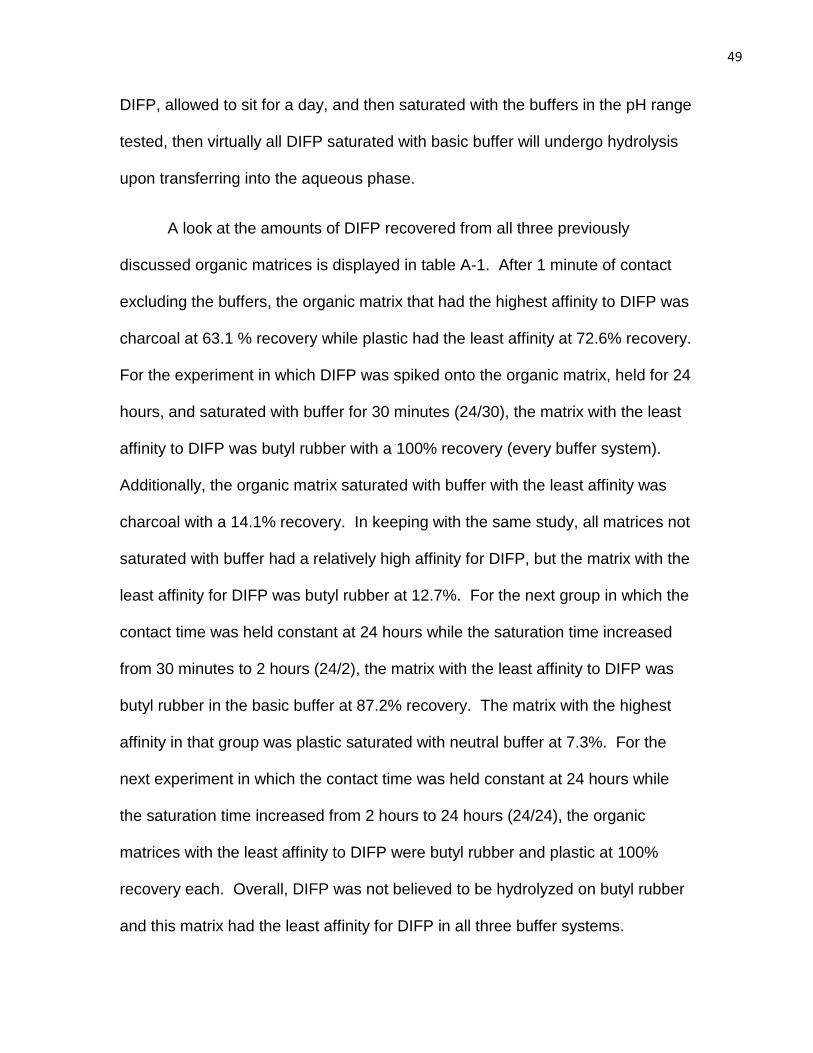
49
DIFP, allowed to sit for a day, and then saturated with the buffers in the pH range
tested, then virtually all DIFP saturated with basic buffer will undergo hydrolysis
upon transferring into the aqueous phase.
A look at the amounts of DIFP recovered from all three previously
discussed organic matrices is displayed in table A-1. After 1 minute of contact
excluding the buffers, the organic matrix that had the highest affinity to DIFP was
charcoal at 63.1 % recovery while plastic had the least affinity at 72.6% recovery.
For the experiment in which DIFP was spiked onto the organic matrix, held for 24
hours, and saturated with buffer for 30 minutes (24/30), the matrix with the least
affinity to DIFP was butyl rubber with a 100% recovery (every buffer system).
Additionally, the organic matrix saturated with buffer with the least affinity was
charcoal with a 14.1% recovery. In keeping with the same study, all matrices not
saturated with buffer had a relatively high affinity for DIFP, but the matrix with the
least affinity for DIFP was butyl rubber at 12.7%. For the next group in which the
contact time was held constant at 24 hours while the saturation time increased
from 30 minutes to 2 hours (24/2), the matrix with the least affinity to DIFP was
butyl rubber in the basic buffer at 87.2% recovery. The matrix with the highest
affinity in that group was plastic saturated with neutral buffer at 7.3%. For the
next experiment in which the contact time was held constant at 24 hours while
the saturation time increased from 2 hours to 24 hours (24/24), the organic
matrices with the least affinity to DIFP were butyl rubber and plastic at 100%
recovery each. Overall, DIFP was not believed to be hydrolyzed on butyl rubber
and this matrix had the least affinity for DIFP in all three buffer systems.
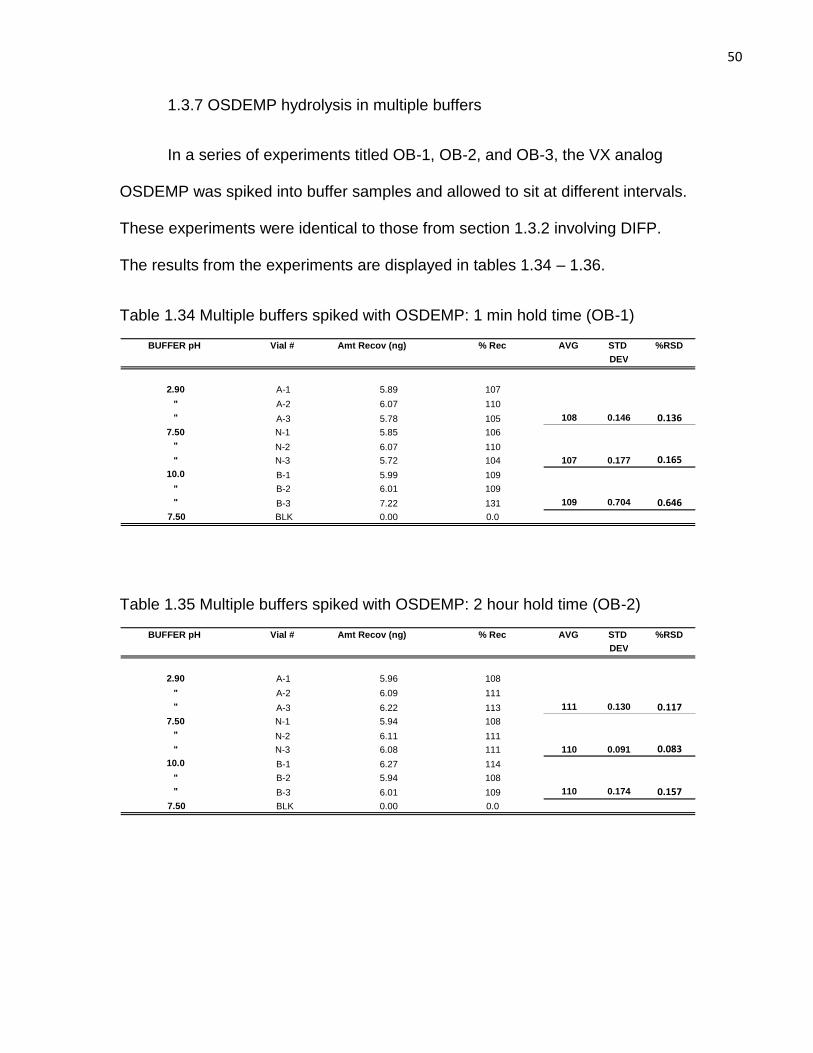
50
1.3.7 OSDEMP hydrolysis in multiple buffers
In a series of experiments titled OB-1, OB-2, and OB-3, the VX analog
OSDEMP was spiked into buffer samples and allowed to sit at different intervals.
These experiments were identical to those from section 1.3.2 involving DIFP.
The results from the experiments are displayed in tables 1.34 – 1.36.
Table 1.34 Multiple buffers spiked with OSDEMP: 1 min hold time (OB-1)
Table 1.35 Multiple buffers spiked with OSDEMP: 2 hour hold time (OB-2)
BUFFER pH Vial # Amt Recov (ng) % Rec AVG STD %RSD
DEV
2.90 A-1 5.96 108 " A-2 6.09 111 " A-3 6.22 113 111 0.130 0.117
7.50 N-1 5.94 108 " N-2 6.11 111 " N-3 6.08 111 110 0.091 0.083
10.0 B-1 6.27 114 " B-2 5.94 108 " B-3 6.01 109 110 0.174 0.157
7.50 BLK 0.00 0.0
BUFFER pH Vial # Amt Recov (ng) % Rec AVG STD %RSD
DEV
2.90 A-1 5.89 107 " A-2 6.07 110 " A-3 5.78 105 108 0.146 0.136
7.50 N-1 5.85 106 " N-2 6.07 110 " N-3 5.72 104 107 0.177 0.165
10.0 B-1 5.99 109 " B-2 6.01 109 " B-3 7.22 131 109 0.704 0.646
7.50 BLK 0.00 0.0
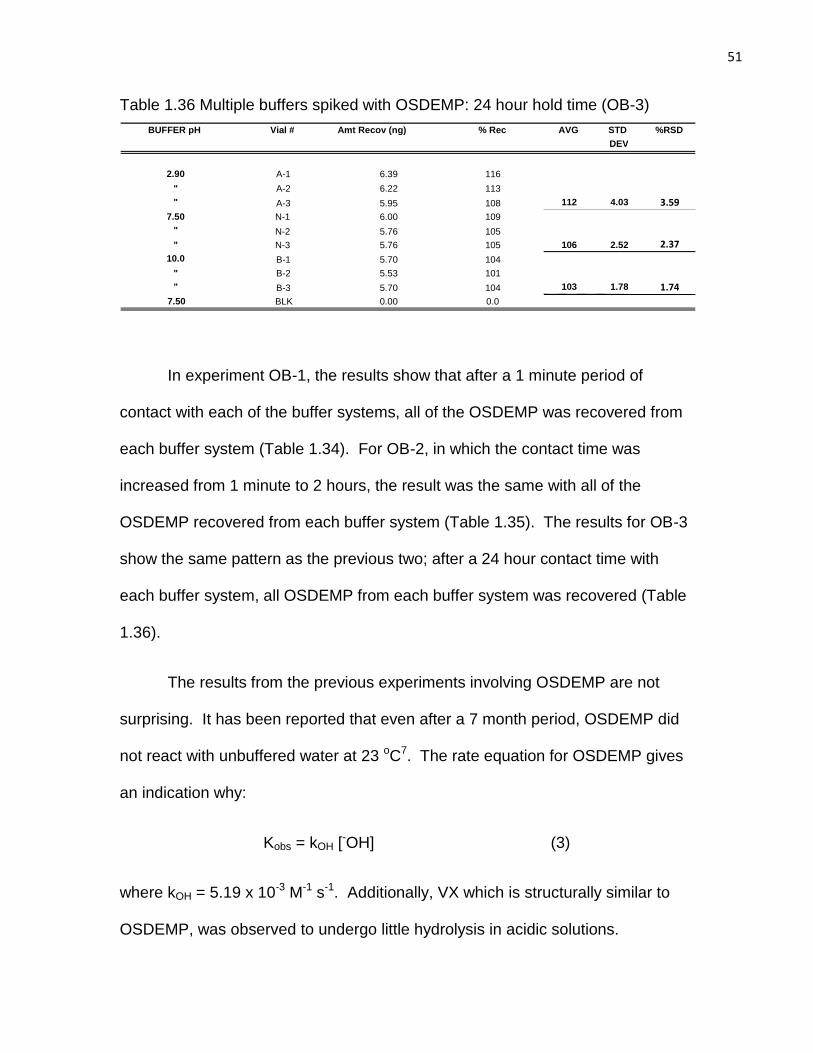
51
Table 1.36 Multiple buffers spiked with OSDEMP: 24 hour hold time (OB-3)
In experiment OB-1, the results show that after a 1 minute period of
contact with each of the buffer systems, all of the OSDEMP was recovered from
each buffer system (Table 1.34). For OB-2, in which the contact time was
increased from 1 minute to 2 hours, the result was the same with all of the
OSDEMP recovered from each buffer system (Table 1.35). The results for OB-3
show the same pattern as the previous two; after a 24 hour contact time with
each buffer system, all OSDEMP from each buffer system was recovered (Table
1.36).
The results from the previous experiments involving OSDEMP are not
surprising. It has been reported that even after a 7 month period, OSDEMP did
not react with unbuffered water at 23 oC7. The rate equation for OSDEMP gives
an indication why:
Kobs = kOH [-OH] (3)
where kOH = 5.19 x 10⁻³ M-1 s-1. Additionally, VX which is structurally similar to
OSDEMP, was observed to undergo little hydrolysis in acidic solutions.
BUFFER pH Vial # Amt Recov (ng) % Rec AVG STD %RSD
DEV
2.90 A-1 6.39 116 " A-2 6.22 113 " A-3 5.95 108 112 4.03 3.59
7.50 N-1 6.00 109 " N-2 5.76 105 " N-3 5.76 105 106 2.52 2.37
10.0 B-1 5.70 104 " B-2 5.53 101 " B-3 5.70 104 103 1.78 1.74
7.50 BLK 0.00 0.0
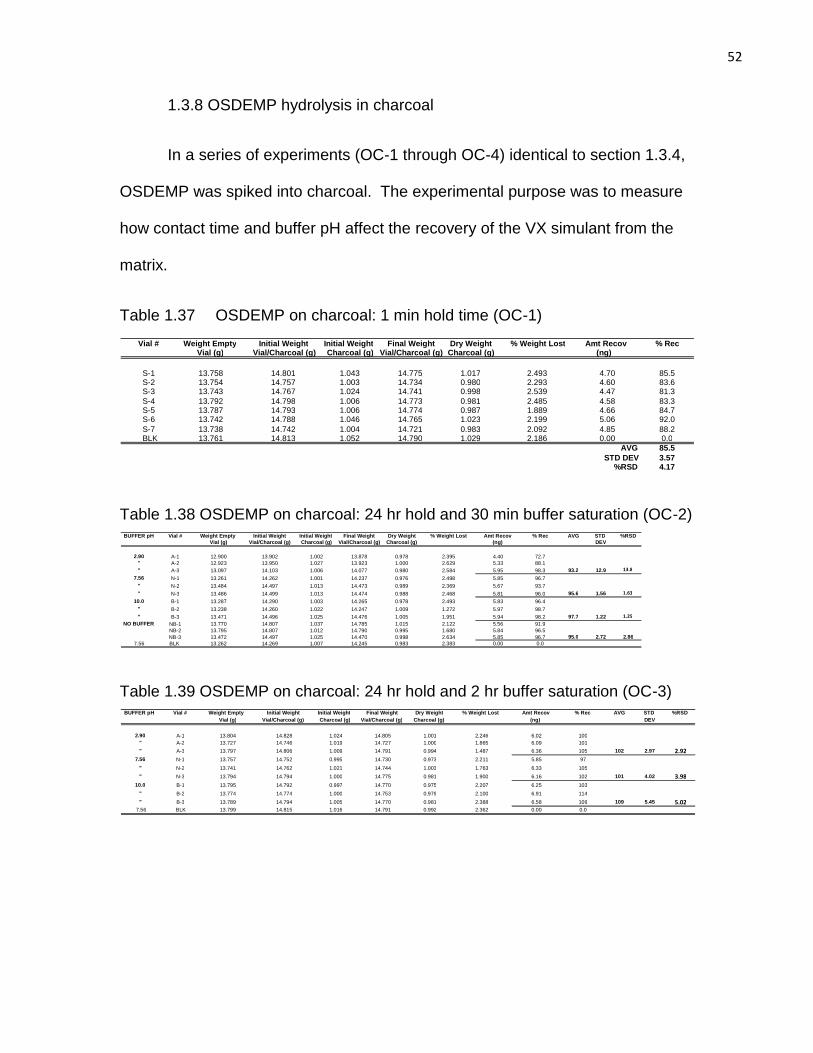
52
1.3.8 OSDEMP hydrolysis in charcoal
In a series of experiments (OC-1 through OC-4) identical to section 1.3.4,
OSDEMP was spiked into charcoal. The experimental purpose was to measure
how contact time and buffer pH affect the recovery of the VX simulant from the
matrix.
Table 1.37 OSDEMP on charcoal: 1 min hold time (OC-1)
Table 1.38 OSDEMP on charcoal: 24 hr hold and 30 min buffer saturation (OC-2)
Table 1.39 OSDEMP on charcoal: 24 hr hold and 2 hr buffer saturation (OC-3)
BUFFER pH Vial # Weight Empty Initial Weight Initial Weight Final Weight Dry Weight % Weight Lost Amt Recov % Rec AVG STD %RSD
Vial (g) Vial/Charcoal (g) Charcoal (g) Vial/Charcoal (g) Charcoal (g) (ng)
DEV 2.90 A-1 13.804 14.828 1.024 14.805 1.001 2.246 6.02 100 " A-2 13.727 14.746 1.019 14.727 1.000 1.865 6.09 101 " A-3 13.797 14.806 1.009 14.791 0.994 1.487 6.36 105 102 2.97 2.92
7.56 N-1 13.757 14.752 0.995 14.730 0.973 2.211 5.85 97 " N-2 13.741 14.762 1.021 14.744 1.003 1.763 6.33 105 " N-3 13.794 14.794 1.000 14.775 0.981 1.900 6.16 102 101 4.02 3.98
10.0 B-1 13.795 14.792 0.997 14.770 0.975 2.207 6.25 103 " B-2 13.774 14.774 1.000 14.753 0.979 2.100 6.91 114 " B-3 13.789 14.794 1.005 14.770 0.981 2.388 6.58 109 109 5.45 5.02
7.56 BLK 13.799 14.815 1.016 14.791 0.992 2.362 0.00 0.0
BUFFER pH Vial # Weight Empty Initial Weight Initial Weight Final Weight Dry Weight % Weight Lost Amt Recov % Rec AVG STD %RSD
Vial (g) Vial/Charcoal (g) Charcoal (g) Vial/Charcoal (g) Charcoal (g) (ng)
DEV 2.90 A-1 12.900 13.902 1.002 13.878 0.978 2.395 4.40 72.7 " A-2 12.923 13.950 1.027 13.923 1.000 2.629 5.33 88.1 " A-3 13.097 14.103 1.006 14.077 0.980 2.584 5.95 98.3 93.2 12.9 13.8
7.56 N-1 13.261 14.262 1.001 14.237 0.976 2.498 5.85 96.7 " N-2 13.484 14.497 1.013 14.473 0.989 2.369 5.67 93.7 " N-3 13.486 14.499 1.013 14.474 0.988 2.468 5.81 96.0 95.6 1.56 1.63
10.0 B-1 13.287 14.290 1.003 14.265 0.978 2.493 5.83 96.4 " B-2 13.238 14.260 1.022 14.247 1.009 1.272 5.97 98.7 " B-3 13.471 14.496 1.025 14.476 1.005 1.951 5.94 98.2 97.7 1.22 1.25
NO BUFFER NB-1
1
13.770 14.807 1.037 14.785 1.015 2.122 5.56 91.9 NB-2 13.795 14.807 1.012 14.790 0.995 1.680 5.84 96.5
NB-3 13.472 14.497 1.025 14.470 0.998 2.634 5.85 96.7 95.0 2.72 2.86 7.56 BLK 13.262 14.269 1.007 14.245 0.983 2.383 0.00 0.0
Vial # Weight Empty Initial Weight Initial Weight Final Weight Dry Weight % Weight Lost Amt Recov % Rec Vial (g) Vial/Charcoal (g) Charcoal (g) Vial/Charcoal (g) Charcoal (g) (ng)
S-1 13.758 14.801 1.043 14.775 1.017 2.493 4.70 85.5
S-2 13.754 14.757 1.003 14.734 0.980 2.293 4.60 83.6 S-3 13.743 14.767 1.024 14.741 0.998 2.539 4.47 81.3 S-4 13.792 14.798 1.006 14.773 0.981 2.485 4.58 83.3 S-5 13.787 14.793 1.006 14.774 0.987 1.889 4.66 84.7 S-6 13.742 14.788 1.046 14.765 1.023 2.199 5.06 92.0 S-7 13.738 14.742 1.004 14.721 0.983 2.092 4.85 88.2
BLK 13.761 14.813 1.052 14.790 1.029 2.186 0.00 0.0 AVG 85.5
STD DEV 3.57 %RSD 4.17
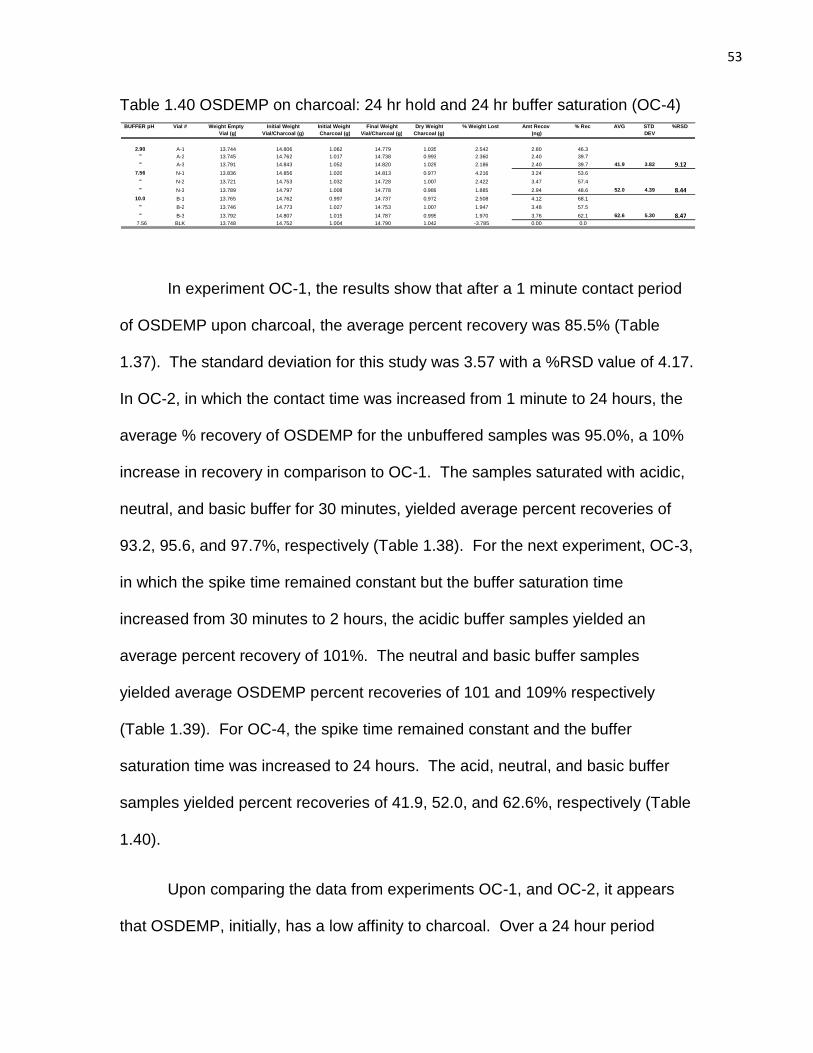
53
Table 1.40 OSDEMP on charcoal: 24 hr hold and 24 hr buffer saturation (OC-4)
In experiment OC-1, the results show that after a 1 minute contact period
of OSDEMP upon charcoal, the average percent recovery was 85.5% (Table
1.37). The standard deviation for this study was 3.57 with a %RSD value of 4.17.
In OC-2, in which the contact time was increased from 1 minute to 24 hours, the
average % recovery of OSDEMP for the unbuffered samples was 95.0%, a 10%
increase in recovery in comparison to OC-1. The samples saturated with acidic,
neutral, and basic buffer for 30 minutes, yielded average percent recoveries of
93.2, 95.6, and 97.7%, respectively (Table 1.38). For the next experiment, OC-3,
in which the spike time remained constant but the buffer saturation time
increased from 30 minutes to 2 hours, the acidic buffer samples yielded an
average percent recovery of 101%. The neutral and basic buffer samples
yielded average OSDEMP percent recoveries of 101 and 109% respectively
(Table 1.39). For OC-4, the spike time remained constant and the buffer
saturation time was increased to 24 hours. The acid, neutral, and basic buffer
samples yielded percent recoveries of 41.9, 52.0, and 62.6%, respectively (Table
1.40).
Upon comparing the data from experiments OC-1, and OC-2, it appears
that OSDEMP, initially, has a low affinity to charcoal. Over a 24 hour period
BUFFER pH Vial # Weight Empty Initial Weight Initial Weight Final Weight Dry Weight % Weight Lost Amt Recov % Rec AVG STD %RSD
Vial (g) Vial/Charcoal (g) Charcoal (g) Vial/Charcoal (g) Charcoal (g) (ng)
DEV 2.90 A-1 13.744 14.806 1.062 14.779 1.035 2.542 2.80 46.3 " A-2 13.745 14.762 1.017 14.738 0.993 2.360 2.40 39.7 " A-3 13.791 14.843 1.052 14.820 1.029 2.186 2.40 39.7 41.9 3.82 9.12
7.56 N-1 13.836 14.856 1.020 14.813 0.977 4.216 3.24 53.6 " N-2 13.721 14.753 1.032 14.728 1.007 2.422 3.47 57.4 " N-3 13.789 14.797 1.008 14.778 0.989 1.885 2.94 48.6 52.0 4.39 8.44
10.0 B-1 13.765 14.762 0.997 14.737 0.972 2.508 4.12 68.1 " B-2 13.746 14.773 1.027 14.753 1.007 1.947 3.48 57.5 " B-3 13.792 14.807 1.015 14.787 0.995 1.970 3.76 62.1 62.6 5.30 8.47
7.56 BLK 13.748 14.752 1.004 14.790 1.042 -3.785 0.00 0.0
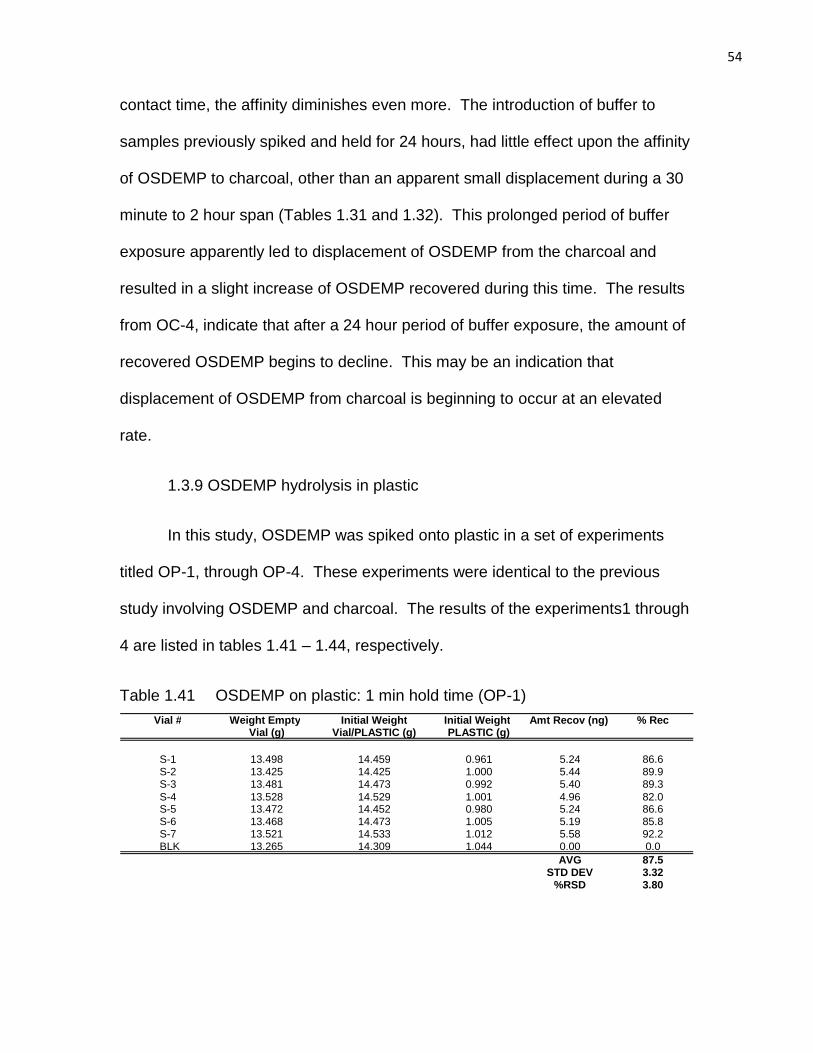
54
contact time, the affinity diminishes even more. The introduction of buffer to
samples previously spiked and held for 24 hours, had little effect upon the affinity
of OSDEMP to charcoal, other than an apparent small displacement during a 30
minute to 2 hour span (Tables 1.31 and 1.32). This prolonged period of buffer
exposure apparently led to displacement of OSDEMP from the charcoal and
resulted in a slight increase of OSDEMP recovered during this time. The results
from OC-4, indicate that after a 24 hour period of buffer exposure, the amount of
recovered OSDEMP begins to decline. This may be an indication that
displacement of OSDEMP from charcoal is beginning to occur at an elevated
rate.
1.3.9 OSDEMP hydrolysis in plastic
In this study, OSDEMP was spiked onto plastic in a set of experiments
titled OP-1, through OP-4. These experiments were identical to the previous
study involving OSDEMP and charcoal. The results of the experiments1 through
4 are listed in tables 1.41 – 1.44, respectively.
Table 1.41 OSDEMP on plastic: 1 min hold time (OP-1)
Vial # Weight Empty Initial Weight Initial Weight Amt Recov (ng) % Rec Vial (g) Vial/PLASTIC (g) PLASTIC (g)
S-1 13.498 14.459 0.961 5.24 86.6 S-2 13.425 14.425 1.000 5.44 89.9 S-3 13.481 14.473 0.992 5.40 89.3 S-4 13.528 14.529 1.001 4.96 82.0 S-5 13.472 14.452 0.980 5.24 86.6 S-6 13.468 14.473 1.005 5.19 85.8 S-7 13.521 14.533 1.012 5.58 92.2 BLK 13.265 14.309 1.044 0.00 0.0
AVG 87.5 STD DEV 3.32
%RSD 3.80
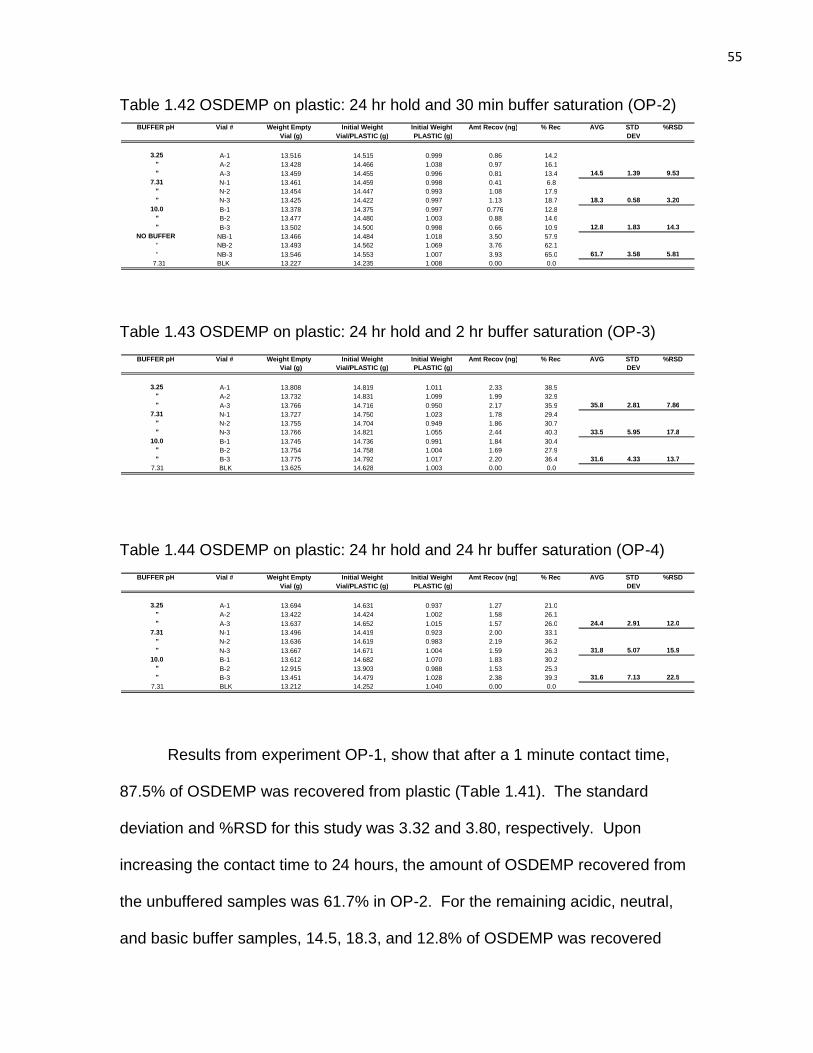
55
Table 1.42 OSDEMP on plastic: 24 hr hold and 30 min buffer saturation (OP-2)
Table 1.43 OSDEMP on plastic: 24 hr hold and 2 hr buffer saturation (OP-3)
Table 1.44 OSDEMP on plastic: 24 hr hold and 24 hr buffer saturation (OP-4)
Results from experiment OP-1, show that after a 1 minute contact time,
87.5% of OSDEMP was recovered from plastic (Table 1.41). The standard
deviation and %RSD for this study was 3.32 and 3.80, respectively. Upon
increasing the contact time to 24 hours, the amount of OSDEMP recovered from
the unbuffered samples was 61.7% in OP-2. For the remaining acidic, neutral,
and basic buffer samples, 14.5, 18.3, and 12.8% of OSDEMP was recovered
BUFFER pH Vial # Weight Empty Initial Weight Initial Weight Amt Recov (ng) % Rec AVG STD %RSD
Vial (g) Vial/PLASTIC (g) PLASTIC (g)
DEV 3.25 A-1 13.694 14.631 0.937 1.27 21.0 " A-2 13.422 14.424 1.002 1.58 26.1 " A-3 13.637 14.652 1.015 1.57 26.0 24.4 2.91 12.0
7.31 N-1 13.496 14.419 0.923 2.00 33.1 " N-2 13.636 14.619 0.983 2.19 36.2 " N-3 13.667 14.671 1.004 1.59 26.3 31.8 5.07 15.9
10.0 B-1 13.612 14.682 1.070 1.83 30.2 " B-2 12.915 13.903 0.988 1.53 25.3 " B-3 13.451 14.479 1.028 2.38 39.3 31.6 7.13 22.5
7.31 BLK 13.212 14.252 1.040 0.00 0.0
BUFFER pH Vial # Weight Empty Initial Weight Initial Weight Amt Recov (ng) % Rec AVG STD %RSD
Vial (g) Vial/PLASTIC (g) PLASTIC (g)
DEV 3.25 A-1 13.808 14.819 1.011 2.33 38.5 " A-2 13.732 14.831 1.099 1.99 32.9 " A-3 13.766 14.716 0.950 2.17 35.9 35.8 2.81 7.86
7.31 N-1 13.727 14.750 1.023 1.78 29.4 " N-2 13.755 14.704 0.949 1.86 30.7 " N-3 13.766 14.821 1.055 2.44 40.3 33.5 5.95 17.8
10.0 B-1 13.745 14.736 0.991 1.84 30.4 " B-2 13.754 14.758 1.004 1.69 27.9 " B-3 13.775 14.792 1.017 2.20 36.4 31.6 4.33 13.7
7.31 BLK 13.625 14.628 1.003 0.00 0.0
BUFFER pH Vial # Weight Empty Initial Weight Initial Weight Amt Recov (ng) % Rec AVG STD %RSD
Vial (g) Vial/PLASTIC (g) PLASTIC (g)
DEV 3.25 A-1 13.516 14.515 0.999 0.86 14.2 " A-2 13.428 14.466 1.038 0.97 16.1 " A-3 13.459 14.455 0.996 0.81 13.4 14.5 1.39 9.53
7.31 N-1 13.461 14.459 0.998 0.41 6.8 " N-2 13.454 14.447 0.993 1.08 17.9 " N-3 13.425 14.422 0.997 1.13 18.7 18.3 0.58 3.20
10.0 B-1 13.378 14.375 0.997 0.776 12.8 " B-2 13.477 14.480 1.003 0.88 14.6 " B-3 13.502 14.500 0.998 0.66 10.9 12.8 1.83 14.3
NO BUFFER NB-1 13.466 14.484 1.018 3.50 57.9 " NB-2 13.493 14.562 1.069 3.76 62.1 " NB-3 13.546 14.553 1.007 3.93 65.0 61.7 3.58 5.81
7.31 BLK 13.227 14.235 1.008 0.00 0.0
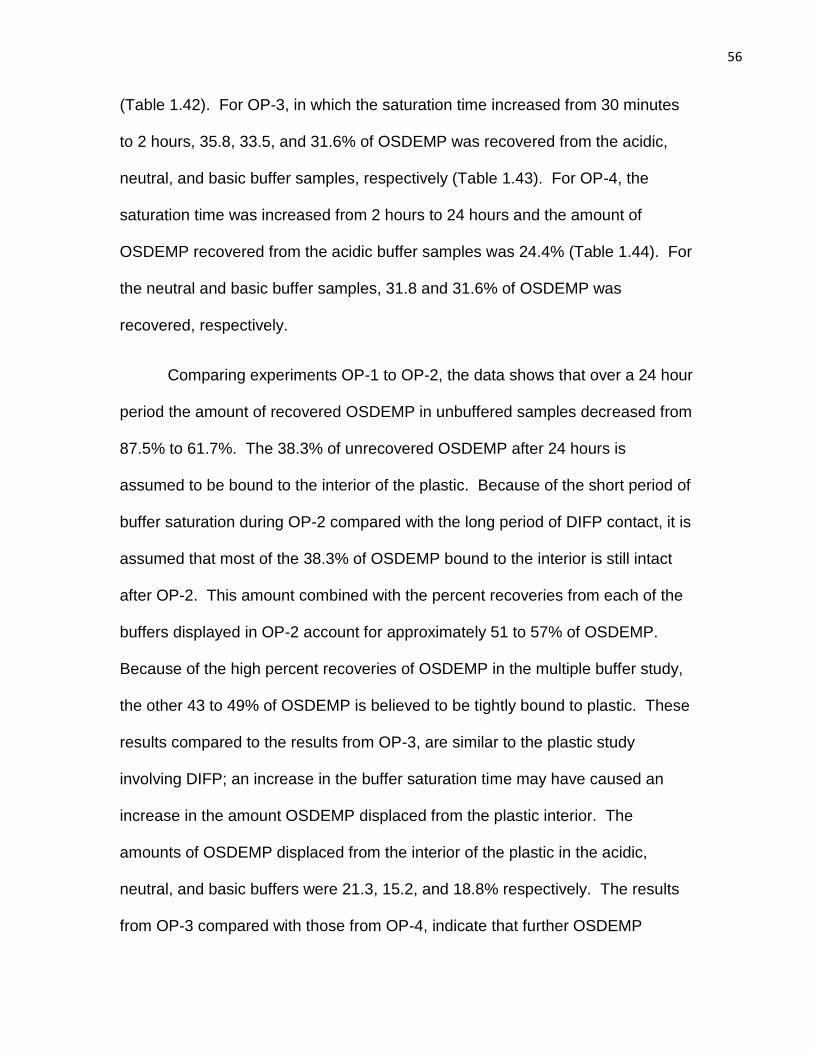
56
(Table 1.42). For OP-3, in which the saturation time increased from 30 minutes
to 2 hours, 35.8, 33.5, and 31.6% of OSDEMP was recovered from the acidic,
neutral, and basic buffer samples, respectively (Table 1.43). For OP-4, the
saturation time was increased from 2 hours to 24 hours and the amount of
OSDEMP recovered from the acidic buffer samples was 24.4% (Table 1.44). For
the neutral and basic buffer samples, 31.8 and 31.6% of OSDEMP was
recovered, respectively.
Comparing experiments OP-1 to OP-2, the data shows that over a 24 hour
period the amount of recovered OSDEMP in unbuffered samples decreased from
87.5% to 61.7%. The 38.3% of unrecovered OSDEMP after 24 hours is
assumed to be bound to the interior of the plastic. Because of the short period of
buffer saturation during OP-2 compared with the long period of DIFP contact, it is
assumed that most of the 38.3% of OSDEMP bound to the interior is still intact
after OP-2. This amount combined with the percent recoveries from each of the
buffers displayed in OP-2 account for approximately 51 to 57% of OSDEMP.
Because of the high percent recoveries of OSDEMP in the multiple buffer study,
the other 43 to 49% of OSDEMP is believed to be tightly bound to plastic. These
results compared to the results from OP-3, are similar to the plastic study
involving DIFP; an increase in the buffer saturation time may have caused an
increase in the amount OSDEMP displaced from the plastic interior. The
amounts of OSDEMP displaced from the interior of the plastic in the acidic,
neutral, and basic buffers were 21.3, 15.2, and 18.8% respectively. The results
from OP-3 compared with those from OP-4, indicate that further OSDEMP
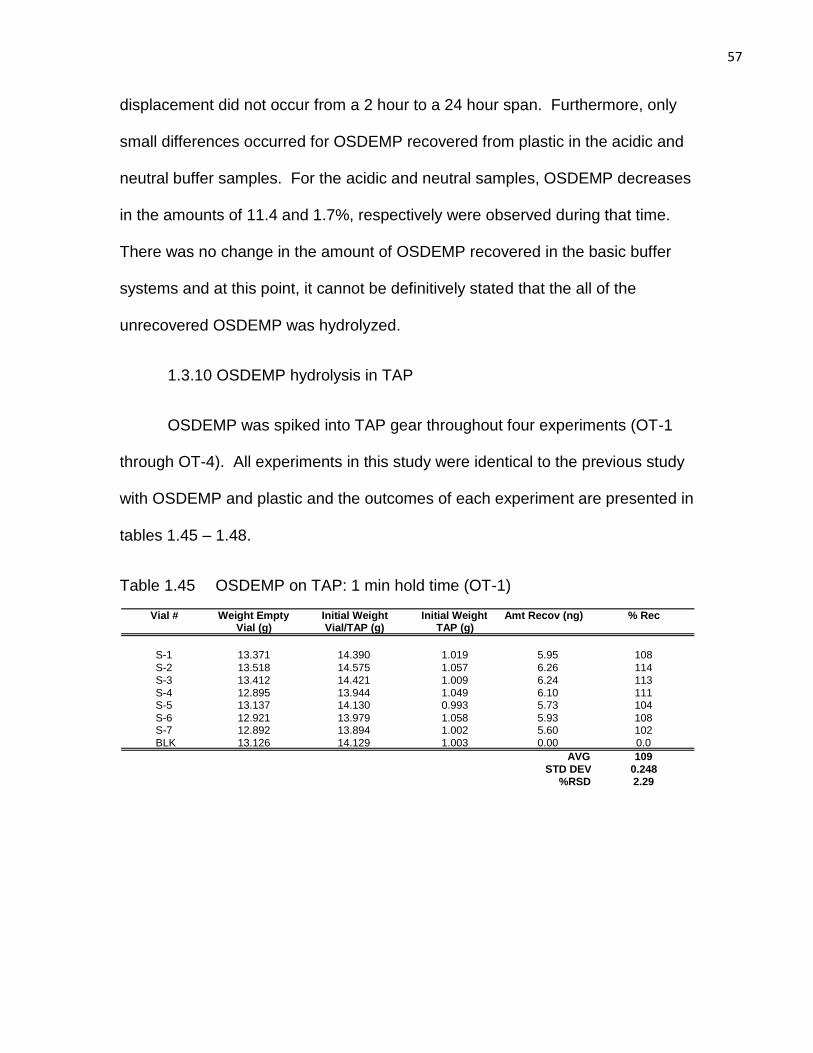
57
displacement did not occur from a 2 hour to a 24 hour span. Furthermore, only
small differences occurred for OSDEMP recovered from plastic in the acidic and
neutral buffer samples. For the acidic and neutral samples, OSDEMP decreases
in the amounts of 11.4 and 1.7%, respectively were observed during that time.
There was no change in the amount of OSDEMP recovered in the basic buffer
systems and at this point, it cannot be definitively stated that the all of the
unrecovered OSDEMP was hydrolyzed.
1.3.10 OSDEMP hydrolysis in TAP
OSDEMP was spiked into TAP gear throughout four experiments (OT-1
through OT-4). All experiments in this study were identical to the previous study
with OSDEMP and plastic and the outcomes of each experiment are presented in
tables 1.45 – 1.48.
Table 1.45 OSDEMP on TAP: 1 min hold time (OT-1)
Vial # Weight Empty Initial Weight Initial Weight Amt Recov (ng) % Rec Vial (g) Vial/TAP (g) TAP (g)
S-1 13.371 14.390 1.019 5.95 108 S-2 13.518 14.575 1.057 6.26 114 S-3 13.412 14.421 1.009 6.24 113 S-4 12.895 13.944 1.049 6.10 111 S-5 13.137 14.130 0.993 5.73 104 S-6 12.921 13.979 1.058 5.93 108 S-7 12.892 13.894 1.002 5.60 102 BLK 13.126 14.129 1.003 0.00 0.0
AVG 109 STD DEV 0.248
%RSD 2.29
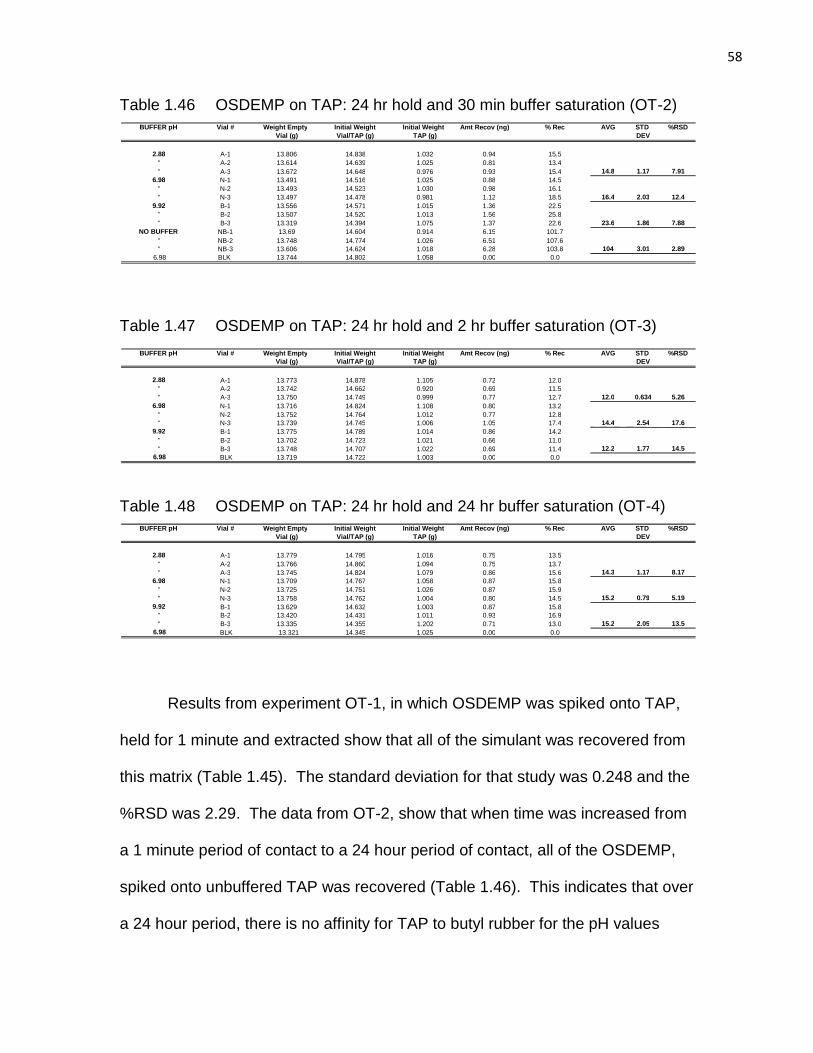
58
Table 1.46 OSDEMP on TAP: 24 hr hold and 30 min buffer saturation (OT-2)
Table 1.47 OSDEMP on TAP: 24 hr hold and 2 hr buffer saturation (OT-3)
Table 1.48 OSDEMP on TAP: 24 hr hold and 24 hr buffer saturation (OT-4)
Results from experiment OT-1, in which OSDEMP was spiked onto TAP,
held for 1 minute and extracted show that all of the simulant was recovered from
this matrix (Table 1.45). The standard deviation for that study was 0.248 and the
%RSD was 2.29. The data from OT-2, show that when time was increased from
a 1 minute period of contact to a 24 hour period of contact, all of the OSDEMP,
spiked onto unbuffered TAP was recovered (Table 1.46). This indicates that over
a 24 hour period, there is no affinity for TAP to butyl rubber for the pH values
BUFFER pH Vial # Weight Empty Initial Weight Initial Weight Amt Recov (ng) % Rec AVG STD %RSD
Vial (g) Vial/TAP (g) TAP (g)
DEV 2.88 A-1 13.779 14.795 1.016 0.75 13.5
" A-2 13.766 14.860 1.094 0.75 13.7 " A-3 13.745 14.824 1.079 0.86 15.6 14.3 1.17 8.17
6.98 N-1 13.709 14.767 1.058 0.87 15.8 " N-2 13.725 14.751 1.026 0.87 15.9 " N-3 13.758 14.762 1.004 0.80 14.5 15.2 0.79 5.19
9.92 B-1 13.629 14.632 1.003 0.87 15.8 " B-2 13.420 14.431 1.011 0.93 16.9 " B-3 13.335 14.355 1.202 0.71 13.0 15.2 2.05 13.5
6.98 BLK 13.321 14.345 1.025 0.00 0.0
BUFFER pH Vial # Weight Empty Initial Weight Initial Weight Amt Recov (ng) % Rec AVG STD %RSD
Vial (g) Vial/TAP (g) TAP (g)
DEV 2.88 A-1 13.773 14.878 1.105 0.72 12.0
" A-2 13.742 14.662 0.920 0.69 11.5 " A-3 13.750 14.749 0.999 0.77 12.7 12.0 0.634 5.26
6.98 N-1 13.716 14.824 1.108 0.80 13.2 " N-2 13.752 14.764 1.012 0.77 12.8 " N-3 13.739 14.745 1.006 1.05 17.4 14.4 2.54 17.6
9.92 B-1 13.775 14.789 1.014 0.86 14.2 " B-2 13.702 14.723 1.021 0.66 11.0 " B-3 13.748 14.707 1.022 0.69 11.4 12.2 1.77 14.5
6.98 BLK 13.719 14.722 1.003 0.00 0.0
BUFFER pH Vial # Weight Empty Initial Weight Initial Weight Amt Recov (ng) % Rec AVG STD %RSD
Vial (g) Vial/TAP (g) TAP (g)
DEV 2.88 A-1 13.806 14.838 1.032 0.94 15.5
" A-2 13.614 14.639 1.025 0.81 13.4 " A-3 13.672 14.648 0.976 0.93 15.4 14.8 1.17 7.91
6.98 N-1 13.491 14.516 1.025 0.88 14.5 " N-2 13.493 14.523 1.030 0.98 16.1 " N-3 13.497 14.478 0.981 1.12 18.5 16.4 2.03 12.4
9.92 B-1 13.556 14.571 1.015 1.36 22.5 " B-2 13.507 14.520 1.013 1.56 25.8 " B-3 13.319 14.394 1.075 1.37 22.6 23.6 1.86 7.88
NO BUFFER NB-1 13.69 14.604 0.914 6.15 101.7 " NB-2 13.748 14.774 1.026 6.51 107.6 " NB-3 13.606 14.624 1.018 6.28 103.8 104 3.01 2.89
6.98 BLK 13.744 14.802 1.058 0.00 0.0
59
tested. For OP-2, the low percent recoveries of the samples saturated with
buffer is an indication that OSDEMP developed an affinity to TAP. From a 2 hour
to a 24 hour period, the amount of OSDEMP recovered from saturated samples
increases by 2.3% in the acidic buffer samples and 0.8% in the neutral samples.
In the basic buffer system, the amount of OSDEMP recovered during this time
increased by 3.0%. This slight increase in recovery may be an indication that
OSDEMP in the presence of the experimental buffer systems does indeed have
a very high affinity to butyl rubber, but over a period of time the affinity weakens.
A look at the amounts of OSDEMP recovered from all three previously
discussed organic matrices is displayed in table A – 2. The comparison shows
that after a 1 minute contact time four of the six samples had no affinity for
OSDEMP during this time. The remaining samples (charcoal and plastic) still
possessed relatively low affinities for OSDEMP at 85.5 ad 87.5% recoveries,
respectively. For the experiment in which OSDEMP was spiked into the organic
matrix, held for 24 hours, and saturated with buffer for 30 minutes (24/30), the
individual matrix with the least affinity to OSDEMP was butyl rubber at 104%
recovery. As a group, charcoal had the least affinity for OSDEMP with greater
than 93% recovery in all samples. Overall, plastic had the least affinity to
OSDEMP during this time frame. For the next group, in which the OSDEMP
contact time remained constant, but the saturation time increased from 30
minutes to 2 hours (24/2), the organic matrix with the least affinity to OSDEMP
was charcoal. The entire charcoal sample group had no affinity for OSDEMP
during this that time frame. The group with the highest affinity to OSDEMP was
60
butyl rubber. For the last experiment, in which the OSDEMP contact time
remained constant but the saturation time increased from 2 hours to 24 hours, a
slight change in OSDEMP affinity occurred overall in both the butyl rubber
samples and in the plastic samples while a moderate change occurred in the
charcoal samples.
Because OSDEMP did not hydrolyze in the presence of any of the buffer
systems during the multiple buffer study, it may appear that this simulant was not
hydrolyzed in the charcoal, plastic, or TAP experiments. However, at this time it
is unclear if hydrolysis is occurring in these samples or if the samples have
developed high affinities to OSDEMP in their interiors, or both. Further testing is
necessary to determine which is occurring.
1.3.11 CEES hydrolysis in multiple buffers
In an experiment titled CB-1, the HD analog CEES was spiked into
acetate, boric acid, and disodium tetraborate buffers and the samples were
allowed to sit for 1 minute. The results are displayed in table 1.40. The goal
here was to compare the amount of time it took for CEES to interact and
ultimately undergo hydrolysis in buffered aqueous solutions with different pH
values. In this experiment, CEES was detected in all the buffer systems,
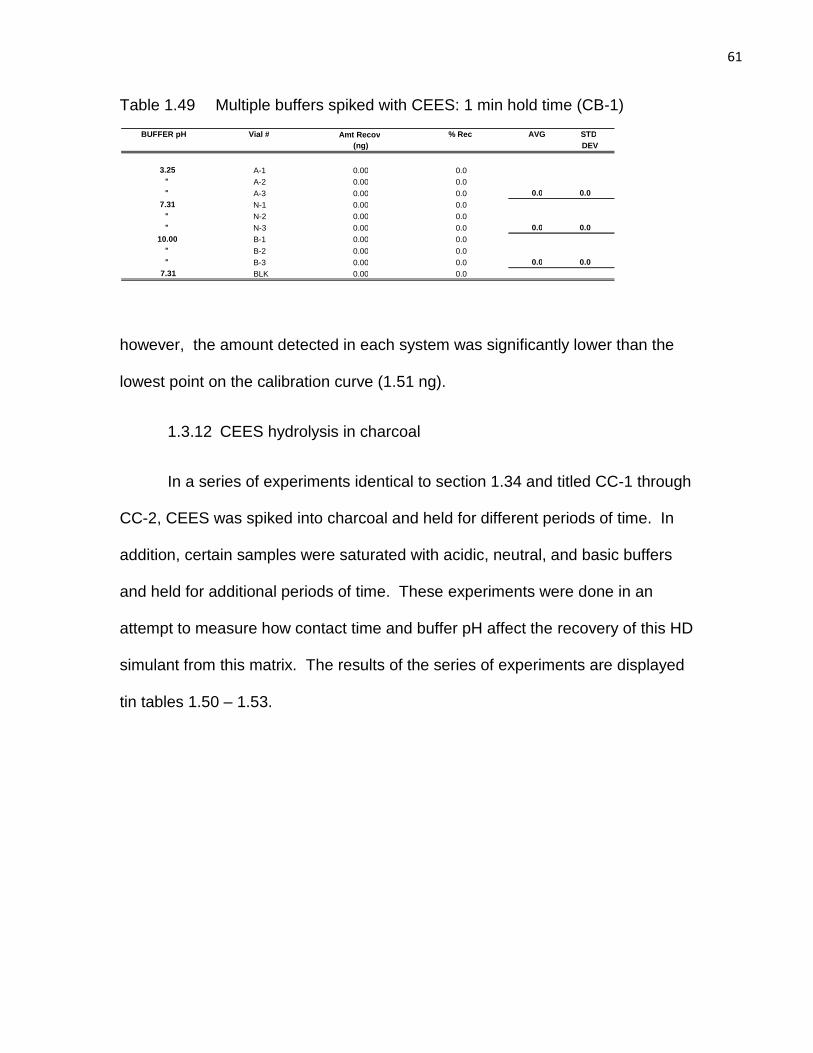
61
Table 1.49 Multiple buffers spiked with CEES: 1 min hold time (CB-1)
however, the amount detected in each system was significantly lower than the
lowest point on the calibration curve (1.51 ng).
1.3.12 CEES hydrolysis in charcoal
In a series of experiments identical to section 1.34 and titled CC-1 through
CC-2, CEES was spiked into charcoal and held for different periods of time. In
addition, certain samples were saturated with acidic, neutral, and basic buffers
and held for additional periods of time. These experiments were done in an
attempt to measure how contact time and buffer pH affect the recovery of this HD
simulant from this matrix. The results of the series of experiments are displayed
tin tables 1.50 – 1.53.
BUFFER pH Vial # Amt Recov
Recov
% Rec AVG STD (ng) DEV
3.25 A-1 0.00 0.0 " A-2 0.00 0.0 " A-3 0.00 0.0 0.0 0.0
7.31 N-1 0.00 0.0 " N-2 0.00 0.0 " N-3 0.00 0.0 0.0 0.0
10.00 B-1 0.00 0.0 " B-2 0.00 0.0 " B-3 0.00 0.0 0.0 0.0
7.31 BLK 0.00 0.0
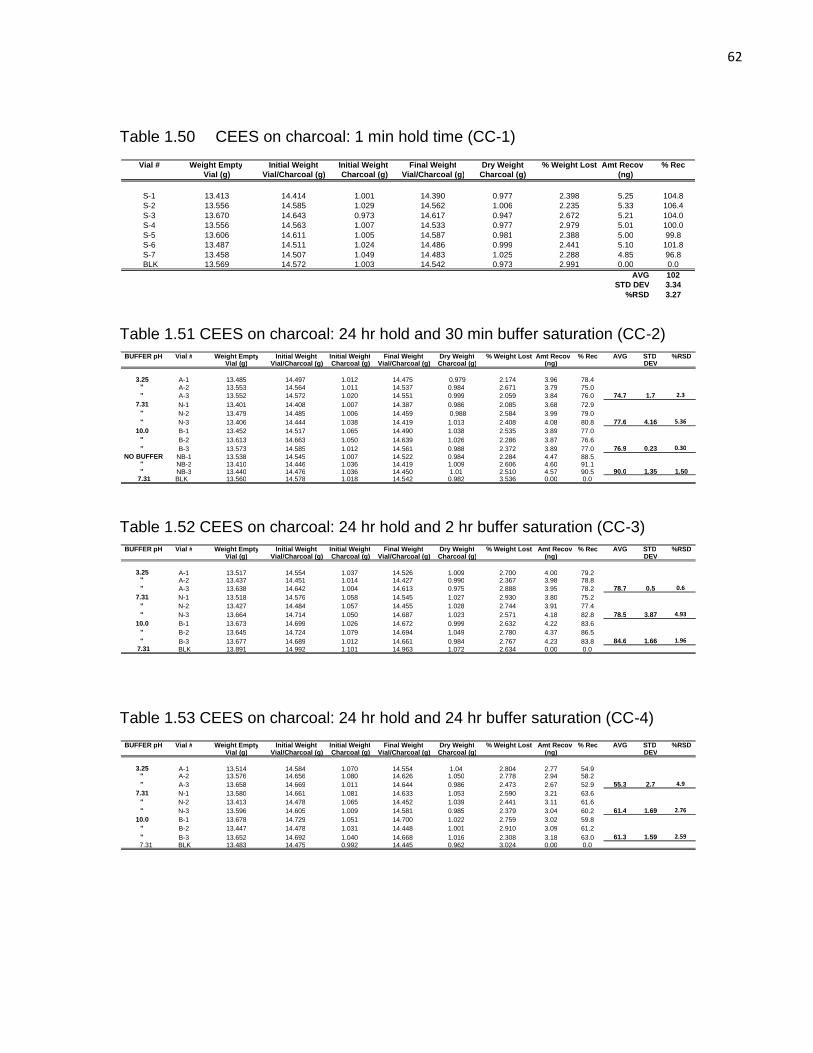
62
Table 1.50 CEES on charcoal: 1 min hold time (CC-1)
Table 1.51 CEES on charcoal: 24 hr hold and 30 min buffer saturation (CC-2)
Table 1.52 CEES on charcoal: 24 hr hold and 2 hr buffer saturation (CC-3)
Table 1.53 CEES on charcoal: 24 hr hold and 24 hr buffer saturation (CC-4)
BUFFER pH Vial # Weight Empty Initial Weight Initial Weight Final Weight Dry Weight % Weight Lost Amt Recov % Rec AVG STD %RSD
Vial (g) Vial/Charcoal (g) Charcoal (g) Vial/Charcoal (g) Charcoal (g) (ng) DEV 3.25 A-1 13.514 14.584 1.070 14.554 1.04 2.804 2.77 54.9 " A-2 13.576 14.656 1.080 14.626 1.050 2.778 2.94 58.2 " A-3 13.658 14.669 1.011 14.644 0.986 2.473 2.67 52.9 55.3 2.7 4.9
7.31 N-1 13.580 14.661 1.081 14.633 1.053 2.590 3.21 63.6 " N-2 13.413 14.478 1.065 14.452 1.039 2.441 3.11 61.6 " N-3 13.596 14.605 1.009 14.581 0.985 2.379 3.04 60.2 61.4 1.69 2.76
10.0 B-1 13.678 14.729 1.051 14.700 1.022 2.759 3.02 59.8 " B-2 13.447 14.478 1.031 14.448 1.001 2.910 3.09 61.2 " B-3 13.652 14.692 1.040 14.668 1.016 2.308 3.18 63.0 61.3 1.59 2.59
7.31 BLK 13.483 14.475 0.992 14.445 0.962 3.024 0.00 0.0
BUFFER pH Vial # Weight Empty Initial Weight Initial Weight Final Weight Dry Weight % Weight Lost Amt Recov % Rec AVG STD %RSD
Vial (g) Vial/Charcoal (g) Charcoal (g) Vial/Charcoal (g) Charcoal (g) (ng) DEV 3.25 A-1 13.517 14.554 1.037 14.526 1.009 2.700 4.00 79.2 " A-2 13.437 14.451 1.014 14.427 0.990 2.367 3.98 78.8 " A-3 13.638 14.642 1.004 14.613 0.975 2.888 3.95 78.2 78.7 0.5 0.6
7.31 N-1 13.518 14.576 1.058 14.545 1.027 2.930 3.80 75.2 " N-2 13.427 14.484 1.057 14.455 1.028 2.744 3.91 77.4 " N-3 13.664 14.714 1.050 14.687 1.023 2.571 4.18 82.8 78.5 3.87 4.93
10.0 B-1 13.673 14.699 1.026 14.672 0.999 2.632 4.22 83.6 " B-2 13.645 14.724 1.079 14.694 1.049 2.780 4.37 86.5 " B-3 13.677 14.689 1.012 14.661 0.984 2.767 4.23 83.8 84.6 1.66 1.96
7.31 BLK 13.891 14.992 1.101 14.963 1.072 2.634 0.00 0.0
BUFFER pH Vial # Weight Empty Initial Weight Initial Weight Final Weight Dry Weight % Weight Lost Amt Recov % Rec AVG STD %RSD
Vial (g) Vial/Charcoal (g) Charcoal (g) Vial/Charcoal (g) Charcoal (g) (ng) DEV 3.25 A-1 13.485 14.497 1.012 14.475 0.979 2.174 3.96 78.4 " A-2 13.553 14.564 1.011 14.537 0.984 2.671 3.79 75.0 " A-3 13.552 14.572 1.020 14.551 0.999 2.059 3.84 76.0 74.7 1.7 2.3
7.31 N-1 13.401 14.408 1.007 14.387 0.986 2.085 3.68 72.9 " N-2 13.479 14.485 1.006 14.459 0.988 2.584 3.99 79.0 " N-3 13.406 14.444 1.038 14.419 1.013 2.408 4.08 80.8 77.6 4.16 5.36
10.0 B-1 13.452 14.517 1.065 14.490 1.038 2.535 3.89 77.0 " B-2 13.613 14.663 1.050 14.639 1.026 2.286 3.87 76.6 " B-3 13.573 14.585 1.012 14.561 0.988 2.372 3.89 77.0 76.9 0.23 0.30
NO BUFFER NB-1 13.538 14.545 1.007 14.522 0.984 2.284 4.47 88.5 " NB-2 13.410 14.446 1.036 14.419 1.009 2.606 4.60 91.1 " NB-3 13.440 14.476 1.036 14.450 1.01 2.510 4.57 90.5 90.0 1.35 1.50
7.31 BLK 13.560 14.578 1.018 14.542 0.982 3.536 0.00 0.0
Vial # Weight Empty Initial Weight Initial Weight Final Weight Dry Weight % Weight Lost Amt Recov % Rec Vial (g) Vial/Charcoal (g) Charcoal (g) Vial/Charcoal (g) Charcoal (g) (ng)
S-1 13.413 14.414 1.001 14.390 0.977 2.398 5.25 104.8 S-2 13.556 14.585 1.029 14.562 1.006 2.235 5.33 106.4 S-3 13.670 14.643 0.973 14.617 0.947 2.672 5.21 104.0 S-4 13.556 14.563 1.007 14.533 0.977 2.979 5.01 100.0 S-5 13.606 14.611 1.005 14.587 0.981 2.388 5.00 99.8 S-6 13.487 14.511 1.024 14.486 0.999 2.441 5.10 101.8 S-7 13.458 14.507 1.049 14.483 1.025 2.288 4.85 96.8 BLK 13.569 14.572 1.003 14.542 0.973 2.991 0.00 0.0
AVG 102 STD DEV 3.34
%RSD 3.27
63
In experiment CC-1, CEES was spiked onto charcoal for a 1 minute
contact time; the data shows that all of the CEES were recovered from the
samples (Table 1.50). Upon increasing the contact time to 24 hours (experiment
CC-2), the results show that an average of 90% of the CEES was recovered from
charcoal (Table 1.51). For the remaining samples in that procedure that were
saturated with buffer for an additional 30 minutes, the data shows a recovery of
74.7, 77.8, and 76.9% for the acidic, neutral and basic buffer samples,
respectively. The results from experiment CC-3 shows that an average of 78.7,
78.5, and 84.6% of CEES was recovered from the acidic, neutral, and basic
samples, respectively, that were saturated for a 2 hour period (Table 1.52). The
acidic, neutral, and basic samples in CC-4 had CEES recoveries of 55.3, 61.4,
and 61.3%, respectively (Table 1.53).
A comparison of the results from CC-1 and CC-2, shows that after a 24
hour span the affinity of CEES to charcoal decreased by approximately 10% from
102% to 90%. The unrecovered 10% of CEES from CC-2 was assumed to be
tightly bound during this period and was not able to be extracted. Since the
unbuffered samples averaged a 10% loss in recovery over the 24 hour period, it
is assumed that the remaining samples lost the same amount before the addition
of the buffers. Upon addition of the acidic, neutral, and basic buffers to those
samples, the percentage of hydrolyzed CEES is assumed to 15.3, 12.4, and
13.1%, respectively. When the saturation time increased from 30 minutes to 2
hours, the percent recovery increased slightly in all samples: 4% for the acidic
samples, 0.9% for the neutral samples, and 7.7% for the basic samples. The
64
slight increase of percent recovery over this period may be an indication of CEES
displacement by the buffer systems. Upon comparison to experiment CC-3, the
results for procedure CC-4 appear to show an increase of displacement and
degradation over a 24 hour saturation period.
The data obtained throughout these four experiments also leads to
another possibility; the observed degradation of CEES is only indicative of the
CEES present upon the surface of the charcoal. The remaining CEES may have
developed a high affinity to the charcoal interior in the presence of the buffer and
was not able to be extracted. The apparent immediate hydrolysis of CEES in all
buffer systems seems to indicate that this compound is readily transferred into
the aqueous phase. However, the persistence of CEES upon charcoal after a 24
hour period indicates a relatively high affinity to this organic matrix.
A look at the amounts of CEES recovered from both buffer and charcoal is
displayed in table A – 3. After a 1 minute contact time, CEES has relatively no
affinity for charcoal but is completely hydrolyzed in all three buffer systems. For
the next two experiments involving CEES with charcoal (24/30, 24/2), the affinity
of CEES to charcoal remains relatively unchanged in all buffers except for the
basic buffer system (7.7% change). However, a moderate change occurs for all
three buffer systems in the final procedure (24/24). Further testing is necessary
to determine if the hydrolysis of CEES is occurring in these samples or a
moderate affinity has developed during this time frame.
65
1.4 CONCLUSION
It must be stated that the results reported here indicate the behavior of
CWA simulants and as such are not 100% comparable to actual CWA.
Similarities in the chemical structure may elicit similar not identical reaction
behavior. In addition, actual CWA stored in ton containers and munitions at CDF
are expected be somewhat degraded and exist in solution with other compounds
and degradation products. Because of these factors, actual CWA may be
expected to elicit somewhat different behavior under the experimental
parameters utilized in this report. The experiments discussed in this report
should be regarded as starting points to give an idea of what type of behavior
actual CWA may have in neat form in reactions occurring at 1 atm and 25 oC in
environments with normal humidity.
1.4.1 1 minute hold time (aqueous media)
After a 1 minute period, 100% hydrolysis of CEES occurred in all media
and 100 % recovery of OSDEMP occurred in all of the media (Table A – 1,
Figure 1). Recovered amounts in excess of 100% can be attributed to
temperature and humidity changes in the laboratory. These changes may have
affected the density of 2-propanol thus affecting the amount of recovered
simulant. Just over 85% of DIFP (in all media) was also recovered during this
time. All CEES spiked onto charcoal and all OSDEMP spiked onto TAP was also
recovered after 1 minute. All unrecovered simulant previously spiked onto the
66
matrices is either still attached to the matrix of was hydrolyzed on the matrix;
more testing is needed to determine which occurred
1.4.2 2 hour and 24 hour hold time (aqueous media)
All OSDEMP spiked into all aqueous media was recovered after both 2
and 24 spike periods (Table A – 2, Figure 2). Approximately 4% of DIFP was
recovered after the 24 hour spike period, the rest is assumed to have hydrolyzed.
1.4.3 24 hour hold time (organic matrices)
OSDEMP recoveries ranging from 93 to 97% were observed when this
simulant was spiked onto to charcoal for 24 hours and either saturated with
buffer for 30 minutes or not saturated at all (Table A – 3, Figure 3). None of the
DIFP spiked onto TAP and saturated with buffer after 30 minutes was recovered.
At this time the unrecovered DIFP and simulant on other matrices is believed to
have either hydrolyzed on the matrices or developed a high affinity and was
unable to be recovered.
All OSDEMP spiked onto charcoal (24 hour hold and 2 hour buffer
saturation) and saturated with all aqueous media was recovered (Table A – 4,
Figure 4).
DIFP spiked onto both plastic and TAP was completely recovered from
basic media after a 24 hour spike period and a 24 hour hold period (Table A – 5,
Figure 5). For the TAP samples spiked with DIFP in this study, extremely low
recoveries were also observed from the acidic and neutral media. Further testing
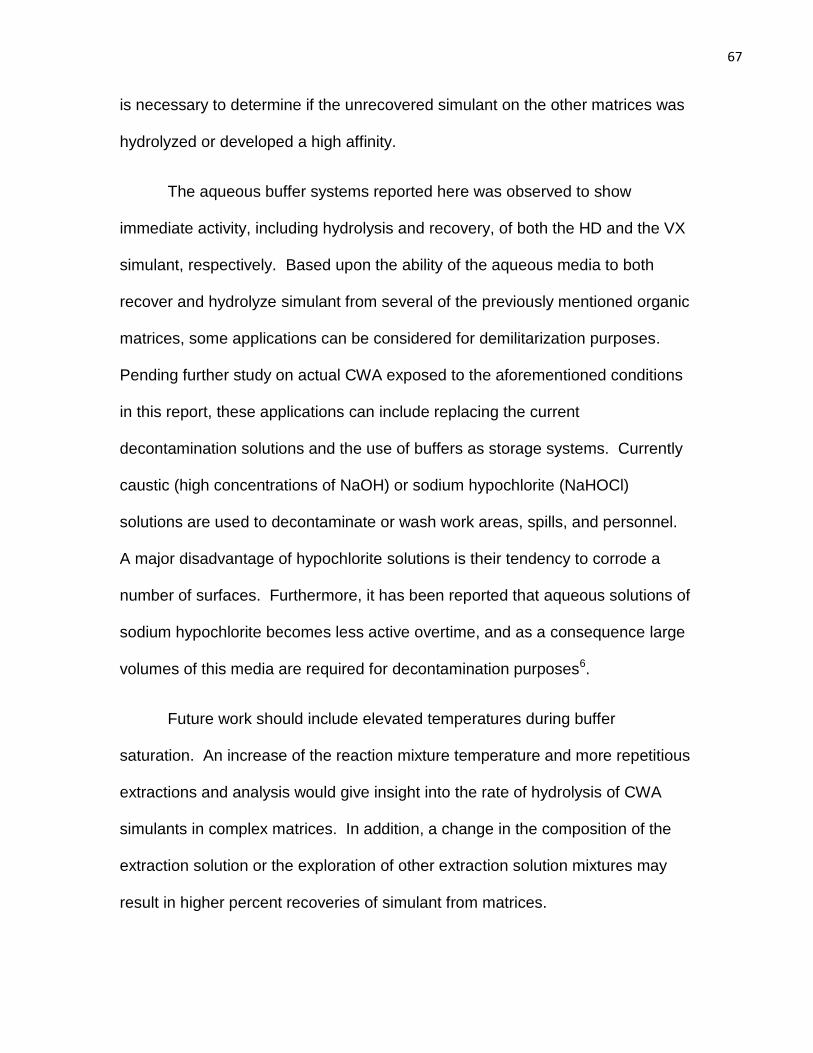
67
is necessary to determine if the unrecovered simulant on the other matrices was
hydrolyzed or developed a high affinity.
The aqueous buffer systems reported here was observed to show
immediate activity, including hydrolysis and recovery, of both the HD and the VX
simulant, respectively. Based upon the ability of the aqueous media to both
recover and hydrolyze simulant from several of the previously mentioned organic
matrices, some applications can be considered for demilitarization purposes.
Pending further study on actual CWA exposed to the aforementioned conditions
in this report, these applications can include replacing the current
decontamination solutions and the use of buffers as storage systems. Currently
caustic (high concentrations of NaOH) or sodium hypochlorite (NaHOCl)
solutions are used to decontaminate or wash work areas, spills, and personnel.
A major disadvantage of hypochlorite solutions is their tendency to corrode a
number of surfaces. Furthermore, it has been reported that aqueous solutions of
sodium hypochlorite becomes less active overtime, and as a consequence large
volumes of this media are required for decontamination purposes6.
Future work should include elevated temperatures during buffer
saturation. An increase of the reaction mixture temperature and more repetitious
extractions and analysis would give insight into the rate of hydrolysis of CWA
simulants in complex matrices. In addition, a change in the composition of the
extraction solution or the exploration of other extraction solution mixtures may
result in higher percent recoveries of simulant from matrices.
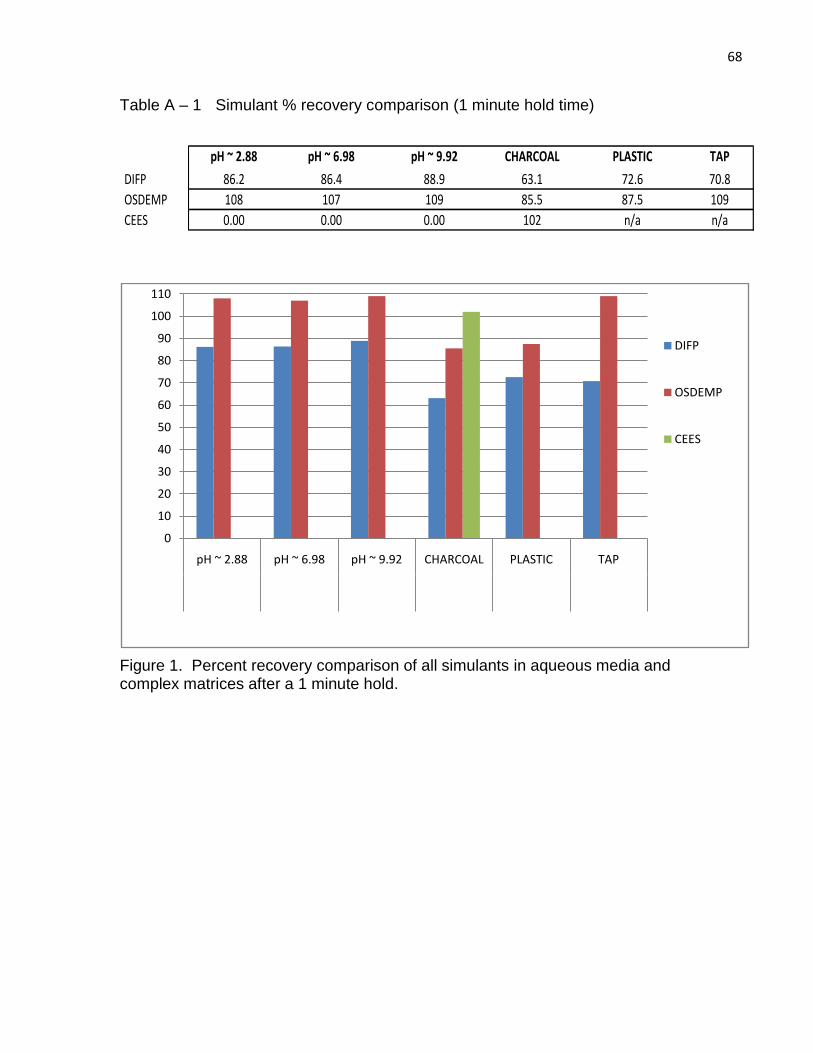
68
Table A – 1 Simulant % recovery comparison (1 minute hold time)
Figure 1. Percent recovery comparison of all simulants in aqueous media and complex matrices after a 1 minute hold.
pH ~ 2.88 pH ~ 6.98 pH ~ 9.92 CHARCOAL PLASTIC TAP
DIFP 86.2 86.4 88.9 63.1 72.6 70.8
OSDEMP 108 107 109 85.5 87.5 109
CEES 0.00 0.00 0.00 102 n/a n/a
pH ~ 9.92
0
10
20
30
40
50
60
70
80
90
100
110
pH ~ 2.88 pH ~ 6.98 pH ~ 9.92 CHARCOAL PLASTIC TAP
DIFP
OSDEMP
CEES
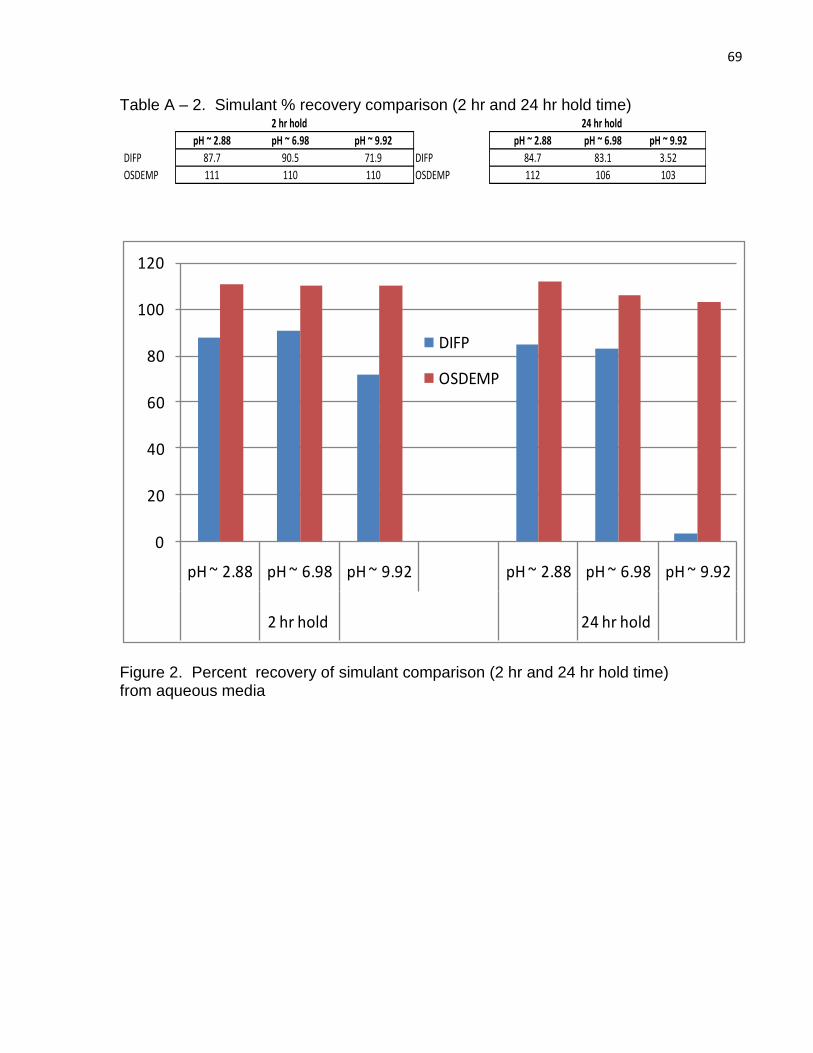
69
Table A – 2. Simulant % recovery comparison (2 hr and 24 hr hold time)
Figure 2. Percent recovery of simulant comparison (2 hr and 24 hr hold time) from aqueous media
2 hr hold 24 hr hold
pH ~ 2.88 pH ~ 6.98 pH ~ 9.92 pH ~ 2.88 pH ~ 6.98 pH ~ 9.92
DIFP 87.7 90.5 71.9 DIFP 84.7 83.1 3.52
OSDEMP 111 110 110 OSDEMP 112 106 103
0
20
40
60
80
100
120
pH ~ 2.88 pH ~ 6.98 pH ~ 9.92 pH ~ 2.88 pH ~ 6.98 pH ~ 9.92
2 hr hold 24 hr hold
DIFP
OSDEMP
70
Table A – 3 Simulant % recovery comparison (24 hr hold & 30 minute saturation period).
Figure 3. Percent recovery comparison of simulants in matrices after a 24 hour hold and a 30 minute buffer saturation period.
DIFP / charcoal OSDEMP / charcoal CEES / charcoal DIFP / plastic OSDEMP / plastic DIFP / TAP OSDEMP / TAP
BUFFER CHARCOAL CHARCOAL CHARCOAL PLASTIC PLASTIC TAP TAP
TYPE 24/30 24/30 24/30 24/30 24/30 24/30 24/30
NO BUFFER 66.6 95.0 90 79.1 61.7 87.3 104
pH ~ 2.88 85.9 93.2 74.7 55.8 14.5 0 14.8
pH ~ 6.98 79.5 95.6 77.6 58.4 18.3 0 16.4
pH ~ 9.92 79.2 97.7 76.9 53.3 12.8 0 23.6
-5
5
15
25
35
45
55
65
75
85
95
105
DIFP / charcoal
OSDEMP / charcoal
CEES / charcoal
DIFP / plastic
OSDEMP / plastic
DIFP / TAPOSDEMP / TAP
NO BUFFER
pH ~ 2.88
pH ~ 6.98
pH ~ 9.92
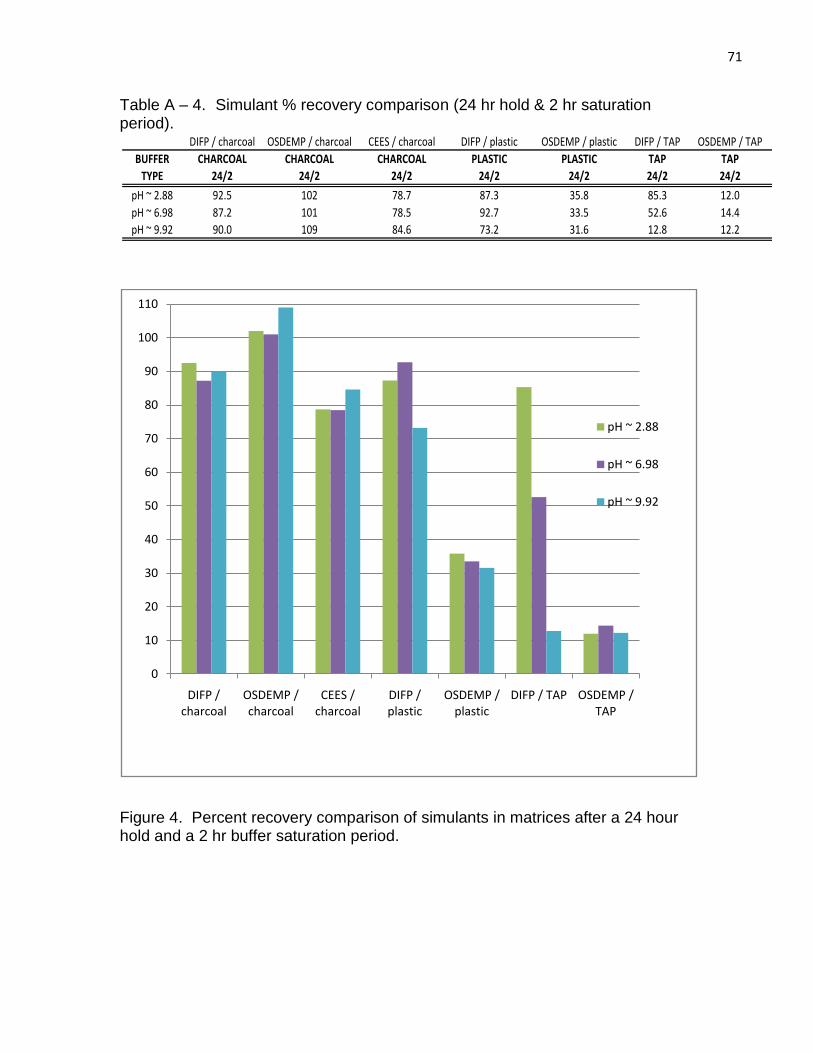
71
Table A – 4. Simulant % recovery comparison (24 hr hold & 2 hr saturation period).
Figure 4. Percent recovery comparison of simulants in matrices after a 24 hour hold and a 2 hr buffer saturation period.
DIFP / charcoal OSDEMP / charcoal CEES / charcoal DIFP / plastic OSDEMP / plastic DIFP / TAP OSDEMP / TAP
BUFFER CHARCOAL CHARCOAL CHARCOAL PLASTIC PLASTIC TAP TAP
TYPE 24/2 24/2 24/2 24/2 24/2 24/2 24/2
pH ~ 2.88 92.5 102 78.7 87.3 35.8 85.3 12.0
pH ~ 6.98 87.2 101 78.5 92.7 33.5 52.6 14.4
pH ~ 9.92 90.0 109 84.6 73.2 31.6 12.8 12.2
0
10
20
30
40
50
60
70
80
90
100
110
DIFP / charcoal
OSDEMP / charcoal
CEES / charcoal
DIFP / plastic
OSDEMP / plastic
DIFP / TAP OSDEMP / TAP
pH ~ 2.88
pH ~ 6.98
pH ~ 9.92
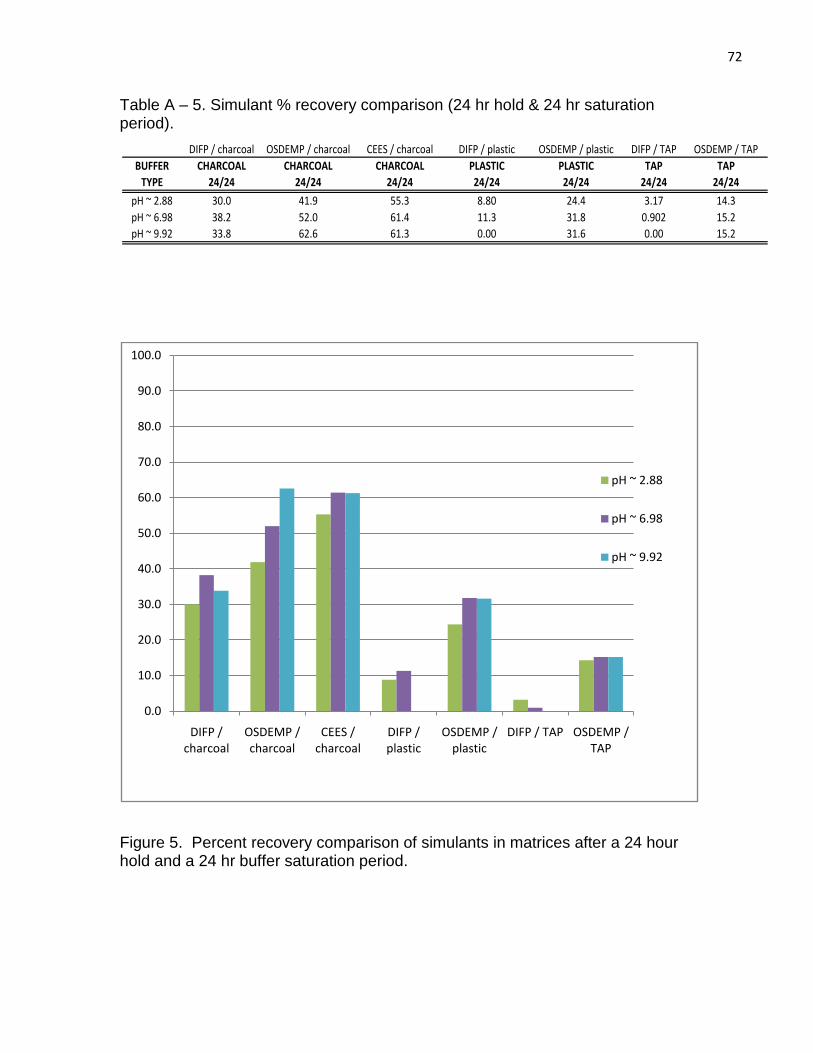
72
Table A – 5. Simulant % recovery comparison (24 hr hold & 24 hr saturation period).
Figure 5. Percent recovery comparison of simulants in matrices after a 24 hour hold and a 24 hr buffer saturation period.
DIFP / charcoal OSDEMP / charcoal CEES / charcoal DIFP / plastic OSDEMP / plastic DIFP / TAP OSDEMP / TAP
BUFFER CHARCOAL CHARCOAL CHARCOAL PLASTIC PLASTIC TAP TAP
TYPE 24/24 24/24 24/24 24/24 24/24 24/24 24/24
pH ~ 2.88 30.0 41.9 55.3 8.80 24.4 3.17 14.3
pH ~ 6.98 38.2 52.0 61.4 11.3 31.8 0.902 15.2
pH ~ 9.92 33.8 62.6 61.3 0.00 31.6 0.00 15.2
0.0
10.0
20.0
30.0
40.0
50.0
60.0
70.0
80.0
90.0
100.0
DIFP / charcoal
OSDEMP / charcoal
CEES / charcoal
DIFP / plastic
OSDEMP / plastic
DIFP / TAP OSDEMP / TAP
pH ~ 2.88
pH ~ 6.98
pH ~ 9.92
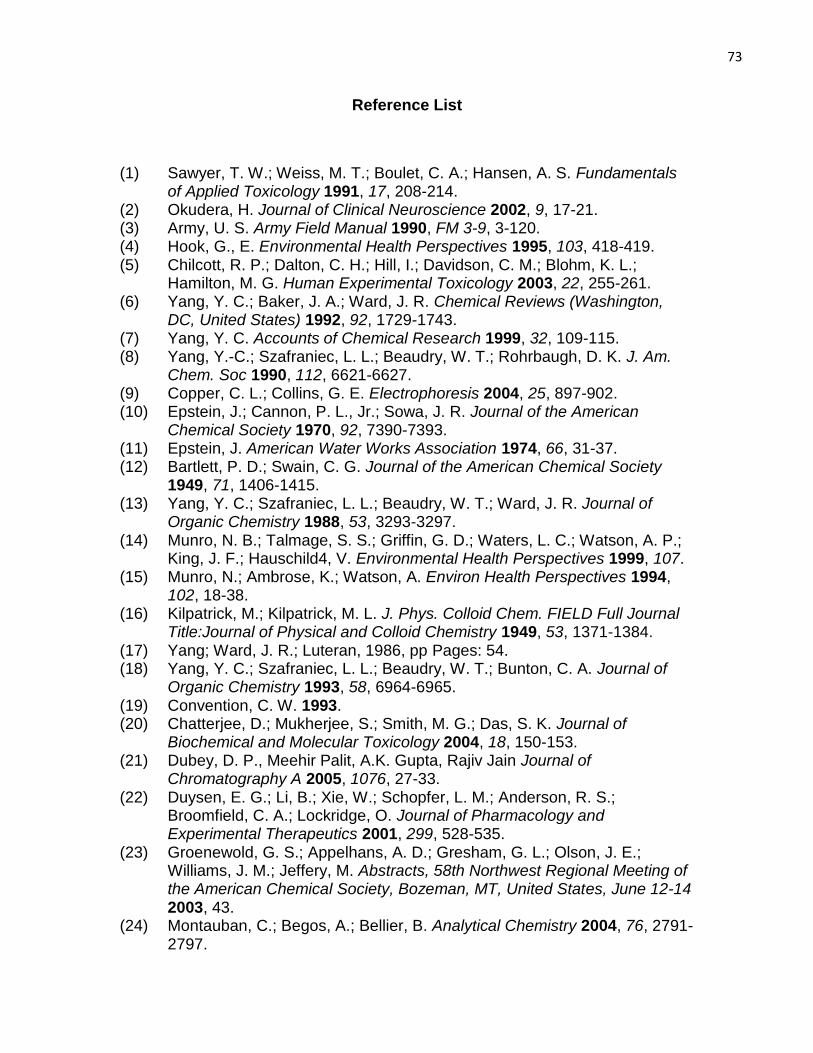
73
Reference List
(1) Sawyer, T. W.; Weiss, M. T.; Boulet, C. A.; Hansen, A. S. Fundamentals
of Applied Toxicology 1991, 17, 208-214. (2) Okudera, H. Journal of Clinical Neuroscience 2002, 9, 17-21. (3) Army, U. S. Army Field Manual 1990, FM 3-9, 3-120. (4) Hook, G., E. Environmental Health Perspectives 1995, 103, 418-419. (5) Chilcott, R. P.; Dalton, C. H.; Hill, I.; Davidson, C. M.; Blohm, K. L.;
Hamilton, M. G. Human Experimental Toxicology 2003, 22, 255-261. (6) Yang, Y. C.; Baker, J. A.; Ward, J. R. Chemical Reviews (Washington,
DC, United States) 1992, 92, 1729-1743. (7) Yang, Y. C. Accounts of Chemical Research 1999, 32, 109-115. (8) Yang, Y.-C.; Szafraniec, L. L.; Beaudry, W. T.; Rohrbaugh, D. K. J. Am.
Chem. Soc 1990, 112, 6621-6627. (9) Copper, C. L.; Collins, G. E. Electrophoresis 2004, 25, 897-902. (10) Epstein, J.; Cannon, P. L., Jr.; Sowa, J. R. Journal of the American
Chemical Society 1970, 92, 7390-7393. (11) Epstein, J. American Water Works Association 1974, 66, 31-37. (12) Bartlett, P. D.; Swain, C. G. Journal of the American Chemical Society
1949, 71, 1406-1415. (13) Yang, Y. C.; Szafraniec, L. L.; Beaudry, W. T.; Ward, J. R. Journal of
Organic Chemistry 1988, 53, 3293-3297. (14) Munro, N. B.; Talmage, S. S.; Griffin, G. D.; Waters, L. C.; Watson, A. P.;
King, J. F.; Hauschild4, V. Environmental Health Perspectives 1999, 107. (15) Munro, N.; Ambrose, K.; Watson, A. Environ Health Perspectives 1994,
102, 18-38. (16) Kilpatrick, M.; Kilpatrick, M. L. J. Phys. Colloid Chem. FIELD Full Journal
Title:Journal of Physical and Colloid Chemistry 1949, 53, 1371-1384. (17) Yang; Ward, J. R.; Luteran, 1986, pp Pages: 54. (18) Yang, Y. C.; Szafraniec, L. L.; Beaudry, W. T.; Bunton, C. A. Journal of
Organic Chemistry 1993, 58, 6964-6965. (19) Convention, C. W. 1993. (20) Chatterjee, D.; Mukherjee, S.; Smith, M. G.; Das, S. K. Journal of
Biochemical and Molecular Toxicology 2004, 18, 150-153. (21) Dubey, D. P., Meehir Palit, A.K. Gupta, Rajiv Jain Journal of
Chromatography A 2005, 1076, 27-33. (22) Duysen, E. G.; Li, B.; Xie, W.; Schopfer, L. M.; Anderson, R. S.;
Broomfield, C. A.; Lockridge, O. Journal of Pharmacology and Experimental Therapeutics 2001, 299, 528-535.
(23) Groenewold, G. S.; Appelhans, A. D.; Gresham, G. L.; Olson, J. E.; Williams, J. M.; Jeffery, M. Abstracts, 58th Northwest Regional Meeting of the American Chemical Society, Bozeman, MT, United States, June 12-14 2003, 43.
(24) Montauban, C.; Begos, A.; Bellier, B. Analytical Chemistry 2004, 76, 2791-2797.
74
(25) Piao, H.; Marx, R. B.; Schneider, S.; Irvine, D. A.; Staton, J. J. Chromatogr., A FIELD Full Journal Title:Journal of Chromatography, A 2005, 1089, 65-71.
(26) Technology, B. o. A. S. a. The National Academic Press 2007. (27) Scott, R. P. W. "Chromatographic Detectors: Design, Function, and
Operation", Marcel Dekker, Inc. New York, (1996), 99. (28) Braithwaite, A; Smith F. J. "Chromatographic Methods", Kluwer Academic
Publishers, Boston (1999), 232-234. (29) "Modern Practice of Gas Chromatography", (Ed. Grob, Robert L, and
Barry, Eugene F.), John Wiley & Sons, Inc New Jersey (2004) 326-328.


![[PPT]Tema 2.- MATRICES - Open Course Ware Moodle 2.5 · Web viewMATRICES PRODUCTO DE MATRICES POTENCIAS NATURALES DE MATRICES CUADRADAS MATRICES SUMA DE MATRICES. PRODUCTO DE UN ESCALAR](https://img.pdfslide.us/doc/110x75/5c17a16c09d3f2c7368c2ad2/ppttema-2-matrices-open-course-ware-moodle-25-web-viewmatrices-producto.jpg)