Embed Size (px)
Citation preview

Faraday 1
The Faraday Effect
Objective
To observe the interaction of light and matter, as modified by the presence of a magnetic
field, and to apply the classical theory of matter to the observations. You will measure the
Verdet constant for several materials and obtain the value of e/m, the charge to mass ratio
for the electron.
Equipment
Electromagnet (Atomic labs, 0028), magnet power supply (Cencocat. #79551, 50V-5A
DC, 32 & 140 V AC, RU #00048664), gaussmeter (RFL Industries), High Intensity
Tungsten Filament Lamp, three interference filters, volt-ammeter (DC), Nicol prisms (2),
glass samples (extra dense flint (EDF), light flint (LF), Kigre), sample holder (PVC), HP
6235A Triple output power supply, HP 34401 Multimeter, Si photodiode detector.
I. Introduction
If any transparent solid or liquid is placed in a uniform magnetic field, and a beam of
plane polarized light is passed through it in the direction parallel to the magnetic lines of
force (through holes in the pole shoes of a strong electromagnet), it is found that the
transmitted light is still plane polarized, but that the plane of polarization is rotated by an
angle proportional to the field intensity. This "optical rotation" is called the Faraday
rotation (or Farady effect) and differs in an important respect from a similar effect, called
optical activity, occurring in sugar solutions. In a sugar solution, the optical rotation
proceeds in the same direction, whichever way the light is directed. In particular, when a
beam is reflected back through the solution it emerges with the same polarization as it
entered before reflection. In the Faraday effect, however, the direction of the optical
rotation, as viewed when looking into the beam, is reversed when the light traverses the
substance opposite to the magnetic field direction; that is, the rotation can be reversed by
either changing the field direction or the light direction. Reflected light, having passed
twice through the medium, has its plane of polarization rotated by twice the angle
observed for single transmission.
By placing the sample between two pieces of Polaroid or two Nichol prisms, it can be
arranged (with sufficient magnetic field strength) that little light is transmitted through
the system in one direction, while it can pass, eventually with undiminished intensity, in
the opposite direction. The effect is unique in this respect: it permits the construction of
an irreversible optical instrument with which observer A can see observer B, while A
cannot be seen by B.
Read the theory of the Faraday rotation in the appendix and consult the references given
at the end of this writeup. Many references can also be found online.
The relation between the angle of rotation of the polarization and the magnetic field in
the transparent material is given by Becquerel's formula:

Faraday 2
1. = VBd
Wherethe is the angle of rotation, d is the length of the path where the light and
magnetic field interact (d is the sample thickness for this experiment), B is the magnetic
field component in the direction of the light propagation and V is the Verdet constant for
the material (MKS units: radian/Tesla meter). This empirical proportionality constant
varies with wavelength and temperature and is tabulated for various materials.
The Verdet Constant, V, depends on the dispersion of the refractive index, dn/d where n
is the index of refraction is the wavelength. As shown in the appendix:
2. V = /dB = -
d
dn
cm
e
2
1
Here e/m is the charge to mass ratio of the electron and c is the speed of light. Some
values of V are listed in the table
http://en.wikipedia.org/wiki/Faraday_effect

Faraday 3
Substances that are noted for their large dispersion (large dn/d), such as heavy flint
glasses, and CS2, also show a large Faraday effect as predicted by the theory. In the
visible range the refractive index of common substances, such as air, water; lead and soda
glasses, etc., decreases rapidly with increasing wavelength (increasing frequency
separation from the governing ultraviolet absorption resonances; normal dispersion);
hence, dn/d is negative and it follows that light traveling in the direction of B has its
plane of polarization turned counterclockwise for an observer looking into the beam. The
theory discussed in the appendix (cross product expression for magnetic force on a
moving charged particle) explains the reversal of the rotation when either the field or the
light direction is reversed (but not both). These theoretical conclusions are confirmed by
the observations. The fact that the theory predicts the correct sign is a direct proof that
the effect is related to the motion of negative charges, the electrons.
With the exception of some paramagnetic materials, the quantitative observations are in
excellent agreement with Becquerel's equation. Typically, from = 6 x 10⁻⁵ to 7 x 10⁻⁵
cm, the refractive index changes by about 10-2. Hence (in mks units) with dn/d ≈ 105
m-1,/c ≈ 2x10-15 seconds, and e
m = 1.76x10¹¹, V is therefore about 17.6 radians per
tesla-meter, or ≈ 0.06 minutes of arc per gauss-cm. With a good Nichol prism, rotations
of about one-half minute can be observed. Since paths of several centimeters length and
fields of a few thousand gauss can be used, the Faraday effect is quite easy to observe and
is measurable with good accuracy.
Faraday 4
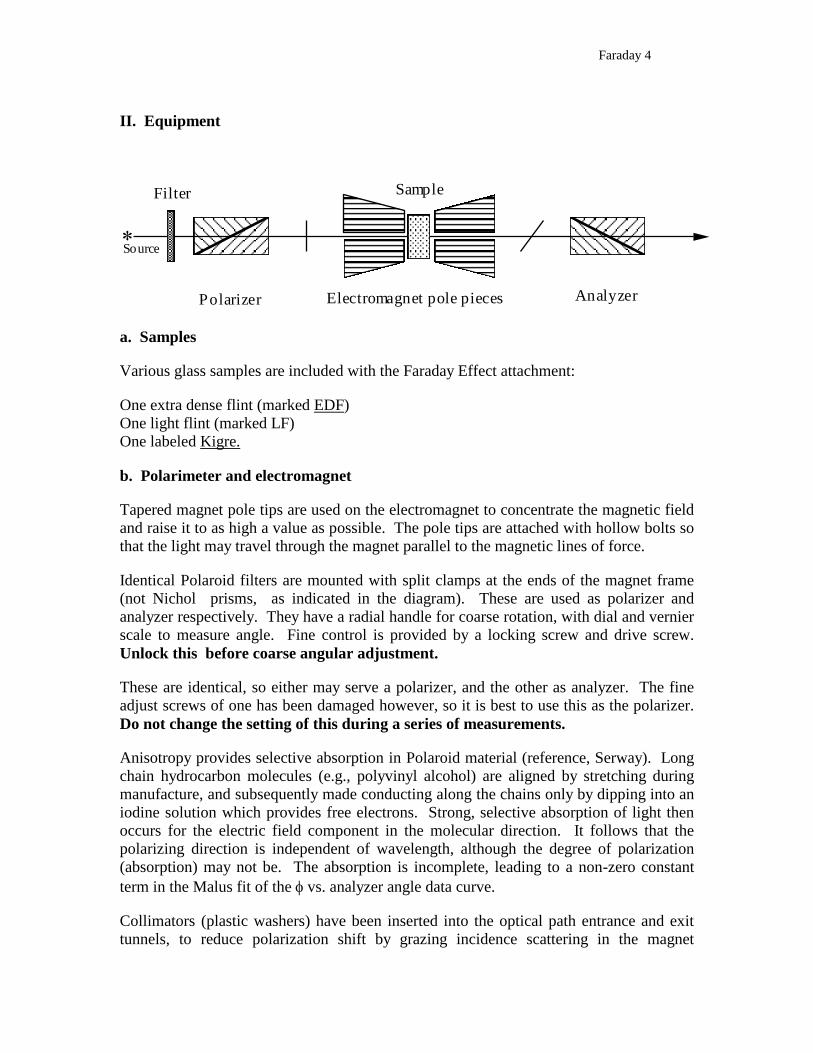
II. Equipment
Polarizer Electromagnet pole pieces Analyzer
SampleFilter
Source
a. Samples
Various glass samples are included with the Faraday Effect attachment:
One extra dense flint (marked EDF)
One light flint (marked LF)
One labeled Kigre.
b. Polarimeter and electromagnet
Tapered magnet pole tips are used on the electromagnet to concentrate the magnetic field
and raise it to as high a value as possible. The pole tips are attached with hollow bolts so
that the light may travel through the magnet parallel to the magnetic lines of force.
Identical Polaroid filters are mounted with split clamps at the ends of the magnet frame
(not Nichol prisms, as indicated in the diagram). These are used as polarizer and
analyzer respectively. They have a radial handle for coarse rotation, with dial and vernier
scale to measure angle. Fine control is provided by a locking screw and drive screw.
Unlock this before coarse angular adjustment.
These are identical, so either may serve a polarizer, and the other as analyzer. The fine
adjust screws of one has been damaged however, so it is best to use this as the polarizer.
Do not change the setting of this during a series of measurements.
Anisotropy provides selective absorption in Polaroid material (reference, Serway). Long
chain hydrocarbon molecules (e.g., polyvinyl alcohol) are aligned by stretching during
manufacture, and subsequently made conducting along the chains only by dipping into an
iodine solution which provides free electrons. Strong, selective absorption of light then
occurs for the electric field component in the molecular direction. It follows that the
polarizing direction is independent of wavelength, although the degree of polarization
(absorption) may not be. The absorption is incomplete, leading to a non-zero constant
term in the Malus fit of the vs. analyzer angle data curve.
Collimators (plastic washers) have been inserted into the optical path entrance and exit
tunnels, to reduce polarization shift by grazing incidence scattering in the magnet
Faraday 5
"tunnels".
c. Light sources
The transparent glass is placed between the pole faces with the plastic support resting on
the tapered portion of the pole faces. A high-intensity incandescent lamp with filters is
used as a light source. A bright light source is desirable since greater contrast of light
levels is helpful in obtaining accurate data.
There are three filters. The wavelengths are engraved on the outside, front end of the filter
barrels.
Blue: 4495 Å Yellow: 5490 Å Red: 6500 Å
These are very narrow band interference filters ( = 15-50 Å). Use these peak
wavelengths as the effective wavelengths.The filters are in cells that slide into the front
end of the apparatus. The filter should face the high-intensity tungsten lamp. Do not force
the filter cell into the apparatus.
IT IS IMPORTANT THAT THE FILTER DOES NOT COME INTO CONTACT
WITH THE HOT BULB. LEAVE A TWO INCH AIR SPACE BETWEEN THE
FILTER AND THE BULB.
Put the lamp at maximum intensity for best results. If you see saturation put the lamp on
medium brightness and move the lamp away from the filter end.
d. Magnet
The magnet is controlled with a variable power supply. The voltage output of the power
supply, proportional to the magnet current, is measured with a multi meter (HP 34401 ).
III. Experimental procedure
The aim of this experiment is to test the Bequerel relation and to measure the Verdet
constant and its dependence on the wavelength of light. You will collect data to plot the
light intensity vs. polarizer angle for B=0, and several nonzero B fields. You will then fit
the data to Malus law which will allow you to extract the values of the polarization
rotation angle as a function of field, B. From the field dependence of the polarization
rotation you will check the linearity with field and calculate the Verdet constant for three
wavelengths. Finally you will use your data to obtain the value of e/m.
1. Light detection
The intensity minimum can be determined by eye, which has excellent, non-linear
sensitivity, but with poor precision and cumulative eye fatigue. Using a photosensitive
detector is more objective. Among the possibilities are a photodiode, a photoresistive
device and a phototransistor.
Faraday 6
The eye can be very sensitive to low light levels, due to its approximately logarithmic
intensity response. A photoresistor also has a non-linear response. The photo transistor
and photodiode can exhibit a fairly linear response over a range of intensity, making them
suitable for the Malus law (cosine squared) behavior of intensity vs. analyzer angle which
is the basis of the present method of determining the minimum of intensity. This law, in
turn, follows and exhibits directly the vector character of the electric field.
At present a silicon photodiode is employed in the photovoltaic mode (no bias). DC
output voltage is read with a HP 34401 multimeter. Range should be set for minimum
fluctuation, sacrificing resolution. Choose "Slow 6 digit" mode (integration time 2
seconds) on the MEASurement (5: resolution) menu. (The display asterisk will blink at
the end of each measurement cycle.) Refer to the HP manual menu tutorial; also to pages
13, 34 and 81-83.
The photodiode is about 0.1" square with an integral collecting and focusing lens. The
diode housing is clamped with four set screws to the analyzer housing, and rotates with it.
One detector lead is grounded to the case (and thus to the coax braid via the UHF-BNC
adapter); the other connects to the coax center wire. The other end of the coax cable
terminates in a double banana plug. The pin adjacent to the plastic lug is connected to
coax braid and thus to Faraday apparatus ground; be sure this plug is inserted into the lo
input of the HP multimeter. (Check for proper and for reverse input orientation the meter
reading response to touching the cable ground.) If any other devices (e.g., a notebook
computer) are plugged into the meter power strip, check meter fluctuation, reading shift,
etc. Try reversing the power plug if there seems to be a problem; better, run the device on
battery.
The theoretical variation of detector output would follow Malus cos2() "law". This is a
direct consequence of the fact that the amplitude of the electromagnetic wave passed by
the analyzer is proportional to |cos()| , where is the angle between polarizer and
analyzer. Thus the transmitted intensity is proportional to cos2()), with an additional
constant term that is present when the polarization and analysis are incomplete. When
using visual detection of the analyzed intensity observing the minimum angle is
preferable to observation of the maximum (less saturation of eye sensitivity), but rates of
change of either are small.
The Malus "law" offers a simple alternative way to detect with considerable precision the
"crossed" or the "parallel" angle of the analyzer (minimum or maximum detector voltage)
by non-linear least square fitting of a curve of detector voltage vs. angle. Application of
the Malus theory requires that the detector response remain linear over the range of light
intensities fit, and that the source remain fixed in position and constant in intensity during
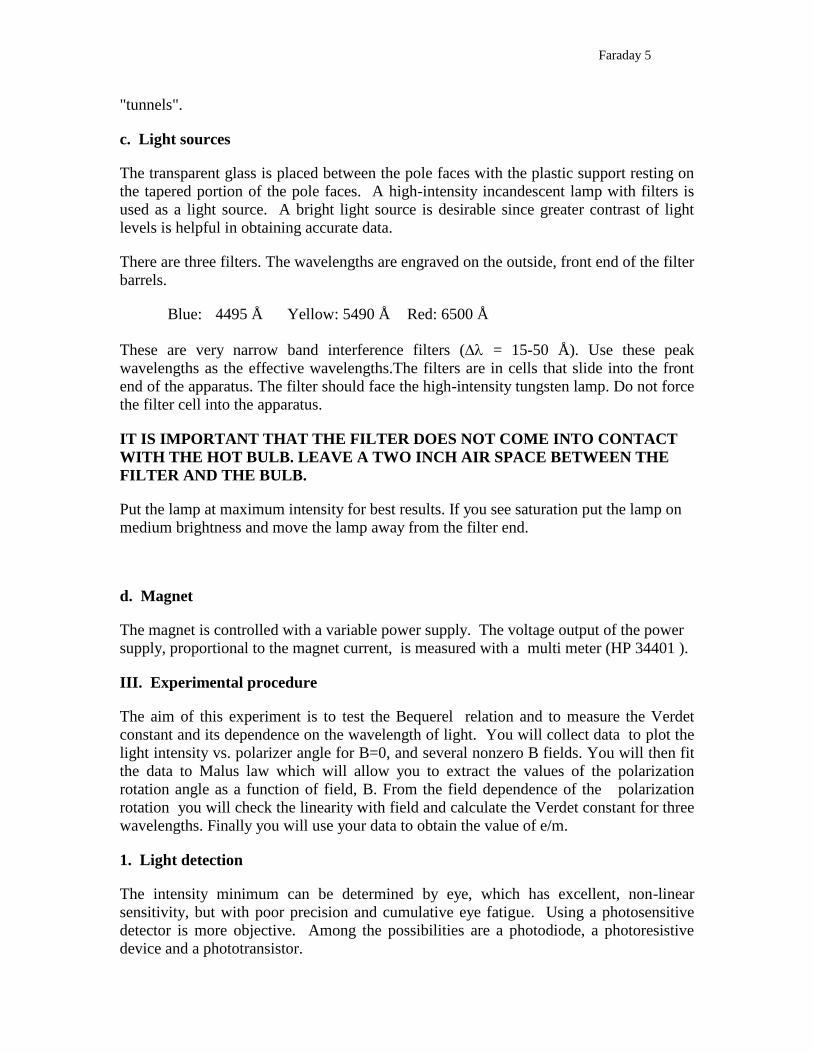
the measurement. Test and application of Malus law is shown below for data taken with
an unfiltered mercury discharge source. The fit was done with Kaleidograph. Note the
zero offset.
Faraday 7
4
6
8
10
12
14
16
18
250 300 350 400 450 500 550
de
tecto
r outp
ut, m
V D
C
analyzer setting , degrees
y = m1+m2*cos(m0-m3)*cos(m0-...
ErrorValue
0.00445895.3848m1
0.008566711.495m2
0.021148403.29m3
NA15832Chisq
NA0.99563R
Non-linear weighted least square fit of the data to Malus law. Note that the two
"crossed" positions of the analyzer (minima) are 180 degrees apart, as expected.
The constant background (m1 parameter) can be understood as resulting from incomplete
polarization and analysis.
The Malus curve at zero field can be used to extract the Faraday rotation angle as a
function of field. After the zero field measurement and without moving any part of the
apparatus the field is gradually ramped up through a set of desired values. At every field,
you will measure the detector voltage versus magnet power supply voltage V. You will
then use the hysteresis curve B(V) which is obtained by measuring the field with a Hall
probe gaussmeter..
2. Data acquisition
Source and detector familiarization. With the Si photovoltaic detector quickly find and
record at zero magnet current approximate maximum and minimum detector meter
readings for each filter. The silicon response improves rapidly at shorter wavelengths.
Are these detector and the polaroid materials suitable for all of the wavelengths of the
filters?
Law of Malus verification Take detector current readings at zero magnet current every
~10 degrees over a range of ≥ 360 degrees to test the Law of Malus (cos2 intensity
behavior). Estimate an average detector current error from observed meter fluctuations.
Plot detector current vs. analyzer angle, and use your favorite fitting program (Origin
Faraday 8
or matlab etc.) to fit the data to the form )(cos* 3
2
21 mmm corresponding to the
Malus formula. The fitting parameters 1m , 2m and and 3m correspond respectively to the
minimum detector current value, the amplitude of the detector current variation and the
angle between polarizer and analyzer at the minimum of detector current (remember to
use the same units in the simulation as in the measurement, ie degrees, not radians).
Include in your report the plot and the fit equation showing fit parameters and minimum
chi square value. You will note that the quality of fits improves considerably if you limit
the range of fitting angles to bracket a minimum or a maximum.
Shifts of the entire curve with magnetic field are the desired data. This shift is measured
by the parameter m3. The polarizer setting must not be changed during a sequence of
measurements.
Magnet calibration. Measure the magnetic field with the gaussmeter, removing the
sample and orienting the plane of the probe perpendicular to the field for maximum
reading. Handle the gaussmeter with care. Note 10x gain.
Establish a reproducible hysteresis loop for both positive and negative magnet supply
voltages. Follow the procedure described below.
WARNING : Be certain that the power supply is zeroed and turned off before
disconnecting the magnet in order to reverse current leads. Failure to observe this
precaution may result in personal injury or damage to the equipment.
Hysteresis loop. Turn on the magnet power supply (be sure to set the output to zero!).
Turn on the gaussmeter and calibrate it, following the instructions on top of the
instrument
Remove any residual magnetism in the magnet ("degauss") as follows: Raise the voltage
in the magnet power supply to the maximum value you expect to use ~ +50 V and then
back to zero, switch off the power supply and reverse polarity; raise voltage to -40 V and
back to zero, switch off and reverse polarity; raise to +30 amperes and back to zero,
switch off and reverse polarity, etc.( -20, +10, -5,0).
Hereafter you will maintain a definite magnetic hysteresis curve by always increasing the
voltage up to 50V in the same sense, and by always decreasing it back down to zero
before raising it again. Turn voltage down to zero before switching off-do not switch off
with current flowing in the magnet. This is good practice with any magnetic circuit, to
avoid inductively generated high voltages and possible arcing.
Now calibrate your magnet by following by recording B(V) for a few voltages on the up
branch (0 u to +50 V) and then same voltages on the down branch (+50, 0, -50) and then
back to B=0. If you maintain the same hysteresis curve the B(I) calibration will remain
valid throughout the experiment and you will no longer need to use the Hall probe
Take Faraday data as described below on a single branch of the magnet hysteresis curve
(+ going or - going). Always maintain the same hysteresis curve as for your calibration
Faraday 9
(same current maximum and minimum).
Then measure B(V) and plot the curve of transmission minimum angle shift vs. B for
increasing and decreasing B (positive and negative currents). Alternatively, with the
analyzer fixed at the angle of maximum sensitivity (45 degrees from zero field
transmission minimum), measure detector voltage vs magnet current voltage for + and -
currents; then convert to angle shift as a function of field using a previously determined
Malus curve. Recheck to verify intensity stability.
Rotation of polarization. The data collection procedure described should be repeated
for all samples, for all three filters and for at least 3 field values in addition to zero field.
1. Set the field current (run both + and - to double the data range) and then record the
angle for minimum transmission measured by eye.
2. Now switch to using the photodetector and Malus law. Measure the detector voltage
vs. analyzer angle readings at intervals in the selected region, without attempting to
observe the exact minimum; then find the minimum (or maximum) by least square
fitting the data. Voltage readings every 10 degrees in a range of about ± 45 degrees
around a min (or max) will provide a good determination, if the data is smooth. If
you take data around a minimum, you may fit to the form
m1-m2*cos(m0-m3)*cos(m0-m3); m1=?; m2=; m3=?
(input initial parameters by inspection of the response curve). Here you would input
m3 = approximate observed minimum angle. You could equally well fit to m1-
m2*cos(m0-m3)*cos(m0-m3); m1=?; m2=; m3=? . Then your starting m3 would be
approximately that of an adjacent maximum. Both best fits (same data set) will be the
same, except for a difference of exactly 90 degrees in final m3, so the minimum angle
can easily be recovered from a fit to the latter form of Malus law.
3. An alternative method to using the photodetector and Malus law described in 2.
Establish the Malus curve at zero field. Set the analyzer to the minimum angle. Sweep the
field through a set of values and observe the change in transmitted intensity with field.
Using the Malus curve and magnet calibration extract the Farady rotation angle as a
function of field. Compare your results to those obtained in 1 and 2.
IV. Analysis
1. Verdet constant
Tabulate your rotational shifts vs. magnetic field (include the tables in an appendix). For
all your data plot the rotation shift versus B. Use a least square linear fit to obtain the
Verdet constant and the error for all samples and for each wavelength. Include the plot
and equation in your report.
Compare the results obtained with each one of the 3 methods and comment on their
accuracy. Compare the measured Verdet constant to accepted values.
Faraday 10
(use consistent (mks and radian) units when combining experimental values of V with
theory to obtain e
m .)
2. Comparison of Faraday inferred dispersion with Cauchy formula prediction
If sample dispersion data is available (check appendix 5 ), fit to an inverse even power
series (n = A + B/2 does fairly well) and differentiate to obtain
dn/ddispersion= -2B/3 at your wavelength. From the measured value of V and using
accepted values for e/m and c calculate d
dnVerdet . Make a table with the values of V,
d
dnVerdet and dn/ddispersion . Compare
d
dnVerdet to dn/ddispersion. and comment on
the differences.
If corresponding values of V and the dn/ddispersion can be obtained at several
wavelengths or for several samples, a linear fit to a plot of 2 V /(/c) vs. dn/ddispersion
permits an experimental determination of e/m. Discuss your result.
Report:
Include a theoretical background, description of procedure, the data presented in
graphic format whenever possible, analysis and discussion of results. Raw data should be
presented in the appendix. In discussion section, space permitting, you may also include
other relevant topics such as: the physical (microscopic) origin of the Faraday rotation;
why does the classical treatment work for the Faraday rotation (why don’t we need
Planck’s constant to explain the phenomenon), an explanation of the physical origin of
hysteresis in magnets.
References
1. E. Hecht: Optics, 2nd. Ed, 1987, Addison-Wesley. Pages 316-318, a qualitative
discussion of the effect and practical applications of the Faraday effect to control
of laser beam modulation and quantitative analysis of materials, 309-314, optical
activity, 56-68, absorption and dispersion of light in matter
2. G. R. Fowles: Introduction to Modern Optics, 2nd Ed., Holt, Rhinehart, Winston,
1975; pp. 189-192 ( analytic discussion), pp. 185-189 (optical activity)
3. Born and Wolf: Principles of Optics, PP 91-98. Relates dispersion (frequency
variation of index of refraction) to absorption resonances of the material, giving a
theoretical basis for the Cauchy dispersion formula.
4. D. W. Preston and E.R. Dietz: The Art of Experimental Physics, Experiment 22-
Faraday 11
The Faraday Effect, pp. 355-366.
5. Jenkins and White: Fundamentals of Optics. The Faraday effect from an
experimental viewpoint (pp. 596-598). Dispersion: theory and experiment (pp.
464-469).
6. Faraday, Kerr, and Zeeman: The Effects of a Magnetic Field on Radiations, E. P.
Lewis-Editor. A description of the Faraday effect by its discoverer.
7. Monk: Light: Principles and Experiment, 1937, p. 444.
8. Rossi: Optics, Chapter 8, especially sections 1, 3 4, 14 and 15. Uses oscillating
point-charge model to compute the polarization vector for an isotropic medium.
(Unfortunately missing from the Physics Library, and out of print.)
9. V. A. Avetisov, V. I. Goldanskii and V.V. Kuz'min: Handedness, Origin of Life
and Evolution, Physics Today, v44 #1, July 1991. Fundamental origin of optical
activity in self-replicating chiral biological polymers. Not related to the Faraday
effect, but involving rotation of the plane of polarization of transmitted light by
intrinsic medium structure, rather than by an externally applied influence.
10. Amino Acids in Both Moon and Meteorite: Physics Today, February 1971, p17.
Details the finding of both right and left-handed optically active amino acids, in
contrast to the overwhelming dominance of left-handed forms in terrestrial living
organisms.
11. Silicon Photodiodes and Their Selection: Photonics Design and Applications
Handbook, Book 3, 39th International Edition, 1993 (Laurin Publishing Co. Inc.,
Berkshire Common, PO Box 4949, Pittsfield MA 01202-4949)
12. The Photonics Dictionary, Photonics Design and Applications Handbook, Book
4, 1993
13. Hewlitt-Packard HP 34401-90012 Multimeter Service Guide, June 1992, Edition
3
14. R. A. Serway: Physics for Scientist and Engineers, with Modern Physics volume
II, updated version; 3rd edition, 1990 (Saunders, HBJ)
15. L. Spitzer: Physical Processes in the Interstellar Medium, Wiley, 1978
16. L. Spitzer: Diffuse Matter in Space, 1968
17. K.-T. Kim, P.P. Kronberg, P.E. Dewdney and T. L. Landecker, The Halo and
Magnetic Field of the Coma Cluster of Galaxies, Ap. J. 355, 29, 87-D1 (1990)
Faraday 12
Appendix 1. Optical rotation and circular birefringence
1. Decomposition of plane-polarized light into coherent, counter-rotating,
circularly polarized components
Optical rotation can be thought of in terms of circular birefringence. By the latter
is meant that the propagation velocity, or the refractive index, is different for right
and left circular polarized light. For ordinary or "linear" birefringence there is a
difference of the refractive indices for two plane polarized components of light
which are normal to each other. To show that optical rotation is equivalent to
circular double refraction, we note that a plane polarized beam can always be
considered as the coherent superposition of two coherent circularly polarized
components of the same frequency and of equal amplitude. For instance, a
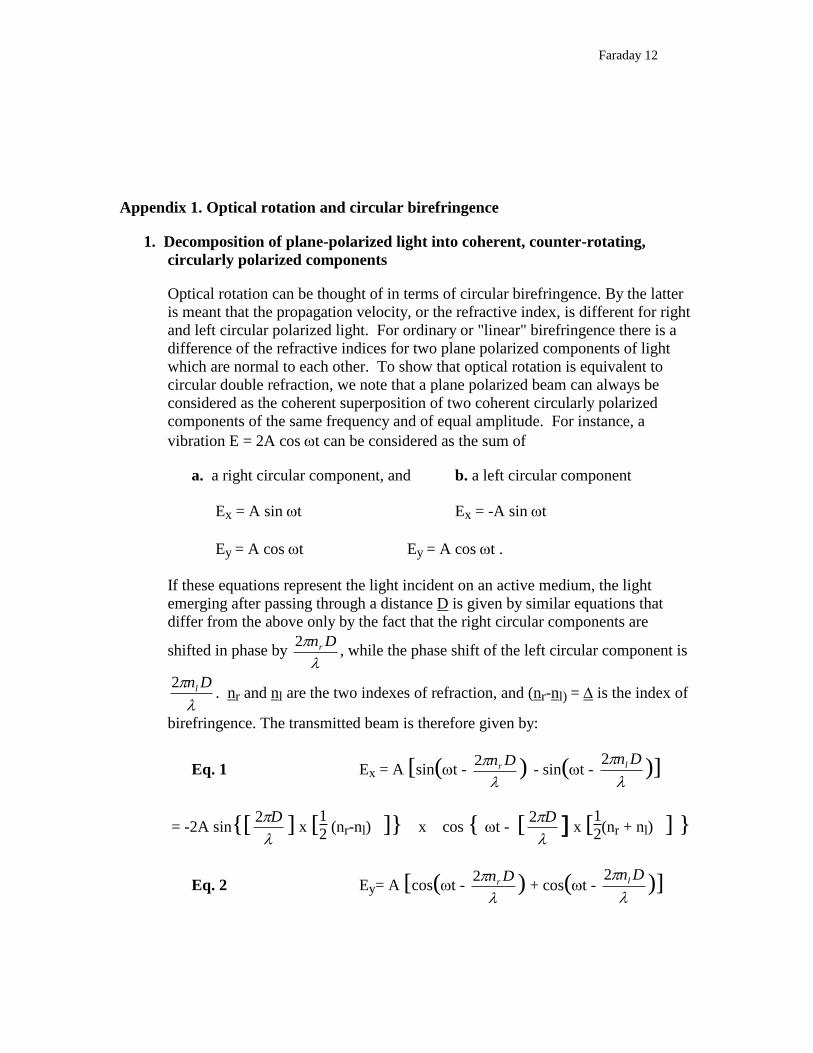
vibration E = 2A cos t can be considered as the sum of
a. a right circular component, and b. a left circular component
Ex = A sin t Ex = -A sin t
Ey = A cos t Ey = A cos t .
If these equations represent the light incident on an active medium, the light
emerging after passing through a distance D is given by similar equations that
differ from the above only by the fact that the right circular components are
shifted in phase by
Dnr2, while the phase shift of the left circular component is
Dnl2. nr and nl are the two indexes of refraction, and (nr-nl) = is the index of
birefringence. The transmitted beam is therefore given by:
Eq. 1 Ex = A [sin(t -
Dnr2 ) - sin(t -
Dnl2 )]
= -2A sin{[
D2 ] x [1
2 (nr-nl) ]} x cos { t - [
D2 x [1
2(nr + nl) ] }
Eq. 2 Ey= A [cos(t -
Dnr2 ) + cos(t -
Dnl2 )]
Faraday 13
= 2A cos{[
D2 ] x [ 1
2(nr-nl) ]} x cos { t - [
D2 ]x [1
2(nr + nl) ] }
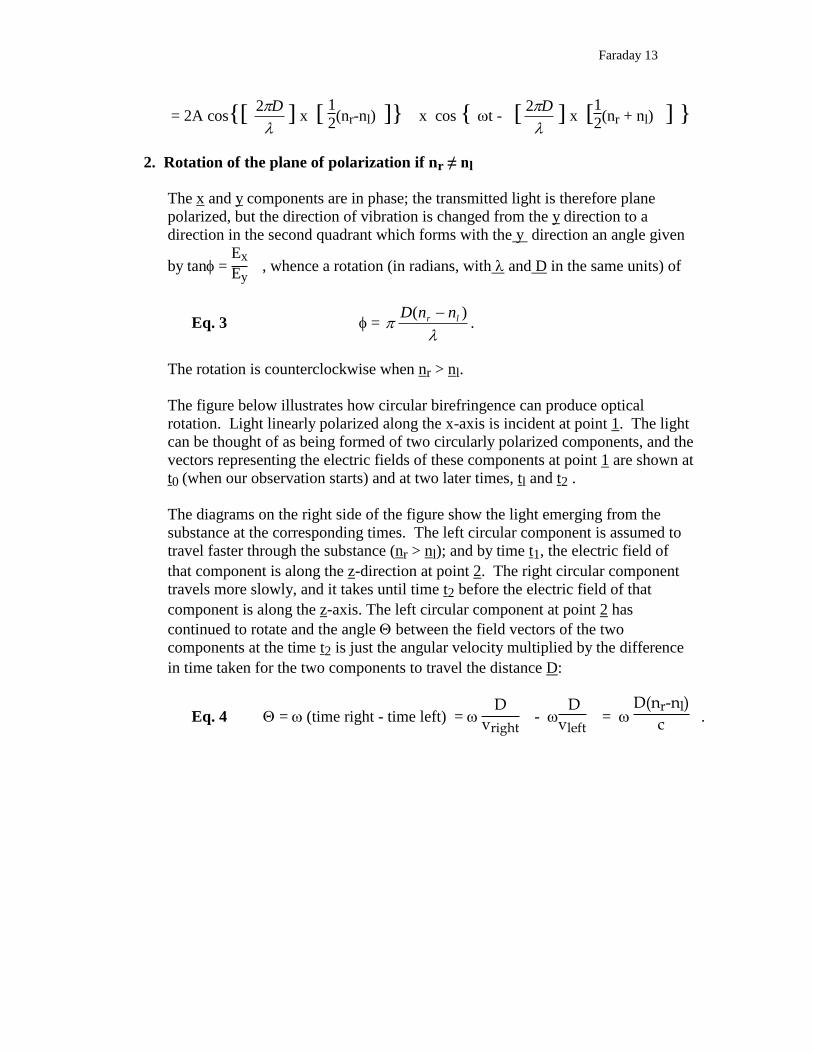
2. Rotation of the plane of polarization if nr ≠ nl
The x and y components are in phase; the transmitted light is therefore plane
polarized, but the direction of vibration is changed from the y direction to a
direction in the second quadrant which forms with the y direction an angle given
by tan= Ex
Ey , whence a rotation (in radians, with and D in the same units) of
Eq. 3 =
)( lr nnD
.
The rotation is counterclockwise when nr > nl.
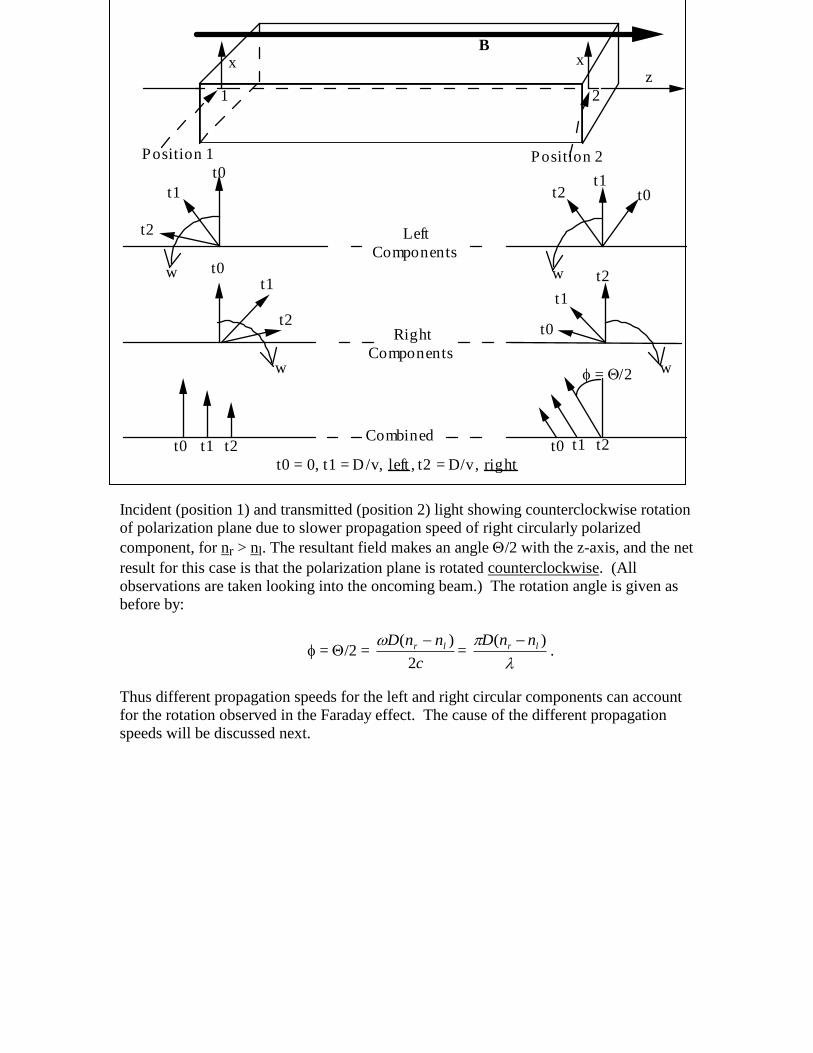
The figure below illustrates how circular birefringence can produce optical
rotation. Light linearly polarized along the x-axis is incident at point 1. The light
can be thought of as being formed of two circularly polarized components, and the
vectors representing the electric fields of these components at point 1 are shown at
t0 (when our observation starts) and at two later times, tl and t2 .
The diagrams on the right side of the figure show the light emerging from the
substance at the corresponding times. The left circular component is assumed to
travel faster through the substance (nr > nl); and by time t1, the electric field of
that component is along the z-direction at point 2. The right circular component
travels more slowly, and it takes until time t2 before the electric field of that
component is along the z-axis. The left circular component at point 2 has
continued to rotate and the angle between the field vectors of the two
components at the time t2 is just the angular velocity multiplied by the difference
in time taken for the two components to travel the distance D:
Eq. 4 = (time right - time left) = D
vright -
Dvleft
= D(nr-nl)
c .
Faraday 14
Incident (position 1) and transmitted (position 2) light showing counterclockwise rotation
of polarization plane due to slower propagation speed of right circularly polarized
component, for nr > nl. The resultant field makes an angle /2 with the z-axis, and the net
result for this case is that the polarization plane is rotated counterclockwise. (All
observations are taken looking into the oncoming beam.) The rotation angle is given as
before by:
= /2 = c
nnD lr
2
)( =
)( lr nnD .
Thus different propagation speeds for the left and right circular components can account
for the rotation observed in the Faraday effect. The cause of the different propagation
speeds will be discussed next.
1 2
Left
Components
Right
Components
Combined
t0 = 0, t1 = D/v, left , t2 = D/v, right
Position 1 Position 2
x x
t0
t1
t2
t2t1
t0
t0t1
t2t0
t1
t2
t0 t1 t2 t2t1t0
Incident (position 1) and transmitted (position 2) light showing
counterclockwise rotation of polarization plane due to slower propagation
speed of right circularly polarized component, for n,right 2xn,left.
= /2 = [ D/(2c)]x[n,right - n,left]
w w
w w= /2
z
B

Faraday 15
Appendix 2. Classical model for light propagation in a medium
1. Spring-mass model of forced electron oscillation
A convenient model for explaining the propagation of light in a substance involves the
absorption and re-radiation (delayed and re-directed) of the incoming light by electrons of
the medium. The details of this model give an explanation for the absorption, scattering,
and index of refraction of the medium.
In a classical model, when electrons are disturbed from their equilibrium orbits, they
behave as if they were bound by a linear, radial restoring force, and they exhibit the
familiar mass-spring damped resonance phenomenon. The absorption and phase shift
characteristics of a linear oscillator are shown below.
The phase shift curve provides an explanation for the reduced speed of light in a medium.
It corresponds to a delay in re-radiation of the light. The re-radiated light combines
coherently with the incoming beam, which is further absorbed and re-radiated deeper in
the medium. The net effect is a lower propagation speed. The change in the index of
refraction with frequency (dispersion) can be explained by the change in phase shift with
frequency.
A more quantitative relationship between the refractive index and phase shift is discussed
in Rossi, Section 8-4. Briefly, the velocity of light depends upon
1
em
where the dependence upon (and hence the relationship between the D and E vectors)
results from the displacement current contribution to B. If we consider the electrons of
the material to have very little damping, the phase relation between E and the electron
motion (displacement) will shift by almost 180° as the driving (light) frequency passes
through resonance. Whereas at lower frequencies the polarization of the atoms reduces
the electric field D in the medium, at frequencies above the resonance (unsplit, no
magnetic field) the phase of the electron motion is reversed, which tends to increase the
electric field. SinceD = E = 0E + P, becomes less than 0, and the index of
refraction is less than 1 above the resonance. (This implies that v > c, the relativistic
limiting velocity for causal information. However, as is shown in many texts, the phase
velocity (which we are discussing) can exceed c, but not the group or signal velocity.)

Faraday 16
13 012 011 010 090800
1
2
omega
am
pli
tud
e
13 012 011 010 09080-200
-100
0
omega
ph
ase
- d
egre
es
13 012 011 010 090800.6
0.8
1.0
1.2
1.4
omega
ind
ex o
f
refr
act
ion
Also, recalling that the influence of the medium should diminish as the driving
frequency moves away from resonance, we get a qualitative explanation for the
Faraday 17
curves shown previously (amplitude, phase relation and index of refraction) for an
oscillator without an external magnetic field.
2. Analysis of forced, sinusoidal electron oscillations about equilibrium
a. Unsplit resonance at 0, with B = 0. [nl = nr ( --> vl = vr)]
The equations governing the motion of the electron are:
Eq. 5 mr = -m2r + eE or, with K=2m,
mx = - eE cos(t) - Kx
my = - eE sin(t) - Ky .
The resonance occurs for either of = + K/m = + 0 , so at this point (no
magnetic field) both right and left circular components are affected in the
same way. The introduction of an external magnetic field along the direction
of propagation of the light removes this symmetry and leads to the following
classical explanation of the Faraday effect.
b. Split "left" and "right" resonances when B ≠ 0; the Larmor frequency
shift + L from 0. [nl ≠ nr ( --> vl ≠ vr)]
Refraction is the result of the interaction of the light with the electrons.
Considering a right circular beam passing through a diamagnetic medium in
the direction of an externally applied magnetic field B (z axis), the equations
of motion of the electrons now become:
Eq. 6 mr = - m2 r + eE + e
c (r x B) ===>
mx = - eE cos(t) - Kx - e
c By
my = - eE sin(t) - Ky + e
c Bx .
Disregarding, momentarily, the incoming electric field, it is easy to show that
there are solutions corresponding to circular motion of the electrons with
angular frequency
Eq. 7 L = eB
(2m) = 2L,
where L is called the "Larmor" frequency.

Faraday 18
For an observer looking into the beam, the light vector rotates clockwise, and
the electronic structure rotates counterclockwise (negative charge) with the
Larmor frequency, relative to the circularly polarized light. If is the
frequency of light it is apparent that, to the rotating electrons, the light vector
appears to be rotating at a higher frequency + L and it will act accordingly;
that is the refractive index for this light will have the same value as the
unmagnetized medium has for light of frequency + L. Hence
Eq. 8 nr() = n(+L)
where n is the refractive index as ordinarily measured without magnetic field.
In a similar way left circular light passing in the same direction as B appears
to the atoms to have a lower frequency and hence
Eq. 9 nl() = n(-L) .
Since L for visible light is much smaller than , we can write
Eq. 10 n(0 + L) = n() + d
dnL and, since
=
c and
d
dnc
d
d
2 =
2
c
d
dn =
d
dn
c
2
we obtain
(nr-nl)= 2 d
dnL and, with L =
2
1L = )(
22
10n
m
eB
Eq. 11 (nr - nl) = m
eB
d
dn
c
4
2 2
where d
dnis evaluated at frequency 0.
Finally, the optical rotation per unit length is
Eq. 12 f
D = -
d
dn
cm
e
2
1B .
This is called Becquerel's equation. The quantity V = /(DB)= -
d
dn
cm
e
2
1 is
called the Verdet constant of the material. It is usually given in degrees of
rotation per gauss, per centimeter of light path. (Note that the unit degree,
although dimensionless, nevertheless involves mixed units of length. Angular
measure is defined as the ratio of arc length to radius length; with both in the
same units, the angular unit is the radian. When using degrees, the arc length
Faraday 19
unit is [360/(2)] times that of the radius. In comparing experiment and
theory, it is best to convert the Verdet constant to radians, rather than degrees.)
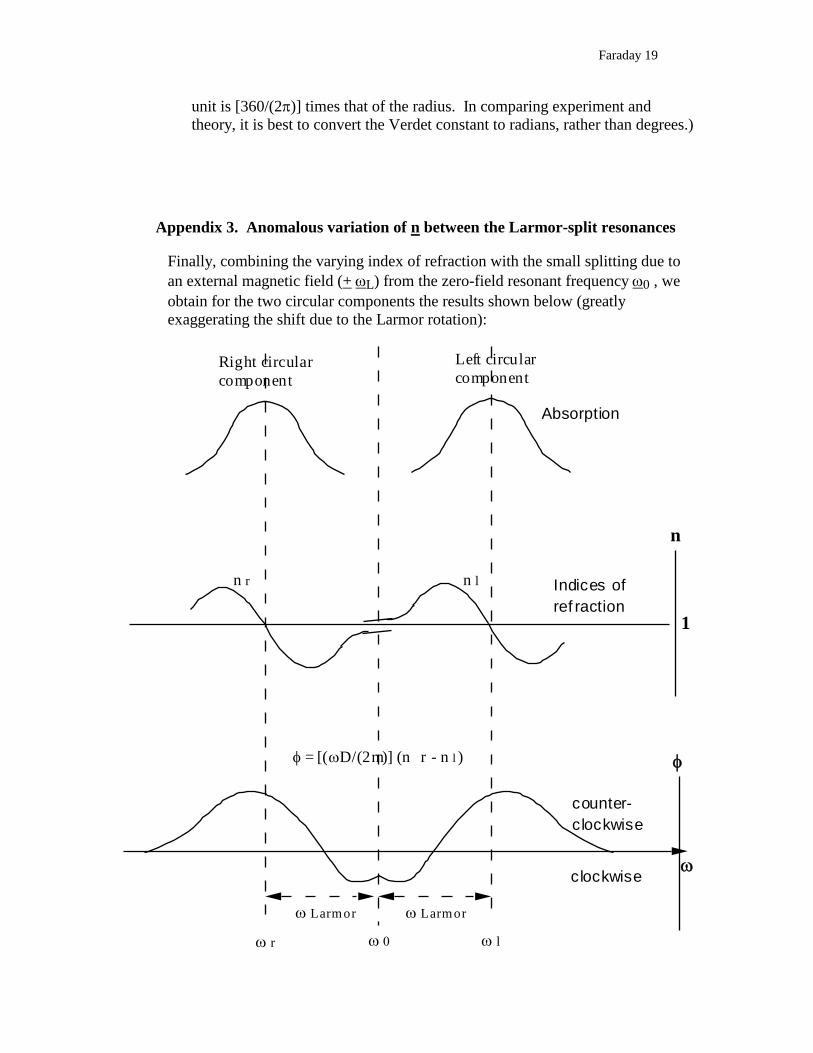
Appendix 3. Anomalous variation of n between the Larmor-split resonances
Finally, combining the varying index of refraction with the small splitting due to
an external magnetic field (+ L) from the zero-field resonant frequency 0 , we
obtain for the two circular components the results shown below (greatly
exaggerating the shift due to the Larmor rotation):
Absorption
Indices of
ref raction
counter-
clockwise
clockwise
= [(D/(2m)] (n r - n l )
r l
Larmor Larmor
1
n
Right circular
component
Left circular
component
n r n l
Faraday 20
showing anomalous dispersion (n < 1), and the origin of the rotation angle vs.
in the region of the split resonances. Of course, our data is taken far from these
classical spring-mass ultraviolet electron resonances (at lower ), where nr > nl,
as discussed previously.
This model describes the normal, diamagnetic Faraday effect quite well. Paramagnetic
and ferromagnetic substances also exhibit a Faraday effect. The present experiment,
however, involves measurement of the Faraday rotation for a diamagnetic substance.
Appendix 4. Why does the classical picture work?
Since we know that the spring-mass classical picture of electron binding to a positively
charged nucleus leads to prediction of an atom unstable to radiative energy loss, an
interesting question is: Why does the classical picture above work so well? Another is:
Why are the important, governing resonances in the ultraviolet?
As to the first question, all we need are strong and heavily damped (broad)
absorption resonances. Quantized excitation energies provide them. For the
second question, we must conclude that atomic and solid state quantum level
structures are such that resonances with the required properties lie in the
ultraviolet. This involves such fundamental quantities as the strength of the
Coulomb force, the mass of the electron, the stability of nuclei, the Pauli principle
(quantum statistics of the electron), etc.
Appendix 5. Dominant effect of ultraviolet resonances on normal dispersion in the
visible. Cauchy formula for n().
The dispersion, dn/d, is also a function of . For most glasses, the behavior of n is
dominated by "distant" scattering , strongly absorptive (therefore broad) ultraviolet
resonances. An exception is the Kigre glass sample used in this experiment, for which
erbium doping produces infrared absorption dominance in the visible variation of n. The
sign of the Verdet constant is thus different for the flint and Kigre glasses.
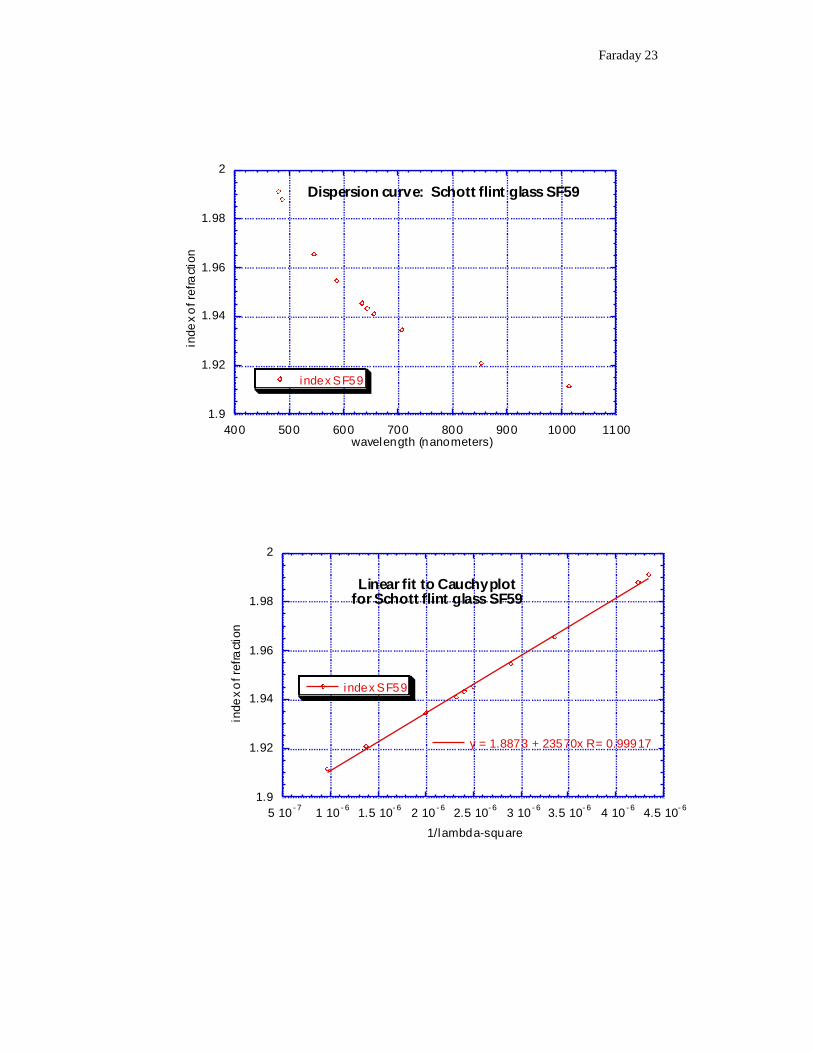
The first successful attempt to represent the curve of normal dispersion was made by
Cauchy in 1836 using the form
Eq. 13 n = A + B/2 + C/4 ,
where A, B, and C are constants characteristic of any one substance (B ≠ magnetic field
here, of course). Very often it is sufficient to keep the first two terms only. Then
Eq. 14 n = A + B/2 and dn/d = -2B/3
The table below gives the index of refraction n vs. wavelength for various materials, in
the visible range from 400 to 750 nanometers. A quadratic fit in

Faraday 21
1
l2 (using KaleidaGraph on a Macintosh, for example) will yield the Cauchy parameters
for n vs. . dn/dcan then be determined by differentiation of this analytic fit formula.
Around 200 nm, n curves sharply upward, indicating the distant absorption and scattering
resonances which cut off transmission in the ultraviolet.
In specifying glass the manufacturer usually gives nD (the index for the yellow sodium D
lines) and also the value of (nD-1)/(nF-nC), the indices for several other lines of common
sources, and the differences between these and a number of other lines. Detailed
information concerning many glasses can be found in the International Critical Tables.
The table below is from Monk. The numerical part can be copied and pasted directly into
a KaleidaGraph data file.
Å) Light
Crown
Dense
crown
Light
Flint
Dense
Flint
Heavy
Flint
Fused
Quartz
Fluorite
4000 1.5238 1.5854 1.5932 1.6912 1.8059 1.4699 1.4421
4600 1.5180 1.5801 1.5853 1.6771 1.7843 1.4655 1.4390
5000 1.5139 1.5751 1.5796 1.6770 1.7706 1.4624 1.4366
5600 1.5108 1.5732 1.5757 1.6951 1.7611 1.4599 1.4350
6000 1.5085 1.5679 1.5728 I.6542 1.7539 1.4581 1.4336
6500 1.5067 1.5651 1.5703 I.6503 1.7485 1.4566 1.4324
7000 1.5051 1.5640 1.5684 1.6473 1.7435 1.4553 1.4318
7500 1.5040 1.5625 1.5668 1.6450 1.7389 1.4542 1.4311
It is also interesting to analyze the Faraday rotation effects in terms of the phase shifts
encountered by the light beam as it traverses the substance. If the incoming light has a
frequency below both resonance frequencies (0 + L), it is clear that the phase shift will
be greater for the right circular component (dn
dl negative). Thus its propagation speed
will be lower, and a situation as illustrated will result.

Faraday 22
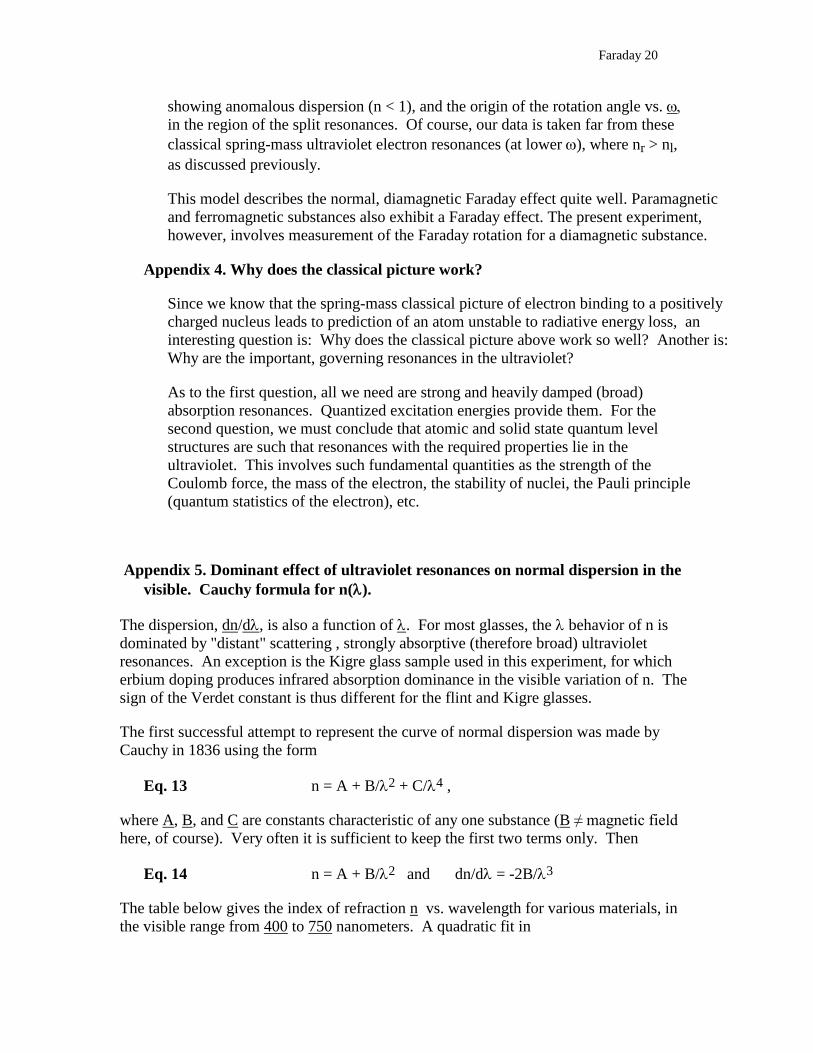
Manufacturers data (Schott Glass technologies, Inc.) for the flint glass sample (type SF59,
melt #703495/I, order #Q346376, international code 953204, Lk #23908, Schott Ref.
#D6502, 20 mm diameter x 10 mm thick) includes the following indices of refraction:
line (nm) 1/2 1e7 x 1/2 index n
nt 1014.0 9.7258e-07 9.7258 1.9117
ns 852.10 1.3773e-06 13.773 1.9206
nr 706.50 2.0034e-06 20.034 1.9342
nC 656.30 2.3216e-06 23.216 1.9412
nC' 643.80 2.4127e-06 24.127 1.9433
n 632.80 2.4973e-06 24.973 1.9452
nd 587.60 2.8963e-06 28.963 1.9545
ne 546.10 3.3532e-06 33.532 1.9654
nF 486.10 4.2320e-06 42.320 1.9880
nF' 480.00 4.3403e-06 43.403 1.9909
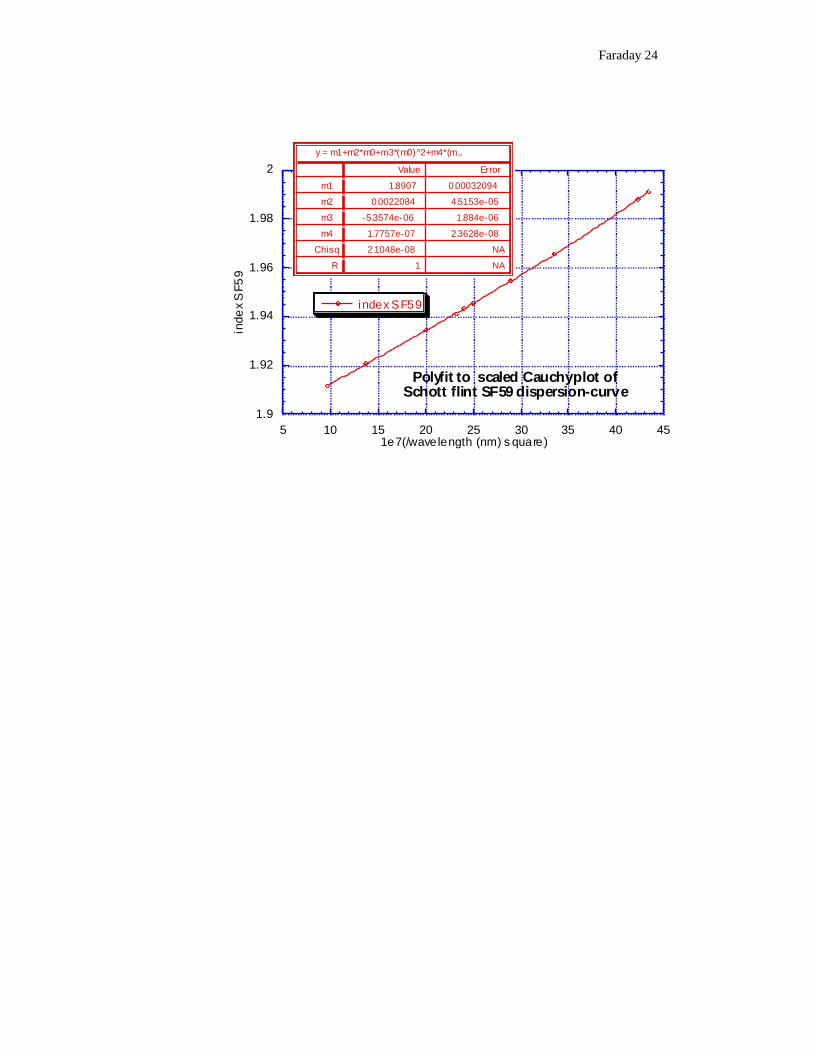
Plots and fits to this data are shown below.
Faraday 23
1.9
1.92
1.94
1.96
1.98
2
400 500 600 700 800 900 1000 1100
Dispersion curve: Schott flint glass SF59
index SF59
inde
x o
f re
fra
ctio
n
wavelength (nanometers)
1.9
1.92
1.94
1.96
1.98
2
5 10- 7
1 10- 6
1.5 10- 6
2 10- 6
2.5 10- 6
3 10- 6
3.5 10- 6
4 10- 6
4.5 10- 6
Linear fit to Cauchy plotfor Schott flint glass SF59
index SF59
y = 1.8873 + 23570x R= 0.99917
inde
x o
f re
fra
ctio
n
1/lambda-square
Faraday 24
1.9
1.92
1.94
1.96
1.98
2
5 10 15 20 25 30 35 40 45
Polyfit to scaled Cauchy plot ofSchott flint SF59 dispersion-curve
index SF59
inde
x S
F5
9
1e7(/wavelength (nm) s quare)
y = m1+m2*m0+m3*(m0)^2+m4*(m...
ErrorValue
0.000320941.8907m1
4.5153e-050.0022084m2
1.884e-06-5.3574e-06m3
2.3628e-081.7757e-07m4
NA2.1048e-08Chisq
NA1R