Embed Size (px)
Citation preview

June 1, 2016 | NADCP
Phil Breitenbucher, MSWShannon Carey, PhD
The Family Drug Court Movement: Reaching the Tipping Point from Innovation to Institutionalization
Strengthening Partnerships
Improving Family
OutcomesFamily Drug Courts

Acknowledgement
Improving Family
OutcomesStrengthening Partnerships
This presentation is supported by:
The Office of Juvenile Justice and Delinquency Prevention Office of Justice
Programs(2013-DC-BX-K002)
Points of view or opinions expressed in this presentation are those of thepresenter(s) and do not necessarily represent the official position orpolicies of OJJDP or the U.S. Department of Justice.

• Explore the FDC Movement, from inception to expansion, and the improved recovery, safety, and permanency outcomes it has achieved for children and families
• Highlight lessons learned from key initiatives that raised the level of FDC practice and policy
• Equip and challenge FDC practitioners with the practice and policy skills, leadership, and renewed commitment to achieve lasting systems change
Learning ObjectivesImproving
Family Outcomes
Strengthening Partnerships
Three Discussion Activities to Focus on Skills-Building

8,300,000 children
* 2002 – 2007 SAMHSA National Survey on Drug Use and Health (NSDUH)

How many children in the child welfare system have a parent in need of treatment?
Statement of the Problem
• Between 60–80% of substantiated child abuse and neglect cases involve substance use by a custodial parent or guardian (Young, et al, 2007)
• 61% of infants, 41% of older children who are in out-of-home care (Wulczyn, Ernst and Fisher, 2011)
• 87% of families in foster care with one parent in need; 67% with two (Smith, Johnson, Pears, Fisher, DeGarmo, 2007)

Source: AFCARS Data, 1999 to 2014
Parental AOD as a Reason for Removal in the United States, 1999-2014
15.8%18.5% 19.6%
21.6% 22.7% 23.4%24.9%
26.1% 26.3% 25.8% 26.1%28.4% 29.3%
30.5% 31.0% 31.8%
0%
5%
10%
15%
20%
25%
30%
35%
1999 2000 2001 2002 2003 2004 2005 2006 2007 2008 2009 2010 2011 2012 2013 2014

0.0%
10.0%
20.0%
30.0%
40.0%
50.0%
60.0%
70.0%
Alab
ama
Alas
kaAr
izona
Arka
nsas
Calif
orni
aCo
lora
doCo
nnec
ticut
Dela
war
eDi
stric
t of C
olum
bia
Flor
ida
Geor
gia
Haw
aii
Idah
oIll
inoi
sIn
dian
aIo
wa
Kans
asKe
ntuc
kyLo
uisia
naM
aine
Mar
ylan
dM
assa
chus
etts
Mic
higa
nM
inne
sota
Miss
issip
piM
issou
riM
onta
naN
ebra
ska
Nev
ada
New
Ham
pshi
reN
ew Je
rsey
New
Mex
ico
New
Yor
kN
orth
Car
olin
aN
orth
Dak
ota
Ohi
oO
klah
oma
Ore
gon
Penn
sylv
ania
Rhod
e Is
land
Sout
h Ca
rolin
aSo
uth
Dako
taTe
nnes
see
Texa
sU
tah
Verm
ont
Virg
inia
Was
hing
ton
Wes
t Virg
inia
Wisc
onsin
Wyo
min
gPu
erto
Ric
o US
Parental AOD as Reason for Removal, 2014
Source: AFCARS Data, 2014
National Average: 31.8%

404,878
398,057397,153
400,989
415,129
390,000
395,000
400,000
405,000
410,000
415,000
420,000
2010 2011 2012 2013 2014
Num
ber o
f Chi
ldre
nNumber of Children in Out-of-Home
Care, 2010-2014
Source: AFCARS Reports, 2011-2014. Retrieved from http://www.acf.hhs.gov/programs/cb/research-data-technology/statistics-research/afcars

ASFA Time Clock
The Adoption and Safe Families Act
(PL 105-89)

Family Drug Courts
Responding to the need for practice and policy solutions addressing the Adoption and SafeFamilies Act (ASFA) timelines using collaborative courts to strengthen families

First Family Drug Courts Emerge – Leadership of Judges Parnham & McGee
Six Common Ingredients Identified
Grant Funding – OJJDP, SAMHSA, CB
Practice Improvements – Children Services, Trauma, Evidence-Based Programs
Systems Change Initiatives
Institutionalization, Infusion, Sustainability
1994
2002
2007
2004
Nex
t
2014
FDC Movement
10 Key Components and Adult Drug Court model

10 40
153
322360 340
1999 2001 2005 2010 2013 2015
FDC Movement
Since 2009, has provided
TA and learned from
over 300 FDC programs

Important Practices of FDCs•System of identifying families
• Timely access to assessment and treatment services• Increased management of recovery services and compliance
with treatment
• Systematic response for participants – contingency management• Increased judicial oversight
Sources: 2002 Process Evaluation and Findings from 2015 CAM Evaluation
• Collaborative non-adversarial approach grounded in efficient communication across service systems and court
• Improved family-centered services and parent-child relationships
7

How are they identified and
assessed?
How are they supported and
served?
How are cases and outcomes
monitored?
Important Practices of FDCs

FDC Model
Drug Court Hearings
TherapeuticJurisprudence
Enhanced Family-Based
Services
Intensive Case Management &
Recovery Support
Judicial Oversight Comprehensive Services

The Big Seven – Key Ingredients for an Effective Family Dependency Treatment Court
Check it out! Session TS-7 | Wed. June 1st, 1:15 – 2:30 pm

FDC Guidelines
http://www.cffutures.org/files/publications/FDC-Guidelines.pdfTo download a copy today visit our website:

Shared Outcomes
Client Supports
Shared Mission & Vision
Agency Collaboration
FDC Recommendations
• Interagency Partnerships
• Information Sharing
•Cross System Knowledge
• Funding & Sustainability
•Early Identification & Assessment
•Needs of Adults
•Needs of Children
•Community Support

Cross-system collaborationHow to serve children and families
= improving outcomes
Body of KnowledgeWe know a lot more now
FDC Movement
Regional Partnership
Grants
Children Affected by Methamphetamines
Prevention and Family Recovery Program
Statewide Systems Reform Program
Adult Drug Courts
Research

5Rs
Recovery
Remain at home
Reunification
Re-occurrence
Re-entry
How Collaborative Policy and Practice Improves
We know more….

National FDC OutcomesRegional Partnership Grant Program (2007 – 2012)• 53 Grantee Awardees funded by Children’s Bureau• Focused on implementation of wide array of integrated
programs and services, including 12 FDCs• 23 Performance Measures• Comparison groups associated with grantees that did implement
FDCsChildren Affected by Methamphetamine Grant (2010 – 2014)• 11 FDC Awardees funded by SAMHSA• Focused on expanded/enhanced services to children and
improve parent-child relationships• 18 Performance Indicators• Contextual Performance Information included for indicators
where state or county-level measures are similar in definition and publicly available.

0
22.0
45.5
CAM RPG FDC RPG Comparison
Access to TreatmentM
edia
n #
of d
ays t
o ad
miss
ion
Median of 0.0 days indicating that it was most common for adults to access care the same day they entered CAM services

310356
422
-25
25
75
125
175
225
275
325
375
425
475
CAM RPG FDC RPG Comparison
Days in Foster CareMedian Length of Stay (days) in Out-of-Home Care

84.9%73.1%
54.4%
0
10
20
30
40
50
60
70
80
90
CAM RPG FDC RPG Comparison
Reunification Rates within 12 MonthsP
erce
ntag
e of
Reu
nific
atio
n w
ithin
12
mon
ths

Remained in Home
91.5% 85.1%71.1%
0
10
20
30
40
50
60
70
80
90
100
CAM RPG FDC* RPG Comparison*
Percentage of children who remained at home throughout program participation
* This analysis is based on 8 RPG Grantees who implemented an FDC and submitted comparison group data
n = 1652 n = 695n = 1999

2.3%
3.4%
4.9%5.8%
0
1
2
3
4
5
6
7
CAM Children RPG Children - FDC RPG Children - No FDC RPG - 25 State ContextualSubgroup
Re-occurrence of Child MaltreatmentPercentage of children who had substantiated/indicated maltreatment within 6 months
n = 4776Total RPG Children = 22,558

5.0% 5.1%
13.1%
0.0
2.0
4.0
6.0
8.0
10.0
12.0
14.0
CAM Children RPG - Children RPG - 25 StateContextual Subgroup
Re-entries into Foster CarePercentage of Children Re-entered into Foster Care Within Twelve Months

Per Family$ 5,022 Baltimore, MD$ 5,593 Jackson County, OR$ 13,104 Marion County, OR
$ 16,340 Kansas$ 26,833 Sacramento, CA$ 9,003 Clark County, WA
Per Child
Cost Savings

Cross-system collaborationHow to serve children and families
= improving outcomes
Body of KnowledgeWe know a lot more now
FDC Movement
Recovery Support and Family-Based Services
Monitoring Cases and Outcomes
Governance & Leadership for Systems
Change
Early Screening and Assessment

How should families be identified and assessed for
FDC?1999 2016
Body of KnowledgeWe know a lot more now
FDC Movement

Who do FDC’s Work For?
Studies Show Equivalent or Better Outcomes:
• Co-occurring mental health problems
• Unemployed
• Less than a high school education
• Criminal history
• Inadequate housing
• Risk for domestic violence
• Methamphetamine, crack cocaine, or alcohol
(e.g., Boles & Young, 2011; Carey et al. 2010a, 2010b; Worcel et al., 2007)

Drug Courts That Accepted Participants With Charges in Addition to Drug Charges
Had Nearly Twice the Reductions in Recidivism and 30% higher cost savings
Note 1: Difference is significant at p<.05Note 2: Non-drug charges include property, prostitution, violence, etc.
0%
10%
20%
30%
40%
50%
Drug court accepts non-drug chargesN=42
Drug court does NOT accept non-drug chargesN=24
41%
21%
Perc
ent r
educ
tion
s in
reci
divi
sm

Who Does it Work For?
Average Number of Rearrests by Number of Prior Arrests at 2 Years
0.00
0.25
0.50
0.75
1.00
1.25
1.50
1 2 3 4
Ave
rage
Num
ber o
f Rea
rres
ts
Average Number of Prior Arrests
Comparison (n=81)
p<.01
MN DWI Court Study9 Sites
NHTSAfunded

Average Number of Rearrests by Number of Prior Arrests at 2 Years
0.00
0.25
0.50
0.75
1.00
1.25
1.50
1 2 3 4
Ave
rage
Num
ber o
f Rea
rres
ts
Average Number of Prior Arrests
DWI Court (n=48) Comparison (n=81)
p<.01
MN DWI Court Study9 Sites
NHTSAfunded
Who Does it Work For?

“Higher Risk” FTC CAM Participants (Those with Young Children) Did Better
0.00
0.25
0.50
0.75
1.00
8 76 140
Ave
rage
Num
ber o
f Alle
gati
ons
per C
hild
Average Age (in Months)
FTC-CAM Comparison
p<.001

Note: Difference is significant at p<.05
Drug Courts in Which Participants Entered the Program within 50 Days of
Triggering Event Had 63% Greater Reductions in Recidivism
0%
10%
20%
30%
40%
50%
Participants enterprogram within
50 days of arrestN=15
Participants enterprogram within
50 days of arrestN=26
39%
24%
Perc
ent r
educ
tions
in re
cidi
vism

Since timely engagement and
access to assessment and treatment matters:
How can identification and screening be
moved up as early as possible?

A Model for Early Identification, Assessment,
and Referral
Referral into CWS Hotline
CWS Safety and Risk Assessment Detention Hearing
Jurisdictional-Dispositional
Hearing
AOD Screening & Assessment
Referral to FDC or appropriate LOC
Status Review Hearing
Typical referral to FDC or other LOC
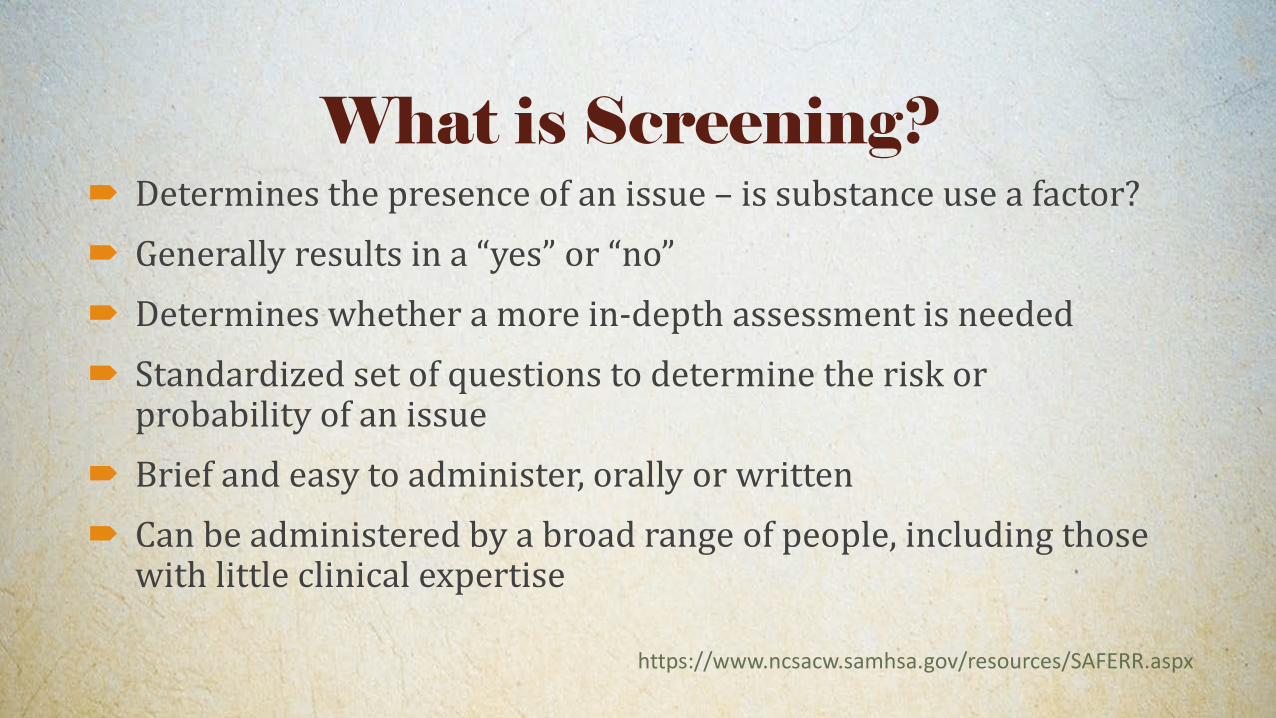
What is Screening? Determines the presence of an issue – is substance use a factor? Generally results in a “yes” or “no” Determines whether a more in-depth assessment is needed Standardized set of questions to determine the risk or
probability of an issue Brief and easy to administer, orally or written Can be administered by a broad range of people, including those
with little clinical expertise
https://www.ncsacw.samhsa.gov/resources/SAFERR.aspx

What Tool Should We Use?
Standardized set of questions to determine the risk or probability of an issue Brief and easy to administer, orally or written Can be administered by a broad range of people, including those with little clinical
expertise Examples: UNCOPE; GAIN; AUDIT; CAGE Practice Principle – It’s the team, not the tool
https://www.ncsacw.samhsa.gov/resources/SAFERR.aspx

4 Prong – Screening
Tool Signs & symptoms Corroborating reports Drug screen
Proceed to assessmentYes

15.818.5 19.6
21.6 22.7 23.4 24.9 26.1 26.3 25.8 26.128.4 29.3 30.5 31
0
10
20
30
40
50
60
70
1999 2000 2001 2002 2003 2004 2005 2006 2007 2008 2009 2010 2011 2012 2013
PERC
ENT
PARENTAL AOD AS REASON FOR REMOVAL IN THE US 1998 - 2013
U.S. National
Source: AFCARS Data Files
Source: AFCARS Data, 2013
Great variability across states ranging from <10% to over 60%
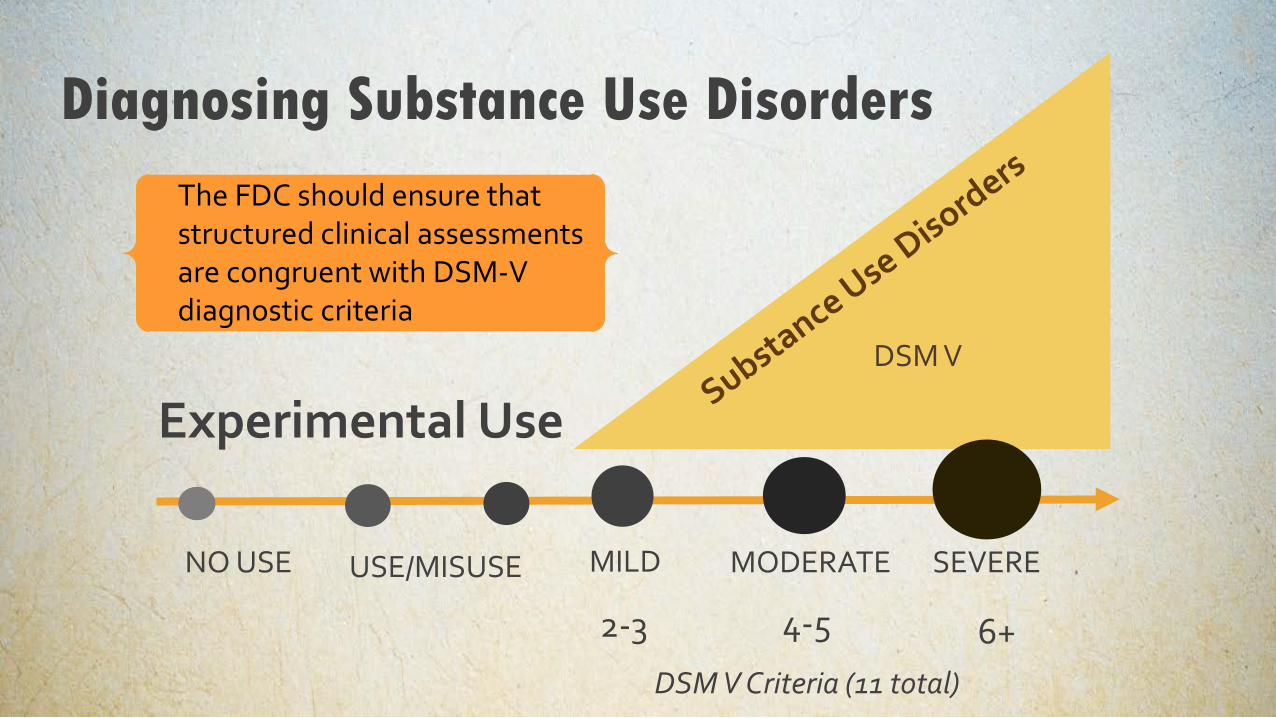
NO USE
Experimental Use
USE/MISUSE MILD MODERATE SEVERE
Diagnosing Substance Use Disorders
DSM V
2-3 4-5 6+DSM V Criteria (11 total)
The FDC should ensure that structured clinical assessments are congruent with DSM-V diagnostic criteria

Matching Service to Need: How FDCs Identify, Assess and Support Families
to Achieve Recovery, Safety, and Permanency
Check it out!Session 123A | June 3, 2016, 11am – 12:15pm

FDC GUIDELINES SELF-ASSESSMENT
RECOMMENDATION 5: DEVELOP PROCESS FOR EARLY IDENTIFICATION
AND ASSESSMENT
#1
20 MINUTES
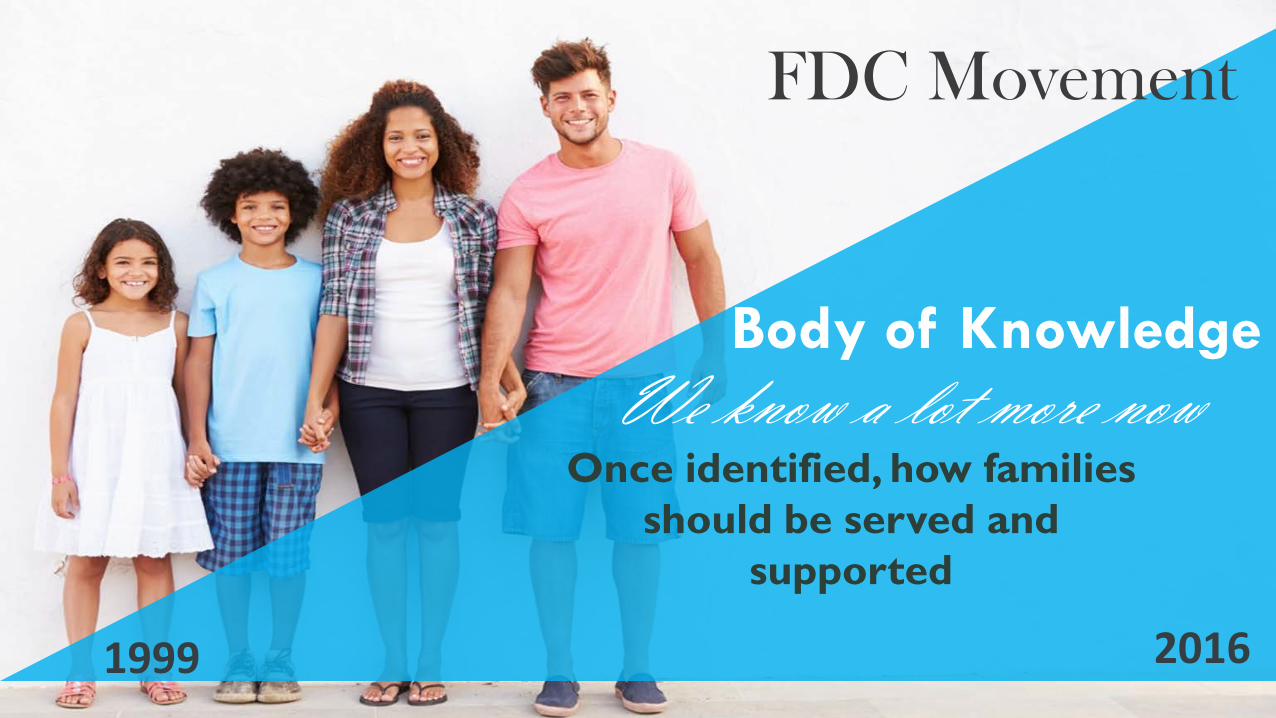
Once identified, how families should be served and
supported
1999 2016
Body of KnowledgeWe know a lot more now
FDC Movement

Rethinking Engagement
If you build it, will they come?
Effective FDCs focus oneffective engagement

Rethinking Treatment Readiness
Addiction as an elevatorRe-thinking “rock bottom”
“Raising the bottom”

Titles and Models• Recovery Support Specialist• Substance Abuse Specialist• Recovery Coach• Recovery Specialist• Parent Recovery Specialist
• Peer Mentor• Peer Specialist• Peer Providers• Parent Partner
What does our program and community need?You need to ask:
Experiential Knowledge, Expertise Experiential Knowledge, Expertise +
Specialized Trainings

102
130151
200
0
50
100
150
200
250
No Parent SupportStrategy
Intensive CaseManagement Only
Intensive CaseManagement and Peer/
Parent Mentors
Intensive CaseManagement and
Recovery Coaches
Median in Days
Median Length of Stay in Most Recent Episode of Substance Abuse Treatment after RPG Entry by Grantee Parent Support Strategy Combinations

46% 46%
56%63%
0%
10%
20%
30%
40%
50%
60%
70%
No Parent SupportStrategy
Intensive CaseManagement Only
Intensive CaseManagement and
Peer/ ParentMentors
Intensive CaseManagement and
Recovery Coaches
Median in Days
Substance Abuse Treatment Completion Rate by Parent Support Strategies

Helping Them Get Ready: Active Client Engagement through a FDTC Recovery Support Specialist
Check it out!Session FDC E-5| Thurs. June 2nd, 4:45 - 6pm

Drug Courts That Used One or Two Primary Treatment Agencies Had 76%
Greater Reductions in Recidivism
Note: Difference is significant at p<.05
0
0.1
0.2
0.3
0.4
0.5
0.6
0.7
1 2 3 4 4 - 10 > 10Number of agencies
Fewer treatment providers is related to greater reductions in recidivism
% reduction in recidivism
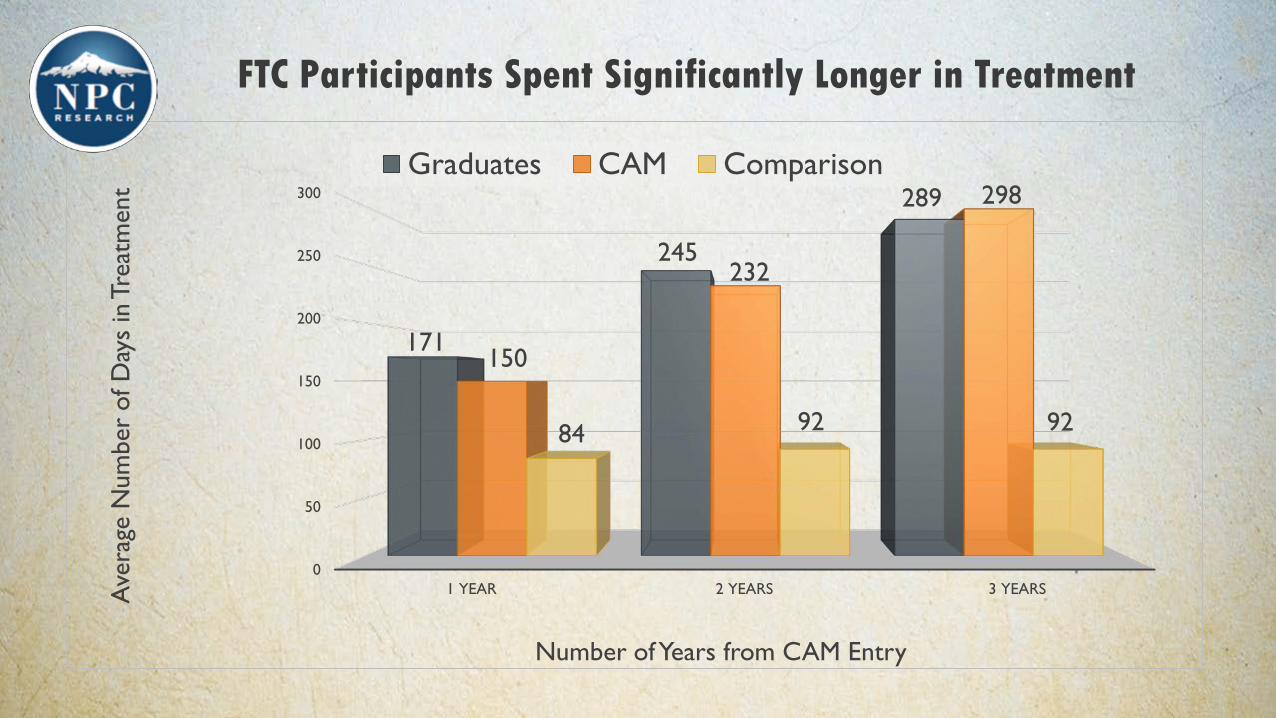
FTC Participants Spent Significantly Longer in Treatment
0
50
100
150
200
250
300
1 YEAR 2 YEARS 3 YEARS
171
245
289
150
232
298
84 92 92
Ave
rage
Num
ber
of D
ays
in T
reat
men
t
Number of Years from CAM Entry
Graduates CAM Comparison

FTC Participants Were Significantly More Likely to Complete Treatment
0%
25%
50%
75%
100%
1 YEAR 2 YEARS 3 YEARS
58%
83%87%
42%
68%77%
23%31% 30%
Per
cent
of I
ndiv
idua
ls w
ith
Succ
essf
ul T
reat
men
t C
ompl
etio
n
Number of Years from CAM Entry
Graduates CAM Comparison
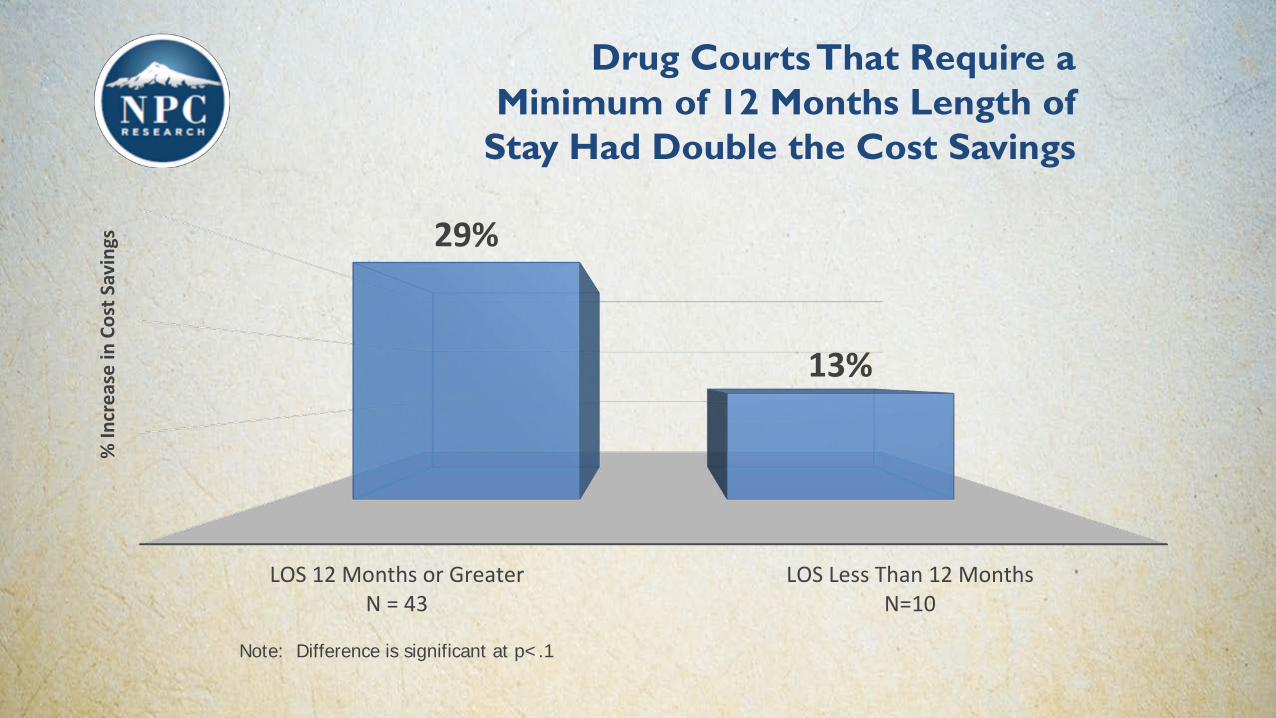
Drug Courts That Require a Minimum of 12 Months Length of
Stay Had Double the Cost Savings
Note: Difference is significant at p<.1
LOS 12 Months or GreaterN = 43
LOS Less Than 12 MonthsN=10
29%
13%
% In
crea
se in
Cos
t Sav
ings

Drug Courts That Required Greater Than 90 Days of Abstinence Had 3 Times
Greater Reduction in Recidivism and Substantial Cost Savings
Note: Difference is significant at p<.05
0%
10%
20%
30%
40%
Participants are clean at least 90 days beforegraduation
N=57
Participants are clean LESS THAN 90 daysbefore graduation
N=9
37%
14%
Perc
ent r
educ
tions
in re
cidi
vism

Drug Courts That Included a Focus on Relapse Prevention Had Over 3 Times
Greater Savings
Note: Difference is significant at p<.05
0%
5%
10%
15%
20%
25%
30%
35%
40%
45%
YesN=9
NoN=2
41%
13%
Perc
ent I
mpr
ovem
ent i
n O
utco
me
Cost
s*
Drug Court Has a Phase that Focuses on Relapse Prevention
*”Percent improvement in outcome costs” refers to the percent savings for drug court compared to business-as-usual

Addiction affects
the whole family
Developmental impact
Psycho-social impact
Impact on parenting
Generational impact

FDC Practice Improvements
Approaches to child well-being in FDCs need to change
Child-focused assessments and
services
In the context of parent’s recovery
Family-centered Treatmentincludes parent-child dyad
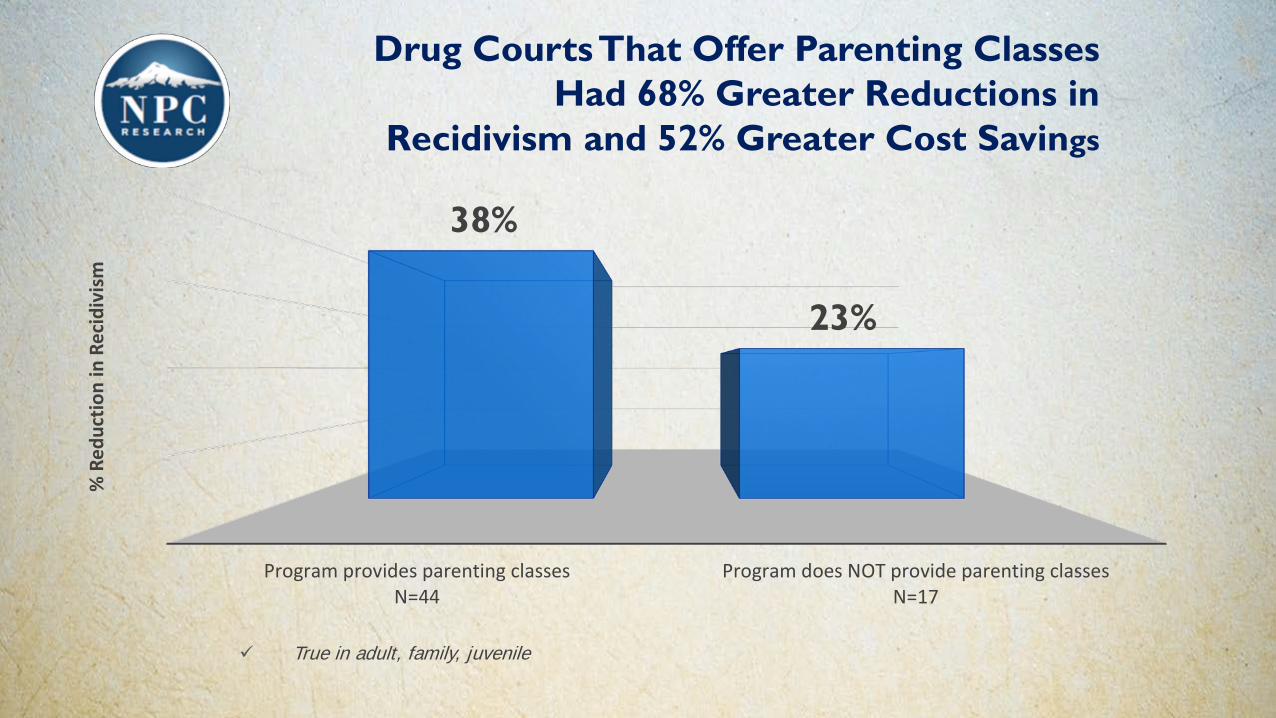
True in adult, family, juvenile
Drug Courts That Offer Parenting Classes Had 68% Greater Reductions in
Recidivism and 52% Greater Cost Savings
Program provides parenting classesN=44
Program does NOT provide parenting classesN=17
38%
23%
% R
educ
tion
in R
ecid
ivis
m
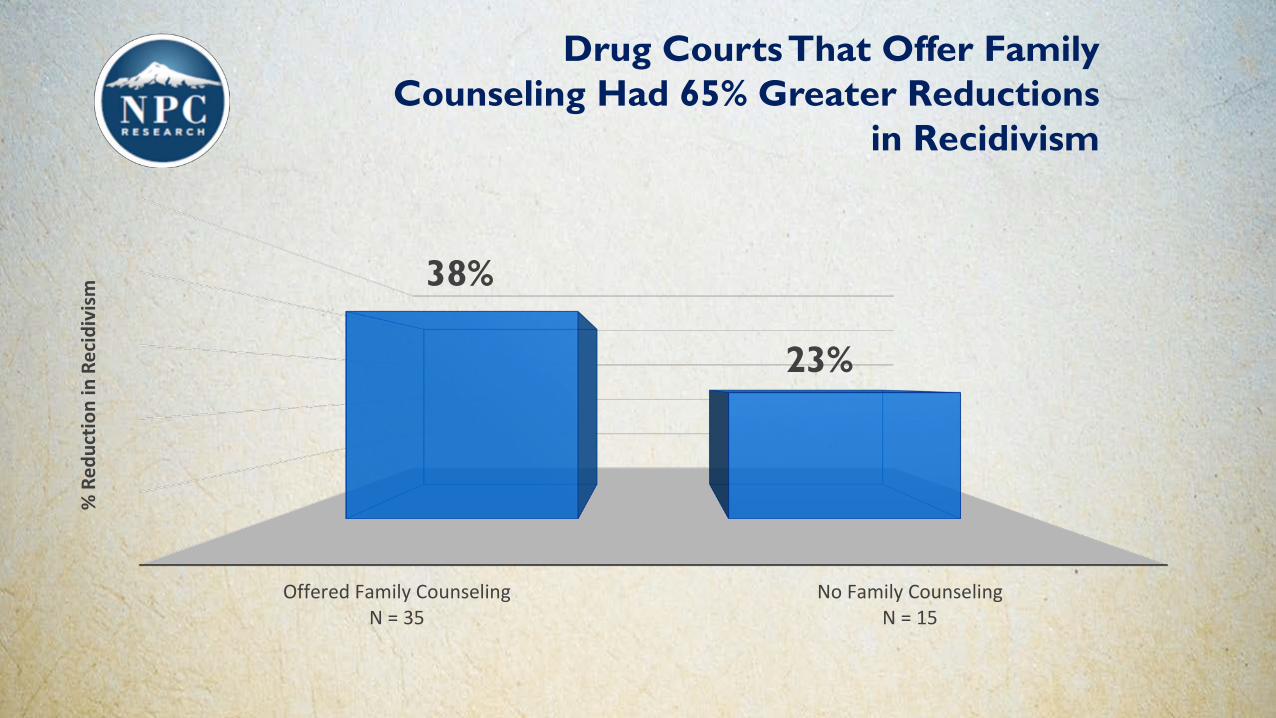
Drug Courts That Offer Family Counseling Had 65% Greater Reductions
in Recidivism
Offered Family CounselingN = 35
No Family CounselingN = 15
38%
23%
% R
educ
tion
in R
ecid
ivis
m
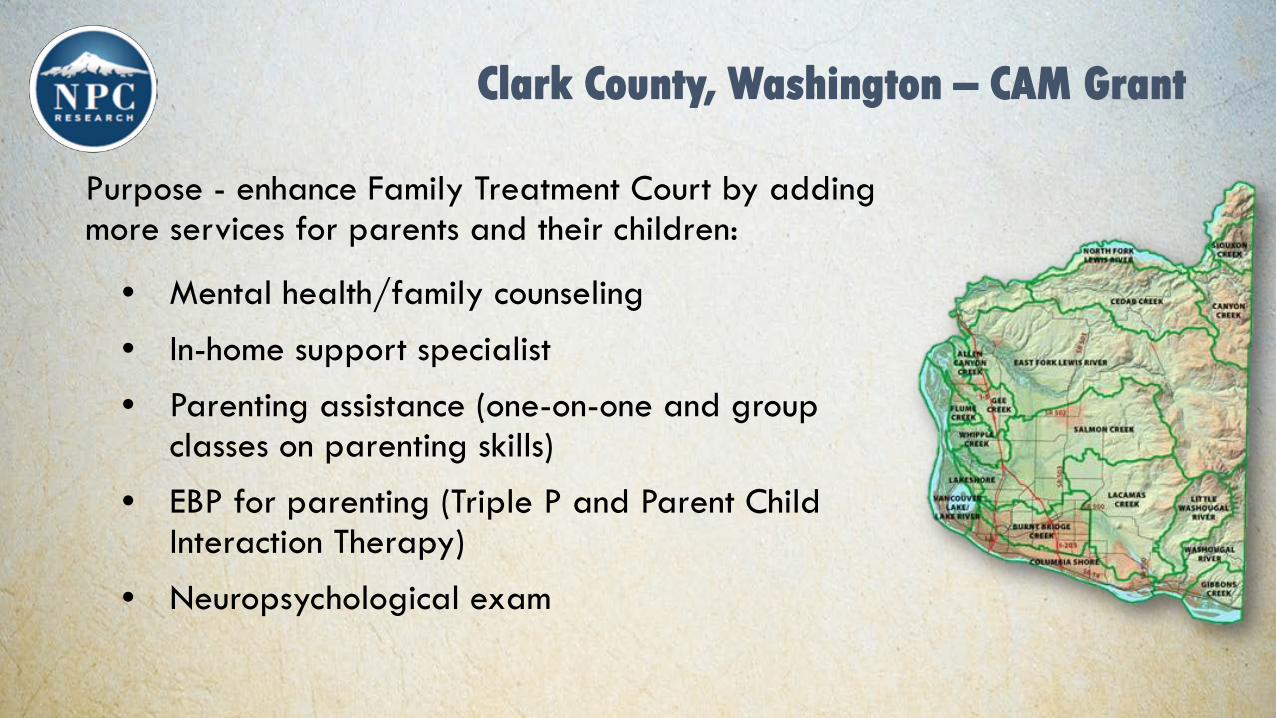
Purpose - enhance Family Treatment Court by adding more services for parents and their children:
• Mental health/family counseling
• In-home support specialist
• Parenting assistance (one-on-one and group classes on parenting skills)
• EBP for parenting (Triple P and Parent Child Interaction Therapy)
• Neuropsychological exam
Clark County, Washington – CAM Grant

FTC CAM Participants Were Twice as Likely to Enroll in Outpatient Treatment
0%
25%
50%
75%
100%
1 Year 2 Years 3 Years
91% 92%
46%
Perc
ent o
f Ind
ivid
uals
with
Tre
atm
ent
Graduates CAM Comparison

FTC-CAM Children Spent Less Time in Out of Home Care than Pre-CAM
0
50
100
150
200
1 YEAR 2 YEARS 3 YEARS
98
123
147
93
157
188
Aver
age
Day
s O
ut o
f Hom
e
Number of Years from Program Entry
CAM PreCAM

FTC-CAM Parents Were Significantly More Likely to be Reunified with Their Children Over 3 Years
0%
25%
50%
75%
100%
1 YEAR 2 YEARS 3 YEARS
13%
74%
90%
9%
62%
83%
25%
42%
59%
Per
cent
of P
aren
ts R
euni
fied
with
The
ir C
hild
ren
Number of Years from Program Entry
Graduates CAM Comparison

FTC-CAM Parents Were Significantly More Likely to be Reunified with Their Children Over 3 Years
0%
20%
40%
60%
80%
100%
1 YEAR 2 YEARS 3 YEARS
9%
62%
83%
25%
56%
69%
Perc
ent o
f Par
ents
Reu
nifie
d w
ith T
heir
Chi
ldre
n
Number of Years from Program Entry
CAM PreCAM
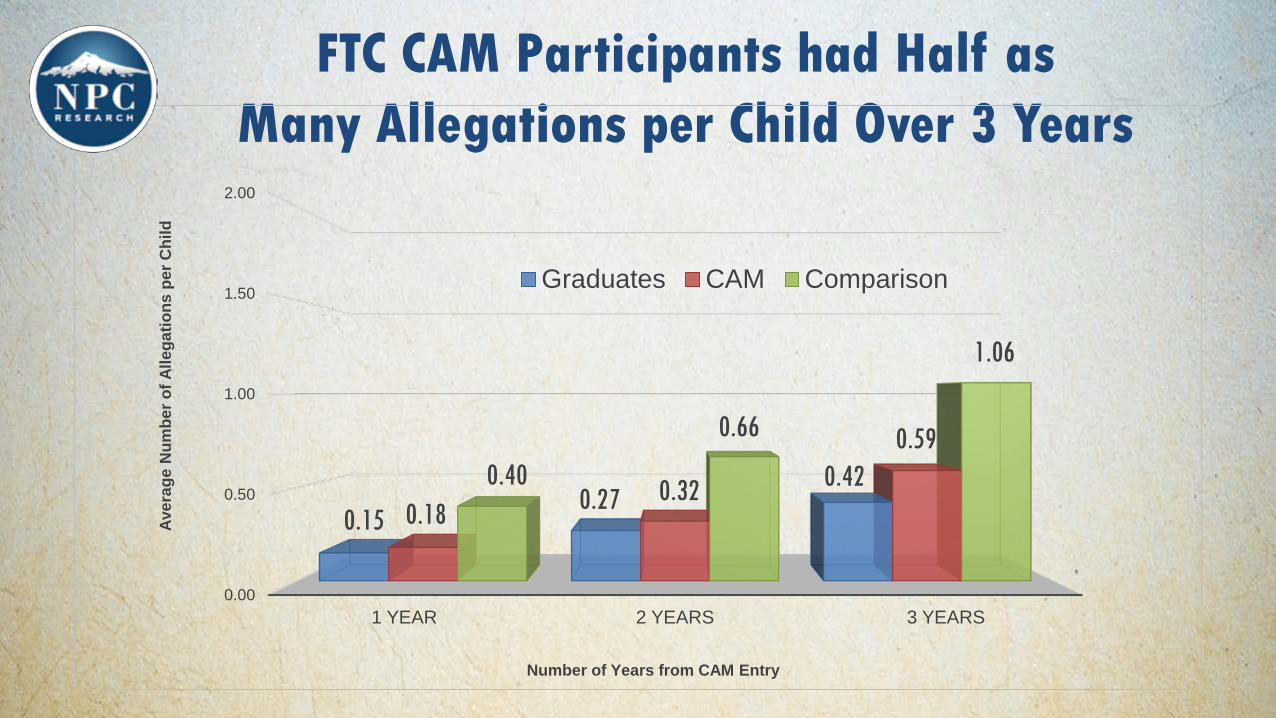
FTC CAM Participants had Half as Many Allegations per Child Over 3 Years
0.00
0.50
1.00
1.50
2.00
1 YEAR 2 YEARS 3 YEARS
0.150.27
0.420.18
0.32
0.590.40
0.66
1.06
Aver
age
Num
ber o
f Alle
gatio
ns p
er C
hild
Number of Years from CAM Entry
Graduates CAM Comparison

CAM Participants Had Fewer New Allegations than Pre-CAM
0.00
0.25
0.50
0.75
1.00
1 YEAR 2 YEARS 3 YEARS
0.200.36
0.39
0.23
0.42
0.72
Aver
age
Num
ber o
f Alle
gatio
ns p
er C
hild
Number of Years from Program Entry
CAM PreCAM

FTC-CAM Parents Were Half as Likely to Have Children Removed 2 and 3 Years After FTC Entry
0%
10%
20%
30%
40%
50%
1 YEAR 2 YEARS 3 YEARS
5% 6%10%
8% 9% 10%5%
18%21%
Per
cent
of A
dults
with
Chi
ldre
n R
emov
ed
Number of Years from FTC Entry
Graduates CAM Comparison

FTC-CAM Parents Were Significantly More Likely to be Reunified with Their Children Over 3 Years
0%
25%
50%
75%
100%
1 YEAR 2 YEARS 3 YEARS
13%
74%90%
9%
62%
83%
25%42%
59%
Per
cent
of P
aren
ts R
euni
fied
with
The
ir C
hild
ren
Number of Years from Program Entry
Graduates CAM Comparison

FTC-CAM Parents Were Significantly More Likely to be Reunified with Their Children Over 3 Years
0%
20%
40%
60%
80%
100%
1 YEAR 2 YEARS 3 YEARS
9%
62%
83%
25%
56%
69%
Per
cent
of P
aren
ts R
euni
fied
with
The
ir C
hild
ren
Number of Years from Program Entry
CAM PreCAM

FTC-CAM Parents had Fewer Re-arrests than Non-FTC Parents Over 3 Years
0.00
0.50
1.00
1.50
2.00
1 YEAR 2 YEARS 3 YEARS
0.18 0.21 0.200.39
0.53 0.55
0.31
0.66
1.43
Aver
age
Num
ber o
f Rea
rres
t
Number of Years from CAM Entry
Graduates CAM Comparison

Other Service Enhancements• Therapeutic-based parent-child
interventions• Trauma-focused interventions• Developmental and behavioral
interventions• Quality visitation and family
time• Family functioning assessment
tools – N. Carolina Family Assessment Scale (NCFAS)

Clark County: NCFAS Scores Improved Significantly from Entry to Exit
-3.0
-2.0
-1.0
0.0
1.0
2.0
-0.1
-1.1
-0.5-0.8
0.2
-0.2
-1.9
0.5
-0.2
-0.8
1.41.3
1.0
1.7
1.31.1
0.0
1.6 1.61.9
Entry Exit

The Parent-Child Relationship – The Unique Opportunities of FDTCs to Achieve Improved Outcomes
Check it out!Session FDC B-5| Thurs. June 2nd, 11am –12:15 pm

Sacramento County Family Drug Court Programming
Parent-child parenting intervention
FDC
CIF
Connections to community supports
Improved outcomes
•Dependency Drug Court (DDC)• Post-File
•Early Intervention Family Drug Court (EIFDC)
• Pre-FileDDC has served over 4,200 parents & 6,300 childrenEIFDC has served over 1,140 parents & 2,042 children CIF has served over 540 parents and 860 children

Effective Strategies to Support Families through Reunification
Check it out!Session FDC A-5| Thurs. June 2nd, 9:30–10:45 am
Planning for Safe Care: What Your FDTC Needs to Know about Opioid Disorders and Serving Impacted Mothers and their Infants
Check it out!Session FDC D-5| Thurs. June 2nd, 3:15 – 4:30 pm
FDC GUIDELINES SELF-ASSESSMENT
RECOMMENDATION 6-7: ADDRESS THE NEEDS OF PARENTS
ADDRESS THE NEEDS OF CHILDREN
#2
20 MINUTES

15 Minute Break

Once served, how do we know we are making an impact? The
importance of monitoring cases and outcomes.
1999 2016
Body of KnowledgeWe know a lot more now
FDC Movement

Administrative Level (macro)• Baselines and Dashboards• Outcomes• Sustainability
Front-line Level (micro)
• Case management• Reporting• Tracking
Two Levels of Information Sharing
Client Program

•More frequent review hearings• Judicial Oversight•Responses to behavior•Case Staffings•Drug testing
Monitoring Cases

Drug Courts That Held Status Hearings Every 2 Weeks During Phase 1 Had
50% Greater Reductions in Recidivism
Note: Difference is significant at p<.1
0%
10%
20%
30%
40%
50%
Drug court hasreview hearingsevery two weeks
N=14
Drug court hasreview hearings
more or less oftenN=35
46%
31%
Perc
ent R
educ
tion
in R
ecid
ivis
m
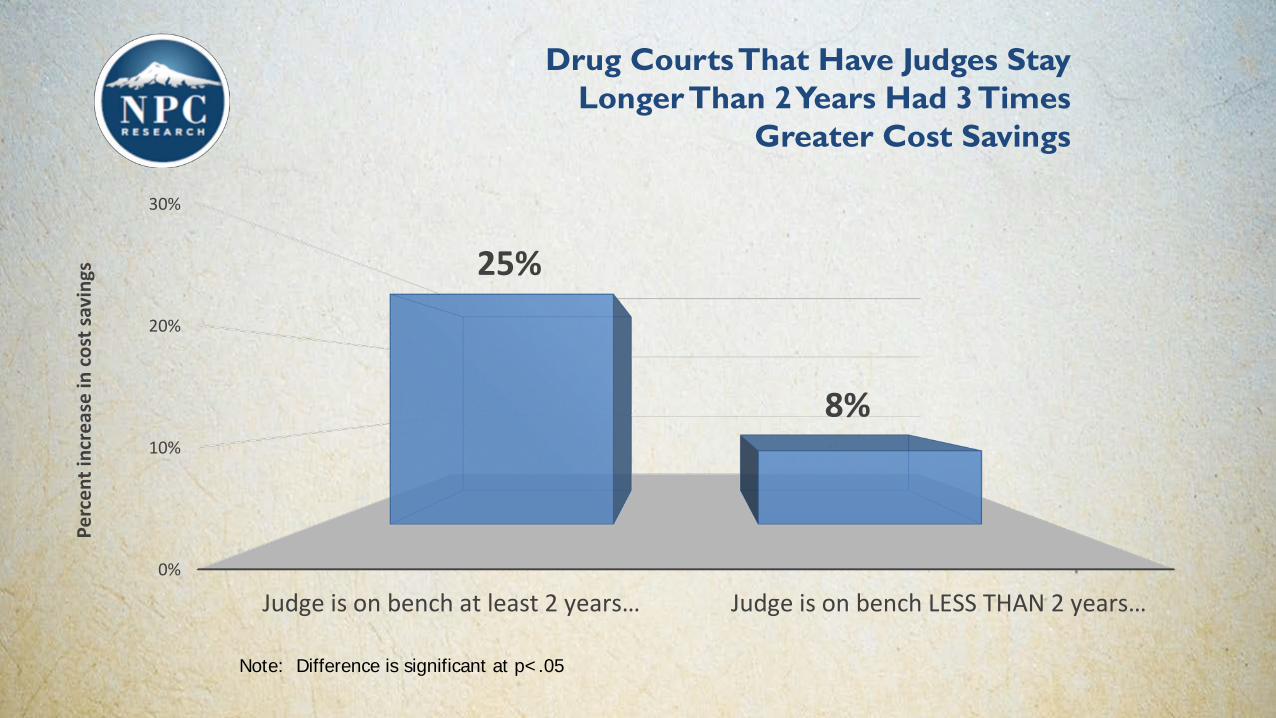
Drug Courts That Have Judges Stay Longer Than 2 Years Had 3 Times
Greater Cost Savings
Note: Difference is significant at p<.05
0%
10%
20%
30%
Judge is on bench at least 2 years… Judge is on bench LESS THAN 2 years…
25%
8%
Perc
ent i
ncre
ase
in c
ost s
avin
gs

Judges Who Spent at Least 3 Minutes Talking to Each Participant in Court Had More Than
Twice the Savings
Note: Difference is significant at p<.05
0%
10%
20%
30%
40%
50%
Judge spends at least 3 min. perparticipant
N=23
Judge spends LESS THAN 3 min. perparticipant
N=12
43%
17%
Perc
ent r
educ
tion
in re
cidi
vism

Note 1: Difference is significant at p<.05
Drug Courts Where the Judge Spends an Average of 3 Minutes or Greater per Participant During Court
Hearings had 153% greater reductions in recidivism

Therapeutic Jurisprudence• Engage directly with parents vs. through
attorneys• Create collaborative and respectful
environments• Convene team members and parents
together vs. reinforcing adversarial nature of relationship
• Rely on empathy and support (vs. sanctions and threats) to motivate
Lens, V. Against the Grain: Therapeutic Judging in a Traditional Court. Law & Social Inquiry. American Bar Association. 2015

The Judge Effect
• The judge was the single biggest influence on the outcome, with judicial praise, support and other positive attributes translating into fewer crimes and less use of drugs by participants (Rossman et al, 2011)
• Positive supportive comments by judge were correlated with few failed drug tests, while negative comments led to the opposite (Senjo and Leip, 2001)
• The ritual of appearing before a judge and receiving support and accolades, and “tough love” when warranted and reasonable, helped them stick with court-ordered treatment (Farole and Cissner, 2005, see also Satel 1998)
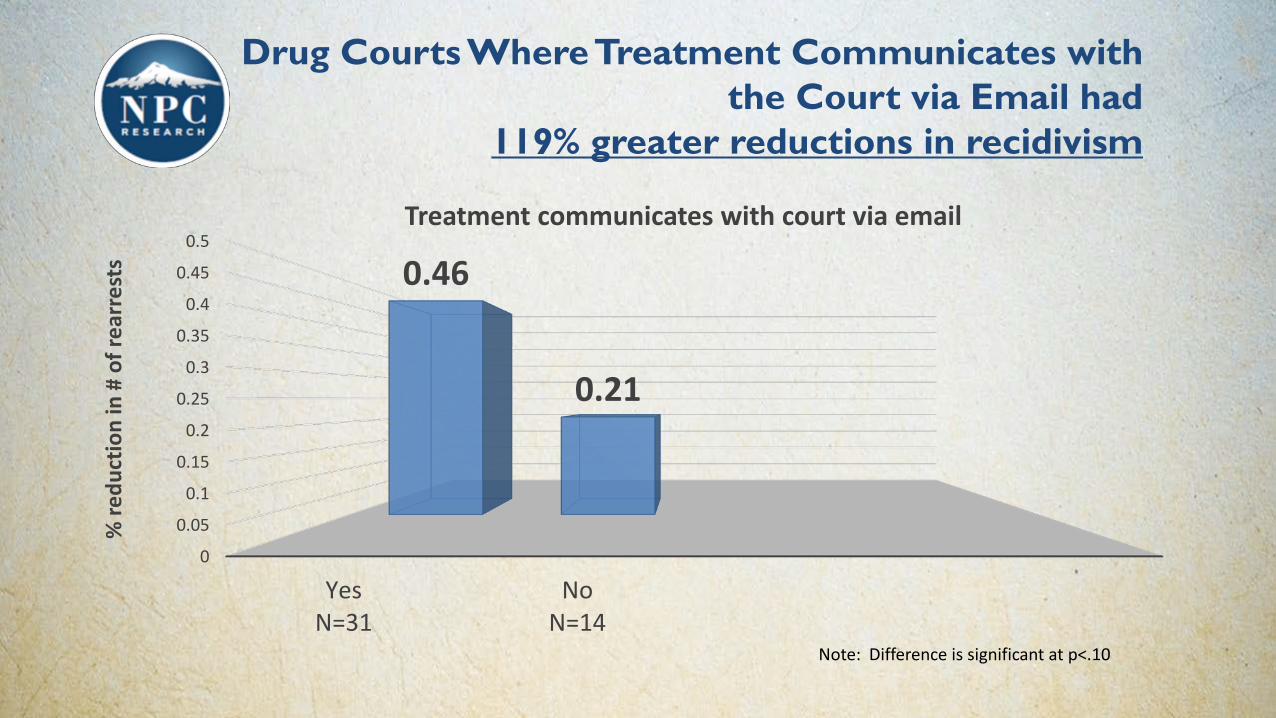
Note: Difference is significant at p<.10
Drug Courts Where Treatment Communicates withthe Court via Email had
119% greater reductions in recidivism
0
0.05
0.1
0.15
0.2
0.25
0.3
0.35
0.4
0.45
0.5
YesN=31
NoN=14
0.46
0.21
% re
duct
ion
in #
of r
earr
ests
Treatment communicates with court via email

0%
10%
20%
30%
40%
Program usespaper files
N=8
Program haselectronic database
N=3
20%
33%
Perc
ent i
ncre
ase
in c
ost s
avin
gsDrug Courts That Used Paper Files Rather Than Electronic Databases
Had 65% LESS Savings
Note: Difference is significant at p<.05

Drug Courts That Required All Team Members to Attend Staffings
Had 50% Greater Reductions in Recidivism and 20% Greater Savings
0%
10%
20%
30%
40%
50%
All team members attend staffingsN=31
All team does NOT attend staffingsN=28
42%
28%
Perc
ent r
educ
tion
in re
cidi
vism
Note 1: Difference is significant at p<.05Note 2: “Team Members” = Judge, Both Attorneys, Treatment Provider, Coordinator

Note: Difference is significant at p<.15 (Trend)
Drug Courts Where Drug Tests are Collected at Least Two Times per Week
in the First Phase Had a 61% Higher Cost Savings
0%
10%
20%
30%
40%
Participants drug tested at least 2X perweekN=53
Participants tested LESS often than 2Xper week
N=12
29%
18%
Perc
ent i
ncre
ase
in c
ost s
avin
gs

Note: Difference is significant at p<.05
0%
10%
20%
30%
40%
Drug tests are back within48 hours
N=21
Drug testsare back in
LONGER THAN48 hours
N=16
32%
19%
Perc
ent i
ncre
ase
in c
ost s
avin
gs
Drug Courts Where Drug Test Results are Back in 48 Hours or Less had
68% Higher Cost Savings

Who collects data, where is it stored, who uses it, who “owns” the data,
levels of access
Assess effectiveness of system in achieving its desired results or
outcomes
Monitoring Outcomes

“Feel Good” ProgramFamily Drug Courts as a
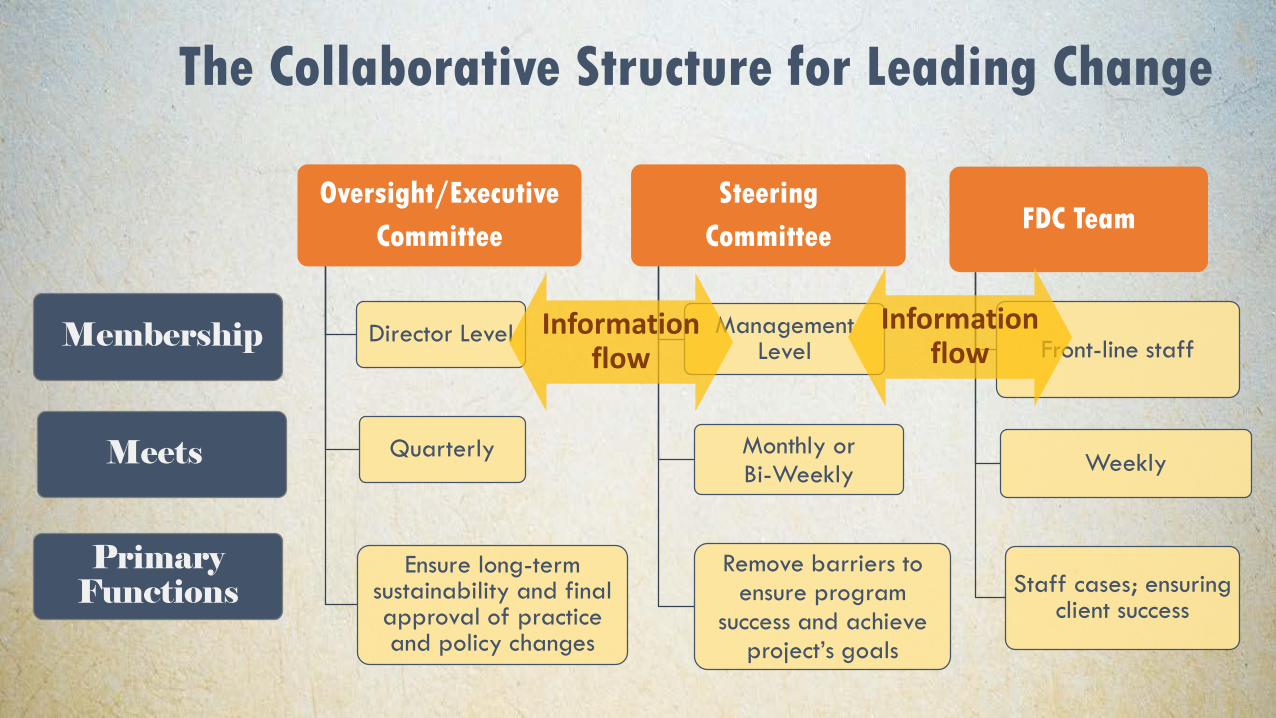
Oversight/ExecutiveCommittee
Director Level
Quarterly
Ensure long-term sustainability and final approval of practice and policy changes
Steering Committee
Management Level
Monthly or Bi-Weekly
Remove barriers to ensure program
success and achieve project’s goals
FDC Team
Front-line staff
Weekly
Staff cases; ensuring client success
Membership
Meets
Primary Functions
The Collaborative Structure for Leading Change
Information flow
Information flow

How do you know….. How will you…..
• How are families doing?• Doing good vs. harm?• What’s needed for families?
• Monitor and improve performance?• Demonstrate effectiveness?• Secure needed resources?
The importance of

Data Dashboard
• What needles are you trying move?• What outcomes are the most important?• Is there shared accountability for “moving the needle” in a measurable
way, in FDC and larger systems?• Who are we comparing to?
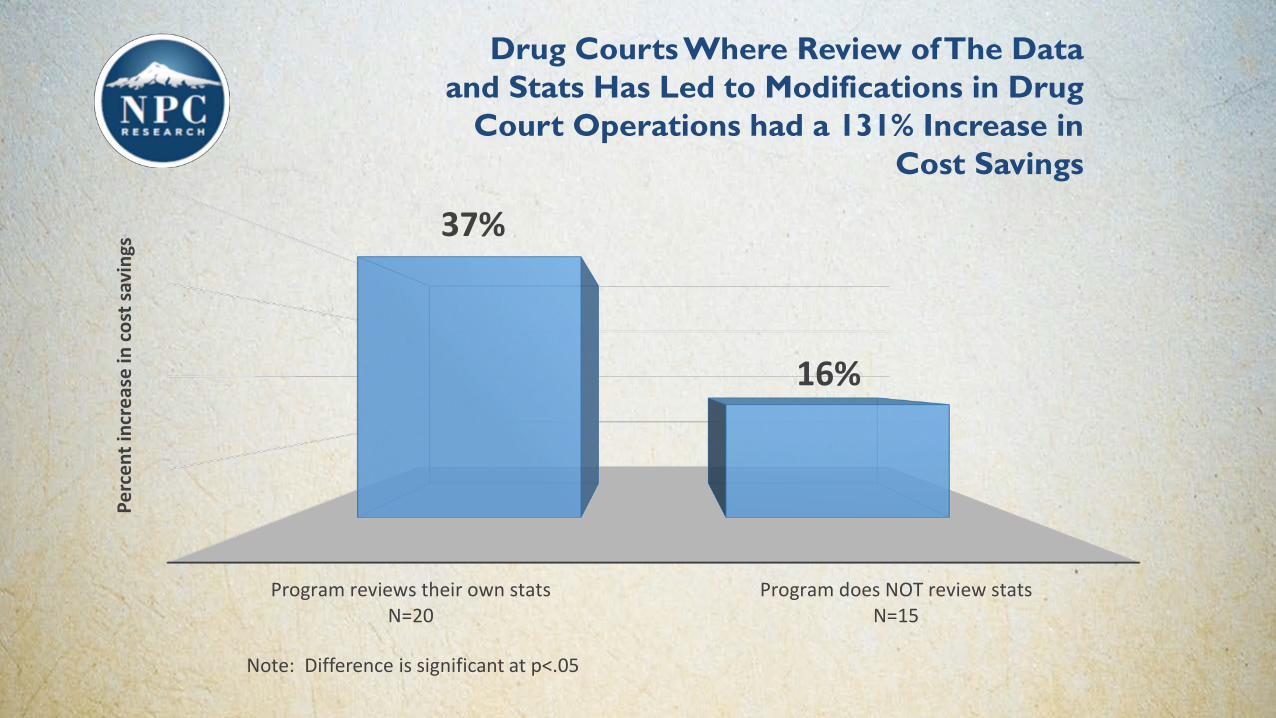
Note: Difference is significant at p<.05
Program reviews their own statsN=20
Program does NOT review statsN=15
37%
16%
Perc
ent i
ncre
ase
in c
ost s
avin
gs
Drug Courts Where Review of The Data and Stats Has Led to Modifications in Drug
Court Operations had a 131% Increase in Cost Savings

Note: Difference is significant at p<.05
0%
10%
20%
30%
40%
50%
Used evaluation to make modifications toprogram
N=18
Did NOT use evaluation to make modificationsN=13
36%
18%
Perc
ent i
ncre
ase
in c
ost s
avin
gs
Drug Courts Where the Results of Program Evaluations Have Led to Modifications in
Drug Court Operations Had a 100% Increase in Cost Savings

System Walk-Through Data and Info Walk-Through
Who collects data, where is it stored, who uses it, who “owns” the data,
levels of access
Assess effectiveness of system in achieving its desired results or
outcomes
Tools for Monitoring Outcomes

Drop-Off Points
Total number of cases that resulted in investigation and those with a screening
Number and percentage of parents referred for assessment
Number and percentage who received an assessment
Number and percentage referred to treatment and FDC
Number and percentage admitted (attended at least one session) to
treatment and to FDCNumber and percentage in
treatment for at least 90 daysNumber and percentage
completing treatment
104
Payoff – Number and percentage Reunified / Remained at home

Systems Walk-Through
Screening
Assessment
Referral
Monitoring

Set-Up for Success - Why Your FDC Team Needs the Busting Barrier Powers of A Steering Committee
Check it out! Session 123A | June 2016, 12pm – 2 pm

Ethical Issues: The Justice League – The Importance of Attorney Advocacy and Support in Family Drug Courts
Check it out! Session 123A | June 2016, 12pm – 2 pm

FDC GUIDELINES SELF-ASSESSMENT
RECOMMENDATION 3: CREATE EFFECTIVE COMMUNICATION
PROTOCOLS FOR SHARING INFORMATION
#3
20 MINUTES

Training and Technical Assistance Needs of FDCs
1999 2016
Body of KnowledgeWe know a lot more now
FDC Movement
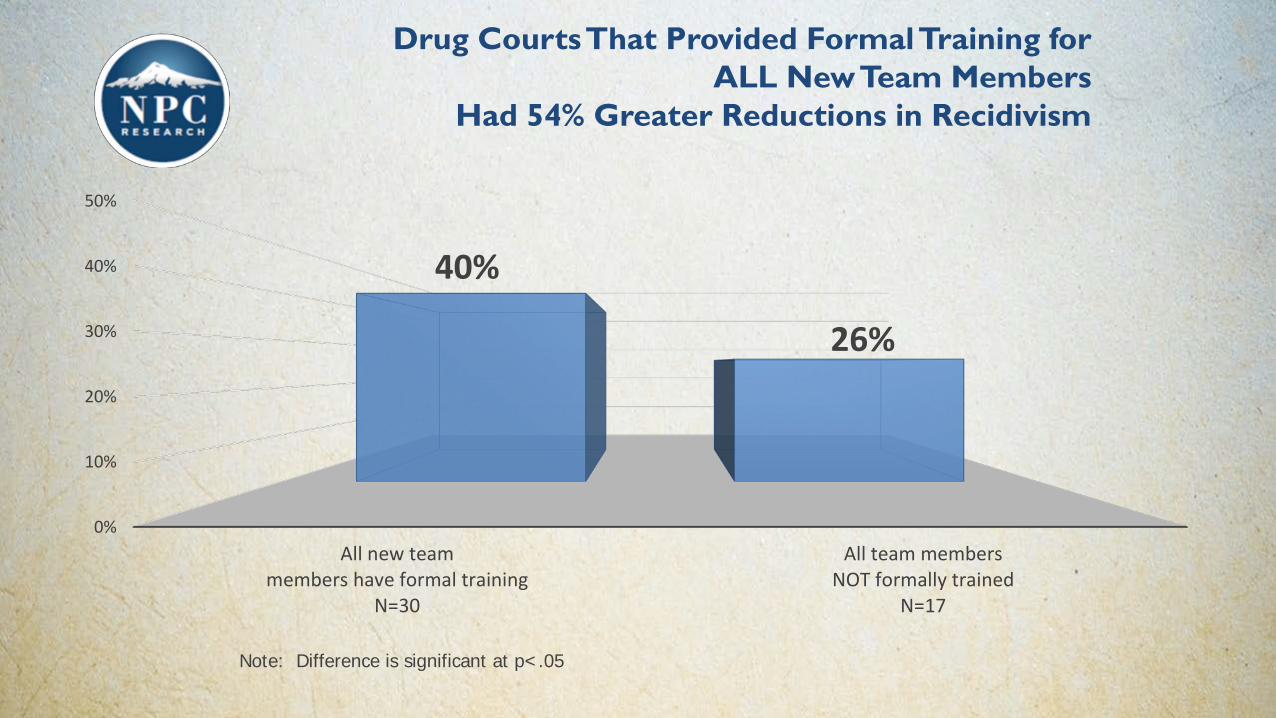
Note: Difference is significant at p<.05
Drug Courts That Provided Formal Training for ALL New Team Members
Had 54% Greater Reductions in Recidivism
0%
10%
20%
30%
40%
50%
All new teammembers have formal training
N=30
All team membersNOT formally trained
N=17
40%
26%

Note: Difference is significant at p<.05
Drug Courts That Received Training Prior to Implementation Had Almost
3.5 Times Higher Cost Savings
0%
10%
20%
30%
40%
Team trained BEFORE implementationN=12
Team members NOT trained beforeimplementation
N=5
27%
8%
Perc
ent i
ncre
ase
in c
ost s
avin
gs

FDC Guidelines
http://www.cffutures.org/files/publications/FDC-Guidelines.pdf
To download a copy today visit our website:

Family Drug Court Learning Academy
2016 Virtual Classroom SeriesWatch Pre-Recorded Webinar Register and Join Live Virtual Classroom Convenient & Effective Learning
Join Us!

Virtual Classroom Webinar Available
Classroom Schedule
Screening & Assessment
April 1 April 14, May 12, May 26
Governance & Leadership
April 5 April 19, May 3, May 17
Parent-Child Relationships
July 1 July 14, July 28,August 18
Data & InfoSystems
July 5 July 21, August 11, August 25
• Real-time networking and knowledge sharing
• Coaching & mentoring• Applied learning
through homework or project assignments
• 24/7 access to classroom
• Technical assistance and resources
Register Now!Space Limited

• Webinar Recordings• FDC Podcasts • FDC Resources• FDC Video features• Webinar registration information
FDC Learning Academy Blog
www.familydrugcourts.blogspot.com

Family Drug Court Online Tutorial
FDC 101 – will cover basic knowledge of the FDC model and operations

FAMILY DRUG COURTPEER LEARNING COURT PROGRAM
King County, WA
Baltimore City, MDJackson County, MO
Chatham County, GA
Pima County, AZ
Wapello County, IA
Miami-Dade, FL
Jefferson County, AL
Dunklin County, MO
CONTACT US FOR MORE INFORMATION: [email protected]

FDC Discipline Specific Orientation Materials
Child Welfare | AOD Treatment | Judges | Attorneys
Please visit: www.cffutures.org/fdc/
Resources

1. Understanding Substance Abuse and Facilitating Recovery: A Guide for Child Welfare Workers
2. Understanding Child Welfare and the Dependency Court: A Guide for Substance Abuse Treatment Professionals
3. Understanding Substance Use Disorders, Treatment and Family Recovery: A Guide for Legal Professionals
Please visit: http://www.ncsacw.samhsa.gov/
NCSACW Online Tutorials
Resources

Contact InformationShannon M. Carey, Ph.D. Co-President, Director of DevelopmentSenior Research AssociatePhone: (503) 243-2436, ext. 104Fax: (503) 243-2454Email: [email protected]

Improving Family
OutcomesStrengthening Partnerships
Contact InformationPhil Breitenbucher, MSWDirector, Family Drug Court ProgramsChildren and Family Futures(714) [email protected]