Embed Size (px)
Citation preview

IOSR Journal of Economics and Finance (IOSR-JEF)
e-ISSN: 2321-5933, p-ISSN: 2321-5925. Volume 1, Issue 4 (Sep. – Oct. 2013), PP 21-32 www.iosrjournals.org
www.iosrjournals.org 21 | Page
The Factor Model for Determining the Individual Investment
behavior in India.
Dr.S.Jayaraj Associate Professor,Department of Accounts and Finance, College of Business and Economics
Bahirdar UniversityBahirdarEthiopia.
Abstract: Globalization of financial markets has been increasing the retail investors’ community over the past
two decades by providing a wide variety of market and investment options. However, it makes much more
complex in their investment decisions process. Expected utility theory views the individual investment decision
as a tradeoff between immediate consumption and differed consumption. But individuals do not always prefer
according to the classical theory of economics. Recent studies on individual investor behavior have shown that
they do not act in a rational manner, rather several factors influence their investment decisions in
stockmarket.It will be useful to examine whether some psychological and contextual factors affect individual
investor behavior .Based on the previous literature on economics, finance and psychology ,individual investors
were surveyed to find what and to what extent affects their investment behahiourIt is widely believed that investment behavior of individual investors influence the prices of stocks rarely. Therefore majority of the
trading strategies and stock market policies are formulated with a focus only on institutional investors. This
paper aims at identifying the factors influencing the retail investor’s attitude.In this study principal component
analysis is used to find out the determinants of individual investment behavior The psychological factors that
may drive the individual investors are identified by using Principal Component Analysis. The present study
provides five major factors that can influence investor behavior in Indian stock market. The findings may be
helpful to design relevant investment strategies according to their personal characteristics so as to realize
optimum return on their investment.
Keywords: Behavior Finance, Factor analysis, investors’ attitude, riskJEL: GO2.
I. Introduction. According to economic theorists, investors think and behave “rationally” when buying and selling stocks. Generally investors are presumed to use all available information to form “rational expectations” in investment
decision making. In reality, driven by greed and fear, investors speculate stocks between unrealistic highs and
lows. They are misled by extremes of emotion, subjective thinking and the herd mentality.Indian stock market is
considered to be highly volatile, sensitive and reactive to unanticipated shocks and news and it takes no time to
impact the market activities. However at the same time, Indian stock market is resilient and recovers soon after
shocks. The role and importance of individual investors and their trading behavior in Indian stock market is also
very crucial. Unlike institutional investors, individual investors are believed to be less informed, have
psychological biases and also thought of as the proverbial noise traders in the stock market. It is believed that
trading behavior of individual investors rarely influences the stock prices. With this perception about the
individual investors, majority of trading strategies and stock market policies are designed and focused to their
institutional counterparts, thereby ignoring the individual investor's interests to some extent. The purpose of this paper is to analyze the determinants of individual investor behavior in Indian stock market..An empirical study
is conducted to analyze the investment behavior and decision making style of individual investors.
II.Text 1. Review of Literature
There are large number of researches in behavioral finance covering the issue of dynamic
relationship between individual investment behavior, trading volume , variation in stock prices and volatility
and returns. Major studies include Odeon(1999) , Choe , kho and Stultz (1999) , Barber and Odeon( 2000,
2001,2005) , Grinblatt and Keloparju (2000) Coval, Hirschleifer and Smway(2002) , Goetzmann and Kumar (2008) , Griffin, Harris and Topalogu (2003) , Jackson (2003) , Andrade, Change and Seasholes(2005), Barber
et al (2005) , Barber, Odean and Zhu (2009) , Hvidkjaer (2005) , Richards (2005) and San (2005).Assessing
individual behavior through questionnaire survey is a well adopted approach in behavioral sciences research. A
large number of researchers adopted this approach to study the importance of cognitive and other factors on
individual behavior. Nagy and Obenberger (1994) examined factors influencing investor behavior. They
developed questionnaire incorporating 34 variables. Their findings suggested that classical wealth maximization
criteria are important to investors even though they employ diverse criteria when choosing stock for investment.

The Factor Model for Determining the Individual Investment behavior in India.
www.iosrjournals.org 22 | Page
Researchers have acknowledged the significance of information factor in individual investment behavior.
Epstein (1994) examined the demand for social information by individual investors. The results indicate the
usefulness of annual reports to corporate shareholders. The result also indicates a strong demand for information about product safety and quality and about company‟s environmental activities. Further the majority of the stock
holders surveyed wanted information about corporate ethics, employee relations and community involvement.
Krishnan and Brooker (2002) analyzed factors influencing the decisions of investor who use the
recommendation of analyst to arrive at short term investment decision to hold or sell a stock. The results
indicate that a strong analyst‟s report reduces disposition error for gains and also reduces the disposition error
for loss.Merikas et al (2003) adopted a modified questionnaire to analyze Greek investor behavior on the
Athens Stock Exchange. The results indicated that individuals base their stock purchase decisions on economic
criteria combined with other diverse variables. The authors did not rely on a single integrated approach, but
rather on many categories of factors. The results also revealed that there is a certain degree of correlation
between the factors that behavioral finance theory and previous empirical evidence identify as the influencing
factors for the average equity investor, and the individual behavior of active investors in the Athens Stock Exchange (ASE) influencing by the overall trends prevailing at the time of the survey in the ASE. Fisher and
Statman (2000) revealed that the sentiment of Wall Street strategists is unrelated to the sentiment of individual
investors or that of newsletter writer (another category of investors provided by them), although the sentiment
of the individual investors and newsletter writers groups is closely related. They concluded that sentiment can be
useful for tactical asset allocation, and that a negative relationship between the sentiment of each of these three
groups and future stock returns, and the relationship is strategically significant for Wall Street strategists and
individual investors. Malmendier and Shanthikumar (2003) tried to answer the question: Are small investors‟
naïve? They found that large investors generate abnormal volumes of buyer initiated trades after a positive
recommendation only if the analyst is unaffiliated. Small traders exert abnormal buy pressure after all positive
recommendations, including those of affiliated analysts. Hodge (2003) analyzed investors‟ perceptions of
earnings quality, auditor independence, and the usefulness of audited financial information. He concluded that
lower perceptions of earnings quality are associated with greater reliance on a firm‟s audited financial statements and fundamental analysis of those statements when making investment decisions.Korniotis and
Kumar (2009a) predict cognitive ability using a host of demographic variables (e.g., age, education, and social
networks). Using the LDB dataset, they show that smarter investors outperform others by about 30 bps per
month (or 3.6% annually) both before and after accounting for transaction costs. Smarter investors earn returns
net of trading costs that are on par with appropriate benchmark returns; they make good stock picks, but only
good enough to cover their trading costs. Other investors underperform appropriate benchmarks by a bit more
than 30 basis points per month (or 3.6% annually) after costs, with about half of the shortfall being traced to
trading costs and half to bad stock selection.
Several papers have developed theoretical models based on the observation that investors are
overconfident (Benos (1998), Caballe and Sakovics (2003), Daniel, Hirshleifer, and Subramanian (1998),
Gervais and Odean (2001), Hong, Scheinkman, and Xiong (2006), Kyle and Wang (1997), Odeon (1998), Peng and Xiong (2006), Scheinkman and Xiong (2003), and Wang (2001)). Generally, these models assume investors
suffer from the miscalibration type of overconfidence. Empirical work has attempted to tease out the type of
overconfidence, miscalibration or better-than-average that is linked to excessive trading. Combining survey
evidence with trades and positions for 1,345 German investors, Dorn and Huberman (2005) document those
investors who think themselves more knowledgeable than average churn their portfolios more. Similarly, Glaser
and Weber (2007) use survey evidence and trading records for 215 German investors to document a link
between the “better-than-average” type of overconfidence and trading activity.
Closely related to the notion of overconfidence are self-assessments of competence, which are studied
by Graham, Harvey, and Huang (2009).they use survey responses from 475 U.S.investors to study the impact of
self-assessed competence on trading. Graham et al. document a strong link between self-assessed competence
and the propensity to trade. They find weak evidence that this measure of overconfidence is linked to trading
activity. The disposition effect has been documented for individual investors in several countries, for some groups of professional investors, and for different types of assets. Shapiro and Venezia (2001) analyze the
trading of 4,330 investors with accounts at an Israeli brokerage in 1994.
Objectives of the study.
The present study has the following specific objectives.
• To identify the factors which determine individual investor investment behavior.
• To know whether any psychological biases exist among Indian investors.
The present study considers eight behavioral factors suggested by various analysts. These behavioral factors are
Representativeness, Overconfidence, Gambler‟s fallacy, Availability bias, regret aversion and Mental
accounting.

The Factor Model for Determining the Individual Investment behavior in India.
www.iosrjournals.org 23 | Page
In addition to these behavioral factors generated from academic sources the following are also considered in the
study. They are contextual factors:
a. Market share and reputation of the firm. b.Accounting and financial information.
c. Publically available information through various media.
d.Recommendation by relatives, brokers, friends
e.Personal financial needs.
Therefore totally 13 factors are included in this study.
2. Method and Analysis: The study is based on primary data collected through questionnaire. The study adopted the five point
Likert scales which is ideal for survey instrument. The respondents were furnished with scenario based
questions to which they were asked to mark their response in a range from 1 ( strongly disagree) to 5 (strongly
agree).The target population for the survey was Indian individual equity investors .Data were collected through a survey of about 300 individual retail investors based in selected cities of Tamilnadu region in India. The
study was conducted during the period between October 2012 to March 2013.
Sampling Size and Procedure: In order to collect information from retail investors the sampling design
has been carefully decided and properly chosen for study. The sample size covered 300 retail investors who
were spread through different investment centers in Tamilnadu.The cities where large investors are available
were identified as investment centers for this study using purposive sampling method. Chennai, Coimbatore,
Trichy, Erode, Tiruppur, Madurai were identified as investment centres.From each identified investment center,
five approved stock brokers were chosen and ten investors were contacted with the help of each broker.
However, on scrutiny of the filled in questionnaire, it was found that 25 of them had provided incomplete
information and hence responses could not be used for further analysis. Thus, the study is based on 275 selected
respondents of retail investors. The researcher made alteration in the questions by consulting three academicians
and two industry professionals.
3. Analysis.
An analysis of the result of correlation suggests that correlation among variable are not statistically
significant enough to indicate any problem among variables themselves. Using the test suggested by Anderson
the correlation coefficient that exceeds the value of 0.8 is searched for as there may be potential problem among
variables. The coefficient table did not show any such problem. The reliability of the survey instrument was
tested with the help of Cronbach‟s Alpha method. This method allows the researcher to measure the reliability
of different categories. It consists of estimates of how much variation in scores of different variables is
attributable to chance or random errors. As a general rule, a coefficient greater than or equal to 0.5 is considered
acceptable and a good indication of construct reliability (Nunnally, 1976).The overall Cronbach‟s Alpha for
eight categories is 0.756.It shows that these categories for survey instruments are valid and reliable. This suggests that scales used in survey instruments are unidimensional.
Univariate Analysis.
The present study considers eight behavioral factors. These are: Representativeness(Kahneman and
Tversky,1973),Overconfidence (Tversky,1990;Gervais et al.,2001a,2001b) Gamblers fallacy (Kaheneman and
Tversky,1974),Anchoring bias(Gervais et al, 2001a) , Availability bias , Regret aversion , Prospect theory, and
Mental accounting
In addition to these behavioral factors generated from academic sources the following contextual factors are
also considered.
a. Market share and reputation of the firm
b. Accounting and financial information
c. Publically available information through various media d. Recommendation by the relatives, brokers, friends
e. Personal financial needs.
Therefore thirteen behavioral and contextual factors are included in the study. Investors, even professionals, fall
prey to important logical fallacies and psychological failings. Some of them are relatively new; others have been
known for decades. These psychological pressures impact the decisions of the people under conditions of
uncertainty in a very predictable manner, not only in the marketplace, but in virtually every aspect of our lives.
The bottom line is that these powerful forces lead most people to make the same mistakes time and again.
Understanding them is their best protection against stampeding with the crowd, and may help the investors to
profit from their mistakes instead.

The Factor Model for Determining the Individual Investment behavior in India.
www.iosrjournals.org 24 | Page
Heuristics is defined as the process by which people reach conclusions, usually by what they find for
themselves, from available information. This often led them to develop the thumb rules, which are not always
accurate. These heuristics cause investors commit errors in particular situations. A review of the heuristics identified as tested with the help of survey questionnaire is helpful in understanding the individual investment
behavior in Indian stock market. A total of five heuristics are considered with seven variables .The influence of
each heuristics on the investors who were surveyed is furnished below:
Influence of „Representative biases.
A Representative Heuristic It is a cognitive bias in which an individual categorizes a situation based on a pattern of previous
experiences or beliefs about the scenario. It can be useful when trying to make a quick decision but it can also
be limiting because it leads to close-mindedness such as in stereotypesIn the market, this means labeling two
companies, or two market environments, as the same when the actual resemblance is superficial. Give people a
little information and, click!, they pull out a picture they're familiar with, though it may only remotely represent the current situation. First, it may give too much emphasis to the similarities between events (or samples), but
not to the probability that they will occur Second, representativeness may reduce the importance of variables
that are critical in determining the event's probability
The analysis provides evidences both for the presence and absence of representative bias among Indian
investors. The representative bias is captured by variables V1 and V2.A large number of the respondents were
found to make investment on the performance of stock in the recent past. Nearly 53.1 % of sample investors
disagreed that they follow the performance of stock in the past. The mean is 2.567 (SD=0.857).Others stated that
they ignore the recent past performance because they felt that the past performance is not a guarantee for future
returns.
B.Influence of Overconfidence bias.
The overconfidence bias is the tendency of people to be more confident than is objectively justified by their abilities and characteristics. There is a fine line between confidence and overconfidence. Confidence
implies realistically trusting in one's abilities, while overconfidence usually implies an overly optimistic
assessment of one's knowledge or control over a situation. In terms of investing, overconfidence can be
detrimental to one‟s stock-picking ability in the long run. .This bias is construed in V3.When the surveyed
individual investors were asked whether they use their predictive skill which is presumed to have been obtained
from their experience, in order to outperform the market, a large number of investors answered in the negative.
Nearly 52.7% of the respondents answered in the negative. The mean value of this variable is 2.49(SD=
0.771).The overconfident tendency does not found to be popular among the sample investors.
C.Influence of Anchoring bias.
Similar to how a house should be built upon a good, solid foundation, investors' ideas and opinions should also be based on relevant and correct facts in order to be considered valid. However, this is not always
so. The concept of anchoring draws on the tendency to attach or "anchor" investors' thoughts to a reference
point - even though it may have no logical relevance to the decision at hand. Anchoring can also be a source of
frustration in the financial world, as investors base their decisions on irrelevant figures and statistics. This
heuristics is found significantly among individual investors. The sample investors were asked whether trading
was influenced by recent experiences about price in the market, and whether they use purchase price of stocks as
a reference point while making trading decisions. Results indicate that they were likely to be influenced by their
recent experiences.. The trading decision of about 55.6% sample investors is well influenced by their
experiences in the recent past. On the other hand nearly 50.91% of respondents were suffering from anchoring
bias as they used their purchase price as a reference point for their trading decisions.
d.Gamblers Fallacy. A gambler's fallacy is a heuristic in which a person thinks the probability of an outcome has changed,
when in reality, it has stayed the same. In the gambler's fallacy, an individual erroneously believes that the onset
of a certain random event is less likely to happen following an event or a series of events. This line of thinking is
incorrect because past events do not change the probability that certain events will occur in the future. It is not
hard to imagine that under certain circumstances, investors or traders can easily fall prey to the gambler's
fallacy. For example, some investors believe that they should liquidate a position after it has gone up in a series
of subsequent trading sessions because they don't believe that the position is likely to continue going up.
Conversely, other investors might hold on to a stock that has fallen in multiple sessions because they view
further declines as "improbable". Just because a stock has gone up on six consecutive trading sessions does not
mean that it is less likely to go up on during the next session. In the present study this heuristics is reflected by

The Factor Model for Determining the Individual Investment behavior in India.
www.iosrjournals.org 25 | Page
variable V6.The respondents were asked whether they should be able to anticipate the end of good or poor
returns at the stock market. This question was specially referring to the anticipation of market returns. This
variable assumed a mean of 2.63 (SD=0.725) .The score shown in the univariate statistics indicates these investors are at least likely to anticipate about stock market returns. The frequency statistics also show that
51.64 % were of the view that they could successfully anticipate market returns whether it would be good or
poor at the market index. This indicates that the Indian investors are influenced by gambler‟s fallacy.
e.Availability Bias.
The availability heuristic is a mental shortcut that occurs when people make judgments about the
probability of events by how easy it is to think of examples. The availability heuristic operates on the notion
that, "if you can think of it, it must be important." The availability of consequences associated with an action is
positively related to perceptions of the magnitude of the consequences of that action. In other words, the easier it
is to recall the consequences of something, the greater we perceive these consequences to be. But the
frequencies that events come to mind are usually not accurate reflections of their actual probability in real life. Investors are more likely to act on this readily available information. Growth stock is a very hot story and
everyone likes a stock a stock that goes up very fast. Individuals as well as Institutional investors fall prey to this
availability heuristics, start believing in the growth story and chase growth stocks. This availability heuristics
comes into play while individuals taking trading decisions in the markets. Survey results show that sample
investors do not hold it good for their investment decision-making. The above-average-score of this factor
shows that they are likely to be swayed away by media reports and join the bandwagon. And frequency statistics
also support this finding that about 57.7 per cent of individual investors did not seem to be taking their
investment/trading decisions on the basis of the readily available information about their choices. This figure
leads us to believe that majority of sample investors are not swayed away by the vividly publicized information
about any stock and choose to buy that stock above those with less media attention.
f.Influence of Mental accounting. Mental accounting refers to the tendency for people to separate their money into separate accounts
based on a variety of subjective criteria like the source of money and intent for each account. According to this
heuristics, individuals assign different functions to each asset group, which has an often irrational and
detrimental effect on their investment decisions. The variable V12 captures the influence of mental accounting
bias. The sample investors were asked whether they would treat it as overall loss if two out of ten stocks in
their investment portfolio are reduced in their investment value significantly .The mean score of this variable is
2.80(SD=0.603) indicates that individual investors seem to taking the losses separately, not as overall loss on the
entire portfolio. Most of the sample investors consider loss on stocks separately rather calculating it as loss of
the portfolio. About 71.9 % of sample investors believe that if any stock in their portfolio has depreciated in its
value, their loss must be attributed to that asset only and it cannot be adjusted against the value of the entire
portfolio. The data from this survey provides strong evidence for mentalaccounting effect on Indian individual investors. Lack of proper awareness and access to right source of information make them more conservative and
hence they get influenced by mental accounting error.
g.Prospect Theory.
Kahneman and Tversky (1979) contented that people values gains and losses differently, and as such,
will base decisions on the perceived gains rather than perceived losses. According to this theory, losses have
more emotional impact than an equivalent amount of gains. During the survey the sample investors were asked
whether they decide their buying on the basis of perceived gains rather than perceived losses. The frequency
analysis showed nearly 53.4% of the respondents expressed that take only the overall gain but combination of
gains and losses. The results indicate that the Indian investors are influenced by Prospect theory.
h.Testing of “Regret Aversion Bias” influence. According prospect theory, losses are three times painful than the pleasure of gain. The reason is
people hate regret and losses produce regret. Often, people weigh only negatives in order to protect themselves
against future losses and subsequent regret. Hence the potential of regret influence their decision making. This
behavior tendency is reflected in the variables V11 and V12.The V11 violate the individual investors‟ tendency
to delay in selling stocks that have decreased in their value. The mean for this variable is 2.93 (with
SD=0.712).Most of the investors, nearly 71.3 % of the surveyed nesters showed the tendency of delaying the
selling of stocks. They believe the prices to recover and delay the selling of such stocks till the prices bounce
back to their reference point. This view is supported by the data on variable V12 (Mean 2.83, SD=0.804). This
variable traduces investors „tendency to book profits on the stocks that have increased in value even if the
prospect of gaining in near future is significant.

The Factor Model for Determining the Individual Investment behavior in India.
www.iosrjournals.org 26 | Page
Multivariate analysis of Indian individual investment behavior. The principal component analysis approach suggests that the number of components extracted is equal
to number of variables analyzed , necessitating that it is to be decided just how many of these components are truly meaningful and worthy of being retained for rotation and interpretation. In general the first the first few
components will account for meaningful amounts of variance and that later components will tend to account for
only trivial variance. The next step of analysis is therefore, to determine how many meaningful components
should be retained for interpretation. The following three criterions are generally used for the purpose:
a. Eigen value-one criterion
b. the Scree test
c. the proportion of variance accounted for.
The Eigen value-one criterion, which is also known as Kaiser criterion is one of the most commonly
used criterion to retain the number of components for rotation and interpretation. Secondly, with Scree test, the
Eigen values associated with each component are plotted in a graph and observed for a „break‟ between
components with relatively large Eigen values and those with small Eigen values. The components that appear before the break are assumed to be meaningful and retained for interpretation. According to the third criterion,
the components that account for a specified proportion of variance in the data set.
On the basis of the criteria mentioned above, the component matrix is formed for further orthogonal
rotation using varimax rotation algorithm which is standard rotation method. The multivariate analysis extracts
obviously 18 behavioral components, but only six components were judged sufficient to explain the significant
data variance and also qualified the above mentioned criteria for solving the number of components to be
retained problem. In fact, all the six components so selected seem to explain 61% of total variance and the
remaining variance is explained by other variables as given below.
S.No Components Eigen Value % of Variance
Explained
Cumulative
variance
1 Component1 3.907 21.706 21.706
2 Component2 2.029 11.272 32.977
3 Component3 1.922 10.681 43.658
4. Component4 1.240 6.890 50.548
5 Component5 1.215 6.748 57.296
6 Component6 1.053 5.849 63.145
Each of the principal components selected for rotation and interpretation are given suitable label based on
statement loaded under each component. Rotation maximizes the loadings of each variable on one of the
extracted factors while minimizing the loading on all other factors. To interpret and to give a title to each
behavioral factor, initial variables were examined carefully along with their respective correlations with
concerned factors. Then only common interpretation of the components could be carried on.
The Behavioral Factors Defined.
According to the extracted coefficients, those six pertinent behavioral components were named as
follows: Conservatism, Diligent and Discreet, Remorse Abhorrence, Cognition, Prudence and Precaution, under
confidence. Following are the detailed analysis for each of the six components extracted from the principal
component analysis.
1. Conservatism
According to the multivariate analysis results, the sample investors seem to be conservative
rather than adoptive. This behavioral component accounts for about 21.706% of data variance explained .The
rotation sums of squared loadings show that this component accounts for about 21.45% of data variance after
orthogonal rotation of component matrix. Hence this is the most influential factor in case of individual investment behavior in the stock market. The underlying variables signify the investor behavior tendency to
look into all publically available information through different media. Investors are more amenable to the
recommendations and suggestions of the acquaintances. One of the factors which affect them is their personal
financial needs. Therefore Indian individual investors seem to be significantly influenced by conservatism
psychological bias.
2. Diligent and Discreet.
The second component is diligent and discreet. It is related to anchoring and accounts. This component
accounts for 11.272% of data variance. After rotation sums of squared loadings it accounts for 10.151% of
variation in data. Each variable included under this factor is associated with a different kind of behavioral
attitude. The variables underline calculated trading decision .Their decisions are found to be based upon the accounting information of the company. Indian individual investors‟ trade behavior, it seems, is based on trend
The Factor Model for Determining the Individual Investment behavior in India.
www.iosrjournals.org 27 | Page
analysis. Their trading decision depends upon recent experiences about prices in the market. This diligent
attitude shown by the surveyed investors may be justified by anchoring their decisions on the basis of their
recent experience about prices in the market and their inquisitiveness to look into the accounting information.
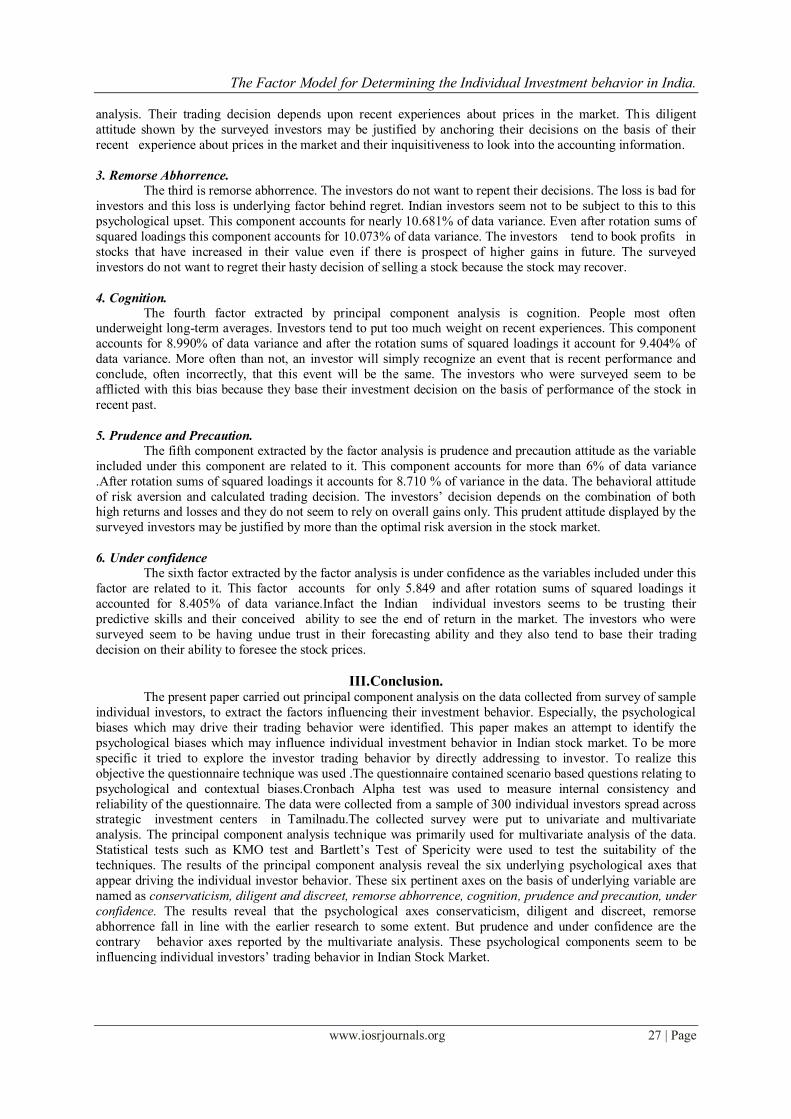
3. Remorse Abhorrence.
The third is remorse abhorrence. The investors do not want to repent their decisions. The loss is bad for
investors and this loss is underlying factor behind regret. Indian investors seem not to be subject to this to this
psychological upset. This component accounts for nearly 10.681% of data variance. Even after rotation sums of
squared loadings this component accounts for 10.073% of data variance. The investors tend to book profits in
stocks that have increased in their value even if there is prospect of higher gains in future. The surveyed
investors do not want to regret their hasty decision of selling a stock because the stock may recover.
4. Cognition.
The fourth factor extracted by principal component analysis is cognition. People most often underweight long-term averages. Investors tend to put too much weight on recent experiences. This component
accounts for 8.990% of data variance and after the rotation sums of squared loadings it account for 9.404% of
data variance. More often than not, an investor will simply recognize an event that is recent performance and
conclude, often incorrectly, that this event will be the same. The investors who were surveyed seem to be
afflicted with this bias because they base their investment decision on the basis of performance of the stock in
recent past.
5. Prudence and Precaution.
The fifth component extracted by the factor analysis is prudence and precaution attitude as the variable
included under this component are related to it. This component accounts for more than 6% of data variance
.After rotation sums of squared loadings it accounts for 8.710 % of variance in the data. The behavioral attitude
of risk aversion and calculated trading decision. The investors‟ decision depends on the combination of both high returns and losses and they do not seem to rely on overall gains only. This prudent attitude displayed by the
surveyed investors may be justified by more than the optimal risk aversion in the stock market.
6. Under confidence
The sixth factor extracted by the factor analysis is under confidence as the variables included under this
factor are related to it. This factor accounts for only 5.849 and after rotation sums of squared loadings it
accounted for 8.405% of data variance.Infact the Indian individual investors seems to be trusting their
predictive skills and their conceived ability to see the end of return in the market. The investors who were
surveyed seem to be having undue trust in their forecasting ability and they also tend to base their trading
decision on their ability to foresee the stock prices.
III.Conclusion. The present paper carried out principal component analysis on the data collected from survey of sample
individual investors, to extract the factors influencing their investment behavior. Especially, the psychological
biases which may drive their trading behavior were identified. This paper makes an attempt to identify the
psychological biases which may influence individual investment behavior in Indian stock market. To be more
specific it tried to explore the investor trading behavior by directly addressing to investor. To realize this
objective the questionnaire technique was used .The questionnaire contained scenario based questions relating to
psychological and contextual biases.Cronbach Alpha test was used to measure internal consistency and
reliability of the questionnaire. The data were collected from a sample of 300 individual investors spread across strategic investment centers in Tamilnadu.The collected survey were put to univariate and multivariate
analysis. The principal component analysis technique was primarily used for multivariate analysis of the data.
Statistical tests such as KMO test and Bartlett‟s Test of Spericity were used to test the suitability of the
techniques. The results of the principal component analysis reveal the six underlying psychological axes that
appear driving the individual investor behavior. These six pertinent axes on the basis of underlying variable are
named as conservaticism, diligent and discreet, remorse abhorrence, cognition, prudence and precaution, under
confidence. The results reveal that the psychological axes conservaticism, diligent and discreet, remorse
abhorrence fall in line with the earlier research to some extent. But prudence and under confidence are the
contrary behavior axes reported by the multivariate analysis. These psychological components seem to be
influencing individual investors‟ trading behavior in Indian Stock Market.

The Factor Model for Determining the Individual Investment behavior in India.
www.iosrjournals.org 28 | Page
References [1]. Odeon. , “Do Investors Trade too much?” American Economic Review, 89:1279-1298. (1999).
[2]. Choe, Hyuk, Bong-Chan Kho, and Rene M. Stulz, „Do foreign investors destabilize stock returns: Theory and Evidence, Journal of
Financial Economics, 72, 485-518. (1999),
[3]. Barber, Brad M., and Terrance Odeon, “Trading is hazardous to your wealth: The common stock investment performance of
individual investors”, Journal of Finance 55, 773-806. (2000)
[4]. Barber, Brad M. and Terrance Odeon, “Boys will be Boys: Gender, Overconfidence, and Common Stock Investment”, Quarterly
Journal of Economics, Vol.116, 261-292. (2001),
[5]. Barber, Brad M., Yi-Tsung Lee, Yu-Jane Liu, and Terrance Odeon, Who loses from trade? Evidence from Taiwan, University of
California, Davis working paper. (2005)
[6]. Grinblatt, Mark, and Matti Keloharju, “The investment behavior and performance of various investor types: A study of Frequency,
and Home Bias” Management Science 55:1094-1106, (2000)
[7]. Coval, J.D., D.A. Hirshleifer, and T. Shumway , “Can Individual Investors Beat the Market” Working paper, Harvard
University(2005),
[8]. Goetzmann, W. and A. Kumar, “Equity Portfolio Diversification,” Review of Finance 12:433-463. (2008)
[9]. Griffin, John M., Jeffery H. Harris, and SelimTopaloglu, The dynamics of institutional and individual trading, Journal of Finance, 58,
2285-2320(2003)
[10]. Jackson, Andrew (2003),”The aggregate behavior of individual investors”, London Business School Working paper. (2003).
[11]. Andrade, Sandro C., Charles Chang, and Mark S. Seasholes, „Trading shocks, assets prices, and the limits of arbitrage”, University of
California, Berkeley working paper. (2005)
[12]. Barber, Brad M., Yi-Tsung Lee, Yu-Jane Liu, and Terrance Odeon, Who loses from trade? Evidence from Taiwan, University of
California, Davis working paper. (2005)
[13]. Barber, B.M., T. Odeon, and N. Zhu, “Do Retail Trades Move Markets? “Review of Financial Studies 22:151-186. (2009).
[14]. Hvidkjaer, Soeren,”Small Trade and the Cross-section of Returns”, Working paper, University of Maryland. (2005).
[15]. Richards, Anthony, “Big fish in small ponds: The trading behavior of foreign investors in Asian emerging equity markets”, Journal of
Financial and Quantitative Analysis, 40, 1-27. [26](2005).
[16]. San, Granit, “Who gains more by trading – individuals or institutions?” Working paper, Tel Aviv University.(2005)
[17]. Nagy, R. A. and R. W. Obenberger, “Factors Influencing Investors Behavior”, Financial Analyst Journal, Vol. 50, pp. 63-68. (1994).
[18]. Epstein, M.J. “Social Disclosure and the Individual Investor”, Accounting, Auditing and Accountability Journal, Vol.4, pp. 94 -109.
(1994)
[19]. Krishnan, R. and D. M. Brooker, “Investors Use of Analysts‟ Recommendations”, Behavioral Research in Accounting, Vol. 14, pp.
129-158. (2002),
[20]. Merikas, A. and D. Prasad, “Factors Influencing Greek Investor Behavior on the Athens Stock Exchange”, paper presented at the
Annual Meeting of the Academy of Financial Services, Denver (Colorado, USA), October (2003).
[21]. Fisher, Kenneth L., and Meir Statman, “Investor Sentiment and Stock returns”, Association for Investment Management and
Research, pp. 16-23. (2000)
[22]. Malmendier, Ulrike, and D. Shanthikumar, “Are Small Investors Naïve?” Stanford University Working Paper. (2003)
[23]. Hodge, F. D., “Investors‟ Perceptions of Earnings Quality, Auditor Independence, and the Usefulness of Audited Financial
Information”, Accounting Horizons, Vol. 17, pp. 37-48. (2003)
[24]. Korniotis, G.M. and A. Kumar, “Do Older Investors Make Better Investment Decisions? “Review of Economics and Statistics
93:244-265. (2009)
[25]. Benos, A.V. “Overconfident Speculators in Call Markets: Trade Patterns and Survival,” Journal of Financial Markets 1:353 -
383.:199-225. (1998)
[26]. Caballe, J. and J. Sakovic, Speculating Against an Overconfident Market,” Journal of Financial Markets, 6(2), 199-225(2003)
[27]. Daniel, K., D. Hirshleifer, and A. Subramanian, “Investor Psychology and Security Market Under - and Overreactions,” Journal of
Finance 53:1893-1885. (1998),
[28]. Gervais, S. and T. Odeon (2001),” Learning to Be Overconfident” .Review of Financial Studies 14:1-27. (2001)
[29]. Hong, H., J. Scheinkman, and W. Xiong, “Advisers and Asset Prices: A Model of the Origins of Bubbles,” Journal of Financial
Economics 89:268-287. (2008)
[30]. Kyle, A.S. and F.A. Wang, “Speculation Duopoly with Agreement to Disagree: Can Overconfidence Survive the Market Test?"
Journal of Finance 52:2073-2090. (1997)
[31]. Odeon, Terrance, “Are investors reluctant to realize their losses?” Journal of Finance, 53, 1775-1798. (1998)
[32]. Peng.L.and W.Xiong,”Investor Attention, Overreaction and Category Learning”. Journal of Financial Economics.60:503-602. (2006).
[33]. Scheinkman, J. and W. Xiong, “Overconfidence and Speculative Bubbles,“Journal of Political Economy 111:1183- 1219(2003).
[34]. Wang, F.A., “Overconfidence, Investor Sentiment, and Evolution,” Journal of Financial Intermediation 10:138-1 (2001).
[35]. Dorn, D. and G. Huberman,“Talk and Action: What Individual Investors Say and What They Do,” Review of Finance 9:437-
481.(2005)
[36]. Graham, J.R., C.R. Harvey, and H. Huang, “Investor Competence, Trading Frequency, and Home Bias” Management Science
55:1094-1106. (2009)
[37]. Nunnally, C. J., Psychometric Theory, McGraw Hill New York. (1978).
[38]. Kehneman, Denial and Amos Tversky,” Availability: A Heuristics for Judging Frequency and Probability”, Cognitive Psychology, 5,
207-232. (1973).
[39]. Gervais, S. and T. Odeon (2001),” Learning to Be Overconfident” .Review of Financial Studies 14:1-27. (2001)
[40]. Kanhneman, Daniel and Amos Tversky,” Prospect Theory: An Analysis of Decision under Risk”, Econometrica, 47(2)263-291
(1979).

The Factor Model for Determining the Individual Investment behavior in India.
www.iosrjournals.org 29 | Page
V1 V2 V3 V4 V5 V6 V7 V8 V9 V10 V11 V12 V13 V14 V15 V16 V17 V18
V1 1 0.623329 -0.04586 -0.08645 -0.13128 -0.04419 0.022725 0.007582 -0.21572 0.161457 0.018006 -0.0064 -0.09648 0.144434 -0.25015 0.064809 0.073849 0.012271
V2 1 -0.03802 0.067579 -0.01097 -0.02138 0.122683 -0.05984 -0.12338 0.11303 0.12251 -0.02602 -0.11338 0.069594 -0.08856 0.081796 0.046465 0.123406
V3 1 0.212547 0.069438 0.366549 0.072213 -0.04337 0.084534 0.021919 -0.03444 -0.07141 -0.07644 0.14354 0.013714 0.153031 0.036429 0.093009
V4 1 0.150094 0.1168 0.267326 0.040201 0.061357 0.221716 0.187947 -0.1348 0.106901 0.343626 0.305783 0.327386 0.185644 0.419784
V5 1 0.104015 0.047987 -0.0038 0.046862 0.092025 0.155039 -0.19223 0.027409 0.211993 0.053823 0.06626 0.094505 0.237637
V6 1 0.051336 -0.14339 0.084787 0.067722 -0.10017 -0.12756 0.112862 0.146603 -0.02783 0.192624 -0.08312 -0.05206
V7 1 0.039531 -0.08608 0.218443 0.223323 -0.13644 0.035049 0.396976 0.117165 0.285546 0.400571 0.41472
V8 1 -0.12275 0.033898 0.425577 0.255974 0.241469 0.086687 0.080591 0.114921 0.17097 0.228299
V9 1 -0.27333 0.01152 -0.00393 0.027948 -0.08554 0.226072 0.111953 -0.04884 0.062326
V10 1 0.253571 -0.12906 0.104411 0.511532 -0.08556 0.272449 0.253454 0.311027
V11 1 0.217239 0.348321 0.300933 0.194096 0.325796 0.364342 0.563818
V12 1 0.187648 -0.12499 0.077228 -0.13355 -0.11568 0.002295
V13 1 0.111305 0.067618 0.346207 0.247249 0.290163
V15 1 0.064008 0.417498 0.358239 0.518379
V16 1 0.079707 0.079982 0.231806
V17 1 0.566083 0.505393
V18 1 0.559649
1
Table.1.Summary Statistics of Survey Respondents.
Table.2.Correlation Matrix.
Determinant = 0.007
Table .3.Descriptive Statistics.
Variables
Mean
Standard
Deviation
Valid
Percentages
Valid percentage Analysis
N
Agree Do not agree
V1
V2
V3
V4
VS
V6
V7
V8
V9
V10
2.567
2.629
2.491
2.681
2.556
2.556
2.400
2.771
2.513
2.784
0,857
0.824
0.771
0.943
0.797
0.824
0.904
0.731
0.686
0.835
46.9
50.9
47.3
55.6
50.9
51.6
42.45
66.5
52.4
64.6
53.1
49.1
52.7
44.4
49.1
48.4
57.5
33.5
47.6
35.4
275
275
275
275
275
275
275
275
275
275
Summary Statistics - Demographic Variables (Total 275)
Age Group Count % Mean
< 25
25-35
35-45
45-55
>55
13
75
108
58
21
4.733
27.273
39.273
21.091
7.636
36.48
Income group( in Indian
INR)
1059713
< 5lakhs
5-10lakhs
10-15 lakhs
15-20 lakhs
>20 lakhs
32
103
70
54
16
11.636
37.455
25.455
19.636
5.818
Investment Group(in INR) 457605
<1 lakh
1-3 lakhs
3-5 lakhs
5-7 lakhs
>7 lakhs
32
87
98
46
12
11.636
31.633
35.636
16.727
4.364
Education
Schooling
Non-Graduates
Graduates
PG
Others
16
56
79
36
88
5.818
20.364
28.727
13.091
4.364
Gender
Male
Female
238
37
86.545
13.455

The Factor Model for Determining the Individual Investment behavior in India.
www.iosrjournals.org 30 | Page
V11
V12
V13
V14
V15
V16
V17
V18
2.898
2.800
2.866
2.287
2.255
2.807
2.909
2.949
0.799
0.837
0.924
0.989
0.616
1.037
0.821
0.836
71.3
66.2
70.9
40.4
31.6
64.7
70.2
69.1
28.7
33.8
29.1
59.6
68.4
35.3
29.8
30.9
275
275
275
275
275
275
275
275
Method: Principal Component Analysis.
Table.4.Kaiser-Meyer Olkin and Bartlett’s test
Table.5.Total Variance Explained
KMO and Bartlett's Test
Kaiser-Meyer-Olkin Measure of Sampling Adequacy. .721
Bartlett's Test of Sphericity Approx. Chi-Square 1308.983
df 153
Sig. .000
\
Initial Eigen Values
Extraction Sums of Squared
Loadings
Rotation Sums of Squared Loadings
Total % of
Variance
Cumulative
%
Total % of
Variance
Cumulative
%
Total % of
Variance
Cumulative
%
1
2
3
4
5
6
7
8
9
10
11
12
13
14
15
16
17
18
3.907
2.029
1.922
1.240
1.215
1.053
0.989
0.847
0.720
0.710
0.608
0.564
0.502
0.435
0.373
0.330
0.299
0.256
21.706
11.272
10.681
6.890
6.748
5.849
5.493
4.707
4.000
3.947
3.378
3.135
2.784
2.418
2.072
1.833
1.660
1.424
21.706
32.977
43.658
50.548
57.296
63.145
68.638
73.345
77.345
81.292
84.670
87.805
90.593
93.012
95.083
96.916
98.576
100.00
3.907
2.029
1.922
1.240
1.215
1.053
21.706
11.272
10.681
6.890
6.748
5.849
21.706
32.973
43.658
50.548
57.296
63.145
2.952
1.827
1.813
1.693
1.568
1.573
16.401
10.151
10.073
9.404
8.710
8.405
16.401
26.553
36.626
46.030
54.740
63.145

The Factor Model for Determining the Individual Investment behavior in India.
www.iosrjournals.org 31 | Page
Table.6.Component Matrix. Variable Components
1 2 3 4 5 6
V1
-0.777
V2 -0.661
0.529
V3 0.517
V4 0.538
V5
V6 0.570
V7 0.559
V8 -0.570
V9 0.500
V10 0.520
V11 0.640
V12 -0.594
0.517
V13
V14 0.708
V15 0.515
V16 0.713
V17 0.697
Extraction Method: Principal Component Analysis a.6components extracted.
Table.7.Rotated Component Matrix.
Variable
Components
1 2 3 4 5 6
V1
0.844
V2 0.890
V3 0.730
V4 0.645
V5
V6 0.836
V7
V8 0.709
V9 -0.754
V10 0.663
V11 0.612
V12 0.740

The Factor Model for Determining the Individual Investment behavior in India.
www.iosrjournals.org 32 | Page
V13
V14
V15 0.607
V16 0.822
V17 0.818
V18 0.668
a.Extraction Method: Principal Component Analysis. b. Rotation Method: Varimax with Kaiser Normalization.
Table.8.Component Transformation Matrix Variable 1 2 3 4 5 6
1 0.816 -0.459 0.235 o0.088 0.214 0.122
2 -0.002 0.220 0.326 -0.734 -0.551 .050
3 -0.005 0.281 -0.733 -0.161 -0.054 0.595
4 0.048 -0.545 0.358 -0.176 0.289 0.677
5 -0.029 0.032 0.215 0.624 -0.653 0.358
6 -0.576 0.602 0.356 0.084 0.360 0.204
Extraction Method: Principal Component Analysis.
Rotation Method: Varimax with Kaiser Normalization.
Table Captions:
Table1.Summary Statistics of Survey Respondents.
Table.2.Correlation Matrix
Table.3. Descriptive Statistics
Figure.1.Scree diagram
Table.4.KMO and Bartlett’s test
Table.5.Total Variance Explained
Table.6Component Matrix
Table.7.Rotated Component Matrix
Table.8.Component Transformation Matrix.