Embed Size (px)
Citation preview

The EY FinancialServices Index3rd quarter 2015

– All Rights Reserved – Financial Services Index 3Q 2015 | 1
Table of contents
Executive Summary 2
The EY Financial Sector Confidence Index slows in linewith weak GDP growth 3
Survey data 4
Retail banking confidence slows on weak growth andrising credit losses 5
Investment bank confidence rises despite weaker flowsand slower profits growth 9
Asset management confidence is knocked by global andlocal drivers 12
Life insurance confidence slips despite stronger profits 19
Technical note 23

– All Rights Reserved – Financial Services Index 3Q 2015 | 2
Executive Summary
The EY Financial Services Confidence Index slows in line with weak GDPgrowth• The EY FSI declined from 77 in the second quarter to 66 in the third quarter of 2015.
• A decline could be attributed to decreases in retail banking, asset management and life insurance confidence, whichcould not be countered by the increase in investment banking confidence.
Retail banking confidence slows on weak growth and rising credit losses• Although income growth remained relatively strong in 15Q3, profits growth remained weak.
• Net interest income growth remained stable, but non-interest income weakened.
• South Africa’s deteriorating economic outlook made banks more risk averse, taking a defensive position to minimisefuture credit losses.
• Operating expenses growth slowed, but remains nevertheless high.
Investment bank confidence rises despite weaker flows and slower profits• Business activity retreated across all but one business line (Treasury & Specialised Finance).
• As a result, fee income dropped markedly.
• Investment banks reigned in costs, to some extent supported by a lower head count.
• Net profits growth slowed noticeably, on the back of weaker income growth.
• In comparison with long term averages, investment banks continue applying easy credit standards, albeit tighter than15Q2.
Asset management confidence is knocked by global and local drivers• Confidence was knocked by volatile markets.
• Net inflows slowed further due to dropping institutional and private client flows and sustained weak unit trust flows.
• Weaker net inflows and especially the fall in share prices knocked the growth in total income.
• Despite strong cost containment, weaker income knocked profits, which fell at their strongest pace since the GFC.
Life insurance confidence slips despite stronger profits• Confidence was weaker in 15Q3, despite a strong recovery in premium and profits growth.
• Total premiums growth turned positive in 15Q3, driven by risk business.
• Investment premium growth deteriorated further.
• Investment income growth continued at a modest pace.
• Administration and marketing expenses continued rising, despite a lower headcount.

– All Rights Reserved – Financial Services Index 3Q 2015 | 3
The EY Financial Services confidence index slows inline with weak GDP growthThe EY Financial Sector Confidence Index (EY FSI) declined from 77 in the second quarter to 66 in the third quarter of20151,2. Given the historical average of 76, the latest reading indicates that overall financial sector confidence has declinedfrom a neutral to a relatively low level.
The percentage of respondents answering “satisfied” to the question “Are prevailing business conditions satisfactory orunsatisfactory?” is taken as the indicator of financial sector confidence.
The EY FSI reflects the unweighted average confidence of four segments of the financial sector, namely:
• retail banking,
• investment banking,
• asset management, and
• life insurance.
The third quarter decline in the EY FSI could be attributed to decreases in retail banking (from 67 to 54), assetmanagement (from 74 to 37) and life insurance confidence (from 93 to 80), which could not be countered by the increasein investment banking confidence (from 75 to 92).
1 During the third quarter of 2015, respondents were asked to provide their views on the estimated developments for the period July to
September 2015 and their expectations for the period October to December 2015. To improve the readability of the report, we refer tothe first period as “estimation of the third quarter of 2015” (15Q3) and the second period as “expectations for the fourth quarter of2015” (15Q4).2
The Bureau for Economic Research (BER) at Stellenbosch University conducted the survey and processed the results on behalf of EY.The survey was conducted between 27 August and 16 September 2015. The results were processed on 17 September 2015. The numberof responses processed was: retail banks (16), investment banks (8), asset managers (20) and life insurers (12).
30
40
50
60
70
80
90
100
02 03 04 05 06 07 08 09 10 11 12 13 14 15
EY Finan Sector Confidence Index% rating bus conditions satisfactory
Long term average 20
40
60
80
100
02 03 04 05 06 07 08 09 10 11 12 13 14 15Retail B Invest B Asset Man Life Ins
Business confidence% rating bus cond satisfactory
Long term average

– All Rights Reserved – Financial Services Index 3Q 2015 | 4
Survey dataSurvey data:
Businessconfidence *
Retail banking Investmentbanking andspecialised
finance
Assetmanagement
Life insurance EY FinancialSector
ConfidenceIndex **
06Q1 100 100 99 94 9806Q2 100 100 100 97 9906Q3 100 100 100 98 10006Q4 100 100 100 100 10007Q1 100 100 100 83 9607Q2 100 100 98 90 9707Q3 94 100 99 100 9807Q4 96 100 97 100 9808Q1 78 79 77 100 8408Q2 57 79 81 63 7008Q3 43 81 57 51 5808Q4 53 46 42 48 4709Q1 32 31 45 50 4009Q2 28 50 60 53 4809Q3 25 57 83 58 5609Q4 26 42 99 71 6010Q1 35 62 97 77 6810Q2 40 25 75 91 5810Q3 62 33 71 83 6210Q4 38 41 89 79 6211Q1 20 55 85 90 6311Q2 50 67 77 90 7111Q3 38 36 71 91 5911Q4 50 50 59 93 6312Q1 87 91 56 93 8212Q2 69 86 59 81 7412Q3 88 82 81 75 8412Q4 88 79 84 93 8613Q1 80 83## 83 95 8513Q2 46 78 85 83 7313Q3 25 93 92 67 6913Q4 30## 82## 96 80 7214Q1 38 73 77 79 6714Q2 46 69 66 64 6114Q3 50 64 52 67 5814Q4 60## 89## 33 81 6615Q1 74 82 45 92 7315Q2 67 75 74 93 7715Q3 54 92 37 80 66
* Percentage of respondents rating prevailing business conditions as satisfactory. 0 = extreme lack of confidence, 100 = extremeconfidence** The EY Financial Sector Confidence Index is calculated as the un-weighted arithmetic mean of the business confidence indices ofretail banks, investment banks, asset managers and life insurers. The average for the period 2002 – 2013 is 77; a reading above 77therefore indicates a relatively “high” confidence level and below 77 a relatively “low” confidence level.# A reliable result could not be calculated, as too few completed questionnaires were received by the cut-off date.## Lower than normal number of responses
The historical survey data can be downloaded in MS Excel format on www.ber.ac.zaClick the button named “Surveys” on the top banner and then select “Financial Services” on the banner along the left hand side.

– All Rights Reserved – Financial Services Index 3Q 2015 | 5
Retail banking confidence declines on the back ofweak growth and rising credit lossesThe third quarter proved to be another difficult one for the South African economy. Data shows that growth turnednegative in the 2nd quarter of the year, with emerging markets across the globe facing renewed pressure on the back of asharply weakening Chinese economy in the third quarter. Equity markets, commodity prices, currencies and bond marketsall experienced hikes in volatility, with emerging market currencies falling sharply, following weaker commodity prices.South Africa felt the impact of these difficulties.
The EY Financial Services index indicates that retail banking confidence is currently in line with long term average levels. Itis neither particularly strong, nor weak. After falling to a low of 25 in 3Q13, retail banking confidence recovered to a highof 74 in 1Q15. Since then, confidence levels dropped to 67 in 2Q15 and still further to 54 in 3Q15. The decline inconfidence can largely be attributed to the country’s weak growth prospects. The deteriorating economic outlook hasheightened risk aversion, making banks more risk averse and taking a defensive position in light of rising credit losses.
Although income expanded at a steady pace, in line with 2Q15 levels, retail banks expect this to slow noticeably in Q415.The steady growth in income growth in 3Q15 stemmed from stable net interest income. In contrast, non-interest incomegrowth slowed, as lower transaction volumes resulted in slower fee income growth.
Growth in operating expenses slowed, and retail banks expect to keep costs contained in 4Q15. To some extent, slowercost growth will result from a shrinking headcount, with 3Q15 seeing a noticeable decline in employee numbers.
After unexpectedly falling sharply in 1Q15, credit losses resumed in 2Q15 and in 3Q15 the pace picked up, in line with2013 and 2014 levels.
The deteriorating economic outlook and the resurgence of credit losses prompted retail banks to further tighten creditstandards. Banks tightened their credit standards for both firms and households, but more drastically for households. Thismay well have been due to some extent, to the tighter affordability criteria following amendments to National CreditRegulations.

– All Rights Reserved – Financial Services Index 3Q 2015 | 6
Survey data: Retail Banking 12014 2015Q1 Q2 Q3 Q4## Q1 Q2 Q3 Q4*
1 Business confidence 2 38 46 50 60 74 67 54
2. Income
a) total income 3, 4 23 39 50 80 69 71 67 29
b) net interest income 3, 5 39 61 75 90 82 72 65
c) fee income 3, 6 15 23 25 50 55 26 -6
d) investment income 3, 7 0 30 50 60 36 25 -8
3. Expenditure
a) total operating expenses (excluding cost offunding) 3, 4
73 42 42 80 100 90 83 83
b) credit losses 3, 8 62 39 25 30 -46 5 45
c) total number of people employed 3 -15 15 8 0 0 30 -5
4. Efficiency and profitability
a) cost-to-income ratio 3 15 -8 -25 10 9 0 0
b) net profit after tax 3 54 84 83 70 55 10 11
5. Credit standards for approving applications for loans3, 9
a) total 3, 4 23 8 17 30 -16 17 46 57
b) households 3 42 15 33 25 0 19 61
c) firms 3 10 0 17 30 20 6 20
Expected## Lower than normal number of responses.1 Retail banking consists of regular retail banking, private banking, micro lending, commercial banking and corporate banking.2 % satisfactory3 Net balance (see Technical Note at the end of the report)4 The total reflects the responses of participants. It is therefore not calculated as the average of the responses to the components.Each data series has to be considered on its own. Deviations between the total and components occur when participants reply “the same”given that the net balance statistic does not take “the same” responses into account. The fact that respondents only answer questionsapplicable to them and that missing items are not imputed also have an effect.5 Interest income less interest expenses6 Fees and commission7 “Investment income” refers to all income from investments and not the investment return. It excludes deferred income andcapital depreciation, but includes realised and unrealised capital gains and losses on investments.8 Value of non-performing loans until 09Q29 Credit standards refer to the terms of the loans and credit lines, such as maximum size, spread of loan rates over bank’s cost offunds, premiums charged on riskier loans, collateral requirements etc.

– All Rights Reserved – Financial Services Index 3Q 2015 | 7
20
40
60
80
100
12Q1 12Q3 13Q1 13Q3 14Q1 14Q3 15Q1 15Q3
Total incomeNet balance: % up less % down
Expected
20
30
40
50
60
70
80
90
12Q1 12Q3 13Q1 13Q3 14Q1 14Q3 15Q1 15Q3
Net interest incomeNet balance: % up less % down
-20
0
20
40
60
80
12Q1 12Q3 13Q1 13Q3 14Q1 14Q3 15Q1 15Q3
Fee incomeNet balance: % up less % down
-60
-40
-20
0
20
40
60
12Q1 12Q3 13Q1 13Q3 14Q1 14Q3 15Q1 15Q3
Investment incomeNet balance: % up less % down
40
50
60
70
80
90
100
12Q1 12Q3 13Q1 13Q3 14Q1 14Q3 15Q1 15Q3
Total operating expenses (excl cost offunds), net balance: % up less % down
Expected
-80
-60
-40
-20
0
20
40
60
80
02Q1 04Q1 06Q1 08Q1 10Q1 12Q1 14Q1
Number of people employedNet balance: % up less % down

– All Rights Reserved – Financial Services Index 3Q 2015 | 8
-60
-40
-20
0
20
40
60
80
12Q1 12Q3 13Q1 13Q3 14Q1 14Q3 15Q1 15Q3
Credit lossesNet balance: % up less % down
-20
0
20
40
60
12Q1 12Q3 13Q1 13Q3 14Q1 14Q3 15Q1 15Q3
Credit standards for approving loansNet balance: % up less % down
Long term average
Expected
-40
-20
0
20
40
60
80
12Q1 12Q3 13Q1 13Q3 14Q1 14Q3 15Q1 15Q3
Cost to income ratioNet balance: % up less % down
0
20
40
60
80
100
12Q1 12Q3 13Q1 13Q3 14Q1 14Q3 15Q1 15Q3
Net profit after taxNet balance: % up less % down

– All Rights Reserved – Financial Services Index 3Q 2015 | 9
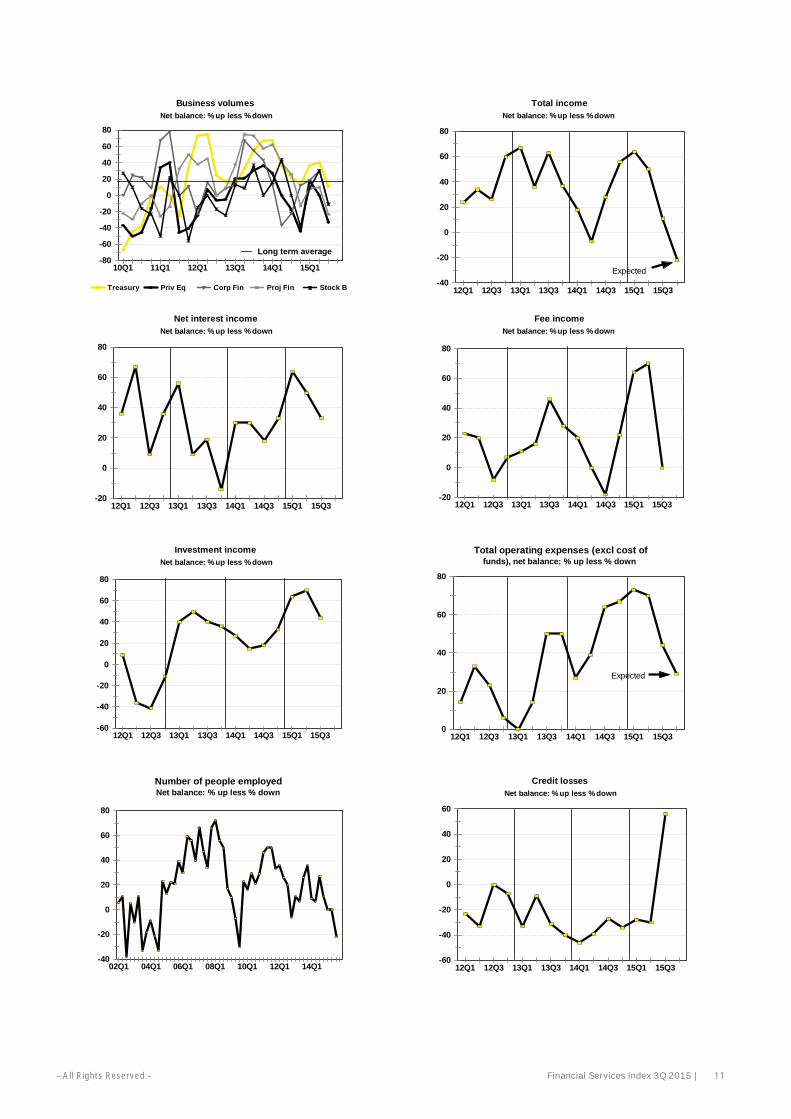
Investment bank confidence rises despite weakerflows and slower profits growthDespite weak growth, investment banks recorded stronger confidence levels in the third quarter. After declining to 75index points in 2Q15, confidence rebounded to 92 in 3Q15. This rebound and strong confidence is not in sync with theeconomic environment.The strong confidence could be attributable to sustained albeit modest profits growth. Investment banks cut back costsamidst the weaker business volumes, supporting the modest profits growth.
Most factors were less supportive of stronger confidence, including falling activity levels, resultant weaker income growth,and sharply rising credit losses.
Business volumes shrunk across all bar one business line, (treasury & specialised finance being the exception).
The falloff in activity resulted in slower income growth. Fee income slowed sharply, although this was partially offset bystronger net interest and investment income streams. Respondents expect income to retreat further in 4Q15.
Investment banks moderated cost growth in the third quarter, aided by a lower head count.
Credit losses rose sharply, after a benign two year period during which credit losses were mostly shrinking. Indeed creditlosses had remained well contained since the 2008 financial crisis. However, this quarter’s reading may prove to be a oneoff (or outlier).
In comparison with long term averages, and considering the spike in credit losses during the quarter, investment banksapplied neutral credit standards in 3Q15 (after easing in 2Q15). They expect to tighten credit standards in the last quarterof 2015, for the first time in a year.

– All Rights Reserved – Financial Services Index 3Q 2015 | 10
Survey data: Investment banking 1 2014 2015Q1 Q2 Q3 Q4## Q1 Q2 Q3 Q4*
1 Business confidence 2 73 69 64 89 82 75 922. Volume of business
a) treasury and specialised finance 3, 4 67 36 22 13 36 40 11b) private equity 3, 5 27 0 -18 -44 18 0 -33c)corporate finance 3, 6 13 -37 -22 12 18 30 -11d) project finance 3 62 40 26 -13 9 10 -23e) stock broking 3 16 44 0 -38 9 30 -11f)overall 3, 7 37 17 2 -14 18 22 -13
3. Incomea) total income 3, 8 18 -7 28 56 64 50 11 -22b) net interest income 3, 9 30 30 18 33 64 50 33c)fee income 3, 10 20 0 -18 22 64 70 0d) investment income 3, 11 27 15 18 33 64 70 44
4. Expenditurea) total operating expenses (excluding
cost of funding) 3, 827 39 64 67 73 70 44 29
b) credit losses 3, 12 -46 -39 -27 -34 -28 -30 56d) total number of people employed 3 9 7 27 11 0 0 -22
5. Efficiency and profitabilitya) cost-to-income ratio 3 37 15 -18 0 18 10 0b) net profit after tax 3 55 15 37 56 64 30 22
6. Credit standards for approving applications forloans3,13
50 38 27 11 0 -34 0 25
* Expected** A reliable result could not be calculated, as too few completed questionnaires were received by the cut-off date.## Lower than normal number of responses1 Investment banking and specialised finance consists of corporate finance, private equity, project finance, treasury andspecialised finance.2 % satisfactory3 Net balance (see Technical Note at the end of the report)4 Treasury and specialised finance comprise structured finance, asset finance, acquisition finance, financial products, corporatetreasury, debt restructuring, cash flow management, tax structuring and balance sheet management, as well as trading of commodities,foreign exchange and various financial instruments.5 Private equity and direct investments comprise the active seek and selection of expansion and buy-out investments as principalin unlisted companies.6 Corporate finance includes the provision of financial advisory services to listed companies related to mergers and acquisitions,divestitures, restructurings, spin-offs, joint ventures, capital raising and management buy-outs, as well as valuations, feasibility studiesand due diligence reviews.7 The unweighted average of treasury and specialised finance, private equity, corporate finance, project finance and stockbroking.8 The total reflects the responses of participants. It is therefore not calculated as the average of the responses to the components.Each data series has to be considered on its own. Deviations between the total and components occur when participants reply “the same”given that the net balance statistic does not take “the same” responses into account. The fact that respondents only answer questionsapplicable to them and that missing items are not imputed also have an effect.9 Interest income less interest expenses10 Fees and commission11 “Investment income” refers to all income from investments and not the investment return. It excludes deferred income andcapital depreciation, but includes realised and unrealised capital gains and losses on investments.12 Value of non-performing loans until 09Q213 Credit standards refer to the terms of the loans and credit lines, such as maximum size, spread of loan rates over bank’s cost offunds, premiums charged on riskier loans, collateral requirements etc.
– All Rights Reserved – Financial Services Index 3Q 2015 | 11
-80
-60
-40
-20
0
20
40
60
80
10Q1 11Q1 12Q1 13Q1 14Q1 15Q1
Treasury Priv Eq Corp Fin Proj Fin Stock B
Business volumesNet balance: % up less % down
Long term average
-40
-20
0
20
40
60
80
12Q1 12Q3 13Q1 13Q3 14Q1 14Q3 15Q1 15Q3
Total incomeNet balance: % up less % down
Expected
-20
0
20
40
60
80
12Q1 12Q3 13Q1 13Q3 14Q1 14Q3 15Q1 15Q3
Net interest incomeNet balance: % up less % down
-20
0
20
40
60
80
12Q1 12Q3 13Q1 13Q3 14Q1 14Q3 15Q1 15Q3
Fee incomeNet balance: % up less % down
-60
-40
-20
0
20
40
60
80
12Q1 12Q3 13Q1 13Q3 14Q1 14Q3 15Q1 15Q3
Investment incomeNet balance: % up less % down
0
20
40
60
80
12Q1 12Q3 13Q1 13Q3 14Q1 14Q3 15Q1 15Q3
Total operating expenses (excl cost offunds), net balance: % up less % down
Expected
-40
-20
0
20
40
60
80
02Q1 04Q1 06Q1 08Q1 10Q1 12Q1 14Q1
Number of people employedNet balance: % up less % down
-60
-40
-20
0
20
40
60
12Q1 12Q3 13Q1 13Q3 14Q1 14Q3 15Q1 15Q3
Credit lossesNet balance: % up less % down
– All Rights Reserved – Financial Services Index 3Q 2015 | 12
Asset manager confidence is knocked by global andlocal drivers
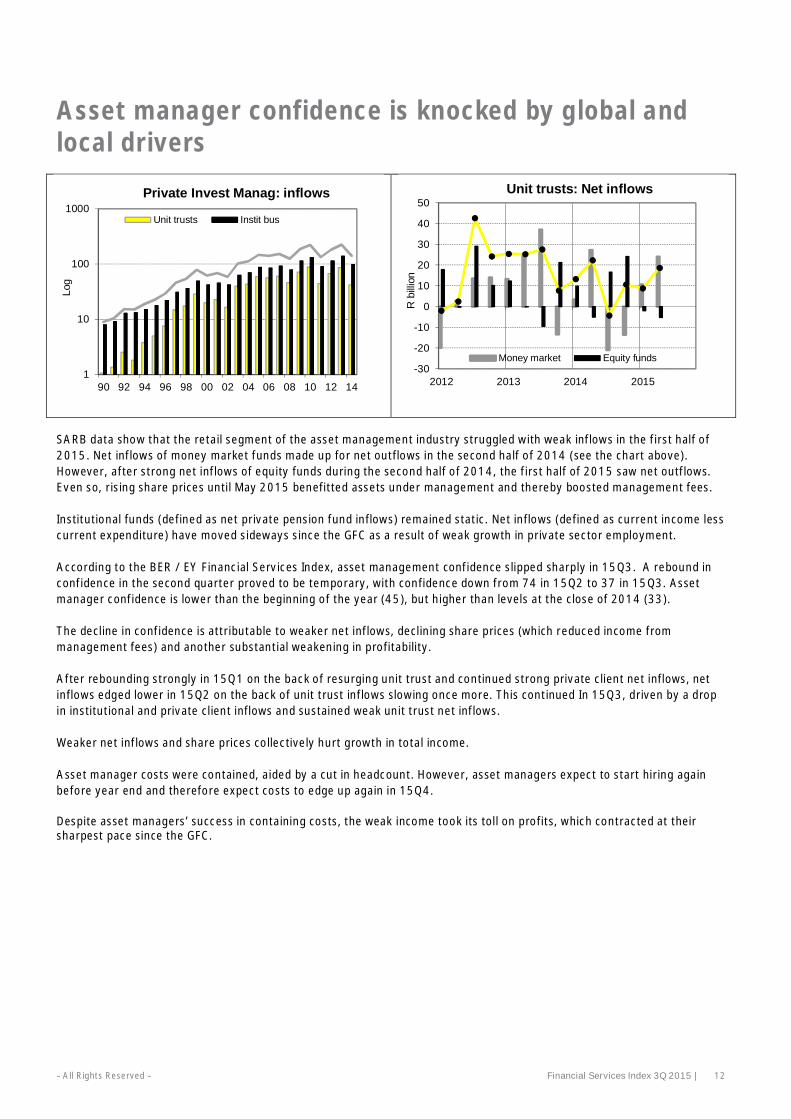
SARB data show that the retail segment of the asset management industry struggled with weak inflows in the first half of2015. Net inflows of money market funds made up for net outflows in the second half of 2014 (see the chart above).However, after strong net inflows of equity funds during the second half of 2014, the first half of 2015 saw net outflows.Even so, rising share prices until May 2015 benefitted assets under management and thereby boosted management fees.
Institutional funds (defined as net private pension fund inflows) remained static. Net inflows (defined as current income lesscurrent expenditure) have moved sideways since the GFC as a result of weak growth in private sector employment.
According to the BER / EY Financial Services Index, asset management confidence slipped sharply in 15Q3. A rebound inconfidence in the second quarter proved to be temporary, with confidence down from 74 in 15Q2 to 37 in 15Q3. Assetmanager confidence is lower than the beginning of the year (45), but higher than levels at the close of 2014 (33).
The decline in confidence is attributable to weaker net inflows, declining share prices (which reduced income frommanagement fees) and another substantial weakening in profitability.
After rebounding strongly in 15Q1 on the back of resurging unit trust and continued strong private client net inflows, netinflows edged lower in 15Q2 on the back of unit trust inflows slowing once more. This continued In 15Q3, driven by a dropin institutional and private client inflows and sustained weak unit trust net inflows.
Weaker net inflows and share prices collectively hurt growth in total income.
Asset manager costs were contained, aided by a cut in headcount. However, asset managers expect to start hiring againbefore year end and therefore expect costs to edge up again in 15Q4.
Despite asset managers’ success in containing costs, the weak income took its toll on profits, which contracted at theirsharpest pace since the GFC.
1
10
100
1000
90 92 94 96 98 00 02 04 06 08 10 12 14
Log
Private Invest Manag: inflows
Unit trusts Instit bus
-30
-20
-10
0
10
20
30
40
50
2012 2013 2014 2015
Rbi
llion
Unit trusts: Net inflows
Money market Equity funds

– All Rights Reserved – Financial Services Index 3Q 2015 | 13
Survey data: Asset management – All 2014 2015Q1 Q2 Q3 Q4 Q1 Q2 Q3 Q4*
1 Business confidence 1 77 66 52 33 45 74 372. Net inflows
a) Total net inflows 2, 3 12 -11 -12 -37 29 20 -5 1b) Institutional net inflows 2, 4 29 -6 9 -27 -19 -15 -41c) Unit trust net inflows: total 2, 3 19 -9 8 -4 22 -6 -12
i) Institutional 2, 4 24 10 17 -26 14 -20 -52ii) Retail 2, 5 27 -8 -5 45 46 -19 -22
d) Private client net inflows 2 22 -23 -20 0 10 1 -173. Income
a) Total income 2, 3 81 74 42 42 26 18 -28 9b) Average management fees charged 2 30 22 4 8 -12 -27 -8
4. Expensesa) Total expenses 2, 3 77 94 68 61 19 32 23 39b) number of people employed: total 2, 3 53 33 15 -3 9 6 20c) back office costs 2 71 66 53 38 23 15 23d) IT and systems costs 2 73 65 69 67 3 10 29e) marketing costs 2 41 61 50 23 -10 -13 -19f) other distribution costs 2 50 58 57 57 58 47 36g) bonuses paid 2 43 45 46 26 4 -30 -33
5. ProfitabilityNet profit after tax 2, 3 80 57 45 20 6 1 -34
*Expected1 % satisfactory, weighted according to firm size2 Net balance (see Technical Note at the end of the report), weighted according to firm size3 The total reflects the responses of participants. It is therefore not calculated as the average of the responses to the components. Each
data series has to be considered on its own. Deviations between the total and components occur when participants reply “the same”given that the net balance statistic does not take “the same” responses into account. The fact that respondents only answer questionsapplicable to them and that missing items are not imputed also have an effect.
4 According to the Association of Collective Investments (ACI), an institutional fund is a fund in which an individual investor cannotinvest. The units are held in the name of structures such as pension funds, provident funds, companies, endowment policies andstructured funds.
5 According to the ACI, a retail fund is a fund in which individual investors can invest directly and indirectly and the investments are heldin their names. Direct investments take place when individual investors deal directly with the management companies. Indirectinvestments take place when a reseller (LISP) or third party (e.g. a broker) acts as a go-between the individual investors and themanagement companies.

– All Rights Reserved – Financial Services Index 3Q 2015 | 14
-40
-20
0
20
40
60
80
12Q1 12Q3 13Q1 13Q3 14Q1 14Q3 15Q1 15Q3
Total net inflows: All firmsWeighted,net balance: % up less % down
Expected-60
-40
-20
0
20
40
60
80
12Q1 12Q3 13Q1 13Q3 14Q1 14Q3 15Q1 15Q3
Institutional net inflows: All firmsWeighted,net balance: % up less % down
-20
0
20
40
60
80
12Q1 12Q3 13Q1 13Q3 14Q1 14Q3 15Q1 15Q3
Unit trust net inflows: All firmsWeighted,net balance: % up less % down
-30
-20
-10
0
10
20
30
12Q1 12Q3 13Q1 13Q3 14Q1 14Q3 15Q1 15Q3
Private client net inflows: All firmsWeighted,net balance: % up less % down
-40
-20
0
20
40
60
80
100
12Q1 12Q3 13Q1 13Q3 14Q1 14Q3 15Q1 15Q3
Total income: All firmsWeighted,net balance: % up less % down
Expected
-40
-20
0
20
40
60
12Q1 12Q3 13Q1 13Q3 14Q1 14Q3 15Q1 15Q3
Avg management fees charged: All firmsWeighted,net balance: % up less % down

– All Rights Reserved – Financial Services Index 3Q 2015 | 15
Survey data: All firms (continued) 2012 2013 2014 2015Q1 Q3 Q1 Q3 Q1 Q3 Q1 Q3
Current situation6. Capital expenditure on …
a) domestic infrastructure development 1 45 51 41 28 52 30 30 7b) foreign infrastructure development 1 3 1 19 26 9 13 0 19
7. Productsa) Demand for
i) general equity index / tracker funds 1 -14 -42 5 5 -9 -6 11 4ii) absolute return funds 1 -9 -31 -27 -1 11 42 67 51iii) fixed income funds 1 44 72 49 47 4 4 4 12iv) specialist equity funds 1 -13 -15 -17 -9 -19 -32 9 13v) style funds 1 1 -24 -41 -6 -19 -42 -55 -50vi) guaranteed funds 1 -50 -9 -8 5 -9 -24 1 5vii) alternative products (e.g. hedge funds) 1 -7 4 19 -11 -8 15 23 7viii) balanced funds 1 47 64 83 90 73 77 81 46
b) Demand for foreign exposure 1 52 27 45 55 77 87 72 62c) Opportunities to introduce new funds 1 10 28 64 6 5 14 -15 -44
8. RegulationsRestrictions caused by the regulatory environment 1 78 78 67 45 42 57 57 65

– All Rights Reserved – Financial Services Index 3Q 2015 | 16
-80
-60
-40
-20
0
20
40
60
80
100
05Q1 07Q1 09Q1 11Q1 13Q1 15Q1abs return fixed inc guaranteed alt prod balanced
Low risk products
Long term average-60
-40
-20
0
20
40
60
05Q1 07Q1 09Q1 11Q1 13Q1 15Q1
general equity funds specialist equity funds style funds
High risk products
Long term average
-60 -40 -20 0 20 40 60 80 100
style funds
equity index funds
guaranteed funds
alternative products
fixed income funds
specialist equity funds
balanced funds
absolute return funds
15Q3 15Q1
Demand for productsNet balance, % up less % down
0
20
40
60
80
100
12Q1 12Q3 13Q1 13Q3 14Q1 14Q3 15Q1 15Q3
Total expenses: All firmsWeighted,net balance: % up less % down
Expected
-10
0
10
20
30
40
50
60
70
12Q1 12Q3 13Q1 13Q3 14Q1 14Q3 15Q1 15Q3
No of people employed: All firmsWeighted,net balance: % up less % down
-40
-20
0
20
40
60
80
100
12Q1 12Q3 13Q1 13Q3 14Q1 14Q3 15Q1 15Q3
Net profit after tax: All firmsWeighted,net balance: % up less % down

– All Rights Reserved – Financial Services Index 3Q 2015 | 17
Survey data: Asset management – SmallFirms 1
2014 2015Q1 Q2 Q3 Q4 Q1 Q2 Q3 Q4*
1 Business confidence 2 85 84 63 59 53 58 452. Net inflows
a) Total net inflows 3, 4 60 31 4 14 41 -6 -5 35b) Institutional net inflows 3, 5 43 36 7 0 35 -21 -70c) Unit trust net inflows: total 3, 4 64 68 79 38 23 25 25
i) Institutional 3 52 52 75 9 29 12 0ii) Retail 3 64 44 58 62 35 44 31
d) Private client net inflows 3 50 34 46 60 67 73 563. Income
a) Total income 3, 4 70 70 59 46 29 -11 -20 -30b) Average management fees charged 3 -7 35 11 0 0 0 -16
4. Expensesa) Total expenses 3, 4 87 96 75 76 71 78 80 40b) number of people employed: total 3, 4 69 88 45 50 53 42 70c) back office costs 3 57 38 18 4 0 16 5d) IT and systems costs 3 40 35 52 18 0 16 20e) marketing costs 3 30 54 37 9 0 0 15f) other distribution costs 3 44 14 23 23 24 21 5g) bonuses paid 3 70 69 59 18 -35 -58 -15
5. ProfitabilityNet profit after tax:3, 4 55 59 58 46 12 -31 -12
* Expected1 Firms with funds under management of less than R40 billion in 2013.2 % satisfactory3 Net balance (see Technical Note at the end of the report), weighted according to firm size4 The total reflects the responses of participants. It is therefore not calculated as the average of the responses to the components. Each
data series has to be considered on its own. Deviations between the total and components occur when participants reply “the same”given that the net balance statistic does not take “the same” responses into account. The fact that respondents only answer questionsapplicable to them and that missing items are not imputed also have an effect.
5 Private pension funds, public pension funds managed on behalf of the Public Investment Commissioners (PIC), life funds, medical aidfunds, etc.

– All Rights Reserved – Financial Services Index 3Q 2015 | 18
Survey data: Asset management – Largefirms 1
2014 2015Q1 Q2 Q3 Q4 Q1 Q2 Q3 Q4*
1 Business confidence 2 74 60 48 21 42 79 342.Net inflows
a) Total net inflows 3, 4 -2 -26 -19 -60 24 27 -6 -10b) Institutional net inflows 3, 5 24 -22 9 -40 -37 -13 -31c) Unit trust net inflows: total 3, 4 8 -37 -27 -32 21 -12 -22
i) Institutional 3 17 -4 -5 -42 9 -28 -65ii) Retail 3 19 -27 -30 37 50 -35 -36
d) Private client net inflows 3 15 -40 -47 -21 -8 -21 -403.Income
a) Total income 3, 4 84 79 35 39 24 26 -31 20b) Average management fees charged 3 41 17 0 12 -17 -33 -5
4.Expensesa) Total expenses 3, 4 75 92 66 54 4 19 3 38b) number of people employed: total 3, 4 49 13 3 -27 -6 -5 4c) back office costs 3 75 76 67 52 31 14 29d) IT and systems costs 3 82 76 76 90 4 8 33e) marketing costs 3 45 64 56 30 -15 -17 -31f) other distribution costs 3 52 71 71 73 71 56 46g) bonuses paid 3 35 36 40 30 19 -22 -39
5.ProfitabilityNet profit after tax 3, 4 86 57 40 8 4 11 -40
* Expected1 Firms with funds under management in excess of R40 billion in 2013.2 % satisfactory3 Net balance (see Technical Note at the end of the report), weighted according to firm size4 The total reflects the responses of participants. It is therefore not calculated as the average of the responses to the components. Each
data series has to be considered on its own. Deviations between the total and components occur when participants reply “the same”given that the net balance statistic does not take “the same” responses into account. The fact that respondents only answer questionsapplicable to them and that missing items are not imputed also have an effect.
5 Private pension funds, public pension funds managed on behalf of the Public Investment Commissioners (PIC), life funds, medical aidfunds, etc.

– All Rights Reserved – Financial Services Index 3Q 2015 | 19
Life insurance confidence slips despite strongerprofitsAccording to SA Reserve Bank data, life insurers faced more difficult prospects in 2014. Premium income growth slowedfrom 2012 and 2013 levels(see the chart below). While individual premium income (56% of the total) continued growing atcomfortable levels, group premium income (44%) contracted in 2014 and into the first half of 2015.Declining group premiums is attributed to a lack of growth in private sector employment since the GFC in 2008.
In addition to weak premium incomes (80% of inflows), afall in investment income (20%) also impacted lifeinsurers in 2014. After contracting sharply in 2009 and2010 due to the recession, investment income beganrecovering in 2010 and registered the highest (year-on-year) growth in 2013. It contracted in 2014, partly due tothe high base established in 2013, but also due to lowerdividend yields, declining bond yields and little growth inreal rentals. Rising bond yields lifted investment incomeduring the first half of 2015.
After robust growth between 2012 and 2014, benefitpayments moderated in the first half of 2015 (see the chartbelow). The slower growth is attributed to muted growth in
lump sum payments (38% of the total) and to a lesser extent, weaker annuities (11%). In contrast, surrenders (52%)increased at an even faster rate than in 15Q1, in line with 2012 and 2014 levels.
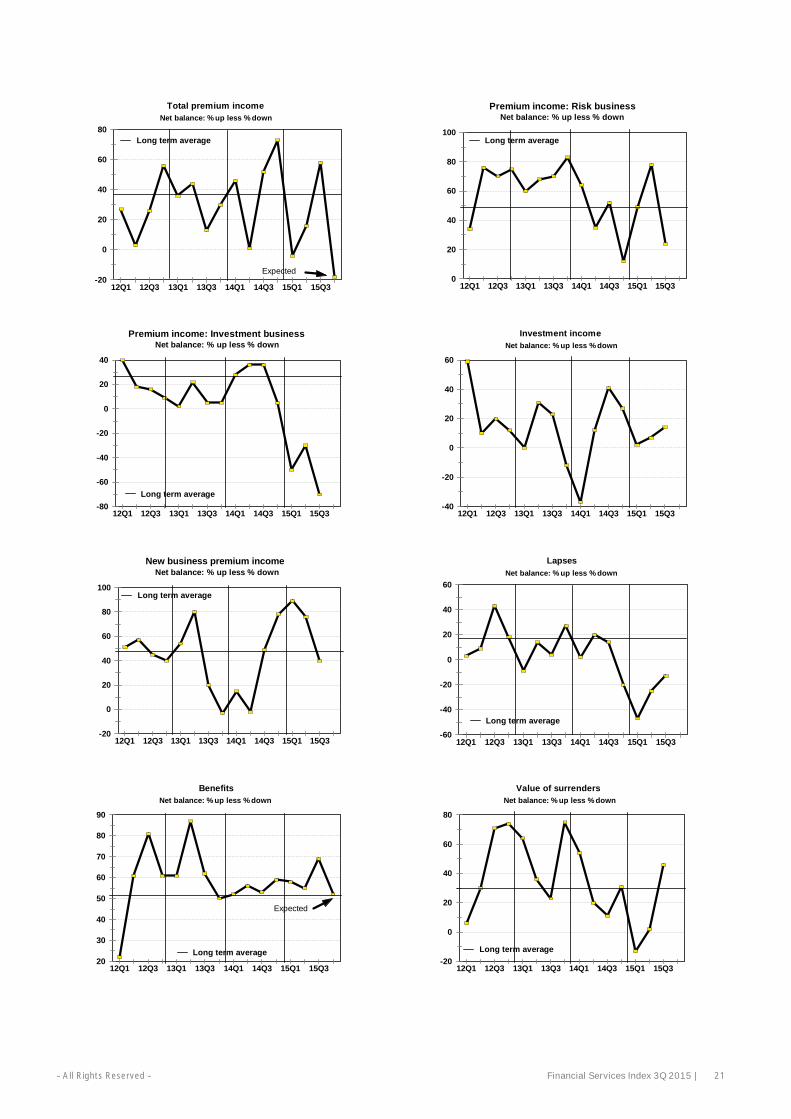
The BER EY Financial Services Index shows that life Insurer confidence fell in 3Q15, despite stronger income and profitsgrowth. This was driven by stronger premium income growth after a weak first half. This growth was driven entirely by riskpremiums, (with investment premiums deteriorating further).
Respondents are not optimistic about 15Q4, expecting total premium to drop again. This is largely attributed to the weakeconomic outlook, which slows premium growth and raises surrenders. New business premiums were flat in 15Q3,prompting respondents to adopt cautionary expectations. However, these negative sentiments were countered by acontinued decline in lapses.
Investment income growth continued at a modest pace. Growth in benefits continued at 15Q2 levels. Surrenders surged in15Q3, driven by pressured consumers cashing in policies prematurely. Administration and marketing expenses rosestrongly, despite the full-time admin employee headcount shrinking. Stronger premium incomes and risk productprofitability boosted net profits after tax growth.
-10-505
10152025303540
2012 2013 2014 2015
%ch
ange
YoY
Total premium income
-20
-10
0
10
20
30
40
50
60
70
2012 2013 2014 2015
%ch
ange
YoY
Total premium income
Individual Group
-20
-10
0
10
20
30
40
50
2012 2013 2014 2015
%ch
ange
YoY
Total investment income

– All Rights Reserved – Financial Services Index 3Q 2015 | 20
Survey data: Life Insurance 1 2014 2015Q1 Q2 Q3 Q4 Q1 Q2 Q3 Q4*
1 Business confidence 2 79 64 67 81 92 93 802. Inflow
a) total inflow 3, 4 46 47 50 64 -3 14 49b) total premium income 3, 5 46 1 52 73 -4 16 58 -18
i) risk business / no of new contracts 3 64 35 52 12 49 78 24ii) investment business (only individual business) 3 28 36 36 5 -50 -30 -70
c) new business premium income 3 15 -2 49 78 89 76 40d) lapses / no of contracts terminated 3 2 20 14 -20 -47 -25 -13e) investment income 3, 6 -37 12 41 27 2 7 14
3. Outflowa) total outflow 3, 7 49 57 55 59 58 57b) benefits 3 52 56 53 59 58 55 69 52c) value of surrenders 3 54 20 11 31 -13 2 46d) sales remuneration 3, 8 88 93 89 53 68 80 72e) administration and marketing expenses 3 19 63 75 61 53 75 71f) number of full-time admin employees 3, 9 0 -5 41 53 14 -2 -7g) number of in-house agents 3 42 61 33 -27 51 57 31
4. Profitabilitya) net profit after tax 3 20 56 70 39 -51 36 87b) profitability of risk business 3 48 62 25 -30 -45 28 18c) administration expenses as % of premium income 3 48 57 24 -10 69 41 16d) value of new business 3 60 48 33 32 28 29 16
* Expected1 Individual life and retirement annuities business plus group life and employee benefit business.2 % satisfactory, weighted according to firm size3 Net balance (see Technical Note at the end of the report), weighted according to firm size4 Weighted net balance (80% total premium income + 20% investment income)5 The total reflects the responses of participants. It is therefore not calculated as the average of the responses to the components. Each
data series has to be considered on its own. Deviations between the total and components occur when participants reply “the same”given that the net balance statistic does not take “the same” responses into account. The fact that respondents only answer questionsapplicable to them and that missing items are not imputed also have an effect.
6 “Investment income” refers to all income from investments and not the investment return. It includes dividend, interest, rental andother non-capital investment income, as well as realised and unrealised capital gains and losses on investments.
7 Weighted net balance (90% benefits + 10% administration and marketing expenses)8 Distribution costs and commissions.9 Excluding field staff
– All Rights Reserved – Financial Services Index 3Q 2015 | 21
-20
0
20
40
60
80
12Q1 12Q3 13Q1 13Q3 14Q1 14Q3 15Q1 15Q3
Total premium incomeNet balance: % up less % down
Long term average
Expected0
20
40
60
80
100
12Q1 12Q3 13Q1 13Q3 14Q1 14Q3 15Q1 15Q3
Premium income: Risk businessNet balance: % up less % down
Long term average
-80
-60
-40
-20
0
20
40
12Q1 12Q3 13Q1 13Q3 14Q1 14Q3 15Q1 15Q3
Premium income: Investment businessNet balance: % up less % down
Long term average-40
-20
0
20
40
60
12Q1 12Q3 13Q1 13Q3 14Q1 14Q3 15Q1 15Q3
Investment incomeNet balance: % up less % down
-20
0
20
40
60
80
100
12Q1 12Q3 13Q1 13Q3 14Q1 14Q3 15Q1 15Q3
New business premium incomeNet balance: % up less % down
Long term average
-60
-40
-20
0
20
40
60
12Q1 12Q3 13Q1 13Q3 14Q1 14Q3 15Q1 15Q3
LapsesNet balance: % up less % down
Long term average
20
30
40
50
60
70
80
90
12Q1 12Q3 13Q1 13Q3 14Q1 14Q3 15Q1 15Q3
BenefitsNet balance: % up less % down
Long term average
Expected
-20
0
20
40
60
80
12Q1 12Q3 13Q1 13Q3 14Q1 14Q3 15Q1 15Q3
Value of surrendersNet balance: % up less % down
Long term average

– All Rights Reserved – Financial Services Index 3Q 2015 | 22
0
20
40
60
80
100
12Q1 12Q3 13Q1 13Q3 14Q1 14Q3 15Q1 15Q3
Administration and marketing expensesNet balance: % up less % down
Long term average-40
-20
0
20
40
60
12Q1 12Q3 13Q1 13Q3 14Q1 14Q3 15Q1 15Q3
Number of full-time admin employeesNet balance: % up less % down
Long term average
-60
-40
-20
0
20
40
60
80
100
12Q1 12Q3 13Q1 13Q3 14Q1 14Q3 15Q1 15Q3
Net profit after taxNet balance: % up less % down
Long term average
-60
-40
-20
0
20
40
60
80
12Q1 12Q3 13Q1 13Q3 14Q1 14Q3 15Q1 15Q3
Profitability of risk businessNet balance: % up less % down
Long term average

– All Rights Reserved – Financial Services Index 3Q 2015 | 23
Technical noteA document with more information on the survey method is available on www.ber.ac.za . Click the button named “Services”and then select “Surveys” and finally “Financial Services”. Alternatively, click on “EY Financial Survey” on the home pageand then on “Financial Services” under Quick Links.
Survey methodThe BER started conducting surveys amongst retail and investment banks in 2002. The scope of the survey was expandedto asset managers and life insurers in 2003.
EY, the international accounting and business advisory firm, not only supports the financial sector survey financially, butalso made valuable inputs to the design and makes the overall results public. However, the BER conducts the survey andinterprets the results. The BER treats the identities of participants and individual responses as confidential and does notreveal this information to any third party, including the sponsoring firm.
The division heads of all the major retail banks, investment banks, asset managers and life insurers operating in SouthAfrica participate in the survey.
The survey results reveal current and expected changes in income, expenses and profitability for these firms’ South Africaoperations only. Industry specific issues, such as banks’ credit standards and the demand for various products of assetmanagers, are covered during the first and third quarter surveys.
The surveys are conducted during March, June, September and December. The results reflect developments per calendarquarter, i.e. the first quarter reflect developments during January, February and March; the second quarter reflects April,May and June etc.
On occasion questionnaires reach us after the date on which the results of the current quarter are processed. Smallrevisions of the survey results of the previous quarter could occur when we process such questionnaires at a later stage.
The need for the financial services surveySouth Africa has one of the most advanced financial sectors of all emerging market economies and its development is inmany respects on par with those of industrialised countries – and yet its performance is not measured regularly andconsistently. There is a general consensus on the need for a regular, consistent and impartial financial services survey,from managers in the financial sector to financial analysts.
The contribution of the financial sector to GDP has in-creased over the past decade and stood at 9.7% during 2011. Thecontribution of – for example – real estate (6.0%), transport (6.6%) and retail trade (7.2%) are all lower compared to that ofthe financial sector. However, the general government (16.5%), manufacturing (12.8%) and mining (10.2%) are bigger.
Despite its importance, current information on the performance of the financial sector lags behind:
Statistics SA publishes GDP and employment figures for the sector covering financial intermediation, insurance, real estateand business services with a lag of one quarter and no details about the sector’s financial performance.
The compulsory monthly BA 120 (DI 200 until 2007) returns of banks to and the Annual Report of the Bank SupervisionDepartment of the Reserve Bank, the Quarterly Financial Stability Review of the Financial Stability Department of theReserve Bank and the Annual Report of the Financial Services Board (FSB) provide detailed information about theperformance of banks and other financial institutions, but the information is made public with a lag in time except for the BA120 returns.
The interim and annual reports of listed financial companies provide information about their performance, but these reportsappear at irregular intervals (their release dates depend on the financial year-ends of the different companies) and theresults are not always comparable.
The periodic Price Waterhouse Coopers (PWC) Survey, although entirely relevant in relation to its intended target marketand ultimate aim, differs fundamentally from the EY financial services survey. The EY survey measures the same

– All Rights Reserved – Financial Services Index 3Q 2015 | 24
performance criteria of financial institutions over time, appears quarterly and the results are obtained by means of shortquestionnaires.
The quarterly unit trust and bi-annual life insurance reviews of the Association for Savings and Investment SA (ASISA) areuseful. However, the unit trust review does not provide information on the financial performance of management companiesand the life insurance review is only published twice a year.
The investment performance and strategy of asset managers are measured regularly (e.g. Alexander Forbes and Plexus), butno regular, consistent measure of income and expenditure of asset managers exist.
The international standing of the financial sector surveyThe UK, Poland and Switzerland have the longest experience in conducting financial services surveys. In the UK, theConfederation of British Industries (CBI) in London has been conducting comprehensive quarterly financial services surveysin partnership with Price Waterhouse Coopers (PWC) since December 1989. In Poland, the Research Institute for EconomicDevelopment (RIED) at the Warsaw School of Economics has been conducting a banking survey since 1999. The SwissBusiness Cycle Institute (KOF) in Zurich has been conducting a quarterly banking and insurance survey since the beginningof 2000.
In the USA, the Federal Reserve Bank has been conducting a “Senior Loan Officer Opinion Survey on Bank LendingPractices” for many years, but unlike the UK, Polish and Swiss banking surveys, it focuses on bank lending practices andnot the financial performance of the bank sector.
The South African financial services survey is modelled on those of the UK and Switzerland. However, the questionnaire hasbeen adapted for South African conditions and needs. Furthermore, it also includes the questions on credit standards forapproving applications for loans and credit lines out of the US “Senior Loan Officer Opinion Survey”.
Ensuring the reliability and accuracy of the financial sector surveyThe questionnaire has been designed for maximum efficiency and minimum input time. Only multiple-answer type ticks arerequired. No figures are requested. For example, participants only have to tick if a particular activity (such as total incomeor number of people employed) is “up”, “the same” or “down” compared to the same period a year ago and with respect totheir South African operations only.
Respondents are carefully selected and approached on the basis of their position in the financial world. The head of retailbanking or the head of group life insurance is quizzed and not the chairperson of the board of directors of the group orholding company. Divisional heads tend to be best informed about their business units. The confidentiality of the responsesadds to the honesty and candour of participants. Furthermore, respondent quality is monitored.
The same group of participants is surveyed from one quarter to the next. Changes in the results from one quarter to thenext can therefore be attributed to an actual change in the performance yardstick in question and not because of theparticipation – or not – of particular banks, asset managers or life insurers.
South Africa has relatively few banks, asset managers and life insurers. For example, four banks dominate the retail and sixthe merchant and investment banking sector. Likewise, two companies dominate the life insurance industry. The number ofpotential participants in a financial sector survey is therefore relatively low in South Africa.
The degree of presentation of the panel of participants has an important impact on the reliability of a quantitative survey,i.e. when respondents have to indicate actual amounts for each activity and the rand value of the level and change arecalculated. In contrast, the financial sector survey is a qualitative survey, i.e. the majority view of respondents on aparticular activity is taken as an indication of the direction and strength of the trend in that activity. The degree ofpresentation of the panel of participants is less of a concern in the case of qualitative surveys. Furthermore, theparticipation – or not – of a particular respondent has less of an impact on the overall results in the case of qualitativesurveys compared to quantitative ones, as the view of the majority is established and not the actual size.

– All Rights Reserved – Financial Services Index 3Q 2015 | 25
-100
-50
0
50
100
Net
bala
nce
=%
uple
ss%
dow
n
-15
-10
-5
0
5
10
15
%ch
ange
,Qon
sam
eQ
aye
arag
o
04Q1 04Q4 05Q3 06Q2 07Q1 07Q4 08Q3
Net balance of survey data (lhs)
% change YoY of quantitative data (rhs
Net balance vs % change YoY
A
B B
C C
The participating retail and investment banks accounted for 95% of total assets of registered banks in December 2007. Thevalue of the total funds under management of the participating asset managers accounted for 63% of the total during thesecond quarter of 2007.
For reasons of focus, the following financial institutions are not covered, namely short-term insurers, public financialinstitutions (e.g. the Reserve Bank, Land Bank, Post Bank and official pension and provident funds), medical insurancesavings schemes, the informal micro-lending and savings industry, retailers providing credit and individual insurancebrokers/agents. The survey also only focuses on the supply of financial services and not on the demand for such services,which stems from government, businesses, households and the rest of the world.
The survey results reveal trends and not actual figures. The net balance statistic is used to interpret the survey results.(See next section for more details on the interpretation of the net balance statistic.) The net balance statistic is thepercentage of respondents replying “up” less the percentage replying “down”. The percentage of respondents replying“the same” is ignored. Over the years, the net balance statistic has proved to be the most reliable indicator of the directionand size of change in the trend of the respective activities surveyed. The net balance statistic is a qualitative yardstick ofthe direction and size of the year-on-year growth rate of a particular activity. A positive net balance implies positive year-on-year growth and vice versa. The higher the value of the net balance (positive / negative), the larger the rate of increase/ decrease of the activity in question.
To aggregate the sector performance, individual responses are weighted according to their relative size. It makes sensethat the response of a small participant has to count less compared to that of a large participant.
Results are published according to type of activity (e.g. retail banking, investment banking, life insurance and assetmanagement) and not per institution (e.g. ABSA, Investec, Sanlam or Coronation).
How to interpret the net balance statisticWe base our interpretation of the survey results on the net balance statistic. Over the years, the net balance statistic hasproved to be the most reliable indicator of the direction and size of change in the trend of the respective activitiessurveyed.The net balance statistic is the percentage of respondents replying “up” less the percentage replying “down”. Thepercentage of respondents replying “the same” is ignored. For example, if the percentage of respondents rating the volumeof business higher / the same / lower compared to the same period a year ago is as follows:
Higher Same Lower Net balance70% 10% 20% 50%
Then we can conclude that the majority of participants experienced higher business volumes. A net majority (i.e. thepercentage of respondents rating the volume of business higher less the percentage rating the volume lower) of 50% is
registered in the above example.
The net balance statistic is an advanced qualitative yardstick /indicator of the direction (up, same or down) and size (small or large)of the year-on-year percentage change of the correspondingquantitative data (if available) of a particular activity. A net balance ofzero tends to indicate no growth (marked “A” on the accompanyingchart), between 0 and –100 a contraction (marked “B”) and between0 and 100 an expansion (marked “C”) compared to the same quartera year ago. A positive net balance, therefore, implies positive year-on-year growth and vice versa. The higher the value of the net balance(positive / negative), the larger the rate of increase / decrease of theactivity in question tend to be.
Note that a net balance of –50%, for instance, is therefore not equivalent to a –50% decline (calculated year-on-year) in thequantitative data series. A net balance of –50% may correspond to –10% in the case of one set of quantitative data and –3%in another case. The net balance and corresponding percentage change in the quantitative data vary from one data set tothe next and this relationship could only be established if many data points are available.

– All Rights Reserved – Financial Services Index 3Q 2015 | 26
Published October 2015
WarningThis material has been prepared for general information purposes only and maynot be relied upon as accounting, tax, or other professional advice. EYspecifically renounces any liability for reliance on this material by either you orany third party to whom this material may be distributed. Please refer to youradvisors for specific advice.
EY | Assurance | Tax | Transactions | Advisory
About EYEY is a global leader in assurance, tax, transaction and advisoryservices. The insights and quality services we deliver help buildtrust and confidence in the capital markets and in economies theworld over. We develop outstanding leaders who team to deliveron our promises to all of our stakeholders. In so doing, we play acritical role in building a better working world for our people, forour clients and for our communities.
EY refers to the global organization, and may refer to one ormore, of the member firms of Ernst & Young Global Limited,each of which is a separate legal entity. Ernst & Young GlobalLimited, a UK company limited by guarantee, does not provideservices to clients. For more information about our organization,please visit ey.com.
© 2015 EYGM Limited.All Rights Reserved.