Embed Size (px)
Citation preview

Behavior Research Methods2005, 37 (3), 513-521
We present here a simple, relatively inexpensive dis-play that incorporates the best features of Maxwellianview and CRT displays; it presents high-intensity, high-resolution, and if desired, high color saturation imagesto an observer. It is suitable for use in vision researchwith psychophysics or brain imaging or for clinical test-ing. The display is constructed using a modified LCDdata projector,1 a supplemental objective lens, a Fresnellens, and a diffuser. The design is flexible; a wide rangeof viewing distances and angular subtenses is possible.In the configuration we built, the display presents veryhigh intensity (100–20,000 cd/m2), very saturated (nearspectral color) images on a roughly 25 � 25 cm screenpositioned about 100 cm in front of a viewer. The imagesare high resolution and easily controlled with a desktopcomputer.
In Maxwellian view (Westheimer, 1966), a lens formsan image of a lamp filament in the pupil of the eye. Be-cause of this, the viewed field is brightly lit; all the lightfrom the lamp passes through the pupil. The advantage ofthis arrangement is a very high intensity and, if desired,highly saturated colors, if f ilters are used. However,Maxwellian view requires a precise alignment of the eye,which is usually achieved by having the observer bite ona dental impression. The image can be viewed only withone eye at a time (the image can be viewed with both eyesby using a more complex and difficult-to-align design).Also, stimuli are usually created using masks made fromphotographic lithographs, making it very difficult topresent complex or dynamic stimuli.
CRT monitors have the advantage of easy control overthe shape and time course of the stimuli. With a high graylevel resolution video board, they can be calibrated topresent precisely controlled luminance levels (Brainard,1989). However, the maximum luminance is very low, ascompared with natural light levels (102 cd/m2, as comparedwith 104 cd/m2 for a white sheet of paper in sunlight), andthe color gamut is limited by the phosphors used.
Current electronic data projectors put out a lot of light(1,000–2,500 lm is typical). In these projectors, a com-pact lamp illuminates LCD or DLP panels. These panelscan be viewed in a Maxwellian configuration if that lamp,which is usually imaged near the projector’s objectivelens, is reimaged in the observer’s pupil by a large Fres-nel lens. By adding a supplementary positive lens imme-diately in front of the projector’s objective lens (or by re-moving and replacing that objective lens), the LCD orDLP image can be made to coincide with and fill theFresnel lens, a foot or two from the projector.
Such a setup yields intensities far higher than thoseachieved with any CRT and, in fact, higher than typicallywanted. However, by introducing a holographic diffuserin the plane of the projected image, light can be uni-formly dispersed over a region around the subject’s eyes.This sacrifices (unneeded) intensity but (1) allows binoc-ular observation and (2) allows a less restrictive chinrestto replace the customary dental impression. The diffuser-extended Maxwellian image can even be large enough toallow binocular observation, while still providing pigment-bleaching light levels (~5.3 log trolands are required tobleach 90% of L and M cone pigment; Rushton & Henry,1968; this requires a display luminance of 14,300 cd/m2
with a typical 4-mm pupil). In addition, the color gamutof this display system can be greatly enlarged (approach-ing the physical limit of monochromatic primaries) byplacing thin dichroic filters in the internal light path ofthree-panel projectors. Dynamic range, light level, color
513 Copyright 2005 Psychonomic Society, Inc.
Correspondence concerning this article should be addressed to R. D.Beer, Department of Psychology, University of California at San Diego,5212 McGill Hall, La Jolla, CA 92093-0109 (e-mail: [email protected]).
Note—This article was accepted by the previous editor,Jonathan Vaughan.
The Extended Maxwellian View (BIGMAX): A high-intensity, high-saturation color display
for clinical diagnosis and vision research
R. DIRK BEER, DONALD I. A. MACLEOD, and TIMOTHY P. MILLERUniversity of California at San Diego, La Jolla, California
We describe a device that can display very high intensity (up to 400,000 cd/m2), high-resolution visualstimuli. The device is inexpensive, is easily controlled by a conventional computer and video card, andcan be calibrated for use in vision research or clinical applications. The display is capable of present-ing highly saturated, near spectral colors. Unlike Maxwellian view optical systems, our display can beviewed binocularly and does not require exacting head restraint. We describe the construction, give adesign example, and describe our calibration procedure. Furthermore, we report measurements of thecolor gamut, spatial resolution, temporal characteristics, and the dynamic range of light intensity.
514 BEER, MACLEOD, AND MILLER
gamut, and spatial and temporal resolution are all suffi-cient for demanding applications in vision research.
Display OpticsTraditional Maxwellian view systems display very
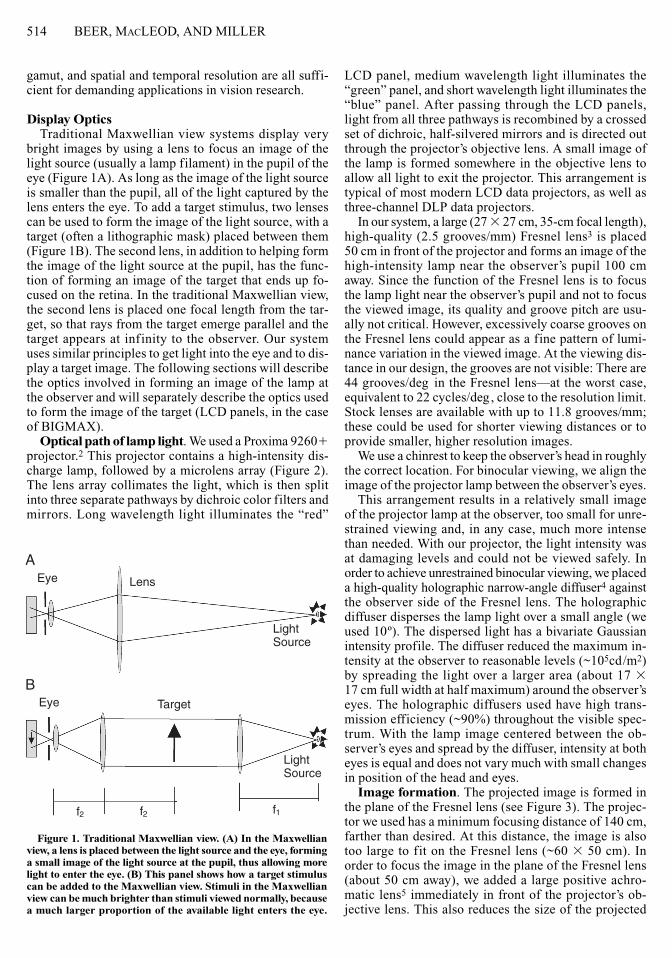
bright images by using a lens to focus an image of thelight source (usually a lamp filament) in the pupil of theeye (Figure 1A). As long as the image of the light sourceis smaller than the pupil, all of the light captured by thelens enters the eye. To add a target stimulus, two lensescan be used to form the image of the light source, with atarget (often a lithographic mask) placed between them(Figure 1B). The second lens, in addition to helping formthe image of the light source at the pupil, has the func-tion of forming an image of the target that ends up fo-cused on the retina. In the traditional Maxwellian view,the second lens is placed one focal length from the tar-get, so that rays from the target emerge parallel and thetarget appears at infinity to the observer. Our systemuses similar principles to get light into the eye and to dis-play a target image. The following sections will describethe optics involved in forming an image of the lamp atthe observer and will separately describe the optics usedto form the image of the target (LCD panels, in the caseof BIGMAX).
Optical path of lamp light. We used a Proxima 9260�projector.2 This projector contains a high-intensity dis-charge lamp, followed by a microlens array (Figure 2).The lens array collimates the light, which is then splitinto three separate pathways by dichroic color filters andmirrors. Long wavelength light illuminates the “red”
LCD panel, medium wavelength light illuminates the“green” panel, and short wavelength light illuminates the“blue” panel. After passing through the LCD panels,light from all three pathways is recombined by a crossedset of dichroic, half-silvered mirrors and is directed outthrough the projector’s objective lens. A small image ofthe lamp is formed somewhere in the objective lens toallow all light to exit the projector. This arrangement istypical of most modern LCD data projectors, as well asthree-channel DLP data projectors.
In our system, a large (27 � 27 cm, 35-cm focal length),high-quality (2.5 grooves/mm) Fresnel lens3 is placed50 cm in front of the projector and forms an image of thehigh-intensity lamp near the observer’s pupil 100 cmaway. Since the function of the Fresnel lens is to focusthe lamp light near the observer’s pupil and not to focusthe viewed image, its quality and groove pitch are usu-ally not critical. However, excessively coarse grooves onthe Fresnel lens could appear as a fine pattern of lumi-nance variation in the viewed image. At the viewing dis-tance in our design, the grooves are not visible: There are44 grooves/deg in the Fresnel lens—at the worst case,equivalent to 22 cycles/deg, close to the resolution limit.Stock lenses are available with up to 11.8 grooves/mm;these could be used for shorter viewing distances or toprovide smaller, higher resolution images.
We use a chinrest to keep the observer’s head in roughlythe correct location. For binocular viewing, we align theimage of the projector lamp between the observer’s eyes.
This arrangement results in a relatively small imageof the projector lamp at the observer, too small for unre-strained viewing and, in any case, much more intensethan needed. With our projector, the light intensity wasat damaging levels and could not be viewed safely. Inorder to achieve unrestrained binocular viewing, we placeda high-quality holographic narrow-angle diffuser4 againstthe observer side of the Fresnel lens. The holographicdiffuser disperses the lamp light over a small angle (weused 10º). The dispersed light has a bivariate Gaussianintensity profile. The diffuser reduced the maximum in-tensity at the observer to reasonable levels (~105cd/m2)by spreading the light over a larger area (about 17 �17 cm full width at half maximum) around the observer’seyes. The holographic diffusers used have high trans-mission efficiency (~90%) throughout the visible spec-trum. With the lamp image centered between the ob-server’s eyes and spread by the diffuser, intensity at botheyes is equal and does not vary much with small changesin position of the head and eyes.
Image formation. The projected image is formed inthe plane of the Fresnel lens (see Figure 3). The projec-tor we used has a minimum focusing distance of 140 cm,farther than desired. At this distance, the image is alsotoo large to fit on the Fresnel lens (~60 � 50 cm). Inorder to focus the image in the plane of the Fresnel lens(about 50 cm away), we added a large positive achro-matic lens5 immediately in front of the projector’s ob-jective lens. This also reduces the size of the projected
Eye Lens
LightSource
A
Eye
LightSource
Target
B
f2 f2 f1
Figure 1. Traditional Maxwellian view. (A) In the Maxwellianview, a lens is placed between the light source and the eye, forminga small image of the light source at the pupil, thus allowing morelight to enter the eye. (B) This panel shows how a target stimuluscan be added to the Maxwellian view. Stimuli in the Maxwellianview can be much brighter than stimuli viewed normally, becausea much larger proportion of the available light enters the eye.

BIGMAX DISPLAY 515
LCD image so that it fits on the Fresnel. The built-in op-tical zoom and focus functions were used to fine-tune thesize and focus of the image on the Fresnel lens.
A three-channel display can achieve extremely satu-rated colors, while still maintaining high light output,using additional dichroic reflecting filters placed insidethe projector before or after the LCD or DLP panels. Be-cause of the large amount of light energy that the filterstypically block, absorbing filters cannot be used, sincethey do not survive the heat stress.
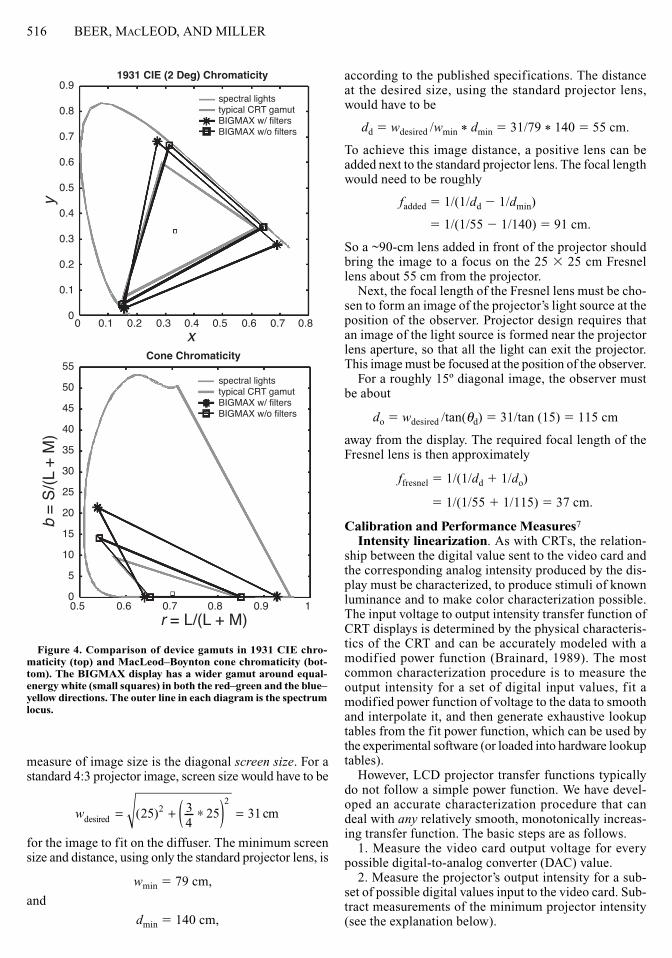
To achieve the widest color gamut possible, we useddichroic filters to reduce light that stimulated more thanone receptor class at a time. The filters maximize theratio of S/L cone excitation by the blue channel and max-imize the ratio of L/M cone excitation by the red chan-nel.6 For the green channel, the filter is a compromisethat slightly increases the M/L cone ratio, while sub-stantially reducing the S/M cone ratio. Figure 4 showsthe chromatic gamut of the BIGMAX projector after ad-dition of a 430-nm lowpass filter to the blue channel, ad-dition of a 500- to 550-nm bandpass filter and a 540-nmhighpass filter to the green channel, and addition of a
645-nm highpass filter to the red channel. Filtered spec-tra are shown in Figure 5. The filters reduce display lu-minance by about a factor of four: Whereas maximumintensity without filters is ~20,000 cd/m2, the maximumequal-energy white intensity with the filters in place is~5,000 cd/m2.
Design ExamplesWe present two sample designs: (1) our design (ap-
proximately) and (2) a long-throw, low-magnificationdesign that could be used to present stimuli to observersin fMRI experiments. The second design is based onlyon our experience with the first one; we have not builtthe second design. In designing our display, we used thinlens equations to make rough guesses about the lensesand distances required, bought several lenses with roughlycorrect focal length, and then got a working system bytrial and error.
First, the projected image needs to be made the de-sired size and focused at the desired distance. We wantedan image that would fit on the 25 � 25 cm Fresnel lens,with the projector as close as possible. The standard
FresnelLens
ObjectiveLens
MicrolensArray
Lamp
LensLCDPanelNarrow-angle
HolographicDiffuser
Cornea/Lens
Retina
Figure 2. Optical path showing two light rays emanating from a singlepoint within the compact lamp source. Note: not to scale.
FresnelLens
ObjectiveLens
LampLCDPanel
Narrow-angleHolographicDiffuser
Cornea/Lens
Figure 3. Image formation, showing two rays that pass through a sin-gle pixel in the LCD panel after originating from two distinct points inthe lamp source. These are separate at the objective lens but are reunitedin the image plane at the Fresnel lens and again at the retina. The an-gular dispersion added by the holographic diffuser is not shown.
516 BEER, MACLEOD, AND MILLER
measure of image size is the diagonal screen size. For astandard 4:3 projector image, screen size would have to be
for the image to fit on the diffuser. The minimum screensize and distance, using only the standard projector lens, is
wmin � 79 cm,
and
dmin � 140 cm,
according to the published specifications. The distanceat the desired size, using the standard projector lens,would have to be
dd � wdesired /wmin * dmin � 31/79 * 140 � 55 cm.
To achieve this image distance, a positive lens can beadded next to the standard projector lens. The focal lengthwould need to be roughly
fadded � 1/(1/dd � 1/dmin)
� 1/(1/55 � 1/140) � 91 cm.
So a ~90-cm lens added in front of the projector shouldbring the image to a focus on the 25 � 25 cm Fresnellens about 55 cm from the projector.
Next, the focal length of the Fresnel lens must be cho-sen to form an image of the projector’s light source at theposition of the observer. Projector design requires thatan image of the light source is formed near the projectorlens aperture, so that all the light can exit the projector.This image must be focused at the position of the observer.
For a roughly 15º diagonal image, the observer mustbe about
do � wdesired /tan(θd) � 31/tan (15) � 115 cm
away from the display. The required focal length of theFresnel lens is then approximately
ffresnel � 1/(1/dd � 1/do)
� 1/(1/55 � 1/115) � 37 cm.
Calibration and Performance Measures7
Intensity linearization. As with CRTs, the relation-ship between the digital value sent to the video card andthe corresponding analog intensity produced by the dis-play must be characterized, to produce stimuli of knownluminance and to make color characterization possible.The input voltage to output intensity transfer function ofCRT displays is determined by the physical characteris-tics of the CRT and can be accurately modeled with amodified power function (Brainard, 1989). The mostcommon characterization procedure is to measure theoutput intensity for a set of digital input values, fit amodified power function of voltage to the data to smoothand interpolate it, and then generate exhaustive lookuptables from the fit power function, which can be used bythe experimental software (or loaded into hardware lookuptables).
However, LCD projector transfer functions typicallydo not follow a simple power function. We have devel-oped an accurate characterization procedure that candeal with any relatively smooth, monotonically increas-ing transfer function. The basic steps are as follows.
1. Measure the video card output voltage for everypossible digital-to-analog converter (DAC) value.
2. Measure the projector’s output intensity for a sub-set of possible digital values input to the video card. Sub-tract measurements of the minimum projector intensity(see the explanation below).
wdesired cm= + ∗( ) =( )25 34
25 3122
0.9
0.8
0.7
0.6
0.5
0.4
0.3
0.2
0.1
00 0.1 0.2 0.3 0.4 0.5 0.6 0.7 0.8
x
y
r = L/(L + M)
b =
S/(
L +
M)
0.5 0.6 0.7 0.8 0.9 1
55
50
45
40
35
30
25
20
15
10
5
0
spectral lightstypical CRT gamutBIGMAX w/ filtersBIGMAX w/o filters
1931 CIE (2 Deg) Chromaticity
Cone Chromaticity
spectral lightstypical CRT gamutBIGMAX w/ filtersBIGMAX w/o filters
Figure 4. Comparison of device gamuts in 1931 CIE chro-maticity (top) and MacLeod–Boynton cone chromaticity (bot-tom). The BIGMAX display has a wider gamut around equal-energy white (small squares) in both the red–green and the blue–yellow directions. The outer line in each diagram is the spectrumlocus.

BIGMAX DISPLAY 517
3. Fit a high-order polynomial (14th or 16th orderseems to work well; lower order polynomials do not fol-low the data accurately, whereas higher order polynomi-als oscillate and are affected too much by measurementnoise) to the log10(voltage) versus log10(intensity).
4. Generate a lookup table by using the fit polynomial.Most LCD projectors modulate light from a constant-intensity light source by changing the opacity of threeseparate monochromatic LCD panels (one for each colorchannel), so one would expect that light from the threechannels would add without any interaction. In fact, onewould expect more interaction between color channelsin CRTs, unless digital signal processing (DSP) mixesvideo signals for the three color channels. We confirmedthat light increments in each of the three color channelsadd together precisely. This means that three lookup ta-bles, one for each color channel, are enough to preciselycharacterize the input–output relation of the display.
For reasons that will be discussed below, we decidedto subtract the constant off intensity from our intensitymeasurements, on the assumption that the visual systemadapts to or discounts this constant light.
Color characterization. We found that the spectralradiance distribution of each color channel changes verylittle over a 1,000-fold range of intensities (Figure 5).This makes calibration simple, since it allows desiredcolors to be generated by mixing the three known spec-tral distributions. The procedure was as follows.
1. For each color channel, measure the spectral energyemitted by the display with that channel on while theother two channels are off. Also measure the spectral en-ergy with all three channels off.
2. Subtract the off spectrum from the on spectrum foreach channel (see the explanation below).
3. Calculate L-, M-, and S-cone excitations for eachchannel by convolving the measured (incremental) spec-tra with cone sensitivity functions (cone sensitivities areavailable on Stockman & Sharpe’s Web site, http://www.cvrl.org).
The 3 � 3 matrix of L-, M-, and S-cone excitationsfor the red, green, and blue channels is used to calculateLMS from RGB, and vice versa.
Contrast ratio and minimum luminance. LCD pro-jectors have limited contrast ratio because they emitsome light in the off state. The contrast ratio of our LCDprojector display with dichroic filters inserted is 48 (usingthe ANSI method of measuring a 4 � 4 black-and-whitecheckerboard). However, the early visual system dis-counts constant background light, so for many vision ex-periments, the range between the smallest and the largestreliably produced intensity increments is more importantthan the standard contrast ratio. We measured the ratio ofthe highest possible intensity increment to the smallestreliably produced intensity increment. The smallest in-tensity increment that can be reliably distinguished fromnoise is 1/10,000 of the maximum intensity increment,demonstrating an intensity resolution ample for most vi-sion experiments (Figure 6).
This 4.0 decimal log unit range is equivalent to 13.3bits, approximately equal to the resolution of the 12-bitvideo card we used to drive the projector. When one usesthe 12-bit card and the lookup tables generated by ourcalibration procedure, deviations from linearity are smallacross the range of output intensities: Maximum lumi-
0.2
0.15
0.1
0.05
0400 450 500 550 600 650 700 750
Wavelength (nm)
Nor
mal
ized
Rad
ianc
e(r
adia
nce
at w
avel
engt
h/to
tal r
adia
nce)
max. intensity0.1 � max0.01 � max0.001 � max
Figure 5. The distribution of radiance over the spectrum is constant with intensityover a 1,000-fold range. Shown are normalized measurements for each color channelat 1, 0.1, 0.01, and 0.001� maximum intensity. For this comparison, the constant offlight was subtracted from the measurements, and each resulting radiance distributionwas divided by its total radiance.

518 BEER, MACLEOD, AND MILLER
nance error of a full-intensity stimulus is 1% and, at themost, 10% when very small increments of the dark levelwere called for (see Figure 7).
Spatial characteristics. We found that the spatial res-olution of the BIGMAX display is slightly less than thenominal 1,024 � 768 projector resolution. This is duepartly to light scattered in the optics and partly to the LCDelements, projector electronics, or video card electronics.
To estimate the amount of light scatter in the projectorand external optics, we measured the light shiningthrough a small aperture (slightly larger than a singlepixel, 500 μm) placed on the observer side of the diffuser.The modulation of light shining through the aperturewhile surrounding pixels were turned on and off gave ameasure of light spread. The on–off modulated surroundcontained a dark hole centered on the test pixel. Ideally,the amount of light from the test pixel at the center of thedark hole would have been unaffected by illumination ofthe surround. Figure 8 shows the modulation of lightfrom the test pixel as the surround was switched on andoff, as a function of the radius (in pixels) of the dark hole.Modulation is shown as a proportion of the maximumpossible on–off modulation. The test pixel was brighterwhen immediately surrounding pixels were turned on.However, this effect declines rapidly with distance; thereis less than 2% added light from the test pixel when thesurround is more than 3 pixels (2 arcmin) away.
There is also a modulation of the light intensity of in-dividual pixels that is not due to optics. When the testpixel is turned on at 50% of maximum intensity (rather
than being nominally dark, as in the preceding test), theintensity modulation due to surrounding pixels is greaterthan that in the previous measurement (Figure 8), be-coming less than 2% only when the surround is morethan 24 pixels (18 arcmin) away. This indicates that thereis more than just scattered light from the surround, sincethe surround is identical in both cases and would add thesame amount of scattered light no matter what the inten-sity of the test pixels. This pixel interaction may occurduring processing of the video signal within the projector.
The errors in intensity are small when stimuli consistof a large number of pixels, since they depend on inten-sity differences between adjacent or nearly adjacent pix-els. However, the errors can be significant when imagescontain pixel-level detail. We found one experimentalsituation in which the error was large: single-pixel in-tensity increments on a large background field. WithCRT stimulators, measurements for full-field stimuli arealso valid for relatively small test fields surrounded by adifferent intensity. The lower limit of size is typically onthe order of several pixels and is set by video bandwidth(Brainard, Pelli, & Robson, 2002).
But with LCD stimulators such as the projectors weused, the measured intensity of a single pixel variesstrongly as a function of the surround intensity, evenwhen the customary correction is made for the nonlinearvoltage–intensity relationship measured for large fields.For the measurements shown in Figure 9, a uniform back-ground field was displayed at an intensity shown on thehorizontal axis. A test patch was set to a higher nominal
GREEN10
–4
10–5
10–6
10–7
10–8
10–9
10–10
10–11
102
103
104
105
Mea
sure
d in
tens
ity –
mea
sure
d da
rk in
tens
ity (a
rbitr
ary
units
)
Requested intensity number (0 ➔ 32,767)
median of measured intensitiesstandard error of mean
Figure 6. Measured intensity increment versus the requested intensity (DAC) value, green channel.

BIGMAX DISPLAY 519
intensity than the background level, and we measuredthe resulting increase in the actual intensity of the centerpixels in that test patch. Pixels in small test patches werefound to fall short of the values obtained for large fieldsby up to a factor of seven. The shortfall was greater withsmall increments on dark backgrounds, especially back-grounds of less than 5% of maximum intensity. Althoughinconvenient, these errors appear to be consistent, sopatches of just a few pixels can be accurately rendered bymaking careful calibrations, using the particular stimu-lus configuration of interest. If these pixel-to-pixel de-pendencies are due to interactions within the LCD pan-els, rather than to video signal processing, use of a three-channel digital micromirror projector could eliminatethis problem.
Luminance and color uniformity. There are mea-surable nonuniformities in luminance and chromaticityacross the display screen. Table 1 shows measurementsfor a high-intensity, near-white field. These are constantand probably not important in many applications, sincethey are not easily visible (CRT displays also have sig-nificant luminance nonuniformities). For critical appli-cations, it may be possible to correct these nonuniformi-ties in software or by using a negative photographic mask.
SafetyLight intensity produced by this display will reach
damaging levels if the display is operated without thediffuser, since all the projector light will then be focusedin a very small region. Light intensity can also easily
reach damaging levels if the display is operated withoutsufficiently dense color or neutral density filters. Per-sonnel should never place their eyes in the light path andlook in the direction of the projector; this is especiallyeasy to forget during setup of the display. Experimentalsubjects should not view the display until the safety ofthe light level at the location of the subject is verified tobe safe and until the display is approved by the institu-tion’s review board for the protection of human subjects.Consult standard texts (Optical Society of America, 1995;Sliney & Wolbarsht, 1980) to ensure that infrared, visi-ble, and ultraviolet light delivered to subjects’ eyes is atsafe levels.
SummaryWe present a modified Maxwellian view display that
produces very high intensity images, even with unre-strained binocular viewing. The display is capable ofproducing highly saturated colors, approaching the sat-
GREEN10
–4
10–5
10–6
10–7
10–8
10–9
10–10
102
103
104
105
Mea
sure
d in
tens
ity –
mea
sure
d da
rk in
tens
ity (a
rbitr
ary
units
)
Requested intensity number (0 ➔ 32,767)
median of measured intensitiesstandard error of meanabsolute deviation from linearity
Figure 7. Intensity increment versus LUT-modified DAC value, green channel.
Table 1Luminance and 1931 CIE (2º) Chromaticity at Nine Locations
on the Display Screen for a Uniform Near-White Field
4,800 cd/m2 5,000 cd/m2 4,700 cd/m2
x � 0.37, y � 0.41 x � 0.37, y � 0.41 x � 0.37, y � 0.40
5,400 cd/m2 5,500 cd/m2 5,000 cd/m2
x � 0.35, y � 0.40 x � 0.35, y � 0.38 x � 0.36, y � 0.38
5,300 cd/m2 5,400 cd/m2 4,500 cd/m2
x � 0.34, y � 0.38 x � 0.34, y � 0.36 x � 0.35, y � 0.36

520 BEER, MACLEOD, AND MILLER
black test pixel50% test pixel
1.00
.10
.010 5 10 15 20 25 30 35 40
Distance (pixels), surround to test
Inte
nsity
mod
ulat
ion
of te
st p
ixel
by
surr
ound
(pro
porti
on o
f max
imum
on–
off m
odul
atio
n)
Figure 8. Modulation of light shining through a 500-μμm aperturewhen surrounding pixels are turned fully on and off. Modulation isshown as a proportion of the maximum possible modulation (test pixelon–test pixel off).
Figure 9. Shortfall of increments in intensity of small patches whenthe background intensity varies. Intensity measurements of the centerpixels of each test patch were made through a 500-μμm (~2 � 2 pixel)aperture. Each line represents the measured increment intensity as aproportion of the requested increment, and ideally, each line would behorizontal at 1.0. With dark backgrounds of less than 5% of maximumintensity, the incremental intensity of small test patches is reduced by asmuch as a factor of seven below the value expected on the basis of cali-bration with large stimuli.

BIGMAX DISPLAY 521
uration of spectral colors. It has excellent spatial andgood temporal resolution and can be calibrated for de-manding applications, using the procedures we have described.
Many applications are possible, including experimentsrequiring very high light levels, natural light levels, orextremely saturated colors. The display is not expensive,requires only a moderate amount of work to set up, andcan be customized for desired viewing distance and an-gular subtense. A compact display could be constructedfor in-office clinical diagnosis.
We have used the display to make sensitive, objectivemeasurements of the optical quality of the eye after lensreplacement surgery. A patient’s complaints of glare andhalos were objectively corroborated, and measurementcould be compared with standard estimates of the pointspread function (Beer, MacLeod, & Miller, 2003). Wealso used the display for research in which color codingin the human visual system was investigated (Beer &MacLeod, 2003). These experiments required high colorsaturation and would not have been possible without theextended gamut of this display.
The Extended Maxwellian View (BIGMAX) is a low-cost display system with high intensity, resolution, andsaturated colors for use in clinical, applied, and pure vi-sion research.
REFERENCES
Beer, D., & MacLeod, D. I. A. (2003). Color selectivity in metacon-trast: Asymmetrical and anisotropic. Journal of Vision, 3, 138a.
Beer, D., MacLeod, D. I. A., & Miller, T. (2003). The black hole testfor retinal light spread. ARVO Meeting Abstracts, 44, 4194.
Brainard, D. H. (1989). Calibration of a computer controlled colormonitor. Color Research & Application, 14, 23-34.
Brainard, D. H., Pelli, D. G., & Robson, T. (2002). Display charac-terization. In J. Hornak (Ed.), The encyclopedia of imaging scienceand technology (pp. 172-188). New York: Wiley.
Optical Society of America (1995). Handbook of optics (2nd ed.).New York: McGraw-Hill.
Rushton, W. A. H., & Henry, G. H. (1968). Bleaching and regenera-tion of cone pigments in man. Vision Research, 8, 617-631.
Sliney, D., & Wolbarsht, M. (1980). Safety with lasers and other op-tical sources. New York: Plenum.
Stockman, A., & Sharpe, L. Colour and vision database. Available atwww.cvrl.org.
Westheimer, G. (1966). The Maxwellian view. Vision Research, 6, 669-682.
NOTES
1. It should be possible to use other projector technologies—for ex-ample, Texas Instruments’ DLP—but we have not tried them.
2. InFocus Corporation, 27700B SW Parkway Avenue, Wilsonville,OR 97070-9215 (www.infocus.com), $3,000. This projector is a repack-aged version of the Sanyo PLC-XP21N.
3. Fresnel Technologies Inc., 101 West Morningside Drive, Fort Worth,TX 76110 (www.fresneltech.com). Aspheric Fresnel Lens, $45 each.
4. Physical Optics Corporation, 20600 Gramercy Place, Suite 103, Tor-rance, CA 90501 (www.poc.com). Light Shaping Diffusers, about $300.
5. One source for these are suppliers of telescope objectives—for ex-ample, Island Eyepiece, Box 133, Mill Bay, BC, V0R 2P0 Canada(www.islandeyepiece.com). We bought a Vixen Fraunhofer objectivelens (about $200).
6. LINOS Photonics Inc., 459 Fortune Blvd., Milford, MA 01757(www.linos.com). Dichrolight Filters B-42 Dark Blue, G-50/55 PrimaryGreen, Y-54 Amber, R-65 Primary Red, each about $35.
7. A set of MATLAB scripts implementing the calibration describedabove is available on Beer’s Web site at http://psy.ucsd.edu/~rdbeer.
(Manuscript received January 8, 2004;revision accepted for publication August 14, 2004.)


![Instituto de Cosmologia Relatividade Astrofisica …arXiv:1302.7248v1 [gr-qc] 28 Feb 2013 The Quasi-Maxwellian Equations ofGeneral Relativity: Applications tothe PerturbationTheory](https://img.pdfslide.us/doc/110x75/5f49d23a2fee1040c97c8817/instituto-de-cosmologia-relatividade-astroisica-arxiv13027248v1-gr-qc-28-feb.jpg)