Embed Size (px)
Citation preview

PolicyAnalysisSeptember 10, 2014 | Number 756
EXECUTIVE SUMMARY
Daniel Ikenson is director of the Cato Institute’s Herbert A. Stiefel Center for Trade Policy Studies.
The Export-Import Bank and Its VictimsWhich Industries and States Bear the Brunt?By Daniel Ikenson
The charter of the Export-Import Bank of the United States is set to expire on Sep-tember 30. Proponents of reauthorization claim that by increasing exports and jobs, Ex-Im benefits the U.S. economy. But in
that advocacy, the benefits are exaggerated and the costs totally ignored.
The Bank’s skeptics speak of the opportunity costs that arise when government attempts to allocate resourc-es according to nonmarket criteria. They also note that subsidies provided for the benefit of one exporter put competing firms at an artificial disadvantage. In addition to these opportunity and intra-industry costs, there is a third set of significant costs that are too often forgotten: the downstream industry cost.
Using official input-output tables and seven years of Export-Import Bank transactions records, this analysis estimates the downstream costs of Ex-Im subsidies that are inflicted on manufacturing firms in every industry across every U.S. state. These victims populate 189 of 237 manufacturing sub-industries and all 21 broad manufac-turing industry categories identified under the North
American Industry Classification System, and they incurred a net cost of $2.8 billion per year or $14.7 million per sub-industry per year as a result of Ex-Im policies.
Among the specific sub-industry victims bearing the largest costs are U.S. manufacturers of motor vehicle bodies; computer storage devices; and, photographic and photocopying equipment. The 5 broad manufacturing industries incurring the greatest net costs are producers of electrical equipment, appliances and components; fur-niture; food; nonmetallic mineral products; and, chemi-cals. These 5 most ill-affected manufacturing industries account for 50 percent or more of manufacturing GDP in 7 U.S. states, and the 10 largest victims account for two-thirds or more of manufacturing GDP in 22 states.
In their efforts to win reauthorization from Congress, supporters of the Export-Import Bank rely on exagger-ated claims about the Bank’s benefits, while ignoring its costs. Ex-Im policies reward some companies (in the short run) and penalize many others in the process. These kinds of data are often obscured or ignored, but they are essen-tial to any informed judgments about the propriety and efficacy of the Export-Import Bank.

2
“The main purpose of this analysis is to expose the unseen costs, explain that collateral damage must be taken into account when considering the net effects of the Export-Import Bank, and show which industries and states bear the brunt of those costs.”
INTRODUCTION
The Export-Import Bank of the United States is a government-run export credit agen-cy, which provides special financing arrange-ments to facilitate sales between certain U.S. companies and foreign customers. For several months, Washington has been embroiled in a debate over whether to reauthorize the Bank’s charter, which will otherwise expire on Sep-tember 30.
Reauthorization advocates contend that Ex-Im fills a void left by private sector lenders unwilling to finance certain riskier transac-tions and, by doing so, contributes important-ly to U.S. export and job growth. Moreover, rather than burdening taxpayers, the Bank generates profits for the Treasury, helps small businesses succeed abroad, encourages ex-ports of “green” goods, contributes to devel-opment in sub-Saharan Africa, and helps “level the playing field” for U.S. companies compet-ing in export markets with foreign companies supported by their own governments’ gener-ous export financing programs. So what’s not to like about Ex-Im?
First, by dismissing the risk assessments of private-sector, profit-maximizing financial firms and making lending decisions based on nonmarket criteria to pursue often opaque, po-litical objectives, Ex-Im misallocates resources and puts taxpayer dollars at risk. That Ex-Im is currently self-financing and generating rev-enues is entirely beside the point. Ex-Im’s revenue stream depends on whether foreign borrowers are willing and able to service their loans, which is a function of global economic conditions beyond the control of Ex-Im. Given the large concentration of aircraft loans in its portfolio, for example, Ex-Im is heavily ex-posed to the consequences of a decline in de-mand for air travel. Recall that Fannie Mae and Freddie Mac also showed book profits for years until the housing market suddenly crashed and taxpayers were left holding the bag.
Second, even if taxpayers had tolerance for such risk taking, the claim that Ex-Im ex-ists to help small businesses is belied by the
fact that most of Ex-Im’s loan portfolio value is concentrated among a handful of large U.S. companies. In 2013 roughly 75 percent of the value of Ex-Im loans, guarantees, and insur-ance were granted on behalf of 10 large compa-nies, including Boeing, General Electric, Dow Chemical, Bechtel, and Caterpillar.1
Third, the notion that because Beijing, Brasilia, and Brussels subsidize their exporters Washington must, too, is a rationalization that sweeps under the rug the fact that there are dozens of criteria that feed into the ultimate purchasing decision, including product quality, price, producer’s reputation, local investment and employment opportunities created by the sale, warranties, after-market servicing, and the extent to which the transaction contrib-utes toward building a long-term relationship between buyer and seller. To say that U.S. ex-porters need assistance with financing to “lev-el the playing field” suggests that they lack ad-vantages among the multitude of factors that inform the purchasing decision. Moreover, if the offer of cheap financing is the determin-ing factor in these international transactions, what is to stop a growing number of inefficient low-quality producers from contesting these markets with ever-increasing subsidies from their own governments? U.S. companies and the taxpayers that would support them would be better off not competing for these markets if the key to winning foreign customers is par-ticipating in an endless subsidies race.
Fourth, by trying to “level the playing field” with foreign companies backed by their own governments, Ex-Im “unlevels” the playing field for many more U.S. companies compet-ing at home and abroad. This adverse effect has been ignored, downplayed, or mischarac-terized, but the collateral damage is substan-tial and should be a central part of the story.
At the risk of giving short shrift to the mul-titude of other legitimate objections to Ex-Im and its operations—many of which have been described and well-documented by current and former policy scholars2—the main pur-pose of this analysis is to expose the unseen costs, explain that collateral damage must be

3
“While Ex-Im financing reduces the cost of doing business for the lucky U.S. exporter and reduces the cost of capital for his foreign customer, it hurts U.S. competitors of the U.S. exporter, as well as U.S. competitors of his foreign customer by putting them at relative cost disadvantag-es.”
taken into account when considering the net effects of the Export-Import Bank, and show which industries and states bear the brunt of those costs. After all is laid bare and a full and proper accounting is taken, it will be clear that Ex-Im’s policies impose significant costs on manufacturing firms across every industry and in every U.S. state.
THE COSTS OF EX-IM FINANCING
When the Export-Import Bank provides financing to a U.S. company’s foreign customer on terms more favorable than he can secure elsewhere, it may be facilitating a transaction that would not otherwise occur. That is the ba-sis for Ex-Im’s claim that it helps the U.S. econ-omy by increasing exports and “supporting” jobs.3 But that claim is questionable because those resources might have created more value or more jobs if deployed in the private sector instead. If that were the case, Ex-Im’s transac-tion imposes a net loss on the economy.
But suppose it could be demonstrated that Ex-Im transactions grow the economy larger or create more jobs than if those resources had been deployed in the private sector instead. Would Ex-Im then be correct in its claim? Not necessarily. Further analysis is required.
Ex-Im financing helps two sets of compa-nies (in the short-run): U.S. firms whose export prices are subsidized by below market rate fi-nancing and the foreign firms who purchase those subsidized exports. It stands to reason, then, that those same transactions might im-pose costs on two different sets of companies: competing U.S. firms in the same industry who do not get Ex-Im backing, and U.S. firms in downstream industries, whose foreign compe-tition is now benefitting from reduced capital costs courtesy of U.S. government subsidies. While Ex-Im financing reduces the cost of doing business for the lucky U.S. exporter and reduces the cost of capital for his foreign cus-tomer, it hurts U.S. competitors of the U.S. exporter, as well as U.S. competitors of his for-eign customer by putting them at relative cost disadvantages.
These effects are neither theoretical nor difficult to comprehend. Yet proponents of Ex-Im reauthorization rarely acknowledge, let alone concede, that these are real costs perti-nent to any legitimate net benefits calculation. Instead, they speak only of the gross benefits of export subsidies, which they consider to be the value of exports supported by their autho-rizations.4
But there are at least three sets of costs that are essential to determining the net benefits of Ex-Im: (1) the “Opportunity Cost,” repre-sented by the export growth that would have obtained had Ex-Im’s resources been deployed in the private sector; (2) the “Intra-Industry Cost,” represented by the relative cost disad-vantage imposed on the other U.S. firms in the same industry (the domestic competitors) as a result of Ex-Im’s subsidies to a particular firm in the industry, and; (3) the “Downstream In-dustry Cost,” represented by the relative cost disadvantage imposed on the U.S. competitors of the subsidized foreign customer.
The Opportunity Cost is difficult to esti-mate. The “what-would-have-happened” coun-terfactual requires a variety of assumptions about average economic variables and their relationships, each with its own probability of occurrence. The assumptions necessary to generate such an estimate would significantly influence its value. For the sake of not bogging down the analysis in such detail or with con-testable assumptions, suffice it to recognize that opportunity costs exist. Indeed, oppor-tunity costs always exist when there are fore-gone alternatives to the path chosen. But for the sake of argument and the purpose of this study, assume that the overall opportunity cost of Ex-Im is $0. In other words, there will be no attempt here to quantify the opportunity cost of Ex-Im.
The Intra-Industry Cost is somewhat eas-ier to calculate, in theory. If Ex-Im provides a $50 million loan to a foreign farm equipment manufacturer to purchase steel from U.S. Steel Corporation, the transaction may benefit U.S. Steel, but it hurts competitors like Nucor, Steel Dynamics, AK Steel, and dozens of other

4
“Ex-Im helps some U.S. companies increase their exports sales. But it hinders other U.S. companies’ efforts to compete at home and abroad.”
steel firms operating in the United States and competing for the same customers at home and abroad. The $50 million subsidy to U.S. Steel is a cost to the other firms in the industry, who can attribute a $50 million revenue gap between them (aggregated) and U.S. steel to a government intervention that picked a win-ner and made them, relatively speaking, losers. The $50 million “benefit” for U.S. Steel is a $50 million cost to the other steel firms. But the distortion is then compounded when taking into consideration the dynamics that would have played out had the best firm—the one offering the most value for the best price—se-cured that export deal instead. Reaching rev-enue targets, raising capital, and moving down the production cost curve to generate lower unit costs all become more difficult to achieve on account of the original intervention, ampli-fying the adverse impact on other firms in the industry. When government intervenes with subsidies that tilt the playing field in favor of a particular firm, it simultaneously penalizes the other firms in the industry and changes the competitive industry dynamics going forward.
Every Ex-Im transaction touted for boost-ing U.S. exports creates victims within the same U.S. industry. Without Ex-Im’s interven-tion, Nucor might have been able to win that foreign farm equipment producer’s business, which is a prospect that undermines the prem-ise that Ex-Im boosts exports at all and rein-forces the point that it merely shifts resources around without creating value, and possibly destroys it. What is given to U.S. steel is taken from Nucor and the other firms, among whom may be the more efficient producers. Consid-ering only the intra-industry costs there is a strong case to be made that the net benefits of Ex-Im are at best $0.
But, again, for the sake of argument and the purpose of this paper, assume that the ben-efits do equal the amount of Ex-Im subsidies and that these transactions impose no costs on other firms in the industry. In other words, assume the intra-industry costs also equal $0.
The Downstream Industry costs are those imposed by the transaction on the U.S. compa-
nies that compete with the foreign customer. When a foreign farm machinery producer purchases steel on credit at subsidized interest rates, it obtains an advantage over its competi-tors—including its U.S. competitors. So, when that subsidized rate comes courtesy of a U.S. government program committed to increas-ing U.S. exports, it only seems reasonable to consider the effects on firms in downstream U.S. industries before claiming success. Has the subsidy to the foreign farm machinery producer made John Deere, Caterpillar, New Holland, or other U.S. farm machinery pro-ducers less competitive? Has it hurt their bot-tom lines?
To give a live example, Delta Airlines has been vocal in its objection to Ex-Im-facilitat-ed sales of Boeing jetliners to foreign carriers, such as Air India. Delta rightly complains that the U.S. government, as a matter of policy, is subsidizing Delta’s foreign competition by re-ducing Air India’s cost of capital. That cost re-duction enables Air India to offer lower prices in its bid to compete for passengers, which has a direct impact on Delta’s bottom line. This is a legitimate concern and it is not limited to this example.
Consider the generic case. A U.S. supplier sells to both U.S. and foreign customers. Those customers compete in the same downstream industry in the U.S. and foreign markets. Ex-Im is happy to provide financing to facilitate the sale, as its mission is to increase exports and create jobs. The U.S. supplier is thrilled that Ex-Im is providing his foreign customer with cheap credit because it spares him from having to offer a lower price or from sweeten-ing the deal in some other way to win the busi-ness. The foreign customer is happy to accept the advantageous financing for a variety of reasons, among which is the fact that his capi-tal costs are now lower relative to what they would have been and relative to the costs of his competitors—including his U.S. competitors, who are now on the outside looking in.
Ex-Im helps some U.S. companies increase their exports sales. But it hinders other U.S. companies’ efforts to compete at home and

5
“Supporters tend only to speak of the benefits of Ex-Im activities, as if there were no opportunity costs, intra-industry costs, or downstream industry costs.”
abroad. Moreover, by subsidizing export sales, Ex-Im artificially diverts domestic supply, pos-sibly causing U.S. prices to rise and rendering U.S. customers less important to their U.S. suppliers. Especially in industries where there are few producers, numerous customers, and limited substitute products, Ex-Im disrupts the relationships between U.S. buyers and U.S. sellers by infusing the latter with greater mar-ket power and leverage.
Delta was able to connect the dots. Other companies have, too. But most of the time, the downstream U.S. companies are unwitting victims of this gradual and silent cost-shifting.
UPSTREAM BENEFITS AND DOWNSTREAM COSTS
Supporters tend only to speak of the ben-efits of Ex-Im activities, as if there were no op-portunity costs, intra-industry costs, or down-stream industry costs. But those costs exist and they need to be taken into consideration as part of a net benefit analysis, where:
Net Benefit = Gross Benefit – Opportunity Cost – Intra-Industry Cost – Downstream Industry Cost
While it is intuitive that the full costs of Ex-Im include the opportunity costs and intra-industry costs, as explained earlier, their esti-mation requires making certain assumptions and assigning probabilities that are contest-able and that would detract from the thrust of this analysis. Suffice it to recognize that these costs are real, but go uncaptured in the follow-ing analysis. By setting those costs to zero, the equation becomes:
Net Benefit = Gross Benefit – Downstream Industry Cost
To estimate benefits, Export-Import Bank transaction data for the period 2007–2013—compiled from annual reports—were obtained from the Ex-Im website.5 Based on the infor-mation in the product description field, each
record was assigned a six-digit North Ameri-can Industry Classification System (NAICS) code. The NAICS is “the standard used by Federal statistical agencies in classifying busi-ness establishments for the purpose of col-lecting, analyzing, and publishing statistical data related to the U.S. business economy.”6 A six-digit NAICS code identifies an industry at the most detailed level of specificity, while a three-digit code reflects the aggregated in-dustry classification. For example, NAICS 336111 represents “Automobile Manufactur-ing,” which is a subset of NAICS 33611 (“Auto-mobile and Light Duty Motor Vehicle Manu-facturing”), which is a subset of NAICS 3361 (“Motor Vehicle Manufacturing”), which is a subset of NAICS 336, representing the broad-er Transportation Equipment Manufacturing industry. All NAICS codes that begin with the numbers 31–33 represent industries within the manufacturing sector. At the three-digit level, there are 21 official manufacturing industries in the United States. At the six-digit level, there are 237 individual manufacturing sector sub-industries.7
The following summary statistics derive from these data:
■ Ex-Im authorized $167.8 billion over 24,366 transactions during the seven-year period, which comes to about $24 billion per year and $6.9 million per transaction;
■ Manufactured exports accounted for $107.1 billion and 14,101 transactions for an average of about $15 billion per year and $7.6 million per transaction;
■ Aircraft accounted for nearly $57 bil-lion of the manufacturing total, which was spread over 722 authorizations, the average value of which was about $80 million—more than 10 times the value of the average manufacturing sector trans-action;
■ Producers in all 21 broad manufacturing industries (3-digit NAICS) received sub-sidies;
■ Producers in 225 of 237 manufacturing

6
“Among the most prominent issues in trade policy in recent years has been concern about globally in-terdependent supply chains and how policy is used to extract advantages for some and impose costs on other segments of the supply chain.”
sub-industries (6-digit NAICS) received subsidies.
While aircraft manufacturers (NAICS 336411)—Boeing, primarily—received $57 bil-lion over the seven-year period, additional subsidies, to the tune of almost $50 billion, were provided to exporters in all 21 broad U.S. manufacturing industries from food, textiles, and wood products to machinery, computers, and transportation equipment.
At the six-digit level of specificity, manu-facturers in 225 of 236 industries partook of the $50 billion in non-aircraft manufacturing largesse.8 The range of subsidies spans from $0 (for 11 industries receiving no benefits) to $5.2 billion (for “turbine and turbine generator set units”). The median value was $39.9 million and the mean (skewed far to the right by bil-lion dollar-plus subsidies to 11 industries) was $213.9 million.
Although subsidies like these have been shown to weaken firms over time by reducing their incentive to be efficient and competitive, this analysis assumes that the subsidy amounts authorized are approximations of the “ben-efits” of Ex-Im.9 The analysis takes as given the claim that the value of Ex-Im’s authorizations are benefits that translate dollar-for-dollar into U.S. exports that would not have materialized in the absence of Ex-Im support. In other words, the analysis accepts the rationale for Ex-Im’s existence put forth in its marketing mate-rials, so as to focus on one major oversight.
Consider the impact on firms in down-stream industries. As already described, when companies are given artificial incentives to ex-port, industries downstream to the subsidized exporters bear a cost. Domestic supply is di-verted, more market power is bestowed upon upstream suppliers, and foreign competitors’ capital costs are reduced, giving them an ad-vantage over U.S. firms.
These effects are not merely theoretical. Among the most prominent issues in trade policy in recent years has been concern about globally interdependent supply chains and how policy is used to extract advantages for
some and impose costs on other segments of the supply chain. In recent years, the U.S. gov-ernment brought disputes to the World Trade Organization in hopes of ending Chinese export restrictions on certain raw materials and “rare earth” elements. In both cases, the adverse economic impacts of the restrictions on downstream U.S. industries were the main reasons for pursuing dispute resolution. Then-U.S. Trade Representative Ron Kirk had the following to say about the matter:
China maintains a number of measures that restrain exports of raw material in-puts for which it is the top, or near top, world producer. These measures skew the playing field against the United States and other countries by creating substantial competitive benefits for downstream Chinese producers that use the inputs in the production and export of numerous processed steel, aluminum and chemical products and a wide range of further processed products.10
Policymakers are aware that restrictions on access to crucial intermediate goods raise pro-duction costs for industry. Some have worked to remove unnecessary impediments. Tradi-tionally, the Miscellaneous Tariff Bill has been a legislative vehicle for removing nuisance tar-iffs on industrial inputs.11 Upon signing the last MTB into law, President Obama said:
To make their products, manufactur-ers—some of whom are represented here today—often have to import cer-tain materials from other countries and pay tariffs on those materials. This leg-islation will reduce or eliminate some of those tariffs, which will significantly lower costs for American companies across the manufacturing landscape—from cars to chemicals; medical devices to sporting goods. And that will boost output, support good jobs here at home, and lower prices for American consum-ers.12

7
“Trade restrictions that impede domestic producers’ access to inputs put them at a cost disadvantage vis-à-vis foreign com-petitors with better access. Likewise, export subsidies—by encouraging exports—have the same deleterious effects on domestic downstream industries.”
Ready access to imported intermediate goods is paramount to manufacturing success in our globalized economy. Over the past five years, “industrial supplies and materials” and “capital goods except automotive” accounted for an average of 55 percent of goods imports.13 These are the purchases of U.S. downstream industries. Trade restrictions that impede do-mestic producers’ access to inputs put them at a cost disadvantage vis-à-vis foreign competi-tors with better access. Likewise, export subsi-dies—by encouraging exports—have the same deleterious effects on domestic downstream industries. These costs are real and there is no ignoring them in any legitimate analysis of the effect of Ex-Im’s policies.
ANALYSIS METHODOLOGY
Returning to the fictitious example of steel sales to foreign farm equipment producers, the $50 million loan to the foreign customer would be counted as a $50 million benefit to the U.S. economy, according to Ex-Im’s methodology. In reality, the benefit accrues to U.S. Steel Corpo-ration—not the broader economy—and some percentage of that $50 million is a cost borne by U.S. farm equipment producers.
What percentage? That depends on steel’s relative importance as an input in the produc-tion of farm equipment. If steel accounts for 90 percent of the cost of all intermediate inputs used in farm equipment manufacturing, then $45 million would be the cost borne by that in-dustry (0.9 x $50 million). If steel accounts for only 10 percent of the value of all intermediate inputs used to manufacture farm equipment, then $5 million would be the cost to the indus-try (0.1 x $50 million). Weighting is necessary because the extent of the cost inflicted on the downstream U.S industry depends on the im-portance of the intermediate good being sub-sidized to the production of the downstream product. If steel only accounts for 10 percent of all input costs, then subsidized steel sales to foreign companies have a smaller competitive impact on U.S. firms than if steel accounted for a larger share of the input costs.
Ideally, this approach to calculating the benefits and downstream costs would be pos-sible. But customer names in the Ex-Im da-tabase are often missing or cryptic and the records lack information about the buyer’s industry. Thus, it would be difficult to discern the name of U.S. Steel’s foreign customer (in the fictitious example) using the Ex-Im data-base and even more difficult to ascertain that the customer is in the farm equipment manu-facturing industry. Moreover, U.S. farm equip-ment manufacturers would not be the only victims in this transaction. They are most ad-versely affected because their foreign compe-tition is being directly subsidized by U.S. tax-payers, but other U.S. industries that consume steel are adversely affected by the supply diver-sion and its impact on the balance of market power between them and their steel suppliers.
These impediments necessitate a different approach. Fairly precise calculations of the benefits of Ex-Im by industry can be culled directly from the transactions database. Al-though the name of the exporter or supplier is frequently missing, product descriptions (and thus NAICS product codes) are available for 23,606 of 24,366 transactions. And the real costs of Ex-Im’s subsidies can be estimated us-ing input-output tables in conjunction with the Ex-Im transactions database. On its web-site, the Bureau of Economic Analysis main-tains a set of input-output tables that map the relationships between industries throughout the U.S. economy. Among the information that can be discerned from those tables are the disposition of output from any and all in-dustries and the input use requirements of any and all industries.14
The first observation about the BEA 2007 I-O Use Table is that 45 percent of the value of all U.S. economic output is consumed as in-puts in the production of other industries.15 The interdependence of industries is even more striking with respect to manufacturing output, of which 55 percent is consumed as inputs in the production of other industries.16 The I-O table also reveals how many indus-tries’ output each industry requires as inputs
8
“The cost of Ex-Im to Industry X was calculated as the benefits accruing to every industry upstream of Industry X, weighted by the relative importance of each upstream industry’s output as an input to Industry X, and then ag-gregated.”
for its own production, as well as how much output it requires from each. With this snap-shot of industrial interdependence in mind, it is not so difficult to understand how artificial incentives aimed at changing the behavior of particular firms or industries can have ripple effects throughout the economy.
The benefit of Ex-Im to a given industry (Industry X) was calculated simply as the ag-gregate of Ex-Im subsidies for all companies in Industry X. The cost of Ex-Im to Industry X was calculated as the benefits accruing to ev-ery industry upstream of Industry X, weighted by the relative importance of each upstream industry’s output as an input to Industry X, and then aggregated.
Assume Industry X produces widgets from rubber, steel, and paint and that those three inputs account for 50 percent, 30 percent, and 20 percent, respectively, of Industry X’s input
costs. To derive the downstream cost imposed on Industry X, the following steps are necessary:
1. Identify Industry X’s upstream indus-tries (three, in this example).
2. Total the value of Ex-Im subsidies given to each upstream industry.
3. Weight the value of each total by the relative importance of each input: (.5 × rubber subsidies) + (.3 × steel subsidies) + (.2 × paint subsidies).
4. Aggregate the weighted values.
This process was undertaken for every indus-try and the adjusted, aggregated costs ranged from $8.0 million for “Primary smelting and refining of copper” (331411) to $2.6 billion for “Broadcast and wireless communications equipment manufacturing” (334220) with a median value of $132.2 million.
1,000,000
10,000,000
100,000,000
1,000,000,000
10,000,000,000
1,000,000 10,000,000 100,000,000 1,000,000,000
Figure 1Scatterplot of 236 Sub-Industries in Cost-Benefit Space
$ to
Upstr
eam
Sup
plier
s
$ Benefits from Ex-Im
An Industry-by-Industry Snapshot of the Benefits and Costs of Ex-Im($ Received from Ex-Im and $ Received by Upstream Suppliers by NAICS-6 Code)
Source: Compiled from Bureau of Economic Analysis, Input-Output Use Table, http://www.bea.gov/industry/xls/iouse_before_redefinitions_pur_2007_detail.xlsx; and Export-Import Bank of the United States, FFATA (Federal Funding Accountability and Transparency Act) Transaction Information, 2007–2013, http://www.exim.gov/about/library/foia/Frequently-Requested-Reports-and-Information.cfm.

9
“Using this conservative approach to estimating the often ignored costs of Ex-Im’s subsidies, 189 of the 236 non-aircraft U.S manufac-turing indus-tries can be characterized as victims.”
IDENTIFYING THE VICTIMS
Plotting these costs on the vertical axis and combining with the benefits on the horizontal axis, the scatterplot tells the first part of the story (see Figure 1).
First note that the axes are in logarithmic scales because otherwise the wide range of values for both metrics would have stretched both axes to the point of obscuring the details. Values on the X-axis represent benefits (dollar authorizations from Ex-Im) to each industry and values of the Y-axis represent costs (ad-justed, aggregated benefits to each industry’s upstream supplier industries).
The quadrants are formed by the intersec-tion of the lines drawn at the median values of each metric. Accordingly, the top-right and bottom-right quadrants are populated by in-dustries that received above-median benefits and the top-left and bottom-left quadrants show industries that received below-median benefits. Likewise, the top-left and top-right quadrants contain industries that incurred above-median costs and the lower-left and lower-right quadrants are populated by indus-tries that incurred below-median costs.
With that in mind, the 36 industries repre-sented by dots in the bottom-right quadrant are those industries that received above-medi-an benefits and incurred below-median costs. One might expect to find the “winners” of Ex-Im’s policies concentrated in this most de-sirable quadrant. The 82 industries in the top-right quadrant are those that received above-median benefits and incurred above-median costs. The 82 industries in the bottom-left re-ceived below-median benefits and incurred below-median costs. And the 36 industries in the top-left received below-median benefits and incurred above-median costs, which by most definitions would constitute the “vic-tims” of Ex-Im’s policies.
Indeed, each of the 36 industries in the top left quadrant is an Ex-Im victim, which is de-fined as an industry with negative “net” benefits (where benefit minus cost is less than $0). But the other quadrants are also heavily populated
by industries with negative net benefits. Even though their benefits were above the median benefit and their costs were below the median cost, 24 of the 36 industries in the bottom-right quadrant incurred costs in excess of benefits; 48 of 82 in the top right quadrant had negative net benefits; and the same is true of 81 of the 82 industries in the bottom left quadrant. Using this conservative approach to estimating the often ignored costs of Ex-Im’s subsidies, 189 of the 236 non-aircraft U.S manufacturing indus-tries can be characterized as victims.
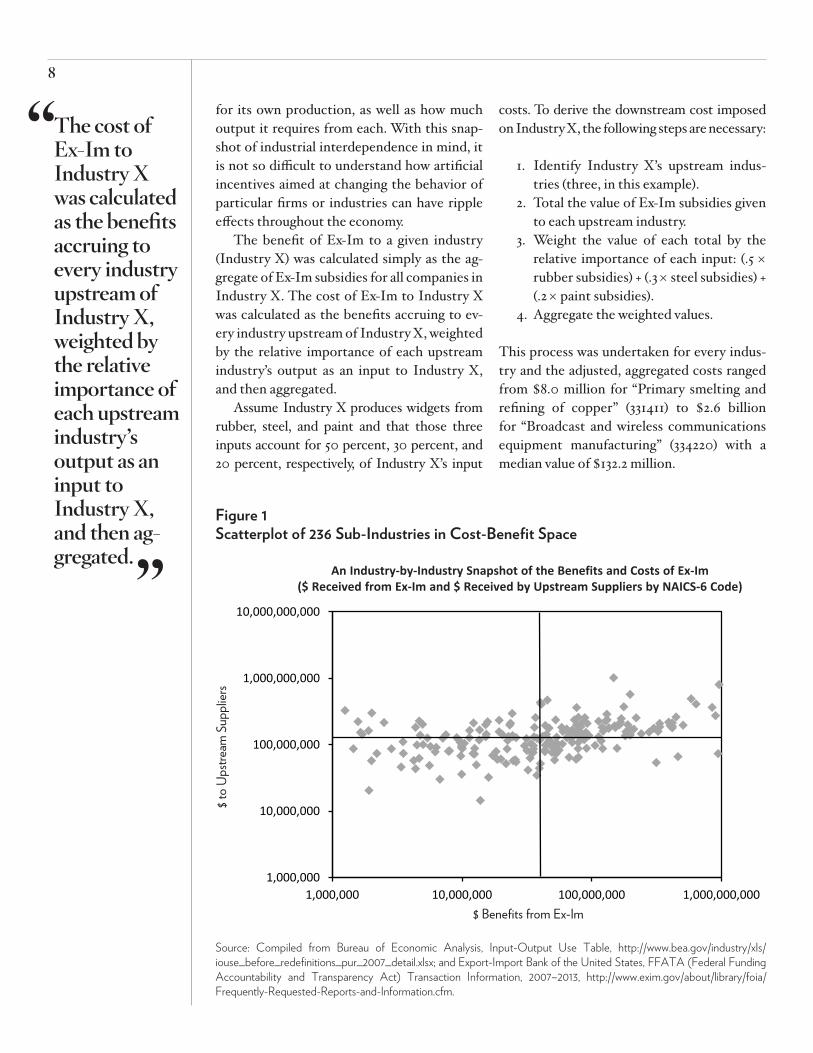
While the appendix contains data for all 236 non-aircraft manufacturing industries plotted in Figure 1, the following table reveals details for the 25 biggest victims (those incur-ring the largest net costs).
It turns out that for nearly every Ex-Im fi-nancing authorization that might advance the fortunes of a single U.S. company, there is at least one U.S. industry—and often dozens or scores of industries—whose firms are adversely impacted because supply is being diverted, market power is being shifted, and the cost of capital is being lowered for their foreign com-petition.
Telephone apparatus manufacturing (NA-ICS 334210), which falls within the comput-ers and electronics industry (NAICS 334), incurred the greatest net cost among all manu-facturers. As shown in the table, companies in the industry received $148 million of ex-port subsidies over the seven-year period. But telephone apparatus manufacturing relies on the output of 51 upstream industries, which received an aggregate total of nearly $12 bil-lion in subsidies over the period. Weighting those subsidies by the relative importance of each industry’s output to the production of telephone apparatus (and then aggregating) generates the cost of Ex-Im to manufactur-ers in this industry. With just over $1 billion in downstream costs, the net benefits of Ex-Im to this industry amount to -$875 million or a cost of $125 million per year.
A total of 189 out of 236 industries populat-ing all of the 21 broad manufacturing industries can be counted among Ex-Im’s victims. The
10Ta
ble 1
Top
25 M
anuf
actu
ring
Indu
stry V
ictim
s of E
x-Im
Ban
k Sub
sidies
NAI
CS 6
Sub-
Indu
stry D
escr
iptio
nSu
bsid
ies to
In
dustr
y ($)
Upstr
eam
In
dustr
ies
(#)
Subs
idies
to
Upstr
eam
In
dustr
ies ($
)Co
st to
In
dustr
y ($)
Net
Ben
efits
($
)An
nuali
zed
Net
Be
nefit
s ($)
3342
10Te
lepho
ne ap
para
tus m
anuf
actu
ring
147,4
19,99
851
11,96
6,645
,775
1,022
,056
,608
-874
,636,6
10-12
4,948
,087
3335
14Sp
ecial
tool,
die,
jig, a
nd fi
xtur
e man
ufac
turin
g45
,429,0
8148
9,564
,286,9
0947
1,006
,342
-425
,577,2
61-6
0,79
6,752
3336
18O
ther
engi
ne eq
uipm
ent m
anuf
actu
ring
40,0
88,0
6883
83,60
6,086
,497
432,8
82,19
7-3
92,79
4,129
-56,1
13,44
733
4290
Oth
er co
mm
unica
tions
equip
men
t man
ufac
turin
g19
7,646
,244
5011,
503,0
18,76
757
4,087
,131
-376
,440,
887
-53,7
77,27
033
4512
Auto
mat
ic en
viron
men
tal c
ontro
l man
ufac
turin
g40
,851,0
0944
10,91
1,586
,754
409,2
60,61
8-3
68,40
9,609
-52,6
29,94
433
4418
ed ci
rcuit
asse
mbl
y (ele
ctro
nic as
sem
bly)
man
ufac
turin
g1,2
50,0
0065
15,24
6,770
,927
329,0
87,59
3-3
27,83
7,593
-46,8
33,94
233
2114
Cus
tom
roll f
orm
ing2,0
10,0
0035
6,472
,306,7
5830
1,401
,728
-299
,391,7
28-4
2,770
,247
3364
13O
ther
airc
raft
parts
and
auxil
iary e
quip
men
t man
ufac
turin
g76
,376,4
7058
71,80
6,833
,591
363,7
70,47
1-2
87,39
4,001
-41,0
56,28
633
2420
Met
al ta
nk (h
eavy
gau
ge) m
anuf
actu
ring
24,32
6,704
5215
,160,
978,3
0829
6,482
,820
-272
,156,1
16-3
8,879
,445
3362
13M
otor
hom
e man
ufac
turin
g0
608,5
78,63
5,873
254,
240,
593
-254
,240,
593
-36,3
20,0
8533
3220
Plas
tics a
nd ru
bber
indu
stry m
achin
ery m
anuf
actu
ring
057
15,90
6,824
,085
238,9
68,56
2-2
38,96
8,562
-34,1
38,36
633
4514
Tota
lizing
fluid
met
er an
d co
untin
g de
vice m
anuf
actu
ring
4,672
,000
5013
,671,7
74,49
722
8,118
,535
-223
,446,5
35-3
1,920
,934
3333
15Ph
otog
raph
ic an
d ph
otoc
opyin
g eq
uipm
ent m
anuf
actu
ring
1,575
,000
416,5
12,78
4,24
622
3,671
,500
-222
,096
,500
-31,7
28,0
7133
6370
Mot
or ve
hicle
met
al sta
mpi
ng36
,831,3
0361
10,54
4,408
,152
257,2
25,15
6-2
20,39
3,853
-31,4
84,83
633
211B
Cro
wn an
d clo
sure
man
ufac
turin
g an
d m
etal
stam
ping
19,31
2,482
5310
,022
,336,4
1923
4,638
,448
-215
,325,9
66-3
0,76
0,85
233
9115
Oph
thalm
ic go
ods m
anuf
actu
ring
2,500
,000
416,4
97,70
7,509
216,3
38,34
4-2
13,83
8,344
-30,
548,3
3533
4112
Com
pute
r sto
rage
dev
ice m
anuf
actu
ring
15,74
5,436
457,1
62,66
4,633
222,4
44,79
3-2
06,69
9,357
-29,5
28,48
033
7215
Show
case
, par
tition
, she
lving
, and
lock
er m
anuf
actu
ring
12,25
0,00
057
8,26
7,861
,428
213,3
80,34
0-2
01,13
0,34
0-2
8,732
,906
3371
10W
ood
kitch
en ca
bine
t and
coun
terto
p m
anuf
actu
ring
4,960
,000
456,7
13,20
3,059
203,5
08,60
0-19
8,548
,600
-28,3
64,0
8633
4511
Sear
ch, d
etec
tion,
and
navig
ation
instr
umen
ts m
anuf
actu
ring
176,7
15,15
078
16,37
2,746
,193
373,4
09,39
1-19
6,694
,242
-28,0
99,17
733
6320
Mot
or ve
hicle
electr
ical a
nd el
ectro
nic eq
uipm
ent m
anuf
actu
ring
400,
000
7815
,496,7
03,0
6619
5,146
,612
-194,7
46,61
2-2
7,820
,945
3328
00C
oatin
g, en
grav
ing, h
eat t
reat
ing an
d all
ied ac
tivitie
s23
,620,
000
5411,
118,36
0,74
521
1,247
,025
-187,6
27,0
25-2
6,803
,861
3334
14He
ating
equip
men
t (ex
cept
war
m ai
r fur
nace
s) m
anuf
actu
ring
15,18
5,000
5115
,541,9
54,57
720
0,80
5,406
-185,6
20,40
6-2
6,517,
201
3160
00Le
athe
r and
allie
d pr
oduc
t man
ufac
turin
g52
,690,
000
405,3
21,23
9,152
237,3
39,97
7-18
4,649
,977
-26,3
78,56
833
6211
Mot
or ve
hicle
body
man
ufac
turin
g78
,836,3
0661
10,42
6,401
,039
259,2
39,99
4-18
0,40
3,688
-25,7
71,95
5
Com
piled
from
Bur
eau
of E
cono
mic
Ana
lysis,
Inpu
t-Out
put U
se T
able,
http
://ww
w.be
a.gov
/indu
stry/
xls/io
use_
befo
re_r
edef
initio
ns_p
ur_2
007_
deta
il.xlsx
; and
Exp
ort-I
mpo
rt Ba
nk o
f the
Unit
ed S
tate
s, FF
ATA
(Fed
eral
Fund
ing A
ccou
ntab
ility a
nd T
rans
pare
ncy A
ct) T
rans
actio
n In
form
atio
n, 20
07-2
013,
http
://ww
w.ex
im.g
ov/a
bout
/libr
ary/
foia/
Freq
uent
ly-Re
ques
ted-
Repo
rts-a
nd-In
form
atio
n.cfm
.”
11
“One would be hard-pressed to find a better example of a policy that produces a few winners at the expense of a multitude of losers.”
annual cost for these 189 victims was an aggre-gated $2.8 billion or $14.7 million per industry. There are hundreds and probably thousands of U.S. companies scattered over these 189 in-dustries that produce in the United States, em-ploy American workers, pay federal, state, and local taxes, and contribute to the social fabric of the communities in which they operate. But they are competitively disadvantaged—victim-ized—by Ex-Im’s provision of subsidies that benefit their foreign competitors and reduce their leverage vis-à-vis their U.S. suppliers. These are the unseen consequences—the col-lateral damage—of Ex-Im’s mission.
Meanwhile, a total of 47 of 236 manufac-turing sub-industries populating 13 of 21 broad manufacturing industries can be counted among Ex-Im’s “winners.” Between 2007 and 2013, gross Ex-Im benefits of $42.8 billion and downstream costs of $13.3 billion accrued to these 47 winners, who realized a net benefit of $29.5 billion or $4.2 billion per year or $89.8 million per sub-industry per year as a result of Ex-Im.
In essence, Ex-Im policies amount to a net tax of $2.8 billion per year on 189 sub-indus-tries ($15 million per industry) and a net sub-sidy of $4.2 billion per year to 47 sub-industries ($90 million per industry). For the winners, the downstream costs amount to less than one-third of the benefits received; for the los-ers, who outnumber the winners by a margin of 4-to-1, the costs are more than triple the benefits. One would be hard-pressed to find a better example of a policy that produces a few winners at the expense of a multitude of losers.
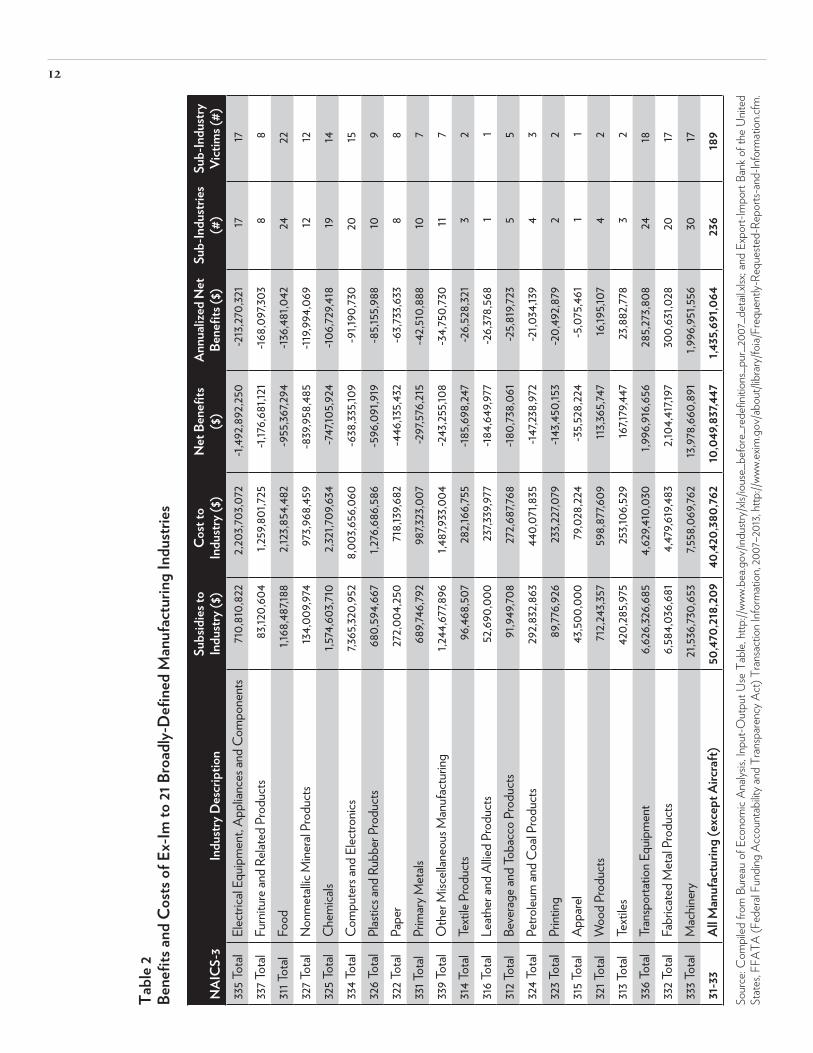
Table 2 presents the results consolidated at the 3-digit NAICS level to provide more of a bird’s-eye view of the benefits received and costs incurred by industry. The data are pre-sented in ascending order of “net benefits” so that the most heavily-burdened industries appear at the top. Sixteen of the 21 broad manufacturing industries experienced costs in excess of benefits over the seven-year period with “Electrical equipment, appliance and components” manufacturers (NAICS 335) in-curring the biggest loss at $1.5 billion. Each of
the 17 sub-industries within NAICS 335 expe-rienced losses over the period.
Eight of the 21 broad manufacturing indus-tries consist only of sub-industries that are Ex-Im victims: Electrical equipment, appliance and components (335); furniture and related products (337); nonmetallic mineral products (327); paper (322); leather and allied products (316); beverage and tobacco products (312); printing (323); and apparel (315).
Of the five broad industries that experi-enced positive net benefits, machinery pro-ducers (NAICS 333) fared best. However, within the machinery industry—as well as within the other “winning” industries—most of the sub-industries experienced losses. Out of 30 machinery sub-industries, 17 experi-enced losses; two-thirds of transportation equipment sub-industries and 85 percent of fabricated metal product sub-industries also incurred net losses.
These figures would all seem to confirm that Ex-Im helps some companies in some in-dustries, but at great cost to industries across the manufacturing spectrum, which is to say Ex-Im amounts to an exercise in “picking win-ners and losers.”
VICTIMS STATE-BY-STATE
The victims of Ex-Im are scattered across industries and across U.S. states. But every broadly defined industry and every state can count victims among its manufacturing firms. Tables 3 and 4 provide overviews of the manu-facturing victims by state. Table 3 ranks the contribution of the 10 most victimized manu-facturing industries to each state’s manufac-turing GDP. The industry accounting for the most manufacturing GDP in each state is as-signed a value of “1.” The most important man-ufacturing industry was a top-10 victim for 33 states and the first or second most important industry was a top-10 victim in 47 states.
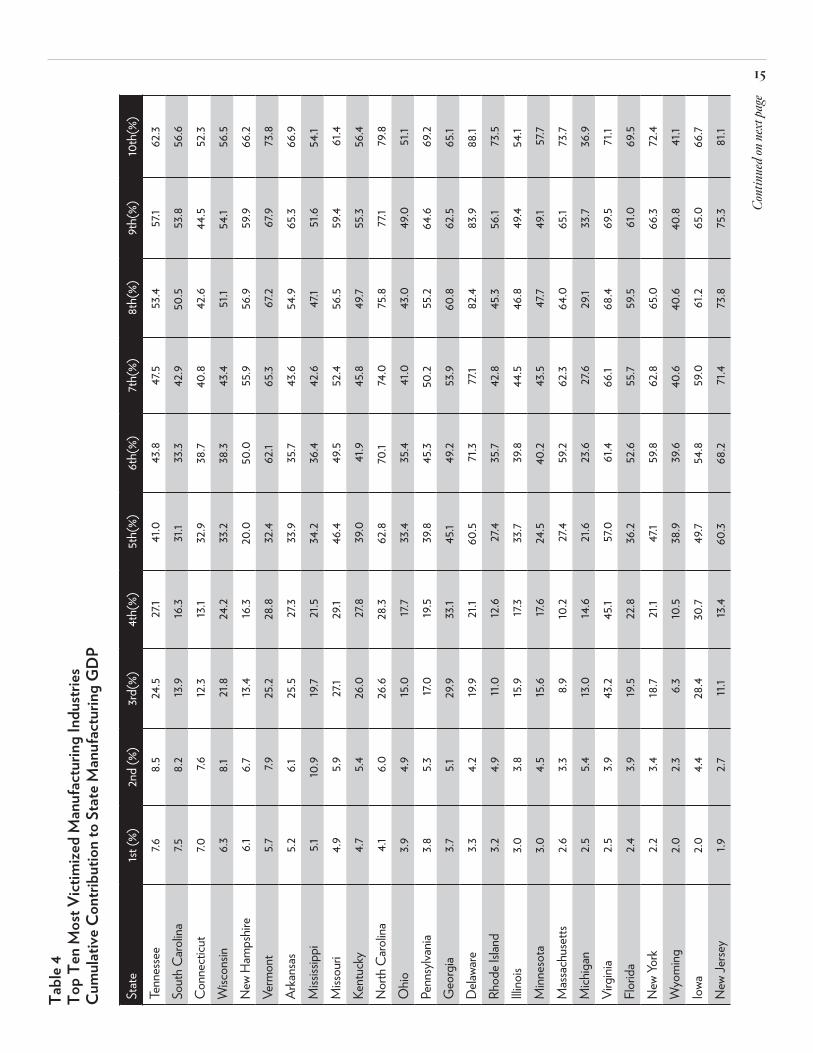
Table 4 presents the cumulative contribu-tion to each state’s manufacturing GDP of the 10 most victimized manufacturing industries. Field “1st” represents the contribution of “Elec-
12
Tabl
e 2Be
nefit
s and
Cos
ts of
Ex-
Im to
21 B
road
ly-D
efin
ed M
anuf
actu
ring
Indu
stries
NAI
CS-3
Indu
stry D
escr
iptio
nSu
bsid
ies to
In
dustr
y ($)
Cost
to
Indu
stry (
$)N
et B
enef
its
($)
Annu
alize
d N
et
Bene
fits (
$)Su
b-In
dustr
ies
(#)
Sub-
Indu
stry
Vict
ims (
#)33
5 Tot
alEl
ectri
cal E
quip
men
t, Ap
plian
ces a
nd C
ompo
nent
s71
0,81
0,82
22,2
03,70
3,072
-1,49
2,892
,250
-213
,270,
321
1717
337 T
otal
Furn
iture
and
Relat
ed P
rodu
cts
83,12
0,60
41,2
59,80
1,725
-1,17
6,681
,121
-168,0
97,30
38
831
1 Tot
alFo
od1,1
68,48
7,188
2,123
,854,4
82-9
55,36
7,294
-136,4
81,0
4224
2232
7 Tot
alN
onm
etall
ic M
inera
l Pro
duct
s13
4,009
,974
973,9
68,45
9-8
39,95
8,485
-119,9
94,0
6912
1232
5 Tot
alC
hem
icals
1,574
,603,7
102,3
21,70
9,634
-747
,105,9
24-10
6,729
,418
1914
334
Tota
lC
ompu
ters
and
Elec
tronic
s7,3
65,32
0,95
28,0
03,65
6,060
-638
,335,1
09-9
1,190
,730
2015
326 T
otal
Plas
tics a
nd R
ubbe
r Pro
duct
s68
0,59
4,667
1,276
,686,5
86-5
96,0
91,91
9-8
5,155
,988
109
322 T
otal
Pape
r27
2,004
,250
718,1
39,68
2-4
46,13
5,432
-63,7
33,63
38
833
1 Tot
alPr
imar
y Met
als68
9,746
,792
987,3
23,0
07-2
97,57
6,215
-42,5
10,88
810
733
9 Tot
alO
ther
Misc
ellan
eous
Man
ufac
turin
g1,2
44,67
7,896
1,487
,933,0
04-2
43,25
5,108
-34,7
50,73
011
731
4 Tot
alTe
xtile
Pro
duct
s96
,468,5
0728
2,166
,755
-185,6
98,24
7-2
6,528
,321
32
316 T
otal
Leat
her a
nd A
llied
Prod
ucts
52,69
0,00
023
7,339
,977
-184,6
49,97
7-2
6,378
,568
11
312 T
otal
Beve
rage
and
Toba
cco
Prod
ucts
91,94
9,708
272,6
87,76
8-18
0,73
8,061
-25,8
19,72
35
532
4 Tot
alPe
troleu
m an
d C
oal P
rodu
cts
292,8
32,86
344
0,07
1,835
-147,2
38,97
2-2
1,034
,139
43
323 T
otal
ing89
,776,9
2623
3,227
,079
-143,4
50,15
3-2
0,49
2,879
22
315 T
otal
Appa
rel
43,50
0,00
079
,028
,224
-35,5
28,22
4-5
,075
,461
11
321 T
otal
Woo
d Pr
oduc
ts71
2,243
,357
598,8
77,60
9113
,365,7
4716
,195,1
074
231
3 Tot
alTe
xtile
s42
0,28
5,975
253,1
06,52
916
7,179
,447
23,88
2,778
32
336 T
otal
Tran
spor
tatio
n Equ
ipm
ent
6,626
,326,6
854,6
29,41
0,03
01,9
96,91
6,656
285,2
73,80
824
1833
2 Tot
alFa
brica
ted
Met
al Pr
oduc
ts6,5
84,0
36,68
14,4
79,61
9,483
2,104
,417,1
9730
0,63
1,028
2017
333 T
otal
Mac
hiner
y21
,536,7
30,65
37,5
58,0
69,76
213
,978,6
60,89
11,9
96,95
1,556
3017
31-3
3Al
l Man
ufac
turin
g (e
xcep
t Airc
raft)
50,47
0,21
8,20
940
,420,
380,
762
10,0
49,8
37,44
71,4
35,6
91,0
6423
618
9
Sour
ce: C
ompi
led fr
om B
urea
u of
Eco
nom
ic A
nalys
is, In
put-O
utpu
t Use
Tab
le, h
ttp://
www.
bea.g
ov/in
dustr
y/xls
/ious
e_be
fore
_red
efini
tions
_pur
_200
7_de
tail.x
lsx; a
nd E
xpor
t-Im
port
Bank
of t
he U
nited
St
ates
, FFA
TA (F
eder
al Fu
nding
Acc
ount
abilit
y and
Tra
nspa
renc
y Act
) Tra
nsac
tion
Info
rmat
ion,
2007
–201
3, ht
tp://
www.
exim
.gov
/abo
ut/li
brar
y/fo
ia/Fr
eque
ntly-
Requ
este
d-Re
ports
-and
-Info
rmat
ion.c
fm.

13Ta
ble 3
Top
Ten
Mos
t Vict
imize
d M
anuf
actu
ring
Indu
stries
(Lef
t to
Righ
t) Ra
nk o
f Con
tribu
tion
to S
tate
Man
ufac
turin
g G
DP
Elec
trica
l Equ
ipm
ent,
Appl
iance
s and
C
ompo
nent
s
Furn
iture
an
d Re
lated
Pr
oduc
ts
Food
, Be
vera
ge,
Toba
cco
Non
met
allic
Mine
ral
Prod
ucts
Che
mica
ls
Com
pute
rs an
d
Elec
tronic
s
Plas
tics a
nd
Rubb
er
Prod
ucts
Pape
rPr
imar
y M
etals
Oth
er
Misc
ellan
eous
M
anuf
actu
ring
33
533
731
1,312
327
325
334
326
322
331
339
Alab
ama
1514
813
210
95
317
Alas
ka17
132
310
78
1816
12Ar
izona
1314
49
31
1015
75
Arka
nsas
817
113
614
52
415
Cali
forn
ia10
164
132
19
1417
5C
olora
do12
142
93
110
1713
4C
onne
cticu
t5
168
142
69
1210
4D
elawa
re8
162
131
34
510
6Fl
orid
a12
152
93
110
816
5G
eorg
ia11
171
122
107
516
13Ha
waii
1610
23
512
917
187
Idah
o12
142
133
17
916
11Illi
nois
1016
314
26
813
117
Indi
ana
1512
714
111
916
45
Iowa
129
110
25
711
815
Kans
as11
152
124
78
1614
13Ke
ntuc
ky8
172
133
119
105
16Lo
uisian
a16
173
92
1410
68
13M
aine
1716
315
46
81
1812
Mar
yland
1614
311
12
413
1210
Mas
sach
uset
ts10
156
122
18
1113
4M
ichig
an10
94
135
127
146
8M
innes
ota
1216
314
71
119
175
Miss
issip
pi10
74
161
156
1211
14M
issou
ri7
171
132
1012
811
14
Cont
inue
d on n
ext p
age

14El
ectri
cal E
quip
men
t, Ap
plian
ces a
nd
Com
pone
nts
Furn
iture
an
d Re
lated
Pr
oduc
ts
Food
, Be
vera
ge,
Toba
cco
Non
met
allic
Mine
ral
Prod
ucts
Che
mica
ls
Com
pute
rs an
d
Elec
tronic
s
Plas
tics a
nd
Rubb
er
Prod
ucts
Pape
rPr
imar
y M
etals
Oth
er
Misc
ellan
eous
M
anuf
actu
ring
Mon
tana
1513
25
79
1219
178
Neb
rask
a14
151
112
87
1310
4N
evad
a14
152
65
47
1310
1N
ew H
amps
hire
618
410
81
716
95
New
Jerse
y12
142
111
38
1013
4N
ew M
exico
1316
37
41
1211
188
New
York
1316
211
13
712
156
Nor
th C
aroli
na5
112
131
36
1215
9N
orth
Dak
ota
1713
24
107
915
1814
Ohio
1016
511
113
814
712
Okla
hom
a14
184
85
76
1112
13O
rego
n15
162
119
112
75
8Pe
nnsy
lvania
1116
213
16
98
410
Rhod
e Isla
nd11
148
152
46
123
1So
uth
Car
olina
717
813
114
36
1112
Sout
h D
akot
a15
93
84
710
1314
1Te
nnes
see
517
212
311
97
108
Texa
s13
166
112
39
1410
12Ut
ah16
126
102
513
111
3Ve
rmon
t5
122
98
110
1317
4Vi
rgini
a9
161
132
75
1017
15W
ashin
gton
1617
212
73
148
119
Wes
t Virg
inia
1516
119
113
717
210
Wisc
onsin
616
213
49
85
1214
Wyo
ming
713
54
211
819
1615
Unite
d St
ates
1316
314
12
1012
119
Sour
ce: C
ompi
led fr
om B
urea
u of E
cono
mic
Ana
lysis,
Inpu
t-Out
put U
se T
able,
http
://ww
w.be
a.gov
/indu
stry/
xls/io
use_
befo
re_r
edef
initio
ns_p
ur_2
007_
deta
il.xlsx
; Exp
ort-I
mpo
rt Ba
nk o
f the
Unit
ed S
tate
s, FF
ATA
(Fed
eral
Fund
ing A
ccou
ntab
ility
and
Tran
spar
ency
Act
) Tra
nsac
tion
Info
rmat
ion,
2007
–201
3, ht
tp://
www.
exim
.gov
/abo
ut/li
brar
y/fo
ia/Fr
eque
ntly-
Requ
este
d-Re
ports
-and
-Info
rmat
ion.c
fm; a
nd
Bure
au o
f Eco
nom
ic A
nalys
is, G
DP
by S
tate
, Man
ufac
turin
g (in
tera
ctive
tabl
e), h
ttp://
www.
bea.g
ov/iT
able/
iTab
le.cf
m?re
qid=
70&s
tep=
1&isu
ri=1&
acrd
n=1#
reqi
d=70
&ste
p=6&
isuri=
1&70
03=9
00&7
004=
nai
cs&7
005=
12&7
001=
1900
&700
2=1&
7090
=70.
Tabl
e 3 Contin
ued
15Ta
ble 4
Top
Ten
Mos
t Vict
imize
d M
anuf
actu
ring
Indu
stries
Cu
mul
ative
Con
tribu
tion
to S
tate
Man
ufac
turin
g G
DP
Stat
e1st
(%)
2nd
(%)
3rd(
%)4t
h(%)
5th(
%)6t
h(%)
7th(
%)8t
h(%)
9th(
%)10
th(%
)Te
nnes
see
7.68.5
24.5
27.1
41.0
43.8
47.5
53.4
57.1
62.3
Sout
h C
aroli
na7.5
8.2
13.9
16.3
31.1
33.3
42.9
50.5
53.8
56.6
Con
nect
icut
7.07.6
12.3
13.1
32.9
38.7
40.8
42.6
44.5
52.3
Wisc
onsin
6.38.1
21.8
24.2
33.2
38.3
43.4
51.1
54.1
56.5
New
Ham
pshir
e6.1
6.713
.416
.320
.050
.055
.956
.959
.966
.2Ve
rmon
t5.7
7.925
.228
.832
.462
.165
.367
.267
.973
.8Ar
kans
as5.2
6.125
.527
.333
.935
.743
.654
.965
.366
.9M
ississ
ippi
5.110
.919
.721
.534
.236
.442
.647
.151
.654
.1M
issou
ri4.9
5.927
.129
.146
.449
.552
.456
.559
.461
.4Ke
ntuc
ky4.7
5.426
.027
.839
.041
.945
.849
.755
.356
.4N
orth
Car
olina
4.16.0
26.6
28.3
62.8
70.1
74.0
75.8
77.1
79.8
Ohio
3.94.9
15.0
17.7
33.4
35.4
41.0
43.0
49.0
51.1
Penn
sylva
nia3.8
5.317.
019
.539
.845
.350
.255
.264
.669
.2G
eorg
ia3.7
5.129
.933
.145
.149
.253
.960
.862
.565
.1D
elawa
re3.3
4.2
19.9
21.1
60.5
71.3
77.1
82.4
83.9
88.1
Rhod
e Isla
nd3.2
4.911.
012
.627
.435
.742
.845
.356
.173
.5Illi
nois
3.03.8
15.9
17.3
33.7
39.8
44.5
46.8
49.4
54.1
Minn
esot
a3.0
4.515
.617.
624
.540
.243
.547
.749
.157
.7M
assa
chus
etts
2.63.3
8.910
.227
.459
.262
.364
.065
.173
.7M
ichig
an2.5
5.413
.014
.621
.623
.627
.629
.133
.736
.9Vi
rgini
a2.5
3.943
.245
.157
.061
.466
.168
.469
.571
.1Fl
orid
a2.4
3.919
.522
.836
.252
.655
.759
.561
.069
.5N
ew Yo
rk2.2
3.418
.721
.147
.159
.862
.865
.066
.372
.4W
yom
ing2.0
2.36.3
10.5
38.9
39.6
40.6
40.6
40.8
41.1
Iowa
2.04.4
28.4
30.7
49.7
54.8
59.0
61.2
65.0
66.7
New
Jerse
y1.9
2.711.
113
.460
.368
.271
.473
.875
.381
.1
Cont
inue
d on n
ext p
age

16St
ate
1st (%
)2n
d (%
)3r
d(%)
4th(
%)5t
h(%)
6th(
%)7t
h(%)
8th(
%)9t
h(%)
10th
(%)
Alab
ama
1.83.8
9.611.
624
.027
.331
.439
.050
.752
.2C
olora
do1.7
3.218
.922
.236
.659
.461
.562
.263
.872
.5Ka
nsas
1.72.6
18.3
19.9
30.7
35.5
39.6
40.2
41.1
42.6
Utah
1.54.0
11.0
14.0
27.5
36.8
39.1
41.8
61.4
72.4
Cali
forn
ia1.5
2.412
.413
.631
.758
.960
.862
.062
.969
.5So
uth
Dak
ota
1.54.1
19.0
21.8
33.6
37.3
39.7
41.2
42.7
62.8
Okla
hom
a1.4
1.911.
515
.822
.827
.632
.735
.837
.939
.8Ar
izona
1.42.6
9.712
.019
.951
.753
.954
.959
.765
.6N
evad
a1.4
2.512
.417.
122
.830
.234
.335
.737
.580
.6N
ebra
ska
1.11.9
27.5
28.9
53.0
55.4
59.3
60.4
62.0
71.9
Idah
o1.1
2.025
.626
.734
.475
.677
.979
.980
.581
.6Te
xas
1.11.8
6.98.4
30.6
42.3
44.3
45.3
47.2
48.5
Wes
t Virg
inia
1.02.0
4.68.3
52.4
53.8
58.0
58.7
67.8
71.3
Indi
ana
1.02.5
8.2
9.539
.041
.044
.145
.052
.559
.9M
aryla
nd0.
81.9
15.7
17.6
50.5
70.4
75.0
76.2
77.8
79.8
Was
hingt
on0.
81.4
8.410
.012
.619
.520
.823
.324
.926
.9N
ew M
exico
0.8
1.39.8
12.0
16.5
66.8
67.7
69.0
69.4
71.5
Ore
gon
0.6
1.04.9
5.86.9
84.9
85.7
87.3
89.3
90.6
Main
e0.
51.5
16.6
18.1
27.3
33.8
38.0
53.3
53.7
55.9
Mon
tana
0.4
1.310
.314
.518
.120
.020
.921
.021
.324
.6Ha
waii
0.3
2.133
.939
.243
.445
.046
.847
.147
.150
.2N
orth
Dak
ota
0.3
1.525
.531
.535
.139
.243
.043
.543
.644
.5Lo
uisian
a0.
30.
44.3
5.443
.944
.345
.147
.848
.949
.4Al
aska
0.1
0.5
35.3
38.9
39.5
40.8
41.6
41.6
41.8
42.2
Unite
d St
ates
2.63.8
15.2
17.1
35.3
47.7
51.1
53.7
56.9
61.1
Sour
ce: C
ompi
led fr
om B
urea
u of E
cono
mic
Ana
lysis,
Inpu
t-Out
put U
se T
able.
http
://ww
w.be
a.gov
/indu
stry/
xls/io
use_
befo
re_r
edef
initio
ns_p
ur_2
007_
deta
il.xlsx
; Exp
ort-I
mpo
rt Ba
nk o
f the
Unit
ed S
tate
s, FF
ATA
(Fed
eral
Fund
ing A
ccou
ntab
ility
and
Tran
spar
ency
Act
) Tra
nsac
tion
Info
rmat
ion,
2007
–201
3, ht
tp://
www.
exim
.gov
/abo
ut/li
brar
y/fo
ia/Fr
eque
ntly-
Requ
este
d-Re
ports
-and
-Info
rmat
ion.c
fm; a
nd
Bure
au o
f Eco
nom
ic A
nalys
is, G
DP
by S
tate
, Man
ufac
turin
g (in
tera
ctive
tabl
e), h
ttp://
www.
bea.g
ov/iT
able/
iTab
le.cf
m?re
qid=
70&s
tep=
1&isu
ri=1&
acrd
n=1#
reqi
d=70
&ste
p=6&
isuri=
1&70
03=9
00&7
004=
nai
cs&7
005=
12&7
001=
1900
&700
2=1&
7090
=70.
Tabl
e 4 Contin
ued

17
“If the arguments against reauthoriza-tion were not already persuasive enough, the costs imposed on unwitting downstream U.S. industries by Export-Import Bank subsidies is perhaps the most compelling reason to shut down the Bank.”
trical equipment, appliance and components” manufacturing (NAICS 335)—the biggest vic-tim—to each state’s manufacturing value-add-ed. So for Tennessee, manufacturing industry 335 (the 1st largest victim) accounted for 7.6 per-cent of the state’s manufacturing value added. NAICS 335 accounted for 7.5 percent of South Carolina’s manufacturing value added. Field “2nd” represents the cumulative contribution of the first and second largest victims of Ex-Im—the second largest (with reference to Table 3) being NAICS 337, “Furniture and related products.” Field “3rd” is the cumulative contri-bution of the top three victims to each state’s manufacturing value-added, and so on.
Table 4 is sorted in descending order of “1st” (the largest victim’s contributions to the respective state’s manufacturing value-added). States appearing near the top of the table are likely most ill-affected by the quiet imposi-tions thrust upon their electrical equipment producers in the form of heightened competi-tion at home and abroad from foreign produc-ers benefiting from U.S. taxpayer subsidies.
But to get a better picture of the states that are likely paying the highest price for Ex-Im, look at the “5th” column or the “10th”column, which reveal the cumulative contributions of the top 5 and top 10 biggest victims, respec-tively, to each state’s manufacturing value-added. The top-5 victims cumulatively ac-count for 50 percent of more of manufacturing value-added in seven U.S. states: North Caro-lina (62.8%), Delaware (60.5%), New Jersey (60.3%), Virginia (57.0%), Nebraska (53.0%), West Virginia (52.4%), and Maryland (50.5%). The top 10 victims cumulatively account for two-thirds or more of manufacturing value-added in 22 states.
For 17 U.S. states, the largest manufacturing industry was a top-5 Ex-Im victim. The chemi-cal industry—the fifth largest Ex-Im victim—is the largest manufacturing industry in 11 states. The data reveal countless compelling facts about the costs of Ex-Im and which industries and states bear them.
It is evident from this analysis that al-though Ex-Im’s subsidies may benefit certain
industries and states in the short-run, they ad-versely affect other industries and states. The fact that Table 2 shows positive net benefits, overall, does nothing to mitigate the fact that Ex-Im’s operations essentially rob Peter to pay Paul. In fact, that table shows that for every dollar of subsidies doled out to the winners, $0.80 is imposed as a downstream cost on the victims ($50 billion in benefits vs. $40 billion in adjusted costs), which renders Ex-Im a very inefficient form of industrial policy.
CONCLUSION
In their efforts to win reauthorization from Congress, supporters of the Export-Import Bank rely on exaggerated claims about the Bank’s benefits, while ignoring its costs. Ex-Im pays for itself, the argument goes, as though that claim accounts for the opportunity costs, intra-industry costs, and downstream industry costs.
Realistically, Ex-Im financing helps two sets of companies (in the short-run): U.S. firms whose export prices are subsidized by below-market-rate financing and the foreign firms that purchase those subsidized exports. Those same transactions impose costs on two differ-ent sets of companies: competing U.S. firms in the same industry, who do not get Ex-Im back-ing, and U.S. firms in downstream industries, whose foreign competition is now benefitting from reduced capital costs courtesy of U.S. government subsidies.
The facts are that Ex-Im policies reward some companies and penalize many others in the process. The victims of Ex-Im’s policies populate 189 of 236 non-aircraft manufactur-ing sub-industries and all of the 21 broad man-ufacturing industry categories. The costs are borne in every U.S. state and in many of them the victims are crucial industries. The top-5 victims cumulatively account for 50 percent or more of manufacturing value-added in 7 U.S. states, and the top 10 victims cumulatively ac-count for two-thirds or more of manufactur-ing value-added in 22 states. In 17 U.S. states, the largest manufacturing industry was a top-5 Ex-Im victim.

18
This analysis took into quantitative consid-eration only the downstream costs, leaving the intra-industry and opportunity costs alone. The overall costs of Ex-Im are thus grossly un-derstated. If the arguments against reauthori-
zation were not already persuasive enough, the costs imposed on unwitting downstream U.S. industries by Export-Import Bank subsidies is perhaps the most compelling reason to shut down the Bank.

19Ap
pend
ixBe
nefit
s and
Cos
ts of
Ex-
Im to
236
Six-
Dig
it N
AIC
Man
ufac
turin
g Su
b-In
dustr
ies
NAI
CS
6Su
b-In
dustr
y Des
crip
tion
Subs
idies
to
Indu
stry (
$)Up
strea
m
Indus
tries
(#)
Subs
idies
to U
pstre
am
Indu
stries
($)
Cos
t to
In
dustr
y ($)
Net
Ben
efits
($
)An
nuali
zed
Net
Bene
fits (
$)33
4210
Telep
hone
appa
ratu
s man
ufac
turin
g14
7,419
,998
5111,
966,6
45,77
51,0
22,0
56,60
8-8
74,63
6,610
-124,9
48,0
8733
3514
Spec
ial to
ol, d
ie, jig
, and
fixt
ure m
anuf
actu
ring
45,42
9,081
489,5
64,28
6,909
471,0
06,34
2-4
25,57
7,261
-60,
796,7
5233
3618
Oth
er en
gine
equip
men
t man
ufac
turin
g40
,088
,068
8383
,606,0
86,49
743
2,882
,197
-392
,794,1
29-5
6,113
,447
3342
90O
ther
com
mun
icatio
ns eq
uipm
ent m
anuf
actu
ring
197,6
46,24
450
11,50
3,018
,767
574,0
87,13
1-3
76,44
0,88
7-5
3,777
,270
3345
12Au
tom
atic
envir
onm
enta
l con
trol m
anuf
actu
ring
40,85
1,009
4410
,911,5
86,75
440
9,260
,618
-368
,409,6
09-5
2,629
,944
3344
18Pr
inted
circu
it asse
mbly
(elec
tronic
asse
mbly
) man
ufac
turin
g1,2
50,0
0065
15,24
6,770
,927
329,0
87,59
3-3
27,83
7,593
-46,8
33,94
233
2114
Cus
tom
roll f
orm
ing2,0
10,0
0035
6,472
,306,7
5830
1,401
,728
-299
,391,7
28-4
2,770
,247
3364
13O
ther
airc
raft
parts
and
auxil
iary e
quip
men
t man
ufac
turin
g76
,376,4
7058
71,80
6,833
,591
363,7
70,47
1-2
87,39
4,001
-41,0
56,28
633
2420
Met
al ta
nk (h
eavy
gau
ge) m
anuf
actu
ring
24,32
6,704
5215
,160,
978,3
0829
6,482
,820
-272
,156,1
16-3
8,879
,445
3362
13M
otor
hom
e man
ufac
turin
g0
608,5
78,63
5,873
254,
240,
593
-254
,240,
593
-36,3
20,0
8533
3220
Plas
tics a
nd ru
bber
indu
stry m
achin
ery m
anuf
actu
ring
057
15,90
6,824
,085
238,9
68,56
2-2
38,96
8,562
-34,1
38,36
633
4514
Tota
lizing
fluid
met
er an
d co
untin
g de
vice m
anuf
actu
ring
4,672
,000
5013
,671,7
74,49
722
8,118
,535
-223
,446,5
35-3
1,920
,934
3333
15Ph
otog
raph
ic an
d ph
otoc
opyin
g eq
uipm
ent m
anuf
actu
ring
1,575
,000
416,5
12,78
4,24
622
3,671
,500
-222
,096
,500
-31,7
28,0
7133
6370
Mot
or ve
hicle
met
al sta
mpi
ng36
,831,3
0361
10,54
4,408
,152
257,2
25,15
6-2
20,39
3,853
-31,4
84,83
633
211B
Cro
wn an
d clo
sure
man
ufac
turin
g an
d m
etal
stam
ping
19,31
2,482
5310
,022
,336,4
1923
4,638
,448
-215
,325,9
66-3
0,76
0,85
233
9115
Oph
thalm
ic go
ods m
anuf
actu
ring
2,500
,000
416,4
97,70
7,509
216,3
38,34
4-2
13,83
8,344
-30,
548,3
3533
4112
Com
pute
r sto
rage
dev
ice m
anuf
actu
ring
15,74
5,436
457,1
62,66
4,633
222,4
44,79
3-2
06,69
9,357
-29,5
28,48
033
7215
Show
case
, par
tition
, she
lving
, and
lock
er m
anuf
actu
ring
12,25
0,00
057
8,26
7,861
,428
213,3
80,34
0-2
01,13
0,34
0-2
8,732
,906
3371
10W
ood
kitch
en ca
bine
t and
coun
terto
p m
anuf
actu
ring
4,960
,000
456,7
13,20
3,059
203,5
08,60
0-19
8,548
,600
-28,3
64,0
8633
4511
Searc
h, de
tecti
on, a
nd na
vigati
on in
strum
ents
man
ufac
turin
g17
6,715
,150
7816
,372,7
46,19
337
3,409
,391
-196,6
94,24
2-2
8,099
,177
3363
20M
otor
vehic
le ele
ctric
al an
d ele
ctro
nic eq
uipm
ent m
anu-
fact
uring
400,
000
7815
,496,7
03,0
6619
5,146
,612
-194,7
46,61
2-2
7,820
,945
3328
00C
oatin
g, en
grav
ing, h
eat t
reat
ing an
d all
ied ac
tivitie
s23
,620,
000
5411,
118,36
0,74
521
1,247
,025
-187,6
27,0
25-2
6,803
,861
3334
14He
ating
equip
men
t (ex
cept
warm
air f
urna
ces)
man
ufac
turin
g15
,185,0
0051
15,54
1,954
,577
200,
805,4
06-18
5,620
,406
-26,5
17,20
131
6000
Leat
her a
nd al
lied
prod
uct m
anuf
actu
ring
52,69
0,00
040
5,321
,239,1
5223
7,339
,977
-184,6
49,97
7-2
6,378
,568
3362
11M
otor
vehic
le bo
dy m
anuf
actu
ring
78,83
6,306
6110
,426,4
01,0
3925
9,239
,994
-180,
403,6
88-2
5,771
,955
3372
1AO
ffice
furn
iture
and
custo
m ar
chite
ctur
al wo
odwo
rk an
d m
illwor
k man
ufac
turin
g4,3
75,0
0064
11,06
0,05
9,101
183,3
73,76
3-17
8,998
,763
-25,5
71,25
2
3371
27In
stitu
tiona
l fur
nitur
e man
ufac
turin
g23
,293,8
5656
9,048
,872,5
6419
8,577
,388
-175,2
83,53
2-2
5,040
,505
Cont
inue
d on n
ext p
age

20 N
AIC
S 6
Sub-
Indu
stry D
escr
iptio
nSu
bsid
ies to
In
dustr
y ($)
Upstr
eam
Ind
ustri
es (#
)Su
bsid
ies to
Ups
tream
In
dustr
ies ($
)C
ost t
o
Indu
stry (
$)N
et B
enef
its
($)
Annu
alize
d Ne
t Be
nefit
s ($)
3312
00St
eel p
rodu
ct m
anuf
actu
ring
from
pur
chas
ed st
eel
88,35
8,900
559,6
64,91
0,68
225
6,366
,496
-168,0
07,59
6-2
4,001
,085
3335
11In
dustr
ial m
old m
anuf
actu
ring
73,50
5,253
439,0
19,49
0,84
723
7,315
,300
-163,8
10,0
48-2
3,401
,435
3359
12Pr
imar
y bat
tery
man
ufac
turin
g0
426,7
48,54
2,021
161,6
96,0
69-16
1,696
,069
-23,0
99,43
833
7122
Non
upho
lster
ed w
ood
hous
ehold
furn
iture
man
ufac
turin
g1,9
00,0
0062
9,446
,591,0
3816
2,964
,486
-161,0
64,48
6-2
3,009
,212
3345
16An
alytic
al lab
orat
ory i
nstru
men
t man
ufac
turin
g13
0,69
5,528
5614
,271,0
23,33
228
8,875
,366
-158,1
79,83
8-2
2,597
,120
3399
50Sig
n man
ufac
turin
g13
,646,4
5957
10,73
3,443
,541
167,3
93,49
7-15
3,747
,038
-21,9
63,86
333
5991
Car
bon a
nd g
raph
ite p
rodu
ct m
anuf
actu
ring
11,41
9,206
284,9
73,0
92,43
916
4,452
,997
-153,0
33,79
1-2
1,861
,970
3371
2AO
ther
hou
seho
ld no
nuph
olste
red
furn
iture
1,644
,748
526,2
55,79
3,221
153,7
10,22
2-15
2,065
,474
-21,7
23,63
933
1510
Ferro
us m
etal
foun
dries
43,83
0,00
055
10,25
6,536
,104
195,5
12,19
7-15
1,682
,197
-21,6
68,88
533
5222
Hous
ehold
refri
gera
tor a
nd h
ome f
reez
er m
anuf
actu
ring
600,
000
537,8
00,39
4,24
214
8,845
,180
-148,
245,1
80-2
1,177
,883
31111
1D
og an
d ca
t foo
d m
anuf
actu
ring
36,15
5,500
373,7
06,76
3,593
183,0
49,93
2-14
6,894
,432
-20,
984,9
1933
5228
Oth
er m
ajor h
ouse
hold
appl
iance
man
ufac
turin
g1,7
00,0
0053
7,608
,228,8
3714
4,468
,562
-142,7
68,56
2-2
0,39
5,509
3261
60Pl
astic
s bot
tle m
anuf
actu
ring
19,30
8,184
325,8
40,62
8,695
157,4
11,75
4-13
8,103
,570
-19,72
9,081
3352
24Ho
useh
old la
undr
y equ
ipm
ent m
anuf
actu
ring
040
4,692
,258,3
0413
8,001
,319
-138,0
01,31
9-19
,714,4
7432
5130
Synt
hetic
dye
and
pigm
ent m
anuf
actu
ring
4,750
,000
3411,
893,4
48,0
2413
9,262
,310
-134,5
12,31
0-19
,216,0
4433
3613
Mec
hanic
al po
wer t
rans
miss
ion eq
uipm
ent m
anuf
actu
ring
7,500
,000
457,7
05,94
6,013
141,8
44,0
99-13
4,344
,099
-19,19
2,014
3362
14Tr
avel
traile
r and
cam
per m
anuf
actu
ring
450,
000
628,6
53,66
2,207
133,3
90,36
9-13
2,940
,369
-18,99
1,481
3327
20Tu
rned
pro
duct
and
scre
w, nu
t, an
d bo
lt m
anuf
actu
ring
46,86
4,000
5010
,145,2
98,11
817
8,838
,284
-131,9
74,28
4-18
,853,4
6933
399B
Fluid
pow
er p
roce
ss m
achin
ery
84,20
4,954
459,5
12,39
2,032
213,6
22,0
57-12
9,417,
103
-18,48
8,158
3119
20C
offe
e and
tea m
anuf
actu
ring
15,36
4,057
161,6
08,88
9,654
144,5
92,26
9-12
9,228
,212
-18,46
1,173
3352
10Sm
all el
ectri
cal a
pplia
nce m
anuf
actu
ring
400,
000
497,2
70,41
9,140
124,8
67,66
6-12
4,467
,666
-17,78
1,095
3335
1AM
etal
cutti
ng an
d fo
rming
mac
hine t
ool m
anuf
actu
ring
58,62
5,202
5010
,118,
204,4
6218
2,963
,518
-124,3
38,31
6-17
,762,6
1733
2200
Cut
lery a
nd h
andt
ool m
anuf
actu
ring
76,50
0,00
057
10,59
8,652
,385
200,
222,3
41-12
3,722
,341
-17,67
4,620
3333
13O
ffice
mac
hiner
y man
ufac
turin
g0
506,7
80,40
5,626
121,8
58,80
8-12
1,858
,808
-17,40
8,401
3399
30D
oll, t
oy, a
nd g
ame m
anuf
actu
ring
20,50
0,00
048
8,027
,518,9
0714
2,277
,930
-121,7
77,93
0-17
,396,8
4733
9940
Offi
ce su
pplie
s (ex
cept
pap
er) m
anuf
actu
ring
5,400
,000
5110
,036
,434,0
5412
6,810
,092
-121,4
10,0
92-17
,344,
299
3363
A0M
otor
vehic
le ste
ering
, sus
pens
ion co
mpo
nent
, and
bra
ke
syste
ms m
anuf
actu
ring
9,095
,495
8111,
616,1
26,86
712
8,363
,296
-119,2
67,80
1-17
,038
,257
3329
91Ba
ll and
rolle
r bea
ring
man
ufac
turin
g7,1
00,0
0041
9,002
,793,0
1112
5,584
,843
-118,4
84,84
3-16
,926,4
0633
4515
Elec
tricit
y and
sign
al te
sting
instr
umen
ts m
anuf
actu
ring
92,16
7,175
4813
,490,
389,2
5021
0,14
2,358
-117,9
75,18
4-16
,853,5
98
Appe
ndix Co
ntinued
Cont
inue
d on n
ext p
age
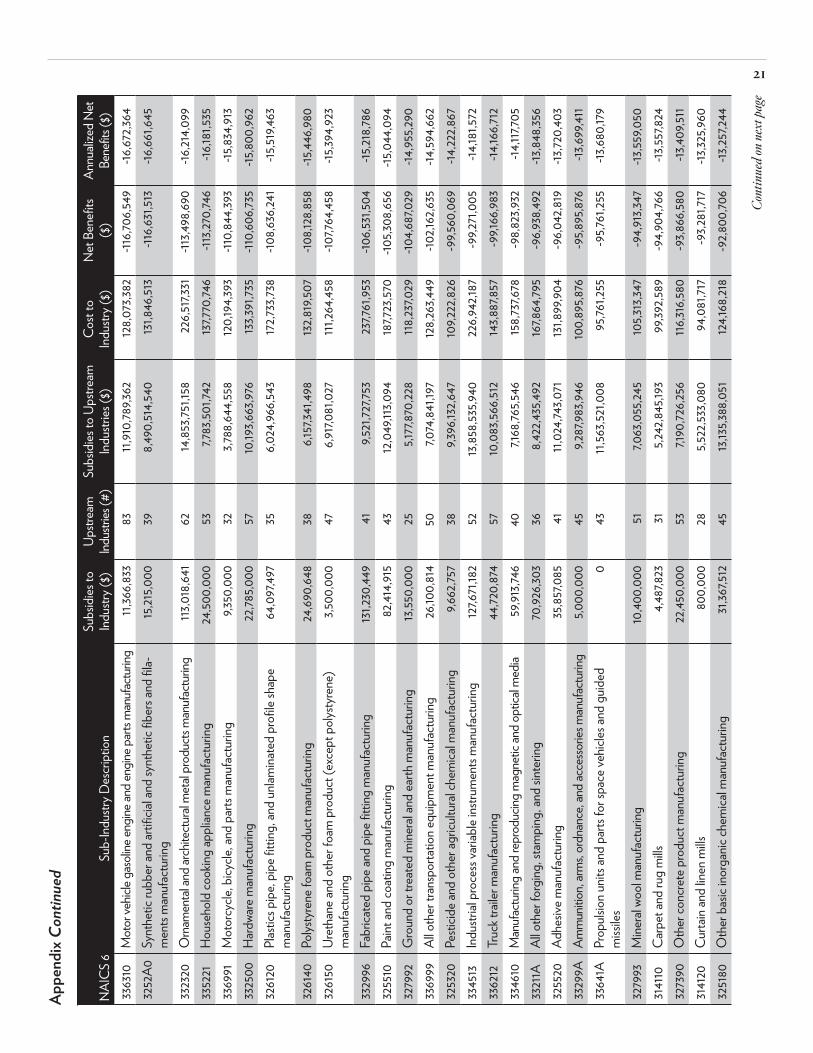
21
NAI
CS
6Su
b-In
dustr
y Des
crip
tion
Subs
idies
to
Indu
stry (
$)Up
strea
m
Indus
tries
(#)
Subs
idies
to U
pstre
am
Indu
stries
($)
Cos
t to
In
dustr
y ($)
Net
Ben
efits
($
)An
nuali
zed
Net
Bene
fits (
$)33
6310
Mot
or ve
hicle
gaso
line e
ngine
and e
ngine
parts
man
ufac
turin
g11,
366,8
3383
11,91
0,78
9,362
128,0
73,38
2-11
6,706
,549
-16,67
2,364
3252
A0Sy
nthe
tic ru
bber
and
artif
icial
and
synt
hetic
fibe
rs an
d fila
-m
ents
man
ufac
turin
g15
,215,0
0039
8,490
,514,5
4013
1,846
,513
-116,6
31,51
3-16
,661,6
45
3323
20O
rnam
ental
and a
rchite
ctural
met
al pr
oduc
ts m
anuf
actu
ring
113,0
18,64
162
14,85
3,751
,158
226,5
17,33
1-11
3,498
,690
-16,21
4,099
3352
21Ho
useh
old co
oking
appl
iance
man
ufac
turin
g24
,500,
000
537,7
83,50
1,742
137,7
70,74
6-11
3,270
,746
-16,18
1,535
3369
91M
otor
cycle
, bicy
cle, a
nd p
arts
man
ufac
turin
g9,3
50,0
0032
3,788
,644,5
5812
0,19
4,393
-110,
844,3
93-15
,834,9
1333
2500
Hard
ware
man
ufac
turin
g22
,785,0
0057
10,19
3,663
,976
133,3
91,73
5-11
0,60
6,735
-15,80
0,96
232
6120
Plas
tics p
ipe,
pipe
fitti
ng, a
nd un
lamina
ted
prof
ile sh
ape
man
ufac
turin
g64
,097
,497
356,0
24,96
6,543
172,7
33,73
8-10
8,636
,241
-15,51
9,463
3261
40Po
lysty
rene
foam
pro
duct
man
ufac
turin
g24
,690,
648
386,1
57,34
1,498
132,8
19,50
7-10
8,128
,858
-15,44
6,980
3261
50Ur
etha
ne an
d ot
her f
oam
pro
duct
(exc
ept p
olysty
rene
) m
anuf
actu
ring
3,500
,000
476,9
17,08
1,027
111,26
4,458
-107,7
64,45
8-15
,394,9
23
3329
96Fa
brica
ted
pipe
and
pipe
fitti
ng m
anuf
actu
ring
131,2
30,44
941
9,521
,727,7
5323
7,761
,953
-106,5
31,50
4-15
,218,7
8632
5510
Paint
and
coat
ing m
anuf
actu
ring
82,41
4,915
4312
,049
,113,0
9418
7,723
,570
-105,3
08,65
6-15
,044
,094
3279
92G
roun
d or
trea
ted
mine
ral a
nd ea
rth m
anuf
actu
ring
13,55
0,00
025
5,177
,870,
228
118,23
7,029
-104,6
87,0
29-14
,955,2
9033
6999
All o
ther
tran
spor
tatio
n equ
ipm
ent m
anuf
actu
ring
26,10
0,81
450
7,074
,841,1
9712
8,26
3,449
-102,1
62,63
5-14
,594,6
6232
5320
Pesti
cide a
nd o
ther
agric
ultur
al ch
emica
l man
ufac
turin
g9,6
62,75
738
9,396
,132,6
4710
9,222
,826
-99,5
60,0
69-14
,222,8
6733
4513
Indu
strial
pro
cess
varia
ble i
nstru
men
ts m
anuf
actu
ring
127,6
71,18
252
13,85
8,535
,940
226,9
42,18
7-9
9,271
,005
-14,18
1,572
3362
12Tr
uck t
raile
r man
ufac
turin
g44
,720,
874
5710
,083
,566,5
1214
3,887
,857
-99,1
66,98
3-14
,166,7
1233
4610
Man
ufac
turin
g and
repr
oduc
ing m
agne
tic an
d opt
ical m
edia
59,91
3,746
407,1
68,76
5,546
158,7
37,67
8-9
8,823
,932
-14,11
7,705
3321
1AAl
l oth
er fo
rging
, sta
mpi
ng, a
nd si
nter
ing70
,926,3
0336
8,422
,435,4
9216
7,864
,795
-96,9
38,49
2-13
,848,3
5632
5520
Adhe
sive m
anuf
actu
ring
35,85
7,085
4111,
024,7
43,0
7113
1,899
,904
-96,0
42,81
9-13
,720,
403
3329
9AAm
mun
ition,
arms,
ordn
ance
, and
acce
ssorie
s man
ufac
turin
g5,0
00,0
0045
9,287
,983,9
4610
0,89
5,876
-95,8
95,87
6-13
,699,4
1133
641A
Prop
ulsion
units
and
parts
for s
pace
vehic
les an
d gu
ided
m
issile
s0
4311,
563,5
21,0
0895
,761,2
55-9
5,761
,255
-13,68
0,17
9
3279
93M
inera
l woo
l man
ufac
turin
g10
,400,
000
517,0
63,0
55,24
510
5,313
,347
-94,9
13,34
7-13
,559,0
5031
4110
Car
pet a
nd ru
g m
ills4,4
87,82
331
5,242
,845,1
9399
,392,5
89-9
4,904
,766
-13,55
7,824
3273
90O
ther
conc
rete
pro
duct
man
ufac
turin
g22
,450,
000
537,1
90,72
6,256
116,31
6,580
-93,8
66,58
0-13
,409,5
1131
4120
Cur
tain
and
linen
mills
800,
000
285,5
22,53
3,080
94,0
81,71
7-9
3,281
,717
-13,32
5,960
3251
80O
ther
bas
ic ino
rgan
ic ch
emica
l man
ufac
turin
g31
,367,5
1245
13,13
5,388
,051
124,1
68,21
8-9
2,800
,706
-13,25
7,244
Appe
ndix Co
ntinued
Cont
inue
d on n
ext p
age

22
NAI
CS
6Su
b-In
dustr
y Des
crip
tion
Subs
idies
to
Indu
stry (
$)Up
strea
m
Indus
tries
(#)
Subs
idies
to U
pstre
am
Indu
stries
($)
Cos
t to
In
dustr
y ($)
Net
Ben
efits
($
)An
nuali
zed
Net
Bene
fits (
$)32
3120
Supp
ort a
ctivi
ties f
or p
rintin
g42
,015
,000
295,4
80,27
7,456
134,1
59,49
3-9
2,144
,493
-13,16
3,499
3251
20In
dustr
ial g
as m
anuf
actu
ring
5,700
,000
418,0
01,17
6,406
94,42
7,848
-88,7
27,84
8-12
,675,4
0733
3112
Lawn
and
gard
en eq
uipm
ent m
anuf
actu
ring
37,73
3,617
519,8
05,91
0,82
612
5,717,
716
-87,9
84,0
99-12
,569,1
5733
2430
Met
al ca
n, bo
x, an
d ot
her m
etal
cont
ainer
(lig
ht g
auge
) m
anuf
actu
ring
9,896
,367
459,2
73,41
9,523
96,21
8,019
-86,3
21,65
2-12
,331,6
65
3279
91C
ut st
one a
nd st
one p
rodu
ct m
anuf
actu
ring
027
4,487
,637,7
1585
,978,7
14-8
5,978
,714
-12,28
2,673
3351
10El
ectri
c lam
p bu
lb an
d pa
rt m
anuf
actu
ring
1,450
,000
307,2
37,56
8,21
387
,296,5
75-8
5,846
,575
-12,26
3,796
3326
00Sp
ring
and
wire
pro
duct
man
ufac
turin
g77
,617,1
6149
10,34
9,808
,598
163,2
86,99
8-8
5,669
,838
-12,23
8,548
3116
15Po
ultry
pro
cessi
ng6,3
17,77
337
5,720
,750,
652
91,49
5,964
-85,1
78,19
1-12
,168,3
1332
4121
Asph
alt p
aving
mixt
ure a
nd b
lock m
anuf
actu
ring
2,850
,000
476,6
86,0
48,18
987
,116,3
60-8
4,26
6,360
-12,0
38,0
5132
7330
Con
cret
e pip
e, br
ick, a
nd b
lock m
anuf
actu
ring
9,900
,000
486,7
98,0
23,52
290
,778,
205
-80,
878,
205
-11,55
4,029
3391
13Su
rgica
l app
lianc
e and
supp
lies m
anuf
actu
ring
67,33
6,584
7813
,194,3
45,44
514
7,089
,601
-79,7
53,0
17-11
,393,2
8833
2710
Mac
hine s
hops
168,8
78,45
679
17,66
0,24
9,440
248,0
35,87
3-7
9,157
,417
-11,30
8,20
233
341A
Air p
urific
ation
and
vent
ilatio
n equ
ipm
ent m
anuf
actu
ring
39,76
5,488
6111,
364,5
44,0
85118
,538,1
21-7
8,772
,633
-11,25
3,233
3114
10Fr
ozen
food
man
ufac
turin
g10
,035
,000
436,0
79,0
57,59
487
,864,9
47-7
7,829
,947
-11,11
8,564
3353
14Re
lay an
d ind
ustri
al co
ntro
l man
ufac
turin
g53
,656,9
4452
10,22
2,478
,681
130,
441,5
37-7
6,784
,594
-10,96
9,228
3271
00C
lay p
rodu
ct an
d re
fract
ory m
anuf
actu
ring
12,49
8,860
477,3
95,96
7,519
88,47
0,06
1-7
5,971
,200
-10,85
3,029
3369
92M
ilitar
y arm
ored
vehic
le, ta
nk, a
nd ta
nk co
mpo
nent
man
u-fa
ctur
ing0
414,9
32,13
9,007
75,14
5,924
-75,1
45,92
4-10
,735,1
32
3339
91Po
wer-d
riven
han
dtoo
l man
ufac
turin
g79
,339,4
8341
8,720
,296,9
0515
4,026
,330
-74,6
86,84
7-10
,669,5
5033
391A
Pum
p an
d pu
mpi
ng eq
uipm
ent m
anuf
actu
ring
81,29
3,479
5610
,261,6
11,64
615
5,886
,136
-74,5
92,65
8-10
,656,0
9432
2291
Sanit
ary p
aper
pro
duct
man
ufac
turin
g8,0
00,0
0028
5,029
,525,7
2681
,167,2
44-7
3,167
,244
-10,45
2,463
3119
40Se
ason
ing an
d dr
essin
g m
anuf
actu
ring
7,846
,500
405,2
76,86
5,357
80,0
98,85
7-7
2,252
,357
-10,32
1,765
3336
12Sp
eed
chan
ger, i
ndus
trial
high-
spee
d dr
ive, a
nd g
ear
man
ufac
turin
g6,2
03,38
141
7,094
,277,0
3178
,386,3
80-7
2,182
,998
-10,31
1,857
3329
13Pl
umbi
ng fi
xtur
e fitt
ing an
d tri
m m
anuf
actu
ring
2,200
,000
419,0
34,58
0,68
974
,113,3
90-7
1,913
,390
-10,27
3,341
3222
30St
ation
ery p
rodu
ct m
anuf
actu
ring
950,
000
335,7
53,59
5,518
72,78
7,494
-71,8
37,49
4-10
,262,4
9932
4122
Asph
alt sh
ingle
and
coat
ing m
ater
ials m
anuf
actu
ring
432,5
6226
3,507
,592,8
2872
,064
,571
-71,6
32,0
08-10
,233,1
4433
3993
Pack
aging
mac
hiner
y man
ufac
turin
g47
,120,
389
499,8
25,0
88,37
4118
,421,0
75-7
1,300
,686
-10,18
5,812
3262
20Ru
bber
and
plas
tics h
oses
and
beltin
g m
anuf
actu
ring
3,523
,000
315,3
47,47
4,055
74,27
8,506
-70,
755,5
06-10
,107,9
29
Appe
ndix Co
ntinued
Cont
inue
d on n
ext p
age
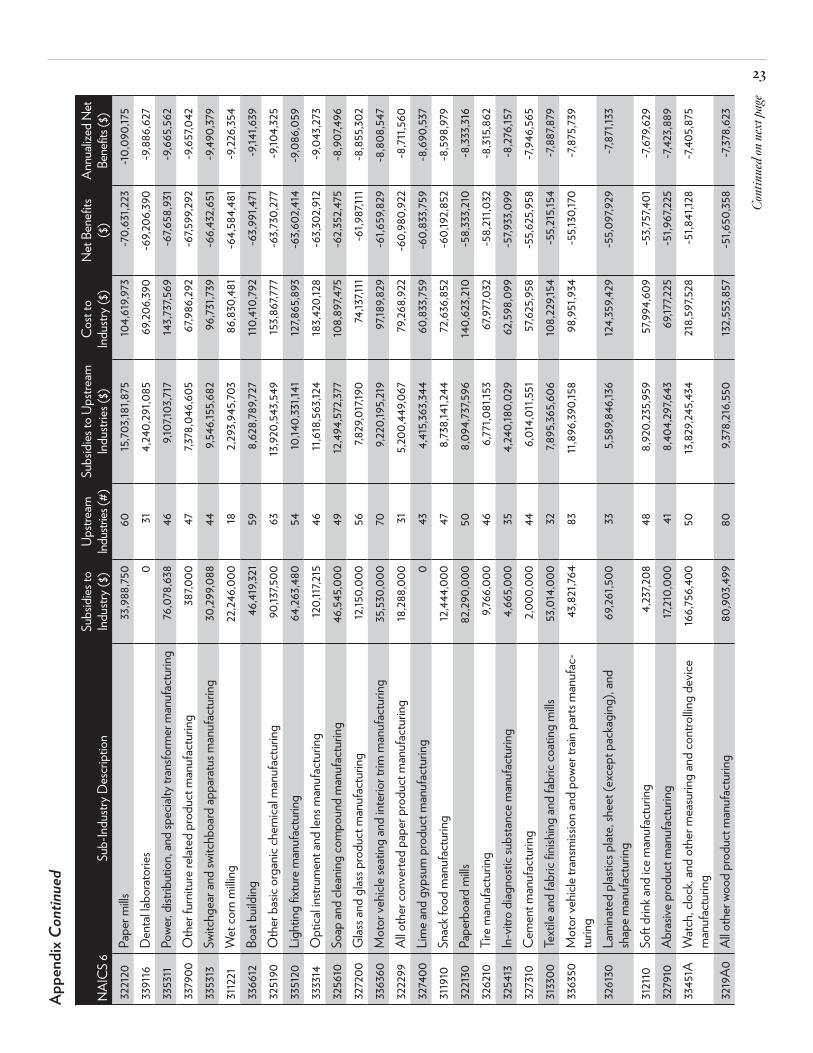
23
NAI
CS
6Su
b-In
dustr
y Des
crip
tion
Subs
idies
to
Indu
stry (
$)Up
strea
m
Indus
tries
(#)
Subs
idies
to U
pstre
am
Indu
stries
($)
Cos
t to
In
dustr
y ($)
Net
Ben
efits
($
)An
nuali
zed
Net
Bene
fits (
$)32
2120
Pape
r mills
33,98
8,750
6015
,703,1
81,87
510
4,619
,973
-70,
631,2
23-10
,090
,175
3391
16D
enta
l labo
rato
ries
031
4,24
0,29
1,085
69,20
6,390
-69,2
06,39
0-9
,886,6
2733
5311
Powe
r, dist
ribut
ion, a
nd sp
ecial
ty tr
ansfo
rmer
man
ufac
turin
g76
,078
,638
469,1
07,10
3,717
143,7
37,56
9-6
7,658
,931
-9,66
5,562
3379
00O
ther
furn
iture
relat
ed p
rodu
ct m
anuf
actu
ring
387,0
0047
7,378
,046
,605
67,98
6,292
-67,5
99,29
2-9
,657,0
4233
5313
Switc
hgea
r and
switc
hboa
rd ap
para
tus m
anuf
actu
ring
30,29
9,088
449,5
46,15
5,682
96,73
1,739
-66,4
32,65
1-9
,490,
379
3112
21W
et co
rn m
illing
22,24
6,000
182,2
93,94
5,703
86,83
0,48
1-6
4,584
,481
-9,22
6,354
3366
12Bo
at b
uildi
ng46
,419,3
2159
8,628
,789,7
27110
,410,
792
-63,9
91,47
1-9
,141,6
3932
5190
Oth
er b
asic
orga
nic ch
emica
l man
ufac
turin
g90
,137,5
0063
13,92
0,54
3,549
153,8
67,77
7-6
3,730
,277
-9,10
4,325
3351
20Li
ghtin
g fix
ture
man
ufac
turin
g64
,263,4
8054
10,14
0,33
1,141
127,8
65,89
3-6
3,602
,414
-9,0
86,0
5933
3314
Opt
ical in
strum
ent a
nd le
ns m
anuf
actu
ring
120,
117,21
546
11,61
8,563
,124
183,4
20,12
8-6
3,302
,912
-9,0
43,27
332
5610
Soap
and
clean
ing co
mpo
und
man
ufac
turin
g46
,545,0
0049
12,49
4,572
,377
108,8
97,47
5-6
2,352
,475
-8,90
7,496
3272
00G
lass a
nd g
lass p
rodu
ct m
anuf
actu
ring
12,15
0,00
056
7,829
,017,
190
74,13
7,111
-61,9
87,11
1-8
,855,3
0233
6360
Mot
or ve
hicle
seat
ing an
d int
erior
trim
man
ufac
turin
g35
,530,
000
709,2
20,19
5,219
97,18
9,829
-61,6
59,82
9-8
,808,5
4732
2299
All o
ther
conv
erte
d pa
per p
rodu
ct m
anuf
actu
ring
18,28
8,000
315,2
00,44
9,067
79,26
8,922
-60,
980,
922
-8,71
1,560
3274
00Li
me a
nd g
ypsu
m p
rodu
ct m
anuf
actu
ring
043
4,415
,363,3
4460
,833,7
59-6
0,83
3,759
-8,69
0,53
731
1910
Snac
k foo
d m
anuf
actu
ring
12,44
4,000
478,7
38,14
1,244
72,63
6,852
-60,
192,8
52-8
,598,9
7932
2130
Pape
rboa
rd m
ills82
,290,
000
508,0
94,73
7,596
140,
623,2
10-5
8,333
,210
-8,33
3,316
3262
10Ti
re m
anuf
actu
ring
9,766
,000
466,7
71,0
81,15
367
,977,0
32-5
8,21
1,032
-8,31
5,862
3254
13In
-vitr
o di
agno
stic s
ubsta
nce m
anuf
actu
ring
4,665
,000
354,
240,
180,
029
62,59
8,099
-57,9
33,0
99-8
,276,1
5732
7310
Cem
ent m
anuf
actu
ring
2,000
,000
446,0
14,0
11,55
157
,625,9
58-5
5,625
,958
-7,94
6,565
3133
00Te
xtile
and
fabr
ic fin
ishing
and
fabr
ic co
ating
mills
53,0
14,0
0032
7,895
,365,6
0610
8,22
9,154
-55,2
15,15
4-7,
887,8
7933
6350
Mot
or ve
hicle
trans
miss
ion an
d po
wer t
rain
parts
man
ufac
-tu
ring
43,82
1,764
8311,
896,3
90,15
898
,951,9
34-5
5,130
,170
-7,87
5,739
3261
30La
mina
ted
plas
tics p
late,
shee
t (ex
cept
pac
kagi
ng),
and
shap
e man
ufac
turin
g69
,261,5
0033
5,589
,846,1
3612
4,359
,429
-55,0
97,92
9-7,
871,1
33
3121
10So
ft dr
ink an
d ice
man
ufac
turin
g4,
237,2
0848
8,920
,235,9
5957
,994,6
09-5
3,757
,401
-7,67
9,629
3279
10Ab
rasiv
e pro
duct
man
ufac
turin
g17,
210,
000
418,4
04,29
7,643
69,17
7,225
-51,9
67,22
5-7,
423,8
8933
451A
Wat
ch, c
lock,
and
othe
r mea
surin
g an
d co
ntro
lling
devic
e m
anuf
actu
ring
166,7
56,40
050
13,82
9,245
,434
218,5
97,52
8-5
1,841
,128
-7,40
5,875
3219
A0Al
l oth
er w
ood
prod
uct m
anuf
actu
ring
80,90
3,499
809,3
78,21
6,550
132,5
53,85
7-5
1,650
,358
-7,37
8,623
Appe
ndix Co
ntinued
Cont
inue
d on n
ext p
age
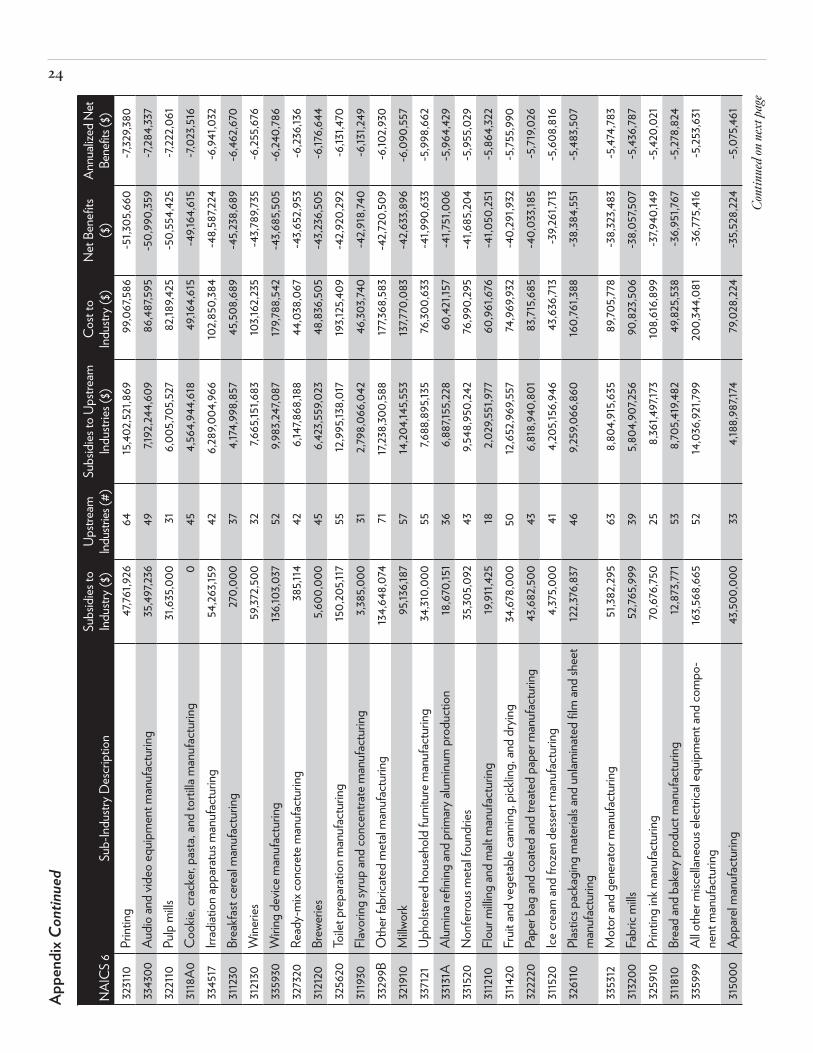
24
NAI
CS
6Su
b-In
dustr
y Des
crip
tion
Subs
idies
to
Indu
stry (
$)Up
strea
m
Indus
tries
(#)
Subs
idies
to U
pstre
am
Indu
stries
($)
Cos
t to
In
dustr
y ($)
Net
Ben
efits
($
)An
nuali
zed
Net
Bene
fits (
$)32
3110
ing47
,761,9
2664
15,40
2,521
,869
99,0
67,58
6-5
1,305
,660
-7,32
9,380
3343
00Au
dio
and
video
equip
men
t man
ufac
turin
g35
,497,2
3649
7,192
,244,6
0986
,487,5
95-5
0,99
0,35
9-7,
284,3
3732
2110
Pulp
mills
31,63
5,000
316,0
05,70
5,527
82,18
9,425
-50,
554,4
25-7,
222,0
6131
18A0
Coo
kie, c
rack
er, p
asta
, and
torti
lla m
anuf
actu
ring
045
4,564
,944,6
1849
,164,6
15-4
9,164
,615
-7,02
3,516
3345
17Irr
adiat
ion ap
para
tus m
anuf
actu
ring
54,26
3,159
426,2
89,0
04,96
610
2,850
,384
-48,5
87,22
4-6
,941,0
3231
1230
Brea
kfast
cere
al m
anuf
actu
ring
270,
000
374,1
74,99
8,857
45,50
8,689
-45,2
38,68
9-6
,462,6
7031
2130
Wine
ries
59,37
2,500
327,6
65,15
1,683
103,1
62,23
5-4
3,789
,735
-6,25
5,676
3359
30W
iring
devic
e man
ufac
turin
g13
6,103
,037
529,9
83,24
7,087
179,7
88,54
2-4
3,685
,505
-6,24
0,78
632
7320
Read
y-m
ix co
ncre
te m
anuf
actu
ring
385,1
1442
6,147
,868,1
8844
,038
,067
-43,6
52,95
3-6
,236,1
3631
2120
Brew
eries
5,600
,000
456,4
23,55
9,023
48,83
6,505
-43,2
36,50
5-6
,176,6
4432
5620
Toile
t pre
para
tion m
anuf
actu
ring
150,
205,1
1755
12,99
5,138
,017
193,1
25,40
9-4
2,920
,292
-6,13
1,470
3119
30Fl
avor
ing sy
rup
and
conc
entra
te m
anuf
actu
ring
3,385
,000
312,7
98,0
66,0
4246
,303,7
40-4
2,918
,740
-6,13
1,249
3329
9BO
ther
fabr
icate
d m
etal
man
ufac
turin
g13
4,648
,074
7117,
238,3
00,58
817
7,368
,583
-42,7
20,50
9-6
,102,9
3032
1910
Millw
ork
95,13
6,187
5714
,204,1
45,55
313
7,770
,083
-42,6
33,89
6-6
,090
,557
3371
21Up
holst
ered
hou
seho
ld fu
rnitu
re m
anuf
actu
ring
34,31
0,00
055
7,688
,895,1
3576
,300,
633
-41,9
90,63
3-5
,998,6
6233
131A
Alum
ina re
fining
and
prim
ary a
luminu
m p
rodu
ction
18,67
0,15
136
6,887
,155,2
2860
,421,1
57-4
1,751
,006
-5,96
4,429
3315
20N
onfe
rrous
met
al fo
undr
ies35
,305,0
9243
9,548
,950,
242
76,99
0,29
5-4
1,685
,204
-5,95
5,029
3112
10Fl
our m
illing
and
malt
man
ufac
turin
g19
,911,4
2518
2,029
,551,9
7760
,961,6
76-4
1,050
,251
-5,86
4,322
3114
20Fr
uit an
d ve
geta
ble c
annin
g, p
icklin
g, an
d dr
ying
34,67
8,000
5012
,652,9
69,55
774
,969,9
32-4
0,29
1,932
-5,75
5,990
3222
20Pa
per b
ag an
d co
ated
and
treat
ed p
aper
man
ufac
turin
g43
,682,5
0043
6,818
,940,
801
83,71
5,685
-40,
033,1
85-5
,719,0
2631
1520
Ice cr
eam
and
froze
n des
sert
man
ufac
turin
g4,3
75,0
0041
4,20
5,156
,946
43,63
6,713
-39,2
61,71
3-5
,608,8
1632
6110
Plas
tics p
acka
ging
mat
erial
s and
unlam
inate
d film
and
shee
t m
anuf
actu
ring
122,3
76,83
746
9,259
,066
,860
160,
761,3
88-3
8,384
,551
-5,48
3,507
3353
12M
otor
and
gene
rato
r man
ufac
turin
g51
,382,2
9563
8,804
,915,6
3589
,705,7
78-3
8,323
,483
-5,47
4,783
3132
00Fa
bric
mills
52,76
5,999
395,8
04,90
7,256
90,82
3,506
-38,0
57,50
7-5
,436,7
8732
5910
ing in
k man
ufac
turin
g70
,676,7
5025
8,361
,497,1
7310
8,616
,899
-37,9
40,14
9-5
,420,
021
3118
10Br
ead
and
bake
ry p
rodu
ct m
anuf
actu
ring
12,87
3,771
538,7
05,41
9,482
49,82
5,538
-36,9
51,76
7-5
,278,8
2433
5999
All o
ther
misc
ellan
eous
elec
trica
l equ
ipm
ent a
nd co
mpo
-ne
nt m
anuf
actu
ring
163,5
68,66
552
14,0
36,92
1,799
200,
344,0
81-3
6,775
,416
-5,25
3,631
3150
00Ap
pare
l man
ufac
turin
g43
,500,
000
334,1
88,98
7,174
79,0
28,22
4-3
5,528
,224
-5,0
75,46
1
Cont
inue
d on n
ext p
age
Appe
ndix Co
ntinued

25 N
AIC
S 6
Sub-
Indu
stry D
escr
iptio
nSu
bsid
ies to
In
dustr
y ($)
Upstr
eam
Ind
ustri
es (#
)Su
bsid
ies to
Ups
tream
In
dustr
ies ($
)C
ost t
o
Indu
stry (
$)N
et B
enef
its
($)
Annu
alize
d Ne
t Be
nefit
s ($)
3366
11Sh
ip b
uildi
ng an
d re
pairin
g22
0,07
2,280
6622
,333,8
44,24
825
4,981
,352
-34,9
09,0
72-4
,987,0
1032
5414
Biolo
gica
l pro
duct
(exc
ept d
iagno
stic)
man
ufac
turin
g25
,750,
000
349,1
46,78
8,23
559
,574,5
12-3
3,824
,512
-4,83
2,073
3115
1AFl
uid m
ilk an
d bu
tter m
anuf
actu
ring
24,78
0,00
049
5,610
,153,6
1757
,591,9
49-3
2,811,
949
-4,68
7,421
3262
90O
ther
rubb
er p
rodu
ct m
anuf
actu
ring
87,33
7,500
527,3
98,30
2,823
119,61
4,664
-32,2
77,16
4-4
,611,0
2331
1300
Suga
r and
conf
ectio
nery
pro
duct
man
ufac
turin
g21
,829,5
0047
9,057
,620,
039
52,0
77,10
8-3
0,24
7,608
-4,32
1,087
3344
1AO
ther
elec
tronic
com
pone
nt m
anuf
actu
ring
152,0
78,26
367
16,97
2,330
,338
181,9
40,67
0-2
9,862
,407
-4,26
6,058
3241
10Pe
troleu
m re
finer
ies78
,703,3
0139
10,82
6,299
,965
108,5
51,61
8-2
9,848
,317
-4,26
4,045
3279
99M
iscell
aneo
us no
nmet
allic
mine
ral p
rodu
cts
33,46
6,000
424,8
34,91
8,693
63,0
62,40
3-2
9,596
,403
-4,22
8,058
3117
00Se
afoo
d pr
oduc
t pre
para
tion a
nd p
acka
ging
26,0
90,0
0026
3,441
,847,0
4055
,223,0
14-2
9,133
,014
-4,16
1,859
3254
11M
edici
nal a
nd b
otan
ical m
anuf
actu
ring
49,35
1,500
324,3
46,21
3,655
76,70
2,910
-27,3
51,41
0-3
,907,3
4433
5911
Stor
age b
atte
ry m
anuf
actu
ring
55,97
7,000
426,3
85,48
7,228
83,24
0,54
7-2
7,263
,547
-3,89
4,792
3314
19Pr
imar
y sm
elting
and
refin
ing o
f non
ferro
us m
etal
(exc
ept
copp
er an
d alu
minu
m)
9,927
,500
132,3
07,42
2,560
36,0
72,12
9-2
6,144
,629
-3,73
4,947
3121
40D
istille
ries
6,740
,000
232,3
89,43
7,095
30,27
4,459
-23,5
34,45
9-3
,362,0
6632
2210
Pape
rboa
rd co
ntain
er m
anuf
actu
ring
53,17
0,00
046
13,18
1,037
,336
73,76
7,729
-20,
597,7
29-2
,942,5
3333
9920
Spor
ting
and
athle
tic g
oods
man
ufac
turin
g113
,037
,159
638,8
45,10
8,153
132,4
29,69
7-19
,392,5
38-2
,770,
363
3115
13C
hees
e man
ufac
turin
g1,9
13,0
0049
4,525
,763,7
5520
,594,1
80-18
,681,1
80-2
,668,7
4031
2200
Toba
cco
prod
uct m
anuf
actu
ring
16,0
00,0
0044
4,523
,609,5
8732
,419,9
61-16
,419,9
61-2
,345,7
0931
1514
Dry,
cond
ense
d, an
d ev
apor
ated
dair
y pro
duct
man
ufac
tur-
ing40
,205,3
8945
4,176
,671,5
5152
,165,3
35-11
,959,9
45-1,
708,5
64
3364
14G
uided
miss
ile an
d sp
ace v
ehicl
e man
ufac
turin
g18
9,533
,244
248,5
83,69
7,918
200,
337,6
71-10
,804,4
27-1,
543,4
9031
122A
Soyb
ean a
nd o
ther
oils
eed
proc
essin
g32
,250,
000
217,0
76,0
85,77
041
,713,3
70-9
,463,3
70-1,
351,9
1031
1990
All o
ther
food
man
ufac
turin
g78
,461,2
0043
5,768
,305,0
0987
,701,5
69-9
,240,
369
-1,32
0,05
333
1411
Prim
ary s
melt
ing an
d re
fining
of c
oppe
r0
162,8
50,0
25,22
98,0
24,41
8-8
,024
,418
-1,14
6,345
3112
25Fa
ts an
d oil
s ref
ining
and
blen
ding
51,64
0,00
027
7,983
,272,7
0759
,130,
398
-7,49
0,39
8-1,
070,
057
3359
20C
omm
unica
tion a
nd en
ergy
wire
and
cabl
e man
ufac
turin
g39
,412,4
7146
7,094
,988,1
6944
,448,
272
-5,0
35,80
1-7
19,40
033
1420
Cop
per r
olling
, dra
wing
, ext
rudi
ng an
d all
oying
13,82
1,773
438,9
03,71
5,946
14,55
0,09
4-7
28,32
1-10
4,046
3314
90N
onfe
rrous
met
al (e
xcep
t cop
per a
nd al
uminu
m) r
olling
, dr
awing
, ext
rudi
ng an
d all
oying
66,82
0,00
046
9,754
,207,2
1564
,804,7
342,0
15,26
628
7,895
3149
00O
ther
text
ile p
rodu
ct m
ills91
,180,
684
356,3
33,22
3,726
88,69
2,449
2,488
,236
355,4
62
Cont
inue
d on n
ext p
age
Appe
ndix Co
ntinued
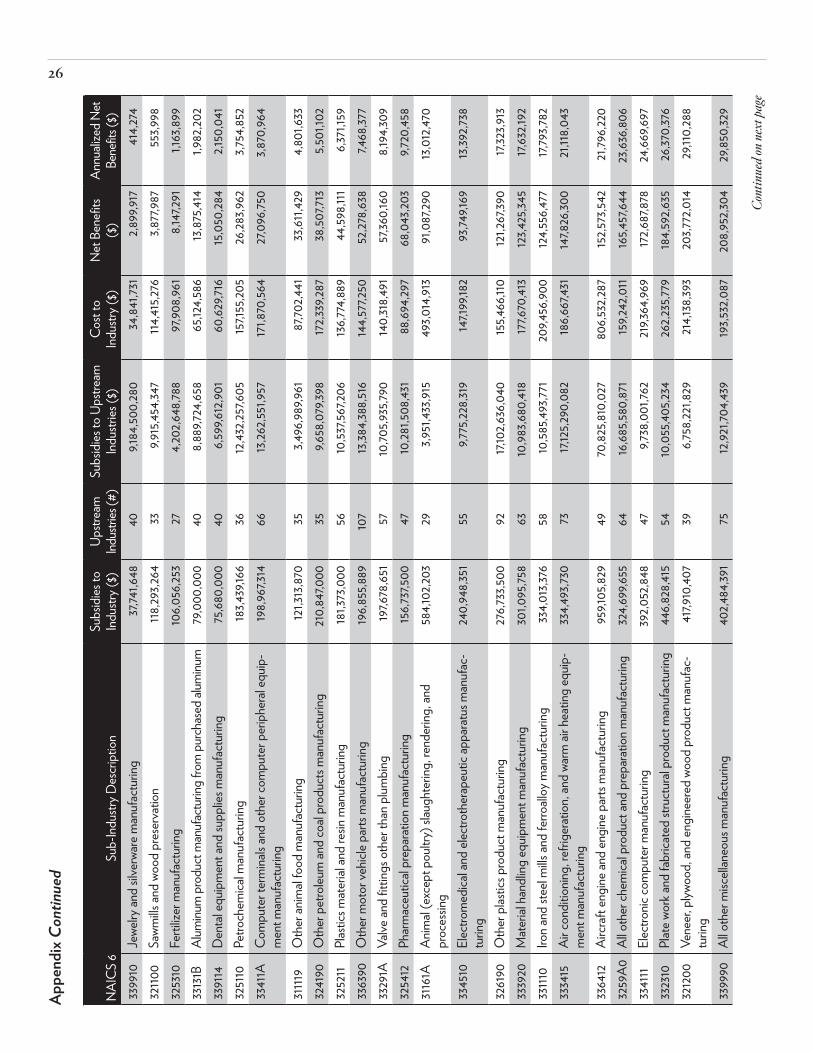
26
NAI
CS
6Su
b-In
dustr
y Des
crip
tion
Subs
idies
to
Indu
stry (
$)Up
strea
m
Indus
tries
(#)
Subs
idies
to U
pstre
am
Indu
stries
($)
Cos
t to
In
dustr
y ($)
Net
Ben
efits
($
)An
nuali
zed
Net
Bene
fits (
$)33
9910
Jewe
lry an
d sil
verw
are m
anuf
actu
ring
37,74
1,648
409,1
84,50
0,28
034
,841,7
312,8
99,91
741
4,27
432
1100
Sawm
ills an
d wo
od p
rese
rvat
ion118
,293,2
6433
9,915
,454,3
47114
,415,2
763,8
77,98
755
3,998
3253
10Fe
rtiliz
er m
anuf
actu
ring
106,0
56,25
327
4,20
2,648
,788
97,90
8,961
8,147
,291
1,163
,899
3313
1BAl
uminu
m p
rodu
ct m
anuf
actu
ring
from
pur
chas
ed al
uminu
m79
,000
,000
408,8
89,72
4,658
65,12
4,586
13,87
5,414
1,982
,202
3391
14D
enta
l equ
ipm
ent a
nd su
pplie
s man
ufac
turin
g75
,680,
000
406,5
99,61
2,901
60,62
9,716
15,0
50,28
42,1
50,0
4132
5110
Petro
chem
ical m
anuf
actu
ring
183,4
39,16
636
12,43
2,257
,605
157,1
55,20
526
,283,9
623,7
54,85
233
411A
Com
pute
r ter
mina
ls an
d ot
her c
ompu
ter p
erip
hera
l equ
ip-
men
t man
ufac
turin
g19
8,967
,314
6613
,262,5
51,95
717
1,870
,564
27,0
96,75
03,8
70,96
4
31111
9O
ther
anim
al fo
od m
anuf
actu
ring
121,3
13,87
035
3,496
,989,9
6187
,702,4
4133
,611,4
294,8
01,63
332
4190
Oth
er p
etro
leum
and
coal
prod
ucts
man
ufac
turin
g21
0,84
7,000
359,6
58,0
79,39
817
2,339
,287
38,50
7,713
5,501
,102
3252
11Pl
astic
s mat
erial
and
resin
man
ufac
turin
g18
1,373
,000
5610
,537,5
67,20
613
6,774
,889
44,59
8,111
6,371
,159
3363
90O
ther
mot
or ve
hicle
parts
man
ufac
turin
g19
6,855
,889
107
13,38
4,388
,516
144,5
77,25
052
,278,6
387,4
68,37
733
291A
Valve
and
fittin
gs o
ther
than
plum
bing
197,6
78,65
157
10,70
5,935
,790
140,
318,4
9157
,360,
160
8,194
,309
3254
12Ph
arm
aceu
tical
prep
arat
ion m
anuf
actu
ring
156,7
37,50
047
10,28
1,508
,431
88,69
4,29
768
,043
,203
9,720
,458
3116
1AAn
imal
(exc
ept p
oultr
y) sl
augh
terin
g, re
nder
ing, a
nd
proc
essin
g58
4,102
,203
293,9
51,43
3,915
493,0
14,91
391
,087
,290
13,0
12,47
0
3345
10El
ectro
med
ical a
nd el
ectro
ther
apeu
tic ap
para
tus m
anuf
ac-
turin
g24
0,94
8,351
559,7
75,22
8,319
147,1
99,18
293
,749,1
6913
,392,7
38
3261
90O
ther
plas
tics p
rodu
ct m
anuf
actu
ring
276,7
33,50
092
17,10
2,636
,040
155,4
66,11
012
1,267
,390
17,32
3,913
3339
20M
ater
ial h
andl
ing eq
uipm
ent m
anuf
actu
ring
301,0
95,75
863
10,98
3,680
,418
177,6
70,41
312
3,425
,345
17,63
2,192
33111
0Iro
n and
stee
l mills
and
ferro
alloy
man
ufac
turin
g33
4,013
,376
5810
,585,4
93,77
120
9,456
,900
124,5
56,47
717,
793,7
8233
3415
Air c
ondi
tionin
g, re
frige
ratio
n, an
d wa
rm ai
r hea
ting
equip
-m
ent m
anuf
actu
ring
334,4
93,73
073
17,12
5,290
,082
186,6
67,43
114
7,826
,300
21,11
8,043
3364
12Ai
rcra
ft en
gine
and
engi
ne p
arts
man
ufac
turin
g95
9,105
,829
4970
,825,8
10,0
2780
6,532
,287
152,5
73,54
221
,796,2
2032
59A0
All o
ther
chem
ical p
rodu
ct an
d pr
epar
ation
man
ufac
turin
g32
4,699
,655
6416
,685,5
80,87
115
9,242
,011
165,4
57,64
423
,636,8
0633
4111
Elec
tronic
com
pute
r man
ufac
turin
g39
2,052
,848
479,7
38,0
01,76
221
9,364
,969
172,6
87,87
824
,669,6
9733
2310
Plat
e wor
k and
fabr
icate
d str
uctu
ral p
rodu
ct m
anuf
actu
ring
446,8
28,41
554
10,0
55,40
5,234
262,2
35,77
918
4,592
,635
26,37
0,37
632
1200
Vene
er, p
lywoo
d, an
d en
gine
ered
woo
d pr
oduc
t man
ufac
-tu
ring
417,9
10,40
739
6,758
,221,8
2921
4,138
,393
203,7
72,0
1429
,110,
288
3399
90Al
l oth
er m
iscell
aneo
us m
anuf
actu
ring
402,4
84,39
175
12,92
1,704
,439
193,5
32,0
8720
8,952
,304
29,85
0,32
9
Appe
ndix Co
ntinued
Cont
inue
d on n
ext p
age

27
NAI
CS
6Su
b-In
dustr
y Des
crip
tion
Subs
idies
to
Indu
stry (
$)Up
strea
m
Indus
tries
(#)
Subs
idies
to U
pstre
am
Indu
stries
($)
Cos
t to
In
dustr
y ($)
Net
Ben
efits
($
)An
nuali
zed
Net
Bene
fits (
$)33
329A
Oth
er in
dustr
ial m
achin
ery m
anuf
actu
ring
637,5
63,30
273
17,34
1,350
,270
410,
974,5
8422
6,588
,718
32,36
9,817
3339
12Ai
r and
gas
com
pres
sor m
anuf
actu
ring
418,3
42,32
159
11,35
0,61
1,887
190,
399,7
7722
7,942
,544
32,56
3,221
3333
1AVe
nding
, com
mer
cial la
undr
y, an
d ot
her c
omm
ercia
l and
se
rvice
indu
stry m
achin
ery
417,8
93,57
168
16,0
45,32
9,966
180,
087,6
1123
7,805
,960
33,97
2,280
3131
00Fi
ber, y
arn,
and
thre
ad m
ills31
4,505
,976
255,3
44,26
6,708
54,0
53,86
926
0,45
2,107
37,20
7,444
3391
12Su
rgica
l and
med
ical in
strum
ent m
anuf
actu
ring
506,3
51,65
558
10,95
8,119
,396
197,3
83,91
930
8,967
,735
44,13
8,24
833
6120
Heav
y dut
y tru
ck m
anuf
actu
ring
462,5
78,49
879
12,12
7,190
,320
66,32
3,743
396,2
54,75
456
,607,8
2233
3994
Indu
strial
pro
cess
furn
ace a
nd o
ven m
anuf
actu
ring
848,0
97,56
734
8,515
,100,
816
365,7
52,85
748
2,344
,710
68,90
6,387
3344
13Se
mico
nduc
tor a
nd re
lated
dev
ice m
anuf
actu
ring
900,
927,8
3377
17,45
0,74
3,974
274,6
70,10
462
6,257
,729
89,46
5,390
3365
00Ra
ilroad
rollin
g sto
ck m
anuf
actu
ring
1,223
,103,4
8851
10,47
6,230
,260
416,7
07,91
080
6,395
,577
115,19
9,368
3361
11Au
tom
obile
man
ufac
turin
g94
3,062
,837
7612
,100,
136,8
7073
,674,6
7786
9,388
,160
124,1
98,30
933
3295
Sem
icond
ucto
r mac
hiner
y man
ufac
turin
g1,5
36,82
3,820
6217,
330,
391,4
7757
0,114
,353
966,7
09,46
713
8,101
,352
3331
20C
onstr
uctio
n mac
hiner
y man
ufac
turin
g1,3
26,19
3,965
6613
,723,4
70,33
320
8,897
,661
1,117,
296,3
0415
9,613
,758
3335
1BC
uttin
g an
d m
achin
e too
l acc
esso
ry, ro
lling
mill,
and
othe
r m
etalw
orkin
g m
achin
ery
1,602
,946,2
7553
13,77
9,789
,185
312,1
25,0
591,2
90,82
1,216
184,4
03,0
31
3331
11Fa
rm m
achin
ery a
nd eq
uipm
ent m
anuf
actu
ring
1,875
,820,
392
6317,
020,
611,2
5723
8,28
5,441
1,637
,534,9
5123
3,933
,564
3342
20Br
oadc
ast a
nd w
ireles
s com
mun
icatio
ns eq
uipm
ent
4,22
9,082
,082
6315
,308,1
27,19
12,5
57,51
2,806
1,671
,569,2
7723
8,795
,611
3361
12Li
ght t
ruck
and
utilit
y veh
icle m
anuf
actu
ring
2,012
,715,4
4177
11,22
6,069
,033
77,0
19,83
41,9
35,69
5,607
276,5
27,94
433
399A
Oth
er g
ener
al pu
rpos
e mac
hiner
y man
ufac
turin
g2,2
67,25
0,21
968
16,64
1,398
,069
275,6
66,30
41,9
91,58
3,916
284,5
11,98
833
3130
Mini
ng an
d oil
and
gas f
ield
mac
hiner
y man
ufac
turin
g4,0
18,85
4,850
6015
,767,8
56,78
732
5,793
,269
3,693
,061
,581
527,5
80,22
633
2410
Powe
r boil
er an
d he
at ex
chan
ger m
anuf
actu
ring
5,003
,595,9
7850
14,95
5,026
,925
903,1
95,17
24,1
00,40
0,80
658
5,771
,544
3336
11Tu
rbine
and
turb
ine g
ener
ator
set u
nits m
anuf
actu
ring
5,213
,669,2
7152
20,0
76,54
1,365
716,3
01,32
74,4
97,36
7,945
642,4
81,13
518
9 “Vi
ctim
s”7,6
74,38
6,166
27,15
5,070
,131
-19,48
0,68
3,965
-2,78
2,954
,852
47 “W
inne
rs”42
,795,8
32,0
4313
,265,3
10,6
3129
,530,
521,4
124,
218,
645,9
16Al
l Man
ufac
turin
g (e
xcep
t Airc
raft)
50,47
0,21
8,20
940
,420,
380,
762
10,0
49,8
37,44
71,4
35,6
91,0
64
Appe
ndix Co
ntinued

28
NOTES
1. Testimony of Veronique de Rugy before the U.S. Congress, House of Representatives, Com-mittee on Financial Services, June 25, 2014, p. 8, http://mercatus.org/sites/default/files/deRugy-exim-testimony-062314.pdf.
2. For a more comprehensive presentation of arguments in favor of shutting down the Export-Import Banks, see, for example: Sallie James, “Time to X Out the Ex-Im Bank,” Cato Institute Trade Policy Analysis no. 47, July 6, 2011, http://object.cato.org/sites/cato.org/files/pubs/pdf/tpa-047.pdf; Veronique de Rugy and Andrea Castillo, “The US Export-Import Bank: A Review of the Debate over Reauthorization,” Mercatus Center Research, July 16, 2014, http://mercatus.org/sites/default/files/deRugy-Ex-ImReview.pdf.
3. See Daniel J. Ikenson, “Washington Post Half-Heartedly Seeks Clarity about Export-Import Bank Jobs Claims,” Cato at Liberty Blog Post, August 15, 2014, http://www.cato.org/blog/wash ington-post-half-heartedly-seeks-clarity-about-export-import-bank-jobs-claims.
4. For an explanation of Ex-Im’s methodology for determining the value of exports and the number of jobs supported by its operations, see “Export-Import Bank: More Detailed Information about Its Jobs Calculation Methodology Could Im-prove Transparency,” United States Government Accountability Office, Report to Congressional Committees, May 2013.
5. Export-Import Bank of the United States, FFA-TA (Federal Funding Accountability and Transpar-ency Act) Transaction Information, 2007–2013, http://www.exim.gov/about/library/foia/Frequent ly-Requested-Reports-and-Information.cfm.
6. United States Bureau of the Census, http://www.census.gov/eos/www/naics/.
7. The NAICS coding system has gone through a few revisions over the years, most recently in 2012. The 2007 version was used because that version is
the basis for the most up-to-date input-output ta-bles, produced by the Bureau of Economic Analy-sis, which are central to this analysis.
8. Aircraft production (NAICS 336411) was ex-cluded to allow for a clearer view of what is hap-pening in typical industries, as inclusion of aircraft subsidies, which accounted for more than half of the subsidies to manufacturers, would skew that picture.
9. See Daniel J. Ikenson, “Steel Trap: How Sub-sidies and Protectionism Weaken the U.S. Steel Industry,” Cato Institute Trade Briefing Paper no. 14, September 1, 2002.
10. Office of the U.S. Trade Representative, Press Office, “WTO Case Challenging China’s Export Restraints on Raw Material Inputs,” Fact Sheet, June 2009, http://www.ustr.gov/about-us/press-of fice/fact-sheets/2009/june/wto-case-challeng ing-chinas-export-restraints-raw-materi.
11. See Daniel Griswold, “The Miscellaneous Tar-iff Bill: A Blueprint for Future Trade Expansion,” Cato Institute Trade Briefing Paper no. 30, Sep-tember 9, 2010.
12. President Barack Obama, The White House, Office of the Press Secretary, “Remarks by the President at the Signing of the Manufacturing En-hancement Act of 2010,” August 11, 2010.
13. Bureau of Economic Analysis, Survey of Cur-rent Business, International Transactions Tables, Table 1.2, http://www.bea.gov/scb/pdf/2014/07%20July/0714_international_transactions_accounts_tables.pdf.
14. This is a link to the BEA’s I-O Use Table, which is too large to reproduce in this report. http://www.bea.gov/industry/xls/iouse_before_redefinitions_pur_2007_detail.xlsx. References will be made in the text to this table for some methodological descriptions. This file contains detail-level Use Table before redefinitions data from the Industry Input-Output (I-O) benchmark accounts for the year 2007. These data were released on January

29
23, 2014, as part of the comprehensive revision to the industry economic accounts (IEAs). Statis-tics were prepared with methodologies that are unique to the I-O accounts and are for industries defined according to the 2007 North American Industry Classification System (NAICS).
15. This is calculated as the sum of the “total inter-mediate” column ($11.7 trillion in cell OA392) di-
vided by the sum of the “total commodity output” column ($26.2 trillion in cell ON397).
16. This can be determined by aggregating the “total intermediate” column (Column OA) for all manufacturing industries (Rows 43-279) and dividing that figure by the “total commodity out-put” column (Column ON) aggregated for rows 43-279.

RELATED PUBLICATIONS FROM THE CATO INSTITUTE
The Obama Administration’s Trade Agenda Is Crumbling by Daniel R. Pearson, Cato Institute Free Trade Bulletin no. 58 (March 19, 2014)
A Compromise to Advance the Trade Agenda: Purge Negotiations of Investor-State Dispute Settlement by Daniel J. Ikenson, Cato Institute Free Trade Bulletin no. 57 (March 4, 2014)
The Transatlantic Trade and Investment Partnership: A Roadmap for Success by Daniel J. Ikenson, Cato Institute Free Trade Bulletin no. 55 (October 14, 2013)
Reversing Worrisome Trends: How to Attract and Retain Investment in a Competitive Global Economy by Daniel J. Ikenson, Cato Institute Policy Analysis no. 735 (August 22, 2013)
Free Trade in Environmental Goods: The Trade Remedy Problem by Simon Lester and K. William Watson, Cato Institute Free Trade Bulletin no. 54 (August 19, 2013)
Liberalization or Litigation? Time to Rethink the International Investment Regime by Simon Lester, Cato Institute Policy Analysis no. 720 (July 8, 2013)
The Challenges of Negotiating a Transatlantic Trade and Investment Partnership by Simon Lester, Cato Institute Free Trade Bulletin no. 51 (February 26, 2013)
License to Drill: The Case for Modernizing America’s Crude Oil and Natural Gas Export Licensing Systems by Scott Lincicome, Cato Institute Free Trade Bulletin no. 50 (February 21, 2013)
Liberalizing Cross-Border Trade in Higher Education: The Coming Revolution of Online Universities by Simon Lester, Cato Institute Policy Analysis no. 720 (February 5, 2013)
Countervailing Calamity: How to Stop the Global Subsidies Race by Scott Lincicome, Cato Institute Policy Analysis no. 710 (October 9, 2012)
Still a Protectionist Trade Remedy: The Case for Repealing Section 337 by K. William Watson, Cato Institute Policy Analysis no. 708 (September 19, 2012)
Free Trade and Tobacco: Thank You for Not Smoking (Foreign) Cigarettes by Simon Lester, Cato Institute Free Trade Bulletin no. 49 (August 15, 2012)
Expanding Ex-Im’s Mandate Is A Big Mistake by Sallie James, Cato Institute Free Trade Bulletin no. 48 (March 14, 2012)
Trade Policy Priority One: Averting a U.S.-China “Trade War” by Daniel J. Ikenson, Cato Institute Free Trade Bulletin no. 47 (March 5, 2012)

Trading with the Bear: Why Russia’s Entry into the WTO Is in America’s Interest by Daniel Griswold and Douglas Petersen, Cato Institute Free Trade Bulletin no. 46 (December 6, 2011)
Time to X Out the Ex-Im Bank by Sallie James, Cato Institute Trade Policy Analysis no. 47 (July 6, 2011)
As Promised, Free Trade Agreements Deliver More Trade: Manufacturing Exports Receive an Extra Boost by Daniel Griswold, Cato Institute Free Trade Bulletin no. 45 (June 7, 2011)
Economic Self-Flagellation: How U.S. Antidumping Policy Subverts the National Export Initiative by Daniel J. Ikenson, Cato Institute Trade Policy Analysis no. 46 (May 31, 2011)
Made on Earth: How Global Economic Integration Renders Trade Policy Obsolete by Daniel Ikenson, Cato Institute Trade Policy Analysis no. 42 (December 2, 2009)
A Protectionism Fling: Why Tariff Hikes and Other Trade Barriers Will Be Short-Lived by Daniel Ikenson, Cato Institute Free Trade Bulletin no. 37 (March 12, 2009)
Opening U.S. Skies to Global Airline Competition by Kenneth J. Button, Cato Institute Trade Policy Analysis no. 5 (November 24, 1998)
RECENT STUDIES IN THE CATO INSTITUTE POLICY ANALYSIS SERIES
755. Responsible Counterterrorism Policy by John Mueller and Mark G. Stewart (September 10, 2014)
754. Math Gone Mad: Regulatory Risk Modeling by the Federal Reserve by Kevin Dowd (September 3, 2014)
753. The Dead Hand of Socialism: State Ownership in the Arab World by Dalibor Rohac (August 25, 2014)
752. Rapid Bus: A Low-Cost, High-Capacity Transit System for Major Urban Areas by Randal O’Toole (July 30, 2014)
751. Libertarianism and Federalism by Ilya Somin (June 30, 2014)
750. The Worst of Both: The Rise of High-Cost, Low-Capacity Rail Transit by Randal O’Toole (June 3, 2014)
749. REAL ID: State-by-State Update by Jim Harper (March 12, 2014)
748. State-Based Visas: A Federalist Approach to Reforming U.S. Immigration Policy by Brandon Fuller and Sean Rust (April 23, 2014)

Published by the Cato Institute, Policy Analysis is a regular series evaluating government policies and offering proposals for reform. Nothing in Policy Analysis should be construed as necessarily reflecting the views of the Cato Institute or as an attempt to aid or hinder the passage of any bill before Congress. Contact the Cato Institute for reprint permission. All policy studies can be viewed online at www.cato.org. Additional printed copies of Cato Institute Policy Analysis are $6.00 each ($3.00 each for five or more). To order, call toll free (800) 767-1241 or email [email protected].
747. Run, Run, Run: Was the Financial Crisis Panic over Institution Runs Justified? by Vern McKinley (April 10, 2014)
746. State Education Trends: Academic Performance and Spending over the Past 40 Years by Andrew J. Coulson (March 18, 2014)
745. Obamacare: What We Know Now by Michael Tanner (January 27, 2014)
744. How States Talk Back to Washington and Strengthen American Federalism by John Dinan (December 3, 2013)
743. The New Autarky? How U.S. and UK Domestic and Foreign Banking Proposals Threaten Global Growth by Louise C. Bennetts and Arthur S. Long (November 21, 2013)
742. Privatizing the Transportation Security Administration by Chris Edwards (November 19, 2013)
741. Solving Egypt’s Subsidy Problem by Dalibor Rohac (November 6, 2013)
740. Reducing Livability: How Sustainability Planning Threatens the American Dream by Randal O’Toole (October 28, 2013)
739. Antitrust Enforcement in the Obama Administration’s First Term: A Regulatory Approach by William F. Shughart II and Diana W. Thomas (October 22, 2013)
738. SNAP Failure: The Food Stamp Program Needs Reform by Michael Tanner (October 16, 2013)
737. Why Growth Is Getting Harder by Brink Lindsey (October 8, 2013)
736. The Terrorism Risk Insurance Act: Time to End the Corporate Welfare by Robert J. Rhee (September 10, 2013)
735. Reversing Worrisome Trends: How to Attract and Retain Investment in a Competitive Global Economy by Daniel Ikenson (August 22, 2013)
734. Arms and Influence in Syria: The Pitfalls of Greater U.S. Involvement by Erica D. Borghard (August 7, 2013)
733. The Rising Cost of Social Security Disability Insurance by Tad DeHaven (August 6, 2013)