Embed Size (px)
Citation preview

Annual Report of Africa RISING Project funded subprojects carried out by
CSIR-Savanna Agricultural Research Institute (CSIR-SARI)
Reporting Period: July – December 2012
Submitting Institute: CSIR- Savanna Agricultural Research Institute, Nyankpala, Ghana
Collaborators: Ministry of Food and Agriculture (MoFA), CSIR-Crop Research Institute and Non-governmental
Organizations (NGOs)
February 2013
Executive summary
Maize (Zea mays) is an important staple food crop in sub-Saharan Africa, but productivity has not kept pace with population growth. Maize is also a major source of calories and cash income, yet grain yield levels are low as a result of low soil nutrient levels, use of varieties with low yield potential and low management levels. Several subprojects were implemented by CSIR-SARI with the purpose of evaluating new and improved varieties of maize sorghum, soybean and cowpea with farmers in their own environment, with the aim of finding adoptable varieties which are appropriate to their needs and also make quality seed of recently released varieties of maize, cowpea and soybean available for project activities in subsequent years. The activities also included determination of fertilizer requirements of improved maize and soybean varieties as well as the optimum planting date, cultivar and insecticide spraying regime for control of insect pests of cowpea. The activities were to produce short-term outputs in 2012 and to support the longer term objectives of the Africa RISING project in West Africa. At all locations, variation in N supply affected growth and development of maize plants and low N stress reduced crop growth and grain yield significantly. In addition, maize straw yield, an essential component of the farming system was increased with fertilizer application. At most locations, grain yield of maize increased with increasing levels of N up to 80 kg N/ha beyond which there were no further significant increases. Preliminary results showed that the application of fertilizer N would increase maize grain yield and sustain soil fertility in the Guinea savanna zone. The practice will ensure food security, reduce nutrient mining and environmental degradation. Fertilizer N was most efficiently used by maize when applied at lower rates than at higher rates. Soybean response to fertilizer and Rhizobium inoculation was inconsistent. Application of P and K fertilizers with or without inoculants tended to increase grain yield relative to the no fertilizer treatment or the treatment with only Rhizobium inoculants. Soybean yield was highest for the treatment with Rhizobium inoculants in Yendi only. The synergy between Rhizobium inoculation and PK fertilization was evident at Bamahu and Yendi. However, Rhizobium inoculation did not increase soybean yields at Nyankpala and Wa. Several of the locations had been planted to soybean in past years, and indigenous Rhizobium bacteria populations were probably adequate for soybean nodulation. In other study conducted to develop an integrated management system for cowpea insect pests, the results showed that spraying cowpea once would have similar effect as not spraying at all. This was manifested in the lack of significant difference observed in most cases between the two spraying regimes in respect to the number of Thrips, Maruca vitrata, shrivelled pods, pods with Maruca feeding holes and grain yield. For a profitable cowpea production, unsprayed fields should not be encouraged. On the other hand two spraying at full flowering and full pod formation had similar effects as praying thrice. Therefore, it is better to spray twice to save the extra cost for the third spray. The use of insecticides must be minimized because of high cost and harmful effects on the environment. Planting cowpea between mid July and early August was found to suffer relatively less attack by Maruca vitrata, Thrips and pod sucking bugs. Moreover grain yields were higher than planting dates in late August. Planting cowpea during the last week of August or beyond means the most critical stages of the plant (flowering and podding) will coincide with terminal drought. This is also the time that insects rapidly increase in their population. Eventually the plants suffer severe attack by insects which results in poor flowering, low pod formation, high rate of pod damage and finally low grain yield. These results obtained in 2012 are preliminary and it would therefore be imperative that the experiments are repeated so as to confirm or reject these current results.

Introduction
Maize (Zea mays) is a major source of calories and cash income in Ghana. It is also an important component of poultry and livestock feed and to a lesser extent, a substitute in the brewing industry. Maize is grown in all the agro-ecological systems of Ghana. In the northern Guinea savanna zone, maize and sorghum are the two major cereal crops on 30 to 40% of the area under agricultural production. Maize cropping provides livelihoods for millions of subsistence farmers. Therefore increasing the productivity of maize-based farming systems could increase and stabilize rural incomes, reduce the chronic food shortages that plague this zone prior to harvest as well as lessen the risk in farming. However, in Ghana, especially the northern Guinea savanna zone most maize is grown under low N conditions because of low nitrogen (N) status of the soils, low N use efficiency in drought-prone environments, high price ratios between fertilizer and grain, limited availability of fertilizer and low purchasing power of farmers. Generally, grain yields of both maize and grain legumes even of the improved varieties are far below the on-station yields. For example the national average maize yield is estimated at 1.7 t/ha and this is low compared to major maize producing countries but a huge potential exists for increasing the yield to about 6.0 t/ha through increasing the use of improved varieties and/or hybrids and appropriate crop production practices (Ministry of Food and Agriculture, 2010). The parasitic weed, Striga hermonthica (witch weed) adversely affect the production of maize and sorghum in the Guinea savanna zone.
Recent community analysis exercise carried out in northern Ghana revealed that declining soil fertility, erratic rainfall, preseason and terminal drought, pest and disease problems, indiscriminant insecticide use by farmers and its attendant health hazards and unavailability of inputs (especially fertilizer and improved seeds) are major agricultural production problems in the region. Other management problems that reduce crop yields include low plant populations, inappropriate planting time, inadequate control of weeds, pest and diseases and control of Striga as well as untimely application of adequate quantities of fertilizers. As low soil N is a major factor limiting cereal production, rotations with legumes such as soybean, cowpea and groundnuts could supply a part of the nitrogen required for cereal growth and may minimize the depletion of soil of organic matter and the build-up of weeds, diseases, and insects. Other solutions for maintaining soil organic matter include crop residue management and combined use of organic and inorganic fertilizers. Integration of grain legumes such as soybean and cowpeas with maize can provide additional protein in the diet which contributes to improved human nutrition. Although several improved maize and grain legume varieties have been recently released by National Crop Improvement Programs/project, agronomic packages to optimize yield under different agro-ecologies in the Guinea savannah are not available.
As part of the United States government’s Feed the Future initiative to address global hunger and food security issues in sub-Saharan Africa, the U.S. Agency for International Development (USAID) is supporting a multi-stakeholder agricultural research project to sustainably intensify mixed farming systems in parts of Africa including Southern Mali and Northern Ghana. Therefore, the CSIR-SARI in collaboration with Ministry of Food and Agriculture (MoFA) initiated some sub-projects based on the agricultural production problems identified by farmers through a participatory research and extension approach across the project communities in

northern Ghana. These subprojects were funded by Africa RISING Project. This annual report covers experiments implemented by CSIR-SARI for the period July to December, 2012.
Purpose
The purpose of the sub-projects were to: assess agronomic and economic benefits of using different rates of N fertilizer on drought
tolerant extra-early, early and medium maturity maize varieties in the savanna agro-ecological zone comprising Northern, Upper West and Upper east regions.
evaluate new and improved varieties of drought tolerant maize varieties with farmers in their own environment, with the aim of finding adoptable varieties which are appropriate to their needs and also
assess the agronomic and economic benefits of using fertilizer N, P and K as well as Rhizobium inoculants for soybean production in the Guinea savanna of Ghana
evaluate cowpea cultivars for their resistance to major insect pests of cowpea, determine appropriate planting dates as a cultural tool for pest management and determine the minimum insecticide protection required for increased cowpea yield in the savanna agro-ecological zone.
increase awareness of improved sorghum varieties currently produced or introduced from the West African sub-region to facilitate the evaluation of the improved varieties by farmers under their own conditions in comparison with their landraces and to improve farmers’ access to seeds of improved varieties.
increase availability and access to quality breeder seed of recently released varieties of maize, sorghum, cowpea and soybean for project activities in subsequent years.
The sub-projects were to produce some short-term outputs in 2012 and to support the longer term objectives of the Africa RISING project in West Africa.
Expected results Economic optimum nutrient requirements for maize and soybean production identified
and promoted Promising drought tolerant maize and sorghum varieties identified and promoted Farmers understanding of maize, sorghum cowpea and soybean production techniques
enhanced Integrated management of cowpea insect pests evaluated and delivered to farmers Capacity of farmers, extension and research staff involved in maize, cowpea and
soybean production activities enhanced through training, interactions and research. Increase awareness of the availability of improved maize, sorghum, cowpea and soybean
varieties in northern Ghana. Farmers’ access to seeds of improved varieties of maize, sorghum, cowpea and soybean
enhanced Strategy to enhance the adoption and facilitate the release of promising sorghum varieties
developed and expanded. Quality breeder and foundation seed of maize, soybean and cowpea made available for
project activities in subsequent seasons.Target beneficiaries

Extension staff of MoFA Farmers Seed producers Non-governmental organizations (NGOs) Researchers
Implementation strategyAfrica RISING Project funded several small, short-term sub-projects carried out by various scientists in CSIR-SARI during the 2012 cropping season (June – October) in the northern savanna agro-ecology. Thus a number of field studies involving on-station and on-farm trials as well as breeder seed production were conducted in 2012 in the Northern (NR), Upper West (UWR) and Upper East (UER) regions. Prior to the establishment of the on-farm trials, consultative meetings were held with the extension staff of MoFA in the various administrative districts in each region to agree on sites for the trials. Informal discussions were held in the communities and subsequently, volunteer farmers were selected in agreement with members of the communities to participate in trials. Criteria used in the selection included: access to land, willingness to spare a portion of the farm for pure stand crop production, field location within the community and willingness to share experience with other farmers. Generally, the dominant means of livelihood in all the project communities is farming. Cereals (especially maize and sorghum) and grain legumes (mostly cowpea and groundnut) are the major crops grown. The results of the short-term sub-projects covering the period July to December 2012 are contained in this report:
A. On-station trials
Activity A1: Response of extra-early, early and medium maturing drought tolerant maize varieties to nitrogen fertilizer in the northern savanna zone (S.S. Buah, J.M. Kombiok and R.A.L. Kanton).
Executive summaryMaize is an important staple food crop in Ghana, yet grain yields are generally low. The low yields are due partly to factors such as inherently poor soils, continuous cropping of cereal after cereal, high cost and unavailability of chemical fertilizers. To address this negative trend in maize yields in the country, field trials were conducted in the northern savanna agro-ecological system comprising the Upper West, Upper East and Northern regions of Ghana to assess agronomic and economic benefits of using different rates of N fertilizer (0, 40, 80, 120 and 160 kg N/ha) on drought tolerant extra-early, early and medium maturity maize varieties. At all locations, variation in N supply affected both growth and development of maize plants and low N stress reduced crop growth and grain yield significantly. In addition, maize straw yield, which is an essential component of the farming system in UER was also increased with fertilizer application. In NR, grain yield of maize increased with increasing levels of N up to 80 kg N/ha

beyond which there were no further significant increases. In the early and medium trials, the yield of the farmer variety was as good as the newly released early and medium maturing varieties tested since there were no significant differences in yield among the varieties. Preliminary results showed that the application of fertilizer N would increase maize grain yield and sustain soil fertility in the Guinea savanna zone. The practice will ensure food security, reduce nutrient mining and environmental degradation. The maize varieties with greater nitrogen use efficiency values at maturity required more N to achieve maximum grain yield but nonetheless were relatively more efficient in utilizing absorbed N in grain production. In general, N use efficiency decreased as a result of increased N supply, regardless of variety. This implies that N was most efficiently used when applied at lower rates than at higher rates. As these results are preliminary it would be imperative that the studies are repeated so as to confirm or reject these current results, so that we can recommend to maize farmers in Ghana for increased and stable maize production.
IntroductionMaize is an important staple food crop in Ghana. However, low soil nutrient level has been found to usually be the most limiting factor to crop reproduction in the Guinea savanna zone of Ghana, but this interacts with the quantity of water available. In most of Ghana, low crop yields are common due to erratic rainfall, low soil nutrient levels (particularly nitrogen and phosphorus), use of unimproved varieties and poor management practices. The release of new maize varieties is the efforts of Scientists from National Agricultural Research Systems (NARS) in collaboration with International Agricultural Research Institutes such as International Institute of Tropical Agriculture (IITA). These new releases carried out by Scientists are made to replace the existing ones used by farmers most often at their request. Depending on the request by the farmers, these varieties released may have higher yield potential, disease and pest resistance, drought tolerance or early maturing to cope with the erratic and ever declining rains of the northern Savanna zone of Ghana. These new varieties are often widely tested with farmers in their own environment (on-farm trials) to ensure that they are not rejected after they have been released.
Several maize varieties that are either tolerant to drought or mature earlier to escape drought have been developed for various agro-ecological systems through collaborative efforts between IITA and NARS such as Savanna Agricultural Research Institute (SARI) and Crops Research Institute (CRI) within the frame work of the Drought Tolerant Maize for Africa (DTMA) project. Even though the breeding process is still on-going, some maize varieties have been jointly released from the programme by SARI and CRI. Before the release of these varieties, they were tested with farmers within the various ecological zones to validate the results obtained from the on-station trials for the past years. The assessment of these new varieties was done both on station and on-farm with the application of the outdated fertilizer recommendations for maize which is more than four decades old. However, with differences in the maturity periods and the additional attributes they possess to withstand both drought and Striga, it became necessary to assess the performance of these new varieties by subjecting them to different levels of fertilizer nitrogen. Therefore the objective of the study was to assess agronomic and economic benefits of using different rates of N fertilizer on drought tolerant extra-early, early and medium maturity maize varieties in the northern savanna agro-ecology of Ghana comprising Northern, Upper East and Upper West regions.

Materials and methodsThree field studies involving three maturity groups of maize (i.e., extra-early, early and medium) were conducted during the 2012 cropping season in the northern savanna agro-ecological system of Ghana, comprising NR, UER and UWR administrative regions. The UWR and NR are both located in the northern Guinea savanna zone but with different soil conditions, while UER is located in the Sudan savanna zone. The Guinea and Sudan savannas often experience hot, distinct dry and wet conditions. Specifically the trials were conducted at the Savanna Agricultural Research Institute experimental fields at Wa and Tumu in UWR, Manga near Bawku, (11o 01’ N, 00o 16’ W, 249 m above sea level) in UER and Nyankpala (latitude 9o 25” N and longitude 1o 00’W, 183 m above sea level) in NR. The northern savanna consists of the Guinea and Sudan savannas and often experience hot, distinct dry and wet conditions. Upper West and NR are both located in the northern Guinea savanna zone but with different soil conditions; while UER is located in the Sudan savanna zone. The Guinea savanna area has an average annual rainfall of about 1000-1200 mm occurring in a single rainy season from May to October. The rest of the year is dry. The Sudan savanna has similar conditions but rainfall amounts are lower (900 – 1000 mm) and the dry period is also longer (November –May). Temperatures are high, between 26°C and 30°C, with little variation throughout the year.
Soils in the northern savanna zone generally have a sandy texture, inherently low in organic matter which limits their moisture-holding capacity and potential for growing annual crops. Traditional slash and burn practices and the yearly indiscriminate bush burning further exacerbate the problem of soil fertility. Dominating soil type in the Guinea Savanna according to FAO (1998) is Savanna Ochrosol with underground laterite (poorly drained soils). Northern and UER have a contrastive geology; UER is underlain by granites interspersed with some pyroclastic rock while the NR is essentially Voltaian sandstones, giving easily worked light soils but prone to concretions and hardpan. The granites have both a greater concentration of nutrients and better retention of precipitation. The Ochrosols which form on top it are less prone to erosion than the sandy soils forming on the sandstones. The soil types that dominate in the UWR are laterite, sandy and sandy loam (savanna ochrosols). They are generally poor in organic matter and nutrients as a result of the absence of serious vegetative cover due to bush burning, overgrazing, over cultivation and protracted erosion and are heavily leached. The levels of organic carbon and total nitrogen and available phosphorus are generally very low. They have low organic carbon and total N contents because of low biomass production and a high rate of decomposition. The soil in Manga is Plinthic Lixisol. The soil of the experimental site in NR is well drained Voltaian sandstone, locally known as the Tingoli series and classified as ferric luvisol (FAO/UNESCO, 1977). Potassium is mostly abundant in the soils of Ghana. The soils at the experimental sites are typical upland soils used for maize production in the Guinea savanna zone of West Africa.
The experiments involving the three maturity groups of maize were conducted in a split-plot arrangement of treatments in a randomized complete block design with four replications. In NR and UWR, the experimental area was ploughed and harrowed with tractor-mounted disc before sowing. However, in the UER, the field was harrowed by a tractor in July and bullocks were used to ridge the field 2 days after harrowing. In all trials, 60 kg P2O5/ha as triple superphosphate (TSP) and 60 kg K2O as muriate of potash (MOP) were applied to each plot before sowing. For

each trial the main plot treatments were five maize varieties. Five nitrogen levels of 0, 40, 80, 120 and 620 kg/ha from urea were applied to the subplots in UER and UWR. Sulphate of Ammonia was the source of N in NR. Each 6-row subplot measured 5.0 x 4.5 m. The fertilizer N was applied in two equal doses to maximize N efficiency. Thus one half of N was applied at 10 days after planting (DAP) and one-half at 35 DAP, when the plants started to grow rapidly and N demand was high. All fertilizers were applied in a subsurface band about 0.05 m to the side of the maize row. Since farmers do not commonly use fertilizer for maize production in the area, the no N fertilizer treatment was the control representing the farmers’ practice.
Sowing date of all experiments in Wa was 13th July 2012. The experiments were planted on 19th
July in Tumu. Sowing was done between 4 -7th July 2012 in UER. In the extra-early (80-85 days) and early-maturity (90-95-days) groups, plots were sown in six rows of 5 m in length and 0.75 m apart. The medium maturing varieties (100-115 days) were sown in six rows of 5 m in length and 0.80 m apart. Distance between plants was 0.40 m in all experiments with two seedlings per stand. The maize varieties were chosen on the basis of their superior performance in on-station and on-farm testing trials. Three seeds were sown per stand but after emergence, the seedlings were hand thinned to two per stand to achieve intended plant densities. Weeds were controlled manually using a hand held hoe. Maize grain was harvested at physiological maturity and the grain weight was corrected to 150 g/kg water content (15%). In NR, harvesting of the cobs from each of the experiments was carried out in December when the crop was dry. The cobs were shelled and dried further to a water content of 12 % before it was weighed per plot and converted to per hectare basis in each case. Other measurements included days to mid-silk and tassel emergence (days), plant height (m), grain yield (kg/ha) and 100-kernel weight (g). Plant height was recorded for 5 randomly selected plants at maturity by measuring the height from the base of the plant to the where tassel branching begins. Anthesis-silking interval (ASI) was calculated as days to mid silk emergence minus days to mid-tassel. Grain and aboveground dry matter yields were determined by harvesting the centre two rows of each subplot. Biomass yield was based on samples dried to constant weight at 60O C. Kernel weight was determined for a sample of 100 oven-dried kernels. In UWR, leaf chlorophyll concentration of the second leaf from the top was assessed at 50% anthesis on 10 plants, using a portable Chlorophyll meter (SPAD-502 Minolta, Tokyo, Japan) and was expressed in arbitrary absorbance (or SPAD) values. All chlorophyll meter readings were taken midway between the stalk and the tip of the leaf. Since chlorophyll content in a leaf is closely correlated with leaf N concentration, the measurement of chlorophyll provides an indirect assessment of leaf N status.
Data collected were subjected to analysis of variance (ANOVA) to establish treatment and the interactions effect on grain yield and yield components. Statistical analyses were performed with the Statistical Program SAS for Windows 9.1® (SAS Institute Inc., Cary, NC, USA) in UWR and GENSTAT in NR. Variety and N levels were treated as fixed effects and replication were treated as random effects. Main effects and all interactions were considered significant when P≤0.05. Regression analyses were conducted to determine yield (dependent variable) response to N level (independent variable) for the genotypes and simple correlations were used to test association among traits. In UWR and UER, nitrogen use efficiency (NUE) was calculated as yield of the N treatment minus yield of the zero kg N/ha (control treatment) divided by the quantity of fertilizer N applied in kg/ha (Cassman et al., 1996).
Economic Analysis Economic analysis was carried out in only UER. The objective of the economic analysis was to assess the economic feasibility of the different rates of fertilizer N on the maize varieties. Partial budgets are constructed to calculate the marginal rate of returns (MRR), eliminate dominated treatments and calculate benefit cost ratios which would help to advice on the recommendations to make.
Marginal Analysis It is the process of calculating MRR between treatments, proceeding in steps from a lower cost treatment to that of next higher cost, and comparing those rates of return to the minimum acceptable rate of return (MARR) of farmers (which, in this case is 150%). This analysis was to help make recommendations to farmers and also help scientist to select treatments for further experimentation. Farmers would be willing to change from one treatment to another if the MRR of that change is greater than the minimum acceptable rate of return. In this case, the minimum acceptable rate of return (MARR) is l50%. This means that farmers will be willing to adopt any of the technologies if their MRR is greater 150%. As long as the MRR between two treatments exceeds 150%, the change from one treatment to the next should be attractive to farmers. If the MRR falls below 150%, on the other hand, the change from one treatment to another will not be accepted.
Calculating the MRR, which is the marginal net benefit (i.e., the change in net benefits) divided by the marginal cost (i.e., the change in total variable costs), expressed as a percentage.
MRR=∆ NB∆ VC
∗100 %
When MRR = 1.70 = 170%. For each 1 GH₵/ ha on average invested on the farm, the farmer will recover his 1 GH₵, plus an extra 0.70 GH₵/ ha in net benefits.
Dominance Analysis was carried out by first listing the treatments in order of increasing costs that vary. Any treatment that has net benefits that are less than or equal to those of a treatment with lower costs that vary is dominated. All treatments dominating were eliminated.
Upper West Region (S.S. Buah)
Results and discussion
Extra-early maturing maize in UWRIn both Wa and Tumu where the study was conducted, the interaction of variety x N level interactions were not statistically significant for any trait, therefore main effects of variety and N levels are reported and discussed in this report (Tables 1 and 2). At both locations, averaging over N levels, varietal differences were observed for days to anthesis and grain yield. In Wa, the earliest variety to flower was 99 TZEE YSTR which also produced the lowest grain yield of 2772 kg/ha (Table 1.1). On the other hand, TZEE W POP STR QPM C0 was the latest to flower. The highest grain yield of 3671 kg/ha was obtained from 2004 TZEE W POP STR C4. The released variety Abontem had similar yields as two other varieties (2000 Syn EE W STR and

TZEE W POP STR QPM C0) in Wa. These two varieties (2000 Syn EE W STR and TZEE W POP STR QPM C0) also had high but similar yields at Tumu (Table 1.2).
Averaged across varieties, fertilized plants flowered earlier. Additionally, plant height was higher with fertilizer treatment but was significantly reduced under no fertilizer condition at both sites. At both sites, the 160 kg N/ha treatment gave the highest plant height and the lowest plant height was obtained from no fertilizer treatment. Moreover, N deprivation increased the anthesis-silking interval (ASI) by 2 days in Wa and delayed silking at both sites. In general, chlorophyll concentration (SPAD values) as well as grain yield and its components increased with N level with significant linear and quadratic responses in Wa (Table 1). At flowering, increasing N levels significantly increased chlorophyll concentration and 160 kg N/ha had the highest value (48.8). The lowest SPAD value was obtained at zero N treatment (33.8). Chlorophyll concentration reduction and leaf yellowing are good indicators of N remobilization. Generally, N deficiency accelerates senescence as revealed in the present study by the decrease in chlorophyll concentration under no fertilizer N treatment as compared with nonstressed conditions. Leaf N decrease in turn is expected to have a direct effect on canopy photosynthesis, resulting in greater kernel abortion (Pearson and Jacob, 1987) and lower grain number (Uhart and Andrade, 1995). Fertilized plants produce heavier and more kernels and therefore had higher grain production in Wa (Table1). Grain yield increased with N level with significant linear and quadratic responses in Wa (Y=1244+34.89N-0.10N2; R2=0.67) and Tumu (Y=432.17+22.21N-0.08N2; R2=0.56) Across varieties, mean increase grain yields as a result of 40 kg N/ha applied over the control treatment was 153% in Wa. Doubling N application level to 80 kg/ha resulted in grain yield increase over control by 199%. Increasing N application level to 120 and 160 kg/ha resulted in yield increase over control by 248 and 301%. Similarly in Tumu, mean increase grain yields as a result of 40 kg N/ha applied over the control treatment was 168%. Doubling N application level to 80 kg/ha resulted in grain yield increase over control by 264%. Increasing N application level to 120 and 160 kg/ha resulted in yield increase over control by 301 and 343%. In Wa, grain yield was more a function of number of kernels per square meter (r = 0.87) than kernel weight (r = 0.59). Grain yield also was correlated with chlorophyll concentration (r = 0.73) suggesting that maintaining N and chlorophyll concentration of leaves during grain filling may lead to maintenance of leaf photosynthesis resulting in better grain filling. The ASI was significantly negatively correlated with grain yield (r = -0.54) at both sites.
Table 1.1. Some agronomic traits of extra-early maize as affected by N levels in Wa, 2012Variety DFA DFS ASI Plant
heightSPAD 100-
seed weight
Kernel number
Grain yield
NUE
day day day M no g no kg/ha Kg/kgN99 TZEE Y STR 48 49 2 1.55 46.7 19.6 142 2772 25.9TZEE W POP STR QPM C0
57 59 2 1.98 42.0 23.0 130 3098 28.7
2000 Syn EE W STR 52 55 2 1.69 42.6 22.0 139 3096 29.22004 TZEE W POP STR C4
54 56 2 1.97 42.7 24.6 148 3671 34.4
Abontem 55 57 2 1.91 44.4 21.6 131 2864 23.7Lsd (0.05) ‡ 1 1 NS 0.13 NS NS NS 507 7.7

N level (kg/ha)0 54 57 4 1.61 33.8 18.3 60 110640 54 56 2 1.76 42.1 21.7 131 2796 42.380 53 55 2 1.82 45.6 23.4 143 3312 27.6120 53 55 2 1.90 48.1 23.9 164 3851 22.9160 52 54 2 2.01 48.8 23.5 194 4438 20.8N linear ** ** ** ** ** ** ** ** **N quadratic NS NS * NS ** * * ** *CV% 2.4 2.6 2.4 9.9 13.5 17.4 20.7 22.1 32.4DFA=days to 50% anthesis; DFS=days to 50% silking; ASI=Anthesis-silking interval; NUE=N use efficiency.‡*, **, and NS = significant at 5 and 1% probability levels and not significant, respectively.
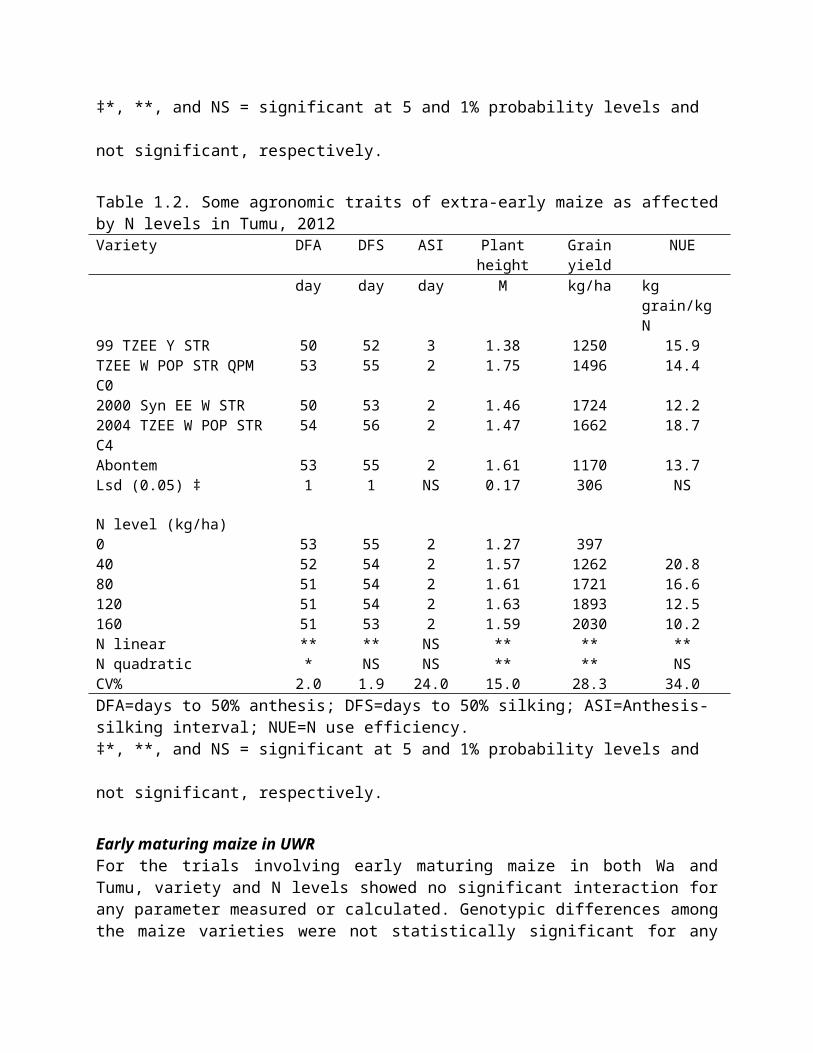
Table 1.2. Some agronomic traits of extra-early maize as affected by N levels in Tumu, 2012Variety DFA DFS ASI Plant
heightGrain yield NUE
day day day M kg/ha kg grain/kg N99 TZEE Y STR 50 52 3 1.38 1250 15.9TZEE W POP STR QPM C0 53 55 2 1.75 1496 14.42000 Syn EE W STR 50 53 2 1.46 1724 12.22004 TZEE W POP STR C4 54 56 2 1.47 1662 18.7Abontem 53 55 2 1.61 1170 13.7Lsd (0.05) ‡ 1 1 NS 0.17 306 NS
N level (kg/ha)0 53 55 2 1.27 39740 52 54 2 1.57 1262 20.880 51 54 2 1.61 1721 16.6120 51 54 2 1.63 1893 12.5160 51 53 2 1.59 2030 10.2N linear ** ** NS ** ** **N quadratic * NS NS ** ** NSCV% 2.0 1.9 24.0 15.0 28.3 34.0DFA=days to 50% anthesis; DFS=days to 50% silking; ASI=Anthesis-silking interval; NUE=N use efficiency.‡*, **, and NS = significant at 5 and 1% probability levels and not significant, respectively.
Early maturing maize in UWRFor the trials involving early maturing maize in both Wa and Tumu, variety and N levels showed no significant interaction for any parameter measured or calculated. Genotypic differences among the maize varieties were not statistically significant for any trait in Wa. Grain yield and yield components were not significantly affected by variety (Table 1.3). Generally, the two new varieties had similar yields as the two released varieties (Aburohemaa and Omankwa) at both sites. All the four improved varieties produced significantly more grain than the famers’ variety

in Tumu (Table 1.4). One of the new varieties (TZE W DT STR C4) was released by CSIR-SARI as CSIR-Wang-dataa in January 2013.
Averaged across maize varieties, increasing N levels had significant effect on all parameters measured or calculated in Wa (Table 1.3). Plant height was higher with fertilizer treatment but was significantly reduced under no fertilizer condition in both Wa and Tumu. Similar to results obtained from the trial involving extra-early maturing maize, N deprivation increased ASI and delayed silking at both sites. Fertilizer application generally, showed a better trend for higher grain yield and yield components than no fertilizer treatment. Lack of N probably enhanced kernel abortion and reduced final grain number. On average, number of kernels per square meter and grain yield increased with N level with significant linear and quadratic responses in Wa (Y=831.90+27.51N-0.06N2; R2=0.79) and Tumu (Y=1098.56+24.31N-0.09N2; R2=0.67). Overall, increase in N levels beyond 80 kg/ha did not result in significant increases in grain yield. Application of the first 40 kg N/ha resulted in the highest mean grain yield increase when compared to the yield increases obtained from the application of 80 120 and 160 kg N/ha. Across varieties, mean increase grain yields as a result of 40 kg N/ha applied over the control treatment was 198% in Wa. Doubling N application level to 80 kg/ha resulted in grain yield increase over control by 269%. Increasing N application level to 120 and 160 kg/ha resulted in yield increase over control by 341 and 442%. Similar large increases were obtained in Tumu. Grain yield was more strongly associated with kernel number (r = 0.89) than with kernel weight (r = 0.67). Grain yield also was positively correlated with chlorophyll concentration (r = 0.62). The ASI was significantly negatively correlated with grain yield (r = -0.53). At both sites, grain yield was negatively correlated (r = -0.44 and -0.60) with days to 50% anthesis. This inverse relationship between days to anthesis and grain yield might be due to the fact that the improved varieties which produced higher grain yield matured earlier than the farmer’s variety which was used as a check.
Table 1.3. Some agronomic traits of early maize as affected by N levels in Wa, 2012Variety DFA DFS ASI Plant
heightSPAD 100-
seed weight
Kernel number
Grain yield
NUE
Day day Day M no g no kg/ha kg/kg NTZE W DT STR C4 57 60 2 1.54 40.4 20.2 120 2487 21.5TZEComp3 DT C2F2 60 62 2 1.52 43.2 19.2 121 2307 22.6Aburohemaa 58 61 2 1.57 42.7 20.3 124 2587 25.7Omankwa 59 61 2 1.69 41.4 19.5 127 2572 28.8Farmer variety 60 63 2 1.66 40.4 19.0 120 2353 23.1Lsd (0.05) ‡ NS‡ 2 NS NS NS NS NS NS NS
N level (kg/ha)0 60 64 4 1.32 39.9 15.9 45 71240 59 62 2 1.53 40.2 18.3 116 2096 34.680 59 62 2 1.55 40.2 19.3 137 2593 23.5120 58 60 2 1.78 43.6 20.9 152 3095 19.9160 56 60 2 1.80 44.4 23.7 162 3810 19.4N linear ** ** ** ** * ** ** ** **

N quadratic NS NS * NS NS NS ** * *CV% 3.3 3.6 49.1 12.5 20.4 17.3 19.1 21.4 20.5DFA=days to 50% anthesis; DFS=days to 50% silking; ASI=Anthesis-silking interval; NUE=N use efficiency.‡*, **, and NS = significant at 5 and 1% probability levels and not significant, respectively.
Table 1.4. Some agronomic traits of early maize as affected by N levels in Tumu, 2012
Variety DFA DFS ASI Plant height
Grain yield NUE
day Day day m kg/ha kg grain/kg N
TZE W DT STR C4 54 56 2 1.38 2300 19.1TZEComp3 DT C2F2 54 56 2 1.53 2196 16.7Aburohemaa 52 55 2 1.52 2222 15.8Omankwa 52 54 2 1.54 2296 21.3Farmer variety 55 58 2 1.87 1716 11.2Lsd (0.05) ‡ 1 1 NS 0.16 209 3.8
N level (kg/ha)0 54 57 2 1.52 101740 53 56 2 1.50 2089 26.880 54 56 2 1.56 2441 17.8120 53 55 2 1.63 2510 12.4160 53 55 2 1.63 2676 10.4N linear ** ** * * ** **N quadratic NS NS NS NS ** **CV% 1.7 2.0 22.4 15.0 13.2 26.7DFA=days to 50% anthesis; DFS=days to 50% silking; ASI=Anthesis-silking interval; NUE=N use efficiency‡*, **, and NS = significant at 5 and 1% probability levels and not significant, respectively.
Medium maturing maize in UWRFor the trial involving medium maturing maize varieties in Wa, all varieties on average, responded similarly to increased N application as evidenced by the lack of significant variety x N level interactions for any trait. Moreover, significant differences were detected among the varieties for days to anthesis and plant height (Table 1.5). The farmer’s variety flowered earliest while DT SYN 1-W was the latest to flower. The released variety, Obatanpa was the tallest while IWD C3SYN F2 was the shortest. Grain yield and yield components were not significantly significant among the maize varieties. It is worthy of note that two new varieties DT SYN-1-W and IWD C3 Syn F2 which had comparable yields as the released variety, Obatanpa were recommended to the National Variety Release Community which subsequently released them as CSIR-Sanzal-sima and CSIR-Ewul-boyu, respectively in January 2013.
Consistent with the results obtained for the extra-early and early maturing varieties, variation in N supply affected both growth and development of the medium maturing maize plants.

Consistently, N deprivation reduced crop growth and development. Averaged across maize varieties, number of kernels per square meter and grain yield increased with N level with significant linear and quadratic responses ((Y=818.61+36.76N-0.11N2; R2=0.78). Fertilizer application generally, showed a better trend for higher grain yield and yield components than no fertilizer treatment. Plant height was higher with fertilizer treatment but was significantly reduced under no fertilizer condition. Large yield reductions were noted under no fertilizer treatment. Chlorophyll concentration was significantly affected by N level with significant linear response. On average, increase in N levels beyond 120 kg/ha did not result in significant increases in grain yield. Application of the first 40 kg N/ha resulted in the highest mean grain yield increase when compared to the yield increases obtained from the application of 80 120 and 160 kg N/ha. Across varieties, mean increase grain yields as a result of 40 kg N/ha applied over the control treatment was 193%. Doubling N application level to 80 kg/ha resulted in grain yield increase over control by 264%. Increasing N application level to 120 kg/ha resulted in yield increase over control by 378%. Grain yield was more positively correlated with number of kernels per square meter (r = 0.85) than kernel weight (r = 0.57). Grain yield also was correlated with chlorophyll concentration (r = 0.64). A significant negative relationship was observed between ASI and grain yield (r = -0.66) confirming data from Edmeades et al. (1993). This negative relationship may due to the fact that no N treatment had the highest ASI but lowest grain yield.
Table1.5. Some agronomic traits of medium maize as affected by N levels in Wa, 2012Variety DFA DFS ASI Plant
heightSPAD 100-seed
weightKernel number
Grain yield
NUE
day day day M no g no kg/ha kg/kgNDT ST W COF2 63 65 3 1.63 42.3 21.1 129 2851 30.0DT SYN 1-W 69 71 3 1.66 43.4 19.3 120 2491 24.9IWD C3SYN F2 66 69 3 1.47 43.9 17.1 132 2305 23.1Obatanpa 63 66 3 1.81 42.1 19.0 149 2936 29.5Farmer’s variety 62 65 3 1.73 41.4 19.9 131 2698 25.0Lsd (0.05) ‡ 1 2 NS 0.12 NS NS NS NS 2.9
N level0 66 71 5 1.37 33.2 13.7 56 77340 65 68 3 1.59 38.4 17.2 134 2267 37.380 64 67 2 1.74 44.0 19.3 148 2811 25.5120 64 66 2 1.80 49.3 22.4 165 3697 24.4160 83 65 2 1.81 48.3 23.7 158 3732 18.5N linear ** ** ** ** ** ** ** ** **N quadratic NS NS ** ** * NS ** ** **CV% 3.1 4.0 44.4 10.2 15.1 13.5 13.7 14.9 12.3
DFA=days to 50% anthesis; DFS=days to 50% silking; ASI=Anthesis-silking interval; ‡*, **, and NS = significant at 5 and 1% probability levels and not significant, respectively.
Nitrogen use efficiency in UWR

Nitrogen use efficiency (NUE) calculated as a ratio of grain yield to amount of N applied was significantly affected by extra-early and medium maturing varieties in Wa but differences were not detected among early maturing maize varieties (Tables 1.1, 1.3 and 1.5). However, in Tumu differences among early maturing varieties was significant with Omankwa having the highest NUE (Table 1.4). The variety 2004 TZEE W POP STR C4 which obtained the highest grain yield among the extra-early maturing varieties in Wa also had the highest NUE (Table 1.2). Also, Obatanpa which tended to have high yields in Wa also had the highest NUE among the medium maturing varieties (Table 1.5). It seems the maize varieties with greater NUE values at maturity required more N to achieve maximum grain yield but nonetheless were relatively more efficient in utilizing absorbed N in grain production. Overall, NUE values among the varieties were consistent with the amount of grain produced at maturity with more efficient varieties having greater values. This may be explained by the fact that these varieties have been bred to tolerate diverse abiotic stresses including drought and low N. Greater N efficiency normally should allow a reduction of nutrient to be applied to efficient plants without reducing the crop yield. This implies a larger proportion of fertilizer N recovery in the plants and consequently lower amounts of nutrients loss due to surface runoff or ground water drainage loss. In general, NUE decreased as a result of increased N supply, regardless of variety. Increased N supply is generally known to reduce NUE in maize (Moll et al., 1982) and sorghum (Buah et al., 1998; Zweifel et al., 1982). For each maturity group and at each location, maize had highest NUE at 40 kg N/ha. The use of 120 kg N/ha or 160 kg N/ha however, did not result in a corresponding increase in NUE at each location. On average, the 160 kg N/ha tended to have the lowest NUE values regardless of maturity group or location (Table 1.3). The drop in efficiency with addition of N fertilizer may be due to the relatively large increase in grain production associated with higher N levels.
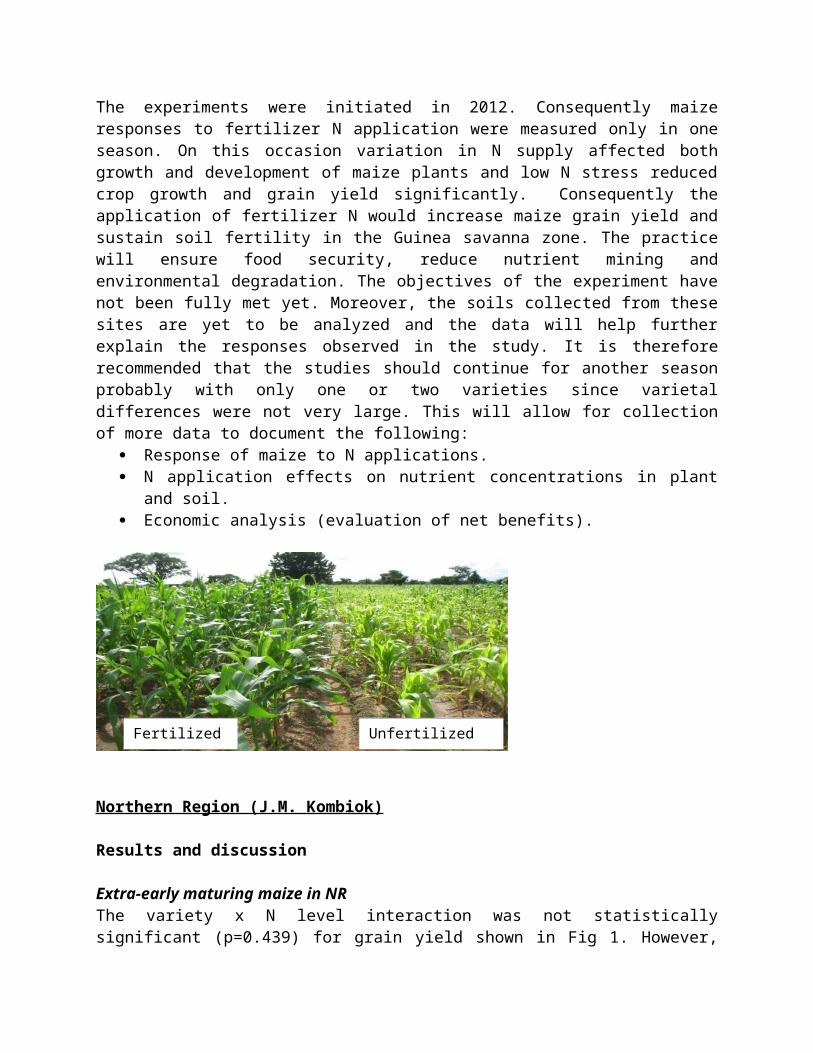
Conclusion and recommendationsThe experiments were initiated in 2012. Consequently maize responses to fertilizer N application were measured only in one season. On this occasion variation in N supply affected both growth and development of maize plants and low N stress reduced crop growth and grain yield significantly. Consequently the application of fertilizer N would increase maize grain yield and sustain soil fertility in the Guinea savanna zone. The practice will ensure food security, reduce nutrient mining and environmental degradation. The objectives of the experiment have not been fully met yet. Moreover, the soils collected from these sites are yet to be analyzed and the data will help further explain the responses observed in the study. It is therefore recommended that the studies should continue for another season probably with only one or two varieties since varietal differences were not very large. This will allow for collection of more data to document the following:
Response of maize to N applications. N application effects on nutrient concentrations in plant and soil. Economic analysis (evaluation of net benefits).

Northern Region (J.M. Kombiok)
Results and discussion
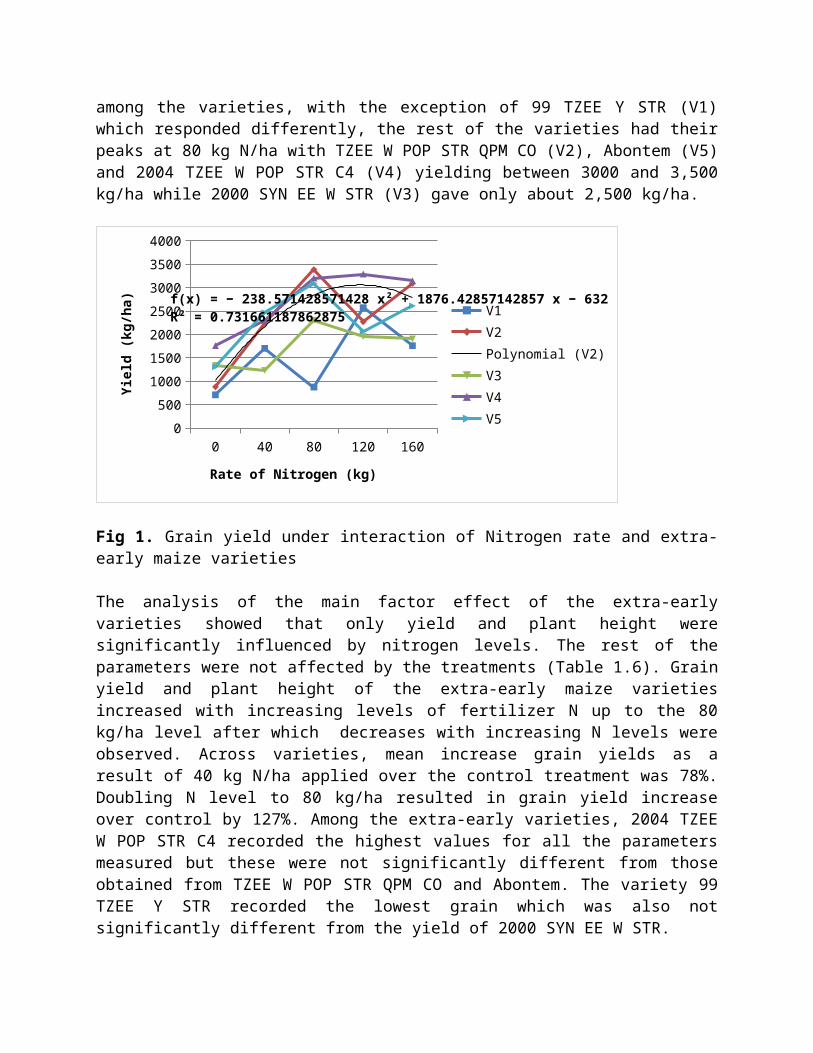
Extra-early maturing maize in NRThe variety x N level interaction was not statistically significant (p=0.439) for grain yield shown in Fig 1. However, among the varieties, with the exception of 99 TZEE Y STR (V1) which responded differently, the rest of the varieties had their peaks at 80 kg N/ha with TZEE W POP STR QPM CO (V2), Abontem (V5) and 2004 TZEE W POP STR C4 (V4) yielding between 3000 and 3,500 kg/ha while 2000 SYN EE W STR (V3) gave only about 2,500 kg/ha.
0 40 80 120 1600
500
1000
1500
2000
2500
3000
3500
4000
f(x) = − 238.571428571429 x² + 1876.42857142857 x − 632R² = 0.731661187862875 V1
V2Polynomial (V2)V3V4V5
Rate of Nitrogen (kg)
Yie
ld (
kg/
ha)
Fig 1. Grain yield under interaction of Nitrogen rate and extra-early maize varieties
The analysis of the main factor effect of the extra-early varieties showed that only yield and plant height were significantly influenced by nitrogen levels. The rest of the parameters were not affected by the treatments (Table 1.6). Grain yield and plant height of the extra-early maize varieties increased with increasing levels of fertilizer N up to the 80 kg/ha level after which
Fertilized maize Unfertilized maize
decreases with increasing N levels were observed. Across varieties, mean increase grain yields as a result of 40 kg N/ha applied over the control treatment was 78%. Doubling N level to 80 kg/ha resulted in grain yield increase over control by 127%. Among the extra-early varieties, 2004 TZEE W POP STR C4 recorded the highest values for all the parameters measured but these were not significantly different from those obtained from TZEE W POP STR QPM CO and Abontem. The variety 99 TZEE Y STR recorded the lowest grain which was also not significantly different from the yield of 2000 SYN EE W STR.
Table 1.6 Response of Extra Early Maize varieties to Nitrogen levels in Northern GhanaVariety Grain
yieldBiomass yield
Plant height
Days to 50% tassel
No. of root lodged/plot
No. of root lodged/plot
kg/ha kg/ha cm days no no
99 TZEE Y STR 1678 1760 129 43 6 5TZEE W POP STR QPM C0 2373 3967 147 43 6 52000 Syn EE W STR 1897 2633 131 47 6 42004 TZEE W POP STR C4 2740 3400 129 48 6 5Abontem 2308 3600 135 43 6 5Lsd (0.05) ‡ 483 793 15 1 NS NS
N level (kg/ha)0 1199 2600 119 44 6 440 2139 2986 134 45 6 580 2727 3333 144 45 5 5120 2432 3307 134 45 6 5160 2502 3133 140 45 6 4Lsd (0.05) 483 NS 15 NS NS NSCV% 40.4 40.4 12.8 6.1 21.7 20.5‡ NS = Not significant at 5% probability level.
Early maturing maize in NRThe analysis of grain yield of early maize variety showed that variety x N level interaction was not significant (Fig 2). Furthermore, mean grain yield of most of the early maize varieties peaked up at the 80 kg N/ha level corresponding to a range of grain yields between 3000 and 3,500 kg/ha.

0 40 80 120 1600
500
1000
1500
2000
2500
3000
3500
4000
4500
f(x) = 1340.83746630976 ln(x) + 1581.55034032584R² = 0.934214407604138
V1Logarithmic (V1)V2V3V4V5
Rate of Nitrogen (kg)
Yie
ld (
kg/
ha)
Fig 2. Grain yield under interaction of nitrogen rate and early maize varieties
The results of the early maize varieties showed a similar trend as in the case of the extra-early varieties (Table 1.7). As in extra-early maize, only the grain yield and plant height of the early maize varieties were significantly affected by nitrogen levels. The lowest grain yield and shortest plants were obtained at no N treatment. Across varieties, mean increase grain yields as a result of 40 kg N/ha applied over the control treatment was 49%. Doubling N level to 80 kg/ha resulted in grain yield increase over control by 93%. Mean grain yield and plant height were highest at 80 kg N/ha but this was not significantly different from those obtained at 120 and 160 kg N/ha levels. Differences among the early maize varieties for all parameters were not statistically significant regardless of N level (Table 1.7). Nonetheless, the farmer variety Obatanpa which was recycled over several seasons by the farmer tended to have higher values for all the parameters. This is not surprising as the farmer variety was not an early variety but rather a medium maturing variety and is therefore expected to have a higher yield potential.
Table1.7. Response of early maize varieties to Nitrogen levels in Northern GhanaVariety Grain
yieldBiomass yield
Plant height
Days to 50% tassel
No. of root lodged/plot
No. of root lodged/plot
kg/ha kg/ha cm days no no
TZE W DT STR C4 2365 3100 163 48 1 1TZEComp3 DT C2F2 2469 2447 157 41 2 1Aburohemaa 2379 2900 159 41 2 1Omankwa 2491 2833 161 47 1 1Farmer variety 2634 3340 163 48 1 1Lsd (0.05) ‡ NS NS NS NS NS NS
N level (kg/ha)0 1563 2467 157 47 1 140 2331 3033 165 47 2 180 3014 3073 164 48 1 1

120 2955 3033 163 48 2 1160 2976 3073 164 48 1 1Lsd (0.05) 486 NS 13 NS NS NSCV% 37.3 27.1 12.8 6.0 71.7 82.6‡ NS = Not significant at 5% probability level.
Medium maturing maize in NRThe interaction of variety with N level for grain yield was not significant (Fig 3). All the varieties except DT SYN I W peaked up at 80 kg N/ha giving a range of yields between 4,200 to 5,200 kg/ha. DT SYN I W increased with increasing rates of N sharply up to 120 kg N/ha but grain yield was similar to the other varieties which had the highest peak at 80 kg N/ha.
0 40 80 120 1600
1000
2000
3000
4000
5000
6000
f(x) = 1012.87095371058 ln(x) + 3138.77773452137R² = 0.791594789455133 V1
V2Logarithmic (V2)V3V4V5
Rate of Nitrogen (kg)
Yie
ld (
kg/
ha)
Fig 3. Grain yield under interaction of nitrogen rate and early maize Varieties
Grain yield, biomass and plant height of the medium maize varieties were the only parameters that were significantly influenced by the application of N (Table 1.8). Grain and biomass yields as well as plant height increased with increasing levels of N up to 80 kg N/ha beyond which there was no significant increase. Mean grain yield and plant height were highest at 80 kg N/ha but this was not significantly different from those obtained at 120 and 160 kg N/ha levels. Thus the values of these parameters at the 80 kg N/ha rate were not significantly different from those obtained at 120 and 80 kg N/ha. Across varieties, mean increase grain yields as a result of 40 kg N/ha applied over the control treatment was 30%. Doubling N level to 80 kg/ha resulted in grain yield increase over control by 94%. The other parameters were not significantly affected by N application. The farmer variety was significantly taller and had higher grain yield than IWD C3SYN F2. The other varieties had similar grain and biomass production (Table 1.8).
Table 1.8. Response of Medium Maize varieties to Nitrogen levels in Northern GhanaVariety Grain
yieldBiomass yield
Plant height
Days to 50% tassel
No. of root lodged/plot
No. of root lodged/plot
kg/ha kg/ha cm days no no
DT ST W COF2 3779 4673 160 57 2 2DT SYN 1-W 4109 5353 153 57 2 2

IWD C3SYN F2 3388 4329 142 57 2 1Obatanpa 4191 4806 166 57 2 2Farmer’s variety 4285 5723 171 56 2 2Lsd (0.05) ‡ 813 960 10 NS NS NS
N level (kg/ha)0 2437 3618 142 56 2 240 3175 4300 162 57 2 280 4746 5452 164 57 2 2120 4783 5693 162 57 2 2160 4611 5820 161 56 2 2Lsd (0.05) 813 960 10 NS NS NSCV% 39.5 35.5 12.6 3.0 50.0 57.2‡ NS = Not significant at 5% probability level.
Preliminary conclusionsGenerally, from all the three experiments, the grain yields and other parameters increased with increasing levels of N up to 80 kg N/ha beyond which there were no further significant increases.
For the extra early maize varieties, 2004 TZEE W POP STR C4, TZEE W POP STR QPM CO and Abontem gave highest grain yields as affected by N levels although differences among them were not statistically significant. In the early and medium trials, the yield of the farmer variety was as good as the newly released early and medium maturing varieties tested since there were no significant differences in yield among them. All the improved varieties tested in the medium category were similar in performance. In each of the experiments, there was no interaction effect of varieties and N levels on the yield and other parameters tested. However, these experiments need to be repeated for a meaningful conclusion to be drawn.
Upper East (R.A.L. Kanton)
The mean physical and chemical properties of the surface soil taken from 0-15 cm in Manga before sowing are presented in Table 1.9. The soils of the experimental site are mainly sandy, and also very acidic, but potassium levels are moderate. However, all the other plant growth requirements are below average for increased maize production (Table 1.9). The application of external sources of fertiliser either organic or inorganic or both is therefore essential for increased and stable maize grain production.
Table 1.9. Some Physical and Chemical Properties of the Surface (0-15 cm) Soil at the Experimental Site at the Manga Agricultural Research Station, 2012. Soil property Extra-early maize
trialEarly maize
trialMedium maize
trialSand (%) 84.56 84.56 84.56Silt (%) 12 10 12Clay (%) 3.44 5.44 3.44

Soil texture Loamy sand Loamy sand Loamy sandSoil pH 4.05 4.17 4.26Organic carbon (%) 0.35 0.27 0.35Total nitrogen (%) 0.05 0.04 0.06Available P (mg kg-1) 11.13 7.20 7.77Exchangeable cations cmol (+)/kgCa 0.70 0.70 0.80Mg 0.30 0.40 0.30K 20.50 32.40 33.20CEC [ cmol (+) kg-1] 2.93 3.66 2.93
Extra-early maturing maize in UER
Results - The number of days taken by maize to tassel decreased with increase in rate of nitrogen fertiliser applied (Table 1.10). Maize plants that were fertilized with more than 40 kg N/ha produced tassel earlier than the non-fertilized plants. Days to mid-silk emergence followed a similar trend, with plants receiving higher N rates producing silk earlier than their non-fertilized counterpart. Maize stem girth increased with increasing N levels. The highest stem girth was recorded when 120 kg N/ha was applied, which was significantly higher than that obtained by the non-fertilized treatment. Ears per plant followed a similar trend with 120 kg N /ha recording numerically, the highest ears per plant followed closely by 80 kg N/ha whilst the non-fertilized treatment recorded the lowest (Table 1.10). Number of ears harvested at harvest was significantly influenced by N application. Generally, number of ears harvested at physiological maturity increased with increase in fertilizer application. Nitrogen rates at 80 and 120 kg/ha produced numerically, the highest number of ears at harvest, which was significantly higher than the non-fertilized treatment.
Table 1.10. Effect of rates of nitrogen fertilizer on yield and its components of extra early maturity maize at Manga, 2012.Fertilizer rate
(kg N/ha)Days to tassel Days to silk Maize stem
girthEars/plant No. of ears
harvested
days days cm no no
0 50.5 60.1 10.07 0.35 14.8
40 49.4 53.8 11.30 0.69 28.7
80 48.7 52.5 11.43 0.81 33.9
120 48.7 52.8 12.59 0.85 33.4
160 48.9 53.3 11.62 0.70 28.2
Mean 49.2 54.5 11.40 0.68 27.8
s.e.d. 0.975 1.06 0.655 0.064 2.65
LSD (0.05) 1.94 2.12 1.305 0.129 5.27

CV (%) 6.30 6.20 18.1 29.90 30.1
Maize 1000-kernel weight increased with increase in the application of fertilizer N, with 120 kg N/ha recording the heaviest kernels whilst the non-fertilized treatment recorded the lowest (Table 1.11). Similarly, all the other N treatments recorded significantly heavier kernels than the non-fertilized treatment. Harvest index (HI), which is an indicator of the conversion efficiency of assimilates from vegetative to generative organs increased with increase in N application with 120 kg N/ha recording the highest harvest index followed closely by 80 kg N/ha with the non-fertilized treatment having the lowest value of 0.14. The highest straw yield was obtained when 40 kg N/ha was applied and the lowest when no fertilizer was applied. Mean straw yield produced when 40 or 120 kg N/ha was applied was significantly higher than that obtained when no fertilizer was applied or when 160 kg N/ha was applied. Generally, grain yield and its components increased with an increase in the level of nitrogen applied. Mean grain yield increased with a commensurate increase in N rate. Generally maize grain yield increased with increase in rate of N applied up to 80 kg/ha. The highest grain yield was recorded when 120 kg N/ha was applied followed by 80 kg N/ha but differences between these two rates were not statistically significant. The lowest grain yield of 351 kg/ha was obtained when no fertilizer was applied. Mean grain yield obtained with the application of 40 kg N/ha was higher than the experimental mean. Compared with the no fertilizer treatment, the application of 40, 80 and 120 kg N/ha increased grain yield by 233, 342 and 435%, respectively.
Nitrogen use efficiency (NUE) was significantly influenced by the rate of fertilizer N applied (Table 1.11). Maximum NUE was obtained at 40 kg N/ha followed by 80 kg N/ha and the least at 160 kg N/ha. Generally the highest rates of nitrogen recorded the lowest NUE. The NUE at 40 kg N/ha was significantly greater than those obtained for all the other treatments. The highest N rate recorded significantly the lowest NUE. Rainfall use efficiency (RUE) varied considerably for maize as a result of treatment effect. Generally, rainfall use efficiency increased with increase in N rate applied except for the highest rate of N. The highest RUE was obtained at 120 kg N/ha followed closely by 80 kg N/ha, whilst the lowest was recorded when no fertilizer was applied. The RUE at 120 kg N/ha was significantly greater than those recorded for the rest of the treatments.
Table 1.11. Effect of rates of nitrogen fertiliser on yield and its components of extra early maturity maize at Manga, 2012.
Fertilizer rate (kg N/ha)
1000-grain
weight (g)
Harvest index
Grain yield (kg/ha)
Straw yield
(kg/ha)
Nitrogen use efficiency
(kg/kg)
Rainfall use efficiency
(kg/ha/mm)
0 169 0.14 351 1417 18.2 0.43
40 186 0.35 1170 2160 29.3 1.44
80 193 0.44 1552 1977 19.4 1.91
120 212 0.48 1877 2103 15.6 2.31

160 190 0.42 1384 1697 8.7 1.70
Mean 190 0.37 1267 1871 18.2 1.56
s.e.d. 7.67 0.037 195.40 222.2 2.64 0.240
CV (%) 12.80 31.9 48.8 39.60 45.0 48.8
In Table 1.12, the treatment 120 kg N/ha is dominated by treatment 160 kg N/ha, suggesting that treatment 160 kg N/ha should be eliminated from further analysis and experimentation. However, the treatments 40, 80 and 160 kg N/ha all have a MRR greater than the minimum acceptable rate of return of 150%. This means that the treatments 40, 80 and 160 kg N/ha are recommended for uptake by farmers or for further research work. The results also showed that for every one Ghana cedis invested on one hectare of land using treatments 40, 80 and 120 kg N/ha, the return on investment will be 8.6, 3.5 and 2.8 Ghana cedis, respectively.
Table 1.12. A partial budget evaluating the effect of different rates of nitrogen fertilizer on grain yield of extra early maturity maize varieties at Manga, 2012.N rate
(kg N/ha)
Total cost that vary
GH₵
Net benefit
GH₵
MRR
%0 0 210.6
40 51.2 650.8 860
80 102.4 828.8 350
120 153.6 972.6 280
160 204.8 625.6 D
Discussion- The earlier attainment of tasseling and silking by maize plants that received higher rates of fertilizer N could be attributed to the better supply of plant nutrients under these treatments compared to the non-fertilized or lower N rate treatment. Generally, plants that receive better growth factors usually take fewer days to attain both growth and development stages compared to those that received less of these growth factors. Similarly the bigger maize plants reported for the higher N rates treatments could also be due to superior growth conditions afforded by the higher fertilizer N rates, leading to better capture of plant growth resources such as water due to better root development and taller plants resulting in better capture of radiation as reflected in the overall plant performance under the higher N treatments.
The relatively higher harvest indices at higher N rates compared to the non-fertilized or lower N rate may be attributed to higher N uptake (Adamptey et al., 2010). Sinclaire (1998) reported that high harvest index was associated with high N levels in maize. Adamtey et al. (2010) reported low grain maize yields for soils that received no fertiliser and ascribed it to reduced plant growth
as a consequence of low nutrient (especially, N) supply and uptake. This observation has been confirmed by the results of the current study in, which the non-fertilized maize recorded abysmal grain yields. Moreover, inorganic fertiliser increased grain yield of maize by 35 to 115% and that of sorghum by 59 to 100% (Nyakatawa et al., 1996). Similarly, Ngambeki et al. (1991) reported that grain yield increases of up to 183% in maize due to application of inorganic and organic fertilizers. The higher maize grain yields reported with higher levels of N are supported by the findings of Gentry et al. (2001) who reported a significant positive relationship between grain yield and soil inorganic N. The low NUE associated with the highest N rates could be ascribed to leaching as the soils of the area are sandy loamy soils, which are characterised by low nutrient holding capacity and any excess N could be leached beyond the rooting zone of crop plants. Rainfall use efficiency reported here are lower than those reported by Neil (2009) for maize. Results of the economic analysis have corroborated those of the agronomic analysis, indicating that beyond the 120 kg N ha-1 rate the excess nitrogen might be leached beyond the rooting zone of maize thereby rendering it unavailable for maize use.
Early maturing maize in UER
Results - Days taken by maize to tassel was significantly influenced by quantity of fertilizer N applied. Generally, fertiliser application reduced the days taken by maize to tassel. The earliest maize plants to tassel were those that received 80 kg and 120 kg N/ha whilst those that were not fertilized were the latest to tassel (Table 1.13). Days taken by maize to produce silk followed a similar trend, with plants receiving 80 kg N/ha producing silk earliest whilst the non-fertilized treatment took a longest time to produce silk. All the fertilized treatments produced silk significantly earlier than their non-fertilized counterparts. Maize plants were also score for some phenotypic traits such as plant and ear aspects, on a scale of 1 to 5, with 1 representing excellent and 5 poor for both traits. Maize that was fertilized produced both healthier plants and bigger cobs than their non-fertilized counterparts (Table1.13). The number of ears at harvest was significantly influenced by fertilizer N application. Numerically, more ears was recorded at 80 kg N/ha followed closely by 160 kg N/ha, while the lowest number of ears were recorded at no fertilizer treatment. Maize ears per plant were significantly influenced by rate of nitrogen. The highest number of ears per plant was recorded at 80 and 160 kg N/ha while the lowest was recorded at the unfertilized treatment.
Table 1.13. Effect of rates of nitrogen fertiliser application on grain yield and its components at Manga, 2012.Rate of N
(kg N/ha)
Days to tassel
Days to silk Plant aspect
Ear aspect No. of ears harvested
Ears/plant
O 54.9 62.6 4.7 4.9 19 0.8
40 52.2 56.9 3.8 4.0 32 1.4
80 51.7 55.8 3.5 3.3 37 1.6
120 51.9 56.3 3.2 3.4 33 1.5
160 52.1 56.1 3.1 3.2 36 1.6
Mean 52.6 57.5 3.7 3.8 31.40 1.39
s.e.d. 0.49 0.56 0.194 0.18 2.37 0.104
C.V. (%) 2.9 3.1 17.0 15.1 23.90 23.7
Kernel weight (1000-kernel weight) of maize was significantly affected by added fertilizer N, with 160 kg N/ha recording the highest kernel weight followed closely by the 120 kg N/ha rate (Table 1.14). Generally, kernel weight and harvest index increased with rate of N applied. All the fertilized treatments significantly produced heavier kernels that the unfertilized treatment. Harvest index was similarly affected significantly by rate of N applied. The highest harvest indices were recorded for the highest rates of N, with the lowest being recorded for the unfertilized treatment. All the treatments that received fertiliser in excess of 40 kg N/ha significantly had higher harvest indices. The highest straw yield was recorded with the application of 80 kg N/ha followed by the 160 kg and 120 kg N/ha rates although differences amongst them were not significant. Fertilizer N rates above 40 kg N/ha significantly produced more biomass than the unfertilized treatment. Mean grain yield of maize increased appreciably with increase in N rate applied. Grain yield was significantly influenced by N rate, with the 120 kg N/ha recording the highest grain yield followed closely by the 80 kg N/ha while the unfertilized treatment recorded the lowest grain yield of 569 kg/ha. However, grain yield difference between the 80 and 120 kg N/ha rates was not statistically significant. Compared with the no fertilizer treatment, the application of 40, 80 and 120 kg N/ha increased grain yield by 209, 401 and 389%, respectively.
The highest nitrogen use efficiency (NUE) was recorded when 40 kg N ha-1 was applied followed by the 80 kg N ha-1, whilst the lowest was recorded at 160 kg N ha-1. Generally, nitrogen use efficiency decreased with an increase in N rate applied. Rainfall use efficiency (RUE) varied considerably among treatments with the highest N rate recording the highest RUE followed closely by 80 kg and 120 kg N/ha (Table 1.14). Fertilizer rates beyond 80 kg N/ha recorded significantly greater RUE values as compared to those obtained for the unfertilized and 40 kg N/ha. The 40 kg N/ha gave higher RUE than the unfertilized treatment. Generally RUE increased with increasing N rates (Table 1.14).
Table 1.14. Effect of rates of nitrogen fertiliser application on grain yield and its components at Manga, 2012.N rate
(kg N/ha)
1000-kernel weight (g)
Harvest index
Grain yield (kg/ha)
Straw yield (kg/ha)
Nitrogen use efficiency (kg/kg)
Rainfall use efficiency (kg/ha/mm)
O 174 0.17 569 2233 30.1 0.69
40 204 0.34 1759 3367 43.8 2.16
80 227 0.40 2848 4017 35.0 3.50

120 236 0.42 2782 3550 23.3 3.40
160 237 0.43 2949 3650 18.4 3.63
Mean 215.6 0.35 2181 3363 30.2 2.64
s.e.d. 6.43 0.022 205.8 270.9 3.05 0.253
C.V. (%) 9.4 19.4 29.8 25.50 31.9 29.8
Treatment 80 kg N/ha is dominated by treatments 120 and 160 kg N/ha, therefore those two treatments were eliminated from further analysis. However, the treatments 40 and 80 kg N/ha both have MRR values that were greater than 150% (Table 1.15). This means that the 40 and 80 kg N/ha treatments could be recommended for uptake by farmers or for further research work. The results also show that for every one Ghana cedis invested on one hectare of land using 40 or 80 kg N/ha, the return on investment will be 12.9 and 11.8 Ghana cedis, respectively.
Table 1.5. A partial budget evaluating the effect of different rates of nitrogen fertilizer on yield of early maturity maize varieties at Manga, 2012.
N level (kg N/ha)
Total cost that vary
GH₵
Net benefit
GH₵
MRR
%
0N 0 341.4
40N 51.2 1004.2 1290
80N 102.4 1606.4 1180
120N 153.6 1515.6 D
160N 204.8 1564.6 D
Discussion - Generally the time taken by maize to produce tassels and silk reduced with an increase in rate of N applied. This might be ascribed to the better nutrition under higher N rates thereby leading to better plant performance resulting in earlier attainment of development stages. The maize plants and their ears were also very attractive under the higher N rates compared to the unfertilized or lower N rates. The higher N rate treatments afforded better nutrients for maize uptake and subsequently resulted in healthier plants that gave well filled ears as compared to the unfertilized treatment which produced stunted plants, which could not produce sufficient assimilates to give good ears. This observation has been confirmed by the results of the current study in, which the non-fertilized maize recorded abysmal grain yields. The low NUE associated with the highest N rates could be ascribed to leaching as the soils of the area are sandy loamy soils, which are characterised by low nutrient holding capacity and any excess nitrogen could be leached beyond the rooting zone of crop plants. Rainfall use efficiency reported here are lower than those reported in the literature. The decline in NUE with increasing rate of fertilizer N is consistent with those generally reported in the literature. This condition could be ascribed to loss

of excess nitrogen applied through leaching and run-off resulting in nitrogen not being available for crop use. However, the better capture and use of rainwater could possibly be due to the better root establishment under the higher fertilized treatment with a resultant increase in root volume and index as reflected in the better exploitation of water resources in the soil leading to the superior maize yields reported. These results are consistent with those reported by Neil, (2009). The economic studies also confirm the above agronomic assertion that the highest N rates used in the current study might not be useful probably due to leaching or run-off effects on the excess fertiliser applied and also due the sandy nature of the soils resulting in poor nutrient and moisture retention for crop growth and development.
Medium maturing maize in UER
Results - There were significant differences among treatments with regard to days taken to tassel (Table 1.16). Increased application of nitrogen facilitated earlier tasseling and silking in maize. There was a reduction in number of days taken to tassel with increase in the rate of fertiliser N applied. Plants that received N in excess of 80 kg N/ha tasselled earlier than their counterparts that received less amounts A similar pattern was also observed with days taken to produce silk. Application of nitrogen significantly influenced the number of ears at harvest with 80 and 120 kg N/ha recording the highest ears whilst the 0 kg N/ha recorded the least. The number of ears harvested for treatments that received more than 80 kg N/ha was significantly higher than those that received lesser amounts of nitrogen fertiliser (Table 1.16). Number of ears per plant also followed a similar trend like ears at harvest, with treatments that received higher quantities of nitrogen producing numerically, higher number of ears per plant as compared to their counterparts that received less amounts of nitrogen. Maize plants that received 120 kg N/ha produced the highest number of ears per plant, which was significantly greater than those produced by maize plants that received no fertiliser or 40 kg N/ha. Also, 1000-kernel weight was significantly influenced by the N application in excess of 40 kg N/ha. The heaviest maize kernels were produced when fertilizer N was applied whilst the lightest kernels were obtained when no fertiliser was applied (Table 1.16).
Table 1.16. Effect of rates of nitrogen fertiliser application on the yield and its components of medium maturing maize at Manga, 2012.N rate (kg N/ha)
Days to tassel
Days to silk
No. of cobs harvested
No. of ears/plant
1000-kernel weight (g)
0 56.5 61.7 13.6 0.79 19140 55.1 59.7 20.2 1.14 23480 54.4 58.4 26.5 1.34 238120 54.5 58.3 26.8 1.40 236160 54.5 58.2 24.3 1.27 237Mean 55.0 59.3 22.28 1.19 227s.e.d. 0.374 0.402 2.01 0.854 10.62CV (%) 2.1 2.1 29.4 0.170 21.17
22.7 14.8
Harvest index of maize, which is an indication of conversion of dry matter from vegetative to generative organs of the plant was also influenced significantly by the application of nitrogen.

The highest harvest index was recorded for plants that received 120 kg N/ha and the least recorded for maize plants that received no fertiliser (Table 1.17). All the fertilized treatment produced significantly greater harvest indices compared to the no fertiliser treatment. Similarly grain yield was significantly affected by level of nitrogen fertiliser applied. In general, grain yield increased with increase in fertilizer N applied except when more than 120 kg N/ha was applied. The highest grain yield was obtained when 120 kg N/ha was applied whilst the lowest when no fertiliser was applied. All fertilized maize treatments significantly out-yielded the no fertilizer N treatment. Compared with the no fertilizer treatment, the application of 40, 80 and 120 kg N/ha increased grain yield by 119, 206 and 211%, respectively. Maize straw yield, which is an essential component of the farming system was highest with the application of 40 kg N/ha. The last straw yield was recorded at 120 kg N/ha. Nitrogen was most efficiently used when applied at the rate of 40 kg N/ha followed closely by the 80 kg N/ha rate. The least efficient rate was when N was applied at the highest rate of 160 kg N/ha. Generally nitrogen use efficiency declined with an increase in rate of N applied (Table 1.17). However, rainfall use efficiency (RUE) followed a contrasting trend with the 80 kg N/ha recording the highest RUE followed closely by the 160 kg N/ha treatment. Generally, RUE increased with increase in rate of nitrogen applied. The RUE values obtained at 80 and 160 kg N/ha treatments were similar but significantly greater than those recorded for the unfertilized treatment and when N was applied at rates of 40 and 120 kg/ha.
Table 1.17. Effect of rates of nitrogen fertiliser application on the yield and its components of medium maturing maize varieties at Manga, 2012.
N rate (kg N/ha)
Harvest index
Grain yield
(kg/ha)
Straw yield
(kg/ha)
Nitrogen use efficiency
(kg/kg)
Rainfall use efficiency (kg/ha/mm
0 0.22 659 2593 22.5 0.8140 0.36 1441 3213 36.0 1.7780 0.50 2015 2027 25.2 2.48120 0.56 2052 1640 17.1 1.52160 0.45 1846 2273 11.5 2.27Mean 0.42 1603 2349 22.5 1.97s.e.d. 0.060 269.5 386.9 3.62 0.33CV (%) 45.40 53.2 52.10 51.0 53.1
In Table 1.18, the 80 kg N/ha treatment is dominated by 120 and 160 kg N/ha treatments, therefore these two treatments were eliminated from further analysis. However the 40 and 80 kg N/ha treatments all have a marginal rate of return (MRR) > 150%. This means that the 40 and 80 kg N/ha rates could be recommended for uptake by farmers or for further research work. The results also show that for every one Ghana cedis invested on one hectare of land using 40 or 80 kg N/ha the return to investment will be 8.2 and 5.7 Ghana cedis, respectively.
Table 1.18. A partial budget evaluating the Effect of different rates of nitrogen fertilizer on grain yield of medium maturity maize varieties at Manga, 2012.

N rate (kg N/ha)
Total cost that vary GH₵
Net benefit GH₵
MRR%
0 0 395.440 51.2 813.4 82080 102.4 1106.6 570120 153.6 1077.6 D160 204.8 902.8 D
Discussion - The earlier attainment of tasseling and silking by maize plants that received higher rates of nitrogen could be attributed to the better supply of plant nutrients under these treatments compared to the non-fertilised or lower N rate treatment. Generally, plants that receive better growth factors usually take fewer days to attain both growth and development stages compared to their counterparts that received less of these growth factors. Similarly the bigger maize plants reported for the higher N rates treatments could also be due to superior grow conditions afforded by the higher N rate treatments, leading to better capture of plant growth resources such as water due to better root development and taller plants resulting in better capture of radiation as reflected in the overall plant performance under the higher N rate treatments. The relatively higher harvest index of maize crops for the higher N rate treatments compared to the non-fertilised or lower N rate may be attributed to the higher nitrogen uptake. In addition low grain maize yields for soils that received no fertiliser may be due to reduced plant growth as a consequence of low nutrient (especially, N) supply and uptake. Better performance maize in term growth, development and yield recorded for the higher rates of nitrogen could be ascribed better utilization of plant growth resources such as nutrients, water and solar radiation due to higher and better nutrition under the fertilized treatments compared to the non-fertilized treatment.
ConclusionGenerally grain yield and its components increased with an increase in the level of nitrogen applied. Nitrogen use efficiency was significantly influenced by the rate of nitrogen applied. In general, the highest rates of nitrogen recorded the lowest nitrogen use efficiencies. The NUE at 40 kg N/ha was significantly greater than those obtained for all the treatments. The highest N rate recorded significantly the lowest NUE. Rainfall use efficiency (RUE) varied considerably for maize as a result of treatment effect. The highest RUE was obtained at 120 kg N/ha followed closely by 80 kg N/ha, whilst the lowest was recorded when no fertilizer was applied. However, since these results are preliminary ones it would be imperative that we repeat this study so as to confirm or reject these current results, so that we can recommend to maize farmers in Ghana for increased and stable maize production, thereby eliminate hunger and poverty and usher farmers a new dawn of prosperity
References
Adamtey, N., Cofie O., Ofosu-Budu, K. G. And Ofosu-Anim, J. (2010) Effect of N-enriched co-compost on transpiration efficiency and waste-use efficiency of maize (Zea mays L.) Under controlled irrigation. Agricultural Water Management, 97: 995-1005

Buah, S.S.J., J.W. Maranville, A. Traore, and P.J. Bramel-Cox. (1998). Response of nitrogen use efficient sorghums to nitrogen fertilizer. Journal of Plant Nutrition. 21(11):2303-2318.
Cassman, K.G., G.C. Gines, M.A. Dizon, M.I. Samson and J.M. Aloantra, (1996). Nitrogen use efficiency in tropical lowland rice system: Contribution from indigenous and applied nitrogen. Field Crops Res., 47:1-12. DOI: 10.1016/0378-4290(95)00101-8Jackai LEN,
FAO/UNESCO (1977). Soil Map of the world, Vol. 6,Africa. FAO, Rome. 299 pp.Gentry, L. E., Below,F. E., David, M. A. And Bergerou, J. (2001) Source of the soybean N credit
in maize production. Plant Soil, 236: 175-184.Moll, R.H., E.J. Kamprath and W.A. Jackson. (1982). Analysis and interpretation of factors
which contribute to efficiency of nitrogen utilization Agron. J. 74:562-564. Neil, A. A. (2009) Grain yield and rainfall use efficiency responses of maize and alternative
rotating crops under marginal production conditions in the western Highveld of South Africa. South Africa Journal of Plant Soil, 26(3): 264-269.
Ngambeki, D. S., Loehman Edna., Yu Zugou and Deuson, R.(1991) New agricultural technologies in Cameroon. Documentation and Analysisi in a Risk Concept. pp. 23.
Nyakatawa, E. Z., Brown, M. And Maringa, D. (1996) Maize and sorghum yields under tied ridges of fertilised sandy soils in semi-arid south-east lowveld of Zimbabwe. African Crop Science Journal Vol.4 (2), 197-206.
Pearson, C.J., and B.C. Jacob. (1987). Yield components and nitrogen partitioning of maize in response to nitrogen before and after anthesis. Aust. J. Agric. Res. 38:1001–1009.
Sinclaire, T. B. (1998) Historical changes in harvest index and crop nitrogen accumulation. Crop Science 38 (3):638-643.
Uhart, S.A., and F.H. Andrade. (1995). Nitrogen deficiency in maize: II. Carbon–nitrogen interaction effects on kernel number and grain yield. Crop Sci. 35:1384–1389.
Zweifel, T.R., J.W. Maranville, W.M. Ross and R.B. Clark. (1987). Nitrogen fertility and irrigation influence on grain sorghum nitrogen efficiency. Agron. J. 79:419-422.
Activity A2: Response of soybean to fertilizer and Rhizobium inoculation in the NR and UWR (PI: N.N. Denwar-NR and S.S. Buah-UWR)
Executive summarySoybean is becoming important cash and oil seed crop which is relatively drought tolerant and requires lower production inputs, yet grain yields are generally low on farmers’ fields. The low yields are due partly to low soil nutrient levels and low management levels. In order to increase soybean yields on savanna soils that are inherently low in plant available nutrients, field trials were conducted to assess the agronomic and economic benefits of using fertilizer N, P and K as well as rhizobium inoculants for soybean production in the Guinea savanna of Ghana. The five soybean varieties tested responded similarly to the fertilizer treatments at all locations but soybean response to fertilizer and Rhizobium inoculation was inconsistent. Application of P and K fertilizers with or without inoculants tended to increase grain yield relative to the no fertilizer treatment or the treatment with only Rhizobium inoculants. Grain weight was highest for the treatment with Rhizobium inoculants only in Yendi. The synergy between Rhizobium inoculation and PK fertilization was evident at Bamahu and Yendi. However, Rhizobium inoculation did not increase soybean yields at Nyankpala and Wa. Fertilizer application as well as Rhizobium

inoculation affected both growth and development of soybean plants and no fertilizer treatment reduced crop growth and grain yield significantly. Most of the locations had been planted to soybean in past years, and indigenous Rhizobium bacteria populations were probably adequate for soybean nodulation. More data is required to confirm soybean response to Rhizobium inoculation in the Guinea savanna zone. These results are preliminary and it would therefore be imperative that the experiments are repeated so as to confirm or reject these current results.
IntroductionSoybean is becoming important cash and oil seed crop which is relatively drought tolerant and require lower production inputs. Soybean may serve the dual purpose for cash and food in many households. However, yields on farmers’ fields in the Guinea savanna zone are relatively low due to erratic rainfall, low soil nutrient levels (particularly nitrogen and phosphorus), use of unimproved varieties and poor management practices. Nitrogen is the most important nutrient element which limits yield in crop production. Declining soil fertility in the Guinea savanna zone requires approaches that include the use of both organic and inorganic fertilizers as well as cropping systems involving legumes. As a grain legume, soybean is able to fix atmospheric nitrogen, thereby improving soil fertility and limiting the application of inorganic fertilizers. Symbiotic N2 fixation supplies N for soybean and eliminates the need for large fertilizer-N applications required for nonlegume crops. Additionally, soybean can be used as a trap crop against Striga hermonthica an endemic parasitic weed in northern Ghana that causes severe yield losses of cereal crops. Biological nitrogen fixation (BNF) is a renewable source of nitrogen to replace inorganic nitrogen fertilizer and it has great potential to compensate for the short falls in availability of fertilizers in African farming system. Biofertilizer as an alternative to commercial fertilizer N for legumes is gaining priority due to its economical and ecological benefits. Soil-P availability during plant seedling development is an important determinant for plant growth, N2
fixation, and grain formation of legumes. Phosphorus influences nodule development through its basic functions as an energy source. However, the element is generally deficient and limits biological nitrogen fixation in highly weathered tropical soils. Application of fertilizer especially N fertilizer to soybean remains a complicated issue owing to conflicting results of previous research. Nevertheless, only 25 to 60% of N in soybean dry matter originates from symbiotic N2 fixation, the remainder comes from soil-N. The use of biofertilizer as a nitrogen source and the amount of phosphorus needed during inoculation is still open to question. Therefore, the study was initiated to assess the agronomic and economic benefits of using fertilizer N, P and K as well as rhizobium inoculants for soybean production in the Guinea savanna of Ghana.
Materials and methodsField studies were conducted at the Savanna Agricultural Research Institute experimental fields in Wa in the Upper West region (UWR) as well as Nyankpala and Yendi in the Northern region (NR) of Ghana. Both regions are located in the Guinea savanna zone of Ghana which is a semi-arid zone, characterized by low, erratic, and poorly distributed monomodal rainfall, averaging about 1100 mm per annum. Most of the rain in the area comes as short duration high intensity storms between May and October. Mean monthly temperatures during the growing season ranged between 26 and 30O C. The soils are typical upland soils used for soybean production in the Guinea savanna zone of West Africa.

The experiments involving two maturity groups of soybean were conducted in a split-plot arrangement of treatments in a randomized complete block design with four replications. The experimental area was ploughed and harrowed before the treatments were imposed. For the trial involving medium maturing soybean, the main plot treatments were five soybean varieties (TGX 1834-5E, TGX 1445-3E, TGX 1448-2E, TGX 1904-6F and Jenguma). Five fertilizer treatments (no fertilizer, PK only, Rizobium + PK fertilizer, Rhizobium only, NPK fertilizer) were applied to the subplots. Each 6-row subplot measured 5.0 x 4.5 m. The N, P and K rates were 25, 60 and 30 kg/ha as N, P2O5 and K2O, respectively. Nitrogen was applied as urea (46% N). Phosphorus was applied as triple superphosphate (46% P2O5) and K as muriate of potash (60% K2O). All fertilizers were applied in a subsurface band about 0.05 m to the side of the maize row. Farmers do not commonly use fertilizer for soybean production in the area; hence the no fertilizer treatment was the control representing the farmers’ practice.
Sowing date of all experiments was between 6 and 19th July, 2012. The medium maturing varieties (100-1115 days) were sown in six rows of 5 m in length and 0.75 m apart. In the early-maturity (90-100 days) group, plots were sown in six rows of 5 m in length and 0.60 m apart. Distance between plants was 5 cm in all experiments with one seedling per stand. The soybean varieties were chosen on the basis of their superior performance in on-station and on-farm testing trials. Weeds were controlled manually using a hand held hoe. Soybean grain was harvested at physiological maturity. Measurements included days to 50% flowering (days), plant height (m) and grain yield (kg/ha). Grain and aboveground dry matter yields were determined by harvesting the centre two rows of each subplot. Biomass yield was based on samples dried to constant weight at 60O C. Data collected were subjected to analysis of variance (ANOVA) to establish treatment and the interactions effect on grain yield and yield components. Statistical analyses were performed with the Statistical Program SAS for Windows 9.1® (SAS Institute Inc., Cary, NC, USA). Variety and fertilizer treatments were considered as fixed effects and replication were treated as random effects. Main effects and all interactions were considered significant when P≤0.05. Simple correlations were used to test association among traits.
Results and discussions
At all locations where this study was conducted, the interaction of variety x fertilizer treatments interactions were not statistically significant for grain yield and yield components, therefore the main effects of variety and fertilizer effects are reported and discussed in this report (Tables 1 through 4).
Wa locationThe soil in Wa where the trial was conducted is slightly acidic (pH=5.4). The previous crop on this piece of land was maize that was fertilized with Urea. Differences among the medium maturing varieties were only significant for days to 50% flowering. TGX 1445-3E was the latest to flower while TGX 1834-5E was the earliest to flower. On the other hand, the soybean varieties did not differ significantly among each other in agronomic traits like plant height, dry weight, pods per plant, yield and its components (Table 1). The released variety, Jenguma tended to have higher grain production (2789 kg/ha) but its yield was not significantly different from those obtained from TGX 1834-5E, TGX 1445-3E, TGX 1448-2E and TGX 1904-6F. Meanwhile

TGX 1834-5E and TGX 1445-3E which were released in January 2013 by SARI as Afayak and Songda have enhanced capacity to stimulate suicidal germination in Striga seed. Consequently, these two varieties could be used to partner Striga-tolerant maize to effectively minimize the harmful effects of Striga in cereal production.
Fertilizer treatment significantly influence flowering date but not plant height, nodule number and weight when compared with no fertilizer treatment (Table 2.1). Nodule number per plant was not significantly different even when inoculation was employed. On average, flowering was delayed with no fertilizer treatment. The application of P and K fertilizers with or without inoculants increased grain yield significantly relative to the no fertilizer treatment or the treatment with only Rhizobium inoculants in Wa. The lowest grain yield of 2333 kg/ha was obtained from the no fertilizer treatment, followed by the treatment that received Rhizobium inoculants only. The treatments which received mineral fertilizers had higher but similar yields (Table 2.1). The synergy between Rhizobium inoculation and PK fertilization was not observed in this study. Moreover soybean did not respond to inoculation in this soil probably due to the acidic nature of the soil. In addition, the experimental site had been planted to soybean in the last three years, and indigenous Rhizobium bacteria populations were probably adequate for soybean nodulation. Therefore soybean grown on land where well nodulated soybean has been grown in recent years will probably not require inoculation. The application of Rhizobium inoculants only tended to increased grain yield when compared with the no fertilizer treatment, although the difference was not statistically significant.
Table2. 1. Mean grain yield and some yield components of soybean as affected by fertilizer and Rhizobium inoculation in Wa, Upper West region, 2012.
Treatment Days to flowering
Pods per plant
Nodule number/10 plants
Nodule weight/10 plants
Grain yield
days no no g kg/haVarietyTGX 1834-5E (Afayak) 48 84 342 1.47 2589TGX 1445-3E (Songda) 54 87 312 1.25 2419TGX 1448-2E 45 87 263 1.08 2704TGX 1904-6F 47 92 274 1.16 2678Jenguma 45 108 265 1.05 2789Lsd (0.05) 1.0 NS NS NS NS
Fertilizer treatmentNo fertilizer 49 79 204 0.84 2333Rhizobium inoculation 48 98 304 1.28 243760 kgP2O5+30 kg K2O/ha 48 93 349 1.24 2844
25 kg N+60 kgP2O5+30 kg K2O/ha 48 94 311 1.34 2833Rhizobium +60 kg P2O5+30 kg 47 93 287 1.30 2720

K2O/haLsd (0.05) 1 NS NS NS 242CV% 1.6 22.7 27.2 31.2 12.4
Bamabu locationEarly maturing varieties are required to fit short rainfall regimes, escape terminal drought in areas where the start or cessation of the rainfall season results in shorter duration of the rainy period and results in situations where the crop does not have sufficient moisture to complete the grain filling. In northern Ghana, such situations arise very often leading to significantly reduced yields. Drier areas in Upper East and West regions will therefore benefit from early maturing varieties. Such early maturing varieties could be used as relay crop to early millet in the Upper East Region. This will enable farmers benefit from both millet and soybean cultivation in one season, particularly in Striga endemic and drought- prone areas. Consequently, TGX 1799-8F and TGX 1805-8F will be particularly useful in these areas.
The response of three early maturing soybean varieties (TGX 1799-8F, TGX 1805-8E and Anidaso) to the same five fertilizer treatments was evaluate during the growing season of 2012 at Bamahu near Wa. Differences among the early maturing varieties were significant for days to flowering and grain yield (Table 2.2). TGX 1799-8F flowered 3 days earlier than TGX 1805-8F and Anidaso. Nevertheless, Anidaso had the highest yield of 2011 kg/ha followed by TGX 1799-8F. Lowest grain yield of 1215 kg/ha was recorded for TGX 1805-8E. It would be recalled that TGX 1799-8F was recently released by SARI as Suong-Pungun.
Fertilizer treatment did not significantly influence flowering date and pod weight. However, grain yield was highest for Rhizobium inoculants+ PK treatment and lowest for no fertilizer treatment. Application of Rhizobium inoculants with or without P and K fertilizers increased grain yield significantly at Bamahu when compared with no fertilizer treatment. The synergy between Rhizobium inoculation and PK fertilization was evident at Bamahu. Results of this study confirm reports that on a land where soybean has not been grown for past years, inoculation is recommended. Adequate supply of P with Rhizobium strains plays an important role in physiological and developmental processes in plant life and the favorable effect of this important nutrient might accelerate the growth processes, which ultimately resulted in increased grain yield of the crop.
Table 2.2. Mean grain yield and some yield components of soybean as affected by fertilizer and Rhizobium inoculation at Bamahu near Wa, Upper West region, 2012.Treatment Days to
floweringPods per plant Grain yield
days no kg/haVarietyTGX 1799-8F (Suong-Pungu) 47 69 1752TGX 1805-8F 50 74 1215Anidaso 40 71 2011

Lsd (0.05) 1.0 NS 206
Fertilizer treatmentNo fertilizer 50 61 1500Rhizobium inoculation 48 83 177860 kgP2O5+30 kg K2O/ha 49 68 1617
25 kg N+60 kgP2O5+30 kg K2O/ha 49 70 1574Rhizobium +60 kg P2O5+30 kg K2O/ha
49 74 1827
Lsd (0.05) NS NS 266CV% 2.8 32.6 16.5
Nyankpala locationAt the Nyankpala site, differences among the medium maturing varieties were significant for pod number, pod weight per plant as well as grain yield (Table 2.3). Jenguma, TGX 1448-2E and TGX 1904-6F had numerically more pods per plant than TGX 1834-5E and TGX 1445-3E. It should be noted that Jenguma and TGX 1448-2E are the same varieties except that they are from different sources. Although TGX 1834-5E recorded numerically fewer pods per plant, its pods were quite heavy and were comparable to those of Jenguma, TGX 1448-2E and TGX 1904-6F. Three varieties (Jenguma, TGX 1448-2E and TGX 1904-6F) had higher but similar grain yields. Their yields on one hand, however, were greater than those of TGX 1834-5E (released as Afayak) and TGX 1445-3E (released as Songda). Fertilizer treatment only had a significant effect on nodule dry weight per plant. Although the use of mineral fertilizer tended to have higher grain production, the yields were not significantly different from those obtained from no fertilizer and only Rhizobium inoculants treatments. The application of Rhizobium inoculants only tended to increased grain yield when compared with the no fertilizer treatment but the difference was not statistically significant. Soybean did not response to inoculation at this site even with N, P and K fertilizer addition.
Table 2.3. Mean grain yield and some yield components of soybean as affected by fertilizer and Rhizobium inoculation in Nyankpala, Northern region, 2012.
Treatment Days to flowering
Pods per plant
Pod weight
per plant
Nodule weight/10 plants
Grain yield
days no no g kg/haVarietyTGX 1834-5E (Afayak) 50 42 15.7 1.75 1500TGX 1445-3E (Songda) 52 32 9.8 1.19 1167TGX 1448-2E 48 52 18.1 1.27 1993TGX 1904-6F 49 57 20.0 1.41 1967Jenguma 49 58 18.9 1.05 1914

Lsd (0.05) NS 8 4.1 NS 389
Fertilizer treatmentNo fertilizer 50 51 18.4 1.50 1480Rhizobium inoculation 50 46 16.0 1.48 162060 kgP2O5+30 kg K2O/ha 51 47 15.5 1.09 1615
25 kg N+60 kgP2O5+30 kg K2O/ha 49 46 15.8 0.81 1906Rhizobium +60 kg P2O5+30 kg K2O/ha
48 50 16.8 1.19 1920
Lsd (0.05) NS NS NS 0.34 NSCV% 10.1 27.7 29.5 34.4 35.0
Yendi locationAt the Yendi site, differences among the medium maturing varieties were significant for pod and grain weight per plant only (Table 2.4). The varieties differed very little with respect to time required to obtain specific growth stages. The varieties produced similar yields. TGX 1904-6F recorded the highest pod weight per plant (16.2 g/plant) while TGX 1448-2E had the least (9.5 g/plant). Grain weight per plant was highest for TGX 1834-5E and least for TGX 1448-2E.
Fertilizer treatment had a significant effect on grain weight per plant and final grain yield at maturity only. Grain weight was highest for the treatment with Rhizobium inoculants only although this was not statistically significantly different from those obtained from the mineral fertilizer treatments. The no fertilizer treatment had the least grain weight per plant. Grain yield and grain weight per plant followed a similar trend. Rhizobium inoculation significantly increased grain yield at Yendi and this yield was comparable to those obtained from the treatments with PK only or PK with Rhizobium inoculants. The synergy between Rhizobium inoculation and PK fertilization was evident at Yendi. The recommended fertilizer rate for soybean (25-6-30 kg/ha as N, P2O5 and K2O, respectively) and the no fertilizer treatments had similar yields at Yendi. The reason for these inconsistencies in grain yield response to NPK fertilization at this site is unclear
Table 2.4. Mean grain yield and some yield components of soybean as affected by fertilizer and Rhizobium inoculation in Yendi, Northern region, 2012.
Treatment Pods per plant
Pod weight
per plant
Grain weight
per plant
Nodule weight/10 plants
Grain yield
days no no g kg/haVarietyTGX 1834-5E (Afayak) 41 12.3 7.6 1.49 1233TGX 1445-3E (Songda) 33 9.6 5.4 1.37 880TGX 1448-2E 33 9.5 5.3 1.28 1053TGX 1904-6F 41 16.2 5.5 1.46 1093

Jenguma 41 13.4 6.1 1.20 952Lsd (0.05) NS 4.0 2.1 NS NS
Fertilizer treatmentNo fertilizer 40 11.2 4.6 1.60 887Rhizobium inoculation 37 13.5 8.1 1.42 119360 kgP2O5+30 kg K2O/ha 39 13.5 7.6 1.31 1084
25 kg N+60 kgP2O5+30 kg K2O/ha 33 11.6 7.3 1.17 881Rhizobium +60 kg P2O5+30 kg K2O/ha
41 11.0 7.2 1.30 1167
Lsd (0.05) NS NS 2.1 NS 283CV% 39.2 32.3 37.2 39.4 42.9
Conclusion and recommendations
This study aimed to enhance soybean production among the small holder farmers in northern Ghana through the use of Rhizobium inoculation and moderate applications of P and K and to sustain soil nutrient level. However the preliminary results suggest that symbiotic nitrogen fixation, a key component in biological nitrogen fixation, may not be as successful in substituting for chemical fertilizer on all soils as initially expected. However, the soils collected from these sites are yet to be analyzed and the data will help explain the inconsistent responses observed in the study. In any case, most of the locations had been planted to soybean in past years, and indigenous Rhizobium bacteria populations were probably adequate for soybean nodulation. More data is required to confirm soybean response to Rhizobium inoculation in the Guinea savanna zone.
Soybean experiment at Wa Soybean experiment at Bamahu
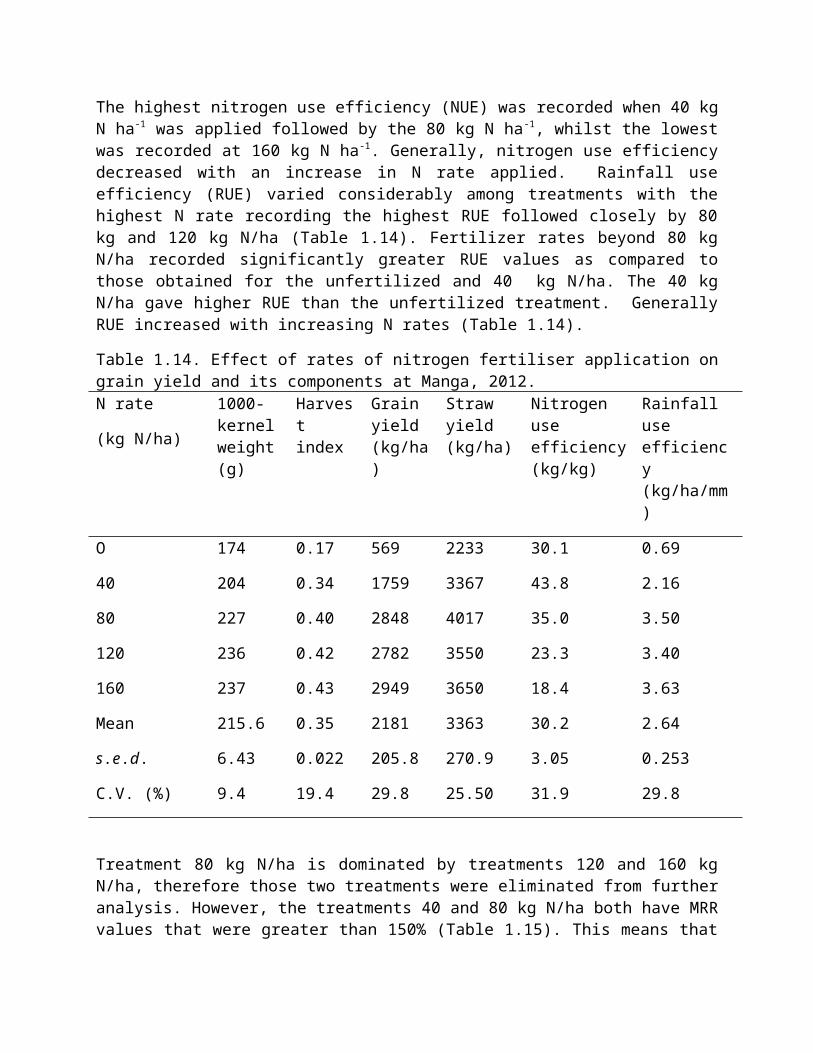
Seed producers visiting the soybean experiment at Wa
Soybean experiment at Tumu
Activity A3: Evaluation of Planting Date, Cultivar and Insecticide Spraying Regime for Control of Insect Pests of Cowpea in Northern Ghana (PI: M. Abudulai – NR; S.S. Seini – UWR and F. Kusi - UER)
Executive summaryCowpea, Vigna unguiculata (L) Walp, is a major staple crop in Ghana. Despite its importance, grain yields on farmers’ field are low because of problems of insect pests that attack the crop throughout its growth, although the most important insect pests are those that attack the crop from flowering. Insecticide application is the recommended practice for control of insect pests on cowpea. However, most resource-poor farmers in Ghana require pest management strategies that are cost-effective and sustainable. The use of insecticides must be minimized because of high cost and harmful effects on the environment. To address these problems, studies were conducted to in order to develop an integrated management system for cowpea insect pests using host plant resistance in elite cultivars, appropriate planting date and reduced insecticide spraying regimes. Results of the study showed that spraying cowpea once would have similar effect as not spraying at all. This was manifested in the no significance observed in most cases between the two spraying regimes in respect to the number of Thrips, Maruca vitrata, shrivelled pods, pods with Maruca feeding holes and grain yield. For a profitable cowpea production, unsprayed fields should not be encouraged. On the other hand two spraying at full flowering and full pod formation was found to have the same effects as praying thrice. In effect, it is best to spray twice to save the extra cost for the third spray. Planting cowpea between mid July and early August was found to suffer relatively less attack by Maruca vitrata, Thrips and pod sucking bugs. Grain yields were also found to be higher with planting within this period than later planting dates in August. Planting of cowpea from late August onwards means that the most critical stages of the plant (flowering and podding) will coincide with terminal drought. This is also the time that insects rapidly increase in their population. Plants are also relatively weak and vulnerable to attack by pests. Eventually the plants suffer severe attack by insects which results in poor flowering, low pod formation, high rate of pod damage by Muruca and pod sucking bugs and finally low grain yield.
Introduction Cowpea, Vigna unguiculata (L) Walp, is a major staple crop in Ghana. The leaves, green pods, green peas and the dry grain are eaten as food and the haulms are fed to livestock. The grain contains 23-28% protein and constitutes the cheapest source of dietary protein for majority of

people in Africa who lack the necessary financial resources to acquire animal protein (Tarawali et al., 1997). Sale of the grain also provides income to farmers and traders in Ghana. As a leguminous crop, cowpea also fixes atmospheric nitrogen into the soil which is of major benefit in African farming where most of the lands are exhausted and farmers lack adequate capital to purchase chemical fertilizers. Moreover, cowpea is shade-tolerant and therefore compatible as an intercrop in the mixed cropping systems widely practiced by small holder farmers (Singh and Sharma, 1996).
Despite its importance, cowpea yields on farmers’ field are low averaging less than 500 kg ha -1. The major cause of the low yields is due to problem of insect pests that attack the crop throughout its growth, although the most important insect pests are those that attack the crop from flowering (Jackai et al. 1985). Insecticide application is the recommended practice for control of insect pests on cowpea. However, most farmers in Ghana are resource-poor and require pest management strategies that are cost-effective and sustainable. The use of insecticides must be minimized because of high cost and harmful effects on the environment. The purpose of this study was to develop an integrated management system for cowpea insect pests using host plant resistance in elite cultivars, appropriate planting date and reduced insecticide spraying regimes. Specifc objectives were:
1. Evaluate cowpea cultivars for their resistance to major insect pests of cowpea2. Determine appropriate planting dates as a cultural tool for pest management in cowpea3. Determine the minimum insecticide protection required for increased cowpea yield.
Materials and methodsThe experiments were conducted in NR, UWR and UER in 2012. Two experiments were established at two locations in the UER (Googo in Bawku West and Tansia in Bawku Municipal). The same two experiments were conducted each at Tingoli in the Tolon-Kumbungu district and Malzeri in the Yendi district of the northern region. Also the experiments were conducted at Bulenga in the Wa East district and Kaleo in the Nadowli district of the Upper West Region.
In Experiment 1, the treatments consisted of four planting dates, 6 cowpea cultivars of maturity periods ranging from early to late which were sprayed with insecticide or unsprayed. The experimental design was a split-split-plot in a randomized complete block design with three treatment replications. Insecticide spray constituted the main plots, planting date as sub-plots and cowpea cultivars as sub-sub-plots. The six cowpea cultivars used were IT99 K-573-1-1 and IT99 K-573-2-1 obtained from IITA, Bawutawuta, Songotra and Padi Tuya obtained from the breeding program at CSIR-SARI and a farmer variety (Table 3.1). However, owing to insufficient quantities of seed, only three cowpea cultivars (Bawutawuta, Padituya and Songotra) were used in UWR. All locations, plantings were made mid-July, late-July, mid-August and late-August. The sub-sub-plots consisted of 4 rows 5 m long spaced at 0.60 m between rows and 0.20 m between plants in a row. The replicates and main plots were separated by 2 m alleys while the sub and sub-sub plots were spaced 1 m apart.
In Experiment 2, the treatments comprised of six cowpea cultivars as in Experiment 1 and four insecticide spraying regimes. The insecticide spraying regime treatments were: 1) no spray (untreated control), 2) spraying once at 50% flowering, 3) two sprays, one at flower bud

initiation and a second at early podding and 4) three sprays, one each at flower bud initiation, 50% flowering and 50% podding. The experimental design was a split-plot in a randomized complete block design with insecticide spraying regime as the main plots and cowpea cultivars as sub-plots. The treatments were replicated four times. The sub-plots consisted of 4 rows 5 m long spaced at 0.60 m between rows and 0.20 m between plants in a row. The replicates and main plots were separated by 2 m alleys while the sub-plots were spaced 1 m apart.
Data collectionData were collected on agronomic parameters such as percent germination and days to 50% flowering and maturity. Insect pests were sampled from the two middle rows of each plot. Populations of thrips and Maruca vitrata were estimated beginning at flower bud formation until 50% podding by picking 20 flowers from the two middle rows in alcohol to the laboratory to count the insects. Populations of pod-sucking bugs (PSBs) were estimated by counting nymphs and adults in the two middle rows of each plot. Pod damage by PSBs and Maruca were estimated from a sub-sample of 100 pods after harvest. Data also were taken on yield parameters such as number of pods per plant, number of seeds per pod, haulm and seed yield.
Table 3.1. List of cowpea cultivars used in the experimentsCultivar SourceV1 = IT 99K-573-1-1 IITAV2 = IT99K-573-2-1 IITAV3 = Songotra CSIR-SARIV4 = Padi Tuya CSIR-SARIV5 = Bawutawuta CSIR-SARIV6 = Farm Variety Farmers
Control of insect pests of cowpea in UER (F. Kusi)
Results and discussion
Experiment: the spray regime x cultivar – Tansia in UERThe number of Thrips per 20 flowers sampled at early flowering stage is shown in Table 3.2. Significantly (P = 0.05) the cultivars and the spray regime main infects recorded differences in the number of Thrips. Generally the spray regimes S0 and S1 recorded significantly higher number of Thrips than S2 and S3 in most of the cultivars evaluated. However, no significant differences were observed among the cultivars under S0 and S1. There were also no significant differences among the cultivars under S2 and S3 spray regimes.
Table 3.2: Thrips population at early flowering stage of 6 cowpea lines subjected to 4 spraying regimes at Tansia, UER
Spray regime Cultivar Mean V1 V2 V3 V4 V5 V6
S0 31.2 15.5 11.7 9.0 29.2 11.0 18.0S1 21.0 19.0 8.5 8.7 10.0 4.2 11.9

S2 8.5 7.5 3.7 4.2 4.2 5.0 5.5S3 7.0 5.2 4.5 3.0 3.2 3.2 4.4Mean 16.9 11.8 7.1 6.2 11.7 5.9 9.9
s.e.d: Var. = 3.54, Spray regime = 3.35 Maruca vitrata population sampled from 20 flowers is presented in Table 3.3. Apart from the cultivars, there was no significant (P=0.05) interaction effect and also no significance differences were observed among the spray regime main effect. IT 99K-573-1-1 recorded significantly higher number of maruca per 20 flowers than the other cultivars.
Table 3.3. Maruca vitrata population at early flowering stage of 6 cowpea lines subjected to 4 spraying regimes at Tansia, UER
Spray regime Variety Mean V1 V2 V3 V4 V5 V6
S0 0.25 0.00 0.50 0.00 0.25 0.00 0.17S1 1.25 0.00 0.00 0.00 0.00 0.00 0.21S2 0.75 0.00 0.00 0.25 0.00 0.00 0.17S3 0.25 0.00 0.00 0.00 0.00 0.00 0.04Mean 0.63 0.00 0.13 0.06 0.06 0.00 0.15
P= 0.05: Var.= 0.019, Spray regime = 0.802, Inter.=0.721S.E.D: Var.0.20, Spray regime=1.77, Inter.=0.40
Thrips population assessment was repeated at full flowering stage which is shown in Table 3.4. The trend was not different from the sampling at early flowering state in relation to Thrips population sampled at the various spray regimes. Significantly (P=0.05) S0 recorded higher number of Thrips in most of the cultivar than S1, S2 and S3. Again significant differences were not observed between S2 and S3 across all the cultivars. Table 3.4. Thrips population at full flowering stage of 6 cowpea lines subjected to 4 spraying regimes at Tansia, UER
Spray regimeVariety Mean
V1 V2 V3 V4 V5 V6S0 53.2 31.8 27.8 20.5 74.2 53.0 43.4S1 13.5 8.0 23.5 19.2 17.7 19.5 16.9S2 9.0 6.5 6.5 6.2 8.5 5.5 7.0S3 4.2 4.0 2.7 7.2 5.5 4.5 4.7Mean 20.0 12.6 15.1 13.3 26.5 20.6 18.0
P=0.05: Var.= 0.228, Spray regime=0.010, Inter.=0.19s.e.d: Var. 6.33, Spray regime=9.42, Inter.= 14.91
Population of Maruca vitrata at full flowering stage is shown in Table 3.5. S0 and S1 recorded significantly higher number of Maruca than S2 and S3. However, there was no significant

difference between S2 and S3. Cultivar main effect did not show any significant difference, there was also no cultivar and spray regime interactions.
Table 3.5. Maruca vitrata population at full flowering stage of 6 cowpea lines subjected to 4 spraying regimes at Tansia, UERSpray regime Variety Mean
V1 V2 V3 V4 V5 V6S0 3.00 2.50 1.75 4.00 2.25 2.00 2.58S1 3.00 2.75 2.25 2.75 2.75 2.25 2.62S2 1.50 1.50 0.50 0.75 0.75 0.50 0.92S3 1.25 0.00 0.50 0.75 1.00 0.75 0.71Mean 2.19 1.69 1.25 2.06 1.69 1.38 1.71
s.e.d: Var. 0.354, Spray regime=0.167, Inter.= 0.667
The number of harvested pods with Maruca vitrata feeding holes per plot is presented in Table 3.6. Both the cultivar and spray main effects showed significant differences (P=0.05) but there was no interaction effects. The spray regimes were clearly classified into two groups, S0 and S1with significantly higher number of pods with Maruca feeding holes and S2 and S3 on the other hand with significantly less number of pods with Maruca feeding holes.
Table 3.6. Pods with Maruca feeding holes of 6 cowpea lines subjected to 4 spraying regimes at Tansia, UER
Spray regime Variety
Mean V1 V2 V3 V4 V5 V6S0 4.50 3.75 2.25 6.32 4.75 3.00 4.09S1 5.50 1.75 4.00 4.50 6.00 4.00 4.29S2 1.00 3.00 3.25 6.35 1.75 0.75 2.8S3 1.75 3.75 1.00 0.75 5.50 1.50 2.37Mean 3.19 3.06 2.62 4.48 4.50 2.31 3.36 P=0.05: Var.= 0.025, Spray regime=0.181, Inter.=0.012s.e.d: Var. 0.786, Spray regime=0.967, Inter.=1.731
The mean shrivelled pods per plot after harvest is shown in Table 3.7. Apart from the cultivar, there was no significant (P=0.05) difference in spray regime and interaction effects. The highest number of shrivelled pods was recorded against V2, whiles V4 recorded the least number of shrivelled pods.
Table 3.7. The number of shrivelled pods of 6 cowpea lines subjected to 4 spraying regimes at Tansia, UER
Spray regime Variety
Mean V1 V2 V3 V4 V5 V6S0 17.00 20.25 15.50 6.20 3.25 15.00 12.87S1 25.75 29.00 14.50 6.75 1.75 13.75 15.25S2 20.00 28.50 19.25 6.75 6.00 16.00 16.08S3 15.25 14.50 18.25 9.00 2.25 13.75 12.17
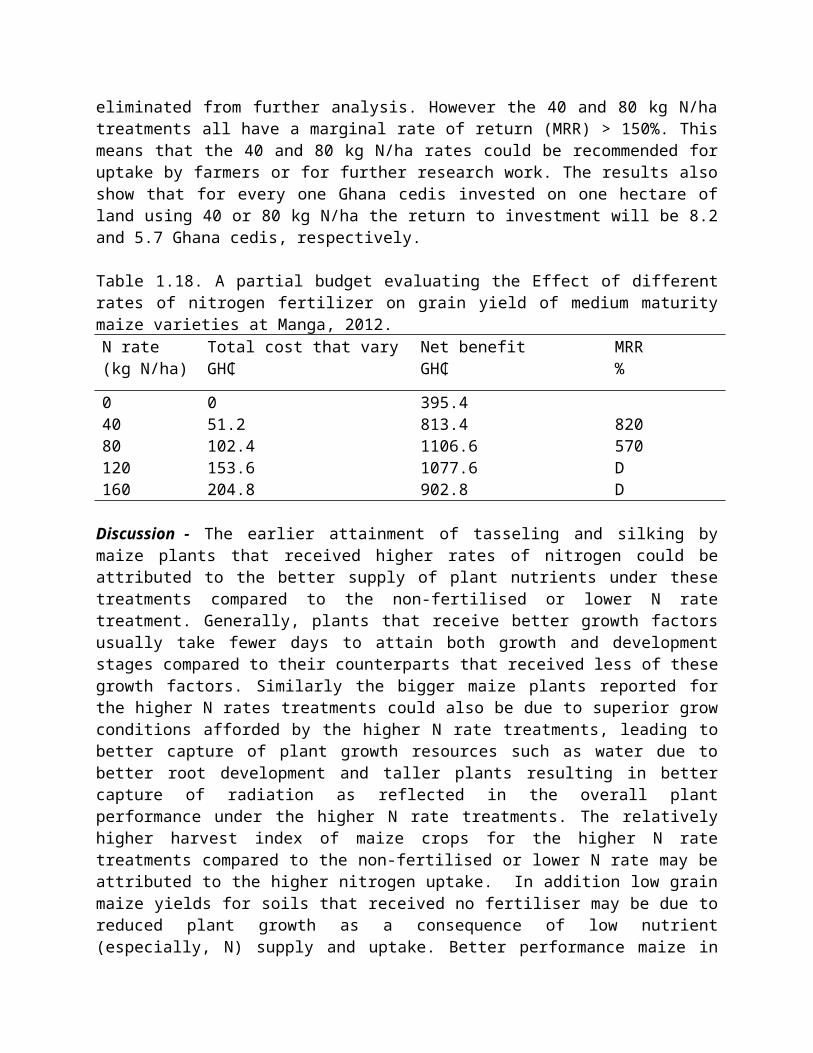
Mean 19.50 23.06 16.87 7.17 3.31 14.62 14.09s.e.d: Var.2.42, Spray regime=1.610, Inter.=4.71
The mean grain yield per ha is shown in Table 3.8. No interaction effect was observed between the cultivars and the spray regimes. However, there were significant (P<0.001 and P=0.005) differences among cultivar and spray regime main effects. The grain yield varied among the cultivars ranging from 0.607 tons ha- (V3) to 0.484 tons ha- (V2). The least yield was recorded against S0 whiles the highest yield was against S3.
Table 3.8. Mean grain yield per ha of 6 cowpea lines subjected to 4 spraying regimes at Tansia, UER
Spray regimeVariety Mean
V1 V2 V3 V4 V5 V6S0 0.176 0.224 0.351 0.215 0.226 0.253 0.241S1 0.443 0.248 0.388 0.231 0.313 0.239 0.310S2 0.761 0.609 0.770 0.605 0.810 0.722 0.713S3 0.808 0.853 0.920 0.771 0.944 0.907 0.867Mean 0.547 0.484 0.607 0.456 0.573 530 0.533s.e.d: Var.0.41, Spray regime=0.0534, Inter.=0.0919
Experiment: the spray regime x cultivar – Googo in UERThe number of Thrips per 20 flowers sampled at early flowering stage at Googo is shown in Table 3.9. The cultivars and the spray regime main infects recorded Significant (P = 0.05) differences in the number of Thrips. The spray regimes S0 and S1 recorded significantly higher number of Thrips whiles S2 and S3 recorded lower number of Thrips in all the cultivars evaluated. The cultivars V1 and V2 recorded the highest number of Thrips whiles the lowest was recorded against V6.
Table 3.9. Thrips population at early flowering stage of 6 cowpea lines subjected to 4 spraying regimes at Googo, UER
Spray regimeVariety Mean
V1 V2 V3 V4 V5 V6S0 85.5 93.0 60.8 52.2 36.0 52.7 63.4S1 96.0 77.0 62.8 53.8 83.8 37.2 68.4S2 49.7 38.2 30.8 28.5 28.0 19.8 32.5S3 35.5 44.7 46.8 25.2 52.2 18.2 37.1Mean 66.7 63.2 50.2 39.9 50.0 32.0 50.4s.e.d: Var.8.77, Spray regime=9.37, Inter.= 18.55 Maruca vitrata population sampled at early flowering from 20 flowers is presented in Table 3.10. Apart from the Spray regime, there was no significant (P=0.05) interaction effect and also no significances differences were observed among the cultivar main effect. The highest number of Maruca was recorded against S1 and the least number was against S2 and V3.

Table 3.10. Maruca vitrata population at early flowering stage of 6 cowpea lines subjected to 4 spraying regimes at Googo, UER
Spray regimeVariety Mean
V1 V2 V3 V4 V5 V6S0 2.25 2.25 2.50 3.00 1.50 1.75 2.21S1 3.75 3.50 2.25 4.50 1.75 3.00 3.12S2 0.50 0.50 0.50 0.50 0.50 0.50 0.50S3 0.50 0.50 1.00 0.25 0.25 0.00 0.42Mean 1.75 1.69 1.56 2.06 1.00 1.31 1.56s.e.d: Variety. 0.436Spray regime=0.305, Interaction = 0.852
Thrips population assessment at full flowering stage is shown in Table 3.11. The trend was not different from the sampling at early flowering state in relation to Thrips population sampled at the various spray regimes. Significantly (P<0.01) S0 recorded higher number of Thrips in most of the cultivar than S1, S2 and S3. The least number of thrips was recorded against S3.
Table 3.11. Thrips population at full flowering stage of 6 cowpea lines subjected to 4 spraying regimes at Googo, UERSpray regime V1 V2 V3 V4 V5 V6 MeanS0 108.8 117.8 77.0 93.0 75.8 73.0 90.9S1 76.5 81.5 90.0 79.5 73.0 71.5 78.7S2 43.0 44.3 33.0 34.8 33.8 29.8 36.4S3 16.7 14.2 21.5 14.5 22.7 13.5 17.2Mean 61.2 64.4 55.4 55.4 51.3 46.9 55.8s.e.d: Variety= 8.78, Spray regime= 8.32, Interaction.= 18.06 Population of Maruca vitrata at full flowering stage is shown in Table 3.12. Significant difference was observed only in the spray regime. S0 and S1 recorded significantly higher number of Maruca than S2 and S3. However, there was no significant difference between S2 and S3. Cultivar main effect did not show any significant difference, there was also no cultivar and spray regime interactions.
Table 3.12. Maruca vitrata population at full flowering stage of 6 cowpea lines subjected to 4 spraying regimes at Googo, UERSpray regime Variety Mean
V1 V2 V3 V4 V5 V6S0 3.75 3.50 3.25 3.00 3.25 3.75 3.42S1 3.50 4.50 3.75 3.25 2.75 2.00 3.29S2 1.75 0.75 1.00 1.00 0.50 1.25 1.04S3 0.50 0.75 0.75 1.25 0.75 1.75 0.96Mean 2.38 2.38 2.19 2.12 1.81 2.19 2.18s.e.d: Variety= 0.463, Spray regime=0.346, Interaction.= 0.913
The number of harvested pods with Maruca vitrata feeding holes per plot is presented in Table 3.13. Only the spray main effects showed significant differences (P=0.05) but there was no interaction effects and cultivar effects. The spray regimes V0 and V1 recorded significantly

higher number of pods with Maruca feeding holes in almost all the cultivars and S2 and S3 on the other hand with significantly less number of pods with Maruca feeding holes.
Table 3.13. Pods with Maruca feeding holes of 6 cowpea lines subjected to 4 spraying regimes at Googo, UER
Spray regimeVariety Mean
V1 V2 V3 V4 V5 V6S0 6.50 12.25 9.00 5.75 5.00 6.00 7.42S1 5.25 8.50 6.00 11.50 16.00 7.00 9.04S2 4.50 2.50 1.75 1.25 1.25 1.50 2.13S3 1.75 2.00 1.00 1.00 2.00 1.50 1.54Mean 4.50 6.31 4.44 4.88 6.06 4.00 5.03s.e.d: Variety= 1.692, Spray regime=1.633, Interaction.= 3.495
The mean number of Striga plants per plot of 6 cowpea cultivars is presented in Fig. 1. There was significant differences (p=0.05) among the 6 cultivars, two of the cultivars, V1 and V2 recorded no Striga emergence per plot whiles the rest recorded Striga emergence ranging from 1.75 in V3 to 19.62 in V4. Among the cultivars that recorded striga emergence is V3 which is known to be resistant to Striga in Northern Ghana.
V1 V2 V3 V4 V5 V60
5
10
15
20
25
0 01.75
13.19
19.62
14.56
Striga /plot
Striga /plot
Fig. 1 The mean number of Striga plants per plot of 6 cowpea cultivars

In Table 3.14 is the mean number of shrivelled pods per plot after harvest. Both the cultivar and the spray regime main effects had significant effects; however there were no interaction effects.So and S1 recorded significantly higher number of shrivelled pods per plot S2 and S3 had the lowest shrivelled pods per plot. On the other hand V1, V2, V3 and V6 recorded significantly higher number of shrivelled pods per plot. The least number of shrivelled pods were found in V5.
Table 3.14. The number of shrivelled pods of 6 cowpea lines subjected to 4 spraying regimes at Googo, UER
Spray regime Variety
Mean V1 V2 V3 V4 V5 V6S0 50.50 46.25 47.00 27.50 44.00 51.75 44.50S1 45.50 47.75 44.00 36.00 42.50 43.25 43.17S2 21.25 23.75 26.25 19.75 19.25 21.75 22.00S3 16.25 16.50 13.50 10.50 8.25 16.75 13.62Mean 33.38 33.56 32.69 23.44 28.50 33.38 30.82s.e.d: Variety= 2.151, Spray regime=1.523, Interaction.= 4.213 The mean grain yield ha- is shown in Table 3.15. No interaction effect was observed between the cultivars and the spray regimes. However, there were significant (P=0.05) differences among cultivar and spray regime main effects. The highest grain yield was recorded in V5 whiles the lowest yield was found in V4. Among the spray regimes, the least yields were recorded against S0 and S1 whiles the highest yield was against S3.
Table 3.15. Mean grain yield per ha of 6 cowpea lines subjected to 4 spraying regimes at Googo, UER
Spray regime Variety
Mean V1 V2 V3 V4 V5 V6S0 0.312 0.340 0.394 0.225 0.324 0.309 0.318S1 0.419 0.413 0.341 0.253 0.352 0.408 0.364S2 1.030 1.027 1.024 0.727 1.186 1.049 1.007S3 1.122 1.271 1.194 0.875 1.247 1.332 1.173Mean 0.721 0.763 0.738 0.520 0.777 0.775 0.716P=0.05: Variety<.001, Spray regime<.001, Interaction= 0.511s.e.d: Variety= 0.0553, Spray regime= 0.0558, Interaction.= 0.1153
4. DiscussionThe trends in both communities clearly indicate that spray cowpea once would have equal effect as not spraying at all. This manifested in the no significance observed in most cases between S0 and S1 in respect to the number of Thrips, Maruca vitrata, shrivelled pods, pods with Maruca feeding holes and grain yield. On the other hand two spraying at full flowering and full pod formation was found to have the same effects as praying thrice. As in S0 and S1, S2 and S3 recorded significantly no difference in Thrips and Maruca vitrata, sampled from the flowers. Likewise, S2 and S3 did not differ significantly in the number of shrivelled pods, pods with Maruca feeding holes and grain yield in most of the cultivars.

Although evaluation of the cultivars against Striga gesnerioides was originally not one of the objectives of the study, the heavy Striga infestation at Googo revealed the resistance of V1 and V2 to striga. The Striga hot spot did not only help to identify these lines, it also enabled the research team to realise that the only source of striga resistant cowpea cultivar (V3) in Northern Ghana had some few plants infested with Striga. This could now be attributed to mixture of seeds from the previous seasons or during the packaging of seeds. It is therefore recommended that the cowpea breeding programme should immediately screen the V3 seeds in both striga hot spots and in striga infested pots. The grain yield differences observed between the two communities could be attributed to differences in the soil fertility. This is because the cultivars in the two communities were the same which were subjected to the same treatments and management strategies. Date of planting x cultivar x sprayed/unsprayed - GoogoThe fourth planting (D4) was one in late August 2012, the plants therefore suffered from terninal drought experienced in the communities. This affected the crop performance and so no data was taken on D4. The number of Thrips Sampled at full flowering at Googo is presented in Table 3.16. There were no interaction effect all levels, the significant effects were rather observed in spray and planting date main effects. Significantly (P=0.05) higher number of Thrips were sampled from the unsprayed plots than from the sprayed plots. On the other hand, the earlier planting dates recorded less number of thrips than the late planting dates.
Table 3.16. Thrips population at full flowering stage of 6 cowpea lines subjected to 4 planting dates and 2 spray regimes at Googo, UERVariety Sprayed Unsprayed
D1 D2 D3 D4 MEAN D1 D2 D3 D4 MEAN V1 36.3 77.3 108.3 74.0 176.3 77.3 171.3 141.7V2 45.7 86.3 91.3 74.4 112.0 113.7 178.7 134.8V3 46.7 78.3 63.3 62.8 63.7 96.0 170.3 110.0V4 46.3 72.0 66.3 61.6 79.3 92.0 162.7 111.3
V5 31.7 46.3 70.3 49.4 85.3 90.7 152.3 109.4V6 42.3 74.3 92.7 69.8 79.7 114.7 121.7 105.3Mean 41.5 72.4 82.1 99.4 97.4 159.5
s.e.d.: Spraying=1.68, date of planting=12.63, Variety= 11.37, Inter.= 29.36
Main EffectsSpraying Sprayed Unsprayed
65.3 118.8 Date of planting D1 D2 D3
70.4 84.9 120.8Variety V1 V2 V3 V4 V5 V6
107.8 104.6 86.4 86.4 79.4 87.6
There was no interaction effects in the number of Maruca sampled at full flowering at Googo (Table 3.17). Significant (P=0.05) difference were observed in spray, planting date and cultivar main effects. Higher number of Maruca was sampled from the unsprayed and the late planting dates. The cultivars also varied in the number of maruca and this ranged from 0.6 (V5) to 2 (v1).
Table 3.17. Maruca vitrata population at full flowering stage of 6 cowpea lines subjected to 4 planting dates and 2 spray regimes at Googo, UERVariety Sprayed Unsprayed
D1 D2 D3 D4 MEAN D1 D2 D3 D4 MEAN V1 0.67 0.67 2.00 1.11 3.00 2.33 3.33 2.89V2 1.33 1.00 1.33 1.22 4.33 1.67 2.00 2.67V3 0.33 1.33 0.33 0.67 0.67 1.00 2.67 1.44V4 1.00 0.67 0.67 0.78 2.00 0.00 4.00 2.00V5 0.00 0.00 0.33 0.11 1.00 0.33 2.00 1.11V6 0.00 0.33 1.67 0.67 1.00 2.00 4.00 2.33Mean 0.56 0.67 1.06 2.00 1.22 3.00s.e.d.: Spraying=0.277, date of planting=0.278, Variety=0.410, Inter.= 1.010
Main EffectsSpraying Sprayed Unsprayed
0.76 2.07
Date of planting D1 D2 D3 1.28 0.94 2.03
Variety V1 V2 V3 V4 V5 V6 2.00 1.94 1.06 1.39 0.61 1.50
Interaction effects were observed at all levels in the number of pods with Maruca feeding holes at Googo (Table 3.18). The 9.67 and 5.79 pods with Maruca feeding holes recorded against V1 and V5 respectively was as result of the combined effects of planting date and spray or unspray.
Table 3.18. Pods with Maruca feeding holes of 6 cowpea lines subjected to 4 planting dates and 2 spray regimes at Googo, UERVariety Sprayed Unsprayed
D1 D2 D3 D4 MEAN D1 D2 D3 D4 MEAN V1 4.33 6.00 4.00 4.78 9.67 11.00 23.00 14.56V2 5.00 7.00 6.00 6.00 8.67 15.00 14.00 12.56V3 4.00 2.00 3.33 3.11 7.33 17.00 10.00 11.44V4 5.33 1.33 7.00 4.56 5.33 13.00 15.00 11.11V5 2.00 3.00 11.33 5.44 5.33 4.00 9.00 6.11V6 6.00 3.00 4.67 4.56 5.33 10.00 19.00 11.44Mean 4.44 3.72 6.06 6.94 11.67 15.00s.e.d.: Spraying=1.424, Date of planting=1.047, Variety=0.584, Inter.= 2.279
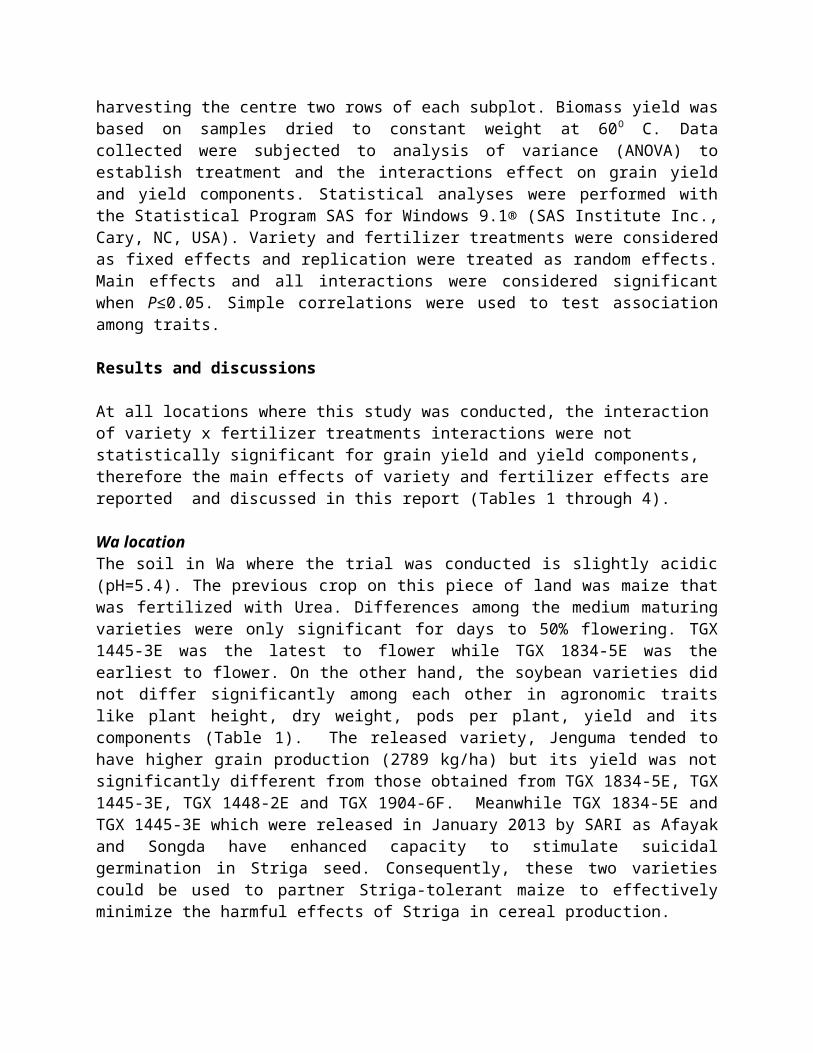
Main EffectsSpraying Sprayed Unsprayed
4.74 11.20
Date of planting D1 D2 D3 5.69 7.69 10.53
Variety V1 V2 V3 V4 V5 V6 9.67 9.28 7.28 7.83 5.78 8.00
Interaction effects were observed at all levels in the number of shrivelled pods per plot at Googo (Table 3.19). As in the pods with Maruca feeding holes, the 25 and 14 shrivelled pods per plot recorded against V2/V6 and V5 respectively was as result of the combined effects of planting date and whether the field was sprayed or not. Table 3.19. number of shrivelled pods of 6 cowpea lines subjected to 4 planting dates and 2 spray regimes at Googo, UERVariety Sprayed Unsprayed
D1 D2 D3 D4 MEAN D1 D2 D3 D4 MEAN V1 10.67 19.00 15.00 14.89 21.67 21.00 42.67 28.44V2 11.33 17.00 11.00 13.11 26.33 40.33 45.33 37.33V3 8.67 10.00 21.00 13.22 21.00 27.00 50.00 32.67V4 10.00 8.00 12.00 10.00 20.00 54.33 34.00 36.11V5 4.67 6.00 15.00 8.56 12.00 16.33 30.00 19.44V6 7.67 19.00 8.00 11.56 20.33 40.67 54.33 38.44Mean 8.83 13.17 13.67 20.22 33.28 42.72s.e.d.: Spraying=1.023, date of planting=1.193, Variety=2.634, Inter.= 6.134
Main EffectsSpraying Sprayed Unsprayed 11.89 32.07Date of planting D1 D2 D3
14.53 23.22 28.19
Variety V1 V2 V3 V4 V5 V6 21.67 25.22 22.94 23.06 14.00 25.00
The grain yield ha- recorded against the 6 cultivars at Googo is shown in Table 3.20. The interaction effects observed is between spraying and variety, therefore the significant differences in grain yield ha- was as a result of whether the field was sprayed or not. Significant difference was also observed in the planting date main effect. Early planting dates recorded higher yields than the late planting dates.

Table 3.20. Mean grain yield per ha of 6 cowpea lines subjected to 4 planting dates and 2 spray regimes at Googo, UERVariety Sprayed Unsprayed
D1 D2 D3 D4 MEAN D1 D2 D3 D4 MEAN V1 1.055 1.242 1.074 1.123 0.251 0.223 0.165 0.213V2 1.119 1.171 1.025 1.105 0.210 0.314 0.432 0.319V3 1.395 1.244 1.223 1.288 0.230 0.165 0.194 0.196V4 0.905 0.932 0.910 0.916 0.218 0.275 0.199 0.231V5 1.266 1.099 0.910 1.092 0.201 0.210 0.202 0.205V6 1.004 1.037 0.546 0.862 0.252 0.160 0.116 0.176Mean 1.124 1.121 0.948 0.227 0.224 0.218s.e.d.: Spraying=0.0519, date of planting=0.0414, Variety=0.0479, Inter.= 0.1433
Main EffectsSpraying Sprayed Unsprayed
1.064 0.223
Date of planting D1 D2 D3 0.675 0.673 0.583
Variety V1 V2 V3 V4 V5 V6 0.668 0.712 0.742 0.573 0.648 0.519
DiscussionData were collected only at Googo for experiment 2, the trial at Tansia was grazed by stray animals. Generally planting of cowpea between mid July (D1) and early August (D2) was found to be suitable for Upper East Region. All the cowpea cultivars (early to medium maturity) had already matured before the onset of the terminal drought which usually occurs in late September or early October in the region. Drying of the cowpea pods also coincide with the terminal drought when cowpea was planted between mid July and early August. Harvesting at this time reduces seed rotten, hence harvesting of clean seeds which require little or no labour to clean the seeds after threshing. Planting cowpea between mid July and early August was also found to suffer relatively less attack by Maruca vitrata, Thrips and pod sucking bugs. This translated into fewer shrivelled pods and pods with Maruca feeding holes. Grain yields were also found to be higher with planting between mid July and early August than late planting from late August on wards. Relatively frequent raining period between mid July and mid September as compare with fewer raining period (about one month or less) between late August and late October could influence grain yield production. Adequate moisture supply is one of the key factors that contributes to plant growth and development which improves their tolerance to pests attack. Insect pests population build up is also naturally checked by frequent raining days. Late planting of cowpea from late August onwards means that the most critical stages of the plant; flowering and podding will coincide with the terminal drought. This is the time that insects rapidly increase in their population. plants are also relatively weak and vulnerable to attack by pests. Eventually the plants suffer severe attack by insects which results in poor flowering, low pod formation, high rate of pod damage by Muruca and pod sucking bugs and finally low grain yield.
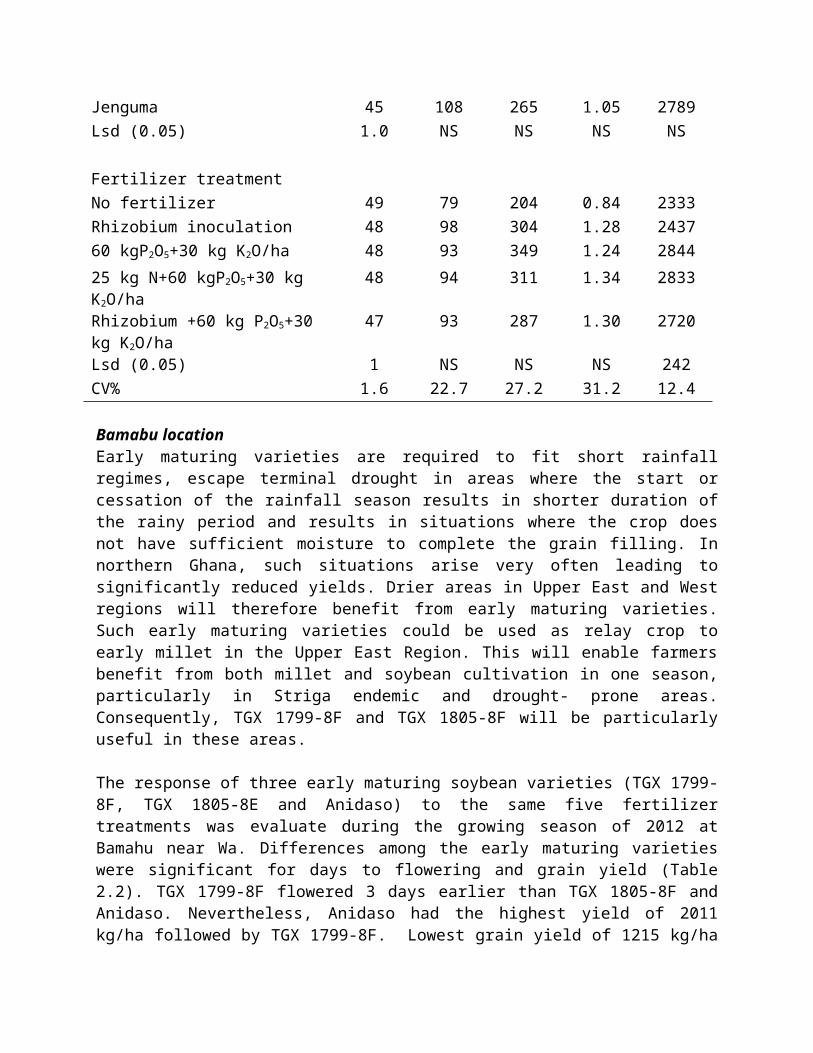
For a profitable cowpea production, unsprayed fields should not be encouraged. It is true that natural effects of frequent raining days, natural enemies and host plant resistance contribute to reduce insect pests build up and damage, integrating these with judicious and timely application of insecticide significantly improves crop performance and grain yield. Songotra, Bawutawuta and the two cultivars from IITA (IT99K-573-1-1 and IT99K-573-2-1) were found to produce significantly higher grain yields in Upper East Region. The Striga resistance of Songotra, IT99K-573-1-1 and IT99K-573-3-2-1 makes them the most preferred choice for the region due to the heavy infestation of Striga seeds in most of the fields in Upper East Region.
Recommendations The following are the recommendations from first year’s results:
1. Timely planting of cowpea between mid July and early August is recommended for farmers in Upper East Region.
2. Judicious and timely application of insecticide at full flowering and full podding in integration with good agronomic practices and creation of conditions that will have adverse natural effects on pests development.
3. IT99K-573-1-1 and IT99K-573-2-1 have been identified as new sources of Striga gesnerioides resistance in Northern Ghana
4. The field resistance of Padi Tuya and Bawutawuta to Striga should be improved and Songotra which is known to be resistant to Striga must be cleaned
Control of insect pests of cowpea in NR (Mumuni Abudulai and Jerry Noboyine)
Results and discussion
Tingoli location in NR
Experiment 1. Evaluation of planting date and cultivar for insect pest management in cowpeaThe results showed significant (P < 0.05) effect of planting date on populations of Maruca vitrata in flowers and thrips in flower buds (Table 3.21). There were more thrips at the last planting dates than the other planting dates. There was also a significant effect of planting date on the number of seeds per pod, percentage pod damage by pod-sucking bugs and cowpea haulm weight (Table 3.22). The third and last planting dates recorded a lower number of seeds per pod compared with the first two planting dates. Percentage pod damage due to PSBs was greater at the last planting date compared with the other planting dates. The number of thrips in flowers and yield were significantly affected by the interaction of spraying by planting date. Yield was similar and more at the earlier planting dates especially when treated with insecticide compared with later plantings.
Table 3.21. Evaluation of planting date and cultivar for insect pest management in cowpea at Tingoli, NRPlanting date No. of Maruca/20 flowers No. of Thrips/20 flower budsMid-July 0.8 b 4.97cLate July 0.8 b 14.9 bMid August 0.2 b 16.9 aLate August 1.3 a 18.7 a

Table 3.22. Effect of planting date and cultivar on number of seeds per pod, percent pod damage and cowpea haulm weight at Tingoli, NRPlanting date No. of seeds/pod % pod damage Haulm weighMid-July 7.4 a 27.0b 2009.3 bLate July 7.2 a 16.9 b 2656.3 bMid August 4.7 b 12.8 b 3654.5 aLate August 0.9 c 86.1a 1903.9 c
Experiment 2. Evaluation of cultivar and spraying regime for insect pest management in cowpeaThere were significant main effects of variety and spraying regime on numbers of thrips in flowers, number of pods per plant, percentage pod damage and grain yield (Table 3.23). Generally, there were more pests infestations at the S0 and S1 treatments compared with the other treatments. These infestations also resulted in significantly higher PSB pod damage at the S0 and S1 treatments resulting in significantly lower yield.
Table 3.23. Evaluation of cultivar and spraying regime for insect pest management in cowpea at Tingoli, NRSpraying regime No. of thrips/20
flowersNo. of pods/plant % Pod damage Yield
S0 12.5a 33.7c 44 a 76.0 cS1 8.9 b 40.3 c 30 ab 188.1bS2 6.9 c 64.9b 28b 349.6 aS3 6.8 c 72.0 a 25b 404.9 a DiscussionThe results demonstrated that planting cowpea within July suffers less insect pressure and resulted in higher yields compared with later plantings. The latter plantings produced lower yields, not only because of intense pest pressure but also because they were also affected by terminal drought. The results also demonstrated that spraying cowpea once would have equal effect as not spraying at all as manifested in the no significance between plots treated once (S1) and untreated (S0) in pest populations and grain yield.. However, spraying twice (S2) at flowering and podding stage or spraying thrice at budding, flowering and podding showed similar effects in lowering pest populations and increasing grain yield. In effect, it is best to spray twice to save the extra cost for the third spray.
Control of insect pests of cowpea in UWR (Shaibu S. Seini and Alhassan Nuhu Jimbani)
Results and discussion
Bulenga in UWR.

Experiment 1. Evaluation of planting date and cultivar for insect pest management in cowpeaThe results showed that effect of planting date on populations of Maruca vitrata in flowers and thrips in flower buds were significant (Table 3.24). There were more thrips and maruca at the last planting dates than the earlierr planting dates. There was also a significant effect of planting date on the number of seeds per pod, pod-sucking bugs and cowpea haulm weight (Table 3.25). The third and last planting dates recorded a lower number of seeds per pod compared with the first two planting dates. The number of thrips in flowers and yield were significantly affected by the interaction of spraying by planting date. Yield was similar and more at the earlier planting dates especially when treated with insecticide compared with later plantings.
Table 3.24. Evaluation of planting date and cultivar for insect pest management in cowpea at Bulenga, UWRPlanting date No. of Maruca/20 flowers No. of Thrips/20 flower budsMid-July 0.7 b 15.8bLate July 0.7 b 16.8 bMid August 1.2 a 19.0 aLate August 1.4 a 19.5 a
Table 3.25. Effect of planting date and cultivar on number of seeds per pod, percent pod damage and cowpea haulm weight at Bulenga, UWR.Planting date No. of seeds/pod % pod damage Haulm weightMid-July 6.9 a 29.4b 2123.2 bLate July 7.1 a 26.7 b 2446.1 bMid August 3.9 b 25.9 b 3255.8 aLate August 0.8 c 90.2a 1764.6 c
Experiment 2. Evaluation of cultivar and spraying regime for insect pest management in cowpeaMain effects of variety and spraying regime were significant on numbers of thrips in flowers, number of pods per plant, damage and grain yield (Table 3.26). Generally, there were more pest infestations at the No spray (S0) and Single (S1) treatments compared with the other treatments. These infestations resulted in significantly lower yield as shown in the table below.
Table 3.26. Evaluation of cultivar and spraying regime for insect pest management in cowpea at Bulenga, UWR.Spraying regime No. of thrips/20 flowers No. of pods/plant Yield (kg/ha)S0 18.5a 23.3c 56.0 cS1 11.1 b 32.4 b 126.4bS2 7.7 c 58.9a 422.3 aS3 7.8 c 63.0 a 465.6 a
Kaleo in UWR
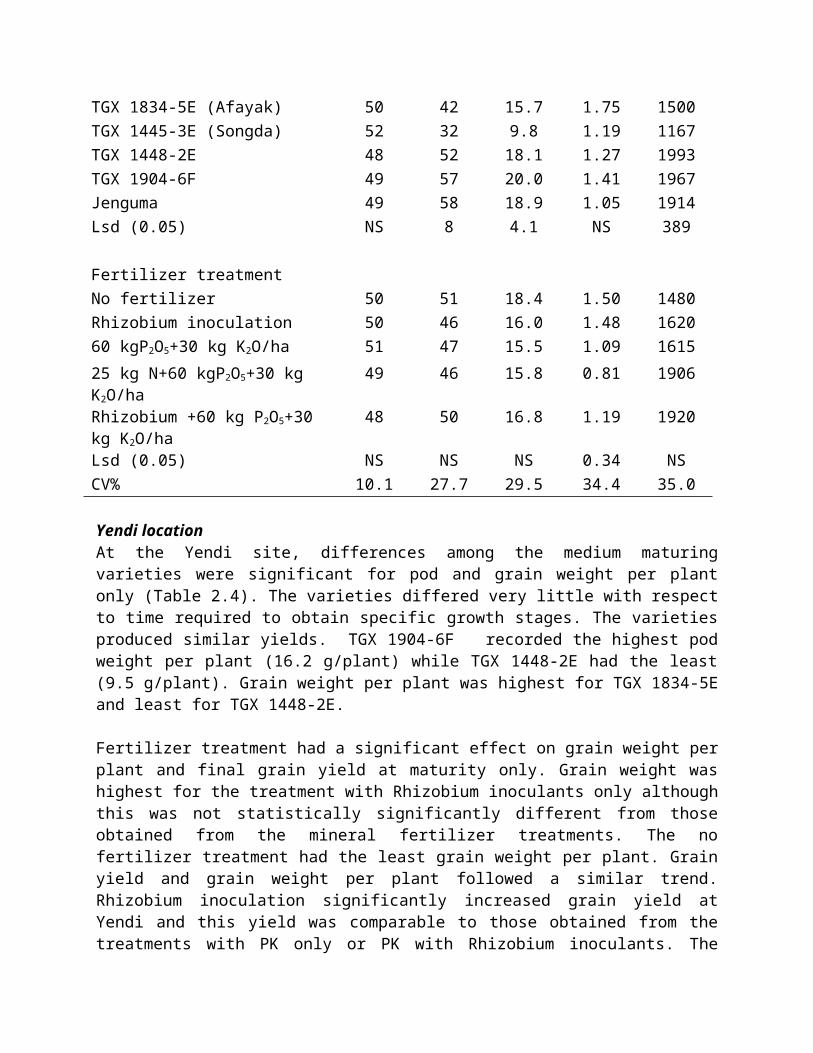
Experiment 1. Evaluation of planting date and cultivar for insect pest management in cowpeaThe results showed that effect of planting date on populations of Maruca vitrata in flowers and thrips in flower buds were significant (Table 3.27). There were more thrips and maruca at the last planting dates than the earlierr planting dates. There was also a significant effect of planting date on the number of seeds per pod, pod-sucking bugs and cowpea haulm weight (Table 3.28). The third and last planting dates recorded a lower number of seeds per pod compared with the first two planting dates. The number of thrips in flowers and yield were significantly affected by the interaction of spraying by planting date. Yield was similar and more at the earlier planting dates especially when treated with insecticide compared with latter plantings.
Table 3.27. Evaluation of planting date and cultivar for insect pest management in cowpea at Kaleo, UWRPlanting date No. of Maruca/20 flowers No. of Thrips/20 flower budsMid-July 0.8 b 7.6cLate July 0.7 b 16.4 bMid August 1.5 a 18.6 aLate August 1.4 a 19.0 a
Table 3.28. Effect of planting date and cultivar on number of seeds per pod, percent pod damage and cowpea haulm weight at Kaleo, UWR.Planting date No. of seeds/pod % pod damage Haulm weighMid-July 7.4 a 28.6b 2325.2 bLate July 7.2 a 26.9 b 2506.3 bMid August 4.4 b 27.6 b 3115.2 aLate August 0.8 c 88.8a 2164.6 c
Experiment 2. Evaluation of cultivar and spraying regime for insect pest management in cowpeaMain effects of variety and spraying regime were significant on numbers of thrips in flowers, number of pods per plant, damage and grain yield (Table 2.29). Generally, there were more pest infestations at the No spray (S0) and Single (S1) treatments compared with the other treatments. These infestations resulted in significantly lower yield as shown in the table below.
Table 3.29. Evaluation of planting date and cultivar for insect pest management in cowpea at Kaleo, UWRSpraying regime No. of thrips/20 flowers No. of pods/plant YieldS0 18.5a 25.4b 52.9 cS1 17.1 a 30.2 b 154.2bS2 7.9 b 60.4a 471.3 aS3 7.4 b 61.6 a 472.6 a
DiscussionThe results show the same general trend in the two low locations.The results indicate that planting cowpea within July was the best option as compared to August. Planting cowpea in July

resulted in higher yields due to lesser pest pressure. The lower yields in August plantings were due mainly to the effect of terminal drought as well as increased pest pressure. The results also demonstrated that spraying cowpea once would have similar effect as not spraying hence the no significance between plots treated once (S1) and untreated (S0) in pest populations and grain yield.. However, spraying twice (S2) at flowering and podding stage or spraying thrice at budding, flowering and podding showed similar effects in lowering pest populations and increasing grain yield. The indication is that a third spray can be discounted with as no economic gains may accrue from that.
ReferencesJackai LEN, Singh SR, Raheja AK, Wiedijk F. (1985). Recent trends in the control of cowpea
pests in Africa. In: Singh SR, Rachiel KO (eds.) Cowpea research, production and utilization. Chichester (UK): Wiley and Sons Ltd. p.233–246.
Singh BB, Sharma B (1996) Restructuring Cowpea for higher yield. Indian J, Genetics, 56:389-405
Tarawali SA, Singh BB, Peter M, Blade SF (1997). Cowpea haulms as fodder. In: Singh BB, Mohan Raj DR, Dashiell KE, Jackai LEN (eds.) Advances in Cowpea research. Copublication of the IITA and JIRCAS. Ibadan, Nigeria.
B. ON-FARM TRIALS
Activity 1. Participatory on-farm testing of drought tolerant maize lines in the northern region of Ghana using Mother and Baby approach (J.M. Kombiok)
IntroductionThe development of new maize varieties is the joint efforts of Scientists from the National Research Systems (NARS) of the individual countries in collaboration with international Agricultural Research Centres such as IITA. Due to the breakdown of the genetic potential of the old crop varieties coupled with the ever decreasing amount and the erratic nature of the rainfall in the savanna region, it has become necessary to develop varieties to cope with this situation. These new releases which may be early maturing or drought resistant are therefore made to replace the existing ones used by farmers. However, before these lines are officially released as varieties, they are tested widely with farmers (on-farm) to ensure that they are not rejected. SARI in collaboration with IITA has put in place a breeding programme for stresses including drought and Striga tolerance. Even though the process of breeding is an on-going, there are always some promising drought/Striga tolerant maize lines each year that could be advanced for further testing with farmers within the Savanna ecological zone to validate the results obtained from the on-station trials for the past years. It is therefore expected that the results of the participatory on-farm evaluation including farmer assessment of the varieties will generally serve as guide for the breeders to fine-tune or re-strategize their breeding programs. In addition to this, the participatory on-farm testing of the varieties would also facilitate the adoption of these varieties by farmers when they find them suitable to their needs.
Objectives:

The objectives of the study were: To evaluate and select drought/striga tolerant varieties/hybrids by the use of mother-baby
model approach to on-farm research. To collect data on the performance of these lines on-farm to support the Maize Breeding
Programme of SARI, Ghana for release to farmers.
Materials and Methods A total of 2 mother trials of medium maturing varieties and 10 baby trials were planted between June and July, 2012 at two (2) sites around Nyankpala and Damongo within the Guinea savanna zone of Ghana. The only mother trial established at both sites was made up of 4 new varieties, a released variety and farmers’ variety. The new varieties are: IWD STR C1, DT SYN 1 F2, DT SRW CO F2 and TZL COMP. -1-W-; a released variety (Obatanpa) and farmers’ variety (FV). Each plot contained six rows six meters long and replicated three times at each location. Plant spacings of 80m x 40m were used for the medium varieties.
Five baby trials each of Extra-early, early and medium were planted alongside each of the mother trials (medium varieties) at both sites. Extra-early, early and medium maturing babies trials contained 3 drought tolerant varieties/hybrids and a local check. Baby trials were not replicated and but were put in a plot of 20 m x 20 m each. Field days were organized at both mother trial sites when maize were about 90 days old. An average of 80 farmers attended each field day. Farmers were allowed to select their preferred varieties based on their own selection criteria (e.g. grain type, maturity group, and varietal reaction to biotic and abiotic stresses). Farmers were also enlightened on the recommended crop management practices for maize production during the field day.
Results and Discussions
Medium maize varieties- Mother TrialComparatively, with the exceptions of Obatanpa and IWD STR C1, yields of the medium maturing varieties were higher in Nyankpala than in Damongo (Table1). These differences in yields could be due to differences in the amount and distribution of rainfall during the 2012 cropping season..Table 1: Yield of medium maize varieties tested at two sites in Northern region of GhanaVariety Mean yield kg/ha
NyankpalaMean yield kg/haDamongo
TZL COMP. 1 WDT SR W CO F2ObatampaF.VDT SYN 1 F2IWD STR C1LSD(0.05)
4281.34156.33843.83781.336253531.3 (NS)
2500.003500.004040.002483.302916.704333.30836.91
FV =Farmers’ varieties

At the Nyankpala site, yields ranged from 3.5 t/ha (IWD STR C1) to 4.2 t/ha for TZL COMP. 1 W but there were no significant differences in the yields of maize among the varieties. The farmers’ variety which was also observed to be an improved variety but mixed had similar yield. At Damongo, there were significant differences among the yields of maize. The lowest maize yield was obtained from TZL COMP. 1 W which was similar to the yields obtained from the farmer’s variety and DT SYN 1 F2. The released variety (Obatanpa) recorded the highest yield which was not also different from the yield of IWD STR C1 but both were significantly higher than the rest of the varieties tested.
Baby trials
Medium VarietiesTwo medium maize new varieties were tested at the two sites (Damongo and Nyankpala) with farmers’ varieties as checks. The results of the yields of maize showed that there were no significant differences among varieties at both sites (Table 2).
Table 2: Yield of medium maize lines tested at three sites in Northern region of GhanaMaize Varieties Mean Yield (kg/ha)Variety Nyankpala DamongoDTSR W COF2ObatampaFVLSD(0.05)
3928.502898.904017.40NS
3444.402444.403511.10NS
Early Maize varieties
Early maturing varieties (TEE W-DT STR C4 and Aborohema) were also tested at the two sites with farmers’ varieties as checks. The results of the yields of maize showed a similar trend at both sites tested even though yields were lower than the medium varieties. There were also no significant differences in maize grain yields observed among the four varieties tested at each of the sites (Table 3).
Table 3: Yield of early maize varieties tested at two sites in Northern region of Ghana
Maize Varieties Mean Yield (kg/ha)Variety Nyankpala DamongoF.VAborohemaTZE W-DT STR C4LSD(0.05)
3911.103213.302702.20NS
1666.702222.203000.00NS
The varieties performed better at the Nyankpala site than the Damongo. However, TZEE WDT STR C4 was more stable in terms of grain yield than the rest of the varieties.
Extra-Early Maize varitiesThe results of three extra-early varieties tested with Abontem are presented in table 4. Even though yields are generally higher in Myankpala than Damongo, no significant differences were observed among the varieties. Even though yields of these varieties including the farmers’ checks were higher in Nyankpala than Damongo, there were no significant differences in grain yield among the varieties. In general, all the maize lines tested performed better under the Nyankpala conditions than in Damongo where rains were more unstable and came in smaller quantities compared to Nyankpala.
Table 4: Yield of Extra-early maize varieties tested at two sites in Northern region of GhanaMaize Varieties Mean Yield (kg/ha)Variety Nyankpala Damongo2004 TZEE W POP STR C4Abontem2000 SYN EE W STR99 TZEE Y STRLSD(0.05)
3306.703164.462986.702836.30NS
2666.701666.702648.502955.60NS
Farmers’ preferenceDuring field days both at the vegetative phase and at harvesting, Farmers were made to select the lines tested in the baby trials as contained in the mother trials at each site. In the first place, the farmers chose the early as against the intermediate lines with the reason that rains do not come early and are now short in duration therefore they need short duration varieties to cope with this change. Even though at each site the yields of both the intermediate and early were not statistically different, farmers’ preferences among the lines were made. For the intermediate, the results of the exercise conducted showed that farmers at all the sites preferred DT-SR-W-COF2 to the other intermediate maturing varieties. This is the second year the farmers expressed interest in this material over the others in the region. The selection was based on crop features and characters considered included plant stand, cob size, grain size, and drought/striga resistance.For the extra earl and early maturing varieties, TZE W-DT STR C4 and 2004 TZEE W POP STR C4 respectively were preferred to the other varieties for reasons such as earliness and yield.
Activity 2: Diffusion of Improved Sorghum Varieties in Northern Ghana through Mini-packs (I.D.K. Atokple)
Executive SummaryIn a collaborative research effort, four new improved sorghum varieties were evaluated on-farm in four districts across of the Upper West and Northern regions of Ghana involving thirty eight farmers. Each farmer bought a 200g seed sachet of the improved varieties and planted along with their cultivated varieties during the 2012 planting season. In terms of grain yield, all the improved sorghum varieties out yielded the farmers’ varieties across all locations. The variety, Soumalemba which had the highest grain yields (range 1987 -2015kg/ha) across all locations
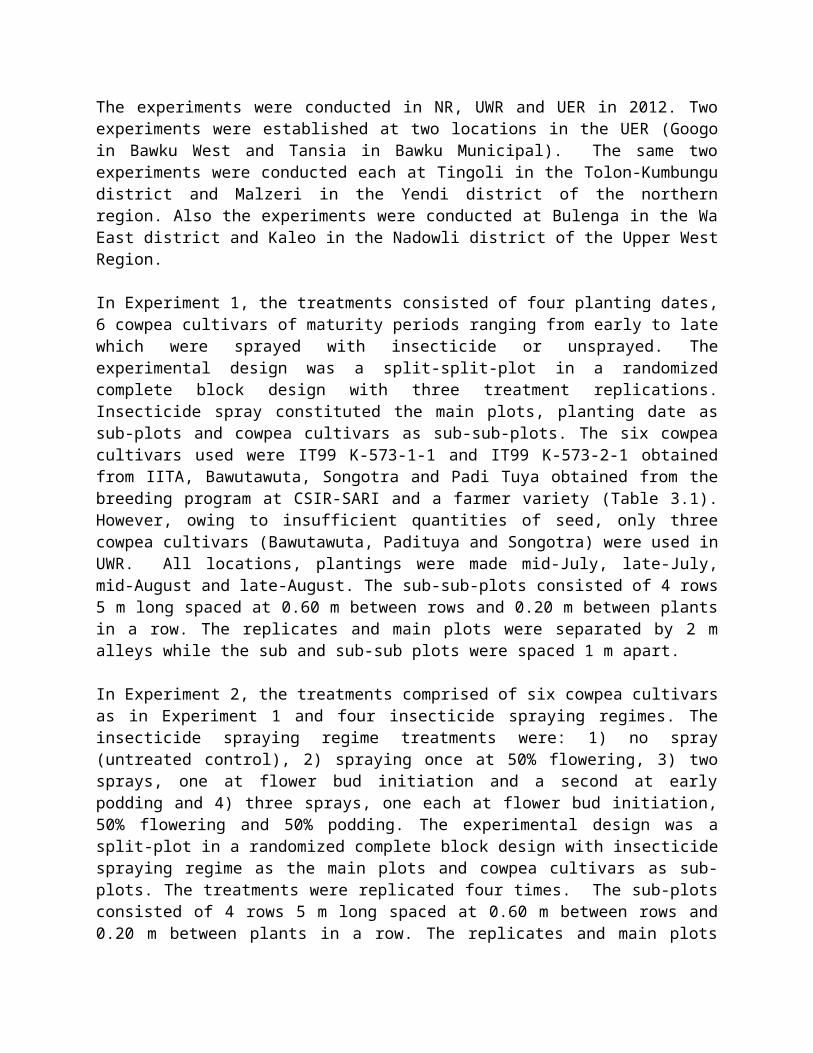
was also the most stable. Whilst the varieties, Boboje and Lata 3 also exhibited some relative stability, Doua G and the farmers’ varieties (range 1345-900 kg/ha) were quite variable across the locations. The most important traits of interest for acceptability and adoption by farmers included high yield, maturity, grain quality and threshability. As subsequent evaluations are planned, it is hoped that the strategy will stimulate the adoption and facilitate the release of such sorghum varieties for commercialization production. The collaboration with agro-input dealers will help expand the selling points within the communities and across the regions
IntroductionIn the context of agriculture intensification in West Africa, the use of improved variety seed is seen more than ever as a necessary measure for increasing production in traditional cereals such as sorghum and pearl millet. CSIR-SARI, Ghana in collaboration with ICRISAT, Mali, has improved varieties and hybrids of sorghum being developed. The performance of such improved varieties and hybrids under farmers’ conditions are essential for the acceptability, release and adoption of such materials. Therefore, in attempt to increase sorghum production and productivity in Northern Ghana under the Africa Rising Project, four improved sorghum varieties were introduced to farmers. The objectives were (i) to increase awareness of improved sorghum varieties currently produced or introduced from the West African sub-region, (ii) to facilitate the evaluation of the improved varieties by farmers under their own conditions in comparison with their landraces and (iii) to improve farmers’ access to seeds of improved varieties.
MethodologyThe mini-packs (about 200g) of 4 improved sorghum varieties, Soumalemba, Boboje, Lata 3 and Doua G were sold at GH₡0.50/pack to farmers who were genuinely interested in testing and experimenting with the new varieties (Plate. 1). The farmers who were also not provided with any other input planted these varieties alongside his/her local variety. The trials were maintained by the farmers throughout but pertinent data were collected by the scientists.
Plate 1. Selling Sorghum seeds to farmers in various Communities
Concurrent with the on-farm evaluations, the seeds of the four sorghum varieties were multiplied on one-acre plot each. Field visits were organized to interact with the farmers for their assessment of these introduced varieties.

Results and DiscussionsThirty eight (38) mini bags were sold to 38 farmers across the four districts (Table 1). It is noteworthy that the farmers’ interest to buy the sorghum seeds was quite innovative and unprecedented. Hitherto, seeds of improved crop varieties were provided to farmers free of charge and even with some inputs.
Table 1. Distribution of farmers from the selected Districts
NO. DISTRICT
COMMUNITY NO. OF FARMERMale Female
1 Yendi Susungbon 10
Gmafudoe 6 4
2 Tolon Kpalsogo 3
Dimabe 3
3 Kumbugu Limo 6
4 Sissila East
Silbelle 6
Total 38
In terms of grain yield, all the improved sorghum varieties out yielded the farmers’ varieties across all locations (Fig. 1). The variety Soumalemba which had the highest grain yields (range 1987 -2015kg/ha) across all locations was also the most stable (Fig. 2). Whilst the varieties, Boboje and Lata 3 also exhibited some relative stability, Doua G and the farmers’ varieties (range 1345-900 kg/ha) were quite variable across the locations (Fig. 2).
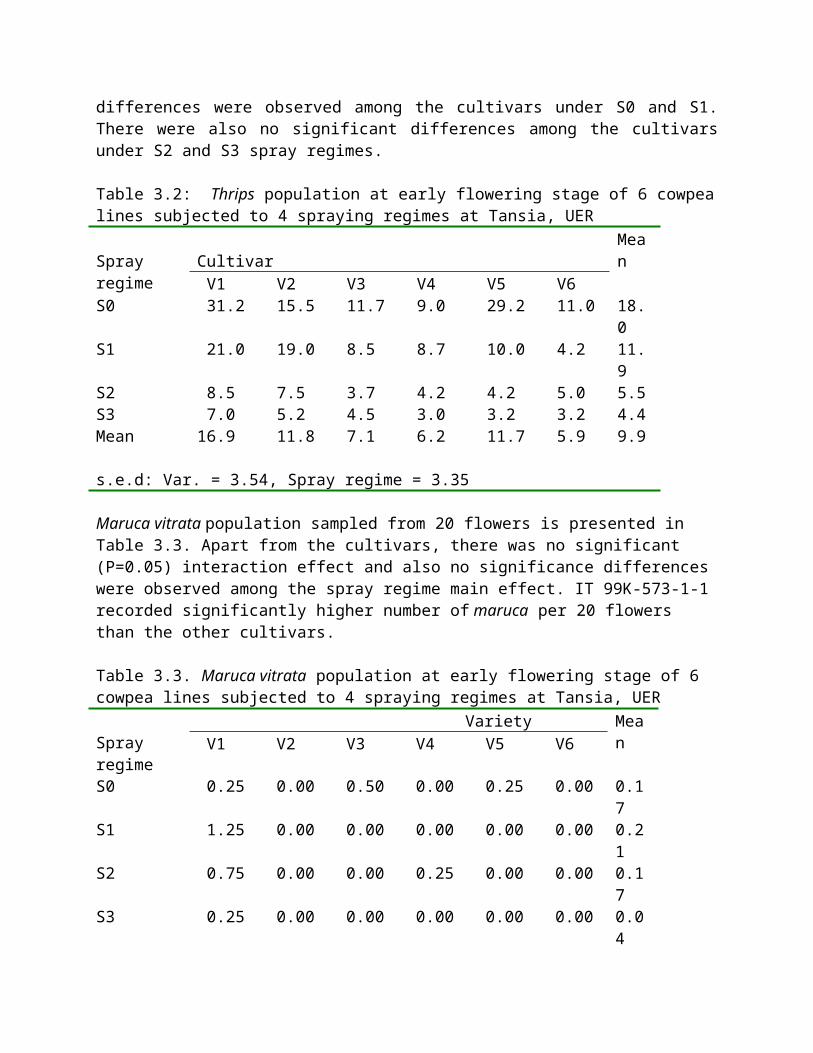
1 2 3 4 5 6 7 8 9 10 11 12 13 14 15 160
500
1000
1500
2000
2500
Fig. 1. Relative Grain Yields of Sorghum Varieties Across Locations
Improved Var Farmer Var
Farmers
Grai
n Yi
eld
kg/h
a
Soumalemba, Boboje, Lata 3 Doua G FV0
500
1000
1500
2000
2500
Fig. 2. Variations of Sorghum Grain Yields across Locations
YendiDimabiKumbuguSilbelle
Grai
n Yi
elds
kg/
ha

From the field days, it was indicated that the most important criteria considered for the selection of varieties are high yields, early maturity, grain quality and threshability. All the farmers consequently had expressed interest in the improved sorghum varieties ans are willing to repeat the evaluations in 2013.
The way forwardWith the multiplication of seeds of the test materials, the evaluations will be up-scaled to other districts and communities in 2013 cropping seasons. Through innovative platforms, negotiations will be advanced to involve the various local input dealers in the target communities. The seeds multiplied on-station will thus be sold to the farmers through the input-dealers. It is important to identify elite farmers to train in seed production.
C. BREEDER SEED PRODUCTION
Activity C1. Breeder seed production of three drought and Striga tolerant maize varieties jointly released by SARI and CRI in 2010 (PI: M.S. Abudulai and Alidu Haruna)
Objective: to produce and make available breeder seed of recently released drought tolerant maize varieties for project activities in subsequent seasons
Introduction The importance of seed provision for agricultural development cannot be overstated. Apart from environmental factors, access to improved seed and inorganic fertilizers is crucial for determining food and incomes of farmers. Lack of availability of improved seeds has very often been cited by farmers and other stakeholders as a major constraint affecting maize productivity and production in Ghana. Seeds are first and foremost, the source of most food and as such are the most crucial components of agriculture. Apart from being a key issue in addressing agricultural development and food security, it is also a commodity that can promote economic development and entrepreneurship. Seeds of improved varieties would need to be multiplied, distributed and cultivated by farmers for benefits of the improved varieties to be realized. In general, improving smallholder farmers’ access to new high yielding varieties and hybrids may be considered as one major approach to achieve increased productivity and production of maize, leading to poverty alleviation and food security enhancement in the country. Regrettably, maize certified seed produced in Ghana meets only 10% of total improved seed requirement of the country, leaving a shortfall of 90% (SRID, 2005). A number of improved drought tolerant open-pollinated and hybrid maize varieties have been developed and released for commercial production in Ghana, with a few more in the pipeline. However, the varieties developed have not achieved the expected impact and patronage due partly to the lack of availability of certified seeds of these varieties on the market, and lack of resources for the promotion and dissemination of the varieties so developed. To meet the demands of maize farmers for certified seeds of the released drought tolerant maize varieties, there is the need to up-scale breeders’ and pre-basic seeds production of these improved varieties in the country. The goal of this project is to bridge the gap of the shortfall in certified seed availability in Ghana by increasing and maintaining the physical and genetic purity of breeders’ and pre-basic seeds of drought tolerant varieties of maize in the country.
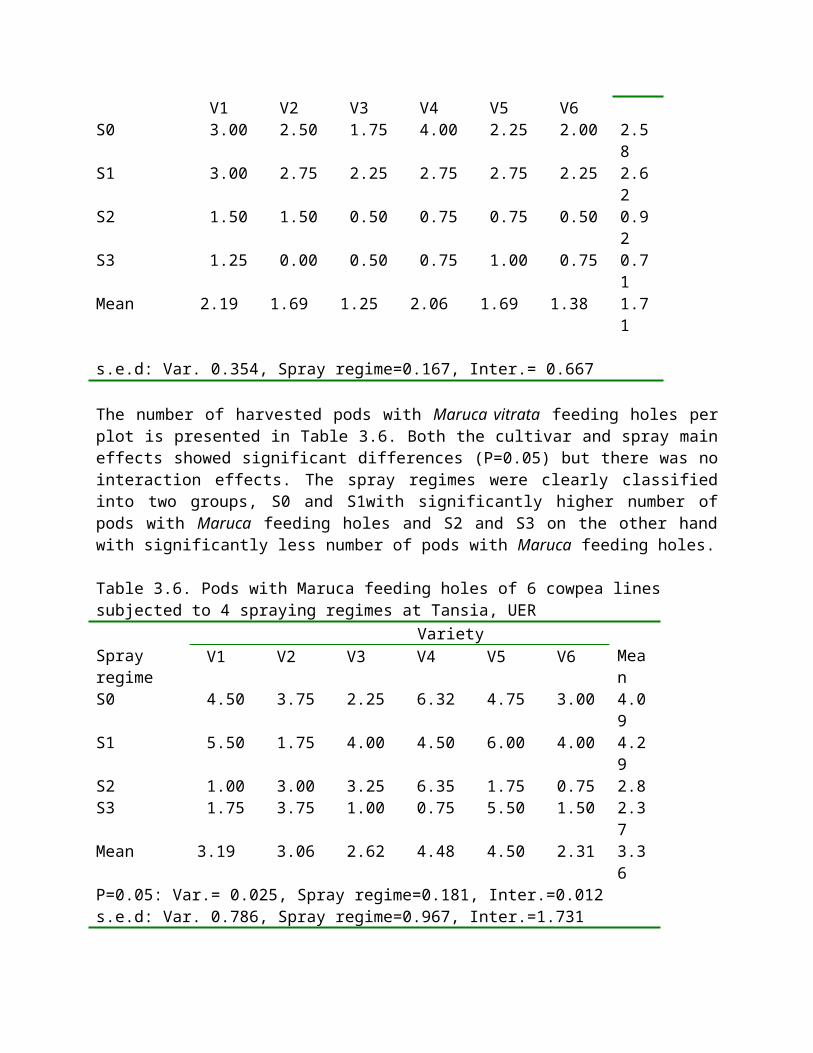
Procedures Isolated fields could not be secured, hence the half-sib mating with hand pollination method for maintaining and producing breeder's seed of an open-pollinated variety was used. Each variety was grown to a plot as an open-pollinated field, with no separation into male and female rows. Off-type, variant and diseased plants were rogued. Controlled hand-pollinations were made by bulking pollen from all typical plants and applying this to the female flowers of selected typical plants. About 500 to 600 plants of each variety were pollinated. The seed from about 400 purposefully selected typical, disease-free plants with desirable cobs were bulked for each variety. Seed from the central portions of the cobs were shelled and maintained as breeder’s seed.
Result Breeder’s seed fields were established at Nyankpala for the production of breeder’s seed of the newly released drought tolerant maize varieties in support of on-farm trials and community-based seed production schemes. Yield quantities and area planted are presented in Table 1.
Table 1: Production figures for maize breeder seed
Crop Variety Area (ha) Yield (kg)
Omankwa TZE-W POP STR QPM 0.32 40
Aburohemaa EVDT-W 99 STR QPM C0 0.40 100
Abontem TZEE-Y POP STR QPM 0.40 120
Total 1.12 260
DiscussionTimeliness and skilfulness are of utmost importance in production of breeder’s seed of open-pollinated maize varieties under controlled hand-pollination. Most summer crops like maize yield more when planted early than late. The timing and skill of collecting of pollen and applying the pollen on the silk of the female flowers play a crucial role in seed setting and productivity. Release of Funds for this activity was a bit late. The carefulness and accuracy of applying pollen to the silk of female flowers might also have not been up to standard. These might have resulted in the low yields recorded. It is hoped that adequate funds will be made available for this activity the next time round and released on good time to ensure better results.
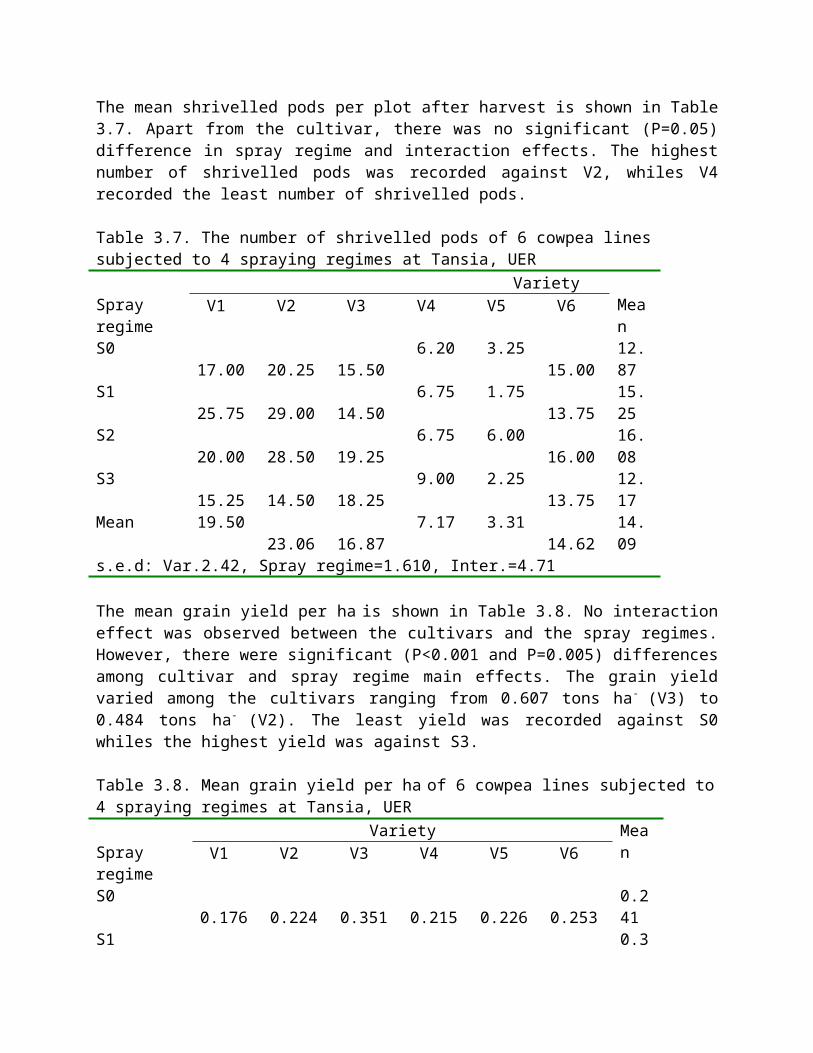
Activity C2: Cowpea breeder seed production (Haruna Mohammed, M. Abudulai, Yaw Owusu and Memunatu Issahaku)
Background/Justification: Cowpea (Vigna unquiculata (L) Walp) is the second most important legume crop in northern Ghana after groundnut. An average of 143,000 MT is produced annually on about 156,000 ha. Ghana is the fifth producer of cowpea in Africa. Cowpea yields (1.0 kg/ha) in this country are the 4th highest in the world, after Peru, Cameroon and Uganda. Ghana also has the fastest growing production of the crop in Africa. Annual rates of growth for cowpea for area, yield and production for the period from 1985-7 to 2005-7 were -0.1%, 39.6%, and 39.8, respectively. It has been projected that the rate of growth for the period between 2010 and 2020 would be 11.1% for cowpea. Unavailability of improve seed is a major constraint to cowpea production in northern Ghana. Despite the development of improved cowpea varieties by the Savanna Agricultural Research Institute (SARI), many farmers do not have access to these varieties partly due to inadequate seed as a result of inability of research institutes to produce adequate quantities due to logistical and financial constraints. Breeder seed is a vital component of the seed industry because it is the basic seed that is obtained from the originating plant breeder/institute for the production of foundation and certified seed. The production and maintenance of breeder seeds of release varieties is necessary to ensure genetic purity of these varieties over time. In Ghana, research institutes are mandated to produce breeder seed of released varieties to supply foundation seed growers leading to certified seed production to supply farmers for increase production and productivity.
PurposeThe project was to produce adequate quantities of improve cowpea varieties with dual purpose properties (high grain and fodder yields) to effectively integrate into livestock production systems for increase crop and livestock production. It also seek to organize and train selected cowpea farming communities on improved production techniques and link cowpea farmers and farmer groups to private seed companies and Seed Producers Association of Ghana (SEEDAPG).
Specific objectives1. Enhance the availability of adequate improved cowpea seed to private seed companies
and farmers.2. Increase the accessibility of farmers to improved varieties for increased production and
productivity,3. Enhance and accelerate crop and livestock integration systems through increase
production of dual purpose cowpea.
Materials and methodsBreeder seed of two improved cowpea varieties (Songotra and Padi-tuya) were produced during the 2012 cropping season at Nyankpala (Tolon/Kumbungu ditrict) and Malzeri (Yendi district).These varieties gave higher grain and fodder yields with resistance to aphids and striga gesnerioides which are major constraints to cowpea production in northern Ghana and are therefore appropriate varieties that can fit into crop and livestock integration systems. Two acres of Padi-tuya and one acre of Songotra was put under cultivation at Nyankpala (Tolon/Kumbungu

district) whilst at Malizeri (Yendi district), two acres of Padi-tuya was cultivated. At both locations the land was ploughed, harrowed and ridged. Planting was done at spacing of 60 cm between rows and 20 cm between plants in a row. Fertilizer was applied at rate of 25-60-30 of urea, triple super phosphate (46% P2O5) and muriate of potash (60% K2O). Lambda cyhalothrin (Karate 2.5 EC) at rate of 60 mls per 15-L knapsack sprayer was applied at vegetative, pre-flowering and pod formation stages to effectively control insect pests. Weeds were controlled at four and six weeks after planting using a hand hoe. Plants were harvested when pods were 95% dry. Threshing was done manually by beating harvested pods with a stick.
Results and DiscussionThree hundred kilograms (300 kg) of Songotra and Padi-tuya varieties was produced (Table 2). This quantity was enough to cultivate twelve (12) hectares of foundation seed and fifteen (15) hectares certified seed and over 30,000 smallholder farmers will indirectly benefit from the improve seed to increase production and productivity in the next cropping season. The seed has been stored in thematic triple bags and will be distributed to foundation seed growers for cultivation this season. This will help promote and disseminate these improved seed and enhance farmers’ accessibility of these varieties for increase cowpea production.
Table 1. Characteristics of two varieties and quantity of seed produced
Variety Name
Yield potential
Quantity of seed produced
(Kg) Special Attribute
Grain yield (kg/ha)
Fodder yield (kg/ha)
Maturity (days)
Songotra 2,000 3,600 60-65 200 (N’la)High yielding, striga resistance
Padi-tuya 2,400 5,400 65-70
300 (200 kg at Yendi and 100 kg at N’la)
Higher grain and fodder yields, moderately resistant to aphids and striga
Concluding remarksThe project will continue to produce large quantities of breeder seed of improve cowpea varieties if assisted with funds and other logistics. About 20% of the average national cowpea seed demand of 63,000 is met and the huge gap will have to be address through a rigorous seed production and delivery system. The project is linked with the entomology unit and the Soil Health Project (SHP) to evaluate existing cowpea lines for resistance to major pests and their responsiveness to artificially produced inoculants. Through our collaboration with IITA, fifteen dual purpose cowpea lines were evaluated and promising lines will constitute entries for on-farm participatory trials and demonstrations.
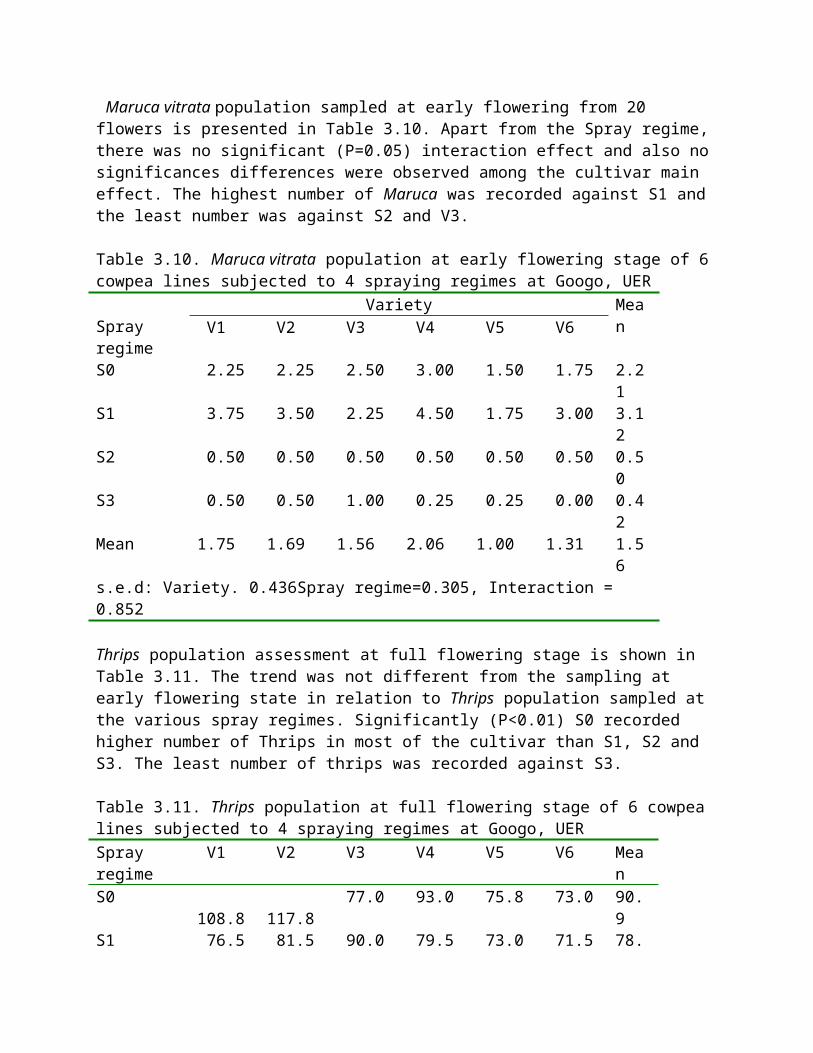
Activity C3: Breeder Seed Production of Soybean (N. N. Denwar)
IntroductionSoybean cultivars Jenguma and Quarshie have emerged as the most cultivated varieties in northern Ghana due to their resistance to pod shattering (allowing farmers time to harvest their staple crops first before attending to soybean) and high yield. Demand for soybean grain has been growing astronomically over the past few years due to a proliferation of soybean processing plants in the country. The crop has also been identified as a poverty alleviation crop and its cultivation is being encouraged and promoted in the country, especially in the breadbasket area of Northern Region, leading to shortfalls in certified seed supplies. Demand for foundation seed by private seed companies has thus grown, making it imperative for SARI to increase its production of breeder seed. The purpose of the project was to produce breeder seed of the commercial varieties Jenguma and Quarshie in order to meet the increasing demand for soybean seed in the breadbasket area of northern Ghana.
Breeder seed field of Variety Jenguma in Nyankpala, 2012
Pod damage (brown, unfilled pods) by pod sucking bugs
Materials and methodsSoybean breeder’s seed fields were established at Nyankpala for the production of breeder’s seed of two non-shattering soybean varieties in support of on-farm trials and community-based seed production schemes. Yield quantities and area planted are presented in Table 1. One hectare (1.0 ha) of land, from the original two hectares planned for Jenguma and Quarshie, was put to cultivation of Jenguma during the cropping season of 2012 at Nyankpala; due to competing programs also requiring land for various projects. Land was ploughed, harrowed and ridged. Fertilizer was applied at the rate of 25-60-30 kg/ha of N-P2O5-K2O two weeks after emergence and later top-dressed with additional compound fertilizer due to excessive run-off and leaching as a result of torrential rains on coarse, sloping land. Weed control was by hand weeding three, six and eight weeks after emergence, due to persistent weed growth. Pod sucking bugs were controlled at podding using standard insecticides. At maturity, whole plants were cut from the base and transported to the drying platform where the produce was left to dry and later threshed by hand using sticks. The seed was separated from the haulm by hand winnowing and the final produce bagged in plastic bags and weighed before storage.
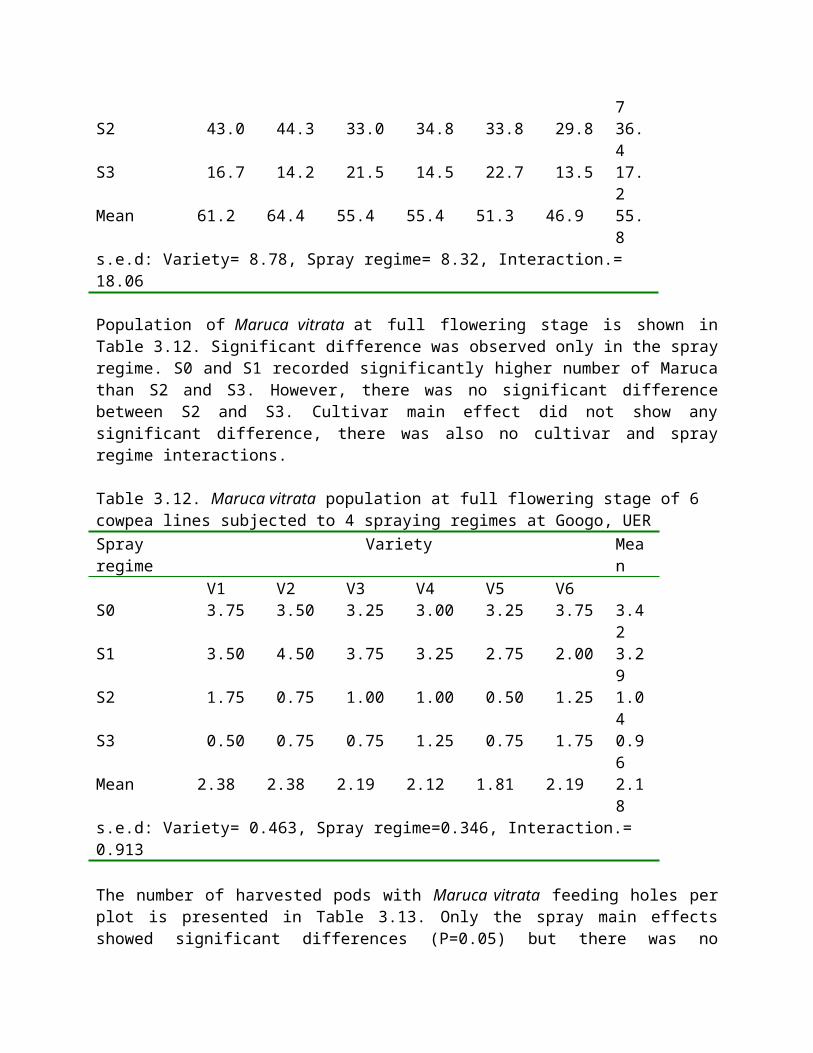
ResultsThe performance of the crop on the field was impressive and pod set was above average. However, due to continuous rainfall until the end of October seed quality was adversely affected by rain falling on harvested produce at the drying platform. Thus, a significant percentage of the seed harvest was mouldy and was discarded. Worst of all, a December 11 night rain (4.8 mm) did the most damage. Eventually, only 600 kg of seed of good quality was obtained from an estimated 1500 kg.
DiscussionBreeder seed is the starting point of any seed industry and the need to have adequate quantities of good quality cannot be overemphasized. For northern Ghana, SARI is the only producer of breeder seed of the various crops. This puts on it a tremendous responsibility to ensure that breeder seed is available in sufficient quantities and quality to meet the ever-increasing demand. And with the imminent rolling out of the USAID Feed the Future project in the breadbasket area of northern Ghana even more demand for improved seed of various crops is anticipated. Without doubt, SARI needs an infrastructural overhaul from the very cross blocks to combine harvesters of soybean and other crops, to seed processing and cold storage. At the present, all of the soybean production processes are carried out manually, mostly by malnourished women already overburdened with other domestic social responsibilities. To ensure the needed growth in the emerging soybean industry, production processes would need to increasingly involve simple machinery and farmer education on usage and maintenance. Overall, there is a bright future for the soybean industry in Ghana as a whole but the necessary inputs and efforts must come into play, and soon.
Table 1: Production figures for maize breeder seed
Variety Area (ha) Yield (kg)
Jenguma 600
Quarshie 200
Total 800
Harvested soybean left to dry in the open awaiting threshing A woman gathers threshed soybean
for winnowing
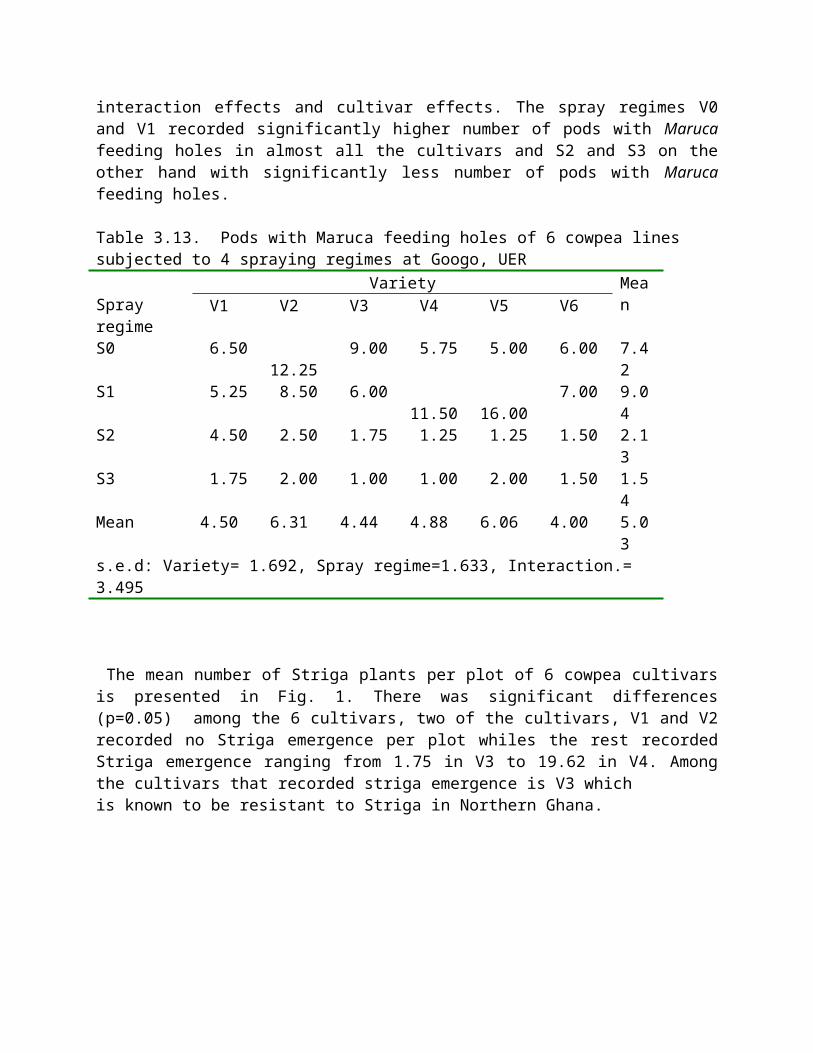
SARI’s only screen house yet to be rehabilitated for crossing work by breeders.
Pod-set in Jenguma, Nyankpala 2012