Embed Size (px)
Citation preview

Energy and Power Engineering, 2010, 2, 291-297 doi:10.4236/epe.2010.24041 Published Online November 2010 (http://www.SciRP.org/journal/epe)
Copyright © 2010 SciRes. EPE
The Experimental Investigation of Recirculation of Air-Cooled System for a Large Power Plant
Wanli Zhao1, Qiyue Wang2, Peiqing Liu1 1Moe’s Key Lab. for Fluid Mechanics, Beijing University of Aeronautics & Astronauts,
Beijing, China 2Department of Myanmar Corperation, CPI Yunnan International Power Investment
Co. Ltd., Kunming, China E-mail: [email protected], [email protected], [email protected] Received June 19, 2010; revised July 6, 2010; accepted August 16, 2010
Abstract The paper introduces thermal buoyancy effects to experimental investigation of wind tunnel simulation on direct air-cooled condenser for a large power plant. In order to get thermal flow field of air-cooled tower, PIV experiments are carried out and recirculation ratio of each condition is calculated. Results show that the thermal flow field of the cooling tower has great influence on the recirculation under the cooling tower. Ameliorating the thermal flow field of the cooling tower can reduce the recirculation under the cooling tower and improve the efficiency of air-cooled condenser also. Keywords: Direct Air-Cooled Condenser, Thermal Flow Field, Recirculation, PIV Experiment, Power Plant
1. Introduction
Recently years many large direct air-cooled condenser (ACC) has been constructed in power plants where cool-ing water is unavailable or costly in nearby areas. Recir-culation was usually formed under the cooling tower in the effect of ambient wind. When recirculation occurred; the efficiency of air-cooled condenser dropped dramati-cally, which sometimes even made the system break off [1-3].
Zhifu Gu [4,5] carried out the wind-tunnel simulation on the direct-air-cooled system for one power plant in China, using the traced gas, which is different from the surrounding air in density, to simulate hot air flow ex-hausted from ACC. Recirculation was weighed by meas-uring the concentration of traced gas. Although use of the traced gas could act as hot exhausted air from finned tubes with the thermal buoyancy effect, the heat ex-change between the hot finned tube and the cold air can-not be simulated realistically; yet backpressure of the steam turbine is extremely sensitive to ambient tempera-ture. Therefore this model of the traced gas investigation on the ACC may not be sufficiently accurate. C.A. Salta and D.G Kroger [6] carried out an experimental study on a scale model of a forced draft air-cooled heat exchange (ACHE). The results showed significant change in air
flow rate caused by varying the platform height. It was found that lowering the platform height resulted in a de-crease of air flow rate across the fans, and badly de-creases in boundary fans of the platform Furthermore, the influence of the width of a walkway along the boun-dary of the platform on the air flow rate through an ACHE was also considered. Tests shown that flow rate of the ACHE can be improved by increasing the width of walkway or extending the height of the platform. P. Van Staden [7], Martin P. Van Staden and Pretorius [8] nu-merically simulated the effect of ambient conditions nearby the Matimba power station. The effect of the re-circulation on the fan performance and the steam-turbine backpressure based were predicted, and the effects of the wind speed and the wind direction on the cooling effi-ciency of the ACC were discussed. They found that the cooling efficiency and the turbine backpressure were very sensitive to the wind speed and wind direction. But the mechanisms that caused hot recirculation and the measures that minimized recirculation were not men-tioned. C. Ziller, D. Schwarzkopf, and R. Balzereit [9], studied the influence of wind speed and direction on the efficiency of mechanically driven cooling devices, which include multi-cell the cooling towers and air-cooled condensers, by means of wind tunnel simulation. Their results show that the negative influence affects the cool-

W. L. ZHAO ET AL.
Copyright © 2010 SciRes. EPE
292
ing devices. Besides, plant structures like gas turbines which can suck hot exhaust air as fresh air can lead to a dramatical decrease of its efficiency. Peiqing Liu, Hu-ishen Duan, et al. [10] carried out the numerical simula-tion of direct air-cooled system of Datong NO. 2 power plant in China, and got the recirculation under the cool-ing tower.
As we all know the thermal flow field around ACC directly influences the hot air dispersing from ACC to the cold air. It is very important to obtain thermal flow field around ACC, especially in certain direction angles. However, most current investigations have not concerned on thermal flow field. Some researches on recirculation were in cold condition, and engineering measures to re-duce recirculation are very few. The present paper intro-duces the buoyancy effects to experimental investigation on direct air-cooled system for a power plant. PIV ex-periment is conducted in wind tunnel to get thermal flow field around ACC. At last, some measures are taken to reduce the recirculation ratio. 2. Experimental System 2.1. Definition of Recirculation Ratio In practice, recirculation is often formed under the action of environment wind. In order to explain the recircula-tion in quantification, Wanli Zhao [1,2] gave evaluation criteria of recirculation ratio:
in a
ou a
T TR
T T
(1)
The average recirculation rate is
1
/N
ii
R R N
(2)
Where aT indicates temperature of ambient air; inT indicates average temperature of air at the inlet of fans;
ouT refers to average temperature of finned tubes. We can calculate the recirculation ratio of each measuring point by (1) through measuring the temperature at the inlet of fans and outlet of finned tubes. We can also get average recirculation rate by (2) under different condi-tions. 2.2. The Model Apparatus The experiment is carried out in FL-8 wind tunnel of Chinese Aviation Industry and Aerodynamic Research Institute. The wind tunnel is a circulative tunnel. The section of test segment is flat eight-square and the area of section is 7.685 square meter. The length of experimental section is 5.5 meters, and maximum velocity is 70 m/s.
Scaling model is similar to Datong No.2 direct air-cooled system [2] the model scaling ratio is 1:120.The boundary layer of atmosphere of B type is simulated in wind tunnel, and section plane exponent of time-average velocity are expressed by 0.16 . The turbulence rate close to the ground is greater than 5%. The device of measuring
temperature is multi-channel temperature patrol system produced by Keithley Corporation of USA. The sensor is thermocouple of T type. There are 92 measuring points altogether placed at inlet of fans and outlet of finned tubes. In model test, the two supplies produced by LongWei electronic Ltd. Hong Kong provide direct cur-rent and steady voltage to 112 model fans, and voltage can change continuously. 2.3. PIV Equipment In this experiment, double compositive Nd: YAG laser is used as a lamp-house, single fluctuating energy is 200mJ, the lamp-house produces green light, and wave length is 532nm. CCD camera is PIVCAM 13-8, resolving power of gray degree is 4096, resolving power of image is 1280 x 1024, and image gathering velocity is 8 frames per second. Frame grabber reads number image of CCD camera to memory, and INSIGHT software is used to deal with, and TECPLOT is used to display. 2.4. Particle Casting Equipment The choice of tracer particle is very important in PIV experiment. On one hand, the particle must have a cer-tain size to enhance the light scattering, and reinforce the contrast of image; on the other hand, the particle must be little enough to assure good following, which can reflect the real flow of fluid.
In this study, smog generation of XQ-1200 type was used to produce tracer particle, and the particle genera-tion can cast tracer particle continuously; at the same time, the casting position of tracer particle can also ad-just automatically. 2.5. Layout of PIV Experiment Because of area of measuring spatial is too large (the width of measuring region is about 1500 mm), so four little areas were divided to measure respectively, and then connect four images to form an integrated image. Figure 1 displays the sketch map of measuring area and camera layout. 2.6. Parameter Choice of Experiment The choice of experiment parameter according to idio-

W. L. ZHAO ET AL.
Copyright © 2010 SciRes. EPE
293
Figure 1. Sketch map of measuring area and camera layout. graphic instance experiences a process of gradual opti-mization. The parameters mainly include: wind velocity, measuring area, size of question area, interval time of fluctuating time t , arithmetic choice et al.
1) Velocity: V = 6 m/s 2) Size of question area: the pixel is 32 × 32 3) Interval time of fluctuating time t : displacement
of particle in t should less than 1/4 of question area, so interval time of fluctuating time can be calculated by:
1max4 /t x U ( )
In which, x is size of question area, maxU is maximum velocity in question area. If 8 mmx ,
max 8 mmU then 200 μst . 4) Arithmetic choice: INSIGHT software provides two
arithmetic, there are, FFT arithmetic and Hart arithmetic, in this study; FFT arithmetic is used. 3. Results and Discussion In order to change the thermal flow field of the cooling tower, three methods are used in the experiment: adding the height of wind wall, adding the width of the platform, and adding the length of the platform. Meanwhile the recirculation under the cooling tower of three methods is measured. 3.1. The Influence of Wind Velocity on
Recirculation Ratio The magnitude of wind velocity has great influence on recirculation ratio. Theoretically, in the absence of wind, there is hardly recirculation existing. When wind velocity increases to a certain value, recirculation of different de-gree may be occurred. Before blows, temperature of measuring points are measured; it is found that tempera-ture of measuring points closed to turbine house is higher than other points. This is because steam ducts are made of
steel, and located between turbine house and cooling tower. Heat discharged from steam ducts is absorbed by fans closed to turbine house, which results in that tem-perature of measuring points close to turbine house is higher than others. When ambient wind blows from boiler to cooling tower, the magnitude of wind velocity aV in wind tunnel is 6 m/s, 8 m/s, 10 m/s, 12 m/s, 14 m/s, av-erage velocity between two steam ducts jV is 2.1 m/s, so relationship between average recirculation ratio and velocity ratio /a jK V V can be obtained.
It can be found that with K increasing, average re-circulation ratio under cooling tower is increasing as well, as shown in Figure 3. This is because flow separated at the top of boiler house and boundary of wind wall far from the turbine-house. At the back of boiler house and backward position of wind wall, two eddy come into being. At the boundary of vortex, strong turbulent en-trainment mixes up, which causes more and more plumes roll into the vortex. When K which leads to enhancing of inertial force increases, that is, vortex strength is aug-mented; more and more plumes are coiled to bottom which causes recirculation increase.
Figure 2. Relationship between velocity ratio and average recirculation ratio.
Figure 3. Relationship between wind direction angle and average recirculation ratio.

W. L. ZHAO ET AL.
Copyright © 2010 SciRes. EPE
294
3.2. Influence of Wind Direction Angle on Recirculation Ratio
In order to reflect the influence of wind direction angles on recirculation ratio, the model test selects 16 direction angles (the interval is 22.5 ) and wind velocity is 6 m/s and 8 m/s. Average recirculation ratio changed with wind direction angles under different velocities is shown in Figure 4. We can see that the worst wind direction angle is about 0 , where the sub-high recirculation ratio is near to 45 . Under the velocity of 8 m/s, the trend of average recirculation ratio changing with the direction angle is similar to velocity of 6 m/s. But when wind di-rection angle β = −67.5°~67.5°, β = −180° ~ −112.5°, β = 112.5° ~ 180°average recirculation ratio of 8 m/s is dis-tinctly higher than 6 m/s. 3.3. Influence of Height of Wind Wall on
Recirculation Ratio In order to decrease recirculation ratio under cooling tower, wind velocity in wind tunnel is 6 m/s, wind direc-tion angle 0 , the height of wind wall wH is adopted by 13 m (design value), 14 m, 15 m, 16 m, 17 m, and 18 m, the diameter of fan ND is 8.91 m. Tempera-ture of each point is measured, and then, recirculation ratio of each point is calculated and the influence of height of wind wall on recirculation ratio is analyzed. Figure 4 shows the relationship among height of wind wall and average recirculation ratio under cooling tower and density Froude number DFr .
In where, 0 0 0/ /DFr V gL T T represents the ratio of inertial force to buoyancy, T the difference in tem-perature, 0V , 0L , 0T the reference velocity, length and reference temperature [3].
From Figure 4 we can see that when the rotational velocity of fans keeps constant, with height of wind wall increasing DFr based on height of wind wall decreases, that is to say, the thermal buoyancy decreases. We can also find that with the height of wind wall increasing, the average recirculation ratio decreased at first, and then increased. However, the values of average recirculation ratio were all below that of design height of wind wall. This is because the wind velocity in the tunnel is much larger than the velocity of hot air discharged from steam ducts, ambient wind suppresses the hot air, leading that the hot air cannot dispel to backward position timely. At the same time, buoyancy force and inertial force act on hot air during its dispersal. When height of wind wall is increasing, and wmwH H , buoyancy force can over-come the inertial force from ambient wind, so recircula-tion decreases gradually. When the height of wind wall continues to increase, and wmwH H , buoyancy force
Figure 4. Relationship among height of wind wall and av-erage recirculation ratio and FrD. can not overcome the inertial force any longer, most of the hot air was suppressed to inlet of fans through finned tubes, which cause recirculation ratio increases. That is to say, when / 1.65W NH D (corresponding height of prototype is 14.64 m), average recirculation ratio is the minimum, average recirculation ratio decreased 1.5% compared with the design height of wind wall. Therefore, increased height of wind wall is beneficial to decrease average recirculation ratio under the cooling tower.
From the above results of the measuring recirculation, adding the height of the wind wall can reduce the recir-culation under the cooling tower. Figure 5 and Figure 6 gives the streamline picture of mid-section of unit under different height of wind wall, when wind velocity is 6m/s, and wind direction angle is 00 (west wind). So the relationship between the thermal flow field of the cool-ing tower and recirculation ratio under the cooling tower is investigated.
From Figure 5 we can see when the ambient wind blows from boiler to the cooling tower, because of air separated from top of boiler and cooling platform, two large captive eddies form on the lee side of the tower and downstream position of platform. One vortex is formed on the top of turbine house and the other vortex is formed at backward position of wind wall away from turbine house. On the boundary of eddy, strong turbulent entrainment and mixing up which causes more and more hot air discharged from ACC bring back into the bottom of the cooling tower, under action of fans’ pumping, hot air was sent to ACC again. From the Figure 5 we can see a little bit “adverse flow” appears on the boundary of wind wall closed to turbine house under the action of eddy, because the height of wind wall is lower.
From the Figure 6 we can find in the case that height of wind wall Hw = 150 mm, the large eddy at the lee back of the boiler is uplifted, and has a trend of throwing away

W. L. ZHAO ET AL.
Copyright © 2010 SciRes. EPE
295
Figure 5. The streamline of mid-section under the height of wind wall wH = 108.3 mm, wind direction angle 00 .
Figure 6. The streamline of mid-section under the height of wind wall wH = 150 mm, and wind direction angle 00 .
to the backward position. But only a little hot air dis-charged from ACC closed to turbine house was brought into eddy and then pumped by outer fans of platform. The streamline on the top of platform was ascending, and
the eddy at backward position was raised. Eddy core flowed away from wind wall, and threw away to the backward position. From velocity profile of mid-section of the unit in wind direction angle 0 , compared to
W. L. ZHAO ET AL.
Copyright © 2010 SciRes. EPE
296
designed height of wind wall, when height of wind wall increased, velocity profile above the platform became slim, and magnitude of velocity closed to the platform diminished. That is, the horizontal inertial force was re-ducing, when buoyancy kept constant, which was helpful for hot air to discharge. The results show good agree-ment with recirculation results of experiment [3].
When wind velocity ratio increases, the average recir-culation under the cooling tower increases as well. That is because air separated at the top of boiler house and boundary of wind wall far from the turbine house. At the back of boiler house and backward position of wind wall, two eddies came into being. At the boundary of vortex, strong turbulent entrainment, and mixing up, which caused more and more plumes roll into the vortex [11]. 3.4. Add the Length or Width of the Platform In the experiment, length and width of the platform are all added, and the average recirculation ratio under the cooling tower of the two situations is also measured. Figure 7 gives the relationship between the average re-circulation ratio and different schemes.
Where wH the height of wind wall, ND the diame-ter of the fan, B is the adding width of the platform, and L is the adding length of the platform. From Fig-ure 7 we can find that adding the width of the platform and adding the length of the platform can both reduce
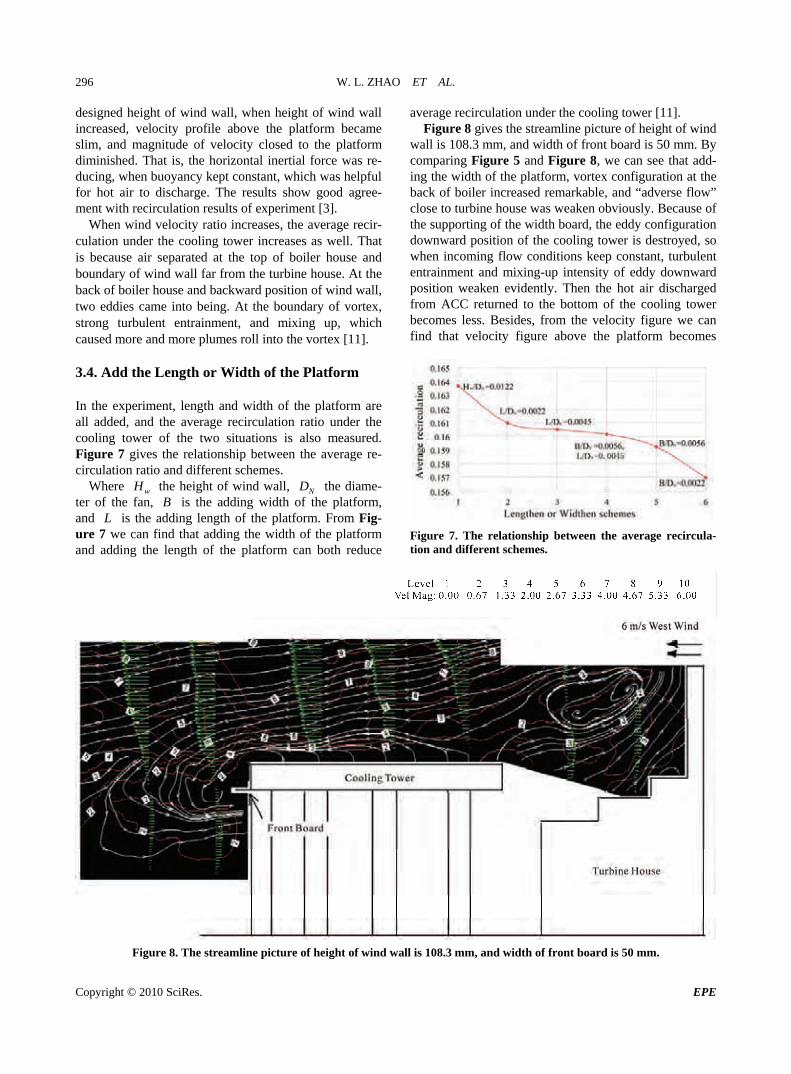
average recirculation under the cooling tower [11]. Figure 8 gives the streamline picture of height of wind
wall is 108.3 mm, and width of front board is 50 mm. By comparing Figure 5 and Figure 8, we can see that add-ing the width of the platform, vortex configuration at the back of boiler increased remarkable, and “adverse flow” close to turbine house was weaken obviously. Because of the supporting of the width board, the eddy configuration downward position of the cooling tower is destroyed, so when incoming flow conditions keep constant, turbulent entrainment and mixing-up intensity of eddy downward position weaken evidently. Then the hot air discharged from ACC returned to the bottom of the cooling tower becomes less. Besides, from the velocity figure we can find that velocity figure above the platform becomes
Figure 7. The relationship between the average recircula-tion and different schemes.
Figure 8. The streamline picture of height of wind wall is 108.3 mm, and width of front board is 50 mm.

W. L. ZHAO ET AL.
Copyright © 2010 SciRes. EPE
297
very slim and velocity closed to the bottom of platform becomes less because of front-board supporting function, which could help the hot air to discharge [3].
Therefore, adding the length or width of the platform can both change the thermal flow flied configuration around the cooling tower, and the recirculation under the cooling tower is decreased. 4. Conclusions The principal conclusions derived from investigations in present paper can be summarized as follows:
The thermal flow field has great influence on the average recirculation under the cooling tower, recirculation under the cooling tower increases as wind velocity ratio increases.
Increasing height of wind wall can ameliorate the thermal flow field of the cooling tower, which can help decrease the average recirculation ratio under the cooling tower.
Adding the length or width of the platform can also improve the thermal flow field of the cooling tower; the average recirculation under the cooling tower can be reduced by this way.
5. Acknowledgements The authors are very grateful to the other members of our groups for their experimental and numerical perform-ances throughout this work. Special thanks should be given to Jiali Jiang and Xiaoli Zhang of Chinese Aviation Industry and Air Dynamic Research Institute for their help in the PIV experiments. 6. References [1] W. L. Zhao and P. Q. Liu, “The Reasons of Recirculation
Produce and It’s Evaluate Criteria for Air-Cooed Power Pant,” Proceedings of Chinese Congress of Theoretical and Applied Mechanics in memory of the Golden Jubilee
of CSTAM, Beijing, 20-22 August 2007, p. 143
[2] W. L. Zhao and P. Q. Liu, “Experimental Researches of the Effect of Environmental Wind on Thermal Recircula-tion under the Tower of Direct Air Cooled System,” Journal of Power Engineering, Vol. 23, No. 3, May 2008, pp. 390-394.
[3] P. Q. Liu, W. L. Zhao and Z. L. Xu, “Simulation and Experimental Study of the Wind Tunnel Thermal Effect of a Directly Air Cooled System in a Thermal Power Plant,” Journal of Thermal Energy and Power, Vol. 28, No. 3, June 2008, pp. 240-243.
[4] Z. F. Gu and H. Li, “Wind Tunnel Simulation on Re-Circulation of Air-Cooled Condensers of a Power Plant,” Journal of Wind Engineering and Industrial Aerodynamics, 2005, pp. 509-520.
[5] Z. F. Gu and X. R. Chen, “Wind Tunnel Simulation of Exhaust Recirculation in an Air-Cooling System at a Large Power Plant,” International Journal of Thermal Sciences, Vol. 46, No. 5, May 2007, pp. 308-317.
[6] C. A. Salta and D. G. Kroger, “Effect of Inlet Flow Dis-tortions on Fan Performance in Forced Draft Air-Cooled Heat Exchangers,” Heat Recovery Systems & CHP, Vol. 15, 1995, pp. 555-561.
[7] M. P. van Staden, “Numerical Modelling of the Effects of Ambient Conditions on Large Power Station Air Cooled Steam Condensers,” American Society of Mechanical Engineers, Vol. 221, 1995, pp. 145-150.
[8] V. Staden and L. Pretorius, “Simulation of Heat Ex-change in Large Air Cooled Condensers, Heat Transfer,” Proceedings of 11th IHTC, Vol. 6, 1998, pp. 155-160.
[9] C. Ziller, D. Schwarzkopf and R. Balzereit, “Recircula-tion, Interference and Plume Diffusion in Power Stations and the Effects on the Efficiency, Wind Engineering into 21st Century,” Proceedings of the 10th International Conference on Wind Engineering, A.A. Balkema, Co-penhagen, 1999, pp. 819-824.
[10] P. Q. Liu, H. S. Duan and W. L. Zhao, “Numerical Inves-tigation of Hot Air Recirculation of Air-Cooled Con-densers at a Large Power Plant,” Applied Thermal Engi-neering, Vol. 29, 2009, pp. 1927-1934.
[11] W. L. Zhao, “Study on Thermal Flow Field Characteris-tics of Direct Air-Cooled System for a Large Powe Plant,” Ph.D. Thesis, School of Aeronautics Science and Engineering, University of BeiHang, Beijing, 2008


![Compact ink recirculation system CC1 - Toshiba Tec Top Page...Compact ink recirculation system Example: Mounting of ink recirculation system [CC1] with ink recirculation head Up to](https://img.pdfslide.us/doc/110x75/5f0f72527e708231d4443441/compact-ink-recirculation-system-cc1-toshiba-tec-top-page-compact-ink-recirculation.jpg)