Embed Size (px)
Citation preview

EqualityResearchSeries
The Experience of Discrimination in Ireland
Analysis of the QNHS Equality Module
Helen Russell, Emma Quinn, Rebecca King O’Riain and Frances McGinnity

This report can be downloaded at: www.equality.ie/research and www.esri.ie

The Experience of Discrimination in Ireland
Analysis of the QNHS Equality Module Helen Russell, Emma Quinn, Rebecca King O’Riain and Frances McGinnity

Helen Russell is a Senior Research Officer, Frances McGinnity is a Research Officer and Emma Quinn is a Research Analyst at The Economic and Social Research Institute, Rebecca King-O’Riain is a senior lecturer in sociology at NUI Maynooth. This research has been carried out as part of the Equality Authority/ESRI Research Programme on Equality and Discrimination The views expressed in this report are those of the authors and do not necessarily represent those of The Equality Authority or The Economic and Social Research Institute. Copyright is jointly held by The Equality Authority and The Economic and Social Research Institute, Dublin 2008. ISBN: 0 7070 0264 8 Cover design by form Printed in Ireland by Brunswick Press

FOREWORD This is the first report arising from the ‘Research Programme on Equality and Discrimination’ which is being carried out by The Economic and Social Research Institute on behalf of The Equality Authority. This study draws on the first national survey of experiences of discrimination carried out by the Central Statistics Office in 2004. The Central Statistics Office survey revealed significant levels of reported discrimination. Overall 12.5 per cent of the Irish population aged 18 years and over said that they had been discriminated against in the preceeding two years. This survey provided a valuable benchmark against which to assess progress in combating discrimination. It provided information that raised questions in relation to the adequacy of the current equality legislation and of the level of investment in the existing equality infrastructure to eliminate this reported discrimination. It is important, therefore, that this data be further examined to increase our understanding of this reported discrimination. Helen Russell, Emma Quinn, Rebecca King O’Riain and Frances McGinnity have applied expertise and insight in their examination of this data. They have provided us with new information on the social characteristics of those at risk of discrimination in different social contexts, on Work-related discrimination by sector and occupation, and on the impact of this discrimination and the responses of those experiencing this discrimination. We are grateful to the authors for their work on this report. We are also grateful to Laurence Bond, Head of Research with the Equality Authority, for his support to this research project. This report has policy and practice implications that must now be a focus for attention from the relevant authorities and organisations. The unemployed are not covered by the equality legislation but they emerge from this report as particularly vulnerable to exploitation. This suggests the need to review and broaden the grounds covered by the equality legislation. The report highlights that the social groups who report the highest levels of discrimination are the least likely to take action. This suggests the need for increased proactive third party interventions such as information campaigns, advocacy and legal supports. The report also suggests the need for new practice to eliminate discrimination particularly in financial services and accommodation as well as in workplace recruitment. Niall Crowley Chief Executive Officer The Equality Authority
The Experience of Discrimination in Ireland iii

ACKNOWLEDGEMENTS We are extremely grateful to Padraig Dalton and the staff of the Central Statistics Office for providing us with access to the Quarterly National Household Survey special module on equality and to additional micro-data in order to carry out this research. Thanks to Philip O’Connell and Brendan Whelan of the Economic and Social Research Institute and Laurence Bond of the Equality Authority for valuable comments on earlier drafts. Finally, sincere thanks are due to Deirdre Whitaker, Regina Moore and Mary Cleary for preparing the report for publication. The authors are solely responsible for the content of the report.
iv The Experience of Discrimination in Ireland

CONTENTS Foreword iii Acknowledgements iv Executive Summary ix CHAPTER 1: INTRODUCTION 1 1.1 Introduction and Background to the Survey 1 1.2 Changing Irish Context 2 1.3 Defining and Measuring Discrimination 3 1.4 Measuring Discrimination Using the Equality Module 7 1.5 Report Plan 11 CHAPTER 2: WHERE DO PEOPLE EXPERIENCE DISCRIMINATION? 12 2.1 Risk of Discrimination Associated with Different Domains 13 2.2 Work-related Discrimination 15 2.3 Groups at Risk of Subjective Discrimination in Accessing Specific 22
Services 2.4 Conclusions 26 Appendix Tables 29 CHAPTER 3: GROUNDS OF DISCRIMINATION EXPERIENCED 31 3.1 Overview of Grounds Reported 31 3.2 Relationship Between Social-demographic Groups and Grounds of 32 Subjective Discrimination 3.3 Relationship Between Domains of Discrimination and Grounds of 37 Subjective Discrimination 3.4 The ‘Other’ Ground and “Multiple Grounds” 39 3.5 Conclusions 41 Appendix Table 42 CHAPTER 4: OVERALL DISCRIMINATION AND GROUPS MOST AT RISK 43 4.1 Vulnerability to Any Form of Discrimination Across Social Groups 43 4.2 Vulnerability to Work-related and Services Discrimination Across Social 46 Groups 4.3 Conclusions 51 Appendix Tables 53 CHAPTER 5: IMPACT AND FREQUENCY OF DISCRIMINATION, ACTION 57 TAKEN AND KNOWLEDGE OF EQUALITY RIGHTS 5.1 Impact of Discrimination 57 5.2 Frequency of Discrimination 60 5.3 Actions Taken in Response to Discrimination 61 5.4 Relationship Between Action, Frequency, Impact and Knowledge of 65 Rights 5.5 Conclusions 70 Appendix Tables 72
The Experience of Discrimination in Ireland v

CHAPTER 6: CONCLUSIONS 75 6.1 Main Findings 76 6.2 Implications for Policy 81 6.3 Implications for Future Data Collection/Research 82 REFERENCES 83 METHODOLOGICAL APPENDIX 87
vi The Experience of Discrimination in Ireland

LIST OF FIGURES Box 1.1 Definition of Discrimination on Equality Module (Prompt Card) 8
Box 2.1 Questions on Domain of Reported Discrimination from Equality Module 12 Questionnaire
Figure 3.1 Gender Composition of Those Who Report Gender Discrimination 33 and of Total Population
Figure 3.2 Age Composition of Those Who Report Age-related Discrimination 34 and of Total Population
Figure 3.3 Composition of Those Reporting Discrimination on the Basis of 35 Race/Skin Colour/Nationality or Ethnic Origin
Figure 3.4 Marital Status of Those Reporting Discrimination on Grounds of 35 Marital Status and of Total Population
Figure 3.5 Family Status Composition of Those Reporting Discrimination on the 36 Grounds of Family Status, and of Total Population
Figure 3.6 Disability Status of Those Reporting Discrimination on the Grounds 37 of Disability, and of Total Population
Figure 3.7 Respondents Who Experienced Discrimination in Service and Work 39 Domains, Per Cent Who Selected the ‘Other’ Ground
Figure 5.1 Impact of Discrimination by Domain 59
Figure 5.2 Frequency of Discrimination of those Recording Any Discrimination 60
Figure 5.3 Frequency of Discrimination Across Domains 61
Figure 5.4 Action Taken in Response to Discrimination 62
Figure 5.5 Proportion Taking Any Action in Response to Discrimination 63
Figure 5.6 Action Taken by Respondents Who Experienced Discrimination in 64 Work and Service Domains
Figure 5.7 Percentage of Respondents Who Experienced Discrimination in 65 Domain Who Took Action
Figure 5.8 Relationship Between Action and Frequency and Subjective Impact 66 of Discrimination
Figure 5.9 Knowledge of Rights Under Irish Equality Law 67
Figure 5.10 Responses to Discrimination and Knowledge of Rights Under Irish 68 Equality Law
The Experience of Discrimination in Ireland vii
LIST OF TABLES Table 2.1 Incidence and Rates of Discrimination Across Domains 13
Table 2.2 Experience of Work-related Discrimination in Last Two Years: 16 Raw and Modelled Risk for Socio-Demographic Groups
Table 2.3 Experience of Work-related Discrimination in Last Two Years: 20 Raw and Modelled Risk for Job Characteristics
Table 2.4 Models of Risk of Discrimination in Service Domains 24
Table A2.1 Likelihood of Experiencing Work-related Discrimination 29
Table A2.2 Models of Risk of Discrimination in Service Domains in Last 2 Years 30
Table 3.1 Grounds of Discrimination as a Percentage of All Reported Grounds 32
Table 3.2 Grounds of Discrimination as a Percentage of All Reported Grounds, 33 Distinguishing Men and Women
Table 3.3 Grounds for Discrimination in Services 37
Table 3.4 Grounds for Work-related Discrimination 38
Table A3.1 Models of Risk of Discrimination on the ‘Other’ Ground 42
Table 4.1 Respondents Who Experienced Any Discrimination in Last Two Years: 44 Raw and Modelled Risk
Table 4.2 Respondents Who Reported Experience of Work-related and 48 Services Discrimination in Last Two Years: Raw and Modelled Risk
Table A4.1 Respondents Who Reported Experience of Any Discrimination in 53
Last Two Years: 000s Table A4.2 Confidence Intervals for Estimates of Any Discrimination by Nationality 54
Table A4.3 Confidence Intervals for Estimates of Any Discrimination by Ethnicity 54
Table A4.4 Confidence Intervals Attached to Estimates of Any Discrimination 54 by Religion
Table A4.5 Model of Probability of Experiencing Any Discrimination 55
Table A4.6 Risk of Discrimination in Work and Services 56
Table 5.1 Serious Impact of Discrimination Among Those Experiencing 58 Discrimination
Table 5.2 Summary of Model Results on Probability of Taking Action 69
Table A5.1 Model of Risk of Serious Impact of Discrimination 72
Table A5.2 Model of Frequency of Discrimination: More than Once Versus Once 73
Table A5.3 Probability of Taking Any Action in Response to Discrimination 74
viii The Experience of Discrimination in Ireland
EXECUTIVE SUMMARY Discrimination undermines equality in society. Discrimination may also exacerbate social cleavages and weaken social solidarity, and in the context of employment, can undermine labour standards and lead to an inefficient use of skills. The importance of eliminating discrimination is reflected in Irish law which prohibits discrimination in a variety of settings and on a range of grounds. Yet discrimination is often difficult to detect and measure, as discriminatory behaviour is rarely observed directly. This study relies on the self-reported experiences of discrimination among the general population. We draw on the first national survey of experiences of discrimination in Ireland carried out by the Central Statistics Office (CSO) in 2004 (CSO, 2005a). The survey asked individuals whether they had experienced discrimination in a number of domains over the previous two years. This survey of approximately 24,600 people provides important baseline information on a number of key issues:
the level of discrimination (subjectively defined), the contexts in which reported discrimination occurs, the perceived grounds of discrimination, the social characteristics of those who report discrimination, the impact of subjective discrimination, the responses taken by those who experience discrimination.
Drawing on the nine grounds covered by Irish Equality legislation, discrimination was defined as follows to those participating in the survey:
Discrimination takes place when one person or a group of persons are treated less favourably than others because of their gender, marital status, family status, age, disability, ‘race’ – skin colour or ethnic group, sexual orientation, religious belief, and/or membership of the Traveller community. Discrimination can occur in situations such as where a person or persons is/are refused access to a service, to a job, or is/are treated less favourably at work. In other words, discrimination means treating people differently, negatively or adversely because they are, for instance, Asian, Muslim, over 50 years of age, a single parent, and/or homosexual. If the reason you may have been treated less favourably than someone else is due to another reason (such as your qualifications, being over an income limit or because you are further back in a queue for something) this does not constitute discrimination.
The advantage of this survey approach is that it is comprehensive and nationally representative. It provides information about a range of social contexts in which discrimination can happen (for example, in the workplace and accessing services such as shops, pubs, health services), and reports discrimination towards a wide range of groups. It provides us with data on forms of discrimination not asked about before, some of which is very difficult to detect using other methods. The main limitation of this approach is that the judgement of whether discrimination has occurred is subjective. Two respondents who have experienced the same treatment could interpret it differently, with one attributing it to discrimination, while another does not. This subjective element may lead to an under-reporting or over-reporting of discrimination. Efforts were made by the CSO to minimise such error by providing respondents with a clear definition of discrimination, delimiting the contexts and time frame that are examined and asking a representative sample of the whole population
The Experience of Discrimination in Ireland ix

rather than just disadvantaged or minority groups. This is in line with international best practice.
Level of Reported Discrimination Overall 12.5 per cent of the Irish population aged 18 years and over said that they had been discriminated against in the preceding two years (Table A). Of the eligible population, 9 per cent of respondents reported discrimination accessing services and 7 per cent reported Work-related discrimination. In 71 per cent of cases discrimination was experienced on more than one occasion.
Table A: Incidence and Rates of Discrimination Experienced discrimination Experienced
Discrimination (000s)
Eligible Population
(000s)
Rate %
Any discrimination 381.6 3,061.1 12.5 Any Service related discrimination 276.7 3,061.1 9.0 Any Work related discrimination 156.9 2,157.4 7.2 Note: The data have been re-weighted to reflect population totals.
Social Context of Discrimination The study examines experiences of discrimination across nine contexts or domains detailed in Table B. The highest rate of discrimination occurred in the two employment domains – with between 5 and 6 per cent of the eligible population reporting discrimination. In absolute numbers, banks and financial institutions proved the most common site for perceived discrimination.
Table B: Incidence and Rates of Discrimination Across Domains Experienced discrimination Experienced
Discrimination (000s)
Eligible Population
(000s)
Rate %
While looking for work 73.9 1,275.8 5.8 In the workplace 100.6 2,076.2 4.8 Obtaining housing or accommodation 43.6 1,097.3 4.0 Using services of banks, insurance etc 112.5 3,061.1 3.7 In shops, pubs or restaurants 80.7 3,061.1 2.6 Accessing health services 51.3 2,903.3 1.8 In relation to education 16.7 1,321.4 1.3 Accessing other public services 30.1 3,061.1 1.0 Using transport services 21.7 3,061.1 0.7 Note: the data have been re-weighted to reflect population totals.
Perceived Grounds of Discrimination The CSO survey also collected information on the grounds on which respondents felt they were discriminated against. As this question required respondents to interpret the motivation of other actors, the results should be understood as perceived grounds of discrimination. Of the nine grounds covered by equality legislation, age-related discrimination was the most commonly reported (19 per cent) followed by race/ethnicity/nationality (16 per cent) and sex (12 per cent) (Table C).
x The Experience of Discrimination in Ireland

Table C: Grounds of Discrimination as a Percentage of All Reported Grounds
Ground % of All Reported Grounds Age 19.3 Race/skin colour/ethnic group/nationality 16.3 Sex 11.5 Family status 10.0 Disability 6.2 Marital Status 4.3 Sexual Orientation 0.5 Religion 0.6 Membership of the Traveller community 0.7 Other 30.6 Total 100.0
Almost one-third of the respondents felt unequally treated on ‘other’ unspecified grounds, not covered by law. The model constructed to analyse the ’other’ ground did not yield a clear picture of who is being missed by the existing equality grounds. Closer examination of three grounds not currently covered by equality legislation (Trade Union membership, education and economic status) showed that Trade Union members, respondents educated to primary and lower secondary level and the unemployed were more likely to use the ‘other’ ground. However, we cannot rule out some misclassification and the substantial number of respondents who ticked the ‘other’ ground is a weakness of the survey, given that the definition supplied is strongly linked to the nine grounds.
Social Characteristics of Those at Risk of Discrimination The survey also includes information on the social characteristics (such as gender, ethnicity, nationality, disability, education etc.) of those who report experiencing discrimination, allowing comparisons between different sub-groups – men/women, Irish national/non-Irish national and so on – in the population. While these characteristics cover many of the grounds on which discrimination is legally prohibited in Ireland, there are two important omissions, namely sexual orientation, which was not asked in the survey, and membership of the Traveller community where the number of respondents was too small to analyse separately. In addition to directly comparing the experience of different groups, we use statistical modelling to identify whether a particular group characteristic – such as gender or nationality – is a predictor of discrimination risk when the differential effect of other characteristics is controlled.
Women and Men
While there is no difference in the proportion of women and men reporting discrimination overall, women were much more likely to report discrimination on marital and family status grounds and, to a lesser extent, on the gender ground. Forty-five per cent of reports of gender based discrimination came from men, predominantly in relation to financial services. Age, nationality/ethnicity and disability were more commonly cited by men as the perceived grounds of discrimination. Statistical modelling shows that gender is a risk factor in a number of specific domains, independently of other factors such as family status or age. In Work-related discrimination, men are more likely to report experiencing discrimination looking for work, while women are more likely to report experiencing discrimination in the workplace. In services, women were more likely to say they had been discriminated
The Experience of Discrimination in Ireland xi

against in accessing health services while men were more likely to say they experienced discrimination accessing financial services such as banking and insurance. In other situations or domains men and women do not differ.
Age Groups: Older/Younger
Claims of discrimination more commonly came from respondents aged less than 25 years than those aged 65 years or over. Young people are particularly likely to report having experienced discrimination while using services such as pubs/clubs/restaurants/shops, banks/insurance and housing, but are no more likely than other age groups to report Work-related discrimination. The finding that being 65 years or older is not a risk factor in any domain is striking and may reflect reluctance among older people to interpret unequal treatment as discriminatory.
Family Status: Lone Parents
Lone parents have one of the highest probabilities of reporting discrimination over the preceding two years. Their risk of discrimination is found to be particularly concentrated within the services domain, with housing/accommodation, transport and other public services standing out as contexts in which lone parents are most likely to experience discrimination.
Non-Irish Nationals/ Minority Ethnic Groups
There is considerable policy interest in the extent to which non-Irish nationals and minority ethnic groups are subject to discrimination in Ireland. Some 24 per cent of non-Irish nationals feel they have been discriminated against over the preceding two years, just over twice the rate for Irish nationals. The higher likelihood of reported discrimination among non-Irish nationals persists in both of the work and four of the service domains (housing, shops/pubs/restaurants, financial services and transport), but is particularly pronounced in relation to job search. Respondents of Black ethnicity have the highest “raw” risk of discrimination among the four ethnic categories – White, Black, Asian or ‘Other’ – identified in the survey, with 40 per cent of those surveyed reporting experience of discrimination. This compares to 12 per cent of the White respondents and 25 per cent of the Asian group. Ethnicity is more strongly associated with discrimination in services than work. The survey also shows that Black respondents were particularly at risk of discrimination in shops/pubs/restaurants, financial services, housing and transport, the ‘Other’ group were at risk in shops/pubs/restaurants and housing and the Asian group in transport. It was also found that Black respondents were more vulnerable to repeat discrimination than White respondents.
People with Disabilities
Our analyses show that disability is one of the strongest predictors of discrimination risk. People with disabilities were at higher risk across all domains except education. Disability has the strongest effect in the health domain and in transport services, where disabled respondents are over five times more likely to report problems of discrimination. People with disabilities also report a greater incidence of repeat discrimination, with 77 per cent of those who experienced discrimination saying it occurred more than once. Furthermore, of respondents with a disability who reported having experienced discrimination, 35 per cent said the experience had a serious impact on their lives.
xii The Experience of Discrimination in Ireland
The Unemployed
The unemployed are not currently covered by equality legislation but they emerge clearly from the current study as a group particularly vulnerable to discrimination: 29 per cent of the unemployed in the survey reported having experienced some form of discrimination in the last two years. Unsurprisingly, the responses of the unemployed indicate particular vulnerability to discrimination while looking for work. Job seekers in this group are 8.7 times more likely to report experience of discrimination in the preceding two years than those currently employed, and the unemployed are also more likely to have experienced discrimination in the workplace.
Work-related Discrimination by Sector and Occupation We analyse Work-related discrimination by sector and occupation for those employed at the time of the survey. Statistical modelling revealed that only individuals working in the education and transport sectors have significantly higher reports of discrimination in the workplace, when occupation and the personal characteristics of workers are taken into account. Sector does not emerge as significant in the context of looking for work, apart from the fact that respondents working in financial services are less likely to report discrimination. In terms of occupation, plant and machine operatives report higher rates of discrimination in the workplace than individuals in other occupations, when we account for other factors using statistical modelling. Occupation had a greater impact on the experience of discrimination when looking for work: clerical and secretarial workers, associate professional and technical and personal and protective services emerged as more vulnerable to discrimination in the ‘looking for work’ model. Overall, the results suggest that it is the composition of the workforce, or the personal characteristics of those who sought work, rather than the sector or occupation in which they work, that is likely to be associated with a higher rate of discrimination.
The Impact of Discrimination and Taking Action Of those who report discrimination in the last two years, some 26 per cent say that it had a serious or very serious effect on their lives. The results presented in this report highlight how the impact of reported discrimination varies across certain groups, and how the impact varies depending on the context. Discrimination in the workplace, obtaining accommodation and in ‘accessing other public services’ is seen to have a more serious impact by those who experience it. The finding that discrimination experienced in the workplace and in relation to housing/accommodation is associated with the most severe impact is unsurprising given that these are two dominant spheres in most people’s lives. Only 40 per cent of respondents take any action (formal or informal) in response to perceived discrimination. The most common form of action taken was verbal, with 26 per cent saying they had taken such action. A further 4 per cent made a written response, with only 6 per cent making a formal response by making an official complaint or taking a legal action. This result suggests that the cases that make it to the Equality Tribunal represent a very small fraction of all cases of discrimination. Regarding taking action, our analysis shows that in many cases, the social groups who report experiencing the highest levels of discrimination are the least likely to take action. Responding to discrimination requires a range of resources such as language skills, confidence and knowledge of one’s rights and entitlements. It appears that more marginalised groups who are subject to higher levels of discrimination may also lack some of these resources.
The Experience of Discrimination in Ireland xiii

Policy Implications The results of this study suggest that accessing financial services and housing, along with recruitment and the workplace, are areas that may require particular monitoring for discriminatory practices. In relation to work, the response of the unemployed and the economically inactive, non-Irish nationals and people with disabilities suggest that these groups are particularly at risk. In relation to services, disabled people, non-Irish nationals and minority ethnic groups reported greater likelihood of consistently experiencing discrimination. The findings regarding reported discrimination in the workplace and in service domains suggest that these groups need particular supports. Employers and service providers need to be aware of situations in which reports of discrimination are high and should be conscious of the groups vulnerable to discrimination. The finding that the most highly discriminated against groups are the least likely to take action indicates the potential benefit of proactive third party interventions such as information campaigns, advocacy and legal supports, along with initiatives by employers and service providers to implement good practice.
xiv The Experience of Discrimination in Ireland

1. INTRODUCTION
1.1 Introduction and Background to the Survey The last decade has seen an increasing awareness of the problem of discrimination within Irish society. This is reflected in the development of equality legislation, discussed below, and the establishment of bodies such as the Equality Authority and the Equality Tribunal. However, while our expectations of a fair society for all have become increasingly well defined in recent years, relatively little is known of the nature or extent of the problem of discrimination in Ireland: how many people are discriminated against and who is most vulnerable? Where does such discrimination occur, how often does it occur, and what type of impact does the experience have on the victim? This report uses data from the first nationally representative survey designed specifically to answer these types of questions: the Central Statistics Office (CSO) Equality Module on the subjective experience of discrimination. In 2004 the CSO Quarterly National Household Survey (QNHS) included a module on equality, which meant that approximately 24,600 QNHS respondents were asked an extra set of questions designed to investigate subjective experience of discrimination across a range of domains and grounds.1 The QNHS equality module provides us with new data on the domains of discrimination (defined as where discrimination happens i.e. at work, looking for work or in service interactions) and on what grounds (the reason given as the motivation for the discrimination) respondents felt they were discriminated against. The survey also includes information on the social characteristics (such as gender, ethnicity, nationality, disability, education, etc.) of those who report experiencing discrimination, allowing comparisons between different sub-groups – men/women, Irish national/non-Irish national and so on – in the population. These characteristics cover many of the grounds on which discrimination is legally prohibited in Ireland, but there are a number of important omissions, namely sexual orientation and membership of the Traveller community. Survey respondents were not asked about their sexual orientation, and the Traveller category of the ethnicity question is subsumed within the “White” ethnicity category, because of the small number of cases, The domain of discrimination (also referred to in this report as the social context or place), social characteristics of those surveyed who reported discrimination, and the grounds on which they felt they were discriminated against can be connected using statistical modelling, thus allowing us to better understand the nature of subjective experience of discrimination in Ireland. Data on frequency, strength of the effect and response to discrimination in Ireland are also analysed. This is the first nationally representative survey of discrimination in Ireland, in which respondents are asked specifically about their experience of discrimination in various arenas. The representative methodology and high response rate has resulted in good quality data and the collection and analysis of this data puts Ireland in line with European and international best practice in attempting to monitor and document discrimination both individually and institutionally. Initial findings from the QNHS Equality Module data were published by the CSO and showed that over 12 per cent of respondents had experienced discrimination in the last two years and that almost 60 per cent of people who experience discrimination take no action (CSO, 2005). 1 The QNHS Equality Module Questionnaire is included in the Methodological Appendix.
The Experience of Discrimination in Ireland 1

The objective of the current study is to analyse this unique data in more depth to give a comprehensive picture of the extent and nature of discrimination in Ireland. This information can then be used to devise policies to prevent discrimination and tackle the impact of discrimination in specific situational contexts and among specific groups of people. In this chapter we first briefly consider some recent changes in Irish society and the implications of these for equality and discrimination (Section 1.2). In Section 1.3 we review some approaches to defining and measuring discrimination. We consider the definition of discrimination, and, in particular how discrimination is defined legally in Ireland in Section 1.3.1. Section 1.3.2 considers various methods of measuring discrimination and their strengths and weaknesses. Following on from this discussion, Section 1.4 discusses in some detail how discrimination is measured in the survey on which this report is based. Section 1.5 discusses the outline of the report, and how subsequent chapters explore the issue of discrimination in Ireland.
1.2 Changing Irish Context There have been a number of important changes in Irish society in recent decades that are relevant for our understanding of discrimination and equality; including changes in family structure, changes in the composition of the labour market, increased immigration and changing social attitudes. While the homogeneity of family structure in the past has often been exaggerated, there has been an increase in diversity of household structures (Fahey and Russell, 2001). Relevant changes to families include increasing rates of lone parenthood, rising levels of cohabitation, increasing marital breakdown and, since 1997, the rise in remarriage (see Fahey, 2005). These changes may have implications for access to equal treatment on the grounds of family status, marital status and, indirectly, gender. Ireland has now been transformed from a country of net emigration, which it had been for most of the twentieth century, to a country of net immigration. The inflow of immigrants increased from 39,000 per annum in 1996 to almost 110,000 per annum in 2007 (CSO, 2003, 2007). The 2006 Census found that 10.1 per cent of the total population (419, 733) were non-Irish nationals, with 1.3 per cent of the population Asian/Asian Irish and 1 per cent African (CSO 2006 Census Principal Demographic Results, March 2007). Increasing national and ethnic diversity may have implications for access to equal treatment on the grounds of ethnicity/nationality. The issue of equality in the workplace has attained greater prominence because of the increased diversity of the contemporary workforce. The rapid increase in the number of women at work, the rise in inward migration, and the increased presence of people with disabilities and older people contribute to a more diverse workforce (O’Connell and Russell, 2005). These changes have been accompanied by an increasing awareness of equality, the establishment of the Equality Authority in 1999 and the implementation of equality legislation from the late 1990s – the Employment Equality Acts 1998 to 2007 and the Equal Status Acts 2000 to 2004. These acts have been key to developing a legal, but also social understanding of what discrimination is and much of the research on the subject in Ireland is guided by the nine grounds. The nine grounds on which it is illegal to discriminate in Ireland are:
2 The Experience of Discrimination in Ireland

1. gender, 2. marital status, 3. family status (e.g. pregnant or with children or other dependants) 4. age, 5. disability, 6. race/ skin colour/ ethnic group/ nationality, 7. sexual orientation, 8. religious belief, 9. membership of the Traveller community.
1.3 Defining and Measuring Discrimination
1.3.1 Defining Discrimination Discrimination is commonly understood as differential treatment on the basis of group membership that unfairly disadvantages a group. Discrimination has also been defined in Irish law, and the understanding of discrimination in the survey on which this report is based closely follows the legal definition. The Employment Equality Acts 1998 to 2007 prohibit discrimination in the workplace and in vocational training, and the Equal Status Acts 2000 to 2004 prohibit discrimination in the provision of goods and services, accommodation and education. Both Acts define discrimination as treating a person less favourably than another person is, has been or would be treated in a comparable situation on any of the grounds specified. Indirect discrimination (when there is less favourable treatment in effect or by impact) and discrimination by association or imputation are also defined and prohibited. The legislation also includes provisions prohibiting sexual harassment and harassment. Harassment is defined as any form of unwanted conduct related to any of the discriminatory grounds, conduct which has the purpose or effect of violating a person’s dignity and creating an intimidating, hostile, humiliating or offensive environment. Both Acts contain a number of detailed exemptions. Under the Equal Status Act the broadest general exemption is that anything mandated by an Act of the Oireachtas or EU law is allowed. A considerable number of exemptions are also outlined in relation to specific services and groups.2 The survey discussed here uses the nine grounds of discrimination identified in the equality legislation as the basis for questions on which grounds of discrimination might be the motivation for the current discrimination (see Section 1.4 for a more detailed discussion, respondents are made aware of the general terms of the legal definition though not of the exemptions). Note that while this legal definition is broadly consistent with the overall definition of discrimination described above, there are limits to this legal definition. For example, some grounds are excluded: discrimination on the basis of employment status is not illegal, for example. In fact, respondents in the survey could also list ‘other’ grounds for discrimination, and the evidence suggests that many did.
1.3.2 Measuring Discrimination Measuring discrimination offers considerable challenges to researchers. As discriminatory behaviour is rarely observed directly, researchers must infer its presence and consider whether or not the behaviour would have been different if the person had been a member of another group. A number of methods for measuring 2 For example, exemptions on the gender ground exist in relation to the provision of single-sex education, the provision of cosmetic services and in cases of potential breach of privacy. Cross-ground exemptions are also specified, for example in the provision of certain financial services (see Chapter 2). For details of provisions and exemptions in the Acts see www.equality.ie
The Experience of Discrimination in Ireland 3

discrimination have been used in previous research, though no single approach allows researchers to address all the important measurement issues and each have their strengths and weaknesses (Blank et al., 2004). Methods include: attitude studies; differential outcome studies; audit studies; legal caseloads and indicators of the experience of discrimination from surveys. The latter is the one used in this study. The purpose of this section is to situate the measurement of discrimination in this study in the context of different approaches to measuring discrimination.
Attitude Studies
Attitude studies have their origins in the social psychological studies of ‘prejudice’, understood as individually held beliefs about ‘others’ rooted in individual experiences (via one-to-one interactions) (Allport 1954/1979; Dovido, Glick and Rudman, 2005), and much early research on discrimination focused on prejudice. Such research attempts to understand how people came to have prejudiced views or ‘stereotypes’ of certain groups. Studies of prejudice in Ireland in the 1970s (Mac Gréil, 1980) documented early prejudiced attitudes, which had declined significantly when resurveyed in 1990 (Mac Gréil, 1996). These studies of prejudice were important for understanding how personal beliefs about others can provide the impetus for discriminatory behaviour by focusing on the ‘motivation’ for the prejudiced belief. However, these types of studies found it more difficult to explain the mechanisms, the social context in which discrimination happens, or the effects that discrimination has (Feagin and Eckberg, 1980). Large-scale EU studies have the advantage of allowing us to locate Ireland’s experience within a broader context. Studies such as the European Social Survey and the Eurobarometer survey address, for example, the attitudes of indigenous populations to immigrants. These European surveys indicate that on average, Irish respondents have been below the European average with respect to generalised resistance to a multicultural society (Hughes et al., 2007). In the context of the present report, it should be noted that while attitudinal research of this nature may be informative, there is only a moderate correlation between stereotypes and prejudice and discriminatory behaviour. Studying attitudes is not the same as measuring discriminatory behaviour.
Differential Outcome Studies
An important recent body of work on discrimination has focused on differential outcomes between groups or patterns of inequality (Darity and Mason, 1998). This approach shifts the focus from individual prejudice to differential outcomes. Many studies of differential outcomes have treated discrimination as the residual i.e., when controlling for other variables there is still an unexplained amount of disadvantage, which is then labelled ‘discrimination’ (Bridges and Nelson, 1999). Examples of this work are particularly prevalent in the analysis of labour market outcomes: a regression model is typically developed to explain an outcome variable such as wages, and includes a variable for group membership, such as gender or ethnicity, and additional observed characteristics that are expected to effect wages. The assumption is that some proportion of a gender or racial gap in earnings is related to average group differences in productivity-linked differences, and thus due to human capital differences (e.g. experience, education), and another, usually the residual part of the gap, is due to average group differences in treatment in the labour market, and thus attributed to discrimination. Many labour market studies have focused on gender discrimination and the pay gap between women and men as an outcome of institutional discrimination (England 1992) or on stratification of occupation by gender segregation in various sectors
4 The Experience of Discrimination in Ireland

(Reskin and Roos, 1990). England (1992) shows that the percentage of women in an occupation reduces wages, even controlling for a variety of other factors. Others have focused on the role of race and ethnicity in the labour market in Australia (Evans and Kelly, 1991), and in the US (Race, Ethnicity and the American Labour Market, 2005). Examples of this type of research in Ireland have looked at the wage penalty among immigrants (Barrett and McCarthy, 2006); labour market outcomes among different ethnic groups (O’Connell and McGinnity, forthcoming); the gender wage gap (Russell and Gannon, 2002); labour market outcomes among older people (Fahey and Russell, 2004); labour market outcomes among the disabled (Gannon and Nolan, 2004, 2005). Some studies have also used large-scale data sets and similar techniques to show how institutions can be imbued with certain values which discriminate against others (Jones, 1972); how IQ testing discriminates against racial/ethnic minorities (Eckberg, 1979); how class background works to disadvantage racial/ethnic groups in education (Cox, 1948) and how racial housing segregation operates (Massey and Denton, 1998). Key to this approach is to ensure that all important influences, net of discrimination, on labour market outcomes are taken account of, so that the residual can be appropriately attributed to discrimination rather than to other differences between the groups. As this is not often the case, as differences are unobserved, the remaining difference may be partly, but not completely, due to discrimination, thus discrimination may be over-estimated. Second, some would argue the clear distinction in these approaches made between ‘in-market’ and ‘pre-market’ discrimination is problematic. ‘In-market’ discrimination is simply the last in a series of processes, and need only occur when earlier attempts to restrict access to jobs, credentials and qualifications of minority groups/women has failed. Thus analysing ‘in-market’ discrimination is giving only a partial account of discrimination in labour markets and thus may under-estimate its extent (Darity and Mason, 1998).
Audit Studies
Audit studies have documented discrimination through experimental designs. These experiments can be used to provide direct observations of unequal treatment. Two individuals are matched for all relevant characteristics other than the one expected to lead to discrimination (gender, race, family status) and they both apply for a job, a good or a service. Systematic differences in outcomes can then be attributed to discrimination. Given the challenges of identifying, measuring and documenting the presence of discrimination, direct measures have considerable appeal (Newman, 1978; Darity and Mason, 1998; Riach and Rich, 2002; Pager, 2007). Such experiments have been conducted for over 30 years across 10 countries. They have investigated discrimination in recruitment towards Indians, Pakistanis, West Indians and Africans in Britain; African-Americans and Hispanics in the US; West-Indians in Canada; Vietnamese in Australia; Turks in Germany; Moroccans in Belgium, the Netherlands and Spain, and Surinamese in the Netherlands (Riach and Rich, 2002; Bertrand and Mullainathan, 2004). These include major studies conducted by the International Labour Organisation, and the Urban Institute and Fair Employment Council of Washington in the US (Riach and Rich, 2002). These experiments have also investigated discrimination in recruitment against women in the US, Australia, Austria, Britain and France, among others, with some also incorporating family status into the gender experiment (e.g., Riach and Rich 2006; Petit, 2007; Correll et al., 2007). While most experiments have been conducted in the labour market, discrimination in access to housing has also been investigated (Fix and Struyk, 1993). The key limitation of this method is its limited generalisability: findings are limited to sectors/occupations tested, and it can be difficult to put this discrimination into a larger context or link it to other types of inequalities.
The Experience of Discrimination in Ireland 5

Legal Caseloads
Another approach to the measurement of discrimination has been to look at the legal cases of tribunals or legally reported discrimination cases. Job discrimination lawsuits in the US for example, provide highly visible evidence of direct discrimination in employment (see Darity and Mason, 1998). In Ireland the Equality Tribunal is the most relevant source of such caseload data. Case files from the Equality Authority would also fall into this category. In 2005 the Equality Tribunal recorded claims of discrimination from almost 1,700 people. These claims were in respect of discrimination related to work, pensions or access to goods and services. This was the highest number of individual claimants ever, more than 29 per cent higher than the previous peak in 2002. Studies based on such data tend to focus on those who are well informed of their rights and who are highly motivated to pursue claims of discrimination. There is thus a concern that such data may not provide representative data of the nature required to accurately measure the incidence, distribution and nature of discrimination. The unrepresentative nature of such data is emphasised when we consider the history of under-reporting of discrimination by vulnerable groups (such as undocumented immigrants) because they often do not want to ‘make trouble’ or be seen to be complaining within dominant society (Wang, 2006).
Subjective Reports of Discrimination Using Large Scale Surveys
Self-reports of discrimination measure discrimination as perceived by the respondent in response to a direct question. This is the type of data upon which the results in this report are based on. An example of such a question would be: ‘In the past two years, have you personally felt discriminated against in the workplace?’ As Blank et al. (2004) note, it is not discrimination that is being directly measured but reports of experiences of discrimination. Where such surveys use a generalisable, nationally representative sample, they can provide an excellent and comprehensive picture of the experience of discrimination. They often provide information about a range of social contexts in which discrimination can happen, often in contexts or domains not covered by other methods, for example, public transport, shops and pubs. These surveys often report discrimination towards a wide range of groups, not just minority groups or groups of particular policy or research interest. Previous research has also shown that people who perceive discrimination may be more likely to report this incident anonymously in response to a direct question in a survey than make a complaint to a legal authority or other body (McGinnity et al., 2006). The data from surveys are thus considered more accurate and comprehensive. Reports of discrimination using large-scale surveys can also provide important baseline data for future research. While surveys of subjective experience make up an important part of our information on discrimination it is important to be cognisant of the limits of such data sources. While the researcher may aspire to capture discrimination as defined above (‘differential treatment on the basis of group membership that unfairly disadvantages a group’) it is essential to acknowledge the subjective nature of such reports. The validity of subjective reports may be reduced in a number of ways. Those who experience discrimination may under-report incidences of discrimination, for a variety of reasons, for example, that they do not believe the treatment is unfair or that they do not believe the treatment, while unfair, relates to their membership of a protected group. For example, respondents may believe instead that “he/she just didn’t like me, it has nothing to do with my disability.” Another issue affecting validity
6 The Experience of Discrimination in Ireland

is if discrimination is subtle or indirect. Discrimination may come in the form of glances or avoidance or ‘the feeling they got’, and these forms of discrimination are typically not picked up by direct questions in surveys. Respondents may also perceive discrimination where none exists (over-reporting). This might happen if, for example, in an ambiguous situation, respondents may falsely attribute the denial of work to discrimination that is in fact due to some other reason like qualifications, timing or even chance. The key point relating to subjective interpretation of discrimination is that two respondents may perceive the same behaviour differently: one may report it as discrimination, the other not. This variation is problematic if it varies systematically across the groups of interest. For example, previous research shows that the highly educated tend to report more discrimination in a range of situations, despite being objectively advantaged (McGinnity et al., 2006). This group tends to be outspoken, informed about equality legislation and sensitive to unequal treatment. So a highly educated person may be more likely to report the same incident as discrimination than someone with low education, and this may bias results. In the next section we discuss the Equality Module, the survey that forms the basis of this study. We discuss how the survey addresses some of the problems of subjective reporting, for example by supplying respondents with a definition of discrimination, and how in general the survey uses best practice to limit the potential bias associated with subjective reporting. Another way of addressing the limitations of subjective self-reports of discrimination is to cross validate the findings with other sources. In general, researchers have found direct self-reports of discrimination like these to be accurate and reliable when cross validated against other data sources (Blank et al., 2004). The current report is an important step in building an understanding of discrimination in Ireland. Ideally, this information should be supplemented with research of the types discussed above (e.g. differential outcome studies; audit studies; legal caseloads etc.) and where possible within this study we make reference to information on discrimination in Ireland gathered using other methods.
1.4 Measuring Discrimination Using the Equality Module The data used in the current report were collected by means of a special module of the Quarterly National Household Survey (QNHS). Each quarter the Central Statistics Office (CSO) produces a Quarterly National Household Survey (QNHS), the main objective of which is to provide estimates on short-term indicators of the labour market. The QNHS is continuous and targets all private households in the state. The QNHS is the second largest statistical project undertaken by the Central Statistics Office after the Census; the total sample per 13-week quarter is 39,000. The response rate is high (93 per cent) and the survey results are weighted to agree with population estimates broken down by age, sex and region.3 Special survey modules are also included for the collection of data on social topics and in the fourth quarter of 2004 a special module on Equality was included. In this module a set of extra questions, mostly covering questions on the experience of discrimination, was asked of approximately 24,600 QNHS respondents, all aged 18 years and over and interviewed directly. The number of cases is lower than the
3 More details about the QNHS are provided in the Methodological Appendix to the report.
The Experience of Discrimination in Ireland 7

overall QNHS for a number of reasons. To ease respondent burden, those participating in the survey for the first time were not questioned on the module, and proxies were excluded because of the nature of the questions. Respondents could also opt out of the extra module, though this only accounts for a small proportion of difference in number of respondents. This module provides the basis for our analysis here. We also draw on additional data from the main QNHS, which was matched to the module data by the CSO specifically for this project. Through the representative and broadly based sample of the QNHS important baseline data on the experience of equality in Ireland could be collected. In addition to the specific questions on subjective experiences of discrimination the module also included some classificatory information not routinely collected in the QNHS. This included two questions on disability, detailed information on religious affiliation and a question on ethnicity. The latter piece of information is particularly important, as this is the first time such information was collected on a nationally representative survey in Ireland. Note that ethnicity is used in this report to define the categories White/Black/Asian/Other identified in the survey in preference to race. Elsewhere (i.e. the US), race is defined as a construct based on observable physical characteristics (e.g. skin colour) that have acquired social significant meaning (see Banton, 1994). Ethnicity more typically refers to cultural factors such as language, religion and nationality (Bobo, 2001). However, we use ethnicity to refer to these categories to be consistent with the use of the term in the Equality Module, and in the 2006 Census of the Irish Population, on which this classification is based (see Garner, 2004, for a discussion of the use of the term ethnicity in Ireland). The module consists of a series of questions asking adult respondents whether they experienced discrimination in the last two years across nine situational contexts or domains (details of the questionnaire are provided in the Methodological Appendix). Those who made an affirmative response in any of the domains were then asked further questions about the nature of the experience. First they were asked on what grounds they felt they had been discriminated against. Respondents could choose from the nine grounds covered by the Irish equality legislation or select ‘other’. Respondents were also asked to provide some limited information on the frequency of discrimination, the actions they took (if any) in response to discrimination and their knowledge of their rights under Irish equality law. Those experiencing discrimination were also asked to assess the impact it had on their lives. Before these questions were asked, each respondent was shown a prompt card with a definition of discrimination which closely follows the legal definition (Box 1.1).
Box 1.1: Definition of Discrimination on Equality Module (Prompt Card)
Discrimination takes place when one person or a group of persons are treated less favourably than others because of their gender, marital status, family status, age, disability, ‘race’ – skin colour or ethnic group, sexual orientation, religious belief, and/or membership of the Traveller community. Discrimination can occur in situations such as where a person or persons is/are refused access to a service, to a job, or is/are treated less favourably at work. In other words, discrimination means treating people differently, negatively or adversely because they are for instance Asian, Muslim, over 50 years of age, a single parent, and/or homosexual. If the reason you may have been treated less favourably than someone else is due to another reason (such as your qualifications, being over an income limit or because you are further back in a queue for something) this does not constitute discrimination.
8 The Experience of Discrimination in Ireland

Interviewers were also well briefed on the definition of discrimination, with a whole series of examples of discrimination which they could give respondents if requested. What respondents are not made aware of are details of the exemptions of the legislation, so it is likely that responses are based on the spirit of the legal definition of discrimination rather than the detail. Following best practice, all questions ask respondents whether they experienced discrimination in a specific situation or venue, for example:
“In the past two years, have you personally felt discriminated against in respect of obtaining housing/accommodation?”
Housing/accommodation is an example of one ‘domain’ or situation. The domains covered are usefully divided into Work-related and service domains. There are six other service domains besides obtaining accommodation, namely: using the services of banks, insurance companies etc; in shops pubs or restaurants; accessing health services; accessing other public services; using transport services; in relation to education. The questions on the experience of discrimination also cover two Work-related domains: in the workplace and in accessing work (applying for a job). The full range of questions is found in the Methodological Appendix. This is a wide range of situations where respondents might have experienced discrimination, though note as with any specific listing, some situations may be omitted. Following the individual questions about the respondent’s experience of discrimination comes a question about why respondents think they were discriminated against, or on what ‘grounds’ they felt the discrimination was based, if they reported that they were discriminated against. This question takes the form: Why do you think you were discriminated against – was it because of your… (Multiple responses allowed)
1. gender, 2. marital status, 3. family status (e.g. pregnant or with children or other dependants), 4. age, 5. disability, 6. race/ skin colour/ ethnic group/ nationality, 7. sexual orientation, 8. religious belief, 9. membership of the Traveller community,
10. Other.
As can be seen these grounds are based on those listed in the equality legislation. Adding the ‘other’ category means that respondents are not limited to discrimination on the basis of the nine grounds listed. However, as no further information is given on what the other grounds might be, this information is limited (see Chapter 3 for a further discussion of the ‘other’ ground). While knowing the respondent’s assessment of the situation does provide very useful additional information on the reported incident, asking individuals to assess the motive behind discrimination adds another layer of interpretation. It can be difficult for the respondent to untangle potentially competing motives from each other, for example, respondents may feel discriminated against on the grounds of race when in fact it was due to age.
The Experience of Discrimination in Ireland 9

There are a number of ways in which the Equality Module follows best practice in order to maximise the validity of the information collected on subjective discrimination, by paying attention to both methodological factors (sampling, interviewing, question design – both placing and wording) and reporting biases (Smith, 2002). In terms of sampling, a random sample of the target population is clearly preferable to give an accurate picture of discrimination in the target group. This is the strategy in the QNHS Equality Module (for more details on sampling see the Methodological Appendix). For overviews of subjective discrimination it is also useful to have a wide range of target groups, where possible, to avoid excluding groups that may be experiencing discrimination. The QNHS Equality Module has a very wide range of groups that may be experiencing discrimination. Attention should also be paid to question wording (Smith, 2002). The most valuable measures of discrimination record specific instances of discrimination experienced by individuals, groups or relating to venues: questions about the overall level of discrimination are too general. Questions work best when they refer to a specific time frame (i.e. the past year) and a specific venue (in interaction with the police, housing, public transportation, banks etc). This is the strategy adopted by the QNHS Equality Module. It should be also noted that the survey, and indeed the legislation which underpins it, does not limit discrimination to minorities, or particular groups under the nine grounds (though the examples listed in the interviewer prompt card are all of discrimination towards minorities). For example, two respondents may report that they were discriminated against on the basis of ethnicity, one Black, one White. The Black respondent may feel that they are passed over for a promotion because they are Black: the White respondent may feel that they are not promoted because they are White. Both are treated as discrimination. An alternative strategy would be to only count discrimination against ‘minorities’ or particular groups under the nine grounds. For example, of those who responded to the question as to whether they experienced discrimination on the basis of ethnicity, only count responses from individuals from ethnic minorities, and disregard the others. Yet this involves the researcher making fairly heroic assumptions about the nature of discrimination. If we then consider gender – should all instances of discrimination on the basis of gender reported by men be excluded? Should all instances of discrimination on the basis of marital status reported by single people be excluded? The aim of this report is to map the extent of discrimination on a range of grounds and domains. Excluding certain groups risks telling a very partial story, so this strategy is not pursued. In summary, in this survey the respondents defined for themselves what they felt qualified as discrimination, broadly guided by the legal definition in Ireland. Ultimately, the survey data gives us new nationally representative data about the nature of ‘reported discrimination’ in Ireland, and the results in this report should be understood in this light. We note that the results are subjective reports at various points throughout this study. Despite these limitations the QNHS Equality Module offers a unique and important first attempt to measure subjective discrimination using a generalisable, and nationally representative sample, which will offer a better understanding of the scope of ‘reported’ and ‘experienced’ discrimination available thus far in Ireland today. This survey provides information about a range of social contexts in which discrimination can happen (work and service domains), and reports discrimination towards a wide range of groups. In all, this survey has the advantages of providing us with data on forms of discrimination not asked about before, some of which is very difficult to
10 The Experience of Discrimination in Ireland

detect using other methods. People who perceive discrimination may be more likely to report this incident anonymously in response to a direct question, than report it to a legal authority or some other body. As mentioned above such surveys can provide important baseline data for future research. Finally, since the survey asks direct questions about discrimination, it was possible for the CSO to follow up with questions about the frequency, impact and response to discrimination.
1.5 Report Plan This report takes the following form. In Chapter 2 we focus on the situational context or domains in which discrimination occurs. We examine self-reports of discrimination in the workplace, in looking for work and in seven service domains, investigating whether there is variation in the characteristics of those who experience discrimination in different situations. We discuss the proportions of the social/demographic groups who reported having experienced discrimination in the various domains and use regression modelling to try to unpick the most influential characteristics in this regard. The statistical methods used in the report are introduced and explained and we provide a guide to interpreting the main results. Data on the reported “grounds” of discrimination are discussed in Chapter 3. As discussed above this information is the respondent’s own interpretation of the motivation behind his or her experience of discrimination. We compare the social/demographic characteristics of respondents who selected certain grounds against the relevant social/demographic characteristics of the population. For example, we compare the marital status of those who believed they had been discriminated against on the grounds of marital status to the marital status of the whole population. This analysis allows us to see which sub groups (e.g. single people, separated etc.) are most at risk. We attempt to address the fact that almost one-third of reported grounds fall into the ‘other’ category, by exploring the characteristics of those who respond in this way. In Chapter 4 we focus on the distribution of subjective experiences of any discrimination, Work-related discrimination and service-related discrimination across social and demographic groups. We look at a range of groups believed to embody characteristics that are important for examining experiences of discrimination. Many of these characteristics are covered by anti-discrimination legislation in Ireland such as gender, age, family status, marital status, race/ethnicity, nationality, disability and religion. We also included employment status and education level as these characteristics have been found to be associated with discrimination in international research, and because these are important lines of social stratification in Irish society. We attempt to identify exactly who is most vulnerable to discrimination. Chapter 5 is concerned with a range of data on the reported impact of discrimination, the frequency of reported incidents, action taken in response to these experiences and knowledge of equality rights. We analyse these variables individually before exploring whether they relate to one another, and if so how. In the final chapter we draw conclusions from the analysis and consider the implications of the findings for policy development in the equality arena. We also consider the data needs and gaps highlighted by the current research.
The Experience of Discrimination in Ireland 11

2. WHERE DO PEOPLE EXPERIENCE DISCRIMINATION? This chapter is concerned with where reported discrimination occurs. Discrimination is likely to affect people differently in different contexts and it is important to take account of the context in which discrimination occurs: are some situations more open to discrimination than others? Are certain groups of respondents more vulnerable to discrimination in some domains than others? Such issues will be addressed in the discussion below. By means of the questions shown in Box 2.1 subjective experience of discrimination was examined in the survey across nine situations or domains. Two domains are Work-related: looking for work and in work. A further seven domains measure the experience of discrimination in accessing or using a range of public and private services.
Box 2.1: Questions on Domain of Reported Discrimination from Equality Module Questionnaire
In the past two years, have you personally felt discriminated against… 1. in the workplace? 2. while looking for work? 3. in places like, shops, pubs, or restaurants? 4. using services of banks, insurance companies or other financial institutions? 5. in relation to education? 6. in respect of obtaining housing/accommodation? 7. in respect of accessing health services (e.g. getting access to a GP, access to
hospital, access to specialist treatment)? 8. in respect of using transport services? 9. in respect of accessing other public services either at a local or national level? It is important to note that the phrasing of some questions means they could be interpreted to include discrimination not only by service providers but also by other service users. This is particularly true for the question “have you personally felt discriminated against in places like shops, pubs and restaurants”. Similarly discrimination in the workplace could potentially be initiated by co-workers or customers as well as managers and employers. The subjective discrimination analysed here is also restricted to the domains of employment and access to services and, therefore, some sorts of discrimination are not included in the figures. As mentioned in Chapter 1, in line with best practice (Blank et al. 2004), the experience of discrimination is time delimited, with respondents asked to recall incidences in the last two years. We use two approaches to analyse the data below. First in Section 2.1 we examine the risk of discrimination by simply comparing proportions of respondents experiencing discrimination across different domains. Sections 2.2 and 2.3 employ a second approach: regression analysis, allowing us to look more closely at the risks of discrimination for different groups of respondents, in different domains, while holding other factors constant. The methodology is explained in detail below. We look first at Work-related discrimination (Section 2.2) and then at the service domains (Section 2.3).
12 The Experience of Discrimination in Ireland

2.1 Risk of Discrimination Associated with Different Domains Table 2.1 shows the percentage of respondents who reported discrimination in each of the nine domains. The table also shows estimates of how many people reported subjective discrimination (000s).4 Overall, just over 381,000 people or 12.5 per cent of the population report experiencing discrimination in at least one of the domains covered by the questionnaire. Service-related discrimination was reported by 276,000; 157,000 reported Work-related discrimination.5 As Table 2.1 shows, the highest rate of discrimination reported was in relation to looking for work. Almost 70,000 people felt they had been discriminated against while looking for work over the preceding two years, representing 5.8 per cent of the population that had engaged in job search. Discrimination in the workplace was the next most commonly reported: almost 5 per cent of the eligible population felt discriminated against in this domain. Of those respondents who had sought accommodation in the last 2 years, 4 per cent reported experiencing discrimination, though this relates to a much smaller number of people, as many people had not sought accommodation in the last 2 years. Discrimination related to the use of financial services such as banks and insurance companies was reported by the largest overall number of respondents: 112,500 people (3.7 per cent of the population) reported discrimination in this domain. The lowest rates of discrimination are reported in accessing education by 1.3 per cent, other public services by 1 per cent and using transport services reported by 0.7 per cent of the eligible population respectively.
Table 2.1: Incidence and Rates of Discrimination Across Domains Experienced Discrimination Experienced
Discrimination (000s)
Eligible Population
(000s)
Rate %
Any discrimination 381.6 3,061.1 12.5 Any Service-related discrimination 276.7 3,061.1 9.0 Any Work-related discrimination 156.9 2,157.4 7.2 While looking for work 73.9 1,275.8 5.8 In the workplace 100.6 2,076.2 4.8 Obtaining housing or accommodation 43.6 1,097.3 4.0 Using services of banks, insurance etc. 112.5 3,061.1 3.7 In shops, pubs or restaurants 80.7 3,061.1 2.6 Accessing health services 51.3 2,903.3 1.8 In relation to education 16.7 1,321.4 1.3 Accessing other public services 30.1 3,061.1 1.0 Using transport services 21.7 3,061.1 0.7 Notes: Respondents could report discrimination in multiple domains. 000s figures are weighted to reflect the total population aged over 18 years. The rates (%) are calculated as a proportion of the eligible population, i.e. we exclude those who say the question is not applicable to them e.g. because they have not searched for work or looked for accommodation (see discussion in text). Those who felt they had been discriminated against in work were asked to indicate whether this related to pay, promotion, work conditions, bullying/harassment or ‘other’ issues. Bullying/harassment was the most common form of discrimination
4 The estimates are based on a sample of the population so the figures have been multiplied or ‘grossed up’ to estimate the true population figures. 5 People can report experiencing discrimination in a number of domains, which is why the total for service and work-related discrimination exceeds the total number for any discrimination.
The Experience of Discrimination in Ireland 13

experienced in work (26 per cent), followed by other (25 per cent), work conditions (19 per cent), promotion (16 per cent) and pay (14 per cent). It is important to note that the percentages refer to the proportion of the eligible population. If a respondent answered “not applicable” to one of the questions listed in Figure 2.1 they are excluded from the relevant domain in Table 2.1. For example, someone who left the education system 20 years ago is likely to tick ‘not-applicable’ to the question relating to discrimination in relation to education in the last 2 years.6 Excluding respondents who answer “not applicable” results in certain selection effects. When we exclude non-applicables we are no longer discussing the same group of respondents across domains. For example, if we exclude those who have answered “not applicable” to discrimination in the workplace we reduce the population from just over 3 million to just over 2 million respondents: if we exclude those who have answered not-applicable to discrimination in education the sample is reduced from just over 3 million to 1.3 million (see Table 2.1, figures are weighted to represent the total population). As can be seen from Table 2.1, this point is most relevant to the two Work-related domains (persons who have not looked for work or been in work in the last two years are excluded) and to education, health and accommodation domains (respondents who have not used these services in the reference period are excluded).7 In the rest of the chapter we consider how the risk of discrimination in different domains varies by social and demographic groups. We do this in two ways. First we consider how the risk of discrimination varies among women and men, across age, national, ethnic, religious groups etc. These simple group averages from the data are called ‘rate’ or sometimes ‘raw risk’ in the tables. However, if we focus on group differences alone, the relative risk of one group may be determined in part by the composition of the group in terms of their vulnerability to other risk factors. For example, non-Irish respondents have a higher reported “raw” risk of discrimination than Irish nationals in shops and pubs. Is this higher risk because of their ethnicity, religion, age… or a combination of several of these characteristics? Using multivariate modelling allows us to disentangle the effect of a whole series of factors. The method allows us to look at the effect of membership of one demographic/social group on discrimination separately by holding all the other characteristics constant. In each model a subcategory within a group (e.g. White within ethnicity) is used as the reference group and conclusions are drawn about other subcategories (Black, Asian, Other) relative to the reference group. The results of these models are presented as ‘modelled risk’ in the Tables.8 The models allow us to assess the strength of the relationship between discrimination and, for example, socio-demographic characteristics in terms of odds ratios. This allows us to make statements such as “respondents of Black ethnicity are 4.6 times more likely to report experience of discrimination in shops, pubs or restaurants than those of White ethnicity”. The models also allow us to determine whether the results are robust or ‘statistically significant’, i.e. whether we can be confident that the differences would
6 Why does this matter? It matters because the discrimination rate is calculated as the number experiencing discrimination (numerator) as a proportion of all ‘at risk’ (denominator). If we use the whole adult population as the denominator in the case of education, the discrimination rate will be misleadingly low. 7 The exclusion of respondents who answered “not applicable” means that results are different from the CSO release on the QNHS Equality Module (Central Statistics Office, 2005). 8 Logistic regression was used for these analyses since the “dependent” or “outcome” variable has two categories: that is, respondents perceived discrimination in a domain or they did not.
14 The Experience of Discrimination in Ireland

not have been generated by chance. These detailed results are presented in the Appendix to this chapter. In the chapter we present a simplified version of the model results, which simply states whether the modelled risk is the same, higher or lower than the reference group. In some cases the model might indicate that the group differs from the reference group, but that there are not enough people in the group to firmly establish this (i.e. establish statistical significance). In this case we say the group is the ‘same’ as the reference group, as we do not have enough evidence to establish otherwise. Interested readers may refer to the Appendix Tables at the end of this chapter for more details on both the strength of the effects and the statistical significance.
2.2 Work-related Discrimination In this section we consider findings on Work-related discrimination, distinguishing discrimination in the workplace from discrimination when looking for work. We argue that for Work-related discrimination it is important to look not only at the socio-demographic characteristics of individuals but also at the characteristics of the job. Previous research among employees suggested that, for example, the industrial sector in which workers are located influences employees’ perceptions of fairness and equality in their organisations (O’Connell and Russell, 2005). In this section we construct two separate models of discrimination at work and discrimination seeking work, controlling for both socio-demographic characteristics and job characteristics. However, we discuss them separately: in Table 2.2 we look at differences between socio-demographic groups; in Table 2.3 we consider ‘organisational’ characteristics. In each case, Columns 2 and 4 of the tables present ‘raw’ or simple group differences, Columns 3 and 5 of the table present modelled results.
2.2.1 Work-related Discrimination by Socio-demographic Characteristics Table 2.2 presents the results for social/demographic characteristics (see Table A2.1 for full model results). Here we discuss results for each group in turn, highlighting where the factors associated with discrimination differ between the two work domains. Note that as the number of people who were seeking work in the past two years was smaller than the number of people at work, the sample for the analysis of discrimination seeking work is smaller.
Gender and Age
Women were more likely than men to feel they have been discriminated against at work - 5.7 per cent of women report this, compared to 4.1 per cent of men, and this difference remains when we control for differences in socio-demographic characteristics, including marital and family status, and job characteristics. These results are consistent with analyses of working conditions and labour market experiences which show that women are disadvantaged relative to men in relation to pay (Barrett et al., 2000; Russell and Gannon, 2002; Russell et al., 2005), and occupational positions (O’Connor, 1998; Fahey et al., 2000). However, the size of the gender difference is smaller than these studies on objective conditions would suggest. This may be because objective labour market inequality is determined by structural factors other than largely direct experiences of discrimination recorded in the survey. The table also shows that men were more likely to feel they have been discriminated against in job search. Once again this finding is robust when we control for compositional effects.
The Experience of Discrimination in Ireland 15

Table 2.2: Experience of Work-related Discrimination in Last Two Years: Raw and Modelled Risk for Socio-Demographic Groups
At Work Looking for Work % Rate or
‘Raw Risk’ Modelled Risk
Rate or ‘Raw’ Risk
Modelled Risk
Col. (1) Col. (2) Col. (3) Col. 4 Col. 5 All 4.8 - 5.8 - Male 4.1 Reference 6.6 ReferenceFemale 5.7 Higher 4.9 LowerAge Under 25 years 5.0 Reference 5.7 ReferenceAge 25-44 years 5.4 Same 5.7 SameAge 45-54 years 4.8 Same 7.6 SameAge 55-64 years 3.2 Same 5.7 SameAge 65 years 1.1 Much lower 1.6 Much lowerWhite 4.6 Reference 5.5 ReferenceBlack or Black Irish 10.0 Same 18.2 SameAsian or Asian Irish 16.7 Same 7.1 SameOther including mixed
background 13.6 Same 15.0 Same
Irish 4.4 Reference 4.9 ReferenceNon-Irish 10.6 Higher 12.6 Much higherCatholic 4.2 Reference 4.9 ReferenceChurch of Ireland 5.0 Same 7.7 SameOther Christian 10.1 Higher 11.3 HigherIslam 12.5 Same 16.7 SameOther Religion 12.1 Much higher 11.4 SameNo Religion 8.0 Higher 10.0 HigherNo disability 4.6 Reference 5.3 ReferenceDisabled 9.0 Much higher 11.4 HigherSingle 5.2 Reference 6.1 ReferenceMarried 4.5 Lower 5.1 LowerSeparated 6.9 Higher 9.4 SameWidowed 1.8 Lower - SameNo child <15 years 3.6 Reference 5.1 ReferenceCouple child<15 years 5.5 Higher 5.9 SameLone parent child<15 years 6.0 Same 8.8 SamePrimary Education 3.6 Reference 8.5 ReferenceLower Sec. Level Education 3.4 Same 5.5 LowerUpper Sec. Level Education 4.3 Same 4.6 LowerPost Sec./Third Level 6.1 Higher 5.5 SameEmployed 4.7 Reference 3.8 ReferenceUnemployed 10.8 Much higher 22.0 Much higherInactive 4.2 Same 7.1 Much higherNote: Rate refers to percentage of respondents that reported discrimination in last two years within each group. Weighted. “Modelled risk” refers to relative risk of subcategories to discrimination when compared to the reference subcategory within group, when other characteristics are controlled (e.g. married respondents compared to single respondents). Much higher = more than twice the risk; Much lower = less than half the risk compared to reference group. Same = group does not differ significantly to reference group. Models are not weighted following convention. Models also include organisational characteristics. Full model results are reported in Appendix Table A2.1. The very marked increase in the demand for female labour in the past ten years, particularly in service sector jobs, may be one reason for this (O’Connell and Russell, 2007). It is plausible that men may have found it more difficult to get a job than women in the two years preceding the survey. Age has relatively little impact on either workplace discrimination or looking for work, so older age groups (45-54 and 55-64 years) are no more likely to report discrimination. In fact the small number of over 65s at risk of Work-related
16 The Experience of Discrimination in Ireland

discrimination are much less likely to report either discrimination at work or seeking work. Is this consistent with previous evidence on the situation of older workers in the Irish labour market? Evidence on objective conditions of older people in the labour market is nuanced. Among those in employment, older workers tend to occupy higher occupational positions (Russell and Fahey, 2004). Wages also increase with age, due to increased seniority and experience (e.g. Barrett et al., 2000). Similarly, the rates of unemployment tend to be lower among older workers. However, a number of studies have shown that, once unemployed, older people have more difficulty re-entering employment and so can experience longer duration of unemployment.9 Therefore, the absence of a significant age effect may arise because the advantageous position of the majority of older workers outweighs the more negative position of the minority trying to access employment or training. Older people may also be less likely to report discrimination, other things being equal.
Nationality, Ethnicity and Religion
The current survey also shows that non-Irish nationals are more than twice as likely as Irish respondents to report discrimination in the work place. Non-Irish national respondents were also more than twice as likely to report discrimination when looking for work than Irish nationals. When we control for compositional differences in the models, these differences are maintained. The fact that non-Irish nationals experience more discrimination than Irish nationals is not accounted for by socio-demographic or job characteristics. This is broadly in line with the findings of McGinnity et al. (2006), in their study of racism and discrimination among recent migrants, who found that over 30 per cent of the sample experienced insults or other forms of harassment at work. These models do not show strong evidence that minority ethnic groups are more likely to report discrimination either at work or seeking work, but the numbers in the Black, Asian and Other categories are small.10 Note also that most respondents from minority ethnic groups are non-Irish nationals and thus experience higher levels of Work-related discrimination: these models just do not indicate an additional penalty for being Black, Asian or other ethnicity, once nationality is accounted for. Religion is also associated with the perception of discrimination in the workplace. While Church of Ireland respondents do not differ from the majority (Catholics), respondents of “other Christian”, ‘other’ religion and no religion were all significantly more likely than Roman Catholics to report experience of discrimination at work. “Other Christian” respondents and those of ‘no religion’ also experienced more problems looking for work than the reference group.
Disability
Disabled people are much more likely to report Work-related discrimination than non-disabled people. This is true of discrimination in work, where twice as many disabled people reported discrimination (9 per cent disabled versus 4.6 per cent non-disabled, the difference is maintained in the model). It is also true of looking for work, where more than twice as many disabled people reported experiencing discrimination (11.4 per cent versus 5.3 per cent non-disabled, once again the difference is maintained in the model).
9 Comparing unemployment rates among older and younger workers is complicated by the tendency of older unemployed workers to withdraw into retirement. 10 In fact the ‘in work’ models suggests that Asians may be more likely to experience discrimination in work but the difference is only marginally statistically significant, and reported in the table as ‘same’.
The Experience of Discrimination in Ireland 17

This is consistent with previous Irish research, which found that people with disabilities are significantly disadvantaged in the labour market. Gannon and Nolan (2004) found that people with disabilities were more likely to be unemployed or outside the labour market holding other characteristics constant, and in a further study found that they were also disadvantaged in terms of earnings (Gannon and Nolan, 2005).
Marital and Family Status
In both job search and at work married people were somewhat less likely to report discrimination than single people. The small number of separated respondents report higher levels of discrimination at work than those who are single. The number of widowed respondents who answered the Work-related questions is small. In terms of family status, couples with children have somewhat higher odds of experiencing discrimination in work than couples without children. Lone parents with children under 15 report somewhat higher rates of Work-related discrimination but the models show that much of this difference is accounted for by other characteristics (i.e. age, education, employment status) and that the difference between lone parents and couples without children is not statistically significant once other characteristics are controlled for.
Education and Employment Status
Regarding education, those with post-secondary/third level education were more likely to report discrimination in work, and this difference is borne out by the models, so it is not simply due to compositional effects. Some of the higher education effect may be related to expectations however (i.e. of pay, promotions), and propensity to report discrimination. Results from other research show that the highly educated are more likely to report experiencing discrimination (e.g. McGinnity et al., 2006; EUMC, 2006). In terms of looking for work, it is the low educated (primary education) who have the highest raw rate of discrimination, at 8.5 per cent, which is consistent with this group having greater difficulties in accessing employment and a higher unemployment rate (O’Connell and Russell, 2007). In the model, it is those with lower and upper secondary education who differ significantly from the low educated: the higher educated do not differ significantly from the low educated. Those currently unemployed are significantly more likely to report having experienced discrimination in the workplace – more than twice as likely as the employed. The model results show that they are much more likely to experience discrimination in the workplace after controlling for their personal characteristics, such as education and age, and job characteristics, like sector and occupation. The effect of being unemployed is even more marked with regard to seeking work. Here over one-fifth of the unemployed experience discrimination while seeking work, compared to under 4 per cent of the employed. It is not possible from this data to assess to what extent their unemployment is due to discrimination on the part of employers, but it is clear that a sizeable proportion of this group feel they have been discriminated against in seeking work. Discrimination seeking work is also high among those inactive in the labour market.
2.2.2 Work-related Discrimination by Organisational Characteristics In this section we examine the influence of organisational characteristics on the levels of Work-related discrimination experienced by respondents. Previous research among employees found that industrial sector, size of firm and presence of a formal equality policy influenced respondents’ perceptions of fairness and equality in their organisations regarding pay/conditions, recruitment and career development
18 The Experience of Discrimination in Ireland
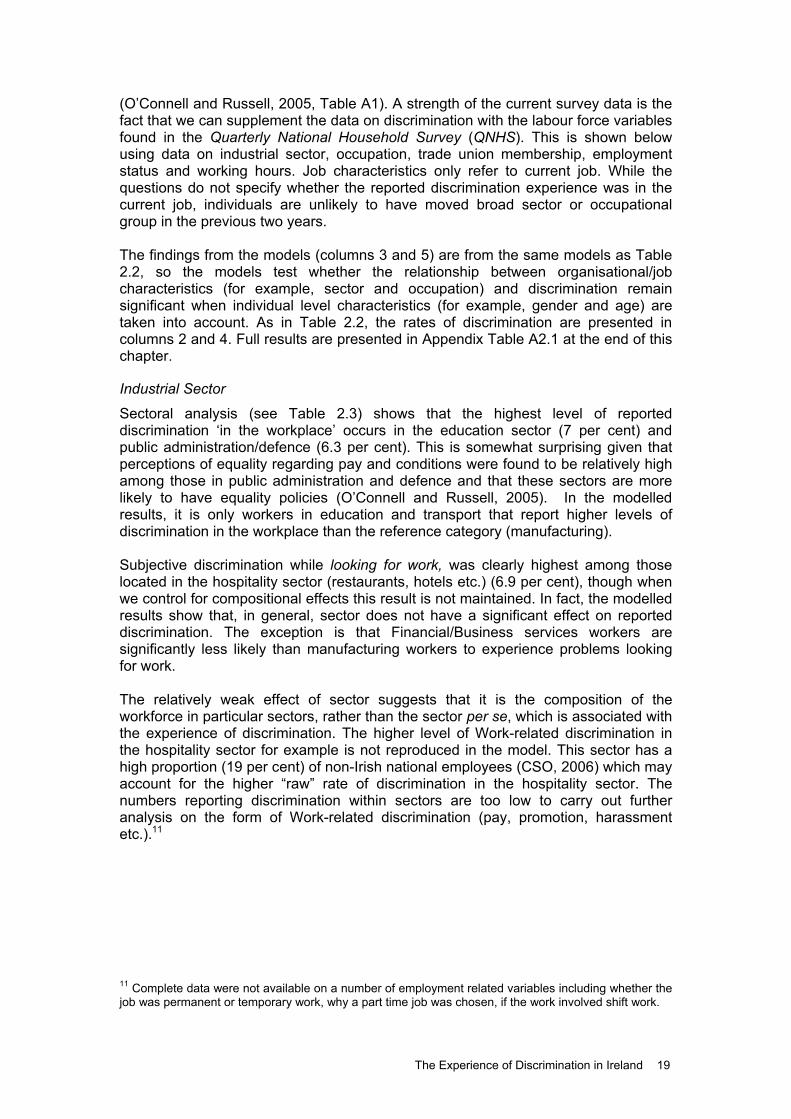
(O’Connell and Russell, 2005, Table A1). A strength of the current survey data is the fact that we can supplement the data on discrimination with the labour force variables found in the Quarterly National Household Survey (QNHS). This is shown below using data on industrial sector, occupation, trade union membership, employment status and working hours. Job characteristics only refer to current job. While the questions do not specify whether the reported discrimination experience was in the current job, individuals are unlikely to have moved broad sector or occupational group in the previous two years. The findings from the models (columns 3 and 5) are from the same models as Table 2.2, so the models test whether the relationship between organisational/job characteristics (for example, sector and occupation) and discrimination remain significant when individual level characteristics (for example, gender and age) are taken into account. As in Table 2.2, the rates of discrimination are presented in columns 2 and 4. Full results are presented in Appendix Table A2.1 at the end of this chapter.
Industrial Sector
Sectoral analysis (see Table 2.3) shows that the highest level of reported discrimination ‘in the workplace’ occurs in the education sector (7 per cent) and public administration/defence (6.3 per cent). This is somewhat surprising given that perceptions of equality regarding pay and conditions were found to be relatively high among those in public administration and defence and that these sectors are more likely to have equality policies (O’Connell and Russell, 2005). In the modelled results, it is only workers in education and transport that report higher levels of discrimination in the workplace than the reference category (manufacturing). Subjective discrimination while looking for work, was clearly highest among those located in the hospitality sector (restaurants, hotels etc.) (6.9 per cent), though when we control for compositional effects this result is not maintained. In fact, the modelled results show that, in general, sector does not have a significant effect on reported discrimination. The exception is that Financial/Business services workers are significantly less likely than manufacturing workers to experience problems looking for work. The relatively weak effect of sector suggests that it is the composition of the workforce in particular sectors, rather than the sector per se, which is associated with the experience of discrimination. The higher level of Work-related discrimination in the hospitality sector for example is not reproduced in the model. This sector has a high proportion (19 per cent) of non-Irish national employees (CSO, 2006) which may account for the higher “raw” rate of discrimination in the hospitality sector. The numbers reporting discrimination within sectors are too low to carry out further analysis on the form of Work-related discrimination (pay, promotion, harassment etc.).11
11 Complete data were not available on a number of employment related variables including whether the job was permanent or temporary work, why a part time job was chosen, if the work involved shift work.
The Experience of Discrimination in Ireland 19

Table 2.3: Experience of Work-related Discrimination in Last Two Years: Raw and Modelled Risk for Job Characteristics
In Work Looking for Work %
Rate Modelled Risk
% Rate
Modelled Risk
Col. (1) Col. (2) Col. (3) Col. (4) Col. (5) All 4.8 - 5.8 - INDUSTRIAL SECTOR Manufacturing 4.6 Reference 3.8 Reference Agriculture 2.1 Same 3.3 Same Construction 2.3 Same 2.9 Same Retail 4.0 Same 3.0 Same Hotels 5.5 Same 6.9 Same Transport 5.6 Higher 3.6 Same Financial 5.6 Same 3.0 Lower Public Administration 6.3 Same 3.0 Same Education 7.0 Higher 2.9 Same Health 5.7 Same 4.3 Same Other services 3.5 Same 4.7 Same OCCUPATION Managers and Administrators 3.5 Reference 2.7 Reference Professional 5.6 Same 3.6 Same Associate Prof. & Technical 5.5 Same 5.7 Higher Clerical and secretarial 5.7 Same 3.6 Higher Craft and related 2.9 Same 1.8 Same Personal Services & Sales 5.3 Same 4.4 Much higher Plant & machinery 5.4 Higher 3.9 Same Other occupations 4.4 Same 5.0 Same OTHER JOB CHARACTERISTICS Full time 4.6 Reference 3.4 Reference Part time 5.3 Same 5.4 Higher Non-Self-employed 5.3 Reference 4.3 Reference Self-employed 2.1 Lower 5.9 Same Non-Trade Union Members 4.2 Reference 4.2 Reference Trade Union Member 6.2 Higher 2.5 Same Note: Rate refers to proportion of eligible respondents that reported discrimination in last two years within each group. Weighted. “Modelled risk” refers to relative risk of subcategories to discrimination when compared to the reference subcategory within group, when other characteristics are controlled (e.g. married respondents compared to single respondents). Much higher = more than twice the risk; Much lower = less than half the risk compared to reference group. Same = group does not differ significantly to reference group. Models are not weighted following convention. Models are based on the eligible population and also include socio-demographic characteristics. Full model results are reported in Appendix Table A2.1.
Occupation
Next we consider Work-related discrimination by the occupation of workers. This is the closest available approximation to a social class indicator but is only available for those currently employed. Table 2.3 shows that while personal and protective services workers are at most risk of discrimination in the workplace (5.8 per cent) and craft workers are least at risk (2.9 per cent), workers in more advantaged positions including professional and associate professional occupations all report more discrimination in the workplace than the average for the whole sample (5.6 per cent and 5.5 per cent respectively, compared to 4.8 per cent average). However, when other compositional effects are accounted for in the model, only plant and machine operatives were more likely to perceive discrimination in the workplace than managers and administrators. We might have expected a clear occupational
20 The Experience of Discrimination in Ireland

gradient, where all those in positions lower down the occupational hierarchy would report more discrimination at work, but with the exception of machine operatives, this is not the case.12 When looking for work, respondents in associate professional and technical and sales/ personal services also reported high levels of discrimination (5.5 per cent and 4.4 per cent respectively). Craft and related workers report very low levels of discrimination in looking for work, and at work. The models indicate that occupation has a greater impact on experience of discrimination when looking for work than in the workplace: clerical and secretarial, associate professional and technical, sales and personal services were all associated with a higher incidence of experiencing discrimination while looking for work than the reference group (managers and administrators).13 Some interesting effects of other job characteristics were also discovered in the data (see Table 2.3). For example, trade union members were somewhat more likely to have reported discrimination in the workplace (6.2 per cent) than non-union members (4.2 per cent).14 Trade Union members also emerge as vulnerable to workplace discrimination in the model. We cannot determine the direction or causality of this relationship with the current cross-sectional data, it is possible that trade union members feel discriminated against because of their membership or that the experience of work place discrimination may motivate people to become union members. It is also possible that trade union members have a higher propensity to report discrimination. The self-employed were significantly less likely to experience discrimination in the workplace. This is consistent with expectations and confirmed in the model, which shows that self-employed workers/family workers were significantly less likely to report discrimination at work than employees. Finally, some differences emerged between the experiences of full- and part-time workers. The part-time workers surveyed were significantly more likely to have reported problems looking for work than their full-time colleagues,15 5.4 per cent reported discrimination looking for work compared to 3.4 per cent of full-time workers. It is possible that the experience of discrimination while looking for work pushed people to take part-time work.16 Findings from the model confirm that part-time workers are more likely to report discrimination looking for work than those working full time, so this ‘raw’ or unadjusted difference is not just a compositional effect. There were no differences between full-time and part-time workers in terms of discrimination at work.
12 In additional analysis (not shown) we tested whether there is a link between perceived work discrimination and overeducation, i.e. people employed below their skill level. We did this by examining the percentage of workers with post-secondary/third level qualifications who report discrimination in various occupations. For this group we found that the level of reported discrimination generally increases as we move down the occupational hierarchy, i.e. highly-educated managers are less likely to report discrimination than highly-educated clerical workers. This analysis provides some limited evidence that subjective discrimination is higher among those who are disadvantaged on an objective measure. 13 As these are predominantly female occupations we test the model to see if the gender difference in seeking work remains once we control for occupation. The difference between men and women is reduced somewhat, but remains statistically significant. 14 P < .001 in both cases. 15 p = 0.000. 16 Insufficient data were available to explore this issue further.
The Experience of Discrimination in Ireland 21

2.3 Groups at Risk of Subjective Discrimination in Accessing Specific Services
In this section we explore subjective reports of discrimination in accessing seven different types of service by the personal characteristics of respondents. It is unlikely that risk factors to discrimination are the same across the range of services considered. It is plausible that the characteristics that mark people out for discrimination in pubs and restaurants differ to those that increase the likelihood of experiencing discrimination accessing housing, not least because the client groups for these services are likely to differ. As shown in Table 2.1, the risk of reported discrimination ranges from 4 per cent in housing to less than 1.5 per cent in education, transport services and other public services. Table 2.4 shows relative risks of discrimination by personal characteristics in each of the seven services discussed below. As mentioned above, for simplicity, the modelled risk is represented as simply “higher”, “lower” etc. than that of the reference group. The detailed odds are supplied in Table A2.2 at the end of this chapter. This analysis also provides an insight into potential problem areas in different types of service provision, which could lead to more targeted policy interventions (such as information campaigns, staff training etc). As we discuss below the subjective nature of the discrimination recorded in this survey must be borne in mind when reading and interpreting the results. Detailed nationality categories have been excluded from these analyses because of small sample sizes. We consider the services where the highest incidence of reported discrimination occur first, housing and financial services (see Table 2.1).
Housing/Accommodation
Of the population that had sought accommodation in the preceding two years, 4 per cent or 44,000 people felt discriminated against. All the measured characteristics influence the risk of subjective discrimination in accessing housing except gender (Table 2.4). Ethnicity, family status, employment status, and disability were the factors most strongly linked to discrimination in accessing accommodation. Age, religion, nationality and education also had a significant bearing. These model results show that respondents of Black and ‘other’ ethnicity were much more likely to perceive problems than White respondents in this domain. Those identified as having no religious beliefs were also at more risk than Catholics. Disabled respondents were much more likely to report experiencing discrimination than non-disabled respondents. Lone parents were much more likely than couples without children to have reported housing discrimination. Couples with children were also more likely to have experienced housing discrimination. The unemployed and inactive were also much more likely than employed to have experienced discrimination in access to housing. Younger age groups were more at risk than older groups, perhaps reflecting greater exposure to risk among younger age groups in the rented sector. The highly educated are less likely to experience housing discrimination. Overall, the picture is consistent and points to a whole range of disadvantaged groups experiencing discrimination in access to housing.
Financial Institutions
As was noted above, the largest number, 112,500, (3.7 per cent) of respondents reported discrimination by financial institutions (banks, insurance companies etc.). This is an interesting domain which highlights that the definition of discrimination in this report is not limited to minorities. If any respondent received unfavourable differential treatment on the basis of group membership and perceived this as unfair
22 The Experience of Discrimination in Ireland

or unjustified, this counts as discrimination: the individual does not need to belong to a minority group. Table 2.4 shows that young people and men were at higher risk of discrimination in this domain than older people and women. This suggests that some respondents may be defining differential experiences as unfair or morally unjustified, and therefore discriminatory, although they may be legally allowable. As noted in Chapter 1, the definition in the questionnaire states that discrimination means treating people less favourably on one of the nine grounds, but does not detail exemptions, such as apply in regard to certain financial services17. While the data does not provide the information, it seems likely that young men, for example, interpret higher motor insurance premiums as discrimination on the basis of age; recent migrants or young people who lack a credit history and are refused a loan may feel they have been discriminated against. Non-Irish nationals emerge as more at risk of subjective discrimination in financial services than Irish nationals. The difficulties which non-Irish nationals encounter in accessing financial services such as opening a bank account and getting a mortgage have also been documented in other studies (McGinnity et al., 2006; Conroy and Brennan, 2003). People of Black ethnicity were almost three times more likely to perceive problems than those of White ethnicity. Those with a disability were much more likely to report discrimination in this sector than those without. Separated respondents were also more likely to report problems than married people. Interestingly, this is the only form of discrimination that men perceive significantly more frequently than women. It is also the only service domain in which discrimination risk is not linked to employment status. Respondents with upper secondary level or post secondary/third level education were more likely to report experience of discrimination than those with primary school education. In summary: while some minority groups disproportionately experience discrimination in access to finance (minority ethnic groups, the disabled), it is also more likely to be reported by young people, men and the highly educated.
17 Providers of financial services are allowed to treat people differently in the case of covering annuities, pensions, insurance policies and other matters relating to risk assessments but only if the differences are based on actuarial or statistical data or other relevant underwriting or commercial factors and are reasonable having regard to the data or other relevant factors, see The Equal Status Acts 2000 to 2004, www.equality.ie
The Experience of Discrimination in Ireland 23

Table 2.4: Models of Risk of Discrimination in Service Domains
Shops/Pubs Financial Education Housing Health Transport Other Public Services
All (Average Rate %) 2.6% 3.7% 1.3% 4.0% 1.8% 0.7% 1.0% Male Reference Reference Reference Reference Reference Reference Reference Female Same Lower Same Same Higher Same Same Age 18-24 years Reference Reference Reference Reference Reference Reference Reference Age 25-44 years Lower Lower Same Same Much Higher Same Same Age 45-64 years Much Lower Lower Same Lower Much Higher Same Same Age 65 plus years Much Lower Much Lower Much Lower Much Lower Same Same Same White Reference Reference Reference Reference Reference Reference Reference Black or Black Irish Much Higher Much Higher Same Much Higher Same Much Higher Same Asian or Asian Irish Same Same Same Same Same Much Higher Same Other including mixed background Much Higher Same Same Much Higher Same Same Same Irish Reference Reference Reference Reference Reference Reference Reference Non-Irish Higher Higher Same Higher Same Much Higher Same Catholic Reference Reference Reference Reference Reference Reference Reference Church of Ireland Same Same Same Same Same Same Same Other Christian Same Higher Much Higher Same Much Higher Much Higher Higher Islam Same Same Same Same Same Much Higher Same Other Religion Higher Same Same Same Much Higher Same Same No religion Higher Much Higher Same Higher Same Same Much Higher Non-Disabled Reference Reference Reference Reference Reference Reference Reference Disabled Much Higher Much Higher Same Much Higher Much Higher Much Higher Much Higher Primary education Reference Reference Reference Reference Reference Reference Reference Lower secondary level education Higher Same Same Same Same Same Same Upper secondary level education Same Higher Same Much Lower Same Same Same Post-secondary/third level Higher Higher Same Lower Same Same Same Employed Reference Reference Reference Reference Reference Reference Reference Unemployed Higher Same Much Higher Higher Much Higher Same Same Inactive Higher Same Higher Much Higher Higher Higher Higher Single Reference Reference Reference Reference Reference Reference Reference Married Lower Lower Same Much Lower Same Same Same Separated Same Higher Same Same Higher Same Same Widowed Lower Same Same Same Same Same Same No child <15 years Reference Reference Reference Reference Reference Reference Reference Couple child <15 years Higher Same Higher Higher Same Higher Higher Lone parent child <15 years Same Same Same Much Higher Same Higher Much Higher
Note: “Modelled risk” refers to relative risk of subcategories to discrimination when compared to the reference subcategory within group, when other characteristics are controlled (e.g. married respondents compared to single respondents). Much higher = more than twice the risk; Much lower = less than half the risk compared to reference group. Same = group does not differ significantly to reference group. Models are un-weighted following convention. Full model results are reported in Appendix Table A2.2.

Shops, Restaurants and Pubs
The shops, restaurants and pubs domain is very broad and an experience of discrimination could range from refusal of entry to unfavourable service. Young people (aged 18-24 years) were significantly more likely to perceive discrimination in shops, restaurants and pubs than older age groups. It is likely that this result partly reflects the greater exposure of younger age groups to risk in this domain, as well as negative stereotyping of young people.18 Ethnicity has a very strong effect in this service domain: Black respondents and those of ‘other’ ethnicity were much more likely to report discrimination when using shops and pubs than White respondents. Non-Irish nationals were also more likely to report problems in this domain than Irish nationals but the effect is not as strong. Disability is strongly linked to discrimination in this domain with disabled respondents much more likely to report experience of problems. Being unemployed, economically inactive, of ‘other’ religion (i.e. non-Christian and non-Muslim) or single are all associated with more frequent reports of discrimination accessing these services. Gender is not influential in this domain. Couples with children were more likely to report discrimination in shops, pubs and restaurants than those without.
Health Services
Disability is the strongest predictor of experiencing discrimination in the health services domain. People with disabilities were much more likely to report such experiences than those without a disability (five times more likely, see Table A2.2). The frequency of exposure to risk is important when considering reported experience in this domain. For example, usage of health services increases with age and it is not surprising that accessing health services is the only domain in which the youngest age group report significantly lower levels of discrimination than the other age groups. Those aged 25-44 years were three times more likely to say they had experienced this type of discrimination than those aged 18-24 years. Those aged 45-64 years were also significantly more likely to perceive discrimination. It is surprising that the oldest age group do not report statistically significantly higher discrimination levels. This may be another useful reminder of the subjective nature of the discrimination reported in the survey: perhaps this finding reflects different underlying tendencies to interpret treatment as discriminatory. The unemployed and economically inactive were also at higher risk of discrimination in the health domain than the employed. It is possible that it is low income and/or medical card status that is driving this result: the two-tiered system for public and private patients in the Irish hospital system is well documented (Nolan and Wiley, 2001; Layte et al., 2007). Women were somewhat more likely to report experience of discrimination than men but the effect is not strong. Interestingly this is the only domain, apart from education, where nationality and ethnicity are not associated with levels of subjective discrimination.
Education
The numbers who perceive discrimination in the remaining service domains is low. In the education model, age group, religion, employment status and family status are found to have a significant influence on perceptions of discrimination. The unemployed were much more likely than the employed to report experience of discrimination in education and ‘other’ Christians are also more likely to report
18 All respondents felt this domain was applicable to them. However, we cannot control for frequency of exposure, for example, the fact that young people may be more likely to visit pubs and restaurants more frequently than older respondents.
The Experience of Discrimination in Ireland 25

problems than Catholics. Couples with children are almost twice as likely as people without children to have reported discrimination in education, it is possible that parents’ perceptions of discrimination relate to accessing education for their children rather than for themselves. A lack of school places may or may not constitute discrimination, depending on how school places are allocated. Young people report higher levels of discrimination in the education domain: clearly younger people will be more exposed to the risk of discrimination in this domain than older age groups. Disabled respondents are somewhat more likely to report higher levels of discrimination in access to education, but this effect is only marginally significant because of the small sample size. It does not pass the ‘threshold’ for statistical significance and is marked ‘same’ in Table 2.4.
Transport
Ethnicity has a very strong effect on perception of discrimination in the transport domain. Discrimination reported here covers a potentially broad range of experiences subjectively defined by the respondent. Such experiences could conceivably range from verbal abuse, poor treatment to difficulty boarding a vehicle. Black and Asian respondents were over four times more likely than White respondents to perceive discrimination in this domain. Nationality and religion were also significantly associated with subjective discrimination in relation to transport services. These findings are in line with the results of McGinnity et al.’s (2006) survey of work permit holders and asylum seekers in Ireland which found that harassment on the street or on public transport/in public places was the most common form of racism/discrimination reported. This study found that 35 per cent of the whole sample, and over half of Black Africans reported this form of discrimination. In the current study it was found that disability also has a strong effect on subjective experience within the transport domain; disabled respondents were over five times more likely to report discrimination than non-disabled people. The problems encountered by people with disabilities in accessing public transport are well documented (Commission on the Status of People with Disabilities, 1996; various publications by the National Disability Authority). Couples with children and lone parents reported experiencing higher levels of discrimination than those without children. It is possible that this family status effect relates to problems of accessing public transport for those with young children in buggies/prams.
Other Public Services
Reports of discrimination in accessing other public services were significantly higher among people with disabilities, lone parents, couples with children, the economically inactive and those of ‘other’ Christian or no religion than the relevant reference groups. It should be remembered the total rates of discrimination reported in these spheres is low, so a high relative risk does not translate into a high absolute risk. It is difficult to build an accurate picture of which other public services are being referred to from the available data but it is likely that social welfare services are included.
2.4 Conclusions In this chapter we examined the risk of discrimination across nine domains: two work and seven service domains. Important differences were identified between the risk factors associated with discrimination across the domains. The availability of information on a wide range of organisational and job characteristics in the Quarterly National Household Survey provided a unique opportunity to investigate Work-related discrimination in detail.
26 The Experience of Discrimination in Ireland

The models constructed for discrimination experienced in service and work domains helped to further refine our understanding of the groups of respondents most at risk of discrimination. Certain limitations should, however, be acknowledged: a higher risk of discrimination could reflect greater exposure, for example, unemployed and non-Irish nationals (likely to be recent migrants) were found to be at risk of discrimination when looking for work but it is likely that more of these respondents have been more actively engaged in job search in the last two years than other groups, even when we exclude those for whom the question is ‘not applicable’. In addition certain groups may be more likely to interpret experiences as discriminatory than others: for example more highly educated respondents emerge in the models as at risk of discrimination in shops/pubs, financial and in work domains, despite being advantaged on objective measures. Other groups may be less likely to identify themselves as having been discriminated against: for example, respondents aged over 65 years emerge as significantly less likely to have experienced discrimination in six of the nine domains. Even in the health domain older respondents do not emerge as significantly more at risk, despite some commentators arguing that age should be used as a method of rationing health services.19
Regarding Work-related discrimination the analyses in Section 2.2 showed some interesting differences between socio-demographic groups. The most notable finding is the very high rates of Work-related discrimination reported by the unemployed, and discrimination seeking work reported both by the unemployed and the inactive. Rates of Work-related discrimination are also particularly high among non-Irish nationals; Other Christians and those with no religion; and disabled people. Women report more discrimination than men at work, but less discrimination when seeking work. A higher level of reported Work-related discrimination among older age groups was not found. The analysis of Work-related discrimination by sector revealed that, only the education and transport sectors have significantly higher reports of discrimination in the workplace, once we account for occupation and other background characteristics. Apart from financial services, sector does not emerge as significant in the looking for work. In terms of occupation, only plant and machine operatives have higher rates of discrimination in the workplace than other occupations, when we account for other factors using statistical modelling. Occupation had a greater impact on experience of discrimination when looking for work: clerical and secretarial workers, associate professional and technical, and personal and protective services emerged as vulnerable in the looking for work model. These results suggest that it is the composition of the workforce, or the personal characteristics of those who sought work, rather than the sector or occupation they work in that is likely to be associated with a higher rate of discrimination. Trade union members were significantly more likely to have experience of discrimination in the workplace than non-union members. Part-time workers were significantly more likely to experience problems looking for work than their full-time colleagues; the supply of part-time workers may exceed the supply of part-time jobs. This interpretation is supported by the fact that the incidence of involuntary part-time work in Ireland is very low and declining (O’Connell and Russell, 2007). Turning to experience of discrimination in the seven service domains, while some groups experienced higher rates of discrimination in most service domains (e.g. the 19 See Callahan D. (1987) for an international discussion of age rationing. As this issue has not yet been systematically investigated, there is very little evidence, aside from anecdotal evidence, that age rationing is practiced in healthcare in Ireland.
The Experience of Discrimination in Ireland 27

disabled), there was also great variation between the services in groups experiencing problems. In accessing housing it was disadvantaged groups who reported problems: respondents of Black and ‘other’ ethnicity; disabled people, lone parents and unemployed/inactive respondents. In the financial service domain, by contrast, young people and men were at higher risk of discrimination – though so too were non-Irish nationals and Black respondents. In shops, restaurants and pubs young people and disabled people are more likely to experience discrimination, as are Black respondents. In the health domain people with disabilities emerged clearly as the group most likely to report discrimination. In the transport domain disabled respondents and respondents of Black and Asian ethnicity emerged as highly at risk of discrimination. These results are largely consistent with results from other Irish studies of these groups cited.
28 The Experience of Discrimination in Ireland

Appendix Table A2.1: Likelihood of Experiencing Work-related Discrimination
In Work Looking for Work Odds Sig. Odds Sig. Female 1.371 0.001 0.588 0.000 Age 25-44 years 1.016 0.918 1.049 0.776 Age 45-54 years 1.095 0.605 1.459 0.064 Age 55-64 years 0.778 0.235 0.907 0.683 Age 65 years 0.275 0.001 0.127 0.000 Black or Black Irish 0.628 0.401 1.594 0.199 Asian or Asian Irish 1.816 0.082 0.615 0.318 Other including mixed background 1.249 0.517 1.557 0.172 Non-Irish 1.488 0.012 2.530 0.000 Church of Ireland 1.268 0.371 1.329 0.372 Other Christian 1.755 0.004 1.717 0.010 Islam 0.907 0.881 1.047 0.940 Other Religion 2.099 0.000 1.441 0.139 No religion 1.738 0.000 1.426 0.058 Disabled 2.757 0.000 1.864 0.000 Married 0.800 0.047 0.733 0.029 Separated 1.599 0.002 1.158 0.423 Widowed 0.449 0.035 0.803 0.520 Couple child<15 years 1.323 0.010 1.035 0.814 Lone parent child<15 years 0.958 0.811 1.217 0.300 Lower secondary level education 0.946 0.745 0.616 0.004 Upper secondary level education 1.106 0.524 0.556 0.000 Post-secondary/Third level 1.604 0.002 0.907 0.513 Unemployed 3.145 0.000 8.705 0.000 Inactive 1.070 0.761 2.955 0.001 Part time 1.001 0.996 1.796 0.000 Self employed 0.626 0.030 1.628 0.098 Trade Union Member 1.286 0.018 0.690 0.075 TU missing 0.875 0.387 0.821 0.409 Professional 0.947 0.771 1.245 0.527 Technical 1.066 0.732 1.968 0.036 Clerical 1.018 0.916 1.978 0.034 Craft 0.876 0.598 0.869 0.725 PP Services/Sales 1.043 0.801 2.041 0.015 Plant & Machine 1.640 0.019 1.064 0.876 Other occupations 1.054 0.802 1.638 0.128 Agriculture 1.008 0.981 0.809 0.656 Construction 0.633 0.104 0.550 0.105 Retail 1.009 0.964 0.686 0.198 Hotels 1.123 0.622 0.754 0.380 Transport 1.666 0.011 0.951 0.883 Financial 1.364 0.081 0.555 0.041 Public administration 1.347 0.171 0.765 0.551 Education 1.503 0.048 0.841 0.604 Health 1.037 0.850 0.677 0.182 Other services 0.889 0.626 0.970 0.919 Constant 0.022 0.000 0.040 0.000 Note: “Inapplicable” excluded from the models. Reference groups: male, under 25 years, White; Irish; Catholic; no disability; primary education; employed; single; no children under 15 years; primary education; employed; full time; employee; non-trade union member; managers and administrators; manufacturing. Statistically significant results are in bold.
The Experience of Discrimination in Ireland 29

Table A2.2: Models of Risk of Discrimination in Service Domains in Last Two Years Shops/pubs Financial Education Housing Health Transport Other Pub. Serv. Odds Sig. Odds Sig. Odds Sig. Odds Sig. Odds Sig. Odds Sig. Odds Sig. Female 1.08 0.460 0.75 0.000 1.50 0.070 1.06 0.710 1.32 0.010 1.10 0.620 0.89 0.440Age 25-44 years 0.52 0.000 0.71 0.010 0.88 0.700 0.83 0.320 3.19 0.000 1.16 0.690 1.40 0.300Age 45-64 years 0.32 0.000 0.51 0.000 0.64
0.240 0.50 0.010 2.26 0.050 0.73 0.450 1.30 0.460
Age 65 plus years 0.23 0.000 0.35 0.000 0.17 0.010 0.21 0.000 1.78 0.170 0.69 0.430 1.41 0.370Black or Black Irish 4.63 0.000 2.98 0.000 1.25 0.750 2.83 0.000 0.41 0.400 4.13 0.000 1.36 0.590Asian or Asian Irish 1.96 0.060 0.85 0.710 0.68 0.730 0.26 0.190 1.74 0.440 4.42 0.010 1.13 0.870Other including mixed background
2.29 0.010 0.87
0.720 1.24 0.800 2.57 0.020 0.39 0.370 0.89 0.880 1.13 0.850
Non-Irish 1.58 0.010 1.37 0.040 1.30 0.490 1.60 0.050 0.64 0.130 2.17 0.020 1.61 0.070Church of Ireland 0.80 0.510 1.31 0.230 0.79 0.740 1.03 0.950 0.55 0.150 0.81 0.720 0.89 0.800Other Christian
1.31 0.230 1.47 0.040 2.21 0.050 1.53
0.150 2.26 0.000 2.25 0.020 1.93 0.030 Islam 1.67 0.220 0.44 0.280 1.68 0.650 0.81 0.730 2.45 0.300 3.26 0.040 0.79 0.820Other Religion 1.75 0.010 1.36 0.160 1.16 0.790 0.79 0.550 2.24 0.010 0.95 0.930 1.38 0.440No Religion 1.57 0.010 2.06 0.000 1.44 0.350 1.90 0.000 1.07 0.820 1.24 0.590 2.88 0.000 Disabled 2.85 0.000 2.53 0.000 1.68 0.080 2.42 0.000 5.38 0.000 5.19 0.000 2.56 0.000 Lower Sec. Level ed. 1.38 0.040 1.25 0.100 1.17 0.650 0.85 0.410 1.03 0.830 1.49 0.120 0.85 0.460Upper Sec. Level ed. 1.01 0.970 1.40 0.010 0.84
0.620 0.49 0.000 0.87 0.350 0.96 0.890 0.74 0.170Post Sec./Third level
1.55 0.000 1.74 0.000 1.15 0.650 0.52 0.000 0.78 0.080 1.41 0.160 1.10 0.600
Unemployed 1.70 0.020 1.02 0.920 3.13 0.000 1.94 0.020 2.01 0.020 1.15 0.790 1.67 0.180Inactive
1.49 0.000 1.11 0.280 1.73 0.010 2.34 0.000 1.63 0.000 1.65 0.020 1.77 0.000
Married 0.63 0.000 0.71 0.000 0.66 0.160 0.38 0.000 1.22 0.170 0.69 0.120 0.70 0.060Separated
1.26 0.210 1.55 0.000 1.26 0.570 1.42 0.080 1.87 0.000 0.93 0.840 1.05 0.840Widowed 0.54 0.010 0.81 0.270 1.27 0.670 0.46 0.080 1.16 0.440 1.41 0.290 0.77 0.320Couple child<15
years 1.46 0.010 1.16 0.180 1.97 0.010 1.80 0.000 1.20 0.230 1.72 0.040 1.72 0.010
Lone parent child<15 years
1.25
0.220 1.32 0.070 1.01 0.970 2.94 0.000 1.39 0.130 1.93 0.050 2.92 0.000
Constant 0.03 0.000 0.04 0.000 0.01 0.000 0.04 0.000 0.00 0.000 0.00 0.000 0.00 0.000Reference categories: Male, aged 18-24 years, White; Irish; Catholic; no disability; primary education employed; single; no children under 15 years. Statistically significant results are in bold font.

3. GROUNDS OF DISCRIMINATION EXPERIENCED
The QNHS Equality module asked respondents who reported any form of discrimination on what grounds they felt they were discriminated against. Respondents were asked to select from a list of nine pre-coded categories: age, gender, race/skin colour/nationality/ethnic origin, family status (for example, pregnancy, having children or other dependents), marital status, religious belief, disability, membership of the Traveller community and sexual orientation. These are the nine grounds covered in Irish equality legislation and described in Chapter 1. Respondents were also free to select ‘other’. Analysis of the grounds on which people felt discriminated against is complicated by a number of features of the data: respondents were permitted to identify more than one ground for each of the nine domains of discrimination (at work, looking for work, using financial services, in shops/pubs etc.); each respondent could report experience of discrimination in multiple domains; and each respondent could be referring to a number of instances of discrimination in the same domain. For example, one respondent might have experienced discrimination in recruitment, and attribute it to both age and gender. Another may have been repeatedly denied access to pubs because of being a Traveller. However, it is worthwhile to try to unpick what the grounds can tell us about discrimination because this is our most direct source of information on the basis of the discrimination reported. In Chapter 2 we examined the relationship between the domain and the reported experience of discrimination, in Chapter 4 we will look in more detail at the association between social/demographic groups and reported experience of discrimination. In this chapter we turn to respondents’ interpretation of why they felt they had been discriminated against, based on the definition given in the Questionnaire. The total grounds cited are discussed first in terms of the social and demographic characteristics of the survey respondents and then the domain to which the associated incident(s) of discrimination relates. Finally, we take a more detailed look at the ‘other’ ground of discrimination.
3.1 Overview of Grounds Reported Across all nine domains of discrimination a total of 3,215 reports of discrimination were made.20 For each report at least one ground was identified leading to a total of 3,456 reported grounds of discrimination. In Table 3.1 we present the proportion of this total accounted for by the different grounds. Of the nine grounds covered by equality legislation, age was the one most frequently reported, accounting for 19 per cent of all grounds reported. The phrase “age discrimination” potentially covers quite different forms of unequal treatment: subjective discrimination was more commonly reported by younger age groups than by older age groups (see discussion below and in Chapter 4). Age discrimination was followed closely by race/skin colour/ethnic group/nationality which accounted for 16 per cent overall, a further 12 per cent was accounted for by sex and 10 per cent by family status. Disability and marital status both accounted for less than 10 per cent of 20 These reports could relate to a number of instances of discrimination within the same domain. However, precise information on the number of instances of discrimination was not collected. The 3,215 reports were made by 2,745 individuals.
The Experience of Discrimination in Ireland 31

the total reported grounds. Sexual orientation, religion and membership of the Traveller community represent a very small fraction of the total grounds reported.
Table 3.1: Grounds of Discrimination as a Percentage of All Reported Grounds
Ground % of All Reported Grounds
Age 19.3 Race/skin colour/ethnic group/nationality 16.3 Sex 11.5 Family status 10.0 Disability 6.2 Marital Status 4.3 Sexual Orientation 0.5 Religion 0.6 Membership of the Traveller community 0.7 Other 30.6 100.0 Total grounds 3,456 Note: Multiple domains of discrimination and multiple grounds of discrimination could be reported by each respondent.
Significantly almost one-third of the reported grounds for discrimination fell into the ‘other ‘category. This is a large proportion of all grounds, and the Questionnaire does not give any further information on what those grounds might be. In Section 3.4 we consider the ‘other’ category in more depth, discussing what those grounds might be, and exploring the characteristics of individuals reporting this ‘other’ category, in an effort to shed light on this ground.
3.2 Relationship Between Social-demographic Groups and Grounds of Subjective Discrimination
It is interesting to consider the characteristics of those reporting different grounds of discrimination. As discussed above knowing which grounds of discrimination tend to arise among different social groups contributes to our understanding of the subjective experience of discrimination. This is because rather than assuming the risk of reported discrimination is based on membership of that group we can interrogate what the respondent him/herself felt was the motivation behind his/her experience. Looking at the gender breakdown of reported grounds there is a strong contrast in the grounds of discrimination reported by men and women. Table 3.2 shows that age discrimination accounts for almost a quarter of the grounds reported by men but it amounted to only 15 per cent of the grounds reported by women. In contrast, family status accounted for 17 per cent of discrimination reported by women but just 3 per cent for men. Marital status was also mentioned more frequently as a ground for discrimination experienced by women. The following analysis of the reported grounds of discrimination against the relevant indicators within the population (for example, the reporting of discrimination based on marital status, by marital status of the population) provides more information on which sub groups are at risk of subjective discrimination.21 While interpreting these
21 We avoid simply looking at the rates of each population group reporting various grounds because each respondent could choose multiple grounds.
32 The Experience of Discrimination in Ireland

results it should be kept in mind that for each ground there are a small number of cases relative to the size of the population.
Table 3.2: Grounds of Discrimination as a Percentage of All Reported Grounds, Distinguishing Men and Women
Male Female % % Age 23.7 15.1 Race/skin colour/nationality/ethnic origin 19.7 12.6 Gender 9.7 13.1 Family status 3.3 16.8 Disability 7.8 4.8 Marital Status 2.1 6.6 Sexual Orientation 0.6 0.1 Religious Belief 0.7 0.5 Membership of the Traveller community 0.3 1.3 Other 32.1 29.2 100.0 100.0 Total grounds 1,737 1,719 Note: Multiple forms of discrimination and multiple grounds of discrimination were allowed for each respondent.
Figure 3.1: Gender Composition of Those who Report Gender Discrimination and of Total Population
0%
10%
20%
30%
40%
50%
60%
70%
80%
90%
100%
Report Gender Discrimination All
FemaleMale
Note: Individual respondents could record multiple grounds. Looking first at gender discrimination we find that just under 45 per cent of reports of gender discrimination come from men. This highlights the point discussed earlier that discrimination in this report is not necessarily directed towards minority or particular groups within the grounds: discrimination on the basis of gender is often seen as solely directed towards women. While this is in contrast to the picture provided by studies of objective discrimination (mostly in the labour force), it should be noted that
The Experience of Discrimination in Ireland 33

these reports from men arise predominantly in relation to accessing financial services, which because of their frequency, dominate the overall picture (the relationship between grounds and domains of discrimination is addressed below in Section 3.3). In Figure 3.2 we consider the age composition of those who felt they were discriminated against on the grounds of age compared to the age-composition of the population. Those aged 18-24 years make up the largest proportion of those reporting age discrimination, accounting for 35 per cent of this group compared to a presence in the population of 15 per cent. Surprisingly, those aged over 65 years are not over-represented among those reporting age discrimination – they make up 17 per cent of that group compared to 15 per cent of the population. Only 22 per cent of reports of age-related discrimination come from those aged 25 to 44 years even though they represent 41 per cent of the population. It is disproportionately the young, not the old, who experience age-related discrimination in Ireland.
Figure 3.2: Age Composition of Those Who Report Age-related Discrimination and of Total Population
0%
10%
20%
30%
40%
50%
60%
70%
80%
90%
100%
Report Age Discrimination All
65 + years45 - 64 years25 - 44 years18 - 24 years
Note: Individual respondents could record multiple grounds. Figure 3.3 shows that 43 per cent of reports of discrimination on the grounds of race/skin colour/nationality/ethnic origin come from non-Irish nationals in the ‘White’ category and 35 per cent come from respondents of Black Asian or ‘Other’ ethnicity (mostly non-Irish nationals but including a small percentage of Irish nationals).22 It is perhaps surprising that 21 per cent of these reports (albeit representing a small number of incidents) come from the majority group i.e. Irish nationals of White ethnicity. It is unlikely that these reports related to discrimination on the grounds of membership of the Traveller community as there was a separate category for this response. These results indicate that some majority respondents perceive preferential treatment of minority national or ethnic groups. Note, however, that while 21 per cent of reports come from the majority group, these make up over 90 per cent
22 Respondents are classified into three groups according to both nationality and ethnicity for this figure.
34 The Experience of Discrimination in Ireland

of the population, so the rate of reported discrimination is considerably lower than among other ethnic/national groups.
Figure 3.3: Composition of Those Reporting Discrimination on the Basis of Race/Skin Colour/Nationality or Ethnic Origin
0%
10%
20%
30%
40%
50%
60%
70%
80%
90%
100%
Report Racial Discrimination All
Black, Asian & otherWhite, Non-IrishWhite, Irish
Note: Individual respondents could record multiple grounds.
Figure 3.4: Marital Status of Those Reporting Discrimination on Grounds of Marital Status and of Total Population
0%
10%
20%
30%
40%
50%
60%
70%
80%
90%
100%
Report Marital StatusDiscrimination
All
Widowed
Separated
MarriedSingle
Note: Individual respondents could record multiple grounds. Two groups are over-represented among those reporting discrimination on the basis of marital status: those who are single and in particular those who are separated/divorced (see Figure 3.4). A quarter of complaints of discrimination on the
The Experience of Discrimination in Ireland 35
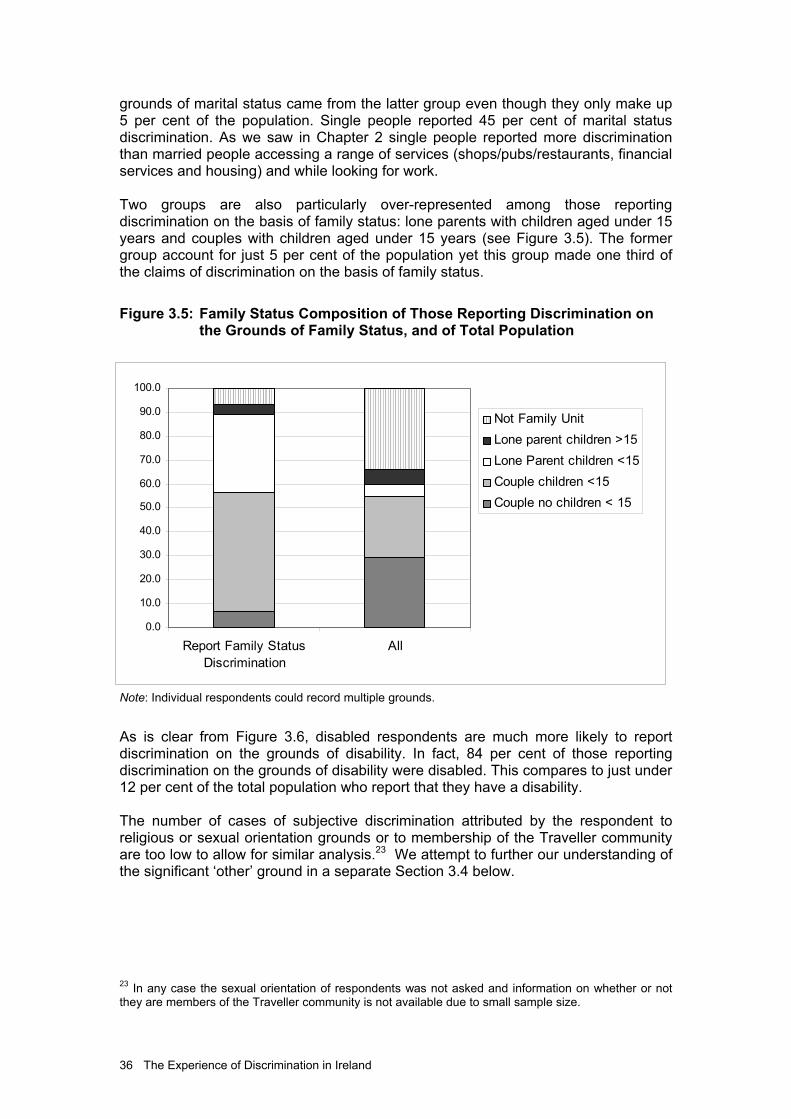
grounds of marital status came from the latter group even though they only make up 5 per cent of the population. Single people reported 45 per cent of marital status discrimination. As we saw in Chapter 2 single people reported more discrimination than married people accessing a range of services (shops/pubs/restaurants, financial services and housing) and while looking for work. Two groups are also particularly over-represented among those reporting discrimination on the basis of family status: lone parents with children aged under 15 years and couples with children aged under 15 years (see Figure 3.5). The former group account for just 5 per cent of the population yet this group made one third of the claims of discrimination on the basis of family status.
Figure 3.5: Family Status Composition of Those Reporting Discrimination on the Grounds of Family Status, and of Total Population
0.0
10.0
20.0
30.0
40.0
50.0
60.0
70.0
80.0
90.0
100.0
Report Family StatusDiscrimination
All
Not Family UnitLone parent children >15Lone Parent children <15Couple children <15Couple no children < 15
Note: Individual respondents could record multiple grounds.
As is clear from Figure 3.6, disabled respondents are much more likely to report discrimination on the grounds of disability. In fact, 84 per cent of those reporting discrimination on the grounds of disability were disabled. This compares to just under 12 per cent of the total population who report that they have a disability. The number of cases of subjective discrimination attributed by the respondent to religious or sexual orientation grounds or to membership of the Traveller community are too low to allow for similar analysis.23 We attempt to further our understanding of the significant ‘other’ ground in a separate Section 3.4 below.
23 In any case the sexual orientation of respondents was not asked and information on whether or not they are members of the Traveller community is not available due to small sample size.
36 The Experience of Discrimination in Ireland

Figure 3.6: Disability Status of Those Reporting Discrimination on the Grounds of Disability, and of Total Population
0%
10%
20%
30%
40%
50%
60%
70%
80%
90%
100%
Report Disability Discrimination All
DisabledNot Disabled
Note: Individual respondents could record multiple grounds.
3.3 Relationship Between Domains of Discrimination and Grounds of Subjective Discrimination
Knowing which grounds of discrimination tend to arise in different domains contributes to our understanding of the subjective experience of discrimination by providing information on the relationship between what respondents felt was the motivation for their experience and where they felt at risk. We look first at the grounds for discrimination among those who felt they were unfairly treated while accessing services (Table 3.3). The results show that the grounds vary quite substantially across the seven services.
Table 3.3: Grounds for Discrimination in Services
Financial Shops & pubs Educ. Housing Health Transp.
Other public service
Gender 20.5 11.2 5.9 6.7 6.0 7.4 7.2 Marital status 5.8 2.2 3.2 13.7 4.4 3.9 8.4 Family status 5.7 11.2 14.6 25.4 11.8 12.6 11.2 Age 26.5 19.2 16.2 13.7 15.5 11.3 11.2 Disability 5.0 4.7 3.8 2.8 7.5 17.7 11.5
Ethnicity/race/ nationality 9.0 22.0 10.8 16.3 5.4 24.2 15.9 Sexual orientation 0.3 1.7 0.0 0.0 0.8 3.0 0.0 Religion 0.3 1.0 3.2 0.2 0.2 0.4 0.0 Traveller 0.5 1.5 0.5 1.0 0.4 0.9 0.3 Other 26.4 25.3 41.6 20.2 48.0 18.6 34.3 Total 100.0 100.0 100.0 100.0 100.0 100.0 100.0 Note: Individual respondents could record multiple grounds within each domain.
The Experience of Discrimination in Ireland 37

Table 3.3 shows that age and gender are the most salient grounds for discrimination in financial services, whereas in shops/pubs etc. it is age and race/skin colour/nationality/ethnic origin, which are most prevalent. The ‘other’ category is important in all seven service domains but is particularly prominent in relation to education, health services and to a lesser extent other public services. In the housing domain the grounds of family status and marital status are particularly common, and account for 25 per cent and 14 per cent of cases in this area respectively. The grounds of sexual orientation, religion and membership of the Traveller community accounted for a very small fraction of cases. The latter probably reflects the small proportion of the population that is made up by members of the Traveller community24. These three grounds were slightly more common in shops and pubs and restaurants and in the transport domain than the other service domains. Being a member of the Traveller community is also mentioned more frequently in perceived housing discrimination. Race/skin colour/ethnic group/nationality is the single most common ground for perceived discrimination in transport services, which is cited in 24 per cent of these reports, closely followed by disability, which is mentioned in a further 18 per cent of cases. These two grounds are also the most commonly cited in relation to discrimination accessing other public services, leaving aside the ‘other’ grounds. When we look at the distribution of grounds within the two work domains (Table 3.4) we see that gender and ‘other’ are more commonly cited grounds in relation to discrimination at work. Whereas age and race/skin colour/nationality/ethnic origin are more commonly cited in reports of discrimination in job search, these account for 28 per cent and 19 per cent of the grounds reported in that domain respectively. These results complement those in Chapter 2, which showed that there was a strong correlation between the nationality of respondents and reports of discrimination in job search.
Table 3.4: Grounds for Work-related Discrimination
In Work Looking for work Any work Gender 17.2 7.2 13.6 Marital status 3.2 4.1 3.2 Family status 8.8 9.2 9.3 Age 16.4 27.6 21.0 Disability 3.6 6.2 4.1 Ethnicity\race\nationality 15.2 19.4 16.2 Sexual orientation 0.8 0.4 0.6 Religion 1.1 0.7 1.0 Traveller 0.2 0.7 0.5 Other 33.5 24.7 30.6 Total 100.0 100.0 100.0
Note: Individual respondents could record multiple grounds within each domain.
24 Census 2006 showed that there were just under 22,400 members of the Traveller community usually resident in Ireland representing 0.5 per cent of a total population of 4,172,000.
38 The Experience of Discrimination in Ireland

3.4 The ‘Other’ Ground and “Multiple Grounds” As Tables 3.1, 3.3 and 3.4 show a large proportion of the grounds cited do not fall into one of the nine categories covered by current equality legislation: age, gender, race/skin colour/ethnic group/nationality, family status, marital status, religious belief, disability, membership of the Traveller community or sexual orientation. In fact, the ‘other’ category accounts for 31 per cent of total reported grounds, at least 20 per cent of grounds in all the nine domains and up to 48 per cent in the health domain and 42 per cent in education domains. This is substantial and somewhat problematic, given that we have no further information on the survey. What is this ‘other’ ground likely to be? The definition of discrimination given to respondents on the interviewer prompt card (Figure 1.1) explicitly states that less favourable treatment on the basis of qualifications, being over an income limit or being further back in a queue does not constitute discrimination, so these are very unlikely. This definition strongly implies that it is membership of a particular group, rather than established procedures, which constitutes discrimination. This suggests that the ‘other’ ground includes sources of discrimination not covered by the equality legislation, for example, employment status, educational qualifications or region of residence. The respondents might be unemployed or from a particular area or region, who felt they were unfavourably treated because they ‘had the wrong address’ or the ‘wrong accent’. While we cannot conclusively establish what these grounds are, we can explore them using the data. First we investigate the association between the ‘other’ ground and three potential sources of discrimination not covered by equality legislation: namely, trade union membership, employment status and educational status (detailed regional information is not provided in the survey).
Figure 3.7: Respondents Who Experienced Discrimination in Service and Work Domains, Per Cent Who Selected the ‘Other’ Ground
0.0
10.0
20.0
30.0
40.0
50.0
60.0
TU membe
r
Non TU m
ember
Primary
Educ.
Lower sec
. ed.
Upper se
c. ed.
Post-s
ec. Third
ed.
Employe
d
Unemploye
d
Inacti
ve
% s
elec
ted
othe
r grn
d.
Any Service Related Any work related
We find some association between choosing the ‘other’ ground and trade union membership in Figure 3.7: 46 per cent of trade union members who reported service related discrimination cited the ‘other’ ground compared to 36 per cent of non-trade union members. The gap is more pronounced among trade union members and non-members in relation to Work-related discrimination (47 per cent and 31 per cent cited
The Experience of Discrimination in Ireland 39

the ‘other’ ground respectively). Regarding educational attainment those educated to primary and lower secondary level were more likely than other education groups to cite the ‘other’ ground in the work and service domains. Similarly, more unemployed respondents used the ‘other’ ground compared to employed and inactive respondents. As a further step in investigating the nature of the ‘other’ ground we ran a model to test what personal characteristics make someone likely to report experience of discrimination under this ground. The results are supplied in Table A3.1 but again no clear picture emerges. Younger people (aged 18-25 years) were significantly more likely to select the ‘other’ ground than people aged 65 years and over. Non-Irish national respondents were significantly less likely to select the ‘other’ ground than Irish. The respondents who used the ‘other’ ground are more likely to be of no religion or ‘other religion’ and are more likely to be separated than single. Respondents of ‘other’ ethnicity (i.e. not White, Black or Asian) were twice as likely to select the ‘other’ ground as White respondents. Disabled people were 2.6 times as likely to select the ‘other’ ground as the reference group. Unemployed people were almost 3 times more likely to select the ‘other’ ground than employed respondents. Part-time workers and trade union members were also more likely to select this ground but the effects are not as strong. Those educated to primary level are more likely to select the ‘other’ ground than those educated to upper secondary level. Only these last four characteristics are not currently covered by equality legislation. In terms of domains, as noted above, the ‘other’ category is important in all seven service domains but is particularly prominent in relation to education, health services and to a lesser extent other public services (Table 3.4). Approximately 16 per cent of respondents who experienced discrimination cited more than one ground. However, none of the ten grounds correlate very strongly with each other. The strongest correlation is found between the ‘other’ ground and age,25 gender26 and race/skin colour/nationality/ethnic origin.27 The grounds of race/skin colour/nationality/ethnic origin also correlate negatively with age28 suggesting if a person reports experience of one ground they are less likely to report experience of the other. The same negative correlation exists between family status and age although it is not as strong.29
It seems likely that part of the explanation for the high proportion of respondents ticking ‘other’ is that some respondents ticked ‘other’ with another ground, like employment status, in mind. It also appears that some of those who ticked ‘other’ also ticked one of the nine legal grounds. Another part of the explanation may be misclassification. Some respondents, faced with the question may have said ‘other’ when they should have ticked one of the nine grounds. For example, young respondents may have been reluctant to tick discrimination on the grounds of ‘age’, despite the legislation and interviewer instructions, given the common perception that age-related discrimination relates to older people. Finally, though the definition on the survey discourages this, it is possible that people felt discriminated against even though proper procedures were followed, e.g. on the basis of the medical urgency of their case in healthcare. This is particularly true if the procedure/reason was not apparent to the respondent and they thus attribute unfavourable treatment to personal characteristics. In conclusion what we can say about the ‘other’ ground is 25 Pearson correlation 0.31. Correlations based on weighted, un-grossed data. 26 Pearson correlation 0.25. 27 Pearson correlation 0.28. 28 Pearson correlation -0.2. 29 Pearson correlation -0.13.
40 The Experience of Discrimination in Ireland
limited – except that a question probing for further information would have been very useful. We return to this point in the conclusion.
3.5 Conclusions Age was the ground most frequently reported overall, accounting for 19 per cent of all grounds reported. Interestingly, there was a significant gender influence on reporting of this ground: it represented a quarter of the grounds reported by men but just 15 per cent of the grounds reported by women. It is also worth noting that in our analysis of the reported grounds of discrimination against the relevant indicators within the population the 18-24 years age group make up the largest proportion of those reporting age discrimination and that over 65 year olds are not over-represented among those who report age related discrimination compared to the population. Age was followed closely by race/skin colour/ethnic group/nationality, which accounted for 16 per cent of all grounds reported. Over 40 per cent of reports of discrimination on the grounds of race/skin colour/ethnic group/nationality come from non-Irish nationals in the White ethnicity category and 35 per cent come from respondents of Black/Asian or Other ethnicity (mostly non-Irish nationals). Regarding the reporting of the grounds of marital status those who are single and in particular those who are separated/divorced were over-represented compared to the general population. The same was true of lone parents with children aged under 15 years and couples with children aged under 15 years reporting discrimination on the basis of family status. The analysis of domains and grounds of discrimination showed that age and gender are the most salient grounds for discrimination in financial services, whereas in shops/pubs etc. it is age and race/skin colour/nationality/ethnic origin, which dominate. When we look at the distribution of grounds within the two work domains we see that gender and ‘other’ are more commonly cited grounds in relation to discrimination at work. Almost one-third of the grounds for discrimination fell into the ‘other‘ category. The model constructed to analyse the ‘other’ ground did not yield a clear picture of who is being overlooked by the existing equality grounds. Closer examination of three grounds not currently covered by equality legislation (Trade Union membership, education and economic status) showed that Trade Union members, respondents educated to primary and lower secondary level and the unemployed were more likely to use the ‘other’ ground. However, we cannot rule some misclassification and the substantial number of respondents who ticked the ‘other’ ground is a weakness of the survey, given that the definition supplied is strongly linked to the nine grounds. Our analysis of reporting of multiple grounds found that none of the ten grounds correlate strongly with each other. The strongest correlation is found between the ‘other’ ground and age, gender and race/skin colour/nationality/ethnic origin.
The Experience of Discrimination in Ireland 41
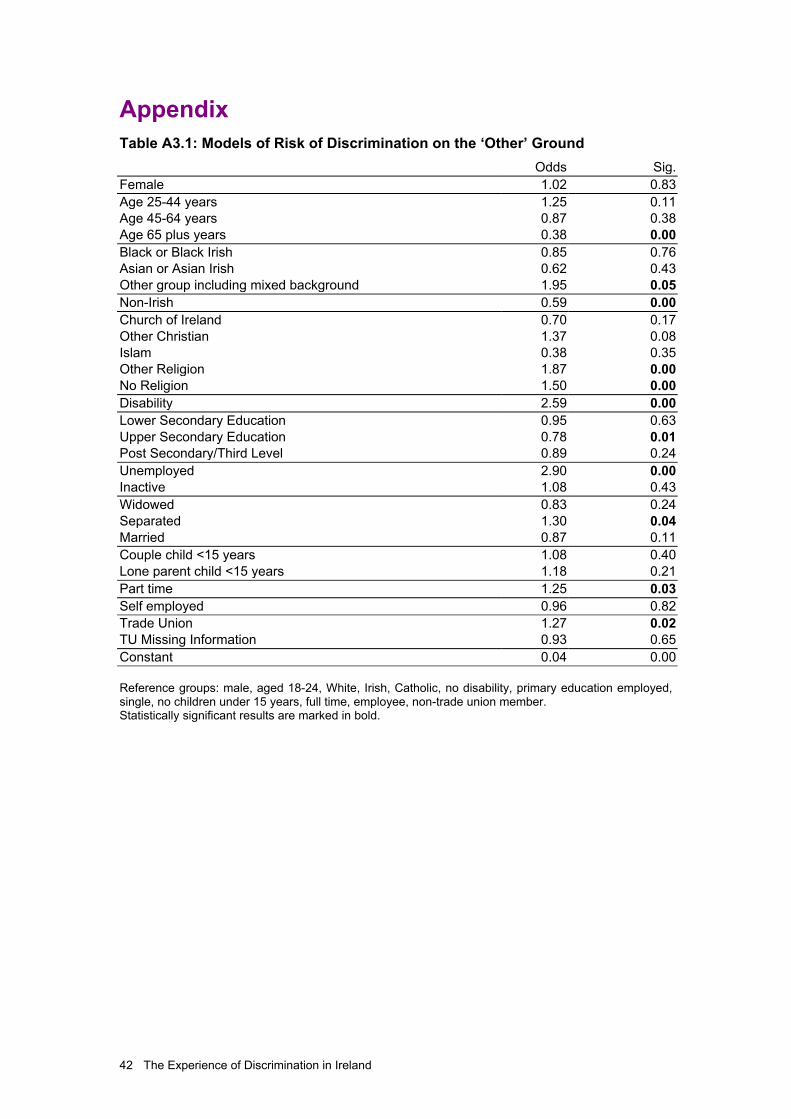
Appendix Table A3.1: Models of Risk of Discrimination on the ‘Other’ Ground
Odds Sig.Female 1.02 0.83Age 25-44 years 1.25 0.11Age 45-64 years 0.87 0.38Age 65 plus years 0.38 0.00Black or Black Irish 0.85 0.76Asian or Asian Irish 0.62 0.43Other group including mixed background 1.95 0.05Non-Irish 0.59 0.00Church of Ireland 0.70 0.17Other Christian 1.37 0.08Islam 0.38 0.35Other Religion 1.87 0.00No Religion 1.50 0.00Disability 2.59 0.00Lower Secondary Education 0.95 0.63Upper Secondary Education 0.78 0.01Post Secondary/Third Level 0.89 0.24Unemployed 2.90 0.00Inactive 1.08 0.43Widowed 0.83 0.24Separated 1.30 0.04Married 0.87 0.11Couple child <15 years 1.08 0.40Lone parent child <15 years 1.18 0.21Part time 1.25 0.03Self employed 0.96 0.82Trade Union 1.27 0.02TU Missing Information 0.93 0.65Constant 0.04 0.00 Reference groups: male, aged 18-24, White, Irish, Catholic, no disability, primary education employed, single, no children under 15 years, full time, employee, non-trade union member. Statistically significant results are marked in bold.
42 The Experience of Discrimination in Ireland

4. OVERALL DISCRIMINATION AND GROUPS MOST AT RISK This chapter, building on the discussion in Chapters 2 and 3, allows us to compare the risk of experiencing any discrimination among social groups. It also allows us to compare risks in service and Work-related domains side by side, focusing on the characteristics of those who are vulnerable to subjective discrimination. As in previous chapters we use two methods to analyse the data, looking at the ”raw” risk of discrimination by simply comparing proportions that perceive discrimination across different groups. For example, comparing discrimination levels among women and men, across age, national, ethnic, religious groups etc. We also use multivariate modelling to look more closely at the risks of discrimination for different groups while holding other factors constant, this allows us to separate out the effects of characteristics that might be linked. It is worthwhile bearing in mind that the reason for the perceived discrimination cannot necessarily be read from characteristics of those who have experienced it. For example, the women who report discrimination have not necessarily experienced gender discrimination; their unequal treatment may have been based on their family status, religion, race etc. As shown by discussion of the grounds for discrimination in previous chapter, it is also not correct to assume that if a group reports higher levels of discrimination that it can be explained simply by membership of that group. It is possible, for example, that the group in question contains higher numbers of people with another attribute that is a focus for discrimination. Readers should also note the implications of aggregating perceived experiences of discrimination across very different domains. For example, a brief interaction in a shop may be reported as an incident of discrimination, so too is discrimination when searching for a job. Both these count as discrimination for “any discrimination”, and they are given equal weight. The analysis in Chapter 2 goes some way to addressing this issue by looking at all the domains individually. With these caveats in mind the results should not be interpreted as a precise measure of the incidence of discrimination among social/demographic groups in society; rather they can tell us about people’s subjective experience of discrimination in Ireland, and how this relates to a range of personal and social characteristics. We look at the “raw” and modelled risk of groups to “any” discrimination and then “any service related” or “any Work-related” discrimination.
4.1 Vulnerability to Any Form of Discrimination Across Social Groups The “raw” and modelled risks of “any” discrimination for a number of key social and demographic groups are summarised in Table 4.1 and discussed below. Table 4.1 combines the results of the two methods: bivariate and multivariate analysis across the various social and demographic groups on which we have data. The percentage “raw” risk in column 1 indicates the proportion of the group in question that experienced some form of discrimination in the last two years. The “modelled risk” in column 2 represents the result of regression analysis of the data. (The technique of regression analysis was explained in Section 2.1.)
The Experience of Discrimination in Ireland 43
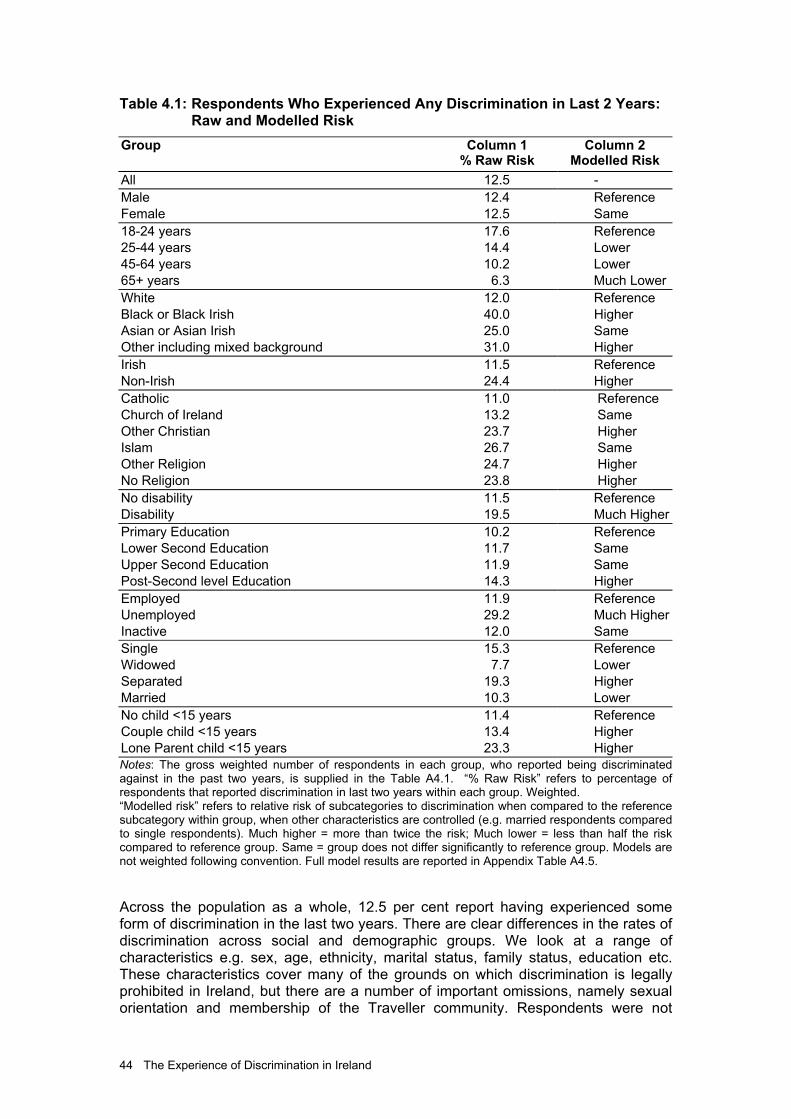
Table 4.1: Respondents Who Experienced Any Discrimination in Last 2 Years: Raw and Modelled Risk
Group Column 1 % Raw Risk
Column 2 Modelled Risk
All 12.5 - Male 12.4 Reference Female 12.5 Same 18-24 years 17.6 Reference 25-44 years 14.4 Lower 45-64 years 10.2 Lower 65+ years 6.3 Much LowerWhite 12.0 Reference Black or Black Irish 40.0 Higher Asian or Asian Irish 25.0 Same Other including mixed background 31.0 Higher Irish 11.5 Reference Non-Irish 24.4 Higher Catholic 11.0 Reference Church of Ireland 13.2 Same Other Christian 23.7 Higher Islam 26.7 Same Other Religion 24.7 Higher No Religion 23.8 Higher No disability 11.5 Reference Disability 19.5 Much HigherPrimary Education 10.2 Reference Lower Second Education 11.7 Same Upper Second Education 11.9 Same Post-Second level Education 14.3 Higher Employed 11.9 Reference Unemployed 29.2 Much HigherInactive 12.0 Same Single 15.3 Reference Widowed 7.7 Lower Separated 19.3 Higher Married 10.3 Lower No child <15 years 11.4 Reference Couple child <15 years 13.4 Higher Lone Parent child <15 years 23.3 Higher Notes: The gross weighted number of respondents in each group, who reported being discriminated against in the past two years, is supplied in the Table A4.1. “% Raw Risk” refers to percentage of respondents that reported discrimination in last two years within each group. Weighted. “Modelled risk” refers to relative risk of subcategories to discrimination when compared to the reference subcategory within group, when other characteristics are controlled (e.g. married respondents compared to single respondents). Much higher = more than twice the risk; Much lower = less than half the risk compared to reference group. Same = group does not differ significantly to reference group. Models are not weighted following convention. Full model results are reported in Appendix Table A4.5.
Across the population as a whole, 12.5 per cent report having experienced some form of discrimination in the last two years. There are clear differences in the rates of discrimination across social and demographic groups. We look at a range of characteristics e.g. sex, age, ethnicity, marital status, family status, education etc. These characteristics cover many of the grounds on which discrimination is legally prohibited in Ireland, but there are a number of important omissions, namely sexual orientation and membership of the Traveller community. Respondents were not
44 The Experience of Discrimination in Ireland

asked about information on their sexual orientation, and the Traveller category is subsumed within the “White” ethnicity category, because of the small number of cases, therefore, we cannot calculate rates of discrimination among these groups.30 When all characteristics are considered simultaneously we find that the factors that have the largest independent influence on the likelihood of reporting any subjective discrimination are age, disability, and employment status. A more detailed discussion of raw and modelled risk across the social and demographic groups follows below.
Gender and Age
The overall incidence of discrimination is almost identical for women and men (column 1) and no significant gender difference emerges in the modelled results (column 2). As we saw in Chapter 2, gender is significant in both work domains and in the financial services and health domains. Women are more likely than men to report discrimination at work and in the health domain, and less likely than men to report discrimination looking for work and in financial services. However, when we aggregate the domains in the overall model presented in Table 4.1, the effects cancel each other out. Also note that these modelled results refer to gender as a risk factor independently of marital and family status. Interestingly, subjective experience of discrimination declines with age: highest levels are reported among the 18 to 24 year age group; 18 per cent of whom report discrimination in the last two years. In the model all older age groups were found to be less likely to report experience of discrimination than 18 to 24 year olds. It is striking that people aged 65+ years are much less likely to report experience of discrimination. This may reflect different tendencies to interpret differential treatment as discriminatory.
Ethnicity, Nationality and Religion
Ethnicity, nationality and religion are linked to the overall incidence of discrimination. The number of respondents in these groups is small so there are wider margins of error attached to these estimates (see Appendix Tables A4.2, A4.3 and A4.4). White respondents report the lowest “raw” rate of discrimination (12 per cent), compared to 25 per cent of Asian and 40 per cent of Black respondents. Just under a third of those with other or mixed ethnic backgrounds say they experienced discrimination in the last two years. The modelled results provide more nuanced information on the risk of the experience of discrimination. Respondents of Black ethnicity emerge as much more vulnerable than White respondents. Detailed model results (Appendix Table A4.5) show that they are in fact almost twice as likely to perceive discrimination as White respondents. Those of ‘Other’ ethnicity also emerge as more vulnerable to discrimination while Asian respondents are not significantly more likely to report such experience, possibly because nationality and religion are controlled. Irish nationals are less likely to report discrimination than non-Irish nationals: 12 per cent compared to 24 per cent. Raw rates for more detailed nationality categories are provided in Appendix Table A4.2 at end of this chapter31 and show that even those from the UK report higher levels of discrimination (16 per cent) than Irish nationals. The proportion reporting discrimination is higher again among those from other EU countries but does not vary between the EU15 and new EU10 states (24 per cent in 30 However, as we saw in Chapter 3 respondents were given the option of saying they had been discriminated against on the grounds of their sexual orientation or membership of the Traveller community. 31 Estimates for detailed nationalities are provided separately in Appendix Table A2.1, along with confidence intervals, which show the wider range of error for these smaller groups.
The Experience of Discrimination in Ireland 45

both cases). The percentage reporting discrimination rises to 38 per cent among respondents from Africa and 30 per cent among respondents from Asia, including the Middle East. These more detailed nationality categories are not included in the modelled results due to the small sample size. Model results show, however, that non-Irish nationals are 1.5 times more likely to perceive discrimination than Irish nationals. Table 4.1 shows that Non-Catholic groups tend to report higher rates of discrimination compared to Catholics. Muslims record the highest “raw” rate of discrimination, however, when other factors are accounted for in the model, they do not differ significantly from Catholics, neither do Church of Ireland respondents. The model results do show that “other Christian”, “other religion” and “no religion” groups are all more vulnerable than Catholics, even after nationality and ethnicity have been controlled, and that these characteristics overlap.
Disability
A much higher proportion of people with a disability say they have experienced discrimination (20 per cent) than those without (12 per cent). However, the model results reveal just how much more vulnerable this group is: disabled respondents are three times more likely to perceive discrimination when other characteristics are controlled (see Appendix Table A4.5).
Education, Employment Status.
A high proportion of the unemployed reported experiencing discrimination (29 per cent). In the model this group emerges as almost three times more likely to perceive such experience as employed respondents (see Table A4.5). This finding is interesting especially given that unemployment is not a ground covered by equality legislation. There is no significant difference in the level of discrimination reported by the employed and the economically inactive. The relationship between education level and discrimination is not particularly strong but interestingly it is the most socially advantaged group i.e. those with post-secondary/third level education who are more likely to say they have been discriminated against. This pattern of results was also found in the survey of racism in Ireland (McGinnity and O’Connell, 2006). The authors suggest that the more highly educated have a greater awareness of their rights and higher expectations of fair treatment and are therefore more likely to interpret a given incident as discrimination.
Marital Status, Family Status
With regard to family status, being a lone parent is a strong predictor of having felt discriminated against in the last two years (see Table 4.1). Comparing rates of discrimination by marital status we see that those who are separated and those who are single are more likely to record discrimination than the married and widowed. It is likely that there is a significant degree of overlap between the separated and lone parent group however both characteristics emerge as significant in the models. (It is worth repeating that these individuals may have felt discriminated against on grounds other than their marital or family status.)
4.2 Vulnerability to Work-related and Services Discrimination Across Social Groups
Table 4.2 below shows the “raw” and modelled risk of demographic and social groups to Work-related discrimination and discrimination accessing services. This allows us to compare group risks across service and Work-related domains in a way
46 The Experience of Discrimination in Ireland

that was not done in Chapter 2, and there are important differences in service and Work-related domains that it is useful to consider. The level of discrimination experienced by different groups in part depends on their exposure to the risk, for example only those who participate, or try to participate, in the labour market are exposed to a risk of Work-related discrimination. It is for this reason that we look separately at the risk of discrimination in employment and services for each of the groups identified above. It also makes sense to distinguish between these employment and service spheres because they are governed by different sets of equality legislation. Overall, Work-related discrimination is less frequently reported (5 per cent) than discrimination accessing services (9 per cent). This does not necessarily mean that subjective experience of discrimination is less common in the workplace than elsewhere. The difference arises in part because a substantial proportion of the population are not in the labour force and so are not exposed to this risk at all. If we exclude those who say that both of the employment related questions are not applicable to them,32 the rate of Work-related discrimination rises to 7 per cent. Using Table 4.2 we can explore whether the same groups are vulnerable to Work-related discrimination and to discrimination in access to services, again “raw” and modelled risk are presented. Our model for Work-related discrimination (Column 2) excludes those who said both work questions were ‘not applicable’ because they were not in work and had not looked for work in the preceding two years.
Gender and Age
Gender is not linked to service-discrimination (Table 4.2, Columns 3 and 4) when domains are aggregated, but women report a marginally higher raw rate of Work-related discrimination than men (7.8 per cent versus 6.8 per cent, Column 1).33 The work discrimination model shows that this small gender difference remains significant and appears to get somewhat stronger when other characteristics are held constant. We also tested interaction effects between gender and employment status and found that employed women are significantly more likely to report work discrimination than employed men, but unemployed and economically inactive men are more likely to report discrimination than women in the same position. This is consistent with the findings in Chapter 2: women are more likely to experience discrimination at work; men are more likely to experience discrimination while looking for work. “Raw” and modelled results indicate that age has a somewhat stronger impact on service discrimination than work discrimination. Young people were much more likely than all other age groups to say that they had been discriminated against while accessing services.
32 Have you felt discriminated against in the workplace in the last two years? Have you felt discriminated against while looking for work in the last two years? We also ran the models selecting only those who were economically active at the time of the survey and the results are very similar. 33 Note also that there are variations in how gender affects specific service domains like health and financial services (see Chapter 2).
The Experience of Discrimination in Ireland 47

Table 4.2: Respondents Who Reported Experience of Work-related and Services Discrimination in Last Two Years: Raw and Modelled Risk
Work-related* Accessing Services Group Column 1 Column 2 Column 3 Column 4 % Raw Risk Modelled
Risk % Raw Risk Modelled
Risk All 7.2 - 9.0 - Male 6.8 Reference 9.0 Reference Female 7.8 Higher 9.1 Same 18 – 24 years 8.4 Reference 13.7 Reference 25 – 44 years 7.7 Same 10.2 Lower 45 – 64 years 6.7 Same 6.5 Much
Lower 65+ years 1.0 Much Lower 6.1 Much
Lower White 6.9 Reference 8.6 Reference Black or Black Irish 23.1 Same 40.0 Much
Higher Asian or Asian Irish 21.1 Same 17.9 Same Other ethnic group 21.7 Higher 23.3 Higher Irish 6.4 Reference 8.4 Reference Non-Irish 16.5 Higher 17.2 Higher Catholic 6.2 Reference 7.9 Reference Church of Ireland 9.8 Same 8.8 Same Other Christian 16.0 Higher 16.5 Higher Islam 12.5 Same 21.4 Same Other Religion 14.8 Higher 16.9 Higher No religion 13.4 Higher 18.9 Much
Higher No disability 6.8 Reference 8.0 Reference Disability 13.6 Much Higher 16.7 Much
Higher Primary Education 7.7 Reference 8.1 Reference Lower Second Education 6.1 Lower 9.4 Same Upper Second Education 6.2 Lower 8.7 Same Post-second Level
Education 8.1 Same 9.6 Higher
Employed 6.1 Reference 8.0 Reference Unemployed 24.7 Much Higher 13.5 Higher Inactive 8.4 Higher 10.4 Higher Single 8.0 Reference 11.4 Reference Widowed 3.5 Same 6.8 Same Separated 11.9 Higher 14.0 Higher Married 6.3 Lower 7.0 Lower No child <15 years 6.8 Reference 8.3 Reference Couple child <15 years 7.7 Higher 9.2 Higher Lone Parent child <15 years
11.0 Same 18.1 Higher
*Work-related discrimination excludes those who answered “not applicable” to both employment related question. Much higher = more than twice the risk; Much lower = less than half the risk compared to reference group. Same = group does not differ significantly to reference group. Full model results are reported in Appendix Tables A2.3 and A2.4.
48 The Experience of Discrimination in Ireland
Age has relatively little impact on Work-related discrimination, except that those over 65 years are very unlikely to report such discrimination. A similar proportion of the other three age groups report experience of Work-related discrimination and no significant difference is found in the model between the lower three age groups.34 In contrast, previous research suggests that older workers are disadvantaged in a number of respects. A research study by Public and Corporate Economic Consultants (PACEC) (2001) found that many barriers exist to increasing participation of older people in the labour market. It was found that many employers have negative attitudes to recruiting older workers and have not adjusted employment and recruitment practices to increase participation of older people in the labour market. Furthermore, almost three-quarters of all respondents expressed the view that older people were discriminated in recruitment and training. As discussed in Chapter 2, the absence of a significant age effect may arise because the advantageous position of the majority of older workers outweighs the more negative position of the minority trying to access employment or training.
Ethnicity, Nationality and Religion
Dealing first with the “raw” proportions of the various groups who reported discrimination we find that ethnicity and nationality are associated with high raw rates of subjective discrimination in both the services and work spheres. For example, 23 per cent of Black respondents and 21 per cent of Asian respondents say they have experienced Work-related discrimination compared to 7 per cent of White respondents. Being Black has an even more negative effect in accessing services, with fully 40 per cent of this group reporting discrimination in this sphere. Turning to nationality, non-Irish nationals perceive much higher raw rates of discrimination in both the work and services spheres and non-Irish nationals emerge as at higher risk in the models too. Analysis of more detailed nationality categories is problematic due to small sample size35 but we can say that a higher proportion of those from countries outside the EU25 (excluding US, Canada, Australia and Oceania) report experiencing discrimination in work and services than other nationalities.36 Since this group includes immigrants from Africa and Asia it is likely that there is a significant overlap between this effect and the effect of ethnicity. Given the high level of labour migration from the 10 EU Member States that acceded in 2004 (EU10) it is noteworthy that those EU10 nationals report relatively high levels of employment related discrimination: 19 per cent of this group report discrimination compared to 12 per cent of those from the EU15. In relation to service discrimination a surprisingly high proportion of EU15 nationals, 18 per cent, reported problems compared to 8 per cent of Irish nationals and 12 per cent of EU10 nationals. Regarding religion, respondents who are ‘Other Christian’, ‘Other religion’ or ‘No religion’ are more likely to report services discrimination than Catholics, once we account for other factors like ethnicity and nationality in the model. Church of Ireland respondents and Muslims do not differ significantly from Catholics in the model. The model results for ethnicity show that Black respondents have a significantly higher risk of services discrimination than White respondents even when other characteristics are held constant. However, only those in the ‘other’ ethnicity category show significantly higher levels of work discrimination. One reason why
34 In the models for Chapter 2 we examined discrimination within the work sphere in more detail, there we used finer age categories to see if workers aged 55 to 65 years differ in their experience of discrimination. 35 See Appendix Table A4.2 for more information. 36 The detailed composition of nationality categories is supplied below in Appendix Table A4.
The Experience of Discrimination in Ireland 49

ethnicity is not particularly significant in work discrimination is because the numbers in each group are small: if groups are very small it is harder to establish differences that are statistically significant and not just due to chance. In addition, because nationality and religion are also controlled, the effect of ethnicity apparent in the “raw” results is weakened.
Disability
The proportion of those with a disability who reported discrimination accessing services (17 per cent) was double that of those without a disability (8 per cent) (Table 4.2 above). A similar gap exists between the proportions of respondents with a disability, and those without, reporting Work-related discrimination. This is consistent with previous Irish research, which found that people with disabilities fared considerably worse than others in their own age range in terms of education, poverty, deprivation, social life and social participation (Gannon and Nolan, 2005) and that people with disabilities are significantly disadvantaged in the labour market, as discussed in Chapter 2. Both the work and services models underline the strength of the disability effect when other characteristics are held constant: those with disabilities emerge as at “much higher” risk than non-disabled. In fact, as the results supplied in Appendix Table A4.6 show, those with a disability are over twice as likely to perceive Work-related discrimination and over three times as likely to perceive service related discrimination.
Education, Employment Status.
As might be expected, employment status is more strongly linked to Work-related discrimination than service related discrimination: the proportion of the unemployed who reported discrimination in the work domain is three times that of the employed (25 per cent versus 6 per cent) see Table 4.2. The work model confirms these results and the unemployed emerge as at “much higher” risk of discrimination than the employed. The odds (presented in Table A4.6) show that this group are 5 times more likely to perceive Work-related discrimination than the employed. The economically inactive group record low levels of Work-related discrimination, because many will not have been in the labour force over the previous two years.37 Both the unemployed and the inactive report higher “raw” levels of subjective discrimination in accessing services and this finding is confirmed in the service-related model. Education is only linked to Work-related discrimination and not to discrimination accessing services. Those with the highest and lowest levels of education are most likely to report Work-related discrimination, even though higher education is strongly associated with better working conditions and rewards (e.g. see O’Connell et al., 2005). The model results show that when other characteristics are controlled those with higher education are more likely to perceive discrimination in services, a result which did not emerge in the bi-variate analysis. The work model confirms that it is those with the highest and lowest levels of education who experience more Work-related discrimination.
Marital Status, Family Status
Family and marital status have a stronger influence on service discrimination than Work-related discrimination (see Table 4.2).
37 As we have excluded the ‘not applicable’ group, the economically inactive consists of those who have been employed or looking for work at some point during the previous two years, however, as they are currently inactive it is likely that their period of involvement (and hence exposure to work-related discrimination) is likely to be shorter than for the economically active.
50 The Experience of Discrimination in Ireland

A much higher proportion of lone parents (18 per cent) perceive discrimination in services than those married/cohabiting parents or people without children. A higher proportion of lone parents also perceived work discrimination than non-parents or couples with children (11 per cent versus 7 per cent and 8 per cent respectively), although the gap is narrower than for services. Turning to marital status the group reporting the highest raw rate of discrimination is the separated in both the work and service related domains. The models confirm that both marital status and family status have an independent effect on the risk of subjective discrimination. Being separated is associated with a higher likelihood of subjective discrimination compared to single people in both the work and service related models and the any discrimination model presented in Tables 4.2 and 4.1 respectively. Being married is associated with a reduced likelihood of discrimination in all three models. Controlling for other factors makes the effect of parenthood on discrimination more pronounced: couples with children have a higher risk of discrimination than childless respondents in all three models. Lone parenthood is significant for any discrimination and services discrimination but not work discrimination, in contrast with the bi-variate result discussed above. It is possible that controlling for gender and education level and marital status reduces the lone parenthood effect.
4.3 Conclusions This chapter has examined the risk of discrimination across social and demographic groups. We identified a range of characteristics believed to be important for examining discrimination experiences. Many of these characteristics are covered by anti-discrimination legislation in Ireland such as gender; age; family status; marital status; ethnicity; nationality; disability and religion. We also included employment status and education level as these characteristics have been found to be associated with both the risk of discrimination and the attitudes towards discrimination in other studies, and because these are important lines of social stratification within Irish society.38 We do not have enough information to classify respondents by sexual orientation and membership of the Traveller community and so we cannot compare the risks of discrimination among these groups. We find that the groups who most commonly experience subjective discrimination are disabled people, the unemployed, young people, respondents from minority ethnic groups, non-Irish nationals, lone parents, and those who are separated. With regard to ethnicity, Black respondents have the highest rates of subjective discrimination and within religion it is other Christian, ‘other religion’ and more unexpectedly those who identify as having no religion who record the highest rates. There is no overall relationship between discrimination and gender. Women report somewhat higher Work-related discrimination (specifically, at work), but there is no difference in service-related discrimination so the overall difference is very small and not significant. We note in discussion that the association between discrimination and gender varies in different domains, as reported in Chapter 2, but the effects cancel each other out in the overall model. In general, the social characteristics identified increase the risk of both Work-related and service-based discrimination but there are differences in the relative strength of
38 Social class is another important element of social stratification but the data do not contain a social class measure for all respondents. The closest we get to this is an occupational classification that is only available for those currently in employment. The influence of occupation is analysed in Chapter 3 when we look more closely at work-based discrimination.
The Experience of Discrimination in Ireland 51
the association in the two spheres. Employment status, education and gender are more strongly linked to Work-related discrimination, with no gender difference in service discrimination. In contrast, age, ethnicity and family status are more strongly linked to services discrimination than to Work-related discrimination. Disability and religion are relevant in both work and service domains.
52 The Experience of Discrimination in Ireland

Appendix Table A4.1: Respondents Who Reported Experience of Any Discrimination in
Last Two Years: 000s
Group 000s
All 382 Male 187 Female 194 18 – 24 years 81 25 – 44 years 181 45 – 64 years 91 65+ years 29 White 357 Black or Black Irish 8 Asian or Asian Irish 7 Other group including mixed background 9 Irish 324 Non-Irish 58 Catholic 290 Church of Ireland 9 Other Christian 23 Islam 4 Other Religion 19 No Religion 34 No disability 311 Disability 70 Primary Education 71 Lower Second Education 57 Upper Second Education 92 Post-second Level Education 150 Employed 217 Unemployed 28 Inactive 137 Single 180 Widowed 17 Separated 29 Married 156 No child <15 years 242 Couple child <15 years 105 Lone Parent child <15 years 35 Grossed and weighted figures.
The Experience of Discrimination in Ireland 53

Table A4.2: Confidence Intervals for Estimates of Any Discrimination by Nationality
DiscriminationRate (%) Std Error (%)
95% Confidence Interval N Unweighted
Ireland 11.5 0.2 11.0 11.9 23,091 UK 16.1 1.6 12.8 19.3 501 Other EU15 22.9 2.4 18.1 27.8 231 New EU10 24.3 2.4 19.5 29.0 200 Other European 30.0 3.8 22.4 37.6 108 Africa 37.8 3.4 31.1 44.6 174 Asia 30.4 3.6 23.1 37.6 150 US,Canada Australia 21.5 3.8 13.8 29.2 99 Other 27.3 3.8 19.8 34.8 54 Total Notes: Other European includes: Bulgaria, Norway, Romania, Iceland, Luxembourg, and Other European. Asia includes: China, India, Pakistan, Turkey, Middle East and Near East, and Other Asia. Other includes: Central and South America, Other (unspecified).
Table A4.3: Confidence Intervals for Estimates of Any Discrimination by Ethnicity
Discrimination
Rate (%)* Std. Error
(%) 95% Confidence Interval N
UnweightedWhite 12.0 0.2 11.6 12.4 24,146 Black or Black Irish 41.3 3.9 33.5 49.1 128 Asian or Asian Irish 26.1 2.9 20.2 32.0 144 Other including mixed background 30.5 3.0 24.5 36.5 183 Total 12.5 0.2 12.0 12.9 24,601 *Calculated using weighted ungrossed data which leads to some differences from the rate quoted in text for smaller categories of respondents.
Table A4.4: Confidence Intervals Attached to Estimates of Any Discrimination by Religion
Discrimination Rate (%)*
Std. Error 95% Confidence Interval N (Unweighted)
Catholic 11.0 0.2 10.6 11.4 21,598 Church of Ireland 13.3 1.5 10.5 16.2 601 Other Christian 23.8 1.5 20.8 26.8 713 Islam 25.1 4.1 17.1 33.0 76 Other 24.7 1.7 21.3 28.1 504 No religion 23.8 1.3 21.3 26.3 887 Total 12.5 0.2 12.1 12.9 24,379 *Calculated using weighted ungrossed data which leads to some differences from the rate quoted in text for smaller categories of respondents
54 The Experience of Discrimination in Ireland

Table A4.5: Model of Probability of Experiencing Any Discrimination
Odds Sig. Female 1.07 .132 Age 25-44 years 0.74 .000 Age45-64 years 0.59 .000 Age 65+ years 0.32 .000 Black or Black Irish 1.87 .006 Asian or Asian Irish 1.28 .295 Other group including mixed background 1.42 .080 Non-Irish 1.50 .000 Church of Ireland 1.10 .486 Other Christian 1.82 .000 Islam 1.22 .513 Other Religion 1.74 .000 No Religion 1.82 .000 Disability 2.96 .000 Lower Second Education 0.98 .745 Upper Second Education 0.97 .661 Post-second/Third Level 1.29 .000 Unemployed 2.90 .000 Inactive 1.07 .198 Widowed 0.82 .047 Separated 1.42 .000 Married 0.77 .000 Couple child <15 years 1.33 .000 Lone parent child <15 years 1.71 .000 Constant 0.13 .000 Reference categories: male, aged 18-24 years, White; Irish; Catholic; no disability; primary education employed; single; no children under 15 years. Statistically significant results are in bold font. Note strong multi-collinearity between ethnicity, nationality and religion.
The Experience of Discrimination in Ireland 55

Table A4.6: Risk of Discrimination in Work and Services
Work Discrimination* Services Discrimination Odds Sig. Odds Sig. Female 1.19 .013 1.00 .934 Age 25-44 years 0.94 .622 0.67 .000 Age 45-64 years 0.96 .759 0.45 .000 Age 65 + years 0.18 .000 0.31 .000 Black or Black Irish 1.33 .377 2.59 .000 Asian or Asian Irish 1.48 .202 1.20 .505 Other group including mixedbackground 1.63 .054
1.64 .027
Non-Irish 1.80 .000 1.34 .005 Church of Ireland 1.23 .341 1.09 .604 Other Christian 1.96 .000 1.74 .000 Islam 0.96 .941 1.50 .210 Other Religion 1.68 .003 1.60 .001 No Religion 1.76 .000 2.01 .000 Disability 2.29 .000 3.22 .000 Lower Second Education 0.73 .010 1.07 .394 Upper Second Education 0.77 .023 0.98 .764 Post-second/Third Level 1.13 .232 1.19 .018 Unemployed 5.03 .000 1.40 .015 Inactive 1.40 .000 1.43 .000 Widowed 0.62 .057 0.84 .116 Separated 1.45 .003 1.34 .002 Married 0.75 .002 0.75 .000 Couple child <15 years 1.33 .001 1.31 .000 Lone parent child <15 years 1.19 .193 1.85 .000 Constant 0.06 .000 0.10 .000 Reference categories: male, aged 18-24 years, White; Irish; Catholic; no disability; primary education employed; single, no children under 15 years. *Work Model excludes those who answered ‘not applicable’ to both employment related questions. Statistically significant results are in bold font.
56 The Experience of Discrimination in Ireland

5. IMPACT AND FREQUENCY OF DISCRIMINATION, ACTION TAKEN AND KNOWLEDGE OF EQUALITY RIGHTS Those who recorded discrimination of any kind were asked to assess how serious an impact it had on their lives. Respondents were also asked if they took any action in response to discrimination and if they experienced discrimination once, on a few occasions or more regularly. We might expect certain groups to report greater impacts if they perceive discrimination more frequently than others, if the discrimination is qualitatively different (e.g. more direct or aggressive, concentrated in particular domains etc.), if they have greater knowledge of their rights or have different expectations about how they should be treated by others. We might also expect the impact of discrimination to vary with the context in which it occurs. It may also seem intuitive that action would be dependent on the impact, frequency or knowledge of rights. In this chapter we analyse the impact and frequency of reported discrimination, the actions taken and the respondents’ knowledge of their rights under equality law. We discuss the variables individually and also look at how they interact with each other. The data gathered on these variables is not particularly detailed and this limits how precise we can be in our analysis but the discussion below should give a sense of the main patterns.
5.1 Impact of Discrimination Overall, 27 per cent of those who report discrimination in the last two years say that it had little or no effect on their lives, 48 per cent said that it had some effect(s) and 26 per cent reported that it had a serious or very serious effect(s) on their lives. These proportions are the same amongst men and women who experienced discrimination.
5.1.1 Social/Demographic Groups and the Impact of Discrimination Here we assess whether the effects of discrimination vary systematically between different social and demographic groups. (Note that in some cases the social and demographic groups used in this chapter are less detailed than those in previous chapters due to smaller sample sizes.) The analyses are based on the 2,843 respondents (un-weighted) who say they have felt discriminated against. Table 5.1 shows that there is little gender difference among those who reported a serious impact arising from discrimination. The raw results show that a higher proportion of those in the 25-64 year age brackets said that the discrimination had a serious effect on their lives than the other age groups. The model confirms the results relating to age, showing that those aged 25 to 44 and 45 to 64 years were more likely to assess the impact as serious compared to those aged under 25 years. (The full model results are reported in Appendix Table A5.1.) The youngest age group had the lowest rate reporting a serious impact yet this age group reported the most discrimination. Respondents of White ethnicity report the highest “raw” levels of serious impact even though respondents of Black ethnicity report much higher levels of discrimination (see previous chapter), but this difference disappears when we control for other factors in the model. Equally, a greater proportion of Irish nationals report serious effects of discrimination than non-Irish nationals, even though the latter group experienced higher rates of discrimination. However, the models results indicate that this difference is not statistically significant, once we control for other factors.
The Experience of Discrimination in Ireland 57
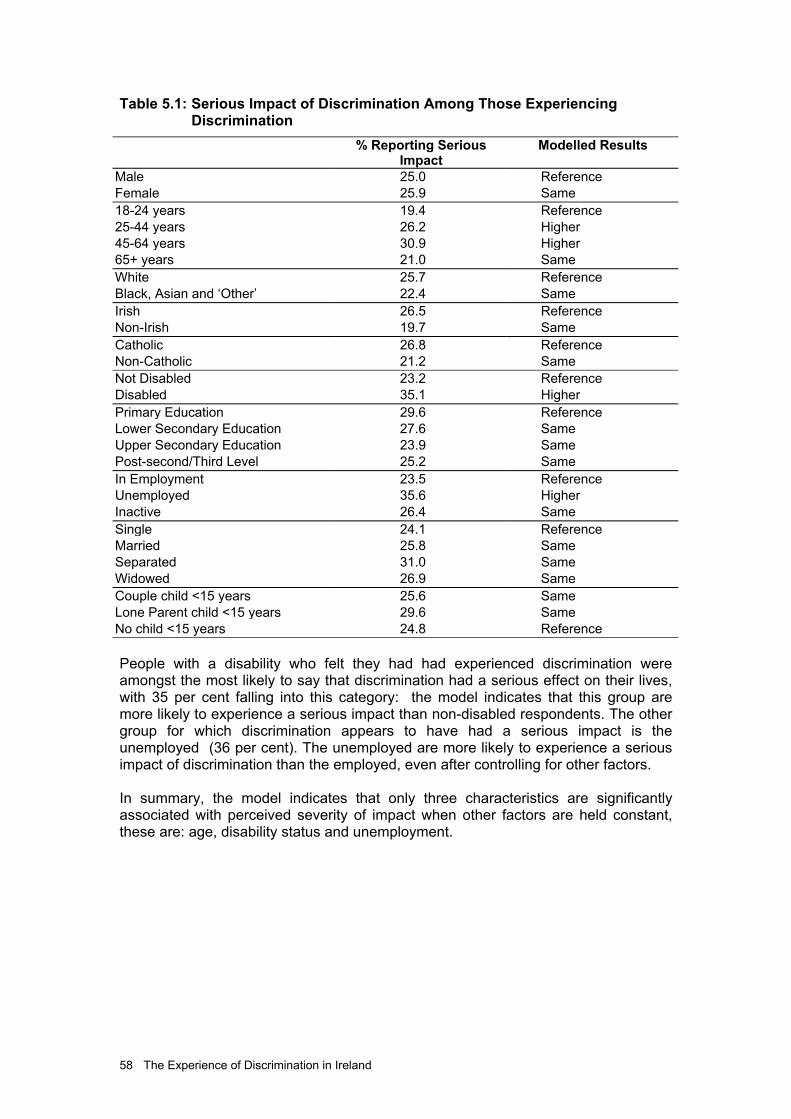
Table 5.1: Serious Impact of Discrimination Among Those Experiencing Discrimination
% Reporting Serious Impact
Modelled Results
Male 25.0 Reference Female 25.9 Same 18-24 years 19.4 Reference 25-44 years 26.2 Higher 45-64 years 30.9 Higher 65+ years 21.0 Same White 25.7 Reference Black, Asian and ‘Other’ 22.4 Same Irish 26.5 Reference Non-Irish 19.7 Same Catholic 26.8 Reference Non-Catholic 21.2 Same Not Disabled 23.2 Reference Disabled 35.1 Higher Primary Education 29.6 Reference Lower Secondary Education 27.6 Same Upper Secondary Education 23.9 Same Post-second/Third Level 25.2 Same In Employment 23.5 Reference Unemployed 35.6 Higher Inactive 26.4 Same Single 24.1 Reference Married 25.8 Same Separated 31.0 Same Widowed 26.9 Same Couple child <15 years 25.6 Same Lone Parent child <15 years 29.6 Same No child <15 years 24.8 Reference People with a disability who felt they had had experienced discrimination were amongst the most likely to say that discrimination had a serious effect on their lives, with 35 per cent falling into this category: the model indicates that this group are more likely to experience a serious impact than non-disabled respondents. The other group for which discrimination appears to have had a serious impact is the unemployed (36 per cent). The unemployed are more likely to experience a serious impact of discrimination than the employed, even after controlling for other factors. In summary, the model indicates that only three characteristics are significantly associated with perceived severity of impact when other factors are held constant, these are: age, disability status and unemployment.
58 The Experience of Discrimination in Ireland

5.1.2 Domains and the Impact of Discrimination Figure 5.1 shows the impact experience of discrimination had on respondents’ lives by domain of discrimination. The analysis in this section is limited to respondents who reported discrimination in only one domain. This is because in cases of discrimination across multiple domains it is not possible to link the reported effect to an individual context. The findings are thus indicative and should be treated with caution.
Figure 5.1: Impact of Discrimination by Domaina
18.2
23.3
28.6
20.0
27.8
16.7
36.2
28.6
47.5
45.5
45.0
42.9
53.3
47.2
66.7
49.3
57.1
40.0
36.4
31.7
28.6
26.7
25.0
16.7
14.5
14.3
12.5
Accessing OtherPublic Services
In the workplace
Obtaining housing oraccomm.
Accessing healthservices
While looking for work
In relation to education
Using services ofbanks, insurance etc
Using TransportServices
In shops/pubs orrestaurants
Little or no impact Some impact Serious impact (incl. v serious)
a Data refer to respondents who reported discrimination in only one domain. Results relating to education and transport domains have low sample size.
In terms of impact, discrimination experienced in the workplace warrants attention: 77 per cent of those who experienced discrimination in this domain alone said it had some or a serious effect on their lives. Discrimination perceived while accessing “other public services” also appears to have had a profound impact on respondents’ lives with 36 per cent of those who reported discrimination in only this domain reporting a “serious effect” and a further 45 per cent reporting “some effect”. However, in absolute numbers relatively few respondents reported discrimination in this domain: 11,000 reported discrimination in only “other public services” and 30,000 named this domain in addition to others. Of those who (only) reported discrimination while accessing health services 80 per cent felt the experience had a serious effect or some effect on their lives.
The Experience of Discrimination in Ireland 59
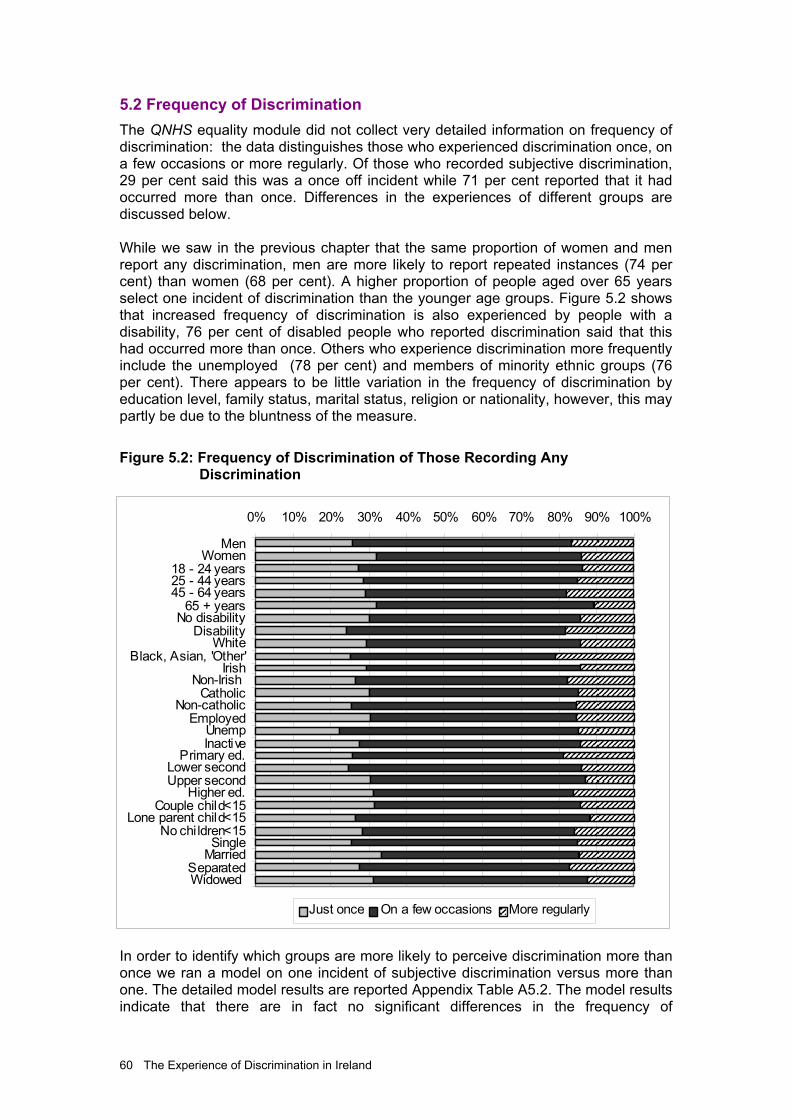
5.2 Frequency of Discrimination The QNHS equality module did not collect very detailed information on frequency of discrimination: the data distinguishes those who experienced discrimination once, on a few occasions or more regularly. Of those who recorded subjective discrimination, 29 per cent said this was a once off incident while 71 per cent reported that it had occurred more than once. Differences in the experiences of different groups are discussed below. While we saw in the previous chapter that the same proportion of women and men report any discrimination, men are more likely to report repeated instances (74 per cent) than women (68 per cent). A higher proportion of people aged over 65 years select one incident of discrimination than the younger age groups. Figure 5.2 shows that increased frequency of discrimination is also experienced by people with a disability, 76 per cent of disabled people who reported discrimination said that this had occurred more than once. Others who experience discrimination more frequently include the unemployed (78 per cent) and members of minority ethnic groups (76 per cent). There appears to be little variation in the frequency of discrimination by education level, family status, marital status, religion or nationality, however, this may partly be due to the bluntness of the measure.
Figure 5.2: Frequency of Discrimination of Those Recording Any Discrimination
0% 10% 20% 30% 40% 50% 60% 70% 80% 90% 100%
MenWomen
18 - 24 years25 - 44 years
45 - 64 years 65 + years
No disabilityDisability
WhiteBlack, Asian, 'Other'
IrishNon-Irish
CatholicNon-catholic
EmployedUnempInactive
Primary ed. Lower secondUpper second
Higher ed.Couple child<15
Lone parent child<15No chi ldren<15
SingleMarried
SeparatedWidowed
Just once On a few occasions More regularly
In order to identify which groups are more likely to perceive discrimination more than once we ran a model on one incident of subjective discrimination versus more than one. The detailed model results are reported Appendix Table A5.2. The model results indicate that there are in fact no significant differences in the frequency of
60 The Experience of Discrimination in Ireland

discrimination by age, among those who report any discrimination. Black respondents are 2.6 times more likely to perceive discrimination more than once than White respondents. Those of no religion and those with a disability are also more likely to perceive repeat discrimination than Catholics or those without a disability and married respondents are significantly less likely than single respondents to perceive repeat discrimination. Figure 5.3 shows the frequency of incidence of discrimination across the nine work and service domains. Subjective discrimination is experienced more frequently in the transport and shops and pubs domains in particular. Interactions in these domains are likely to be brief and frequent, however, and this should be taken into account when interpreting these results. Use of health services is likely to be less frequent and as Figure 5.3 shows one-third of respondents who had problems in this domain reported only one such incident.
Figure 5.3: Frequency of Discrimination Across Domains
33
28
25
25
23
20
18
16
9
53
60
56
56
55
53
66
59
55
14
12
19
19
22
27
16
25
36
0 20 40 60 80 100
Health
Banks
Housing
E ducation
In Work
Other
Look work
Shops and pubs
Transport
Once
On a few occas ions
More regularly
5.3 Actions Taken in Response to Discrimination Those who said they had experienced any kind of discrimination in the preceding two years were asked if they had taken any action in response.39 The question was not asked separately for discrimination in each domain but was asked once to all respondents who said ‘yes’ to discrimination in at least one domain. First we look at the association between actions and the social characteristics of those involved. Below we look at the relationship between actions and the context of discrimination asking if action is more common in particular work or service domains? Four different types of actions were recorded: verbal, written, official complaint and legal 39 The interviewee was asked “What action, if any at all, have you taken in reaction to discrimination you have experienced?” They could answer: verbal action, written action, made an official complaint, legal action or none. Multiple responses were allowed.
The Experience of Discrimination in Ireland 61

action. The last two categories are grouped together in the micro-data. Multiple responses were allowed but in practice only 4 per cent of those who felt they had experienced discrimination recorded more than one action.
Figure 5.4: Action Taken in Response to Discrimination
0%
10%
20%
30%
40%
50%
60%
70%
80%
90%
100%
Men Women All
>1 ActionOfficial or legalWritten action Verbal actionNo action
Note: restricted to respondents who reported that they had experienced discrimination (Un-weighted N=2843). As Figure 5.4 shows overall 60 per cent of those who said they experienced discrimination in the last two years took no further action. The most common form of action taken was verbal, with 26 per cent saying they had taken such action. A further 4 per cent made a written response, only 6 per cent made a formal response by making an official complaint or taking a legal action. This result suggests that the cases that make it to the Equality Tribunal represent a very small fraction of all cases of discrimination. This strengthens the case for using data of this nature, asking questions of a representative sample of the population, to estimate discrimination.
Social and Demographic Groups and Action Taken
Here we examine which groups are most likely to take action in response to discrimination. Are those who are most vulnerable to discrimination or groups who assess its impact to be more serious the ones who are most likely to take action? Alternatively, are those most discriminated against the least proactive? Men were somewhat less likely to have made any response to discrimination than women (37 per cent compared to 43 per cent). In general, it seems that the groups who experience the highest levels of discrimination are least likely to have taken any action. In Chapter 4 we show that the groups who most commonly experience subjective discrimination are the disabled, the unemployed, young people, respondents who are from minority ethnic groups, non-Irish nationals and lone parents. From Figure 5.5 we see that, for example, 71 per cent of the unemployed who were discriminated against took no further action compared to 59 per cent of
62 The Experience of Discrimination in Ireland

those in employment who felt discriminated against. Similarly, non-Irish nationals were significantly less likely to have made a verbal, written or formal complaint than Irish people, and only 24 per cent of minority ethnic respondents who felt discriminated against took any kind of action compared to 41.5 per cent of White respondents. Other groups who were less likely to take action in response to discrimination are younger people, those who are single, those without children and those with lower levels of education.
Figure 5.5: Proportion Taking Any Action in Response to Discrimination
62.6
57.0
73.5
57.6
53.6
52.4
58.5
75.6
57.1
73.4
58.2
63.9
52.1
61.3
57.1
57.8
63.4
58.2
59.2
70.5
58.0
65.6
55.0
51.7
51.5
56.7
55.2
61.5
37.4
43.0
26.5
42.4
46.4
47.6
41.5
24.4
42.9
26.6
41.8
36.1
47.9
38.7
42.9
42.2
36.6
41.8
40.8
29.5
42.0
34.4
45.0
48.3
48.5
43.3
44.8
38.5
0% 20% 40% 60% 80% 100%
Male
Female
18 - 24 years
25 - 44 years
45 - 64 years
65 + years
White
Black, Asian, 'Other'
Irish
Non-Irish
Catholic
Non-Catholic
Disabled
Not disabled
Primary education
Lower second
Upper second
Higher education
In Employment
Unemployed
Not economically active
Single
Married
Separated
Widowed
Couple child<15
Lone parent child <15
No Children
No Action Any Action
Note: Restricted to those who have reported discrimination in the preceding two years. Responding to discrimination requires resources of different types. These include the confidence and language or literacy skills needed to make a complaint, and knowledge of both one’s rights and entitlements and of the systems through which
The Experience of Discrimination in Ireland 63
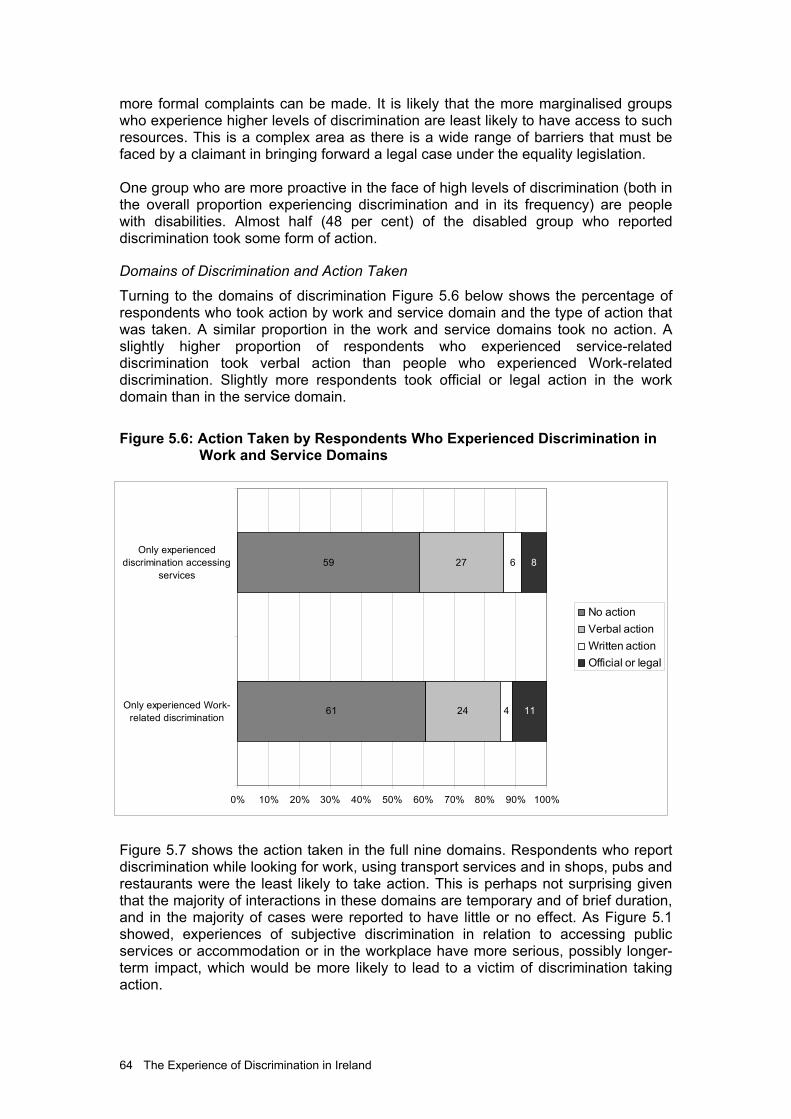
more formal complaints can be made. It is likely that the more marginalised groups who experience higher levels of discrimination are least likely to have access to such resources. This is a complex area as there is a wide range of barriers that must be faced by a claimant in bringing forward a legal case under the equality legislation. One group who are more proactive in the face of high levels of discrimination (both in the overall proportion experiencing discrimination and in its frequency) are people with disabilities. Almost half (48 per cent) of the disabled group who reported discrimination took some form of action.
Domains of Discrimination and Action Taken
Turning to the domains of discrimination Figure 5.6 below shows the percentage of respondents who took action by work and service domain and the type of action that was taken. A similar proportion in the work and service domains took no action. A slightly higher proportion of respondents who experienced service-related discrimination took verbal action than people who experienced Work-related discrimination. Slightly more respondents took official or legal action in the work domain than in the service domain.
Figure 5.6: Action Taken by Respondents Who Experienced Discrimination in Work and Service Domains
61
59
24
27
4
6
11
8
0% 10% 20% 30% 40% 50% 60% 70% 80% 90% 100%
Only experienced Work-related discrimination
Only experienceddiscrimination accessing
services
No actionVerbal actionWritten actionOfficial or legal
Figure 5.7 shows the action taken in the full nine domains. Respondents who report discrimination while looking for work, using transport services and in shops, pubs and restaurants were the least likely to take action. This is perhaps not surprising given that the majority of interactions in these domains are temporary and of brief duration, and in the majority of cases were reported to have little or no effect. As Figure 5.1 showed, experiences of subjective discrimination in relation to accessing public services or accommodation or in the workplace have more serious, possibly longer-term impact, which would be more likely to lead to a victim of discrimination taking action.
64 The Experience of Discrimination in Ireland

Figure 5.7: Percentage of Respondents Who Experienced Discrimination in Domain Who Took Action
58.3
52.5
50.0
46.7
40.0
36.8
30.8
28.6
14.3
41.7
47.5
50.0
53.3
60.0
63.2
69.2
71.4
85.7
Accessing other public services
In the workplace
Obtaining housing or accommod
Accessing health services
In relation to education
Using services of banks, insurance etc
In shops, pubs or restaurants
Using transport services
While looking for work
Any Action No Action
Notes: Analysis is limited to respondents who experienced discrimination in one domain only. Any action includes verbal, written and legal action.
5.4 Relationship Between Action, Frequency, Impact and Knowledge of Rights
Up until now we have focused on action in response to discrimination in general. It is still possible, that overall or within groups it is those who experience more persistent subjective discrimination or who judge that discrimination has had a serious impact on their lives that are most likely to be prompted into action. Here we look at the relationship between action and frequency and the subjective impact of discrimination. Below we also introduce knowledge of rights under equality law into the analysis. Figure 5.8 shows that those who perceive repeated discrimination are no more likely than those who perceive one incident to have taken any action. However, there is a strong association between self-assessed severity of impact and the probability of taking action. Only 25 per cent of those who said the subjective discrimination had little or no effect proceeded to take any action and in the vast majority of cases this was a verbal response. The proportion taking action rises to 39 per cent among those who felt discrimination had some effect and to 59 per cent among those who felt it had a serious impact. The nature of the action taken also varies across these groups. Those who judged the impact to be serious were more likely to have made an official complaint or taken legal action (15 per cent) or to have taken multiple forms of action (10 per cent). Therefore, in the minority of cases where the victims of discrimination identify serious effects, there is a relatively high likelihood of further action. Given that these two pieces of information (action and perceived impact) were collected simultaneously we cannot, however, rule out the possibility that taking further action in itself adds to the scale of the impact on people’s lives.
The Experience of Discrimination in Ireland 65
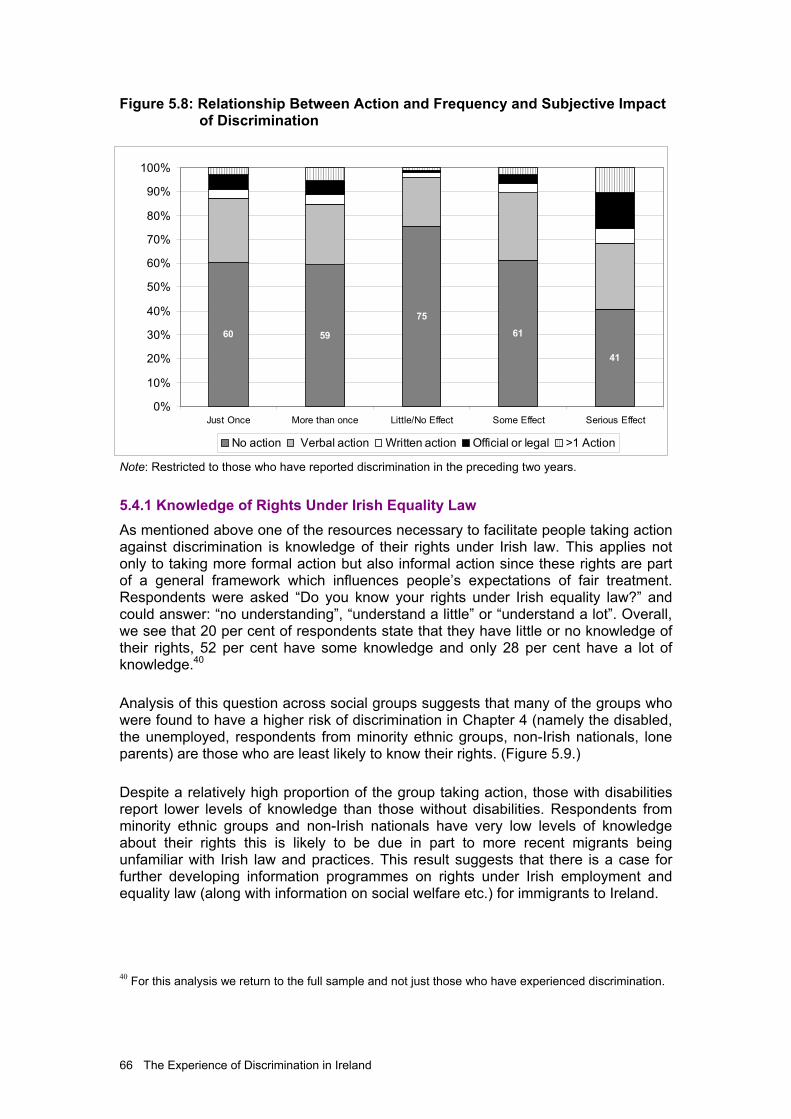
Figure 5.8: Relationship Between Action and Frequency and Subjective Impact of Discrimination
60 59
75
61
41
0%
10%
20%
30%
40%
50%
60%
70%
80%
90%
100%
Just Once More than once Little/No Effect Some Effect Serious Effect
No action Verbal action Written action Official or legal >1 Action
Note: Restricted to those who have reported discrimination in the preceding two years.
5.4.1 Knowledge of Rights Under Irish Equality Law As mentioned above one of the resources necessary to facilitate people taking action against discrimination is knowledge of their rights under Irish law. This applies not only to taking more formal action but also informal action since these rights are part of a general framework which influences people’s expectations of fair treatment. Respondents were asked “Do you know your rights under Irish equality law?” and could answer: “no understanding”, “understand a little” or “understand a lot”. Overall, we see that 20 per cent of respondents state that they have little or no knowledge of their rights, 52 per cent have some knowledge and only 28 per cent have a lot of knowledge.40
Analysis of this question across social groups suggests that many of the groups who were found to have a higher risk of discrimination in Chapter 4 (namely the disabled, the unemployed, respondents from minority ethnic groups, non-Irish nationals, lone parents) are those who are least likely to know their rights. (Figure 5.9.)
Despite a relatively high proportion of the group taking action, those with disabilities report lower levels of knowledge than those without disabilities. Respondents from minority ethnic groups and non-Irish nationals have very low levels of knowledge about their rights this is likely to be due in part to more recent migrants being unfamiliar with Irish law and practices. This result suggests that there is a case for further developing information programmes on rights under Irish employment and equality law (along with information on social welfare etc.) for immigrants to Ireland.
40 For this analysis we return to the full sample and not just those who have experienced discrimination.
66 The Experience of Discrimination in Ireland

Figure 5.9: Knowledge of Rights Under Irish Equality Law
19.8 18.5 21.0
24.1 17.5 16.8
27.6 19.2
42.9
18.2 38.0
18.9 24.9
32.0 18.1
30.9 20.9
16.9 13.0
15.7 27.4
25.5 23.0
15.7 19.5
30.7 15.0
25.5 21.1
52.7
52.1
53.3
52.4
52.4
52.6
53.6
52.9
45.5
53.4
44.3
53.8
45.8
50.1
53.0
54.4
56.6
54.3
48.9
51.7
50.5
54.3
51.8
53.3
53.0
53.2
52.5
53.7
52.7
27.5 29.4
25.8 23.5
30.1 30.6
18.8 28.0
11.7 28.4
17.7 27.3
29.3 17.8
28.9 14.7
22.5 28.8
38.1 32.5
22.1 20.1
25.3 31.0
27.5 16.1
32.5 20.8
26.2
0% 20% 40% 60% 80% 100%
All
Men
Women
18-24yrs
25-44yrs
45-64yrs
65+years
White
Black, Asian, 'Other'
Irish
Non-Irish
Catholic
Non-Catholic
Disabled
Not Disabled
Primary education
Lower second
Upper second
Higher education
In Employment
Unemployed
Not economically active
Single
Married
Separated
Widowed
Couple child<15
Lone parent child<15
No children<15
No understanding Understands a little Understands a lot Those who are unemployed and economically inactive are less aware of their rights than those in employment. The relationship between family status and knowledge is not strong but it is lone parents who have least knowledge, again a group who we found to be vulnerable to discrimination. Among marital status groups it is the widowed that express least knowledge of their rights, this is likely to be associated with their older age profile since older people (aged over 65 years) are significantly less well informed than younger age groups. There is a clear educational gradient in the level and knowledge of rights. Almost a third (31 per cent) of those with only primary level education say they have no knowledge of their rights whereas this applies to only 13 per cent of those with post-secondary or third level education. There is thus an important exception to the general observation above that those groups more likely to experience discrimination are least likely to know their rights:
The Experience of Discrimination in Ireland 67

the highly educated are more likely to experience discrimination and also more likely to know their rights than the low educated. It is possible to assess directly whether knowledge of rights promotes a more active
igure 5.10: Responses to Discrimination and Knowledge of Rights Under Irish
5.4.2 Action Taken When Seriousness, Frequency and Knowledge of Rights
The fi r analysis of responses to discrimination is to estimate a model in
owever, ethnicity is no longer significant suggesting that perhaps it is nationality
response to discriminatory behaviour. In Figure 5.10 we see that there is a strong association between knowledge and action. Almost half of those with a lot of knowledge took formal or informal action in response to discrimination compared to only 30 per cent of those with no knowledge and 41 per cent of those with some knowledge.
F Equality Law
7059
51
0%
20%
40%
60%
80%
100%
No Understand. of rights Little understand. Understands a lot
No action Verbal action Written action Official or legal >1 Action
Note: Confined to those who have experienced discrimination in preceding two years.
Controlled nal step in ou
which we assess whether the different patterns of action across social groups are repeated when we simultaneously take into account seriousness, frequency and knowledge of rights. The model summarised in Table 5.2 shows that even when the level of knowledge and impact of discrimination is held constant a number of social groups still emerge as distinctive in their tendency to take action. Young people are much less likely to take action compared to the three other age groups even when we compare them to others in those age groups with a similar knowledge level and the same social/economic characteristics. Non-Irish nationals who have been discriminated against are also significantly less likely to take action when other relevant characteristics are controlled. Hthat is salient: being from a minority ethnic group has no additional impact, once nationality is accounted for. The unemployed are also less likely than the employed to take action.
68 The Experience of Discrimination in Ireland
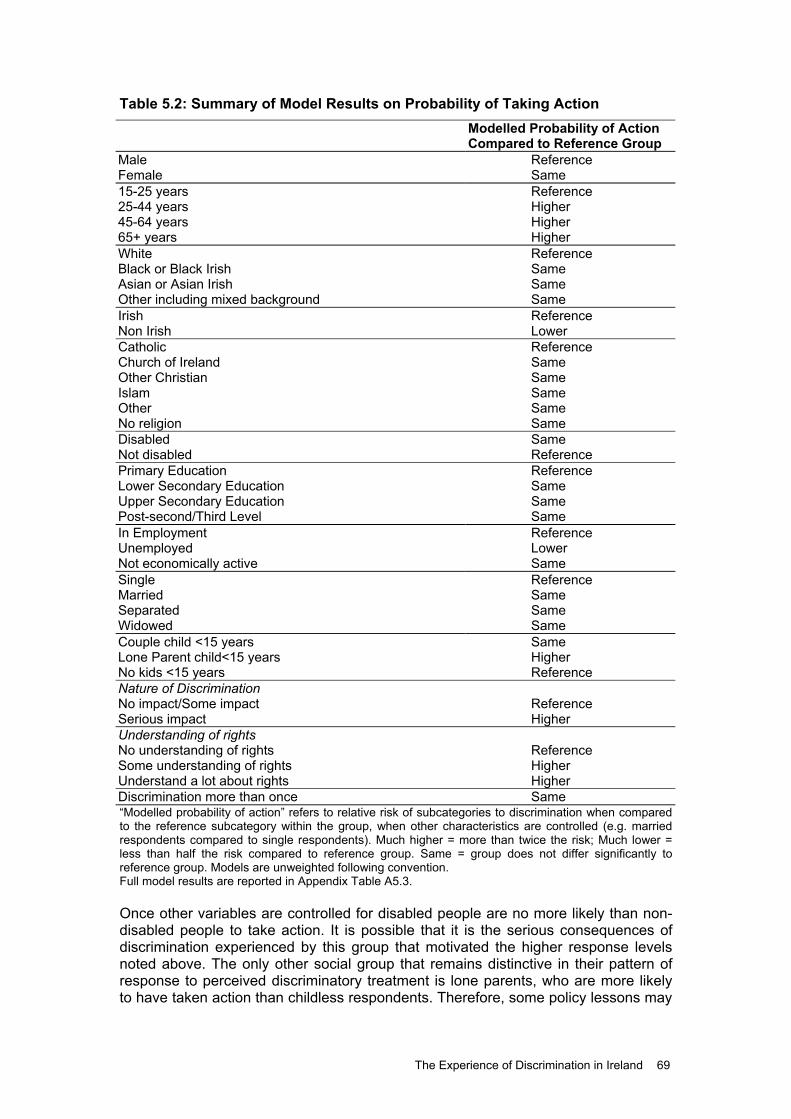
Table 5.2: Summary of Model Results on Probability of Taking Action Modelled Probability of Action
Compared to Reference Group Male Reference Female Same 15-25 years Reference 25-44 years Higher 45-64 years Higher 65+ years Higher White Reference Black or Black Irish Same Asian or Asian Irish Same Other including mixed background Same Irish Reference Non Irish Lower Catholic Reference Church of Ireland Same Other Christian Same Islam Same Other Same No religion Same Disabled Same Not disabled Reference Primary Education Reference Lower Secondary Education Same Upper Secondary Education Same Post-second/Third Level Same In Employment Reference Unemployed Lower Not economically active Same Single Reference Married Same Separated Same Widowed Same Couple child <15 years Same Lone Parent child<15 years Higher No kids <15 years Reference Nature of Discrimination No impact/Some impact Reference Serious impact Higher Understanding of rights No understanding of rights Reference Some understanding of rights Higher Understand a lot about rights Higher Discrimination more than once Same “Modelled probability of action” refers to relative risk of subcategories to disc when compared
nce other variables are controlled for disabled people are no more likely than non-
rimination to the reference subcategory within the group, when other characteristics are controlled (e.g. married respondents compared to single respondents). Much higher = more than twice the risk; Much lower = less than half the risk compared to reference group. Same = group does not differ significantly to reference group. Models are unweighted following convention. Full model results are reported in Appendix Table A5.3. Odisabled people to take action. It is possible that it is the serious consequences of discrimination experienced by this group that motivated the higher response levels noted above. The only other social group that remains distinctive in their pattern of response to perceived discriminatory treatment is lone parents, who are more likely to have taken action than childless respondents. Therefore, some policy lessons may
The Experience of Discrimination in Ireland 69
be learned from this group, in terms of mobilising groups at high risk of discrimination into taking appropriate action. The strong relationship between severity of impact and action taken confirms the
5.5 Conclusions arters of respondents reported that the discrimination they
urning to frequency of discrimination, we constructed a model to investigate the
hen we looked at action taken in response to discrimination we found that 60 per
ooking at the relationship between frequency of experiencing discrimination,
result in Figure 5.10 above and the strong effect of knowledge of rights shows that this is an important mechanism for promoting action amongst those who perceive discrimination. Such action, be it informal or formal, is important for challenging the behaviour of those who discriminate.
More than three-qureported had some/serious or very serious effect on their lives, more than a quarter fell into the latter two categories. A model designed to investigate which social/demographic characteristics are associated with perceived severity of impact (Tables 5.1 and A5.1) found just three characteristics to be significant: age, disability status and unemployment. In many cases the results on the severity of impact are consistent with the findings on risk of discrimination i.e. groups who experience a higher rate of discrimination are also more likely to report a serious impact. In a limited analysis of domains of the experience of discrimination and its impact, we found that more than three-quarters of those who reported discrimination in the workplace alone said it had some or a serious effect on their lives. Tfactors associated with experiencing one incident of discrimination versus more than one. It was found that Black respondents were 2.6 times more likely than White respondents to perceive discrimination more than once. Those of no religion and those with a disability are also more likely to perceive repeat discrimination. Subjective discrimination was reported more frequently in the transport and shops and pubs domains in particular. The unemployed are vulnerable to frequent discrimination in the bi-variate analysis but are no longer distinctive in the model when other social characteristics are held constant. Wcent of those who said they experienced discrimination in the last two years took no further action. Perhaps surprisingly groups who experience the highest levels of discrimination are generally the least likely to have taken any action. Such groups include the young, unemployed, non-Irish nationals and respondents from minority ethnic groups. Almost half of the disabled group who reported discrimination took some form of action yet we found that those with disabilities feel they know less about their rights under equality law than those without disabilities. Domains characterised by brief and temporary interactions were the least closely associated with action: using transport services, in shops, pubs and restaurants and looking for work. Lseverity of impact and action we found that those who perceive repeated discrimination are no more likely to have taken any action but that there is a strong association between severity of impact and the probability of taking action. Taking action in response to discrimination is also strongly related to respondents’ level of knowledge of their rights. This suggests that education and promoting awareness of rights has an important contribution to make as a strategy towards addressing discrimination in the work place and in service environments. Such additional information campaigns might target groups such as the young, non-Irish nationals and the unemployed who are significantly less likely to take any action in response to
70 The Experience of Discrimination in Ireland

discrimination, as well as other groups who report low levels of awareness about rights. In general those social groups at higher risk of discrimination are least likely to know their rights including respondents from minority ethnic groups and non-Irish nationals, the unemployed and the economically inactive. A model designed to investigate whether the different patterns of action across social groups are repeated when we simultaneously take into account seriousness, frequency and knowledge of rights showed that young people and non-Irish nationals are much less likely to take action, and that disabled people are no more likely than non-disabled to take action.
The Experience of Discrimination in Ireland 71

Appendix Table A5.1: Model of Risk of Serious Impact of Discrimination
Sig. Odds Female 0.688 1.04 Age 25-44 years 0.035 1.46 Age 45-64 years 0.005 1.74 Age 65+ years 0.440 0.82 Black or Black Irish 0.219 1.61 Asian or Asian Irish 0.430 1.43 Other ethnic group 0.721 1.15 Non-Irish 0.352 0.84 Church of Ireland 0.310 0.72 Other Christian 0.771 1.06 Islam 0.526 0.68 Other Religion 0.276 0.76 No Religion 0.987 1.00 Disability 0.000 1.75 Lower Secondary Education 0.454 0.90 Upper Secondary Education 0.980 1.00 Post secondary/Third Level 0.972 1.00 Unemployed 0.000 1.87 Inactive 0.318 1.11 Widowed 0.610 1.12 Separated 0.875 1.03 Married 0.516 0.92 Couple child <15 years 0.934 1.01 Lone parent child <15 years 0.243 1.21 Constant 0.000 0.21 N=2747 -2 Log likelihood 3100.761 Cox & Snell R2 0.026 Nagelkerke R2 0.038 Restricted to those who record discrimination. Statistically significant results are in bold font. Reference groups: male, aged 18-24 years, White; Irish; Catholic; no disability; primary education employed; single; no children under 15 years.
72 The Experience of Discrimination in Ireland
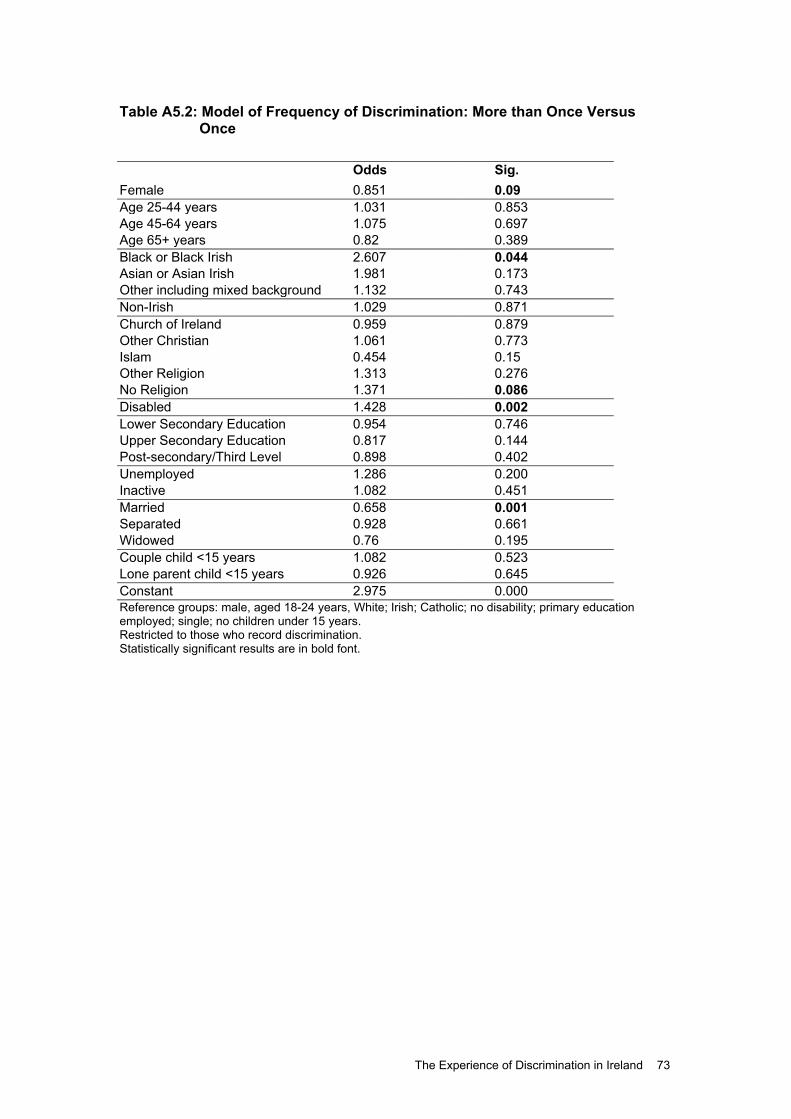
Table A5.2: Model of Frequency of Discrimination: More than Once Versus Once
Odds Sig. Female 0.851 0.09 Age 25-44 years 1.031 0.853 Age 45-64 years 1.075 0.697 Age 65+ years 0.82 0.389 Black or Black Irish 2.607 0.044 Asian or Asian Irish 1.981 0.173 Other including mixed background 1.132 0.743 Non-Irish 1.029 0.871 Church of Ireland 0.959 0.879 Other Christian 1.061 0.773 Islam 0.454 0.15 Other Religion 1.313 0.276 No Religion 1.371 0.086 Disabled 1.428 0.002 Lower Secondary Education 0.954 0.746 Upper Secondary Education 0.817 0.144 Post-secondary/Third Level 0.898 0.402 Unemployed 1.286 0.200 Inactive 1.082 0.451 Married 0.658 0.001 Separated 0.928 0.661 Widowed 0.76 0.195 Couple child <15 years 1.082 0.523 Lone parent child <15 years 0.926 0.645 Constant 2.975 0.000 Reference groups: male, aged 18-24 years, White; Irish; Catholic; no disability; primary education employed; single; no children under 15 years. Restricted to those who record discrimination. Statistically significant results are in bold font.
The Experience of Discrimination in Ireland 73

Table A5.3: Probability of Taking Any Action in Response to Discrimination Odds Sig. Female 1.14 0.149 Age 25-44 years 1.62 0.003 Age 45-64 years 1.67 0.005 Age 65+ years 1.95 0.003 Black or Black Irish 1.04 0.922 Asian or Asian Irish 1.14 0.768 Other including mixed background 0.97 0.93 Non Irish 0.61 0.004 Church of Ireland 1.15 0.597 Other Christian 1.15 0.48 Islam 0.64 0.481 Other 1.44 0.104 No Religion 0.96 0.83 Disabled 1.13 0.26 Lower Secondary Education 1.05 0.73 Upper Secondary Education 0.93 0.589 Post-secondary/Third Level 0.98 0.891 Unemployed 0.61 0.007 Not economically active 0.89 0.263 Married 1.11 0.361 Separated 1.2 0.239 Widowed 1.1 0.646 Couple child <15 years 1.15 0.243 Lone Parent child <15 years 1.39 0.038 Nature of Discrimination Serious impact 2.73 0.000 Some understanding of rights 1.59 0.000 Understand a lot about rights 2.17 0.000 Discrimination more than once 1.05 0.592 Constant 0.21 0.000 Reference categories: male, aged 18-24 years, White; Irish; Catholic; no disability; primary education. Employed; single; no children under 15 years; non-serious impact; no understanding of rights; discrimination once. Statistically significant results are in bold font.
74 The Experience of Discrimination in Ireland

6. CONCLUSIONS This study has examined the experiences of discrimination across the Irish population. Discrimination is often difficult to detect. Some forms of discrimination such as harassment in public places may be overt and observable while other forms of discrimination are more subtle or indirect, such as being turned down for a job because you do not ‘fit in’. Researchers are often confined to drawing conclusions about the extent and nature of discrimination based on observations of unequal outcomes between groups. Others have studied the issue by collecting information on attitudes toward different groups in order to uncover the prejudices and beliefs that lie behind discriminatory behaviour. Experimental studies provide some direct observations of discriminatory behaviour but by their nature are confined to specific contexts and groups. Official complaints and tribunal/legal statistics also provide direct evidence of discrimination but these are highly selective and are likely to represent only those where the complainant is highly motivated. Studies of organisations also provide valuable information on discriminatory processes at an institutional level but the findings cannot normally be generalised beyond the specific case studied.
In this study we rely on individual’s reports of whether they have experienced discrimination over the last two years across a range of domains and on a range of grounds. Our focus is, therefore, on those on the receiving end of discrimination and on their subjective assessment of discrimination. It is based on a national representative survey of over 24,000 respondents and asks about experiences of discrimination across a wide range of domains in the work sphere and in accessing services.
This approach has a number of advantages. First, it provides information on forms of discrimination where no other source of data exists. For example, there are few outcome measures for accessing services like shops/pubs/restaurants or financial services (which may be collected but is owned by private commercial institutions). Second, people who perceive discrimination are much more likely to report the experience in response to a question asked directly of them, than they are to report it in the form of a complaint to an authority. Third, those who have been subjected to discrimination are much more likely to report this experience in a survey, than the perpetrators, who are the focus of studies of prejudice. Social acceptability norms mean that few respondents will openly admit to sexist or racist attitudes or behaviour in surveys.
Fourth, the study is nationally representative and covers the whole population. This means we can compare the experiences of a wide range of groups. Fifth, the study provides invaluable information on the social context of discrimination since it covers a range of domains and is not confined to a specific sphere or institutional context. Finally, since the information relates to direct experiences of discrimination, it is possible to follow up with questions on the frequency, impact and responses to discrimination, which is impossible with indirect outcome based measures of discrimination.
However, the approach, like all the others has its limitations. Self reports of discrimination are subjective and, therefore, subject to two types of error. On the one hand some people may have been subject to discriminatory treatment but did not recognise it as such. On the other hand, some respondents may perceive discrimination where none exists. Second, because the data is collected at the
The Experience of Discrimination in Ireland 75

individual level it will not highlight institutional level discrimination (i.e. discrimination built into the actual fabric of an organisation, for example under representation of a particular group in a workplace). The results should not, therefore, be interpreted as a precise measure of the incidence of discrimination in Irish society. Rather they can tell us about people’s subjective experience of discrimination in Ireland, and how this relates to a range of personal and social characteristics, the domains in which it occurs and to a more limited extent about the consequences of discrimination.
The data comes from the first large scale survey of these issues for the Irish population,41 which was collected as a special module attached to the Quarterly National Household Survey, and was carried out by the CSO in 2004. Given the relative infrequency of subjective discrimination the large size of the sample is important in identifying the patterns and processes involved.
6.1 Main Findings Overall 12.5 per cent of the Irish population said that they have been discriminated against in the preceding two years in at least one of the nine situations outlined; 9 per cent of respondents reported discrimination accessing services and 7 per cent of the relevant population reported Work-related discrimination. Across the services domains examined, rates of subjective discrimination were highest in housing and in financial services. However, it should be noted that while the rates in service and work domains take account of levels of usage in a very broad way by excluding those who did not access the service or participate in employment/job search over the preceding two years this does not control for the very different patterns of usage that still remain e.g. most respondents are likely to go to the shops on a much more frequent basis than they visit health services or apply for a job. The research shows that the likelihood of perceiving discrimination is influenced by gender; age; family status; marital status; race/ethnicity; nationality; disability; religion; employment status, and educational level. The first eight of these characteristics are covered by Irish anti-discrimination legislation, whereas the latter two are risk factors against which citizens are not currently protected. Two other grounds covered by Equality Legislation – sexual orientation and membership of the Traveller community –could not be examined due to data limitations in the survey. Our analysis of Work-related perceived discrimination also reveal further risk factors associated with occupational characteristics: trade union membership, being an employee rather than self-employed, unskilled manual employment (machine operators), and location in the transport/communication or the education sector are all associated with an increased rate of subjective discrimination in work. Part-time workers are more at risk of subjective discrimination while looking for work (even controlling for sex and family status). Personal service/sales work, clerical work and those in associate professional/technical occupations are also associated with higher levels of discrimination in job search, but sector has less impact. Rather than restating the findings in previous chapters we instead draw together the findings on particular groups.
41 Questions about subjective experiences of discrimination have been asked in representative surveys of key groups e.g. migrants and asylum seekers and in European wide surveys that have a smaller sample of Irish respondents.
76 The Experience of Discrimination in Ireland

Women/Men
While there is no difference in the proportion of women and men reporting discrimination overall, women were much more likely to report discrimination on marital and family status grounds and, to a lesser extent, on the gender ground. Age, nationality/ethnicity and disability were more commonly cited by men as the perceived grounds of discrimination. Women were more likely to say they have experienced Work-related discrimination than men. Models further showed that gender had contrasting effects for the two work domains: men experienced more discrimination while looking for work but women experienced higher levels of discrimination in work. And while there is no difference in the proportions of men and women who perceive any service-related discrimination, when we looked within more specific domains we found men were more likely to say they experienced discrimination accessing financial services such as banking and insurance while women were more likely to say they had been discriminated against in accessing health services. Men are more likely than women to say they have experienced repeat discrimination. Despite the differential context of discrimination among men and women, we found no significant difference in the subjective impact of discrimination of men and women.
Older People
Ageism is frequently cited as a problem in the labour market. However, our results show that older people (aged 55 to 64 years) were no more likely to say they have been discriminated against either when in work or looking for work. Those aged over 65 years were less likely to have experienced Work-related discrimination than other age groups. The lack of effect for people aged 55-64 years in work is not surprising given the generally advantaged position of older people in employment (e.g. in relation to occupation, earnings etc.). It is the minority of older people who are outsiders in the labour market who we might expect to report discrimination. The absence of an effect for job search among this age group is, therefore, more striking. One possibility is that older workers who experience difficulties in the labour market are more likely to withdraw and become discouraged (Russell and Fahey, 2004) and, therefore, will not appear in these statistics. Older people (aged 65 plus) are less likely to report subjective discrimination in shops/pubs/restaurants, financial services, education, and housing and report the same low levels of discrimination as the youngest age group (under 25s) in relation to health. While some of these findings are intuitive the low level of health-related discrimination for this group was not anticipated, and may reflect reluctance among older people to interpret unequal treatment as discriminatory. This may partly stem from their relatively low level of knowledge about their rights under Irish equality law compared to younger age groups. This lack of knowledge may also partly explain the greater reluctance of older people to take action in response to discrimination they experience.
Young People
It is noteworthy that claims of discrimination on the grounds of age more commonly come from respondent’s aged under 25 years than those aged over 65 years of age. Indeed young people account for the majority of age-related discrimination in the survey. Young people are particularly likely to have experienced discrimination while using services such as pubs/clubs/restaurants/shops, banks/insurance and housing, but are no more likely than other age groups to report Work-related discrimination. There are no age effects in the perceived impact of discrimination but young people were much less likely than older age groups to have taken any informal or formal action in response.
The Experience of Discrimination in Ireland 77

Lone Parents
Lone parents have one of the highest probabilities of reporting discrimination over the preceding two years. Their risk of discrimination is found to be particularly concentrated within the services domain, with housing/accommodation, transport and other public services standing out as contexts in which lone parents are most likely to experience discrimination. Despite considerable evidence that lone parents face significant barriers in trying to access employment (Russell et al., 2002; Russell and Corcoran, 2000) they are no more likely to report Work-related discrimination than those without children when other factors are held constant. There are a number of possible explanations for this result, which we cannot distinguish with the current data. First that their disadvantaged position in the labour market is not connected with discrimination. Second, that those who faced the greatest difficulties in accessing job opportunities have withdrawn from the labour market and, therefore, have not faced worked related discrimination in the preceding two years. Third, lone parents may experience greater discrimination in the workforce but this effect is soaked up by factors such as gender and marital status in the models. Some evidence from this third explanation comes from the result that those who are separated report higher levels of discrimination in work, and all other marital statuses (single, separated, widowed) report more discrimination in job search than married respondents. Respondents who are part of a couple with children under 15 years also face problems. They are more likely than single respondents to report problems in education, housing and transport domains. Interestingly, unlike lone parents, this group does emerge as significantly more likely to perceive discrimination in the workplace.
Separated People
Separated respondents perceive the highest raw risk of any discrimination among the marital status group. In the models they emerge as more vulnerable to “any discrimination”, “Work-related discrimination” and “service-related discrimination”. They report significantly more problems in accessing financial and health services, and perceive significantly more problems in work than single respondents. Almost one-third of those who experienced discrimination among this group reported that the experience had a serious impact on them. Married people are less likely to experience discrimination in shops/pubs/restaurants, financial services and housing than single people.
Non-Irish Nationals
There is considerable policy interest in the extent to which non-Irish nationals are subject to discrimination in Ireland. From the point of view of the non-Irish nationals themselves, 24 per cent feel they have been discriminated against over the preceding two years, just over twice the rate for Irish nationals. Among non-Irish nationals rates are higher amongst those from Africa and Asia and are lowest among those from the UK, followed by the EU and US/Canada/Australia. The higher likelihood of discrimination among non-Irish nationals persists in both of the work and four of the service domains (housing, shops/pubs/restaurants, financial services and transport), but are particularly pronounced in relation to job search, where immigrants are two and a half times more likely to report discrimination than Irish job seekers, even when ethnicity and religion are already taken into account. It is likely that recent immigrants with a low standard of English are poorly represented in the survey so we can say nothing of their exposure to subjective discrimination.
78 The Experience of Discrimination in Ireland

Non-Irish national respondents are less likely than Irish nationals to say that discrimination had a serious impact on their lives, but this was insignificant when other characteristics are controlled suggesting that this response may reflect the younger age profile of immigrants. They are also much less likely than Irish nationals to have taken any action in response to discrimination. Lack of knowledge of rights is a particular problem for this group, with 38 per cent saying that they have no knowledge of their rights under equality legislation suggesting the need for further targeted information strategies for immigrants about their protection under equality legislation.
Black, Asian and Other Ethnicity
Respondents of Black ethnicity have the highest “raw” risk of discrimination among the ethnic groups with 40 per cent of those surveyed having experienced discrimination. This compares to 12 per cent of White respondents and 25 per cent of the Asian group. Ethnicity is more strongly associated with discrimination in services than work. However, the lack of an effect in the work domains is partly because the numbers in each group are small (ethnicity becomes statistically significant if the Black, Asian and Other groups are combined). Black respondents are more likely to report discrimination in shops/pubs, public transport, accessing financial services and housing. Those respondents of Asian ethnicity are in contrast only significantly more likely to experience discrimination in the transport domain. Black respondents are found to be at greater risk of repeat discrimination than White respondents. Given these high rates of subjective discrimination it is somewhat surprising that ethnicity is not linked to the perceived seriousness of impact. We speculate that this may be due to differences in knowledge of rights (43 per cent of minority ethnic respondents said they had no knowledge of their equality rights compared to 19 per cent of White respondents), differential expectations or may be a coping mechanism for dealing with regular exposure to discrimination. Nor do the high rates of discrimination translate into higher levels of reaction: a much lower proportion of ethnic minority respondents than white respondents took action in response to discrimination (24 per cent compared to 42 per cent).
Other Christian, Other Religion, No Religion
Respondents of Other Christian religion, Other religion and No religion emerge as significantly at risk in any work and any services models and in both more detailed Work-related models. Other Christian respondents are at risk of discrimination in five of the seven service domains: financial, education, health, transport and other public services. Those of no religion emerged as more likely to perceive discrimination in shops and pubs, financial and housing sectors. ‘Other Christian’ may include other Protestant religions as well as Apostolic/Pentecostal and Orthodox, and ‘other religion’ may include Jewish, Hindu, Buddhist and Sikh respondents. ‘Islamic’ respondents did not report higher rates of discrimination overall, or in Work-related or service-related discrimination, however, they did report significantly higher levels of discrimination in the transport domain.
People with Disabilities
Our analyses show that disability is one of the strongest predictors of discrimination risk. People with disabilities were significantly more likely to perceive discrimination in all but one of the nine work and service domains than those without a disability (education is the only domain without a significant effect). Disability has the strongest effect in the health domain and in transport services, where disabled respondents are over five times more likely to perceive problems of discrimination. In shops/pubs,
The Experience of Discrimination in Ireland 79

financial services, housing and other public services this group are over twice as likely to perceive discrimination than people without disabilities. Disability has a strong effect on work- related discrimination particularly in the workplace where the group are 2.8 times more likely to perceive problems. Furthermore, these experiences of discrimination were not limited to one-off incidences but were a more regular part of disabled people’s lives than most other groups. Unsurprisingly then, people with disabilities were one of just four groups for whom discrimination was perceived to have had a more serious impact. Of those disabled respondents who had experienced discrimination 35 per cent said the experience had a serious impact on their lives. Almost half of disabled people who perceived discrimination took some sort of action. While this suggests that they are more proactive than other groups, it still means that just over half (52 per cent) took no action despite fairly pervasive discrimination. A significant deficit in knowledge of rights exists with just under one-third of disabled respondents having no knowledge of their rights under equality law.
The Unemployed
The unemployed are not currently covered by equality legislation but they emerge clearly from the current study as a group particularly vulnerable to discrimination: 29 per cent have experienced some form of discrimination in the last two years. Unsurprisingly, the unemployed are particularly vulnerable to discrimination while looking for work. Job seekers in this group are 8.7 times more likely to report experience of discrimination in the preceding two years than those currently employed. The unemployed are also over three times more likely to have experienced discrimination in the workplace. It is possible that the experience of being discriminated against is either leading people to become unemployed and/or keeping them in an unemployed state, however, we cannot establish this with the current data. The unemployed also report a significantly increased risk of discrimination in four of the seven service domains: education, health, housing and shops/pubs.
The unemployed are almost twice as likely as employed respondents to report that their experience of discrimination had a serious impact on their lives, 36 per cent of the unemployed respondents who experienced discrimination said the resulting impact was serious, which was the highest percentage among all the groups investigated. This finding is made more worrying by the fact that the unemployed are significantly less likely to take action in response to discrimination: 71 per cent of unemployed respondents who had reported experiencing discrimination took no action. Knowledge of rights is relatively poor among unemployed respondents with only 22 per cent claiming to understand a lot about their rights under equality law.
Impact of Discrimination
The summary of results for vulnerable groups highlights how the impact of discrimination varies across certain groups. The perceived impact of discrimination is also found to vary depending upon the context in which it occurs. Discrimination in ‘accessing other public services’, in the workplace and obtaining housing/accommodation is seen to have a more serious impact by those who experience it. Workplace discrimination is likely to have a serious impact for two reasons: first because it potentially has a major effect on the victim’s livelihood and second, because employment involves an ongoing set of relationships and interactions leading to the possibility of more enduring longer-term discrimination. Housing discrimination also has serious implications for quality of life if as a result people are denied access to suitable accommodation. The finding that discrimination experienced in the workplace and in relation to housing is associated with the most
80 The Experience of Discrimination in Ireland

severe impact is understandable given that these are two dominant spheres in most people’s lives.
Taking Action on Discrimination
Our analysis and discussion above shows that often social groups who experience the highest levels of discrimination are least likely to take action. Responding to discrimination requires a range of resources such as language skills, confidence and knowledge of one’s rights and entitlements. It appears that more marginalised groups who are subject to higher levels of discrimination also lack some of these resources. The context in which discrimination occurs is also associated with the probability of action. Perceived discrimination in the workplace, accessing ‘other public services’, in housing and health services was associated with higher levels of action among those at the receiving end. Perceived discrimination in job search resulted in the lowest levels of action. The low level of complaints against discrimination experienced in job search is made more worrying by the fact that this was a domain in which discrimination was perceived to have had a relatively serious impact. It is possible that the imbalance of information between job seekers and recruiters may mean the burden of proof may be heavier for those who feel discriminated against in this domain. Levels of response are also low for discrimination in transport services and shops/pubs/restaurants. It is possible that a victim of discrimination within an institution with defined and accessible policies and procedures may be more likely to take action. For example, someone who has been discriminated against in the workplace will have access to a more obvious complaint mechanism than an outsider for whom the first steps may be less clearly defined. Our model also showed that holding social characteristics constant, two further features of discrimination make taking action more likely – understanding of rights and perceived seriousness of impact. These results suggest that targeted information campaigns may be a useful strategy for encouraging particular groups who experience discrimination to take action of an informal or formal nature, and in that way to challenge the behaviour of those who discriminate.
6.2 Implications for Policy The results of this study outline the scale and distribution of discrimination experienced in Ireland. It highlights particular social groups and particular social institutions/contexts in which levels of discrimination experienced are high. The results suggest that financial services, workplace, recruitment and accommodation/housing are areas that may require particular monitoring for discriminatory practice. In terms of groups affected by discrimination, both the unemployed and inactive, non-Irish nationals and the disabled are particularly at risk of Work-related discrimination. In service-related discrimination, it tends to be the disabled, non-Irish nationals and minority ethnic groups who consistently experience discrimination, and these results suggest that these groups need particular supports, and employers and service providers need to be aware of the potential dangers of discriminatory practices. However, the results also highlight the considerable variation across domains in the characteristics of those experiencing discrimination: it is different people who experience discrimination in housing than in financial services. The findings are also contrary to some expectations, for example, young people are more likely to report age-related discrimination than older people. The finding that the most highly discriminated against groups are the least likely to take action indicates the potential benefit of proactive third party interventions such
The Experience of Discrimination in Ireland 81

as information campaigns, advocacy and legal supports, along with initiatives by employers and service providers to implement good practice. The study also highlights a number of factors that are strongly linked to discrimination in certain domains but are not covered by current equality legislation. Unemployment is chief among these factors. As outlined above the unemployed experience higher levels of subjective discrimination across a range of domains and not just in the work sphere. Consideration might be given to the possibility of extending the discrimination grounds to cover this group.
6.3 Implications for Future Data Collection/Research The QNHS module on discrimination provides invaluable information on the experience of subjective experience of discrimination in Ireland. Given the changing nature of Irish society it is extremely important that this information is collected on a regular basis so the level and distribution of discrimination can be tracked and changes monitored. The quality of the data could be improved in a number of ways. In cases where respondents felt discriminated against in different domains, the current data does not allow us to link the frequency of discrimination, impact of discrimination or response to a specific domain. Follow-up information related to each report of discrimination would allow a more thorough examination of this issue. Second, while sexual orientation was included in the survey as one of the grounds of discrimination, no information was collected on the sexual orientation of respondents. Collection of this information would not only provide important information on the sexual orientation across the population, it would also allow a comparison of the risk of discrimination across homosexual, lesbian and heterosexual men and women. Too few members of the Traveller community were captured in this survey to allow for separate analysis of this group but a targeted sub- sample of Travellers, based on an alternative sampling frame and using the same questionnaire, could yield very interesting information. Provision of translated support forms to interviewers (using a methodology similar to that used during the fieldwork for Census 2006) would help increase participation of non-Irish national communities, helping to boost sample size and to provide more accurate information on their experience. Supplementary qualitative research may help to further define the ‘other’ ground. An open-ended question that allows respondents to specify to which other ground they refer would be very informative. Separate identification within the survey of public social welfare services may also refine the category of “other public services”. The continued collection of information on subjective discrimination would be a valuable resource for equality research and policy. This would also complement the results of research on unequal outcomes across different groups and the other sources of equality information outlined above.
82 The Experience of Discrimination in Ireland
REFERENCES Allport, G.W., 1954/1979. The Nature of Prejudice Cambridge, MA: Perseus Books. Altonji, J. G. and R.M. Blank, 1999. "Race and Gender in the Labor Market," in O.
Ashenfelter and D. Card (eds.), Handbook of Labor Economics, Edition 1, Volume 3, Chapter 48, pp. 3143-3259, Elsevier.
Banton, M. 1994. Discrimination. Buckingham: Open University Press. Barrett, A., T. Callan, A. Doris, D. O’Neill, H. Russell, O. Sweetman and J. McBride, 2000.
How Unequal? Men and Women in the Irish Labour Market, Dublin: Oaktree Press in association with The Economic and Social Research Institute.
Barrett, A. and Y. McCarthy, 2006. “An Analysis of Immigrant Earnings and Welfare Usage in Ireland”. Presentation to the Dublin Economics Workshop, Kenmare, Co. Kerry, October.
Barrett, A., A. Bergin and D. Duffy, 2006. “The Labour Market Characteristics and Labour Market Impacts of Immigrants in Ireland”. The Economic and Social Review. Spring, pp.1-26.
Berik, G., Y. van der Meulen Rodgers and J.E. Zveglich Jr. 2004. “International Trade and Gender Wage Discrimination: Evidence from East Asia”, Review of Development Economics, Vol. 8, No. 2, pp. 237-254.
Bertrand, M. and S. Mullainathan, 2004. “Are Emily and Greg More Employable than Lakisha and Jamal? A Field Experiment on Labor Market Discrimination”, The American Economic Review, Vol.94, No.4, pp.991-1013.
Betts, J. and J. Hamilton, 2006. The Nature and Effects of Racist Behaviours Experienced by Northern Ireland’s Ethnic Minority Health Staff. Belfast: Department of Health, Social Service and Public Safety.
Blank, R.M., M. Dabady and C.F. Citro (eds.), 2004. Measuring Racial Discrimination. Washington DC: The National Academies Press.
Bobo, L., 2001. “Racial Attitudes and Relations at the Close of the Twentieth Century” in N.J. Smelser, W.J. Wilson and F. Mitchell (eds.), America Becoming: Racial Trends and their Consequences. Vol. 1., Commission on Behavioral and Social Sciences and Education, National Research Council. Washington, DC: National Academy Press.
Bridges, W. P. and R. L. Nelson, 1999. Legalizing Gender Inequality: Courts, Markets and Unequal Pay for Women in America, Cambridge: Cambridge University Press.
Burstein, P., 1990. “Intergroup Conflict, Law and the Concept of Labor Market Discrimination”, Sociological Forum, Vol. 5, No. 3, pp. 459-476.
Callahan, D., 1987. Setting Limits: Medical Goals in an Ageing Society. New York: Simon and Schuster.
Central Statistics Office, 2005a. Quarterly National Household Survey, Equality Module. Dublin: Central Statistics Office.
Central Statistics Office, 2005b. Quarterly National Household Survey, Quarter 2, 2005. Dublin: Central Statistics Office.
Central Statistics Office, 2006. Quarterly National Household Survey, Dublin: Central Statistics Office.
Central Statistics Office, 2003, 2007. Population and Migration Estimates. Dublin: Central Statistics Office.
Conley, D., 1999. Being Black, Living in the Red: Race, Wealth and Social Policy in America, Berkeley: University of California Press.
Conroy, P, and A. Brennan, 2003. Migrant Workers and Their Experiences, Dublin: Equality Authority.
The Experience of Discrimination in Ireland 83

Commission on the Status of People with Disabilities 1996. A Strategy for Equality: Report of the Commission on the Status of People with Disabilities. Dublin: Government Publications Office.
Corell, S.J., S. Benard and I. Paik, 2007. “Getting a Job: Is There a Motherhood Penalty?”, American Journal of Sociology, Vol.112, No.5, pp.1297-1338.
Cox, O.C., 1948. Caste, Class and Race, Garden City, New York: Doubleday. Crowley, N., 2005. An Ambition for Equality. Dublin: Irish Academic Press. Darity, W. and P. Mason, 1998. “Evidence on Discrimination in Employment: Codes
of Color, Codes of Gender”, The Journal of Economic Perspectives, Vol.12, No.2, pp. 63-90.
Dovido, J. F., P. Glick, L.A. Rudman (eds.), 2005. On the Nature of Prejudice: Fifty Years After Allport. Malden, MA: Blackwell Publishing.
Eckberg, D., 1979. Intelligence and Race: The Origins and Dimensions of the IQ Controversy. New York: Praeger.
England, P., 1992. Comparable Worth: Theories and Evidence. New York: Aldine De Gruyter.
Equality Act 2004: http://www.oireachtas.ie/documents/bills28/acts/2004/A2404.pdfEuropean Monitoring Centre on Racism and Xenophobia, 2006. Migrants’
Experiences of Racism and Xenophobia in 12 EU Member States. Vienna: EUMC.
Evans, M.D.R. and J. Kelley, 1991. “Prejudice, Discrimination and the Labor Market: Attainments of Immigrants in Australia”, American Journal of Sociology, Vol. 97, No. 3, pp. 721-759.
Fahey, T. and H. Russell, 2001. Family Formation in Ireland: Trends, Data Needs and Implications, Policy Research Series, No. 43. Dublin: The Economic and Social Research Institute.
Fahey, T. and H. Russell, 2004. Ageing and Labour Market Participation, Dublin: The Equality Authority.
Fahey, T., H. Russell and E. Smyth, 2000. “Gender Equality, Fertility Decline and Labour Market Patterns among Women in Ireland”, in B. Nolan, P.J. O’Connell and C.T. Whelan, From Bust to Boom?: The Irish Experience of Growth and Inequality, Dublin: IPA/ESRI.
Fahey, T., 2005. “Strategy on Family Supports: Background Paper”, Draft of paper prepared for the Inter-Departmental Committee on the Strategy for Family Supports.
Fahey, T., 2006. “Discrimination, Prejudice and Bias: A conceptual review”, Dublin: The Equality Authority, EA research.
Feagin, J. R. and D. L. Eckberg, 1980. “Discrimination: Motivation, Action, Effects, and Context”. Annual Review of Sociology. Vol. 6, pp. 1-20.
Fix, M. and R. Struyk, 1993. Clear and Convincing Evidence: Measurement of Discrimination in America, Washington DC: The Urban Institute Press.
Gannon, B. and B. Nolan, 2005. Disability and Social Inclusion in Ireland, Dublin: National Disability Authority and The Equality Authority.
Gannon, B. and B. Nolan, 2004. Disability and Labour Market Participation, Dublin: The Equality Authority.
Garner, S., 2004. Racism in the Irish Experience. London: Pluto Press. Gibson, F.G. Michael and D. Wilson, 1994. Perspectives on Discrimination and
Social Work in Northern Ireland. Central Council for Education and Training in Social Work.
Gunaratnam, Y., 2003. Researching ‘Race’ and Ethnicity: Methods, Knowledge, and Power. London: Sage Publications.
Hewstone, M., R. Rubin and H. Willis, 2002. “Intergroup Bias”, Annual Review of Psychology. Vol. 53, pp. 575-660.
84 The Experience of Discrimination in Ireland

Hughes, G., F. McGinnity, P.J. O’Connell, E. Quinn, 2007. “The Impact of Immigration”, in T. Fahey, H. Russell and C.T. Whelan (eds.), Best of Times? The Social Impact of the Celtic Tiger, Dublin: Institute of Public Administration.
Jones, J., 1972. Prejudice and Racism. Reading, MA: Addison-Wesley. Kanter, R., 1977. Men and Women of the Corporation, New York: Basic Books Inc. Layte, R., A. Nolan and B. Nolan, 2007. “Health and Health Care”, in T. Fahey, H.
Russell and C.T. Whelan (eds.), Best of Times? The Social Impact of the Celtic Tiger, Dublin: Institute of Public Administration.
Mac Gréil, M.,1980. Prejudice and Tolerance in Ireland. New York: Praeger. Mac Gréil, M.,1996. Prejudice in Ireland Revisited: Based on A National Survey of
Intergroup Attitudes in the Republic of Ireland, Dublin: Survey Unit, St. Patrick’s College, Maynooth.
Massey, D. and N. Denton, 1993. American Apartheid, Cambridge, MA: Harvard University Press.
McConahay, J.B., B.B. Hardee, V. Batts. 1981. “Has Racism Declined in America? It Depends on Who is Asking and What is Asked.” The Journal of Conflict Resolution. Vol. 25, No. 4, pp. 563-579.
McGinnity, F., P.J. O’Connell, E. Quinn and J. Williams, 2006. Migrants' Experience of Racism and Discrimination in Ireland: Survey Report, Dublin: The Economic and Social Research Institute.
National Action Plan Against Racism. 2005. at: http://www.justice.ie/ 80256E010039C5AF/vWeb/flJUSQ696JJX-en/$File/NPARen.pdf
National Disability Authority, 2002. Towards Best Practice in Provision of Transport Services for People with Disabilities in Ireland.
Newman, J. M., 1978. “Discrimination in Recruitment: An Empirical Analysis”, Industrial and Labour Relations Review, Vol. 32, No.1, pp.15-23.
Nolan, B. and M. Wiley, 2001. Private Practice in Irish Public Hospitals, General Research Series No. 175, Dublin: The Economic and Social Research Institute.
O’Connell, P.J. and H. Russell, 2005. Equality at Work? Workplace Equality Policies, Flexible Working Arrangements and the Quality of Work, Dublin: The Equality Authority, Equality Research Series.
O’Connell, P.J. and H. Russell, 2007. “Employment and the Quality of Work” in T. Fahey, H. Russell and C.T. Whelan (eds.), Best of Times? the Social Impact of the Celtic Tiger, Dublin: Institute of Public Administration.
O’Connell, P.J. and F. McGinnity (forthcoming). “Immigrants at Work: Ethnicity and Nationality in the Irish Labour Market,” Dublin: ESRI/Equality Authority.
O’Connor, P., 1998. Emerging Voices: Women in Contemporary Irish Society, Dublin: Institute of Public Administration.
Pager, D., 2007. “The Use of Field Experiments for Studies of Employment Discrimination: Contributions, Critiques and Directions for Future Research”. The Annals of the American Association of Political and Social Science, Vol. 609, January.
Public and Corporate Economic Consultants (PACEC), 2001. Labour Participation Rates of the Over-55s in Ireland. Dublin: National Competitiveness Council and the Expert Group on Future Skills Needs.
Petit, P., 2007. “The Effects of Age and Family Constraints on Gender Hiring Discrimination: A Field Experiment in the French Financial Sector”, Labour Economics, Vol.14, Issue 3, pp. 371-391.
Riach, P. and J. Rich, 2006. “An Experimental Investigation of Sexual Discrimination in Hiring in the English Labour Market”, Advances in Economic Analysis and Policy. Vol. 6, Issue 2, pp. 1-20.
Riach, P. and J. Rich, 2002. “Field Experiments of Discrimination in the Market Place”, The Economic Journal, Vol. 112, F480-F518.
The Experience of Discrimination in Ireland 85

Race, Ethnicity and the American Labor Market: What’s at Work? 2005. Washington DC: American Sociological Association. Available on line at: http://www2.asanet.org/ centennial/race_ethnicity_labormarket.pdf
Reskin, B.F. and P.A. Roos, 1990. Job Queues, Gender Queues: Explaining Women’s Inroads into Male Occupations. Philadelphia: Temple University Press.
Russell, H., E. Smyth, M. Lyons and P.J. O’Connell, 2002. Getting out of the House: Women Returning to Employment, Education and Training, Dublin: Liffey Press in association with The Economic and Social Research Institute.
Russell, H. and M.P. Corcoran, 2000. “The Experience of Those Claiming the One-parent Family Payment” in Review of the One-Parent Family Payment, Department of Social Community and Family Affairs, Dublin: Stationery Office.
Russell, H. and T. Fahey, 2004. Ageing and Labour Market Participation. Dublin: The Equality Authority.
Russell, H. and B. Gannon, 2002. “The Gender Wage Gap in Ireland”, Impact Evaluation of the European Employment Strategy in Ireland, Dublin: Department of Enterprise, Trade and Employment.
Russell, H., E. Smyth, P.J. O’Connell, 2005. Degrees of Equality: Gender Differentials Among Recent Graduates, Dublin: The Economic and Social Research Institute.
Smith, T.W., 2002. “Measuring Racial and Ethnic Discrimination”. Unpublished paper, National Opinion Research Center, Chicago.
Wang, Y.Y., 2006. “Chinese Students in Ireland”, Dublin: NCCRI.
86 The Experience of Discrimination in Ireland

METHODOLOGICAL APPENDIX The Quarterly National Household Survey The data used in the current report was collected by means of the Quarterly National Household Survey (QNHS). Each quarter the Central Statistics Office (CSO) produces a Quarterly National Household Survey (QNHS), the main objective of which is to provide estimates on short-term indicators of the labour market. Special survey modules are included for the collection of data on social topics and in Quarter 4 of 2004 a special module on equality was included. This module provides the basis for our analysis here. We also draw on additional data from the main QNHS, which was kindly matched to the module data by the CSO specifically for this project. The QNHS is continuous and targets all private households in the state. The total sample per 13-week quarter is 39,000; it is achieved by interviewing three households per week.42 Households are asked to take part in the survey for five consecutive quarters before being replaced.43 In each quarter one-fifth of the households surveyed are replaced and the QNHS sample involves an overlap of 80 per cent between consecutive quarters and 20 per cent between the same quarter in consecutive years. The QNHS is the second largest statistical project undertaken by the Central Statistics Office after the Census. Participation is voluntary, however, the response rate is high at approximately 93 per cent. The survey results are weighted to agree with population estimates broken down by age, sex and region. Although the QNHS provides generally high quality information there are some challenges involved in capturing minority groups on this type of survey. The CSO estimates that the QNHS undercounts the immigrant population by about 20 per cent (CSO, 2005b). Data are not released on certain groups unless the sample is sufficiently large to be properly representative. Respondents to the Equality Module questionnaire were asked to indicate whether they were members of the Traveller community but the number of respondents who answered affirmatively is too small to allow separate analysis of this group, instead they have been subsumed into the “White ethnicity” category. Respondents were not asked about their sexual orientation so we cannot interrogate the data from this perspective either. While the main purpose of the QNHS is the production of quarterly labour force estimates, there is also provision for the collection of data on social topics through the inclusion of special survey modules. The selection of the major national modules undertaken to date has been largely based on the results of a canvas of users (over 100 organisations) that was conducted by the CSO in 1996 and most recently 2002. The results of the canvas are presented to the National Statistics Board and they are asked to indicate their priorities for the years ahead. In the fourth quarter of 2004 the Quarterly National Household Survey included a module on equality. This meant that a set of extra questions was asked of approximately 24,600 QNHS respondents. This
42 The reference quarters for survey results are: Quarter 1-December to February, Quarter 2-March to May, Quarter 3-June to August and Quarter 4-September to November. 43 ‘Replacement’ households are chosen from the same small area or block. Blocks arise from the two-stage sample design used for the QNHS. In the first stage a sample of 2,600 blocks (or small areas) are selected at county level to proportionately represent eight strata reflecting population density. Each block is selected to contain, on average, 75 dwellings and the sample of blocks is fixed for a period of about five years.
The Experience of Discrimination in Ireland 87

extra sample was aged 18 years and over and was interviewed directly.44 Through the representative and broadly based sample of the QNHS important baseline data on the experience of equality in Ireland could be collected.
44 Presentation delivered by Gerry O’Hanlon, Central Statistics Office, 2 November 2005 at the offices of the Equality Authority, Dublin.
88 The Experience of Discrimination in Ireland

Module on Equality - Questionnaire for Q4 2004
Introduction (prompt card for use with discrimination questions): Discrimination takes place when one person or a group of persons are treated less favourably than others because of their gender; marital status; family status; age; disability, ‘race’ – skin colour or ethnic group, sexual orientation, religious belief, and/or membership of the Traveller community. Discrimination can occur in situations such as where a person or persons is/are refused access to a service, to a job, or is/are treated less favourably at work. In other words, discrimination means treating people differently, negatively or adversely because they are for instance Asian, Muslim, over 50 years of age, a single parent, and/or homosexual. If the reason you may have been treated less favourably than someone else is due to another reason (such as your qualifications, being over an income limit or because you are further back in a queue for something) this does not constitute discrimination.
1. In the past two years, have you personally felt discriminated against in the workplace? - Yes - No - Not applicable (don’t work, haven’t been working in the past two years) - Don’t know
If respondent answered “yes”: 1b. Which of the following best describes the focus of the discrimination you experienced at work in the last two years? - Pay - Promotion - Work conditions - Bullying or harassment - Other
2. In the past two years, have you personally felt discriminated against while looking for work? - Yes - No - Not applicable (haven’t been looking for a job in the last two years) - Don’t know
3. In the past two years, have you personally felt discriminated against in places like, shops, pubs, or restaurants? - Yes - No - Don’t know 4. In the past two years, have you personally felt discriminated against in using services of banks, insurance companies or other financial institutions?
The Experience of Discrimination in Ireland 89
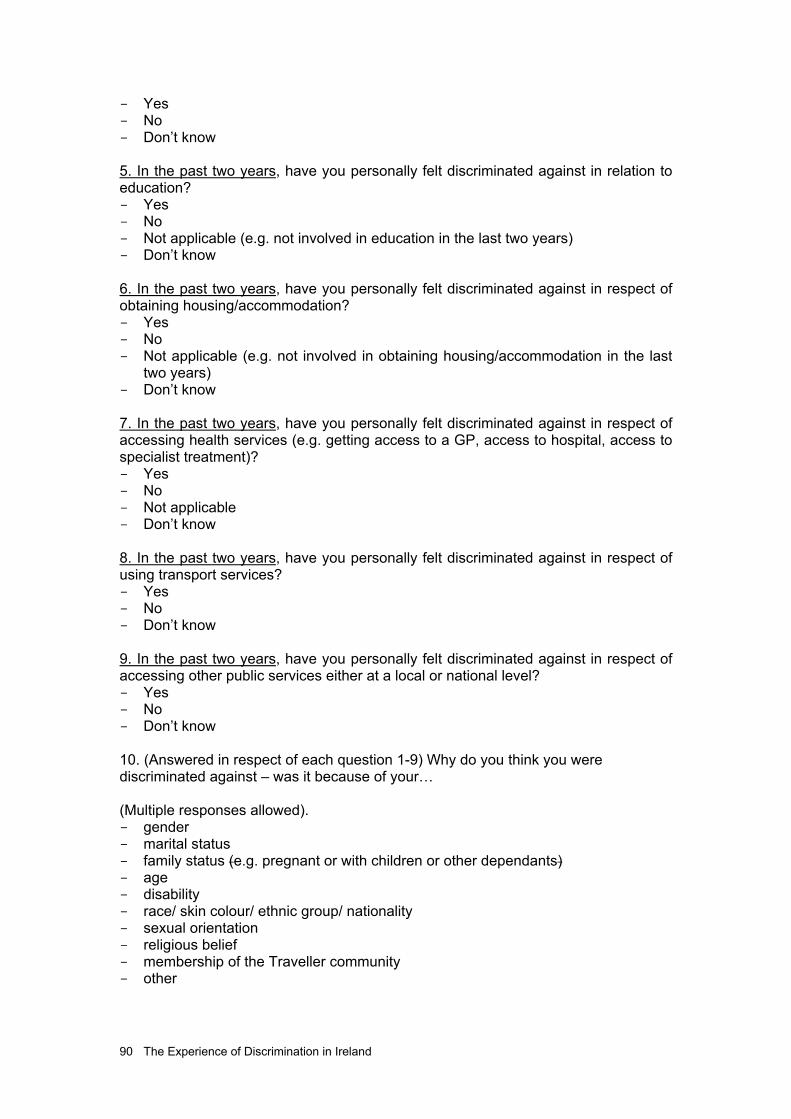
- Yes - No - Don’t know
5. In the past two years, have you personally felt discriminated against in relation to education? - Yes - No - Not applicable (e.g. not involved in education in the last two years) - Don’t know
6. In the past two years, have you personally felt discriminated against in respect of obtaining housing/accommodation? - Yes - No - Not applicable (e.g. not involved in obtaining housing/accommodation in the last
two years) - Don’t know 7. In the past two years, have you personally felt discriminated against in respect of accessing health services (e.g. getting access to a GP, access to hospital, access to specialist treatment)? - Yes - No - Not applicable - Don’t know 8. In the past two years, have you personally felt discriminated against in respect of using transport services? - Yes - No - Don’t know 9. In the past two years, have you personally felt discriminated against in respect of accessing other public services either at a local or national level? - Yes - No - Don’t know 10. (Answered in respect of each question 1-9) Why do you think you were discriminated against – was it because of your… (Multiple responses allowed). - gender - marital status - family status (e.g. pregnant or with children or other dependants) - age - disability - race/ skin colour/ ethnic group/ nationality - sexual orientation - religious belief - membership of the Traveller community - other
90 The Experience of Discrimination in Ireland

Questions 11-13 asked if the person reported experience of discrimination
11. How frequently have you experienced discrimination? - Just once - On a few occasions - More regularly
12. How serious was the effect of discrimination on your life? - Little or no effect(s) - Some effect(s) - Serious effect(s) - Very serious effect(s)
13. May I ask what action, if any at all, have you taken in reaction to discrimination you have experienced. In particular have you complained verbally, or in writing or taken legal action? (Multiple responses allowed). - Yes, verbally - Yes, in writing - Yes, made an official complaint - Yes, taken legal action - No, have not taken any action. 14. Do you know your rights under Irish equality law? - No understanding - Understand a little - Understand a lot
15. Do you have any of the following long-lasting conditions?
(Multiple responses allowed). - Blindness, deafness or a severe vision or hearing impairment? - A condition that substantially limits one or more basic physical activities such as
walking, climbing stairs, reaching, lifting or carrying? - A learning or intellectual disability? - A psychological or emotional condition? - Other, including any chronic illness? - No, none of the above
16. Do you have any difficulty in doing any of the following activities? (Multiple responses allowed). - Learning, remembering or concentrating? - Dressing, bathing or getting around inside the home? - Going outside the home alone to shop or visit a doctor’s surgery? - Working at a job or business or attending school or college? - Participating in other activities, for example leisure or using transport?
17. What is your ethnic group?
A. White - Irish - Irish Traveller - Any other White background
The Experience of Discrimination in Ireland 91

B. Black or Black Irish - African - Any other Black background C. Asian or Asian Irish - Chinese - Any other Asian background D. Other, including mixed background
18. What is your religion?
- Roman Catholic - Church of Ireland - Other Christian - Islam - Jewish - Other - No religion
92 The Experience of Discrimination in Ireland


9 780707 002644
ISBN 0-7070-0264-8
The Equality Authority2 Clonmel StreetDublin 2
Public Information CentreLo Call: 1890 245 545
Tel: (01) 417 3333Business queries: (01) 417 3385Text Phone: (01) 417 3385Fax: (01) 417 3331Email: [email protected]
www.equality.ie
The Economic and Social Research Institute Whitaker Square Sir John Rogerson’s Quay Dublin 2
www.esri.ie