Embed Size (px)
Citation preview
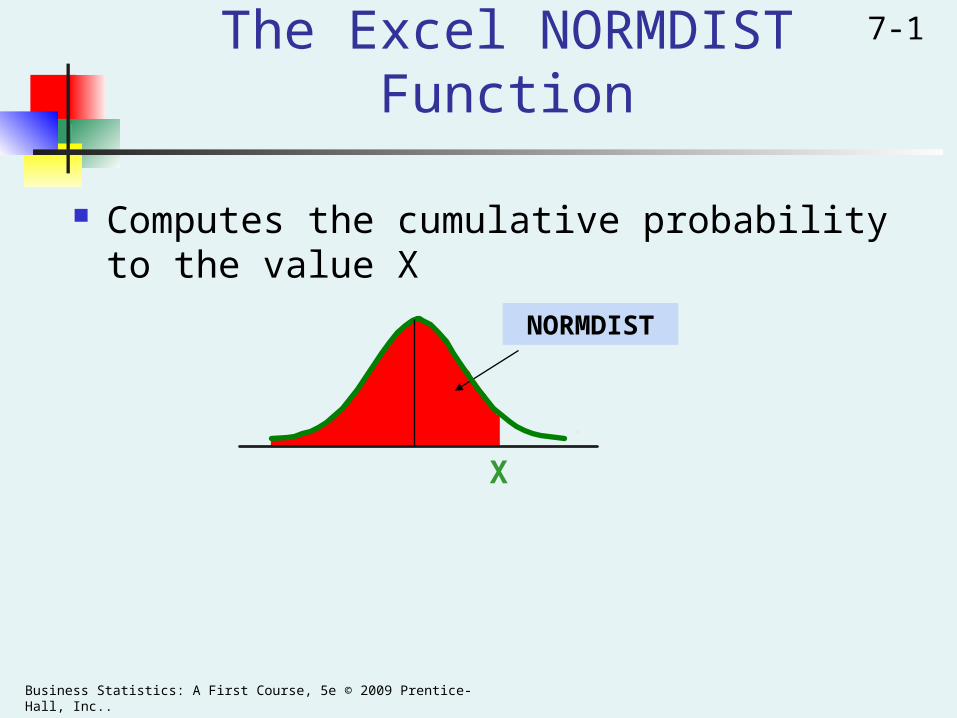
The Excel NORMDIST Function
Computes the cumulative probability to the value X
Business Statistics: A First Course, 5e © 2009 Prentice-Hall, Inc..
7-1
X
NORMDIST
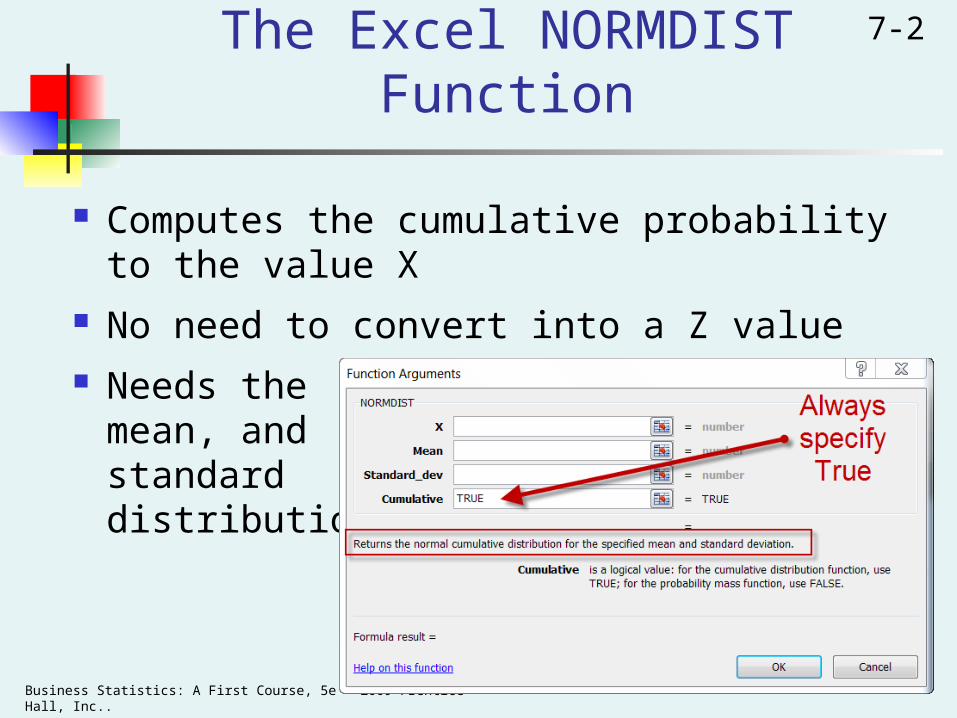
The Excel NORMDIST Function
Computes the cumulative probability to the value X
No need to convert into a Z value Needs the
mean, andstandarddistribution
Business Statistics: A First Course, 5e © 2009 Prentice-Hall, Inc..
7-2
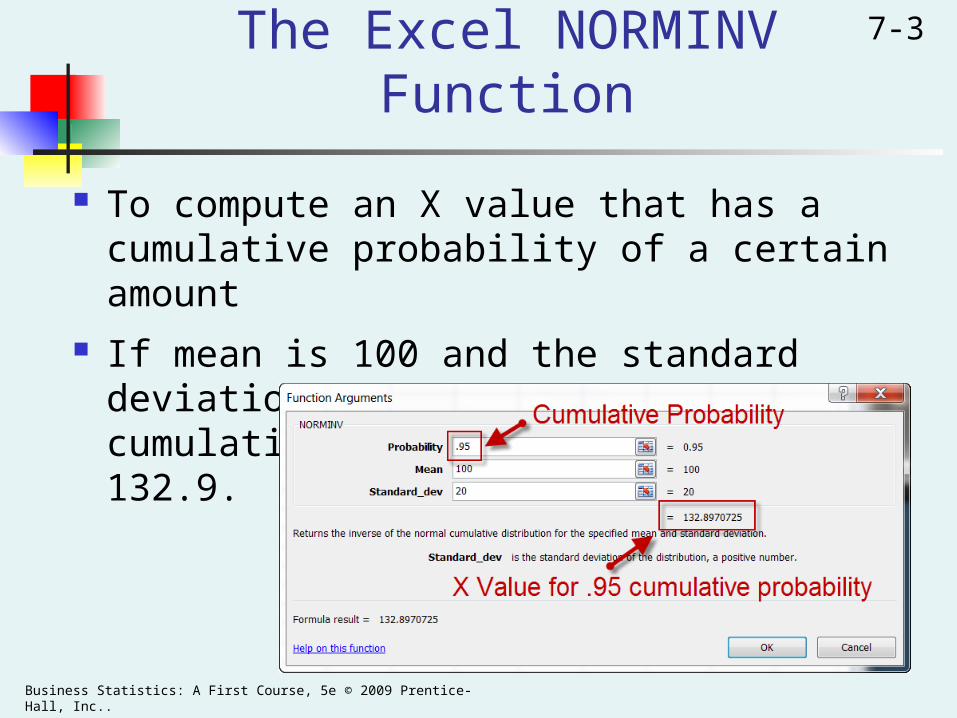
The Excel NORMINV Function
To compute an X value that has a cumulative probability of a certain amount
If mean is 100 and the standard deviation is 20, the X value with a cumulative probability of .95 is 132.9.
Business Statistics: A First Course, 5e © 2009 Prentice-Hall, Inc..
7-3
Basic Business Statistics, 11e © 2009 Prentice-Hall, Inc. 7-4
Chapter 7
Sampling and Sampling Distributions
Business Statistics:A First Course
5th Edition
Basic Business Statistics, 11e © 2009 Prentice-Hall, Inc..
7-5
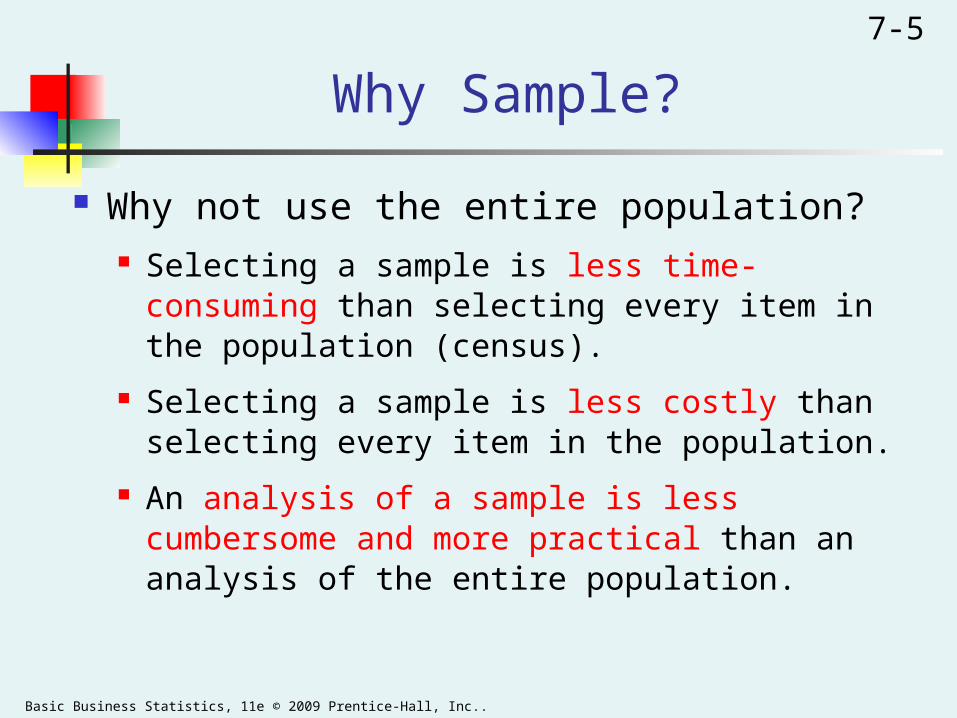
Why Sample?
Why not use the entire population? Selecting a sample is less time-consuming than
selecting every item in the population (census).
Selecting a sample is less costly than selecting every item in the population.
An analysis of a sample is less cumbersome and more practical than an analysis of the entire population.
Basic Business Statistics, 11e © 2009 Prentice-Hall, Inc..
7-6A Sampling Process Begins
With A Sampling Frame
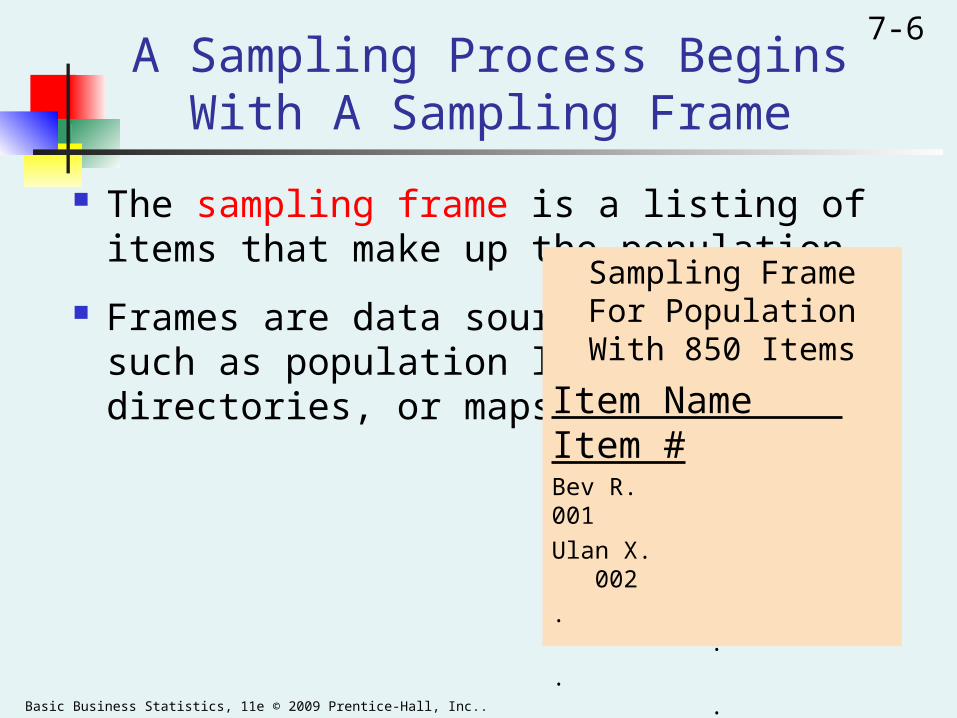
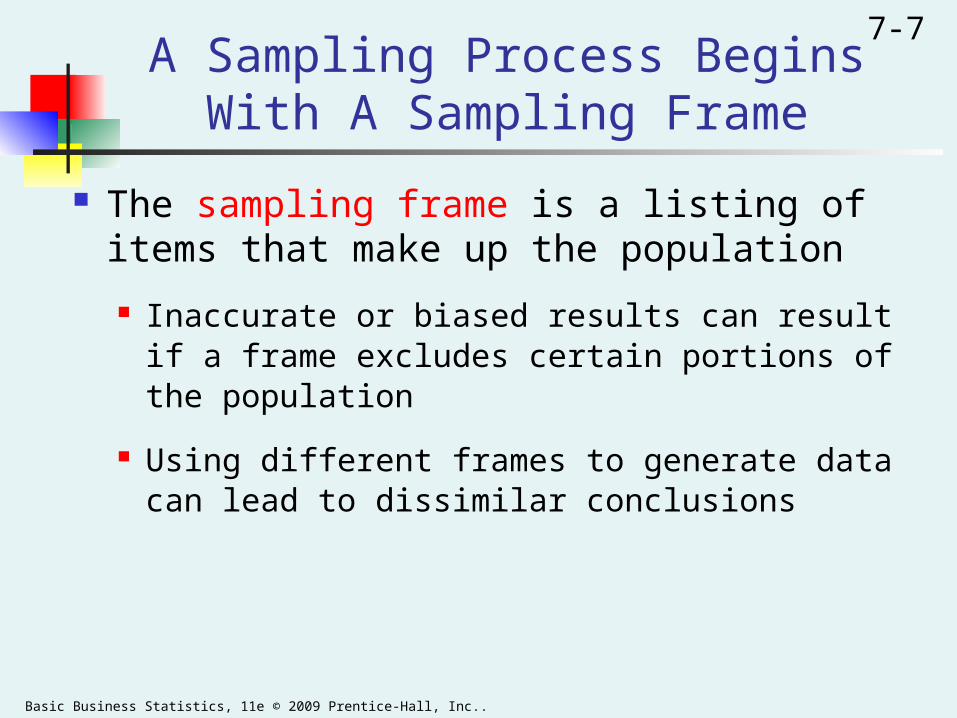
The sampling frame is a listing of items that make up the population
Frames are data sourcessuch as population lists,directories, or maps
Sampling Frame For Population With 850
Items
Item Name Item #Bev R. 001
Ulan X. 002
. .
. .
Joan T. 849
Paul F. 850
Basic Business Statistics, 11e © 2009 Prentice-Hall, Inc..
7-7A Sampling Process Begins
With A Sampling Frame
The sampling frame is a listing of items that make up the population
Inaccurate or biased results can result if a frame excludes certain portions of the population
Using different frames to generate data can lead to dissimilar conclusions

Basic Business Statistics, 11e © 2009 Prentice-Hall, Inc..
7-8
Types of SamplesSamplesSamples
Non-Probability Samples
Non-Probability Samples
JudgmentJudgment
Probability SamplesProbability Samples
Simple RandomSimple Random
SystematicSystematic
StratifiedStratified
ClusterCluster
ConvenienceConvenience
In nonprobability sampling, items not are selected by probability.
Statistical inference methods cannot be used.
In nonprobability sampling, items not are selected by probability.
Statistical inference methods cannot be used.
Basic Business Statistics, 11e © 2009 Prentice-Hall, Inc..
7-9
Types of SamplesSamplesSamples
Non-Probability Samples
Non-Probability Samples
JudgmentJudgment
Probability SamplesProbability Samples
Simple RandomSimple Random
SystematicSystematic
StratifiedStratified
ClusterCluster
ConvenienceConvenience
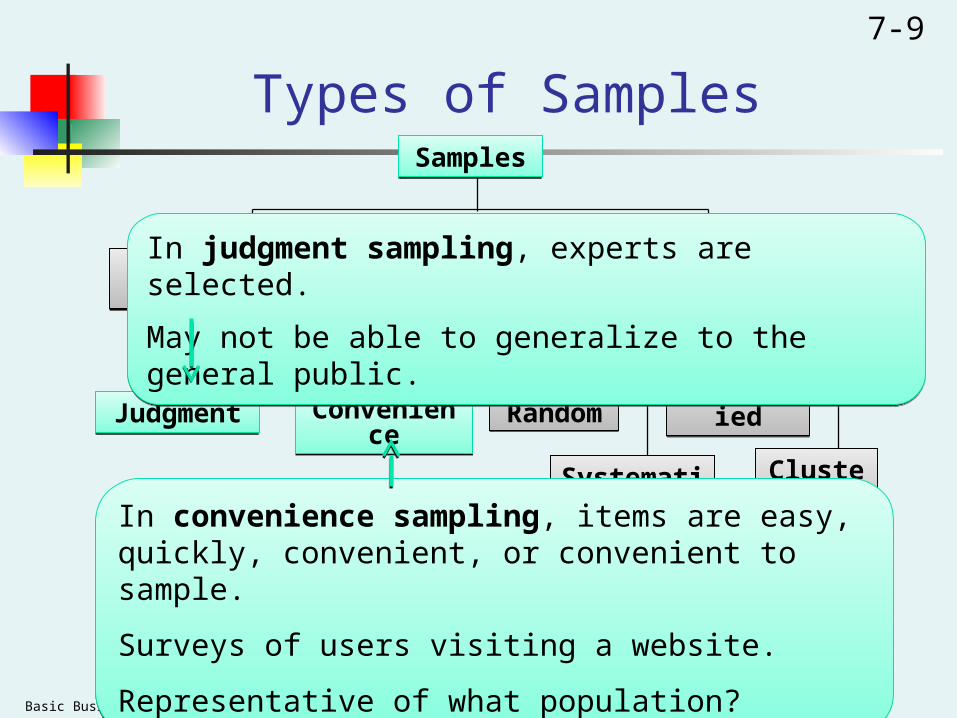
In convenience sampling, items are easy, quickly, convenient, or convenient to sample.
Surveys of users visiting a website.
Representative of what population?
In convenience sampling, items are easy, quickly, convenient, or convenient to sample.
Surveys of users visiting a website.
Representative of what population?
In judgment sampling, experts are selected.
May not be able to generalize to the general public.
In judgment sampling, experts are selected.
May not be able to generalize to the general public.
Basic Business Statistics, 11e © 2009 Prentice-Hall, Inc..
7-10
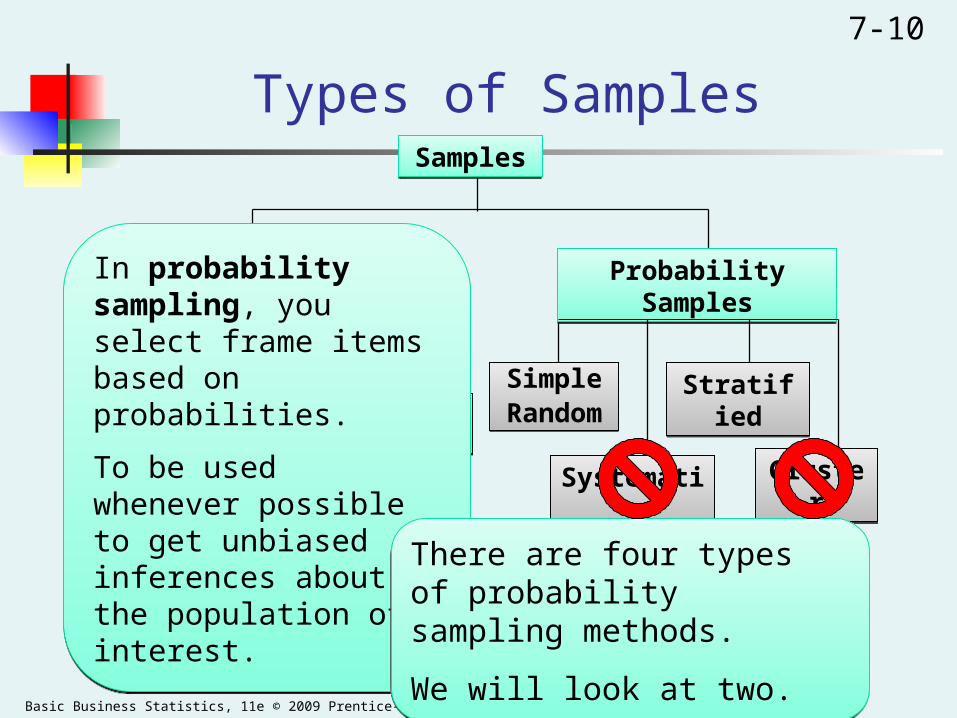
Types of SamplesSamplesSamples
Non-Probability Samples
Non-Probability Samples
JudgmentJudgment
Probability SamplesProbability Samples
Simple RandomSimple Random
SystematicSystematic
StratifiedStratified
ClusterCluster
ConvenienceConvenience
In probability sampling, you select frame items based on probabilities.
To be used whenever possible to get unbiased inferences about the population of interest.
In probability sampling, you select frame items based on probabilities.
To be used whenever possible to get unbiased inferences about the population of interest.
There are four types of probability sampling methods.
We will look at two.
There are four types of probability sampling methods.
We will look at two.
Basic Business Statistics, 11e © 2009 Prentice-Hall, Inc..
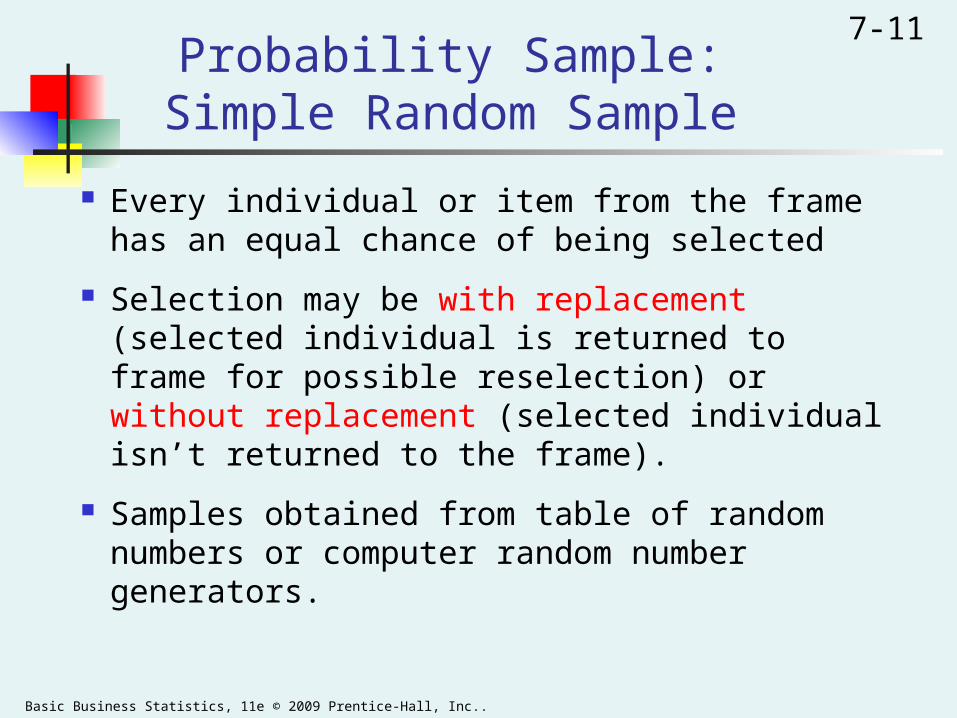
7-11Probability Sample:
Simple Random Sample
Every individual or item from the frame has an equal chance of being selected
Selection may be with replacement (selected individual is returned to frame for possible reselection) or without replacement (selected individual isn’t returned to the frame).
Samples obtained from table of random numbers or computer random number generators.
Basic Business Statistics, 11e © 2009 Prentice-Hall, Inc..
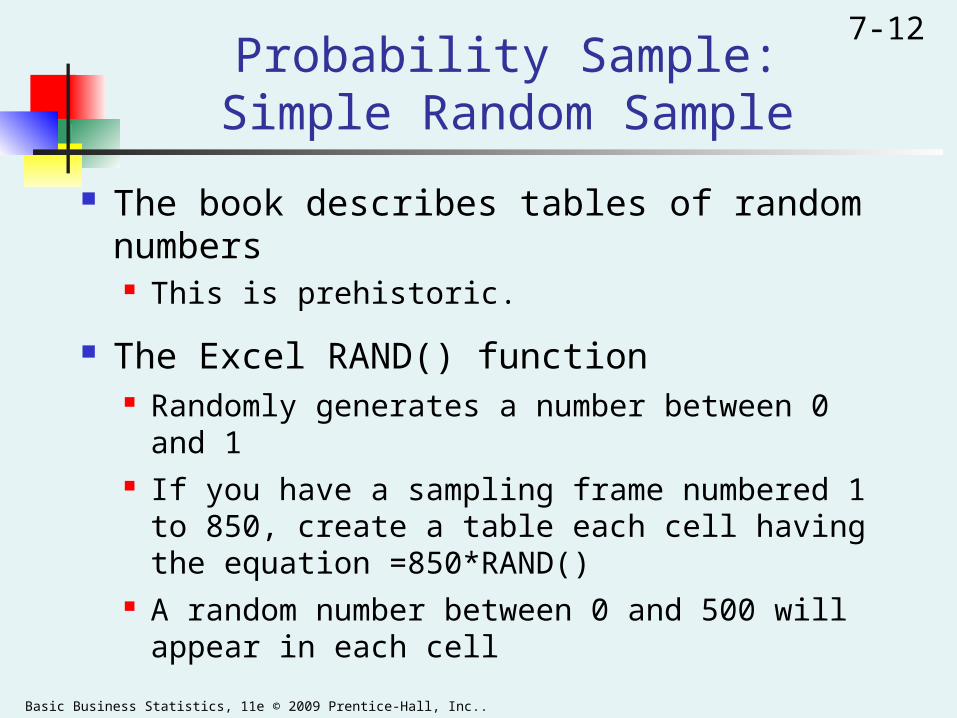
7-12Probability Sample:
Simple Random Sample
The book describes tables of random numbers This is prehistoric.
The Excel RAND() function Randomly generates a number between 0 and 1 If you have a sampling frame numbered 1 to 850,
create a table each cell having the equation =850*RAND()
A random number between 0 and 500 will appear in each cell
Basic Business Statistics, 11e © 2009 Prentice-Hall, Inc..
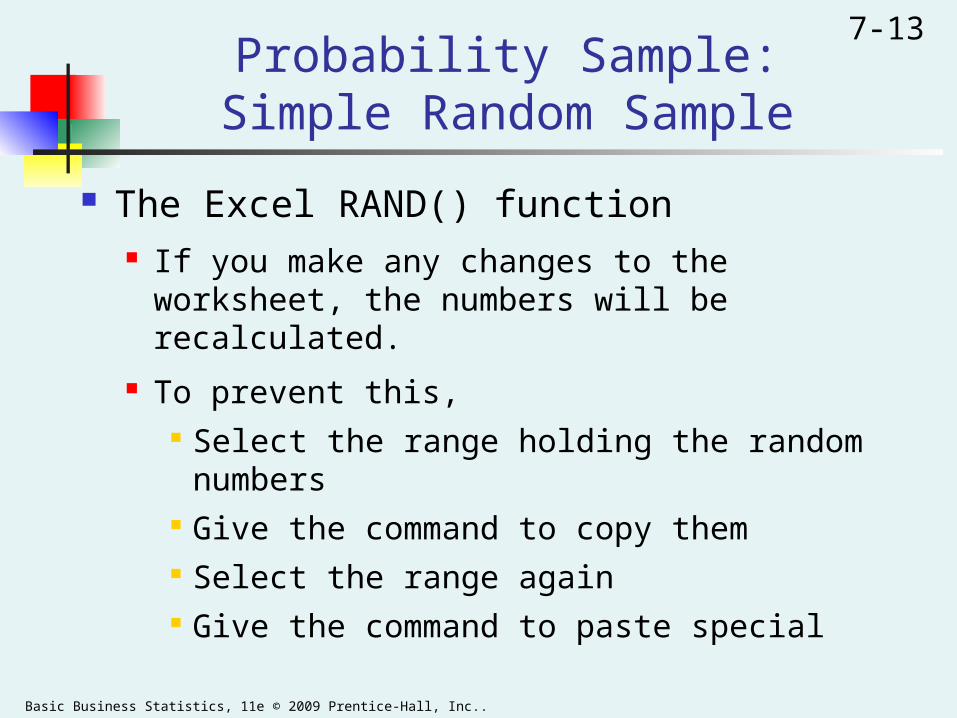
7-13Probability Sample:
Simple Random Sample
The Excel RAND() function If you make any changes to the worksheet, the
numbers will be recalculated.
To prevent this, Select the range holding the random numbers Give the command to copy them Select the range again Give the command to paste special
Basic Business Statistics, 11e © 2009 Prentice-Hall, Inc..
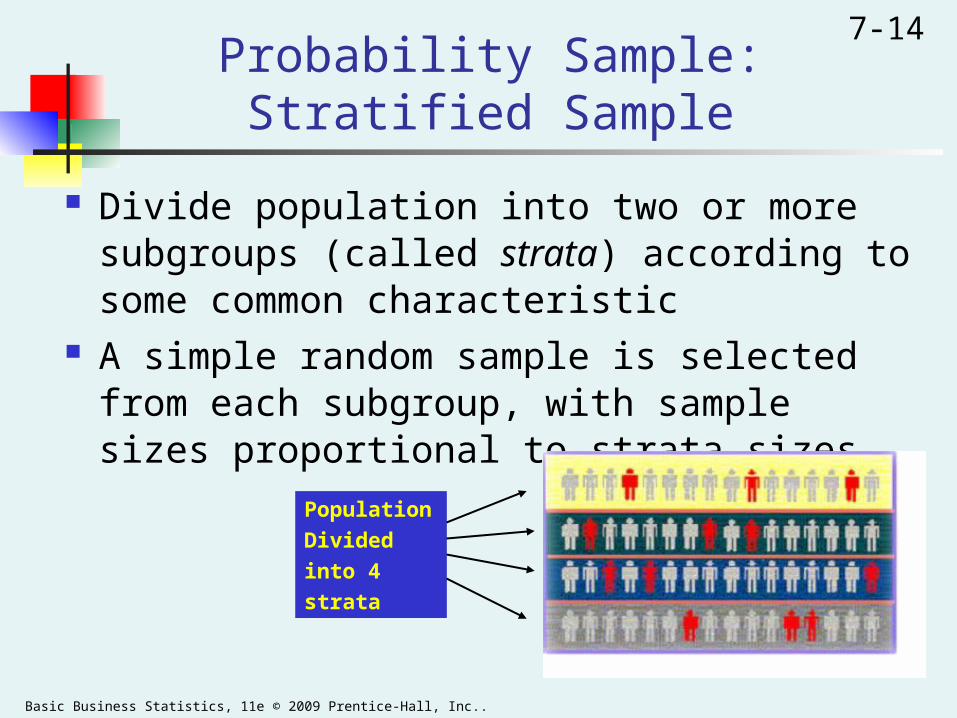
7-14Probability Sample:Stratified Sample
Divide population into two or more subgroups (called strata) according to some common characteristic
A simple random sample is selected from each subgroup, with sample sizes proportional to strata sizes
Population
Divided
into 4
strata
Basic Business Statistics, 11e © 2009 Prentice-Hall, Inc..
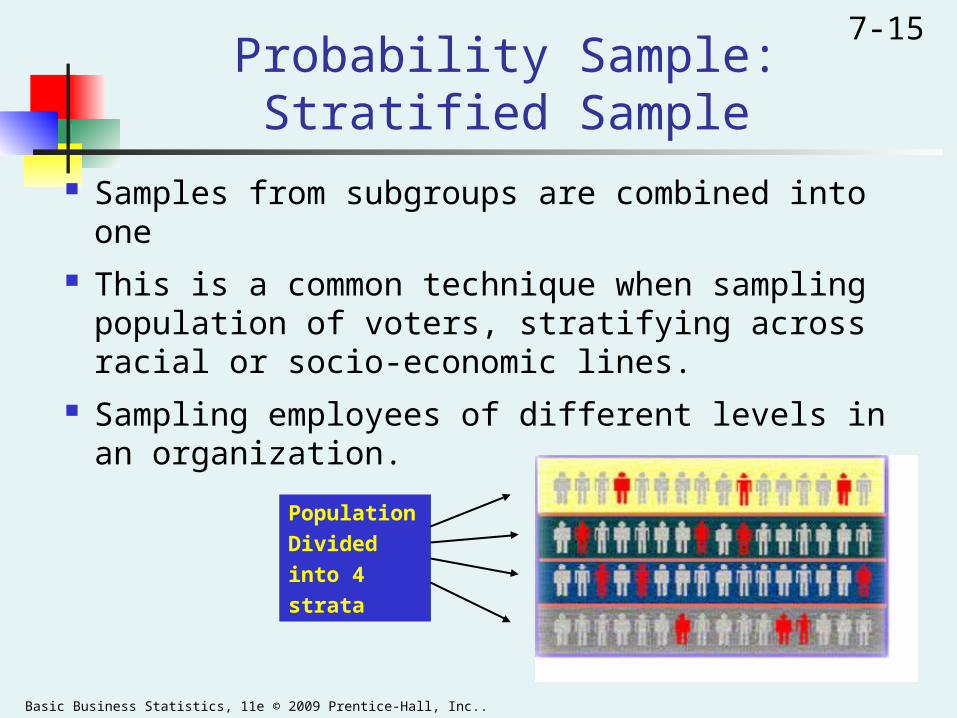
7-15Probability Sample:Stratified Sample
Samples from subgroups are combined into one This is a common technique when sampling
population of voters, stratifying across racial or socio-economic lines.
Sampling employees of different levels in an organization.
Population
Divided
into 4
strata
Basic Business Statistics, 11e © 2009 Prentice-Hall, Inc..
7-16
Evaluating a Survey Design
What is the purpose of the survey?
Is the survey based on a probability sample?
How will various errors be controlled?
Basic Business Statistics, 11e © 2009 Prentice-Hall, Inc..
7-17
Types of Survey Errors
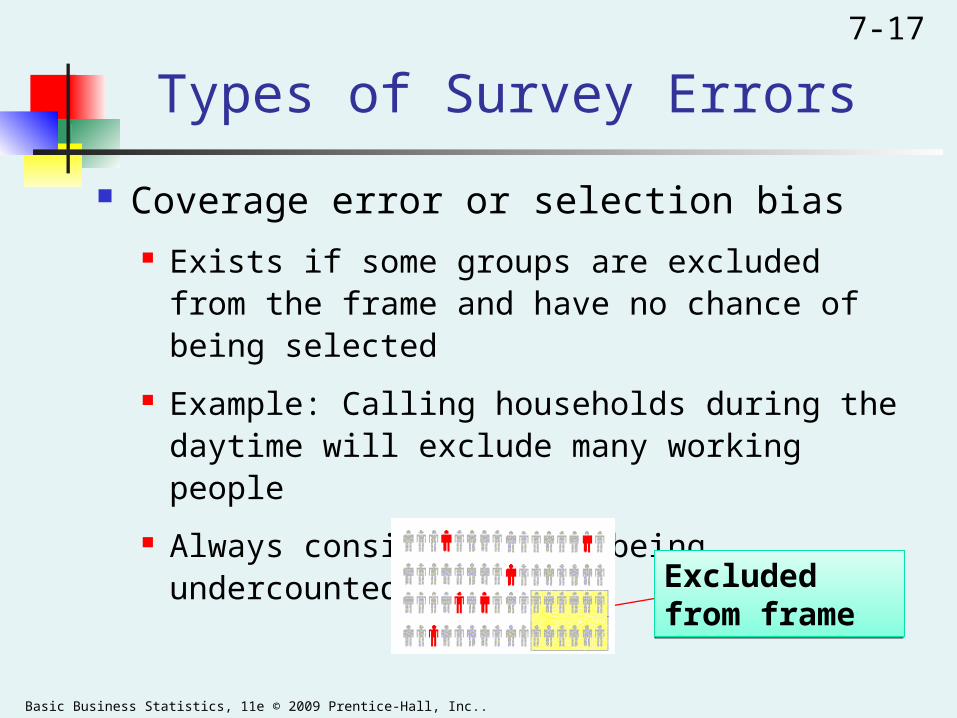
Coverage error or selection bias Exists if some groups are excluded from the frame
and have no chance of being selected
Example: Calling households during the daytime will exclude many working people
Always consider who is being undercounted
Excluded from frameExcluded from frame
Basic Business Statistics, 11e © 2009 Prentice-Hall, Inc..
7-18
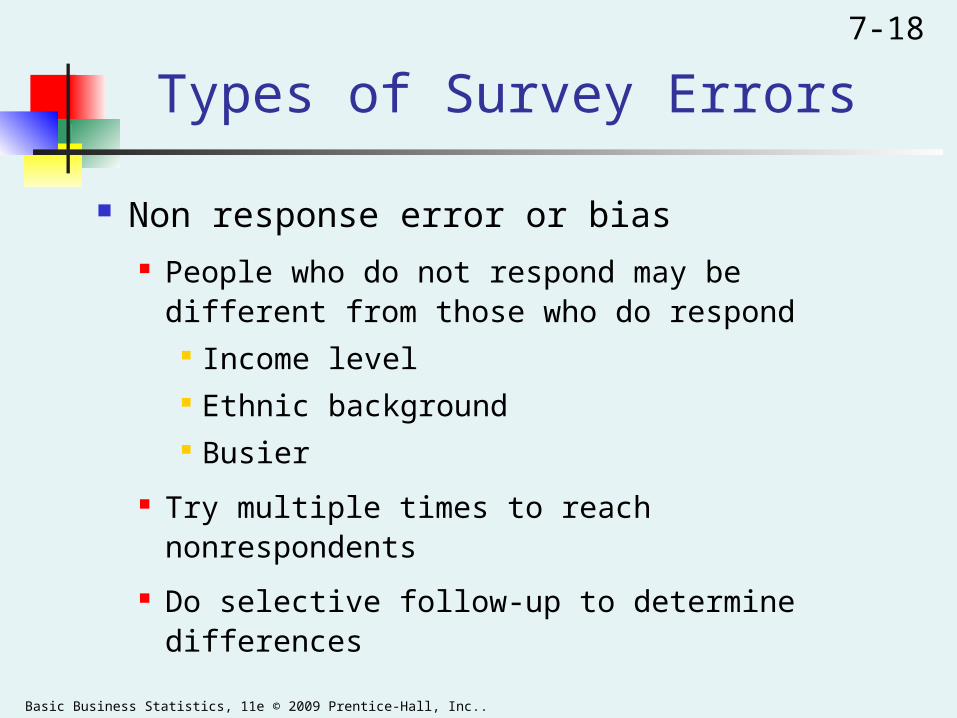
Types of Survey Errors
Non response error or bias People who do not respond may be different from
those who do respond Income level Ethnic background Busier
Try multiple times to reach nonrespondents
Do selective follow-up to determine differences
Basic Business Statistics, 11e © 2009 Prentice-Hall, Inc..
7-19
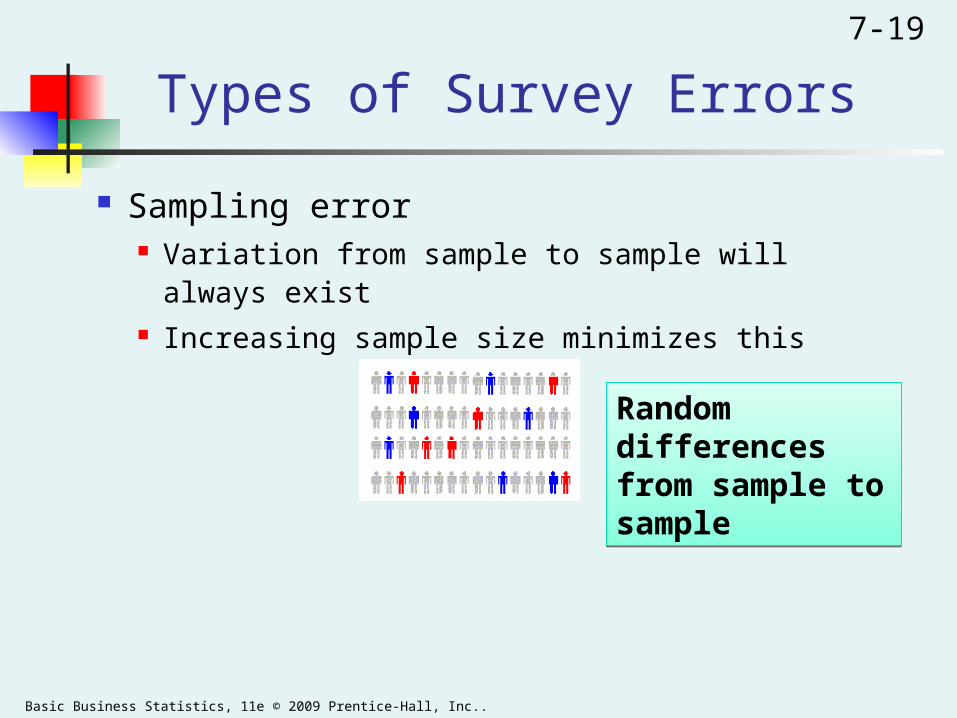
Types of Survey Errors
Sampling error Variation from sample to sample will always exist Increasing sample size minimizes this
Random differences from sample to sample
Random differences from sample to sample
Basic Business Statistics, 11e © 2009 Prentice-Hall, Inc..
7-20
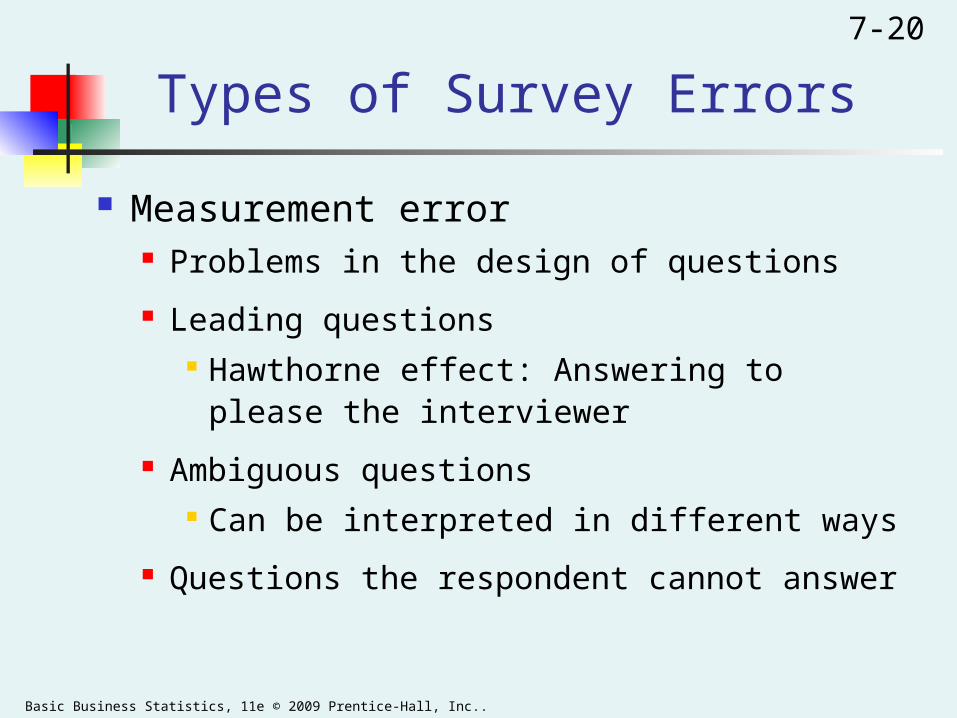
Types of Survey Errors
Measurement error Problems in the design of questions
Leading questions Hawthorne effect: Answering to please the
interviewer
Ambiguous questions Can be interpreted in different ways
Questions the respondent cannot answer
Basic Business Statistics, 11e © 2009 Prentice-Hall, Inc..
7-21
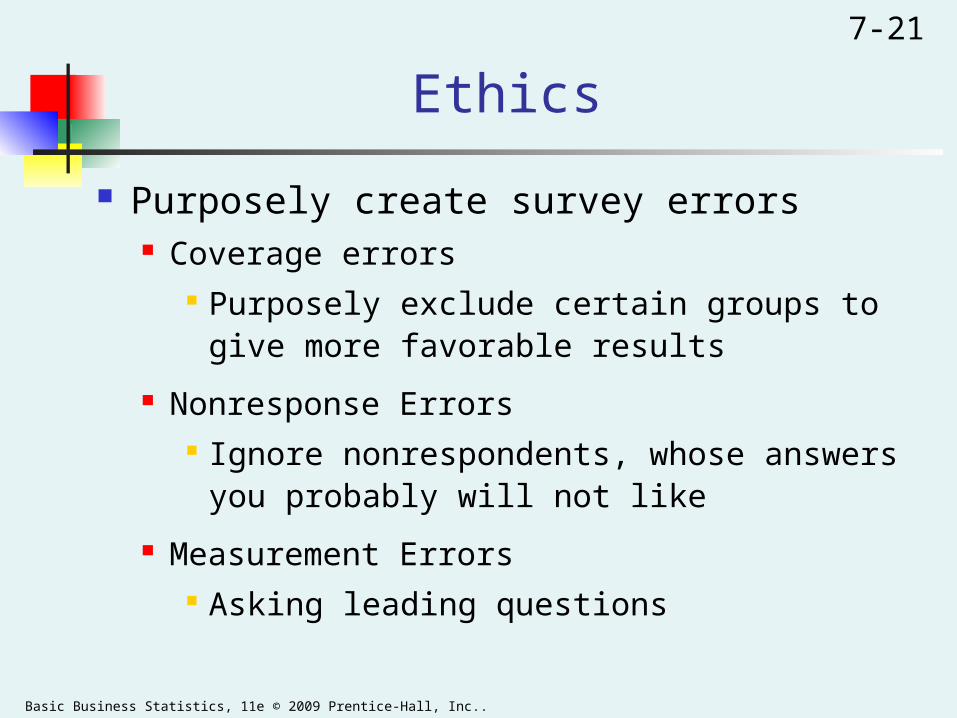
Ethics
Purposely create survey errors Coverage errors
Purposely exclude certain groups to give more favorable results
Nonresponse Errors Ignore nonrespondents, whose answers you
probably will not like
Measurement Errors Asking leading questions
Basic Business Statistics, 11e © 2009 Prentice-Hall, Inc..
7-22
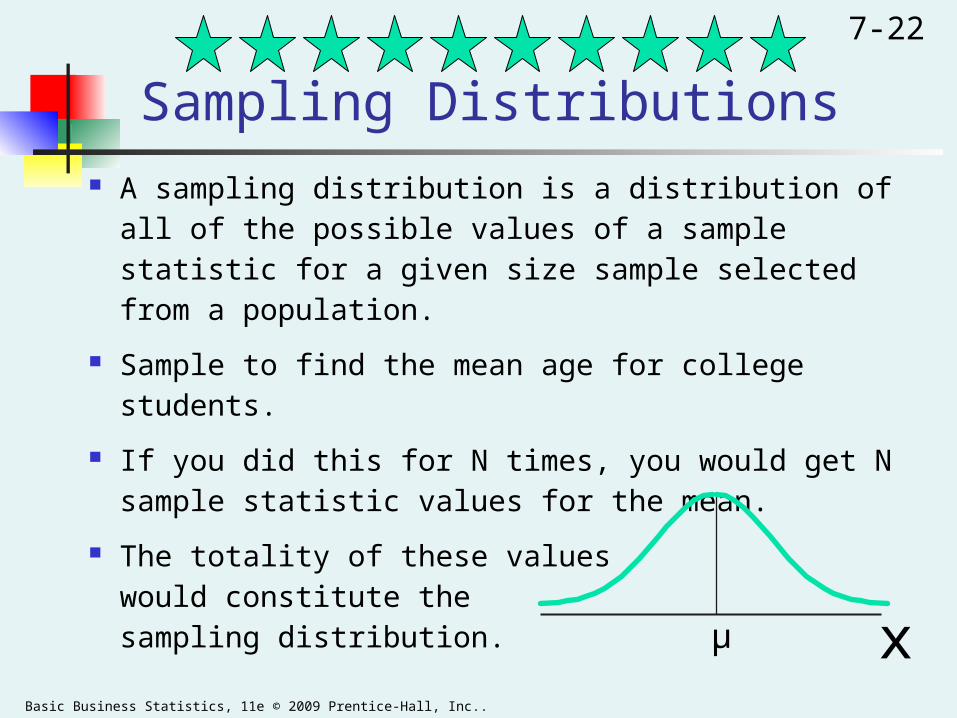
Sampling Distributions A sampling distribution is a distribution of all of the
possible values of a sample statistic for a given size sample selected from a population.
Sample to find the mean age for college students.
If you did this for N times, you would get N sample statistic values for the mean.
The totality of these valueswould constitute the sampling distribution.
xμ
Basic Business Statistics, 11e © 2009 Prentice-Hall, Inc..
7-23
Sampling Distributions
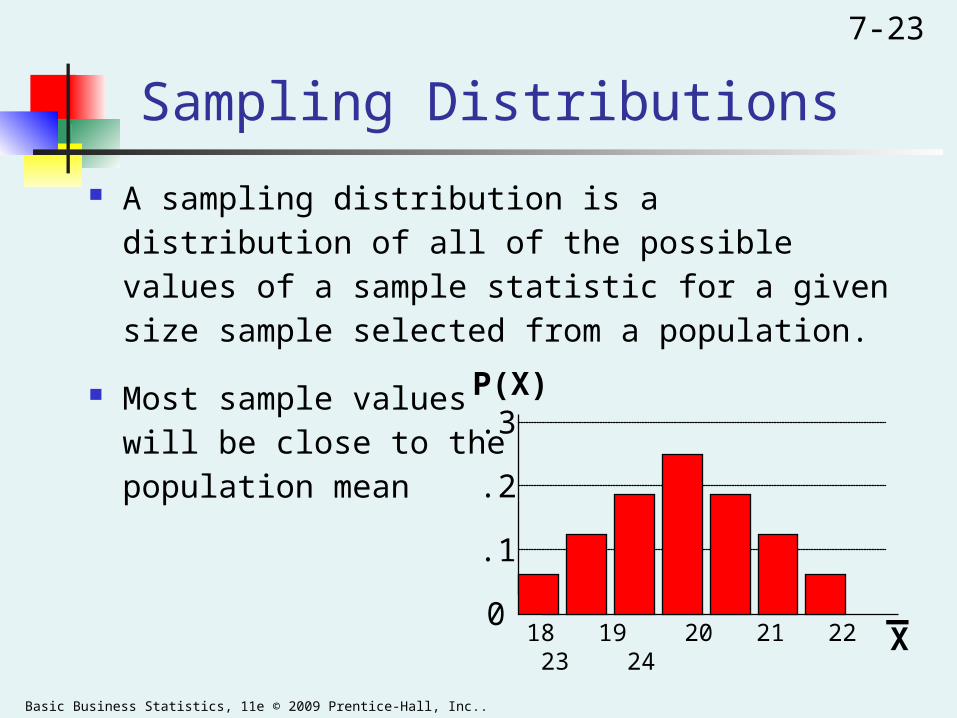
A sampling distribution is a distribution of all of the possible values of a sample statistic for a given size sample selected from a population.
Most sample valueswill be close to thepopulation mean
18 19 20 21 22 23 240
.1
.2
.3 P(X)
X_
Basic Business Statistics, 11e © 2009 Prentice-Hall, Inc..
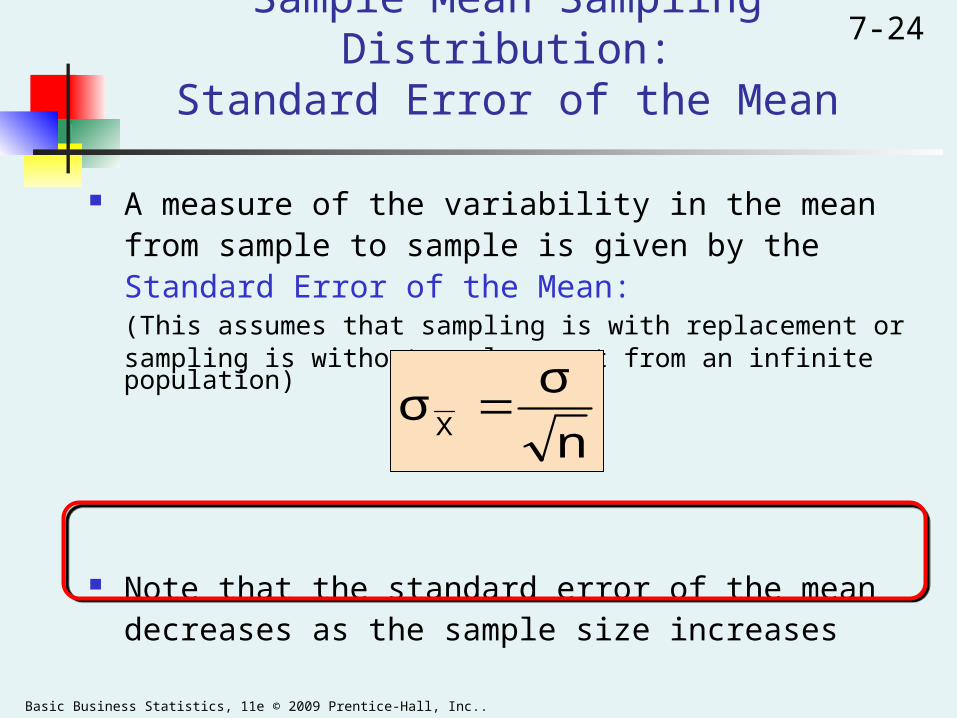
7-24Sample Mean Sampling Distribution:Standard Error of the Mean
A measure of the variability in the mean from sample to sample is given by the Standard Error of the Mean:
(This assumes that sampling is with replacement or sampling is without replacement from an infinite
population)
Note that the standard error of the mean decreases as the sample size increases
n
σσ
X
Basic Business Statistics, 11e © 2009 Prentice-Hall, Inc..
7-25Sample Mean Sampling Distribution:
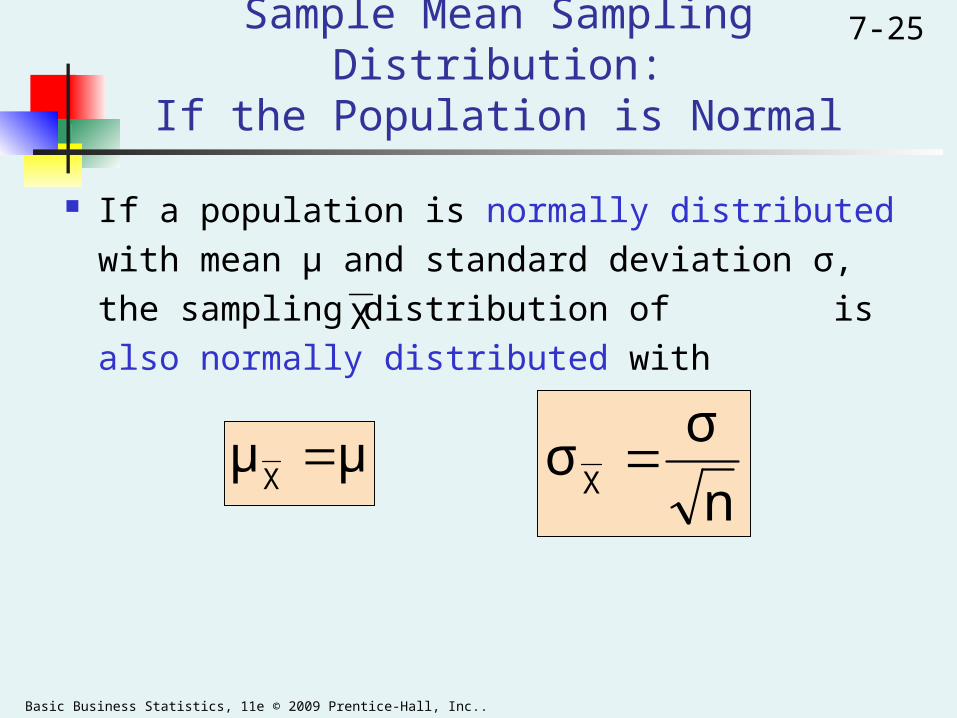
If the Population is Normal
If a population is normally distributed with mean μ
and standard deviation σ, the sampling
distribution of is also normally distributed withX
μμX
n
σσ
X
Basic Business Statistics, 11e © 2009 Prentice-Hall, Inc..
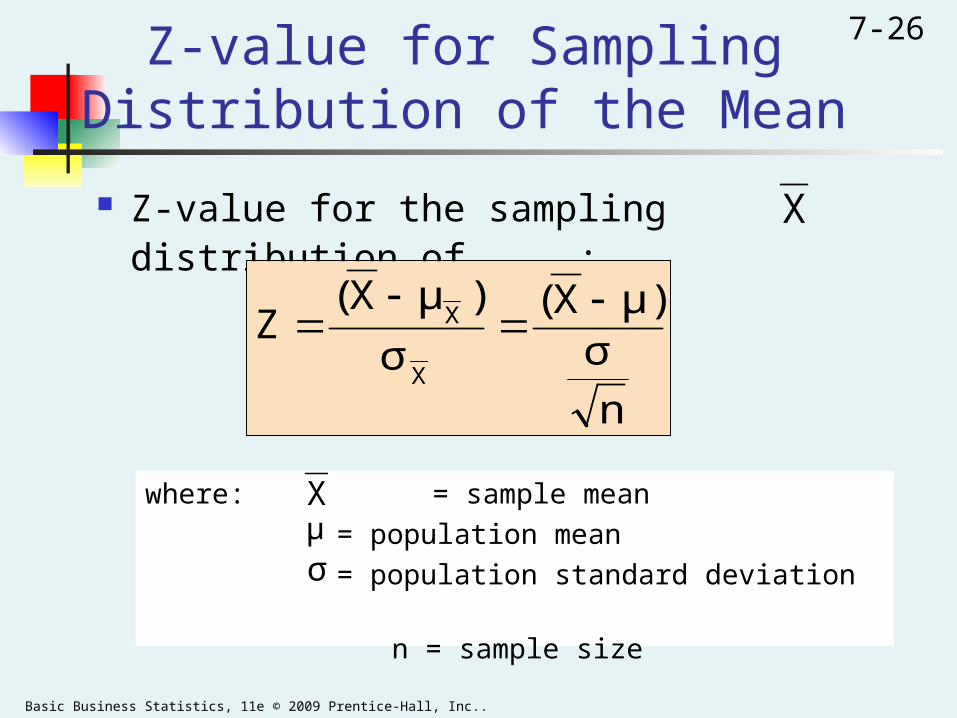
7-26Z-value for SamplingDistribution of the Mean
Z-value for the sampling distribution of :
where: = sample mean
= population mean
= population standard deviation
n = sample size
Xμσ
n
σμ)X(
σ
)μX(Z
X
X
X
Basic Business Statistics, 11e © 2009 Prentice-Hall, Inc..
7-27
Normal Population Distribution
Normal Sampling Distribution (has the same mean)
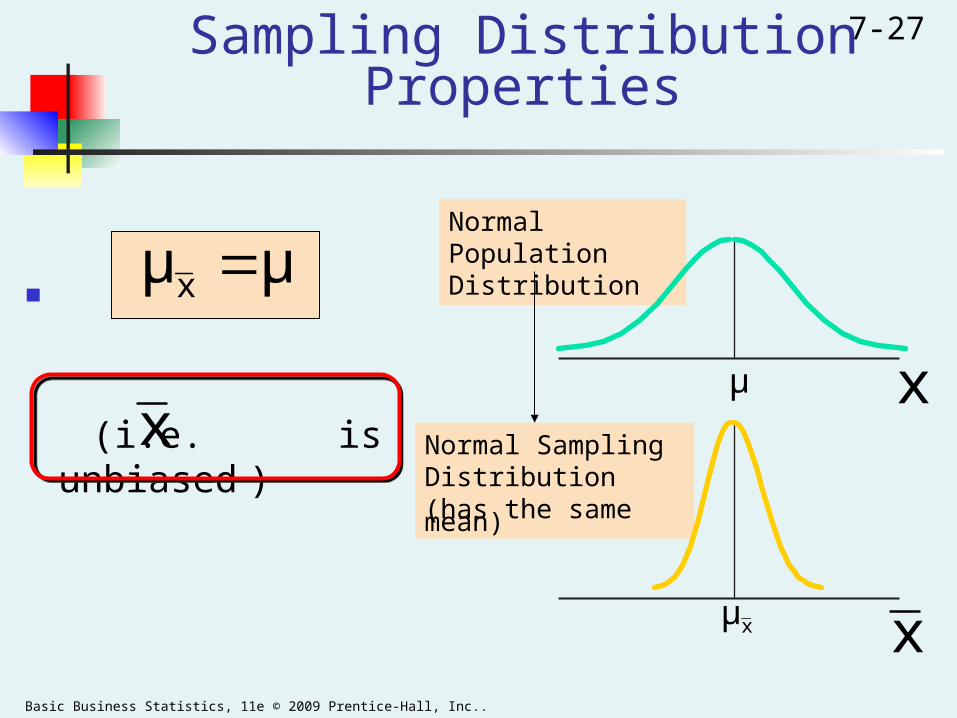
Sampling Distribution Properties
(i.e. is unbiased )x
x
μμx
xμ
xμ
Basic Business Statistics, 11e © 2009 Prentice-Hall, Inc..
7-28
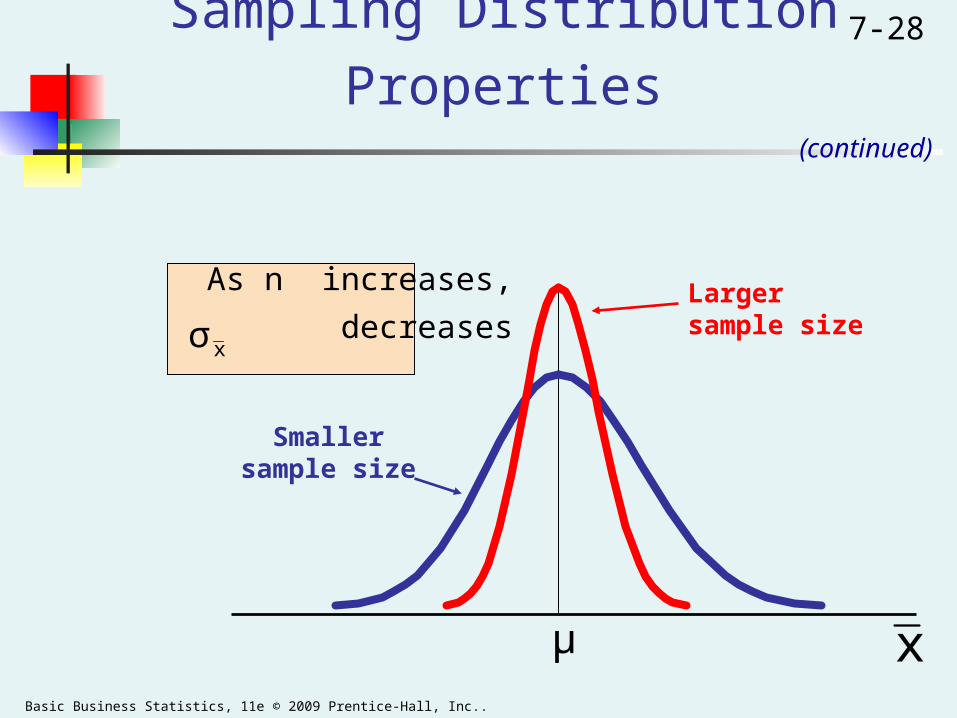
Sampling Distribution Properties
As n increases,
decreasesLarger sample size
Smaller sample size
x
(continued)
xσ
μ
Basic Business Statistics, 11e © 2009 Prentice-Hall, Inc..
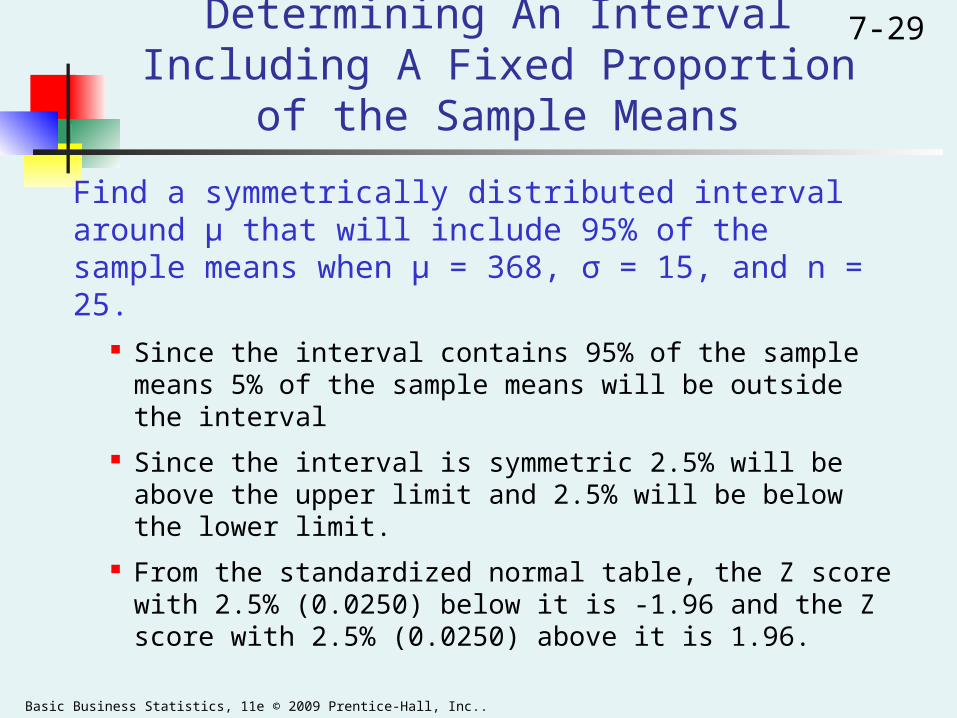
7-29Determining An Interval Including A
Fixed Proportion of the Sample Means
Find a symmetrically distributed interval around µ that will include 95% of the sample means when µ = 368, σ = 15, and n = 25.
Since the interval contains 95% of the sample means 5% of the sample means will be outside the interval
Since the interval is symmetric 2.5% will be above the upper limit and 2.5% will be below the lower limit.
From the standardized normal table, the Z score with 2.5% (0.0250) below it is -1.96 and the Z score with 2.5% (0.0250) above it is 1.96.
Basic Business Statistics, 11e © 2009 Prentice-Hall, Inc..
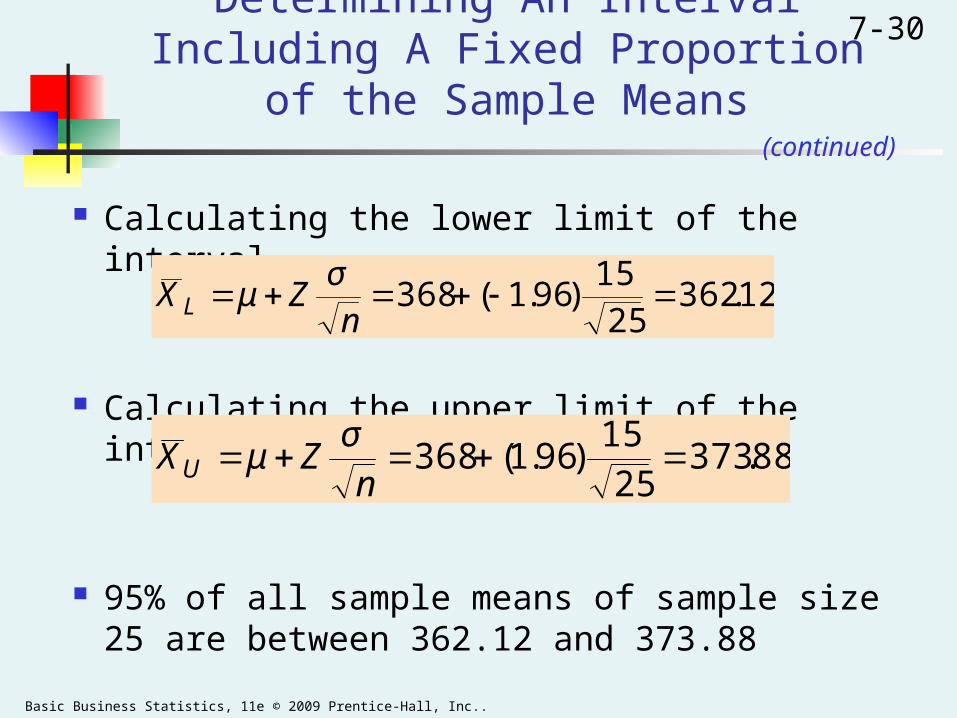
7-30Determining An Interval Including A Fixed Proportion of the Sample Means
Calculating the lower limit of the interval
Calculating the upper limit of the interval
95% of all sample means of sample size 25 are between 362.12 and 373.88
12.36225
15)96.1(368
nZX Lσ
μ
(continued)
88.37325
15)96.1(368
nZXUσ
μ
Basic Business Statistics, 11e © 2009 Prentice-Hall, Inc..
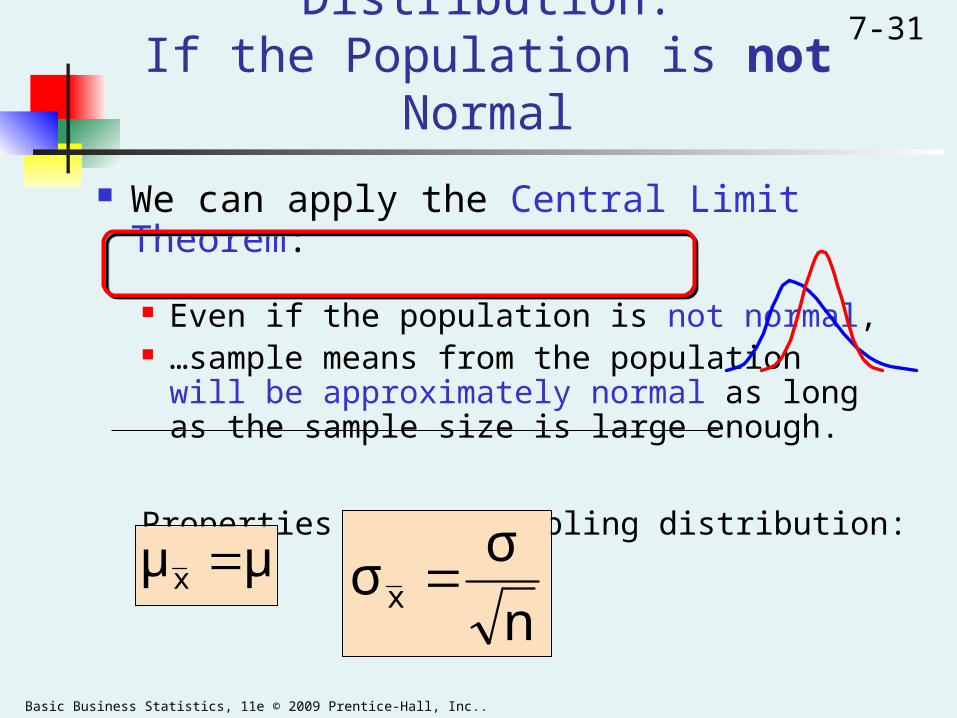
7-31Sample Mean Sampling Distribution:
If the Population is not Normal
We can apply the Central Limit Theorem:
Even if the population is not normal, …sample means from the population
will be approximately normal as longas the sample size is large enough.
Properties of the sampling distribution:
μμx n
σσx
Basic Business Statistics, 11e © 2009 Prentice-Hall, Inc..
7-32
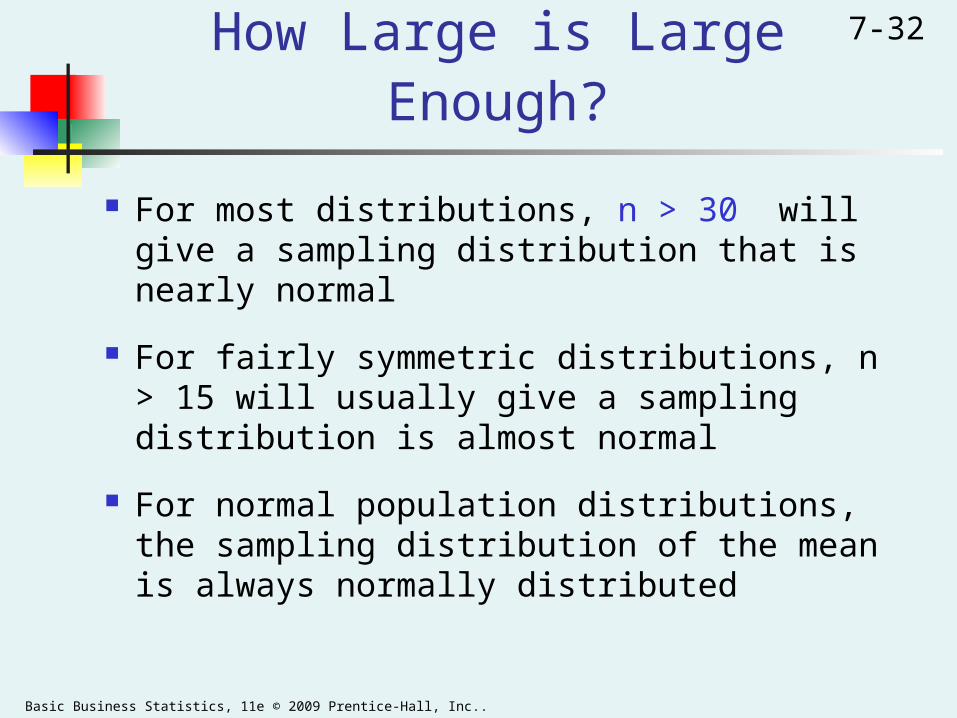
How Large is Large Enough?
For most distributions, n > 30 will give a sampling distribution that is nearly normal
For fairly symmetric distributions, n > 15 will usually give a sampling distribution is almost normal
For normal population distributions, the sampling distribution of the mean is always normally distributed
Basic Business Statistics, 11e © 2009 Prentice-Hall, Inc..
7-33
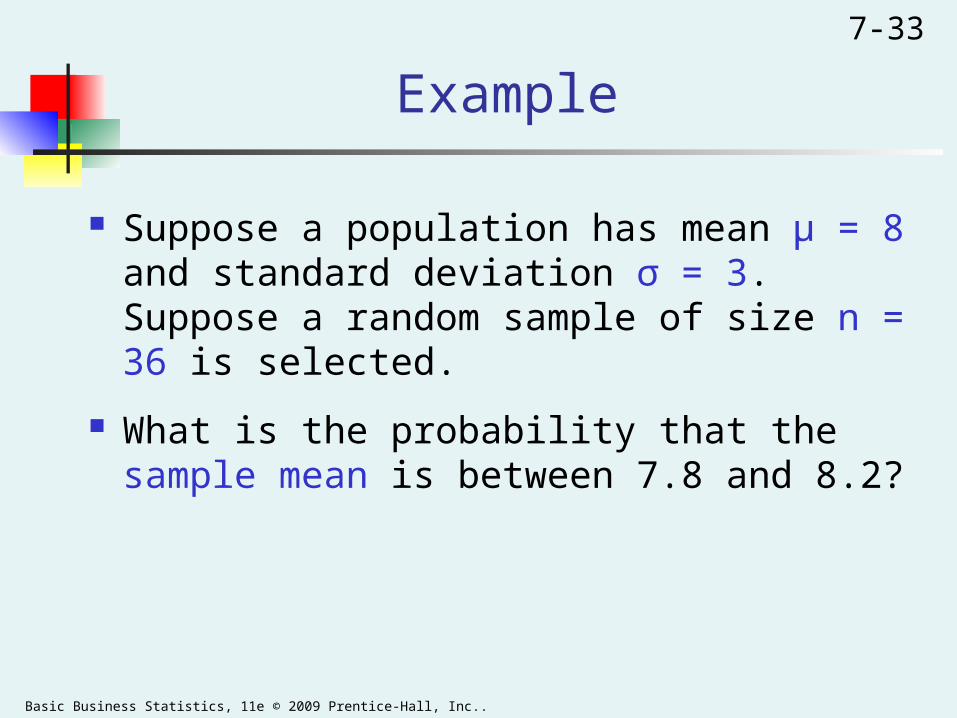
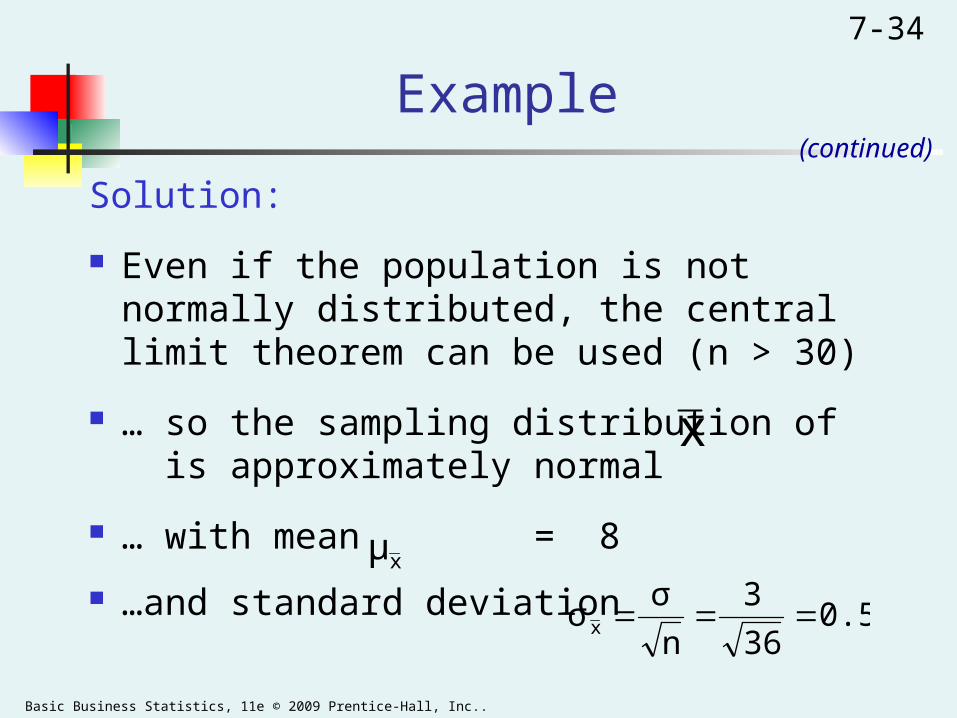
Example
Suppose a population has mean μ = 8 and standard deviation σ = 3. Suppose a random sample of size n = 36 is selected.
What is the probability that the sample mean is between 7.8 and 8.2?
Basic Business Statistics, 11e © 2009 Prentice-Hall, Inc..
7-34
Example
Solution:
Even if the population is not normally distributed, the central limit theorem can be used (n > 30)
… so the sampling distribution of is approximately normal
… with mean = 8
…and standard deviation
(continued)
x
xμ
0.536
3
n
σσx
Basic Business Statistics, 11e © 2009 Prentice-Hall, Inc..
7-35
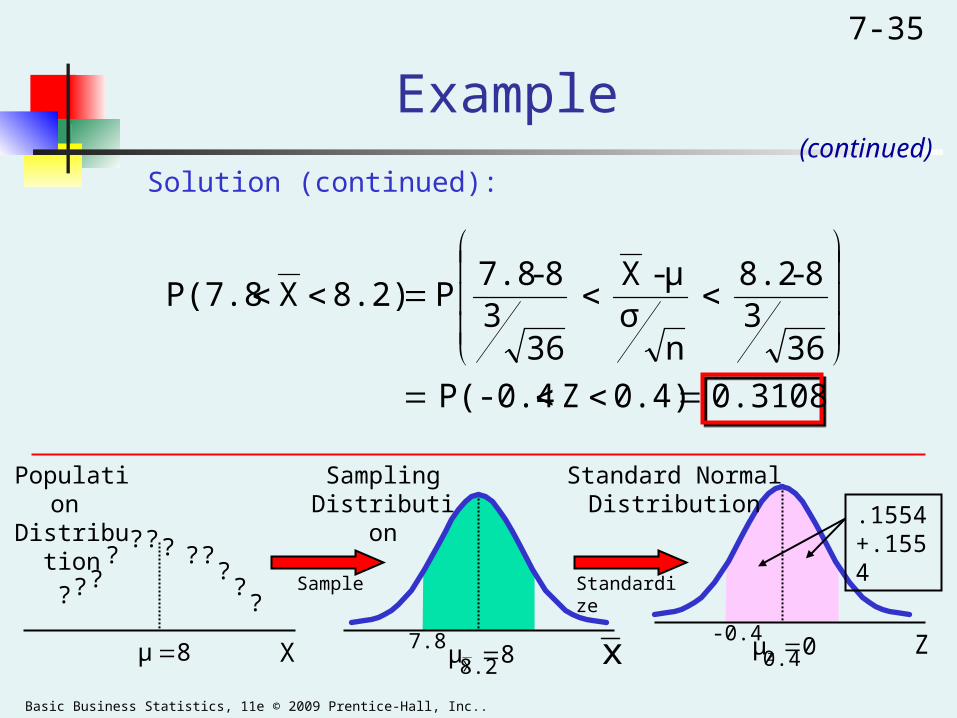
Example
Solution (continued):(continued)
0.31080.4)ZP(-0.4
363
8-8.2
nσ
μ- X
363
8-7.8P 8.2) X P(7.8
Z7.8 8.2 -0.4 0.4
Sampling Distribution
Standard Normal Distribution .1554
+.1554
Population Distribution
??
??
?????
??? Sample Standardize
8μ 8μX
0μz xX
Basic Business Statistics, 11e © 2009 Prentice-Hall, Inc..
7-36
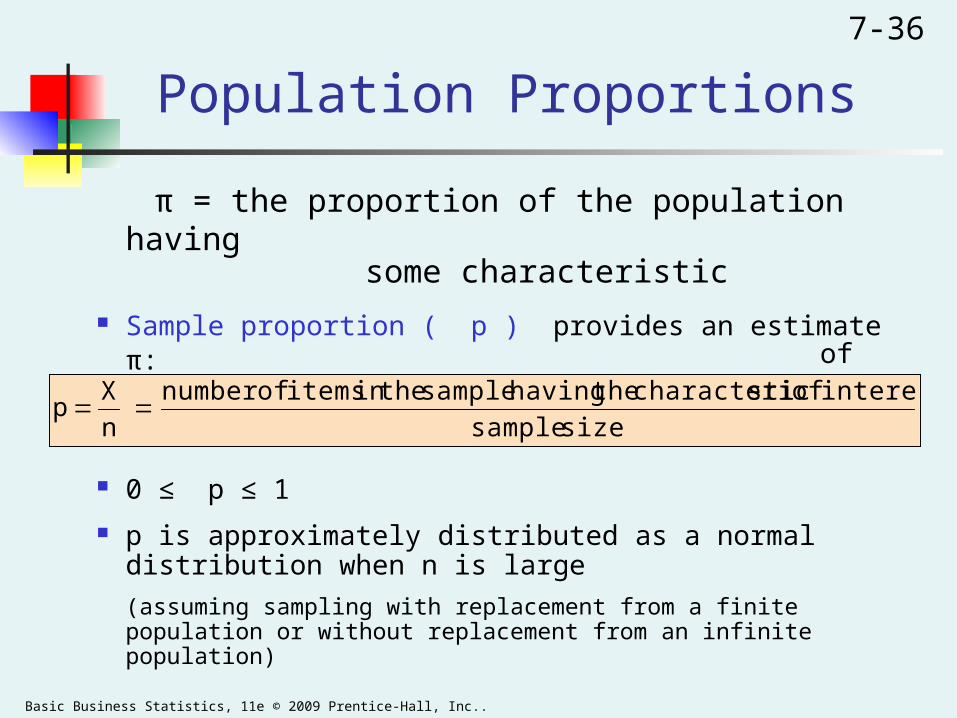
Population Proportions
π = the proportion of the population having some characteristic
Sample proportion ( p ) provides an estimate of π:
0 ≤ p ≤ 1
p is approximately distributed as a normal distribution when n is large
(assuming sampling with replacement from a finite population or without replacement from an infinite population)
size sample
interest ofstic characteri the having sample the in itemsofnumber
n
Xp
Basic Business Statistics, 11e © 2009 Prentice-Hall, Inc..
7-37
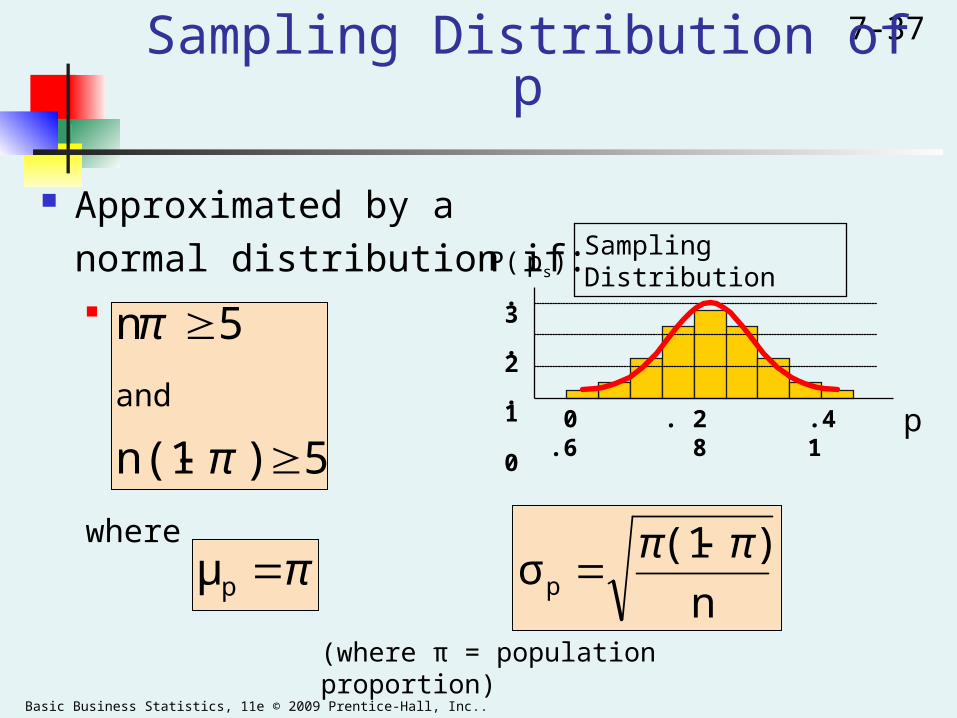
Sampling Distribution of p
Approximated by a
normal distribution if:
where
and
(where π = population proportion)
Sampling DistributionP( ps)
.3
.2
.1 0
0 . 2 .4 .6 8 1 p
πpμn
)(1σp
ππ
5)n(1
5n
and
π
π
Basic Business Statistics, 11e © 2009 Prentice-Hall, Inc..
7-38
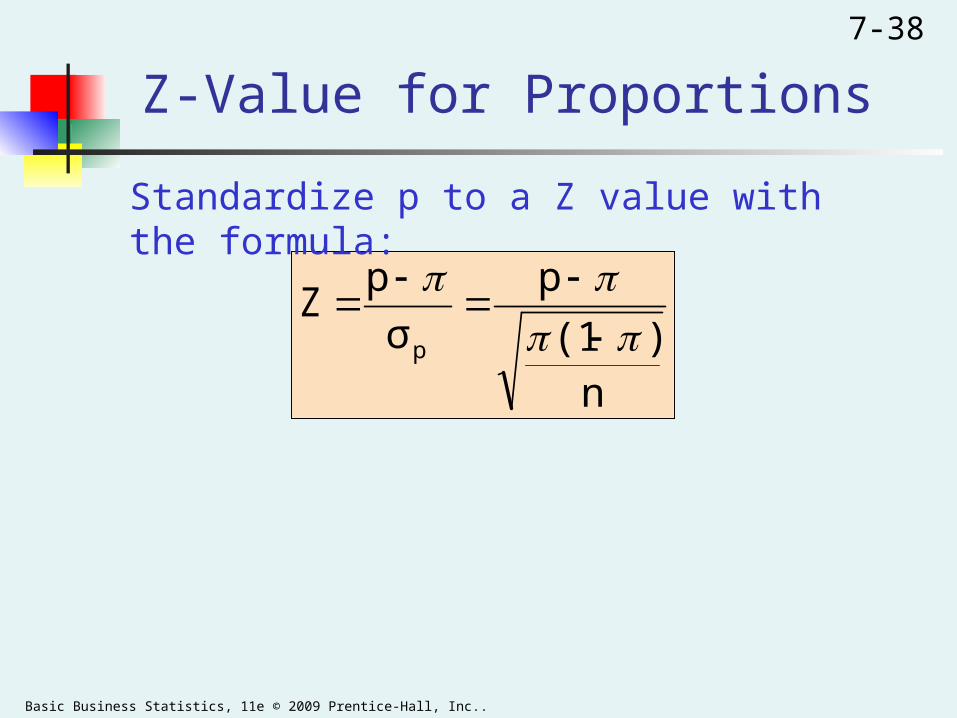
Z-Value for Proportions
n)(1
p
σ
pZ
p
Standardize p to a Z value with the formula:
Basic Business Statistics, 11e © 2009 Prentice-Hall, Inc..
7-39
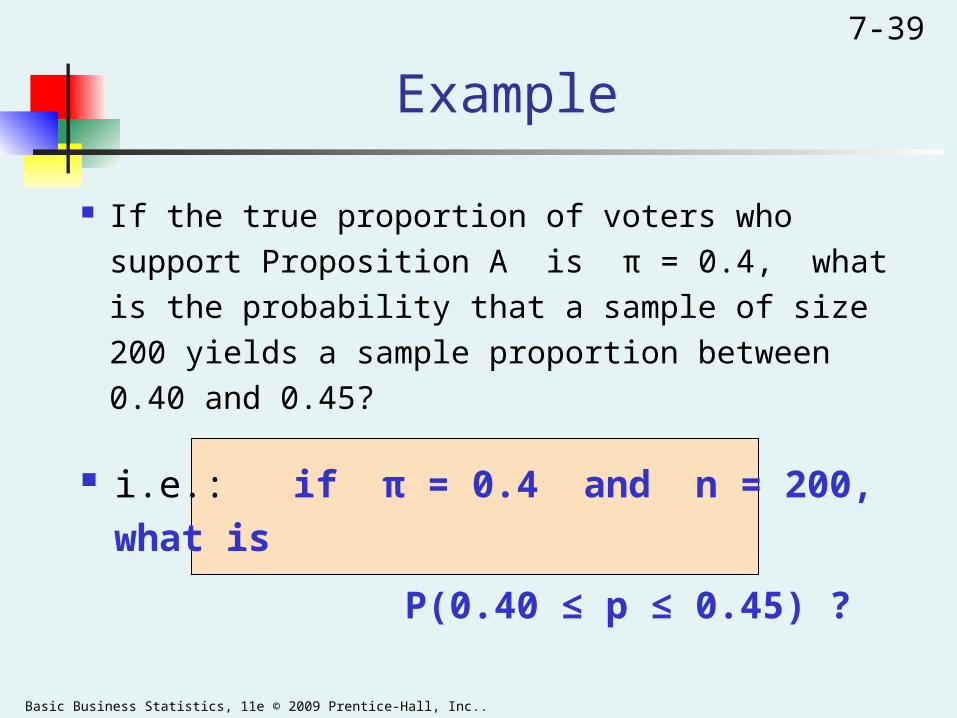
Example
If the true proportion of voters who support
Proposition A is π = 0.4, what is the probability
that a sample of size 200 yields a sample
proportion between 0.40 and 0.45?
i.e.: if π = 0.4 and n = 200, what is
P(0.40 ≤ p ≤ 0.45) ?
Basic Business Statistics, 11e © 2009 Prentice-Hall, Inc..
7-40
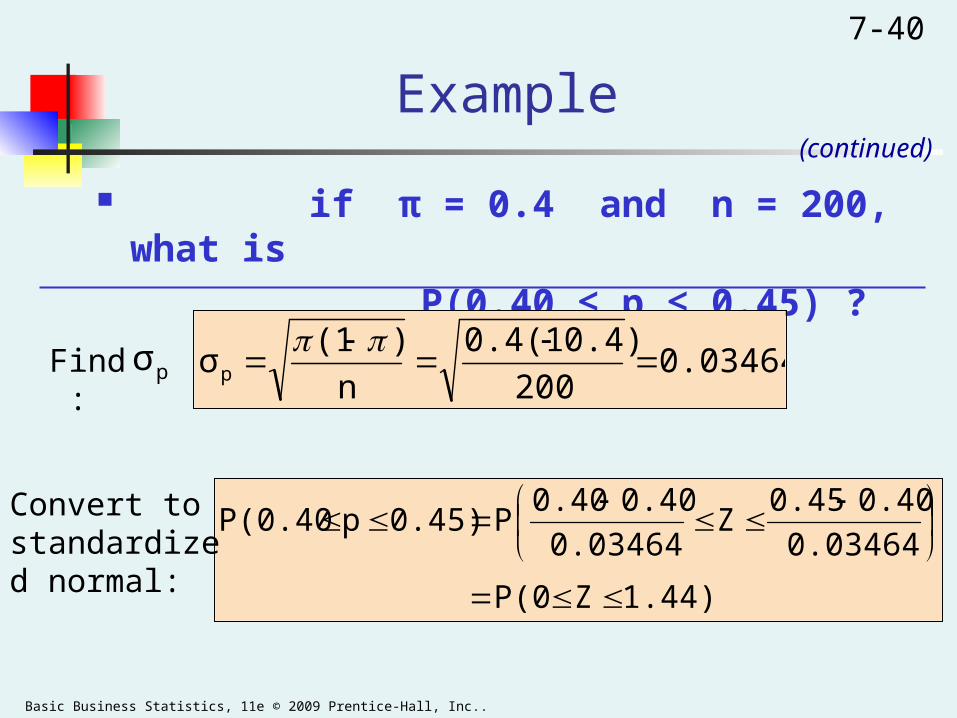
Example
if π = 0.4 and n = 200, what is
P(0.40 ≤ p ≤ 0.45) ?
(continued)
0.03464200
0.4)0.4(1
n
)(1σp
1.44)ZP(0
0.03464
0.400.45Z
0.03464
0.400.40P0.45)pP(0.40
Find :
Convert to standardized normal:
pσ
Basic Business Statistics, 11e © 2009 Prentice-Hall, Inc..
7-41
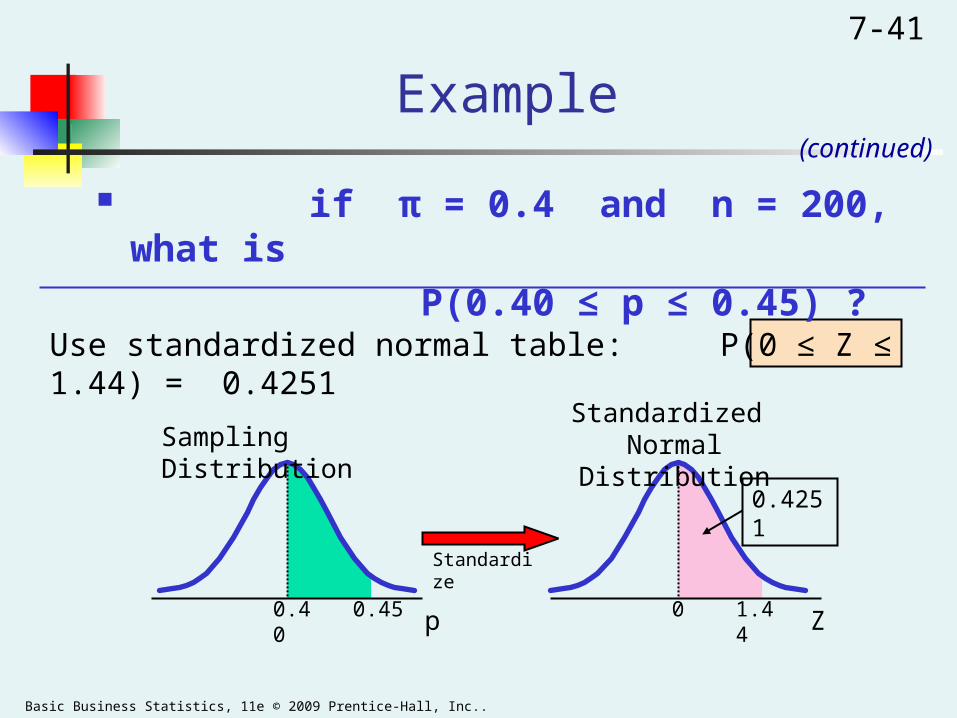
Example
Z0.45 1.44
0.4251
Standardize
Sampling DistributionStandardized
Normal Distribution
if π = 0.4 and n = 200, what is
P(0.40 ≤ p ≤ 0.45) ?
(continued)
Use standardized normal table: P(0 ≤ Z ≤ 1.44) = 0.4251
0.40 0p
Basic Business Statistics, 11e © 2009 Prentice-Hall, Inc..
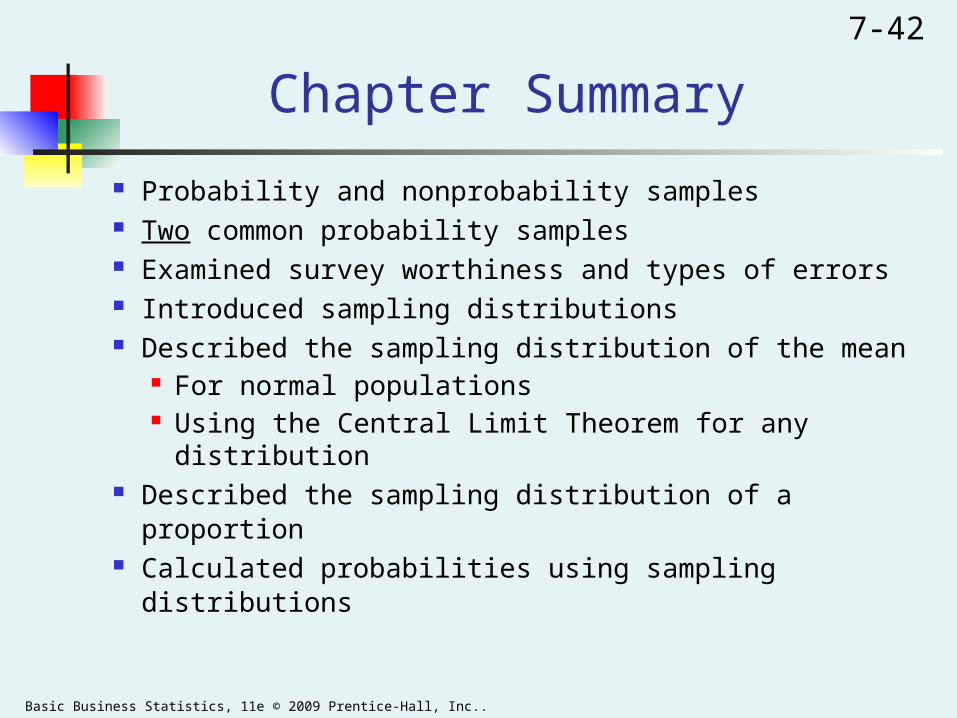
7-42
Chapter Summary
Probability and nonprobability samples Two common probability samples Examined survey worthiness and types of errors Introduced sampling distributions Described the sampling distribution of the mean
For normal populations Using the Central Limit Theorem for any
distribution Described the sampling distribution of a proportion Calculated probabilities using sampling distributions