Embed Size (px)
Citation preview

ORIGINAL ARTICLE
The evolutionary legacy of size-selective harvesting extendsfrom genes to populationsSilva Uusi-Heikkil€a,1,2 Andrew R. Whiteley,3 Anna Kuparinen,4,† Shuichi Matsumura,5,† Paul A.Venturelli,6 Christian Wolter,1 Jon Slate,7 Craig R. Primmer,2 Thomas Meinelt,8 Shaun S. Killen,9
David Bierbach,1 Giovanni Polverino,1 Arne Ludwig10 and Robert Arlinghaus1,11
1 Department of Biology and Ecology of Fishes, Leibniz-Institute of Freshwater Ecology and Inland Fisheries, Berlin, Germany
2 Division of Genetics and Physiology, Department of Biology, University of Turku, Turku, Finland
3 Department of Environmental Conservation, University of Massachusetts, Amherst, MA, USA
4 Department of Environmental Sciences, University of Helsinki, Helsinki, Finland
5 Faculty of Applied Biological Sciences, Gifu University, Gifu, Japan
6 Department of Fisheries, Wildlife, and Conservation Biology, University of Minnesota, St Paul, MN, USA
7 Department of Animal and Plant Sciences, University of Sheffield, Western Bank, Sheffield, UK
8 Department of Ecophysiology and Aquaculture, Leibniz-Institute of Freshwater Ecology and Inland Fisheries, Berlin, Germany
9 Institute of Biodiversity, Animal Health and Comparative Medicine, College of Medical, Veterinary & Life Sciences, University of Glasgow, Glasgow,
UK
10 Department of Evolutionary Genetics, Leibniz-Institute for Zoo and Wildlife Research, Berlin, Germany
11 Chair of Integrative Fisheries Management, Faculty of Life Sciences, Albrecht-Daniel-Thaer Institute of Agricultural and Horticultural Sciences,
Humboldt-Universit€at zu Berlin, Berlin, Germany
Keywords
conservation, fisheries-induced evolution, life-
history evolution, personality, population
dynamics.
Correspondence
Silva Uusi-Heikkil€a, Division of Genetics and
Physiology, Department of Biology, 20014
University of Turku, Finland.
Tel.: +358-2-3335796;
fax: +358-2-3336680;
e-mail: [email protected]
†Authors contributed equally to this work.
Received: 5 August 2014
Accepted: 5 April 2015
doi:10.1111/eva.12268
Abstract
Size-selective harvesting is assumed to alter life histories of exploited fish popula-
tions, thereby negatively affecting population productivity, recovery, and yield.
However, demonstrating that fisheries-induced phenotypic changes in the wild
are at least partly genetically determined has proved notoriously difficult. More-
over, the population-level consequences of fisheries-induced evolution are still
being controversially discussed. Using an experimental approach, we found that
five generations of size-selective harvesting altered the life histories and behavior,
but not the metabolic rate, of wild-origin zebrafish (Danio rerio). Fish adapted to
high positively size selective fishing pressure invested more in reproduction,
reached a smaller adult body size, and were less explorative and bold. Phenotypic
changes seemed subtle but were accompanied by genetic changes in functional
loci. Thus, our results provided unambiguous evidence for rapid, harvest-induced
phenotypic and evolutionary change when harvesting is intensive and size selec-
tive. According to a life-history model, the observed life-history changes elevated
population growth rate in harvested conditions, but slowed population recovery
under a simulated moratorium. Hence, the evolutionary legacy of size-selective
harvesting includes populations that are productive under exploited conditions,
but selectively disadvantaged to cope with natural selection pressures that often
favor large body size.
Introduction
Human harvest of wild populations is often intense and
nonrandom with respect to phenotypes (e.g. Darimont
et al. 2009). In most situations, individuals carrying certain
fitness-related traits (e.g. large body size or explorative and
bold behavior) are more vulnerable to harvest than others
(Allendorf et al. 2008; Al�os et al. 2012; Sutter et al. 2012).
A well-studied example of human harvest is fishing, which
often targets the largest and oldest individuals and is thus
positively size selective (Lewin et al. 2006; Jørgensen et al.
2007; Kuparinen and Meril€a 2007; Law 2007). Life-history
theory suggests that elevated adult mortality favors individ-
uals that allocate energy to reproduction early in life
© 2015 The Authors. Evolutionary Applications published by John Wiley & Sons Ltd. This is an open access article under the terms of the Creative
Commons Attribution License, which permits use, distribution and reproduction in any medium, provided
the original work is properly cited.
597
Evolutionary Applications ISSN 1752-4571
Evolutionary Applications

through early maturation at small size and/or increased
reproductive investment at the expense of postmaturation
somatic growth (Stearns 1992). Such phenotypic changes
could be magnified when harvesting is not only intensive
but also positively size selective (Laugen et al. 2014). While
early maturation increases the probability that an individ-
ual will reproduce before it is harvested, small body size at
reproduction may confer fitness costs through a decrease in
egg number (fecundity), reduced egg and offspring quality
(Walsh et al. 2006; Arlinghaus et al. 2010; Uusi-Heikkil€a
et al. 2010), and increased natural mortality (Jørgensen
and Fiksen 2010; Audzijonyte et al. 2013a; Heino et al.
2013; Jørgensen and Holt 2013). However, depending on a
species’ ecology and local harvesting patterns, evolution of
late, rather than early, maturation (Poos et al. 2011) and
fast, rather than slow, growth rate (Walters and Martell
2004; Matsumura et al. 2011; Enberg et al. 2012) can also
occur in response to harvesting. Furthermore, if adult mor-
tality is very high and there is thus little fitness to gain by
allocating energy to future reproduction, fish might invest
heavily in the first reproduction and produce high, rather
than low (Walsh et al. 2006), quality eggs and offspring. In
fact, despite one might intuitively expect a certain of
change in response to size-selective harvesting (e.g. evolu-
tion of slower growth rate, Walters and Martell 2004), exact
predictions of life-history changes in response to fisheries
exploitation are challenging and require stock- and fishery-
specific analyses (Arlinghaus et al. 2009; Laugen et al.
2014). Evolutionary changes of body size and related life-
history traits can have important repercussions for species
and community ecology (Peters 1983; de Roos and Persson
2002; Haugen et al. 2007), management reference points
(Heino et al. 2013), and population productivity, recovery
speed, and fisheries yield (Law and Grey 1989; Hutchings
and Fraser 2008; Conover et al. 2009; Laugen et al. 2014)
and thus may be of high relevance to contemporary fisher-
ies management (Conover and Munch 2002; Jørgensen
et al. 2007).
A common expectation and empirically reported effect
of intensive and size-selective harvesting is the downsizing
of body size (Conover and Munch 2002; Jørgensen et al.
2007; Swain et al. 2007; Al�os et al. 2014). Beyond correla-
tions between body size and a range of early life-history
traits, any selection on body size may also affect underlying
physiological and behavioral characteristics through corre-
lated selection responses (Walsh et al. 2006; Uusi-Heikkil€a
et al. 2008; Diaz Pauli and Heino 2014). Several, not mutu-
ally exclusive, mechanisms may be at play. For example,
adults may be large because they are efficient in converting
energy into somatic growth (an energy conversion mecha-
nism), because they mature late (an energy allocation
mechanism) or because they are dominant, bold and
aggressive in social interactions and hence superior in
securing and defending food resources (an energy acquisi-
tion mechanism; Enberg et al. 2012). Large individuals
may be also more active and explore the environment more
in search for food and they may be able to do so due to
lower predation risk (Biro and Post 2008). Any changes in
adult body size in response to size-selective fisheries can
thus be a consequence of changes in juvenile growth rate
(which is an unconfounded measure of growth rate capac-
ity not affected by maturation changes, Enberg et al. 2012),
altered maturation schedules (leading to altered energy
allocation patterns), or represent an indirect response to
selection due to direct selection on correlated behavioral or
physiological traits (Walsh et al. 2006; Uusi-Heikkil€a et al.
2008; Biro and Stamps 2010; Enberg et al. 2012). There-
fore, size-selective fisheries might also induce changes in
physiological traits (e.g. metabolism) or behavior (e.g.
aggression, boldness) that contribute to energy acquisition
and hence growth (Enberg et al. 2012; Sutter et al. 2012;
Al�os et al. 2015). Most empirical studies on fisheries-
induced evolution (FIE) have so far focused on three key
life-history traits, namely growth rate, age and size at matu-
ration, and reproductive investment (e.g. Rijnsdorp 1993;
Olsen et al. 2004; for reviews, see Policansky 1993; Heino
and Godø 2002; Sharpe and Hendry 2009; Devine et al.
2012; Audzijonyte et al. 2013b). Currently, there is little
doubt that FIE in the wild could be both plausible and
potentially widespread (Jørgensen et al. 2007; Kuparinen
and Meril€a 2007). However, examination of the joint
effects of size-selective fisheries on several traits, including
physiology (e.g. metabolism), behavior (e.g. feeding activ-
ity) and life history (e.g. growth capacity), in terms of the
resulting effects for population dynamics and fisheries has
been largely confined to modeling studies (e.g. Th�eriault
et al. 2008; Andersen and Brander 2009; Dunlop et al.
2009; Enberg et al. 2009; Matsumura et al. 2011), and the
potential management consequences of FIE remain the
least well-understood aspects of FIE (Jørgensen et al.
2007). Notwithstanding the ongoing controversy of
whether harvesting causes genetic as opposed to mere phe-
notypic change, human-induced rapid phenotypic trait
change may trigger equally fast ecological change and
thereby shape populations, food webs, and ecosystems on a
global scale (Darimont et al. 2009; Palkovacs et al. 2012).
Because life-history, morphological, and behavioral traits
are at least moderately heritable (Mousseau and Roff
1987), intensive and size-selective fishing over multiple
generations is expected to cause genetic (i.e. evolutionary)
changes in a range of traits (e.g. Law 2007; Dunlop et al.
2009; Laugen et al. 2014; Marty et al. 2015). Genetic
changes, as opposed to mere phenotypic change, may mag-
nify the ecological challenges related to overfishing because
they are usually slowly, if at all, reversible in the absence of
similarly strong natural selection pressures working in
598 © 2015 The Authors. Evolutionary Applications published by John Wiley & Sons Ltd 8 (2015) 597–620
Evolutionary legacy of size-selective harvest Uusi-Heikkil€a et al.

opposite direction than harvest selection (Conover et al.
2009) and thus may have lasting effects on populations and
consequently on fisheries. Indeed, meta-analyses, modeling
studies, and experimental work have all shown that evolu-
tionary effects of harvesting can impair biomass recovery of
overharvested populations (Conover et al. 2009; Enberg
et al. 2009; Kuparinen and Hutchings 2012; Neubauer et al.
2013), affect management reference points (Heino et al.
2013), and reduce catchability and hence catch rates and
fisheries quality (Philipp et al. 2009; Al�os et al. 2015). Fish-
eries-induced adaptive change might thus have multiple
consequences for the population and the fishery, in particu-
lar when slowly reversible genetic, as opposed to plastic,
changes are involved (Laugen et al. 2014). Despite increas-
ing concern about the effects of size-selective harvesting on
wild fish populations (Borrell 2013), the consequences of
FIE for populations and fisheries continue to raise contro-
versy (Browman et al. 2008; Jørgensen et al. 2008; Ander-
sen and Brander 2009; see also Bunnefeld and Keane 2014).
Although exploited fish populations can consist of individ-
uals of reduced average adult body size for both demo-
graphic and evolutionary reasons (Jørgensen et al. 2007),
they might remain biologically viable and highly productive
precisely because of the evolution of ‘fast’ life histories, that
is, early maturation and high reproductive investment
(Hutchings 2009; Heino et al. 2013; Jørgensen and Zim-
mermann 2015). Modeling studies also suggest that if fish-
ing pressure can be kept within optimal limits, FIE is not
expected to cause major economic repercussions (Eikeset
et al. 2013; Jørgensen and Zimmermann 2015).
The concern about fisheries-induced evolution was first
raised at the beginning of the 20th century (Rutter 1902),
but has only gained significant momentum since the 1990s
when Law and coworkers published their groundbreaking
research on FIE (e.g. Law and Grey 1989). Although the
potential for rapid FIE is now theoretically, and also empir-
ically, well founded (Jørgensen et al. 2007; Kuparinen and
Meril€a 2007; Laugen et al. 2014), conclusively detecting it
in natural populations has remained a challenge due to the
limited opportunities for disentangling plastic and genetic
responses in a suite of phenotypic traits (Allendorf et al.
2008; Naish and Hard 2008; Therkildsen et al. 2010; Cuve-
liers et al. 2011; P�erez-Rodr�ıgues et al. 2013). In theory,
experiments on FIE could also be designed in the wild
(McAllister and Peterman 1992), but the cause-and-effect
mechanism of size-selective harvesting can best be studied
experimentally in controlled laboratory environments
(Conover and Baumann 2009; Diaz Pauli and Heino 2014).
However, to date, only few experimental studies have con-
clusively reported harvest-induced genetic changes based
on quantitative genetics (Conover and Munch 2002;
Philipp et al. 2009) or molecular approaches (van Wijk
et al. 2013). While there is little doubt that FIE might be
occurring in practical fisheries, the magnitude of life-his-
tory and other phenotypic changes, the specific genes under
selection, and the way how the phenotypic and genetic
changes affect fisheries, population viability, productivity,
and recovery remain largely unresolved (Jørgensen et al.
2007; Heino et al. 2013; Laugen et al. 2014).
From a conservation and management perspective, fish-
eries-induced phenotypic changes are of particular concern
if they affect population dynamics, viability, and recovery
(Hutchings and Fraser 2008; Dunlop et al. 2009; Heino
et al. 2013; Laugen et al. 2014). There is ongoing debate
whether FIE can significantly affect populations and ecosys-
tem services on timescales that are relevant to fisheries
managers (Andersen and Brander 2009; Laugen et al.
2014). Here, we present the results of a selection experi-
ment that provides a comprehensive picture of the evolu-
tionary legacy of size-selective harvesting by examining its
phenotypic, genetic, and population-level consequences. A
major part of this experiment was to quantify phenotypic
and genetic changes in response to five generations of size-
selective harvesting in wild zebrafish (Danio rerio) in the
laboratory using functional genomic markers that can
occur close by, within, or in the regulatory areas of genes
under selection. Phenotypic changes were scaled up to the
population level using a life-history model. Our results
provide important insights into FIE, such as how quickly
fishing might bring about evolutionary changes, and con-
tribute to the ongoing debate over whether size-selective
harvesting causes evolutionary changes in ecologically and
economically important phenotypic traits (e.g. in adult
body size), and whether these changes matter for biomass
renewal, population stability, and conservation.
Materials and methods
Size-selective harvesting and breeding design
We used F1-generation offspring from approximately 1500
wild-collected zebrafish (parental stock) from West Bengal
in India (see Uusi-Heikkil€a et al. 2010 for details) in our
selection experiment to ensure maximum genetic variation.
Our three experimental treatments, each with one replicate
(i.e. two tanks per treatment) consisted of approximately
450 zebrafish per replicate tank. We reared individuals in
each generation in identical environmental (Supporting
Information S1) and density conditions in three replicated
selection treatments similar to Conover and Munch’s
(2002) landmark study. In contrast to Conover and
Munch’s (2002) design where maturation was triggered by
photoperiod and harvesting occurred at a fixed age, the
timing of harvesting in our experiment was determined by
the maturation schedule of the randomly harvested control
treatment: Once 50% of the randomly harvested fish were
mature (determined macroscopically from 20 lethally sam-
© 2015 The Authors. Evolutionary Applications published by John Wiley & Sons Ltd 8 (2015) 597–620 599
Uusi-Heikkil€a et al. Evolutionary legacy of size-selective harvest

pled females), we harvested 75% of individuals in all treat-
ments size selectively or randomly according to size. Hence,
as not all fish were mature at harvesting, the design repre-
sented a harvesting pattern that targeted both mature and
immature fish. Prior to harvesting, we measured the stan-
dard length (SL) of all fish in all tanks to the nearest mm
and wet mass (WM) to the nearest 0.1 g. During harvest-
ing, we sorted the fish by SL and estimated the 75th and
the 25th percentiles of the size distributions. To mimic a
highly intensive lethal capture fishery (Lewin et al. 2006;
Worm et al. 2009; Hilborn and Stokes 2010), we applied a
75% per-generation harvest rate. In the randomly selected
line (random with respect to sizes that were harvested), we
measured all fish and then assigned the fish randomly with
respect to body size to either the harvested group or to the
spawning stock. In a large-selected line, we assigned the
25% largest fish to the spawning stocks, and in the small-
selected line we assigned the 25% smallest fish to the
spawning stocks. The large-selected line hence represented
a mortality schedule mimicking a maximum-length limit
where the largest mature fish survived. The small-selected
line instead represented a positive size-selective harvest
scheme common to most fisheries, where young immature
fishes are saved because they are not vulnerable to the gear
(e.g. too small to become entangled in a fishing net) and/or
have to be released due to the minimum-length limit regu-
lations. There was no unharvested control for logistical rea-
sons. A subsample of F1-generation fish from each selection
line (N = 50 per selection line) was measured at age
60 days to ensure that there were no initial differences in
body size when the selection experiment was started (large-
size selected: 15.2 � 2.79 mm; randomly selected:
15.0 � 2.26 mm; small-size selected: 15.8 � 2.58 mm;
mean � SD; v2 = 1.8105, P = 0.4044).
After harvesting, we kept the spawners from each of the
six experimental populations in separate aquaria for
14 days to ensure that most fish reached maturity before
initiating the spawning trial. To increase the odds of all
spawners contributing to the next generation, we mimicked
natural spawning conditions (Hutter et al. 2010) by trans-
ferring small groups of individuals to spawning boxes. The
boxes contained a mesh structure that prevented egg canni-
balism (Uusi-Heikkil€a et al. 2010, 2012a). We used two
sizes of spawning boxes. Five-liter spawning boxes were
each stocked with two females and four males, and three-
liter spawning boxes were each stocked with one female
and two males (altogether 40 females and 80 males per
selection line from F1- to F6-generation). We measured the
SL and WM of each spawner before placing it into a spawn-
ing box. Females were swapped among boxes once during
the spawning trial to ensure a high number of parental
combinations and to sustain genetic variation. Spawning
trials lasted for 5 days. Each day we cleaned the spawning
boxes, placed fertilized eggs on petri dishes, and transferred
the petri dishes to an incubator (Tintometer GmbH;
T = 26°C). We reared hatchlings in the spawning boxes
(adults were removed) for 30 days and then transferred
them to the rearing tank that their parents were from. The
selective harvesting was repeated again when 50% of the
randomly selected fish were mature.
We continued the size-selective harvesting for five gener-
ations (F1–F6) and then halted size selection up to four
generations (F7–F10). To estimate the strength of selection
during the first five generations, per-generation standard
deviation-standardized selection differentials (also known
as selection intensity), which describes the difference in the
average body size between the spawners and the entire
experimental population standardized by the phenotypic
standard deviation, were estimated for each generation sep-
arately following Matsumura et al. (2012). Note that given
our harvesting design, where age at harvest varied from
generation to generation in line with potential changes in
age at 50% maturation of the random line, did not allow
the estimation of selection responses with respect to size at
age. From the F6-generation onward, 100 individuals per
selection line were randomly selected for spawning, and, as
in previous generations, their offspring were reared in iden-
tical environmental and density conditions. Comparisons
of life-history traits among selection lines were conducted
two to three generations postselection, and physiological
and behavioral traits four generations postselection, in tri-
als where the rearing and growth conditions were strictly
standardized among lines. This was performed to remove
all confounding maternal and paternal effects and any
potential epigenetic effects, thereby increasing the odds that
life-history evolution was measured in a comparative way.
For example, producing the next generation of fish was
time-consuming, and in some cases, populations of our
selection treatments were started a couple of weeks apart
and consisted of slightly different-aged offspring. Uncon-
trolled environmental effects during the subsequent hold-
ing phase might affect life histories, so the comparison of
different traits among the selection lines was performed
only after keeping the selected fish for at least two genera-
tions without any further selection under controlled and
time-matched conditions. Life-history, physiological, and
behavioral traits were assessed using offspring from parents
that had experienced at least two generations of no selec-
tion. For the among-line comparisons, experimental fish of
all lines were produced and reared at the same time and in
identical conditions. This approach was similar to earlier
work in male guppies (Poecilia reticulata; van Wijk et al.
2013). Admittedly, delaying the assessment of life-history,
physiological, and behavioral traits might not be always
desirable in terms of experimental design because the fish
might have started converging back to their original life
600 © 2015 The Authors. Evolutionary Applications published by John Wiley & Sons Ltd 8 (2015) 597–620
Evolutionary legacy of size-selective harvest Uusi-Heikkil€a et al.

histories as shown by Conover et al. (2009). At the same
time, our experimental design can give us some insight into
the persistence of potential harvest-induced changes and
certainly allowed comparisons among lines that were un-
confounded by uncontrolled tank or rearing effects.
Assessment of life-history, physiological, and behavioral
traits
We assessed a range of life-history, physiological, and
behavioral traits expected to change in response to size
selection after five generations of size-selective harvesting.
We focused on life-history traits commonly studied in the
context of FIE, namely juvenile and adult growth rates,
reproductive investment and maturation schedule (Heino
et al. 2013) as well as early life-history traits (Walsh et al.
2006). Moreover, any changes in energy allocation might
be related to metabolic changes (e.g. routine metabolism)
or changes in energy acquisition patterns related to behav-
ior (exploration and boldness; Enberg et al. 2012). Hence,
we also measured standard metabolic rate and measures of
risk-taking behavior and exploration in juvenile zebrafish.
Growth
To study the growth differences among the selection lines
after five generations of size-selective harvesting, we used
replicate boxes (each stocked with 10 fish) for each of the
experimental populations and their replicate lines (alto-
gether 48 rearing boxes). We measured the SL and wet
mass (WM) of the F9-generation fish (i.e. third generation
after the selection was halted) every 15 days from age
30 days to age 210 days. To derive growth and other
growth-related life-history traits, we fitted a biphasic
growth model (Lester et al. 2004) to length-at-age data
(sexes combined) from each experimental population. The
biphasic growth model produced estimates for several key
life-history traits, such as juvenile growth rate (h), repro-
ductive investment (g), age at maturity (T), length at matu-
rity (L), and asymptotic length (L∞), and expected
instantaneous mortality rate (M). For more information
about the growth experiment and the growth model, see
Supporting Information S2.
Maturation
To estimate the plasticity in age and size at maturation that
stemmed from growth variation among the selection lines,
we conducted a maturation experiment in which F8-gener-
ation fish (i.e. second generation after the selection was
halted) were reared under three different feeding condi-
tions (1%, 2%, and 4% of body weight in dry food daily)
following the protocol in Uusi-Heikkil€a et al. (2011). We
used the demographic estimation method (Barot et al.
2004) for estimation of the probabilistic maturation reac-
tion norms (PMRNs; Dieckmann and Heino 2007) for each
selection treatment (see Supporting Information S3).
Reproductive performance and early life-history traits
We estimated the reproductive performance and potential
differences in early life-history traits among the selection
lines using F9-generation fish. Variables of interest included
spawning frequency, clutch size (number of fertilized eggs
produced by female, that is, absolute fecundity) and the rel-
ative fecundity (number of fertilized eggs per gram of
female WM; these three were measures of reproductive per-
formance), egg size, egg survival, larval hatching probabil-
ity, larval age at hatch, larval length at hatch, larval yolk sac
volume, swim bladder inflation probability, and larval sur-
vival (these were measures of early life-history traits; Sup-
porting Information S4). In all statistical analyses, selection
line was treated as a predictive variable, and selection line
replicate, spawning day and couple (i.e. the spawning
female and male) were treated as random variables. If there
was virtually no variance associated with the random vari-
ables, they were excluded from the model. We modeled
count data with a Poisson and probability data (e.g. hatch-
ing probability) with a binomial error structure. To gener-
ate predictions of a potential selection line-specific trait
divergence and to control for the effect of female body size
on early life-history traits (i.e. size-dependent maternal
effects, Hixon et al. 2014), female size was added as predic-
tive variable in a second set of models (except in the larval
survival probability where larvae from different spawning
couples were pooled). Our approach of running models
with and without female size as covariate allowed us to
examine whether differences in reproductive traits were
associated with maternal body size or whether the traits
had evolved independently of maternal size.
Metabolic rate
We used juvenile zebrafish of the F10-generation (i.e. fourth
generation after the selection was halted) to study differ-
ences in mass-specific standard metabolic rate (SMR)
among the selection lines. Juveniles were used to achieve a
measure of base metabolism unaffected by maturation. SMR
was measured as rates of oxygen uptake calculated according
to a previously published protocol (Dupont-Prinet et al.
2010). We ensured that assumptions of homogeneity and
normality of residuals were met, and examined differences
in SMR among treatments using a linear mixed model, with
selection line as a predictive variable, and selection line repli-
cate as a random variable (Supporting Information S5).
Behavior
To study differences in boldness and exploratory behavior
as measures of energy acquisition-related behaviors (Enberg
et al. 2012) among the selection lines, we used the same
© 2015 The Authors. Evolutionary Applications published by John Wiley & Sons Ltd 8 (2015) 597–620 601
Uusi-Heikkil€a et al. Evolutionary legacy of size-selective harvest

fish that were tested for SMR. Each individual was tested
twice for its exploration behavior in an open-field test in a
novel environment similar to Ariyomo and Watt (2012). In
each trial, a single focal fish was introduced into a transpar-
ent plastic cylinder in the center of the arena (Supporting
Information S5). After a brief acclimatization period, the
cylinder was carefully removed and the fish movement was
videotaped for 5 min (1st trial). Measurements were
repeated for each individual after a break of 30 min (2nd
trial). Test fish were measured for total length (TL) and
WM after the tests were completed to not stress the fish. As
a first proxy for exploration, we calculated the individual
mean velocity during each trial (distance moved in 250 s).
We further scored the time that a fish spent freezing
(defined as not moving faster than 20 mm�s) as another
proxy for its exploration and degree of boldness (assuming
that fish that freeze less are more explorative and bold).
To analyze the data, we first searched for correlations
between both response variables (i.e. velocity and time
spent freezing) using a principle component analysis
(PCA) for both test trials (Supporting Information S5). We
used the first principal component (PC1) as a response var-
iable in a linear mixed model in which selection treatment,
experimental trial, TL, and WM were predictive variables
and individual and selection line replicate were random
variables. Model fitting was performed by first evaluating
the random effects through likelihood ratio tests. We then
excluded all covariates with P > 0.1 and refitted the model.
In the final model, all other explanatory variables could be
excluded, except the selection treatment (predictive vari-
able) and the individual (random variable). More details
are given in the Supporting Information S5.
Evolutionary rate
We estimated evolutionary rates in body size at age 90 days
for each selection line using haldanes (Haldane 1949).
Haldanes were calculated as:
ððv2=spÞ � ðv1=spÞÞ=t;where v is the mean body length at age 90 days after one
generation of selection (F2-generation, v1) and after five
generations of selection and three generation of no selection
(F8-generation, v2), sp is the pooled standard deviation of
trait values across time, and t is the number of generations.
Mean body lengths at age 90 days were measured from a
subsample of fish collected at F2- and F8-generations.
Genetic analyses
To determine whether size-selective harvesting induced
genetic changes in the experimentally exploited zebrafish
populations, we used 371 genomewide, evenly distributed
single nucleotide polymorphisms (SNPs) that were chosen
from a previously analyzed wild zebrafish dataset (Whiteley
et al. 2011) in 502 individuals (Supporting Information
S6). Outlier analysis was conducted for F6-generation indi-
viduals (i.e. first generation after the selection was halted)
using the Fdist method (Beaumont and Nichols 1996)
implemented in software LOSITAN – Selection Workbench
(Antao et al. 2008). We studied the differences in allele fre-
quencies of outlier loci among selection lines with PCA.
Because outliers detected by the outlier test can be caused
by allele frequency divergence in any number of experi-
mental replicates, we directly examined allele frequency
variation for the outlier loci to further characterize the nat-
ure of the parallel adaptive divergence. This was performed
by creating 95% confidence intervals for the allele frequen-
cies of the selected lines by bootstrapping the allele fre-
quency data. We then determined whether the confidence
intervals of the selection lines and selection line replicates
overlapped. By doing so for each outlier locus, we identi-
fied the selection treatment responsible for the allele fre-
quency differences (and the detection of the outlier loci).
We identified genes that were nearby outlier loci on the
same linkage group using a SNP database (www.ncbi.nlm.
nih.gov) and the Zebrafish Model Organism Database
(www.zfin.org).
Population growth model
We estimated the finite rate of population growth (k) of
each selection line under different harvest scenarios (with
and without size-dependent harvesting) via a density-
dependent Leslie matrix model that incorporated evolved
life-history traits (i.e. h, g, T, and M, see section ‘Growth’
above), fecundity estimates that were based on empirical
zebrafish egg weight data, and age-dependent survival
probabilities that were determined, with certain adjust-
ments, using empirical estimates of early life-history traits,
that is, fertilization rate, egg survival, hatching probability,
and larval survival (Supporting Information S7). For sim-
plicity, we modeled only females. We studied the perfor-
mance of individuals from the large- and the small-selected
treatments by comparing the population growth rate of a
variant individual in an equilibrium population repre-
sented by the randomly selected life history. We introduced
three prototypical size-dependent harvest mortality scenar-
ios in the population dynamical model: (i) small-size har-
vested, which mimicked a harvest slot as harvesting only
started on maturing fish and large mature fish were saved,
(ii) randomly harvested, which represented unselective har-
vesting with respect to body size, and (iii) large-size har-
vested, which represented a standard positive size-selective
fishery and/or a fishery managed with a minimum landing
size or minimum-size limit (i.e. small-selected experimen-
602 © 2015 The Authors. Evolutionary Applications published by John Wiley & Sons Ltd 8 (2015) 597–620
Evolutionary legacy of size-selective harvest Uusi-Heikkil€a et al.

tal fish) (Supporting Information S7; Fig. S2). Actual values
of maximum daily instantaneous mortalities and length
limits were determined to mimic our experimental 75%
per-generation harvest rate. Accordingly, the maximum
daily instantaneous mortality (Fmax) and the lower (L1) and
upper (L2) limits of the harvesting scheme for each mortal-
ity scenario were as follows: small-size harvested:
Fmax = 0.01825 per day, L1 = 20.8 mm, and L2 =24.1 mm; randomly harvested: Fmax = 0.009125 per day,
L1 = 20.8 mm, and L2 = ∞; and large-size harvested:
Fmax = 0.01825, L1 = 23.7 mm, and L2 = ∞ (see Support-
ing Information S7; equation 8, Fig. S2, and Table S10 for
details). To reveal potential costs of evolution, we com-
pared the population recovery between the three selection
lines after exposure to fishing. To that end, during the first
4000 days (about 30 generations), we introduced size-
selective fishing mortality of a similar selectivity as in the
experiment (represented by the three harvesting schemes
mentioned above) and then stopped fishing and allowed
the populations to recover up to 8000 days (about 60 gen-
erations). For detailed methodological information of the
population growth model, including equations, see Sup-
porting Information S7.
Results
Selection intensities
As expected, we found the harvesting mortality that mim-
icked positive size-selective fisheries mortality (i.e. small-
selected fish) exerted negative standard deviation-standard-
ized selection differentials (i.e. selection intensity) on body
length, while the random fish experienced selection inten-
sity close to zero (Fig. 1). By contrast, selection for large
body size (large-selected fish) exerted a consistently positive
standardized selection differential on body length (Fig. 1).
In the last generation of the selection experiment (F5-gen-
eration), the selection intensity on body size in the small-
selected fish was also close to zero. The reason was that in
the last selected generation, the average body size of the
small-selected fish in the experimental population was too
small (18.7 � 3.21 mm) for a timely reproduction after
selection. To not risk the experiment, it was necessary to
apply a slightly higher size threshold (20 mm) when select-
ing the spawners of the small-selected line. Thus, the small-
selected fish only experienced four rather than five genera-
tions of intensive size-selective harvest.
Life-history changes
After five generations of size selection followed by three
generations of no selection, the small-selected fish had
evolved a significantly lower asymptotic length (L∞)
(27.4 � 0.40 mm) compared to the other selection lines
(random 29.2 � 0.29 mm; large-selected 29.5 � 0.59 mm;
Fig. 2A, Table 1). The small-selected fish were also signifi-
cantly smaller (9.7 � 1.96 mm) when the growth experi-
ment started (at age 30 days) compared to random
(10.4 � 2.09 mm) and large-selected fish (10.5 � 1.87
mm; v2 = 15.20; df = 4,6; P = 0.0005; Fig. 2A). Despite
the lower maximum length, small-selected (and random)
fish exhibited a somewhat, yet statistically not significantly,
higher juvenile growth rate (h; Fig. 2B; Table 1). Small-
selected and random fish also invested more energy in
reproduction (g) (Fig. 2C, Table 1) and matured earlier
(T) than large-selected fish in the growth experiment
(Fig. 2A, Table 1). Despite the similar age at maturation,
small-selected fish matured at a smaller size (L) than ran-
dom and large-selected fish (Fig. 2A, Table 1). The instan-
taneous natural mortality (M) estimated from the
parameters of the biphasic growth model (Supporting
Information S2) was higher among small-selected and ran-
dom (0.018 and 0.017/day, respectively) than among large-
selected fish (0.015/day).
The probabilistic maturation reaction norm (PMRN)
describes the 50% probability of maturation as a function
of age and size (and potentially other traits affecting matu-
ration) while controlling for the effect of growth on matu-
ration. The maturity ogive used in the estimation of the
age-, length-, and condition-based PMRNs included the
main effects of age, length, and condition. Condition was a
significant factor determining maturity among small- and
randomly selected but not among large-selected fish (Sup-
porting Information S3; Table S1). None of the interaction
terms in the ogive models were significant. The three-
dimensional PMRNs estimated for large- and small-
selected fish largely overlapped on the right-hand side of
the curve (low growth rate) but not on the left (high
−2
−1
0
1
2
F1 F2 F3 F4 F5Generation
Sel
ectio
n in
tens
ity
Figure 1 Standard deviation-standardized selection differential (S; also
known as the selection intensity) estimated for each generation sepa-
rately. Red, gray, and blue symbols and lines represent populations of
small, random, and large fish, respectively.
© 2015 The Authors. Evolutionary Applications published by John Wiley & Sons Ltd 8 (2015) 597–620 603
Uusi-Heikkil€a et al. Evolutionary legacy of size-selective harvest

growth rate) where small-selected fish exhibited somewhat
reduced age and size at maturation (Fig. 2D). The PMRN
intercept estimated for the random fish was higher than the
ones estimated for the small- and large-selected fish, partic-
ularly on the left-hand side of the curve, indicating that
under fast growth random fish matured at older age and
larger compared to the small- and large-selected fish. Varia-
tion (measured in standard deviation) in body size across
all ages in restricted growth conditions was higher among
random fish (SD 3.4 mm; range of SL 9–25 mm) com-
pared to the large-selected (SD 2.7 mm; range of SL 9.0–23 mm) and small-selected fish (SD 2.6 mm; range of SL
8.0–23 mm).
Changes in reproductive performance and early life-
history traits
Without controlling for female body size, small-selected
fish of the F9-generation had a significantly lower spawning
probability (0.28 � 0.05; mean � S.E.) than large-
(0.51 � 0.05) and randomly selected fish (0.44 � 0.05;
Table 2). Furthermore, small-selected fish produced signif-
icantly fewer eggs than random and large-selected fish
(lower absolute fecundity), also relative to body size (i.e.
relative fecundity, Fig. 2E), and overall smaller eggs than
large-selected fish (Table 2). In terms of relative fecundity,
small-selected fish exhibited higher values compared to
random fish, but these differences were not significant.
Large-selected fish produced slightly larger larvae
(3.45 � 0.013 mm) than small- (3.38 � 0.021 mm) and
randomly selected fish (3.41 � 0.023 mm), but neither
these differences were statistically significant (Table 2).
Unexpectedly, the offspring produced by random fish had
lower hatching probability (0.58 � 0.03) than offspring of
either large- (0.85 � 0.02) or small-selected fish
(0.80 � 0.03; Table 2). The offspring of random fish also
took longer to hatch (5.2 � 0.08 days) than the offspring
of large- (4.9 � 0.05 days) and small-selected fish
(4.7 � 0.08 days; Table 2). Other early life-history traits,
in particular the larval traits, (Table 2) did not differ signif-
icantly among the selection lines.
When female body size was added as a predictive variable
in the analyses, it explained a significant amount of varia-
tion in spawning probability, in absolute and relative
fecundity (particularly in small-selected fish), in egg size,
and in hatching probability (Table 3). Across all selection
lines, larger females were more likely to produce eggs more
frequently and at higher numbers, but the eggs they pro-
duced were smaller and suffered from lower hatching prob-
ability. In all of these analyses, except spawning probability,
selection treatment remained a significant explanatory vari-
able even after controlling for female size, but again there
were few significant effects of either selection treatment or
female body size on larval traits (Table 3).
Changes in metabolic rate
Standard metabolic rate (SMR) did not differ among the
selection lines (linear mixed model, F2,119 = 0.157,
P = 0.855). The average SMR of a standardized fish weigh-
ing 0.1 g was 0.0738 � 0.0053 mg h�1 for small-selected,
0.0781 � 0.0057 mg h�1 for random, and 0.0753
� 0.0053 mg h�1 for large-selected fish.
05
1015202530
0 50 100 150 200Age (d)
Sta
ndar
d le
ngth
(mm
)
0.100.120.140.160.180.200.22
Small Random Large
h (m
m–d
)
g–d
0.010
0.015
0.020
0.025
Small Random Large20
22
24
26
28
30
100 110 120 130 140 150
Sta
ndar
d le
ngth
(mm
)
Age (d)
20
30
40
50
Small Random Large
Dai
ly re
lativ
e fe
cund
ity(n
umbe
r of e
ggs
fem
ale
g–1 )
0 2000 4000 6000 80000.0
2.5
5.0
7.5
10.0
Fishing
Time (d)
Den
sity
(fis
h–I )
(A) (B)
(C) (D)
(E) (F)
Figure 2 Differences among selection lines in life-history traits and
reproductive output. Data are mean � SEM for panels (B), (C), and (E).
Red, gray, and blue symbols and lines represent populations of small-,
randomly, and large-selected fish, respectively. (A) Biphasic growth
curves (dotted lines refer to treatment-specific age T and length at
maturity L). (B) Average juvenile growth rate (h) (small-selected
0.190 � 0.045; random 0.194 � 0.040; large-selected 0.167 � 0.025
mm�d). (C) Average daily reproductive investment (g) (small-selected
0.021 � 0.003; random 0.020 � 0.004; large-selected 0.017 �0.005). (D) 50% quantiles for the probabilistic maturation reaction
norms (PMRNs; note that most plastic responses in maturation shift the
phenotype along the reaction norm, whereas an evolutionary response
in maturation shifts the reaction norm itself). (E) Average relative fecun-
dity (small-selected 26.6 � 5.83; random 19.8 � 3.44; large-selected
43.3 � 8.03 eggs/g female). (F) Simulated population-level conse-
quences of life-history changes induced by size-selective harvesting.
Population recovery was monitored after large-size harvested fishing
was operated for the first 4000 days.
604 © 2015 The Authors. Evolutionary Applications published by John Wiley & Sons Ltd 8 (2015) 597–620
Evolutionary legacy of size-selective harvest Uusi-Heikkil€a et al.

Changes in behavior
In the behavioral analysis, the PC1 scores for the behavioral
traits differed significantly among the selection lines (Sup-
porting Information S5; Table S3). The PC1 captured
behaviors (swimming velocity and time spent freezing) that
were suggestive of risk taking and boldness. Large-selected
zebrafish were significantly more explorative and bolder
(i.e. swam with higher mean velocities and spent less time
freezing) than small- (P = 0.047) and randomly selected
fish (P = 0.01). Based on the high repeatability value (0.47)
for the PC1 score, individuals were highly consistent in
their boldness behavior between the 1st and the 2nd trial
(v2 = 16.54, df = 1, P < 0.001). The consistency may be an
indicator of personality.
Evolutionary rate
The evolutionary rate in body size at age 90 days, estimated
as haldanes, was 0.165 for randomly selected fish, 0.053 for
the large-selected fish, and �0.116 for small-selected fish.
Genetic changes
Among the 371 SNPs, we identified 22 outlier loci that
responded to divergent selection as indicated by high
genetic differentiation (P < 0.025) (Supporting Informa-
tion; Table S4). There was also evidence of balancing selec-
tion at 12 loci (Supporting Information; Table S5).
However, loci under divergent selection are of greatest rele-
vance to studies such as ours and were thus explored in
more detail. A PCA on the outlier SNPs found substantial
evidence for similar amount and direction of genetic
change within each size-selected replicate and relative to
the random replicates after five generations of size-selective
harvesting (Fig. 3).
In eight of the 22 outliers, differences in allele frequencies
were significant and consistent between the selection line
replicates (Supporting Information; Table S6) as there was
virtually no overlap in 95% confidence intervals for both
size-selected replicates of one selection line (e.g. large-
selected) relative to other treatment replicates (e.g. small-
selected and random; Supporting Information; Table S6,
Fig. 4). Parallel allele frequency divergence at these eight
loci (hereafter parallel outlier loci) made drift an unlikely
explanation and revealed that the mechanistic response
underlying adaptive divergence was similar for a subset of
loci. For an additional six outlier loci, the significant differ-
ence in allele frequency occurred in one of the treatment
replicates (Supporting Information S1). Selection may be
responsible for these single replicate-specific results, but it
is more difficult to rule out genetic drift in this case. Six of
the eight parallel outlier loci were in significant linkage dis-
equilibrium (LD; P < 0.05) with a nearby SNP on the same
linkage group (Supporting Information; Table S7).
Five of the eight parallel outlier SNPs occurred in or
close to a gene or in a regulatory region of a gene that has a
known function, such as serotonin synthesis, ion transport,
regulation of transcription, and collagen formation
(Table 4). Furthermore, six of the parallel outlier SNPs
were in significant LD with another SNP that occurred in a
gene or in a regulatory region of a gene with a known func-
tion, such as embryonic yolk processing, immune response
system, and stress response (Table 4).
Table 1. Differences in life-history parameters among the selection lines as estimated by the biphasic growth model.
Trait Selection line Parameter estimates (SE) Chi-square value* (df) P-value
Juvenile growth rate (h; mm) Large 0.167 (0.013) 4.8999 (3,5) 0.0863
Random 0.194 (0.012)
Small 0.189 (0.013)
Maximum length (L∞; mm) Large 29.53 (0.592) 29.946 (3,4) <0.0001
Random 29.24 (0.371)
Small 27.37 (0.398)
Age at maturity (T; d) Large 106.2 (3.001) 12.490 (3,4) <0.0001
Random 94.14 (4.027)
Small 91.27 (4.315)
Length at maturity (L; mm) Large 22.89 (0.449) 0.9742 (3,4) <0.0001
Random 22.61 (0.300)
Small 21.15 (0.322)
Daily reproductive investment (g) Large 0.017 (0.001) 6.4809 (3,4) 0.0109
Random 0.020 (0.001)
Small 0.021 (0.002)
Parameter estimates for each treatment for each trait are shown. P-values were derived from chi-square statistics. The selection line differing signifi-
cantly from the other treatments is indicated in bold.
*Chi-square value from the deletion of the variable from the full model.
© 2015 The Authors. Evolutionary Applications published by John Wiley & Sons Ltd 8 (2015) 597–620 605
Uusi-Heikkil€a et al. Evolutionary legacy of size-selective harvest

Population-level consequences of harvesting-induced life-
history evolution
The population model revealed that, in the absence of fish-
ing, small-selected zebrafish had lower population growth
rates per day than random or large-selected fish (0.18%
and 0.20% lower, respectively; Table 5). By contrast, when
fish in the model were exploited in a similar positively size-
selective manner as in our experiment (as would for exam-
ple be typical in a minimum-length limit scenario, i.e.
small-size selection), the population growth rate per day of
small-selected fish exceeded that of the random and large-
selected fish (by 0.12% and 0.14%, respectively; Table 5).
When standardizing the population growth rate by genera-
tion time of the random fish, these differences revealed that
the population growth rate of small-selected fish was 25.5%
lower than the one of random fish in the absence of fishing,
while it was 40.5% higher than the one of random fish
when exploited with a minimum-length limit. Accordingly,
during the period when positively size-selective fishing was
operating, small-selected fish showed the slowest popula-
tion decline among the treatments but when fishing was
stopped, the speed of recovery by small-selected fish was
slower than that of the other two selection lines (Fig. 2F).
Moreover, small-selected fish did not recover to the pre-
exploitation densities when we assumed no potential for
life-history evolution during population recovery (Fig. 2F).
Finally, small-selected fish did not perform well when ran-
Table 2. The effect of the selection treatment on zebrafish reproductive performance and early life-history traits.
Trait Selection line Parameter estimates* (SE) Chi-square value† (df) P-value‡
Spawning probability Large 0.4911 (0.2764) 12.138 (3,4) 0.0005
Random 0.4437 (0.3160)
Small 0.2614 (0.3086)
Fecundity (eggs/female/day) Large 9.1831 (0.4543) 779.16 (3,5) <0.0001
Random 5.3896 (0.0396)
Small 3.6352 (0.0354)
Relative fecundity (eggs/g of female WM/day) Large 14.050 (0.4698) 498.52 (3,4) <0.0001
Random 8.5289 (0.0315)
Small 8.6313 (0.0246)
Egg yolk size (mm) Large 0.7286 (0.0116) 82.959 (3,4) <0.0001
Random 0.6611 (0.0077)
Small 0.6618 (0.0076)
Egg survival probability Large 0.9490 (0.5148) 0.958 (3,5) 0.6194
Random 0.9609 (0.5993)
Small 0.9310 (0.5810)
Hatching probability Large 0.9037 (0.4083) 8.943 (3,4) 0.0028
Random 0.6177 (0.5684)
Small 0.8365 (0.6003)
Larval age at hatch (days) Large 4.4977 (0.3788) 8.7742 (5,7) 0.0124
Random 4.9623 (0.5411)
Small 4.5052 (0.5820)
Larval size (mm) Large 3.6893 (0.1457) 3.2586 (4,6) 0.1877
Random 3.5411 (0.1218)
Small 3.4732 (0.1247)
Yolk sac volume (mm3) Large 0.0234 (0.0052) 2.5359 (5,7) 0.2814
Random 0.0171 (0.0045)
Small 0.0237 (0.0039)
Swim bladder inflation probability Large 0.7561 (0.3926) 1.0741 (4,6) 0.5845
Random 0.7282 (0.3188)
Small 0.7999 (0.3573)
Larval survival probability Large 0.9094 (0.2916) 3.4567 (3,5) 0.1776
Random 0.8284 (0.3893)
Small 0.8935 (0.4169)
WM, wet mass.
Parameter estimates values are given for each treatment and for each trait. Selection treatment differing significantly from the other lines indicated
in bold.
*Logit-transformed estimated parameters for binomial distributed data and log-transformed estimated parameters for Poisson distributed data.
†Chi-square value from the deletion of the variable from the full model.
‡P-values derived from the chi-square statistics.
606 © 2015 The Authors. Evolutionary Applications published by John Wiley & Sons Ltd 8 (2015) 597–620
Evolutionary legacy of size-selective harvest Uusi-Heikkil€a et al.

dom harvesting (with respect to body size) or dome-shaped
size-selective harvesting (representing large-selection with a
harvest slot-length limit) was operating (Table 5, Support-
ing Information S7; Fig. S3). The modeling results of the
relative performance of each of the three life histories were
robust to parameter uncertainties (Table 5). Although the
performance of small-selected fish relative to the other
selection lines varied with fishing mortality, small-selected
fish outperformed the other selection lines as long as posi-
tively size-selective fishing was operating with moderate or
high intensity (Fig. S4). Another noteworthy finding was
that the population dynamics of the large-selected and the
random fish were often quite similar when fishing was
operating, suggesting that these two life histories were per-
forming functionally equivalent.
Discussion
Our experimental approach in zebrafish demonstrated
changes in genotypes, phenotypes, and population dynam-
ics in response to just five generations of size-selective
harvesting. Thus, our results present a comprehensive pic-
ture of the evolutionary legacy of size-selective exploitation.
Controlled laboratory environment and a specific harvest-
ing design allowed controlling for size-dependent and other
parental and epigenetic effects. This helped us to establish
Table 3. The effect of female body size (standard length; SL mm) and selection treatment on zebrafish reproductive performance and early life-his-
tory traits.
Trait Variable Parameter estimates* (SE) Chi-square value† (df) P-value‡
Spawning probability Treatment 0.0047 (0.0454) 0.0249 (3,5) 0.9876
Female SL 18.693 (2,3) <0.0001
Fecundity (eggs/female per day) Treatment 197.92 (4,6) <0.0001
Large-selected 0.0076 (0.5096)
Random 0.0049 (0.0404)
Small-selected 0.0110 (0.0065)
Female SL 0.2448 (0.0107) 571.57 (5,6) <0.0001
Relative fecundity (eggs per g of female WM per day) Treatment 398.15 (4,6) <0.0001
Large-selected 0.0748 (0.4892)
Random 0.0488 (0.0318)
Small-selected 0.1204 (0.0461)
Female SL 0.1805 (0.0075) 607.74 (5,6) <0.0001
Egg yolk size (mm) Treatment 21.691 (5,6) <0.0001
Large-selected 0.7362 (0.0430)
Random 0.7110 (0.0073)
Small-selected 0.6793 (0.0087)
Female SL �0.0048 (0.0014) 11.817 (6,7) 0.0006
Egg survival probability Treatment 0.9581 (3,5) 0.6194
Female SL 0.0011 (5,6) 0.9740
Hatching probability Treatment 12.984 (5,7) 0.0015
Large-selected 0.9999 (3.4546)
Random 0.9998 (0.5575)
Small-selected 0.9997 (0.8234)
Female SL �0.2796 (0.1146) 5.9779 (6,7) 0.0145
Larval age at hatch (d) Treatment 8.7742 (5,7) 0.0124
Large-selected 4.4977 (0.3788)
Random 4.9623 (0.5411)
Small-selected 4.5052 (0.5820)
Female SL 1.7207 (7,8) 0.1896
Larval size (mm) Treatment 3.3456 (4,6) 0.9585
Female SL 0.0847 (6,8) 0.1877
Yolk sac volume (mm3) Treatment 2.5359 (5,7) 0.2814
Female SL 1.3175 (7,8) 0.2510
Swim bladder inflation probability Treatment 1.0741 (4,6) 0.5845
Female SL 0.1670 (6,7) 0.6828
Parameter estimates are given for the significant covariates, which are indicated in bold.
*Logit-transformed estimated parameters for binomial distributed data and log-transformed estimated parameters for Poisson distributed data.
†Chi-square value from the deletion of the variable from the full model.
‡P-values derived from the chi-square statistics.
© 2015 The Authors. Evolutionary Applications published by John Wiley & Sons Ltd 8 (2015) 597–620 607
Uusi-Heikkil€a et al. Evolutionary legacy of size-selective harvest

unambiguous cause (size-selective harvesting)-and-effect
(phenotypic and genetic changes) relationships (Diaz Pauli
and Heino 2014) reinforcing the possibility that intensive
harvesting of wild populations can indeed lead to fisheries-
induced evolution (FIE). Despite introducing obvious sim-
plifications by maintaining discrete generations and allow-
ing only single reproductive events, our selection
experiment has value because it allowed the assessment of
various phenotypic traits ranging from life-history traits to
physiology and behavior and applying a genomic approach
to discover specific genes under selection. Five generations
of size-selective harvesting of wild zebrafish affected life
history and behavior by elevating reproductive investment,
decreasing mean maximum body size and reproductive
output, and reducing boldness. The evolved phenotypic
changes in the small-selected fish were overall relatively
subtle and often statistically nonsignificant in relation to
the random fish, but they were accompanied by genetic
changes and large population dynamical effects. These
results collectively showed that contemporary harvest-
induced evolution is conceivable in response to intensive
size-selective exploitation. The population model further
revealed that the phenotypic and genetic changes induced
by positive size selection allowed fish to adapt to harvest-
ing, but hindered population recovery in the absence of
exploitation. Our results overall highlight the potential for
large, harvest-induced population-level consequences to
emerge from rather subtle phenotypic changes in response
to positively size-selective exploitation that might easily go
unnoticed when monitoring natural populations.
We examined the outcome of five generations of size-
selective harvesting by comparing the phenotypes of indi-
viduals among selection treatments several generations
after selection was halted. Hence, our results are conserva-
tive because delaying the trait assessment up to four gener-
ations without harvesting probably had resulted in some
recovery of phenotypic traits due to fecundity selection
similar to the case in the famous Atlantic silverside (Meni-
dia menidia) experiment (Conover et al. 2009; Salinas et al.
2012). Moreover, for logistical reasons, we only exerted
negative selection differentials on body size for four rather
than five generations in our fishing treatment (the small-
selected line, Fig. 1), further reducing the potential for phe-
notypic (and genetic) change. We nevertheless documented
effects of positively size-selective harvesting on a range of
traits and also presented molecular evidence of directional
selection altering the genotypes, reinforcing the previously
expressed notion that rapid evolutionary change is possi-
ble over very short time periods of intensive size-selective
harvesting (Conover and Munch 2002; van Wijk et al.
2013).
Evolved differences in growth and behavior
According to the biphasic growth model, small-selected fish
(under selection similar to most capture fisheries managed
with minimum-length limits) reached significantly lower
mean maximum body size (L∞) than large-selected and
random fish, but there was no significant difference in early
growth rate (h) among the selection lines (Fig. 1A,B).
These findings were in line with recent field evidence in
heavily exploited coastal marine fish species (Al�os et al.
2014) and have been also reported elsewhere (N�ussle et al.
2009). Early maturation at small size and high reproductive
investment can together explain the lower L∞ of the small-
selected fish given the fundamental energetic trade-off
between growth and reproduction (Enberg et al. 2012). In
addition to such differences in energy allocation, juveniles
of the small-selected fish evolved differences in energy
acquisition because they were significantly less bold in an
open-field experiment compared to large-selected fish.
These results suggest that the small-selected zebrafish
evolved a more cautious behavioral type and personality,
likely in relation to feeding behavior, which might have
contributed to their lower body size at harvesting. Simi-
larly, small-selected fish in the Atlantic silverside study
evolved lower food consumption and were less willing to
forage under threat of predation (Walsh et al. 2006). Varia-
tion in exploration and boldness can have fitness conse-
quences because these behaviors can facilitate foraging
success (Stamps 2007; Klefoth et al. 2012), dispersal (Cote
et al. 2010), cognitive performance (Vital and Martins
2011), reproduction (Ariyomo and Watt 2012), and sur-
vival (Smith and Blumstein 2007; Biro and Stamps 2008).
Moreover, boldness and exploration relate directly to vul-
nerability to fishing gear (Al�os et al. 2012, 2015; H€ark€onen
−6
−4
−2
0
2
4
F0 F2 F4 F6
Generation
Prin
cipa
l com
pone
nt 1
(41.
99%
)
Figure 3 A principal component analysis on allele frequencies of the
22 outlier loci illustrates a similar amount and direction of genetic
change occurred among the selection lines induced by size selection
after five generations of harvesting. Red lines and symbols indicate
small-, gray randomly, and blue large-selected replicates.
608 © 2015 The Authors. Evolutionary Applications published by John Wiley & Sons Ltd 8 (2015) 597–620
Evolutionary legacy of size-selective harvest Uusi-Heikkil€a et al.

et al. 2014; Diaz Pauli et al. 2015). Therefore, increased
timidity as an evolutionary response to size-selective fishing
will negatively affect catch rates (Philipp et al. 2009),
reduce angler satisfaction (Arlinghaus et al. 2014), and
potentially also affect the economic value of a fishery.
Moreover, when catchability declines so does the value of
fishery-dependent information to index stock size (Al�os
et al. 2015).
A common assumption in the fisheries literature is that
size-selective mortality should reduce growth rate (Conover
and Munch 2002; but see Walters and Martell 2004 for a
critical view of this apparently intuitive prediction). By
contrast, we found that small-selected zebrafish did not dif-
fer significantly in their juvenile growth rate compared to
random and large-selected fish, and there were also no
physiological differences in standard metabolic rate (and,
therefore, in physiological growth capacity) among the
selection lines. In fact, there was a tendency for small-
selected and random fish to grow faster than large-selected
fish (Fig. 1B). This agrees with modeling work (Matsumura
et al. 2011) and empirical data in positively size selectively
exploited fisheries (van Walraven et al. 2010). The lack of
0.0
0.2
0.4
0.6
0.8
1.0
Large Random Small
Locus rs411619810.0
0.2
0.4
0.6
0.8
1.0
Large Random Small
Locus rs409075080.0
0.2
0.4
0.6
0.8
1.0
Large Random Small
Locus rs40865556
0.0
0.2
0.4
0.6
0.8
1.0
Large Random Small
Locus rs411153540.0
0.2
0.4
0.6
0.8
1.0
Large Random Small
Locus rs408566870.0
0.2
0.4
0.6
0.8
1.0
Large Random Small
Locus rs40688310
0.0
0.2
0.4
0.6
0.8
1.0
Large Random Small
Locus rs412383520.0
0.2
0.4
0.6
0.8
1.0
Large Random Small
Locus rs40655095
Alle
le fr
eque
ncy
Selection line
Figure 4 Replicable genetic changes in differently selected zebrafish lines induced by size-selective harvesting indicated by nonoverlapping 95% con-
fidence intervals estimated for allele frequencies for each outlier locus. Large-selected fish indicated with blue lines, random fish with gray lines, and
small-selected fish with red lines.
© 2015 The Authors. Evolutionary Applications published by John Wiley & Sons Ltd 8 (2015) 597–620 609
Uusi-Heikkil€a et al. Evolutionary legacy of size-selective harvest

significant differences in juvenile growth (which, unlike the
adult growth rate, is a clean measure of growth capacity;
Enberg et al. 2012) could have been caused by our harvest-
ing design where each fish could only spawn once. Hence,
in the random line, larger females, which also carried more
eggs due to the positive relationship of female size and
fecundity (hereafter referred to as fecundity selection), after
harvesting were likely selectively favored, in turn likely cre-
ating a selection pressure on fast juvenile growth rate
despite a nonselective harvest pattern relative to size. Simi-
larly, in the small-selected line, the fastest growing fish
probably contributed more eggs to the next generation and
this maintained positive selection pressure on fast juvenile
growth. Thus, harvesting alone, even when nonselective,
could have had a similarly strong effect as size-selective
harvesting on the evolution of fast juvenile growth through
fecundity selection (Engen et al. 2014). In other words, the
lack of substantial differences in juvenile growth rate
among random and the small lines could be indicative of a
lack of additional evolution of size-selective harvest com-
pared to unselective harvesting. Not having a nonharvest
control precludes our ability to fully understand the rela-
tive effects of selection pressures on juvenile growth rate
caused by unselective versus size-selective harvesting. Nev-
ertheless, our results support theoretical arguments and
empirical data that one should not generally assume that
size-selective harvesting will cause evolution toward low
growth rates (Walters and Martell 2004; van Walraven
et al. 2010; Enberg et al. 2012). In fact, the opposite can
and will occur in many situations because when adult mor-
tality rate is elevated, it is advantageous to be as large as
possible on the first spawning attempt to outpace the high
mortality rate with higher reproductive output (Boukal
et al. 2008; Dunlop et al. 2009; Matsumura et al. 2011), as
in our experiment.
The weak response of juvenile growth rate of small-
selected fish after five generations of size-selective harvest-
ing is in contrast to a groundbreaking experimental study
on harvest-induced selection in Atlantic silversides by Co-
nover and Munch (2002), who reported a steep decline in
(juvenile) growth rate after four generations of size-selec-
tive harvesting. Although silverside and zebrafish share
many life-history and behavioral characteristics (e.g. high
fecundity, small egg size, external fertilization, and school-
ing behavior), silverside are semelparous, while zebrafish
are iteroparous batch spawners. These differences in life-
history strategies could strongly affect energy allocation
patterns and thus juvenile growth. Silverside is a capital-
breeding species that uses stored energy to make large
investments into reproduction, and females typically repro-
Table 4. Outlier loci with the most pronounced, replicable allele frequency divergence among selection treatments and which occur in or close to a
gene with known function.
SNP name Treatment Type Gene name Gene function
rs40907508 Large 6¼ small UTR LysM The chemical reactions and pathways resulting
in the breakdown of macromolecules that form
part of a cell wall
rs40688310 Large and random 6¼ small UTR Tryptophan hydroxylase 2 The chemical reactions and pathways involving
aromatic amino acid family. Controls brain
serotonin synthesis in human and mice
rs40655095 Large 6¼ small S eph receptor B2b The process of introducing a phosphate
group on to a protein. Regulates transcription
rs40856687 Large 6¼ small In atp1b3b Ion transport
rs41238352 Large 6¼ small In col5a1 Collagen formation. Collagen strengthens
and supports many tissues, such as bones
and muscles
rs41141381 UTR Cathepsin L 1 a Involved in embryonic yolk processing
rs40878095 NS Interleukin-1 receptor-associated
kinase 4
Involved in innate immune response system
in zebrafish (Stein et al. 2007)
rs40784742 UTR lims1 Involved in cardiac contraction and heart
beating
rs40769175 UTR Guanylate cyclase activator 1C Involved in calcium signaling in the eye and in
light regulation, circadian rhythms and
stress response (Scholten and Koch 2011,
Wegener et al. 2011)
rs40739415 D Ddt Inner ear development
Also shown are the type of the variant (S, synonymous, UTR, untranslated region, D, downstream gene variant, In, intron variant), gene name, and
gene function.
SNPs in LD with an outlier loci occurring within or close to a gene with a known function are in italics.
610 © 2015 The Authors. Evolutionary Applications published by John Wiley & Sons Ltd 8 (2015) 597–620
Evolutionary legacy of size-selective harvest Uusi-Heikkil€a et al.

duce in years when they have accumulated a threshold level
of stored energy reserves (Bull and Shine 1979). By con-
trast, income breeders, such as zebrafish, spend energy on
reproduction as it is gained (J€onsson 1997). Furthermore,
Conover and Munch (2002) exerted a greater harvesting
pressure (90% per generation) compared to the present
experiment in zebrafish (75% per generation), and this
might have affected the results by increasing the selection
response in juvenile growth rate. Most importantly, how-
ever, in the silverside study, juvenile traits were exclusively
under selection because maturation was induced by photo-
period after the experimental harvesting (Diaz Pauli and
Heino 2014). This experimental procedure channelized
selection differentials on juvenile growth rate, in contrast
to the present case in zebrafish where reproductive traits, in
particular reproductive investment, were allowed to be
under selection in addition to juvenile growth rate. A
recent selection experiment in male guppies (Poecilia retic-
ulata) similarly demonstrated evolution in maturation and
only a minor change in juvenile growth rate after only three
generations of selection (van Wijk et al. 2013). However,
that study differed from ours because it focused on deter-
minately (rather than indeterminately) growing males
(rather than males and females combined). In general,
however, responses of juvenile growth rate to harvesting
vary among species and fisheries, and one should not nec-
essarily expect juvenile growth rate to decline in response
to positively size-selective harvesting (Walters and Martell
2004; Enberg et al. 2012).
Maturation
While reproductive investment increased in response to
selection for small body size in our experiment, we saw lit-
tle differentiation in the maturation schedule (represented
by the probabilistic maturation reaction norm, PMRN;
Heino et al. 2002; Dieckmann and Heino 2007) between
small- and large-selected zebrafish after five generation of
size-selective harvesting. It is noteworthy, however, that
although the PMRNs of small- and large-selected fish lar-
gely overlapped, investigation of the left part of the
PMRNs, that is, the area where food was abundant and
growth rate was high, indicated that small-selected fish
matured somewhat earlier and at smaller size than large-
selected zebrafish (Fig. 2D). This pattern was consistent
with the predicted reduced age at maturation (T) that we
estimated from growth under ad libitum food conditions
(Table 1). The high size- and age-specific maturation prob-
ability of random fish could have been affected by unselec-
tive harvesting. Despite we lacked a nonharvest control, the
evolved differences in the random fish still represent
adaptation to unselective fishing. However, we based the
timing of harvesting on the 50% maturation status of theTable
5.Comparisonofthepopulationgrowth
rate
amongselectionlines
under
differentfishingscen
arios.
Withoutfishing
Withfishing
Small-harvested
Ran
dom
Large-harvested
Large
Small
Large
Small
Large
Small
Large
Small
1.00020
0.99823
0.99991
0.99710
0.99985
0.99915
0.99985
1.00125
(1.00026�
0.00081)
(0.99860�
0.00120)
(1.00040�
0.00295)
(0.99691�
0.00337)
(1.00021�
0.00063)
(0.99917�
0.00081)
(1.00039�
0.00145)
(1.00076�
0.00192)
Values
oflarge-selected
andsm
all-selected
fish
relative
totherandom
fish
areshown.Estimated
uncertainty
boundsareshownin
paren
theses
(mea
n�
SD).
© 2015 The Authors. Evolutionary Applications published by John Wiley & Sons Ltd 8 (2015) 597–620 611
Uusi-Heikkil€a et al. Evolutionary legacy of size-selective harvest

random fish; thus, one should have expected a lower
PMRN intercept compared to the large-selected fish as
indicative of earlier maturation. It is more likely that the
higher size- and age-specific maturation probability in the
random line was caused by the large-size variation com-
pared to large- and small-selected fish. In zebrafish, social
dominance is size dependent (Paull et al. 2010) and in ran-
dom fish the variation (measured as standard deviation) in
body size during the maturation experiment across all ages
was substantially higher (3.0 mm), particularly in growth-
restricted conditions, compared to small- (2.5 mm) and
large-selected fish (2.5 mm). Accordingly, the higher size-
and age-specific maturation probability of the random fish
could have been caused by size-dependent social hierar-
chies or other social factors, which have been shown to
inhibit and delay reproduction for example in guppies
(Diaz Pauli and Heino 2013).
While the evolution of elevated reproductive invest-
ment g (Fig. 2C) and lower L∞ (Table 1) in response
to size-selective harvesting among small-selected fish
was consistent with empirical and theoretical studies
(e.g. Rijnsdorp 1993; Jørgensen et al. 2007; Sharpe and
Hendry 2009; van Walraven et al. 2010), the lack of
substantial difference in the maturation schedule caused
by selective harvesting (as inferred from the PMRN)
may seem counterintuitive. However, our experiment
was based on nonoverlapping generations; hence, each
selected spawner could contribute to the next genera-
tion just once during one spawning event at a fixed
age. Therefore, our experiment prevented early-maturing
fish from benefiting from the increase in spawning fre-
quency, which is a key fitness benefit associated with
early maturation when adults face a high risk of mor-
tality (Poos et al. 2011). The conditions in our experi-
ment were thus artificial and in contrast with the
conditions in the wild. In the wild, fisheries maturation
schedules have been found to readily respond to har-
vest selection as indicated by large changes in the
PMRN’s intercepts and slopes in many stocks, and
these changes were often much more pronounced than
changes in other life-history traits, such as reproductive
investment (Hutchings and Fraser 2008; Sharpe and
Hendry 2009; Devine et al. 2012; Audzijonyte et al.
2013b). Therefore, it is important not to misinterpret
our results as evidence that elevated or size-selective
mortality does not alter the maturation schedule of
exploited fish species. In fact, evolutionary response in
maturation is expected under most exploited conditions
when generations overlap (Devine et al. 2012). Further
experiments with overlapping generations are needed to
fully understand how maturation will evolve in
response to size-selective harvesting (Diaz Pauli and
Heino 2014).
Evolved differences in reproductive success and early life-
history traits
Evolutionary downsizing of adult body size, especially of
females, can have large consequences for offspring produc-
tion and larval viability (Johnson et al. 2011), for example
through direct fecundity decline associated with the reduc-
tions in adult body size or indirectly through size-depen-
dent maternal effects on egg and offspring quality (Walsh
et al. 2006; Arlinghaus et al. 2010; Hixon et al. 2014). In
our study, we demonstrated a positive association between
maternal body size and reproductive output (spawning
probability and fecundity; Table 3). Larger females had a
higher spawning probability, which was exclusively deter-
mined by female body size and not affected by the selection
treatment. Female body size was also positively associated
with fecundity. Large females of many fish species have
been found to have higher amount of energetic resources
to allocate to reproduction compared to small females and
thus are able to spawn more frequently and produce a
higher number of eggs (Hixon et al. 2014), in line with our
findings in zebrafish reported here and elsewhere (Uusi-
Heikkil€a et al. 2010). Maybe somewhat surprisingly egg size
was negatively associated with maternal body size. This
could represent a fundamental egg number – egg size
trade-off and relate to smaller females compensating their
lower fecundity by producing larger eggs (Hendry et al.
2001; Uusi-Heikkil€a et al. 2010). Similarly, the negative
relationship between female size and hatching probability
could be related to the above-mentioned trade-off. How-
ever, the biological relevance of egg size as a trait of egg
quality has been questioned before in zebrafish (Uusi-Heik-
kil€a et al. 2010). Irrespectively, when early life-history or
reproductive traits correlate with the focal trait under selec-
tion (i.e. adult body size), these traits can respond via cor-
related selection response due to genetic covariance
(Munch et al. 2005). We found significant differences in
fecundity (but not in spawning probability) and in several
early life-history traits (egg size, hatching probability, and
larval age at hatch) among the three selection lines even
after statistically controlling for maternal body size, sug-
gesting an evolutionary response unrelated to size-depen-
dent maternal effects.
After just five generations of selection, large-selected fish
produced more and larger eggs compared to small-selected
and random zebrafish, and there was a modest nonsignifi-
cant increase in relative fecundity in small-selected fish
compared to random fish (Fig. 2E). As reproductive invest-
ment increased in the small-selected line compared to the
random line, this likely compensated for the evolution of
smaller adult body size and maintained fecundity high and
largely unaltered with respect to the random line. It is sur-
prising that there were such large differences in fecundity
612 © 2015 The Authors. Evolutionary Applications published by John Wiley & Sons Ltd 8 (2015) 597–620
Evolutionary legacy of size-selective harvest Uusi-Heikkil€a et al.

between random and large-selected zebrafish despite their
similar maximum length (Fig. 2A). These differences could
have been caused, at least partly, by size-dependent domi-
nance hierarchies. In zebrafish, dominance and aggression
are positively associated with increasing body size (Paull
et al. 2010). Larger differences in spawner body sizes in
random females (SD 1.99 mm; range 24–32 mm) com-
pared to large-selected females (SD 1.37 mm; range 27–31 mm) could have maintained higher level of aggression
between females and males in the spawning boxes occupied
with random fish and resulted in lower egg production.
Also, males being larger than females, which by chance
should have been occurred more often in the random line
given the larger size range of the spawners, could have
affected egg production due to female stress caused by male
dominance (D. Bierbach, S. Uusi-Heikkil€a, P. Tscheligi, C.
Wolter and R. Arlinghaus, unpublished data). Further-
more, zebrafish females allocate more reproductive
resources to more preferred, large males (Uusi-Heikkil€a
et al. 2012b), and because in large-selected line males were
generally larger, large-selected females could have released
more eggs toward them compared to random line, where
fewer females were coupled with a large male.
Similar to the fecundity assessments, it is also notewor-
thy that there were no large differences in egg traits
between the small-selected and random fish. Earlier studies
in zebrafish showed that egg size might not be a major
determinant of larval quality (Uusi-Heikkil€a et al. 2010).
Instead, offspring quality may be better indicated by larval
traits such as age at hatch, size at hatch, and the amount of
nutrient reserves (yolk sac volume). Large-selected and ran-
dom fish produced slightly larger larvae than small-selected
fish, but the differences were not statistically significant and
the differences neither translated into shorter hatching time
as an indicator of better larval condition and faster devel-
opment rate (Kimmel et al. 1995). Hence, size-selective
fisheries selection did not substantially alter egg and larval
traits when comparing the small-selected fish with the ran-
dom line. However, random fish had a significantly greater
spawning probability than small-selected fish, suggesting
that the random fish still might have greater reproductive
fitness compared to the small-selected fish.
Despite the lack of differences in early life-history traits
and juvenile growth rate, our results suggest that random
and large-selected fish exhibited faster larval growth than
small-selected fish. This was indicated by the large differ-
ences in body at age 30 days (Fig. 2A) when the growth
experiment started. Despite their similar sizes at hatch
(Table 2), random and large-selected fish were significantly
larger at age 30 days compared to small-selected fish. Fast
larval growth has fitness benefits because it allows larvae to
pass the most vulnerable life-history stages quickly, and
although there might be some costs related to fast growth
(e.g. increased larval mortality; Pepin 1991), it has also
been suggested that even slightly enhanced rates of early
survival and growth can translate into increased probability
of subsequent recruitment (Houde 1987; Hare and Cowen
1997).
Overall, the differences in early life-history traits among
zebrafish selection lines were substantially smaller (and
often nonsignificant) compared to those previously
reported in the silverside study (Walsh et al. 2006). The
inconsistency between the silverside and our study is prob-
ably related to the steeper decline in the body size of
mature silversides after four generations of harvesting and
to the larger difference in body size between small- and
large-selected fish during the spawning trials compared to
our zebrafish study. In fact, large-selected silversides were
more than six times heavier than small-selected ones,
whereas in our study the differences were less than twofold.
Moreover, the differences between these two studies could
again be related to the different life-history strategies of the
two species. Semelparous silversides may invest a much lar-
ger proportion of surplus energy into a single reproductive
season compared to zebrafish, which spread their repro-
ductive effort over multiple batches. Different results
among experimental evolutionary studies reinforce the spe-
cies and environment specificity of FIE, which complicates
the formulation of general predictions about the type and
magnitude of phenotypic changes as a result of size-selec-
tive harvesting (Heino et al. 2013; Laugen et al. 2014).
Evolutionary rate
The degree of decline in adult body size of small-selected
fish in our experiment (7.8% over five generations of selec-
tion) was similar to recent experimental work in male gup-
pies exposed to three generations of size-selective mortality
(7% over three generations; van Wijk et al. 2013) but dif-
fered substantially from the silverside study (25% over four
generations; Conover and Munch 2002). Although the
change in adult body size in our study was significant, such
a subtle phenotypic change in body length might easily go
unnoticed in phenotypic time series from the wild because
fish growth has a large plastic component (Lorenzen and
Enberg 2002). In addition, the rate of evolution of adult
body size that we observed was lower (�0.116 to 0.165
haldanes) than the rate estimated in the male guppy experi-
ment (0.3 haldanes; van Wijk et al. 2013) and much lower
than those estimated for size at maturation from actual
fisheries data (�2.2 to 0.9 haldanes; Devine et al. 2012).
Thus, the phenotypic changes that we observed in the labo-
ratory were conservative relative to the data from the wild,
possibly because the latter include both genetic and plastic
changes and because selection in overlapping generations
may lead to stronger responses in maturation traits than
© 2015 The Authors. Evolutionary Applications published by John Wiley & Sons Ltd 8 (2015) 597–620 613
Uusi-Heikkil€a et al. Evolutionary legacy of size-selective harvest

revealed in our experiment. Our finding underscores an
important dilemma for FIE studies: While FIE can be wide-
spread in exploited systems (Jørgensen et al. 2007; Devine
et al. 2012; Laugen et al. 2014), it is very difficult to detect
when one is confined to just phenotypic analysis, given that
fish life-history traits are extremely plastic and vary in
response to the environment (Kuparinen and Meril€a 2007;
Law 2007). This issue has potentially contributed to the
lack of broad acceptance of FIE among fishers, fisheries
managers, and some fisheries scientists (Jørgensen et al.
2007; Kuparinen and Meril€a 2007; Law 2007; Hilborn and
Minte-Vera 2008).
Harvest-induced genetic changes
In the genetic analyses, we identified 22 outlier loci
responding to divergent selection (Table S6) and 12 out-
liers indicative of balancing selection (Table S7). The out-
liers indicative of balancing selection were linked to genes
involved in processes such as movement of metal ions
within a cell or between cells (Varshney et al. 2013), prote-
olysis, neuronal development (Ahrens et al. 2012), and gly-
copeptide hormone activity (Alderman and Bernier 2007).
These loci with signatures of balancing selection in F7-gen-
eration might have responded to laboratory rearing envi-
ronment (i.e. captivity). Another possibility is that they are
associated with fecundity selection likely experienced by all
experimental lines. Among the 12 loci that exhibited signif-
icant signatures of balancing selection, three can be consid-
ered as candidates for a fecundity selection hypothesis
(Table S7). None of these loci was directly associated with
genes related to reproduction or fecundity (Table S7),
although they could be in linkage disequilibrium (LD) with
genes that are. Despite the fact that the loci with signatures
of balancing selection might have been indicative of adap-
tation to the laboratory environment, at least some of them
might have been false positives. Inaccurate detection of bal-
ancing selection is an inherent weakness of outlier
approaches (Narum and Hess 2011), and the method
employed here, in particular, has been shown to have rela-
tively high type I error rate for balancing selection (Beau-
mont and Nichols 1996).
Our results provide conclusive evidence that size-selec-
tive harvesting can lead to genetic change in timescale rele-
vant to fisheries. We conservatively focused on the eight
outliers that showed parallel divergence in both size-
selected replicates of one selection line. These outliers and
adjacent loci emerged as the strongest candidates of adap-
tive divergence. Five of the eight parallel SNPs occurred
within or close to a gene with a known function (Table 4)
and six of them were in significant LD with a nearby SNP
on the same linkage group (Table 4). Two of the eight out-
liers were in LD with a SNP that occurs within a regulatory
area of a gene associated with zebrafish embryological
metabolism (Tingaud-Sequeira and Cerd�a 2007) and two
other outliers with SNPs occurring within regulatory areas
of the genes or within genes associated with zebrafish circa-
dian rhythms, stress response, and immune system (Stein
et al. 2007; Scholten and Koch 2011; Weger et al. 2011).
These traits might be important in determining adaptive
responses related to fitness in juvenile and adult fish.
Another parallel outlier was located within a regulatory
area of a gene, which has been found to control brain sero-
tonin synthesis in humans and mice. Serotonin is a key ele-
ment in the synthesis of melatonin, a hormone that affects
feeding behavior and aggression in fish (Falc�on et al.
2010). Differences in melatonin production could relate to
differences in fish exploration tendency, which was found
to evolve in our experiment. Denser SNP panels and map-
ping approaches would be needed to test the functional
role of these genes along with other genes with which they
are in LD.
Population-level consequences
The consequences of even subtle phenotypic changes for
populations could potentially be severe. For example, early
maturation and high investment in reproduction cumula-
tively reduce life span (Jørgensen and Fiksen 2010). Indeed,
the estimated instantaneous natural mortality (M) of zebra-
fish was higher among small-selected and random fish than
among large-selected fish. According to our population
model, under positively size-selective fishing (minimum-
length limit scenario), the small-selected fish population
would exhibit a substantially greater population growth
rate than the random and large-selected fish populations.
This finding supports the idea that life-history changes are
compensatory in that they allow individuals (and therefore
populations) to remain productive in the face of positively
size-selective harvest mortality (Hutchings 2009; Matsum-
ura et al. 2011; Kuparinen and Hutchings 2012; Heino
et al. 2013). Hence, from a fisheries perspective, FIE is not
necessarily negative (Eikeset et al. 2013; Jørgensen and
Zimmermann 2015). However, in our model during a sim-
ulated fishing moratorium, the small-selected fish popula-
tion exhibited a substantially lower population growth rate
than the random and large-selected fish populations
(Fig. 2F and Fig. S2). Our modeling results therefore sug-
gest that FIE impedes population recovery during a mora-
torium, which is in line with previous empirical and
theoretical research (Conover et al. 2009; Enberg et al.
2009; Eikeset et al. 2013; Hutchings and Kuparinen 2014;
Kuparinen et al. 2014; Laugen et al. 2014; Marty et al.
2015). Thus, seemingly subtle changes in life-history traits
could have a strong effect on the recovery rate and rebound
potential of exploited fish populations. Moreover, evolu-
614 © 2015 The Authors. Evolutionary Applications published by John Wiley & Sons Ltd 8 (2015) 597–620
Evolutionary legacy of size-selective harvest Uusi-Heikkil€a et al.

tionary downsizing in body size of only 0.1% per year over
50 years has been predicted to reduce biomasses up to 35%
in some species (Audzijonyte et al. 2013a). Hence, FIE
matters for the management and conservation of exploited
fish populations, even if phenotypic responses are modest
and seemingly unimportant at an individual level.
Our population model was simplified by design and
therefore subject to caveats. Although the model included
knowledge of density dependence of vital rates in zebrafish,
it used the dominant eigenvalue of the Leslie matrix as a fit-
ness metric although the dominant Lyapunov exponent has
been suggested as an appropriate measure in density-
dependent population models (Roff 2010). In addition, the
model did not incorporate the potential effects of domi-
nance hierarchies and female differential allocation on
zebrafish reproductive output (Uusi-Heikkil€a et al. 2012b).
Moreover, model results were based on the assumption
that the parameters for growth, maturation, and reproduc-
tive investment that we measured in the laboratory would
translate to field conditions. Our approach to fitting the
biphasic growth model (Lester et al. 2004) allowed us to
predict numerous life-history traits that could be incorpo-
rated into the model. However, our approach assumed that
these traits were optimally adapted to treatment conditions.
Our experimental populations might not have reached an
evolutionary stable state after five generations of selection.
Nevertheless, results of the among-population comparison
of population growth rate should be robust to this omis-
sion because the population model itself does not require
the assumption of evolutionary equilibrium and the esti-
mated population growth rates were rather insensitive to
uncertainty of the parameter values of the Lester growth
model (i.e. growth h, reproductive investment g, and matu-
ration T). Finally, we were not able to perform an evolu-
tionary impact assessment (Jørgensen et al. 2007; Laugen
et al. 2014) in a strict sense because we lacked preharvest
life-history data and were unable to compare population-
level effects over time with and without evolution. We thus
could not evaluate the full implications of FIE. Neverthe-
less, there is value in comparing fitness of evolved life-his-
tories (both small- and large-selected fish) relative to the
random fish, and we can interpret our population dynami-
cal results as showing the effect of size-selective harvesting
relative to unselective harvesting.
Conclusions and implications
Much of the current debate around the prevalence of FIE
has centered on whether the observed phenotypic changes
are genetic (Jørgensen et al. 2007; Kuparinen and Meril€a
2007; Law 2007) and if so, whether these changes matter
for population dynamics and hence management (Hutch-
ings and Fraser 2008; Andersen and Brander 2009; Kupari-
nen and Hutchings 2012; Laugen et al. 2014; Marty et al.
2015). The strength of our experimental study is that it
establishes an unambiguous cause-and-effect relationship
by showing that (i) size-selective harvesting can lead to
genetic and a range of phenotypic changes in contemporary
timescales, (ii) a relatively low evolutionary rate, and (iii)
seemingly subtle phenotypic changes in individual life-his-
tory traits can cumulatively have a strong effect on popula-
tion growth rate and recovery potential. FIE can help to
maintain a productive population while harvesting is inten-
sive, but our results suggest that the same population
adapted to exploitation is expected to recover slowly and
may not reach pre-exploitation levels when fishing is
relaxed. Our work on the evolutionary legacy of size-selec-
tive harvesting thus reinforces the notion that the potential
for FIE and its population-level consequences are of rele-
vance to fisheries management and conservation. Negative
consequences of FIE will be particularly large for stocks that
have been poorly managed in ecological and economic
terms (Eikeset et al. 2013; Jørgensen and Zimmermann
2015) for a long period of time (Neubauer et al. 2013), and
in such cases, it is critical that the ecological and evolution-
ary consequences of fishing are being carefully evaluated
and mitigated.
A straightforward measure that can help curtail the lar-
gely inevitable FIE (Matsumura et al. 2011) is to carefully
control fishing mortality to keep it within ecologically sus-
tainable and economically optimal bounds as shown in two
recent modeling studies in a FIE context (Eikeset et al.
2013; Jørgensen and Zimmermann 2015). A second com-
plementary measure could be to manage the fishing-
induced selectivity, which may produce positive outcomes
from a human perspective (e.g. evolution of large adult
body size as opposed to downsizing of adults, Boukal et al.
2008; Jørgensen et al. 2009; Matsumura et al. 2011). For
example, we found that the population dynamics of large-
selected fish, which evolved large asymptotic adult body
size, did not differ from the random fish in any of the mod-
eled fishing scenarios (Fig. 2F and Fig. S2). Large-selected
fish were exposed to a maximum-size harvest; thus, our
results could be interpreted that saving large fish selects for
life histories that are more similar to unselectively exploited
fish compared to a strictly positively size-selective exploita-
tion common with minimum-length limit regulations and
in most other real fisheries. Previous modeling studies have
also emphasized a superior performance of harvest slots
(i.e. dome-shaped selectivity where large fish and small fish
are saved from harvesting) over standard minimum-length
limits in terms of reducing selection responses in matura-
tion and other traits while facilitating evolution of large
adult size under certain conditions (Hutchings 2009;
Jørgensen et al. 2009; Matsumura et al. 2011). Therefore,
when feasible and desired by stakeholders, the implementa-
© 2015 The Authors. Evolutionary Applications published by John Wiley & Sons Ltd 8 (2015) 597–620 615
Uusi-Heikkil€a et al. Evolutionary legacy of size-selective harvest

tion of maximum-size limits or harvest slots at the expense
of using minimum-size limits could be recommended as an
additional measure of altered selectivity patterns to com-
plement management measures directed at controlling fish-
ing mortality.
Acknowledgements
We thank Karena Kuntze, Asja Vogt, Marcus Ebert, Yvonne
Klaar, Sylvia Werner, Theresa Arlt, Sarah Becker, and Julie
M�enard for fish husbandry, care taking, and data collec-
tion; Rachel Tucker for helping in genotyping the samples;
and Henrik Zwadlo for technical assistance. Funding for
this study was received through the Adaptfish grant to RA
and CW, through the BTypes grant to RA, both funded by
the Gottfried-Wilhelm-Leibniz-Community in the Leibniz-
Competition, through the Besatzfisch grant to RA funded
by the German Federal Ministry for Education and
Research (Grant # 01UU0907), through grant-in-aid for
Scientific Research (C) from the Japanese Ministry of Edu-
cation, Culture, Sports, Science and Technology (Grant #
25440190) to SM and through the Kone Foundation to
SUH. We express our gratitude to two anonymous review-
ers and thank them for their unusually rich and construc-
tive comments that helped to improve the manuscript.
Data archiving statement
Data available from the Dryad Digital Repository: http://
dx.doi.org/10.5061/dryad.r4q8j.
Literature cited
Ahrens, M. B., J. M. Li, M. B. Orger, D. N. Robson, A. F. Schier, F. Eng-
ert, and R. Portugues 2012. Brain-wide neuronal dynamics during
motor adaptation in zebrafish. Nature 485:471–477.
Alderman, S. L., and N. J. Bernier 2007. Localization of corticotropin-
releasing factor, urotensin I, and CRF-binding protein gene expression
in the brain of the zebrafish, Danio rerio. The Journal of Comparative
Neurology 502:783–793.
Allendorf, F. W., P. R. England, G. Luikart, P. A. Ritchie, and N. Ryman
2008. Genetic effects of harvest on wild animal populations. Trends in
Ecology & Evolution 23:327–337.
Al�os, J., M. Palmer, and R. Arlinghaus 2012. Consistent selection
towards low activity phenotypes when catchability depends on
encounters among human predators and fish. PLoS ONE 7:e48030.
Al�os, J., M. Palmer, I. A. Catalan, A. Alonso-Fernandez, G. Basterretxea,
A. Jordi, L. Buttay et al. 2014. Selective exploitation of spatially struc-
tured coastal fish populations by recreational anglers may lead to evo-
lutionary downsizing of adults. Marine Ecology Progress Series
503:219–233.
Al�os, J., M. Palmer, P. Tr�ıas, C. D�ıaz-Gil, R. Arlinghaus, and M.-J.
Rochet 2015. Recreational angling intensity correlates with alteration
of vulnerability to fishing in a carnivorous coastal fish species. Cana-
dian Journal of Fisheries and Aquatic Sciences 72:217–225.
Andersen, K. H., and K. Brander 2009. Expected rate of fisheries-induced
evolution is slow. Proceedings of the National Academy of Sciences of
the United States of America 106:11657–11660.
Antao, T., A. Lopes, R. J. Lopes, A. Beja-Pereira, and G. Luikart 2008.
LOSITAN: a workbench to detect molecular adaptation based on a
Fst-outlier method. BMC Bioinformatics 9:323.
Ariyomo, T. O., and P. J. Watt 2012. The effect of variation in boldness
and aggressiveness on the reproductive success of zebrafish. Animal
Behaviour 83:41–46.
Arlinghaus, R., S. Matsumura, and U. Dieckmann 2009. Quantifying
selection differentials caused by recreational fishing: development of
modeling framework and application to reproductive investment in
pike (Esox lucius). Evolutionary Applications 2:335–355.
Arlinghaus, R., S. Matsumura, and U. Dieckmann 2010. The conserva-
tion and fishery benefits of protecting large pike (Esox lucius L.) by
harvest regulations in recreational fishing. Biological Conservation
143:1444–1459.
Arlinghaus, R., B. Beardmore, C. Riepe, J. Meyerhoff, and T. Pagel
2014. Species-specific preferences of German recreational anglers
for freshwater fishing experiences, with emphasis on the intrinsic
utilities of fish stocking and wild fishes. Journal of Fish Biology
85:1843–1867.
Audzijonyte, A., A. Kuparinen, R. Gorton, and E. A. Fulton 2013a. Eco-
logical consequences of body size decline in harvested fish species:
positive feedback loops in trophic interactions amplify human impact.
Biology Letters 9:20121103.
Audzijonyte, A., A. Kuparinen, and E. A. Fulton 2013b. How fast is fish-
eries-induced evolution? Quantitative analysis of modelling and
empirical studies. Evolutionary Applications 6:585–595.
Barot, S., M. Heino, L. O’Brien, and U. Dieckmann 2004. Estimating
reaction norms for age and size at maturation when age at first repro-
duction is unknown. Evolutionary Ecology Research 6:659–678.
Beaumont, M. A., and R. A. Nichols 1996. Evaluating loci for use in the
genetic analysis of population structure. Proceedings of the Royal
Society B: Biological Sciences 263:1619–1626.
Biro, P. A., and J. R. Post 2008. Rapid depletion of genotypes with fast
growth and bold personality traits from harvested fish populations.
Proceedings of the National Academy of Sciences of the United States
of America 105:2919–2922.
Biro, P. A., and J. A. Stamps 2008. Are animal personality traits linked
to life-history productivity? Trends in Ecology & Evolution 23:361–
368.
Biro, P. A., and J. A. Stamps 2010. Do consistent individual differences
in metabolic rate promote consistent individual differences in behav-
ior? Trends in Ecology & Evolution 25:653–659.
Borrell, B. 2013. Ocean conservation: a big fight over little fish. Nature
493:597–598.
Boukal, D. S., E. S. Dunlop, M. Heino, and U. Dieckmann 2008. Fisher-
ies-induced evolution of body size and other life history traits: the
impact of gear selectivity. ICES CM 2008/F:07.
Browman, R., R. Law, and C. Marshall 2008. The role of fisheries-
induced evolution. Science 320:47.
Bull, J. J., and R. Shine 1979. Iteroparous animals that skip opportunities
for reproduction. American Naturalist 114:296–303.
Bunnefeld, N., and A. Keane 2014. Managing wildlife for ecological,
socioeconomic, and evolutionary sustainability. Proceedings of the
National Academy of Sciences of the United States of America
111:12964–12965.
Conover, D. O., and S. B. Munch 2002. Sustaining fisheries yields over
evolutionary time scales. Science 297:94–96.
616 © 2015 The Authors. Evolutionary Applications published by John Wiley & Sons Ltd 8 (2015) 597–620
Evolutionary legacy of size-selective harvest Uusi-Heikkil€a et al.

Conover, D. O., S. B. Munch, and S. A. Arnott 2009. Reversal of evolu-
tionary downsizing caused by selective harvest of large fish. Proceed-
ings of the Royal Society B: Biological Sciences 267:2015–2020.
Conover, D. O., and H. Baumann 2009. The role of experiments in
understanding fishery-induced evolution. Evolutionary Applications
2:276–290.
Cote, J., S. Fogarty, K. Weinersmith, T. Brodin, and A. Sih 2010. Person-
ality traits and dispersal tendency in the invasive mosquitofish (Gam-
busia affinis). Proceedings of the Royal Society B: Biological Sciences
277:1571–1579.
Cuveliers, E. L., F. A. M. Volckaert, A. D. Rijnsdorp, M. H. D. Larmu-
seau, and G. E. Maes 2011. Temporal genetic stability and high effec-
tive population size despite fisheries-induced life-history trait
evolution in the North Sea sole. Molecular Ecology 20:3555–3568.
Darimont, C. T., S. M. Carlson, M. T. Kinnison, P. C. Paquet, T. E.
Reimchen, and C. C. Wilmers 2009. Human predators outpace other
agents of trait change in the wild. Proceedings of the National Acad-
emy of Sciences of the United States of America 106:952–954.
de Roos, A. M., and L. Persson 2002. Size-dependent life-history traits
promote catastrophic collapses of top predators. Proceedings of the
National Academy of Sciences of the United States of America
99:12907–12912.
Devine, J. A., P. J. Wright, H. E. Pardoe, M. Heino, and D. J. Fraser
2012. Comparing rates of contemporary evolution in life-history traits
for exploited fish stocks. Canadian Journal of Fisheries and Aquatic
Sciences 69:1105–1120.
Diaz Pauli, B., and M. Heino 2013. The importance of social dimension
and maturation stage for the probabilistic maturation reaction norm
in Poecilia reticulata. Journal of Evolutionary Biology 26:2184–2196.
Diaz Pauli, B., and M. Heino 2014. What can selection experiments teach
us about fisheries-induced evolution? Biological Journal of the Lin-
nean Society 111:485–503.
Diaz Pauli, B., M. Wiech, M. Heino, and A. C. Utne-Palm 2015. Oppo-
site selection on behavioral types by active and passive fishing gears in
a simulated guppy Poecilia reticulata fishery. Journal of Fish Biology
86:1030–1045.
Dieckmann, U., and M. Heino 2007. Probabilistic maturation reaction
norms: their history, strengths, and limitations. Marine Ecology Pro-
gress Series 335:253–269.
Dunlop, E. S., M. Heino, and U. Dieckmann 2009. Eco-genetic modeling
of contemporary life-history evolution. Ecological Applications
19:1815–1834.
Dupont-Prinet, A., B. Chatain, L. Grima, M. Vandeputte, G. Claireaux,
and D. J. McKenzie 2010. Physiological mechanisms underlying a
trade-off between growth rate and tolerance of feed deprivation in the
European sea bass (Dicentrarchus labrax). The Journal of Experimen-
tal Biology 213:1143–1152.
Eikeset, A. M., A. Richter, E. S. Dunlop, U. Dieckmann, and N. Chr.
Stenseth 2013. Economic repercussions of fisheries-induced evolution.
Proceedings of the National Academy of Sciences of the United States
of America 110:12259–12264.
Enberg, K., C. Jørgensen, E. S. Dunlop, M. Heino, and U. Dieckmann
2009. Implications of fisheries-induced evolution for stock rebuilding
and recovery. Evolutionary Applications 2:394–414.
Enberg, K., C. Jørgensen, E. S. Dunlop, Ø. Varpe, D. S. Boukal, L. Baulier,
S. Eliassen et al. 2012. Fishing-induced evolution of growth: concepts,
mechanisms and the empirical evidence. Marine Ecology 33:1–25.
Engen, S., R. Lande, and B.-E. Saether 2014. Evolutionary consequences
of nonselective harvesting in density-dependent populations. Ameri-
can Naturalist 184:714–726.
Falc�on, J., H. Migaud, J. A. Mu~noz-Cueto, and M. Carrillo 2010. Current
knowledge on the melatonin system in Teleost fish. General and Com-
parative Endocrinology 165:469–482.
Haldane, J. B. S. 1949. Suggestions as to quantitative measurement of
rates of evolution. Evolution 3:51–56.
Hare, J. A., and R. K. Cowen 1997. Size, growth, development, and sur-
vival of the planktonic larvae of Pomatomus saltatrix (Pisces: Pom-
atomidae). Ecology 78:2415–2431.
Haugen, T. O., I. J. Winfield, L. A. Vøllestad, J. M. Fletcher, J. B. James,
and N. Chr. Stenseth 2007. Density dependence and density indepen-
dence in the demography and dispersal of pike over four decades. Eco-
logical Monographs 77:483–502.
Heino, M., and O. R. Godø 2002. Fisheries-induced selection pressures
in the context of sustainable fisheries. Bulletin of Marine Science
70:639–656.
Heino, M., U. Dieckmann, and O. R. Godø 2002. Measuring probabilis-
tic reaction norms for age and size at matuartion. Evolution
56:669–678.
Heino, M., L. Baulier, D. S. Boukal, B. Ernande, F. D. Johnston, F. M.
Mollet, H. Pardoe et al. 2013. Can fisheries-induced evolution shift
reference points for fisheries management? ICES Journal of Marine
Science 70:707–721.
Hendry, A. P., T. Day, and A. B. Cooper 2001. Optimal size and number
of propagules: allowance for discrete stages and effects of maternal size
on reproductive output and offspring fitness. American Naturalist
157:387–407.
Hilborn, R., and C. V. Minte-Vera 2008. Fisheries-induced changes in
growth rates in marine fisheries: are they significant? Bulletin of Mar-
ine Science 83:95–105.
Hilborn, R., and K. Stokes 2010. Defining overfished stocks: have we lost
the plot? Fisheries 35:113–120.
Hixon, M. A., D. W. Johnson, and S. M. Sogard 2014. BOFFFFs: on the
importance of conserving old-growth age structure in fishery popula-
tions. ICES Journal of Marine Science 71:2171–2185.
Houde, E. D. 1987. Fish early life dynamics and recruitment variability.
American Fisheries Society Symposium 2:17–29.
Hutchings, J. A., and D. J. Fraser 2008. The nature of fisheries- and farm-
ing-induced evolution. Molecular Ecology 17:294–313.
Hutchings, J. A. 2009. Avoidance of fisheries-induced evolution: man-
agement implications for catch selectivity and limit reference points.
Evolutionary Applications 2:324–334.
Hutchings, J. A., and A. Kuparinen 2014. Ghosts of fisheries-induced
depletions: do they haunt us still? ICES Journal of Marine Sciences
71:1467–1473.
Hutter, S., D. J. Penn, S. Magee, and S. M. Zala 2010. Reproductive
behaviour of wild zebrafish (Danio rerio) in large tanks. Behaviour
147:641–660.
H€ark€onen, L., P. Hyv€arinen, J. Paappanen, and A. Vainikka 2014.
Explorative behavior increases vulnerability to angling in hatchery-
reared brown trout (Salmo trutta). Canadian Journal of Fisheries and
Aquatic Sciences 71:1900–1909.
Johnson, D. W., M. R. Christie, J. Moye, and M. A. Hixon 2011. Genetic
correlations between adults and larvae in a marine fish: potential
effects of fishery selection on population replenishment. Evolutionary
Applications 4:621–633.
J€onsson, K. I. 1997. Capital and income breeding as alternative tactics of
resource use in reproduction. Oikos 78:57–66.
Jørgensen, C., K. Enberg, E. S. Dunlop, R. Arlinghaus, D. S. Boukal, K.
Brander, B. Ernande, et al. 2007. Managing evolving fish stocks. Sci-
ence 318:1247–1248.
© 2015 The Authors. Evolutionary Applications published by John Wiley & Sons Ltd 8 (2015) 597–620 617
Uusi-Heikkil€a et al. Evolutionary legacy of size-selective harvest
Jørgensen, C., K. Enberg, E. S. Dunlop, R. Arlinghaus, D. S. Boukal, K.
Brander, B. Ernande, et al. 2008. The role of fisheries-induced evolu-
tion – response. Science 320:48–50.
Jørgensen, C., B. Ernande, and Ø. Fiksen 2009. Size-selective fishing gear
and life history evolution in the Northeast Arctic cod. Evolutionary
Applications 2:356–370.
Jørgensen, C., and Ø. Fiksen 2010. Modelling fishing-induced adapta-
tions and consequences for natural mortality. Canadian Journal of
Fisheries and Aquatic Sciences 67:1086–1097.
Jørgensen, C., and R. E. Holt 2013. Natural mortality: its ecology, how it
shapes fish life histories, and why it may be increased by fishing. Jour-
nal of Sea Research 75:8–18.
Jørgensen, C., and F. Zimmermann 2015. Bioeconomic consequences of
fishing-induced evolution: a model predicts limited impact on net
present value. Canadian Journal of Fisheries and Aquatic Sciences
72:612–624.
Kimmel, C. B., W. W. Ballard, S. R. Kimmel, B. Ullman, and T. F. Schil-
ling 1995. Stages of embryonic development of the zebrafish. Develop-
mental Dynamics 203:253–310.
Klefoth, T., C. Skov, J. Krause, and R. Arlinghaus 2012. The role of eco-
logical context and predation risk-stimuli in revealing the true picture
about the genetic basis of boldness evolution in fish. Behavioral Ecol-
ogy and Sociobiology 66:547–559.
Kuparinen, A., and J. Meril€a 2007. Detecting and managing fisheries-
induced evolution. Trends in Ecology & Evolution 22:652–659.
Kuparinen, A., and J. A. Hutchings 2012. Consequences of fisheries-
induced evolution for population productivity and recovery potential.
Proceedings of the Royal Society B: Biological Sciences 279:2571–
2579.
Kuparinen, A., N. Chr. Stenseth, and J. A. Hutchings 2014. Fundamental
population-productivity relationships can be modified through den-
sity-dependent feedbacks of life-history evolution. Evolutionary
Applications 7:1218–1225.
Laugen, A. T., G. H. Engelhard, R. Whitlock, R. Arlinghaus, D. J. Dankel,
E. S. Dunlop, A. M. Eikeset et al. 2014. Evolutionary impact assess-
ment: accounting for evolutionary consequences of fishing in an eco-
system approach to fisheries management. Fish and Fisheries
15:65–96.
Law, R. 2007. Fisheries-induced evolution: present status and future
directions. Marine Ecology Progress Series 335:271–277.
Law, R., and D. R. Grey 1989. Evolution of yields from populations with
age-specific cropping. Evolutionary Ecology 3:343–359.
Lester, N. P., B. J. Shuter, and P. A. Abrams 2004. Interpreting the von
Bertalanffy model of somatic growth in fishes: the cost of reproduc-
tion. Proceedings of the Royal Society B: Biological Sciences
271:1625–1631.
Lewin, W. C., R. Arlinghaus, and T. Mehner 2006. Documented
and potential biological impacts of recreational fishing: insights
for management and conservation. Reviews in Fisheries Science
14:305–367.
Lorenzen, K., and K. Enberg 2002. Density-dependent growth as a key
mechanism in the regulation of fish populations: evidence from
among-population comparisons. Proceedings of the Royal Society B:
Biological Sciences 269:49–54.
Marty, L., U. Dieckmann, and B. Ernande 2015. Fisheries-induced
neutral and adaptive evolution in exploited fish populations and con-
sequences for their adaptive potential. Evolutionary Applications
8:47–63.
Matsumura, S., R. Arlinghaus, and U. Dieckmann 2011. Assessing evolu-
tionary consequences of size-selective recreational fishing on multiple
life-history traits, with an application to Northern pike (Esox lucius).
Evolutionary Ecology 25:711–735.
Matsumura, S., R. Arlinghaus, and U. Dieckmann 2012. Standardi-
zing selection strengths to study selection in the wild: a critical
comparison and suggestions for the future. BioScience 62:1039–
1054.
McAllister, M. K., and R. M. Peterman 1992. Decision analysis of a
large-scale fishing experiment designed to test for a genetic effect of
size-selective fishing on British Columbia pink salmon (Oncorhynchus
gorbuscha). Canadian Journal of Fisheries and Aquatic Sciences
49:1305–1314.
Mousseau, T. A., and D. A. Roff 1987. Natural selection and the herita-
bility of fitness components. Heredity 59:181–197.
Munch, S. B., M. R. Walsh, and D. O. Conover 2005. Harvest selection,
genetic correlations and evolutionary changes in recruitment: one less
thing to worry about? Canadian Journal of Fisheries and Aquatic Sci-
ences 62:802–810.
Naish, K. A., and J. J. Hard 2008. Bridging the gap between the genotype
and the phenotype: linking genetic variation, selection and adaptation
in fishes. Fish and Fisheries 9:396–422.
Narum, S. R., and J. E. Hess 2011. Comparison of FST outlier tests for
SNP loci under selection. Molecular Ecology Resources 11(Suppl.
1):184–194.
Neubauer, P., O. P. Jensen, J. A. Hutchings, and J. K. Baum 2013. Resil-
ience and recovery of overexploited marine populations. Science
340:347–349.
N�ussle, S., C. N. Bornand, and C. Wedekind 2009. Fishery-induced selec-
tion on an Alpine whitefish: quantifying genetic and environmental
effects on individual growth rate. Evolutionary Applications 2:200–
208.
Olsen, E., M. Heino, G. R. Lilly, M. J. Morgan, J. Brattey, B. Ernande,
and U. Dieckmann 2004. Maturation trends indicative of rapid evolu-
tion preceded the collapse of northern cod. Nature 428:932–935.
Palkovacs, E. P., M. T. Kinnison, C. Correa, C. M. Dalton, and A. P.
Hendry 2012. Fates beyond traits: ecological consequences of human-
induced trait change. Evolutionary Applications 5:183–191.
Paull, G. C., A. L. Filby, H. G. Giddins, T. S. Coe, P. B. Hamilton, and C.
R. Tyler 2010. Dominance hierarchies in zebrafish (Danio rerio) and
their relationship with reproductive success. Zebrafish 7:109–117.
Pepin, P. 1991. Effect of temperature and size on development,
mortality, and survival rates of the pelagic early life history stages of
marine fish. Canadian Journal of Fisheries and Aquatic Sciences
48:503–518.
P�erez-Rodr�ıgues, A., M. J. Morgan, M. Koen-Alonso, and F. Saborido-
Rey 2013. Disentangling genetic change from phenotypic response in
reproductive parameters of Flemish Cap cod Gadus morhua. Fisheries
Research 138:62–70.
Peters, R. H. 1983. The Ecological Implications of Body Size. American
Journal of Physical Anthropology, Vol. 66. Cambridge University Press,
Cambridge.
Philipp, D. P., S. J. Cooke, J. E. Claussen, J. B. Koppelman, C. D. Suski,
and D. P. Burkett 2009. Selection for vulnerability to angling in large-
mouth bass. Transactions of the American Fisheries Society 138:189–
199.
Policansky, D. 1993. Fishing as a cause of evolution in fishes. In T. K.
Stokes, J. M. McGlade, and R. Law, eds. The Exploitation of Evolving
Resources, pp. 2–18. Springer-Verlag, Heidelberg, Germany.
Poos, J. J.,�A. Br€annstr€om, and U. Dieckmann 2011. Harvest-induced
maturation evolution under different life-history trade-offs and har-
vesting regimes. Journal of Theoretical Biology 279:102–112.
618 © 2015 The Authors. Evolutionary Applications published by John Wiley & Sons Ltd 8 (2015) 597–620
Evolutionary legacy of size-selective harvest Uusi-Heikkil€a et al.

Rijnsdorp, A. D. 1993. Fisheries as a large-scale experiment on life-his-
tory evolution, disentangling phenotypic and genetic effects in
changes in maturation and reproduction of North Sea place, Pleuro-
nectes platessa L. Oecologia 96:391–401.
Roff, D. A. 2010. Modelling Evolution – An Introduction to Numerical
Methods. Oxford University Press, Oxford.
Rutter, C. 1902. Natural history of the Quinnat salmon. A Report on
Investigations in the Sacramento River, 1886–1901. Bulletin of the
U.S. Fisheries Commission 22:65–141.
Salinas, S., K. O. Perez, T. A. Duffy, S. J. Sabatino, L. A. Hice, S. B.
Munch, and D. O. Conover. 2012. The response of correlated traits
following cessation of fishery-induced selection. Evolutionary Appli-
cations 5:657–663.
Scholten, A., and K. W. Koch 2011. Differential calcium signaling by
cone specific guanylate cyclase-activating proteins from the zebrafish
retina. PLoS ONE 6:e23117.
Sharpe, D. M. T., and A. P. Hendry 2009. Life history change in com-
mercially exploited fish stocks: an analysis of trends across studies.
Evolutionary Applications 2:260–275.
Smith, B. R., and D. T. Blumstein 2007. Fitness consequences of person-
ality: a meta-analysis. Behavioral Ecology 19:448–455.
Stamps, J. A. 2007. Growth-mortality tradeoffs and ‘personality traits’ in
animals. Ecology Letters 10:355–363.
Stearns, S. C. 1992. The Evolution of Life Histories. Oxford University
Press, Oxford.
Stein, C., M. Caccamo, G. Laird, and M. Leptin 2007. Conservation
and divergence of gene families encoding components of
innate immune response systems in zebrafish. Genome Biology 8:
R251.
Sutter, D. A. H., C. D. Suski, D. P. Philipp, T. Klefoth, D. H. Wahl, P.
Kersten, S. J. Cooke et al. 2012. Recreational fishing selectively cap-
tures individuals with the highest fitness potential. Proceedings of the
National Academy of Sciences of the United States of America
109:20960–20965.
Swain, D. P., A. F. Sinclair, and J. M. Hanson 2007. Evolutionary
response to size-selective mortality in an exploited fish population.
Proceedings of the Royal Society B: Biological Sciences
274:1015–1022.
Th�eriault, V., E. S. Dunlop, U. Dieckmann, L. Bernatchez, and J. J. Dod-
son 2008. The impact of fishing-induced mortality on the evolution of
alternative life-history tactics in brook charr. Evolutionary Applica-
tions 1:409–423.
Therkildsen, N., E. E. Nilsen, D. P. Swain, and J. S. Pedersen 2010. Large
effective population size and temporal genetic stability in Atlantic cod
(Gadus morhua) in the southern Gulf of St. Lawrence. Canadian Jour-
nal of Fisheries and Aquatic Sciences 67:1585–1595.
Tingaud-Sequeira, A., and J. Cerd�a 2007. Phylogenetic relationships and
gene expression pattern of three different cathepsin L (Ctsl) isoforms
in zebrafish: Ctsla is the putative yolk processing enzyme. Gene
386:98–106.
Uusi-Heikkil€a, S., C. Wolter, T. Klefoth, and R. Arlinghaus 2008. A
behavioral perspective on fishing-induced evolution. Trends in Ecol-
ogy & Evolution 23:419–421.
Uusi-Heikkil€a, S., C. Wolter, T. Meinelt, and R. Arlinghaus 2010. Size-
dependent reproductive success of wild zebrafish Danio rerio in the
laboratory. Journal of Fish Biology 77:552–569.
Uusi-Heikkil€a, S., A. Kuparinen, C. Wolter, T. Meinelt, A. C. O’Toole,
and R. Arlinghaus 2011. Experimental assessment of the probabilistic
maturation reaction norm: condition matters. Proceedings of the
Royal Society B: Biological Sciences 278:709–717.
Uusi-Heikkil€a, S., A. Kuparinen, C. Wolter, T. Meinelt, and R. Arling-
haus 2012a. Paternal body size affects reproductive success in labora-
tory-held zebrafish (Danio rerio). Environmental Biology of Fishes
93:461–474.
Uusi-Heikkil€a, S., L. B€ockenhoff, C. Wolter, and R. Arlinghaus 2012b.
Differential allocation by female zebrafish (Danio rerio) to different-
sized males - an example in a fish species lacking parental care. PLoS
ONE 7:e48317.
Walsh, M. R., S. B. Munch, S. Chiba, and D. O. Conover 2006. Maladap-
tive changes in multiple traits caused by fishing: impediments to pop-
ulation recovery. Ecology Letters 9:142–148.
Walters, C. J., and S. J. D. Martell 2004. Fisheries Ecology and Manage-
ment. Princeton University Press, Princeton.
van Walraven, L., F. M. Mollet, C. J. G. van Damme, and A. D. Rijnsdorp
2010. Fisheries-induced evolution in growth, maturation and repro-
ductive investment of the sexually dimorphic North Sea plaice (Pleu-
ronectes platessa L.). Journal of Sea Reasearch 64:84–93.
van Wijk, S. J., M. I. Taylor, S. Creer, C. Dreyer, F. M. Rodrigues, I. W.
Ramnarine, C. van Oosterhout et al. 2013. Experimental harvesting of
fish populations drives genetically based shifts in body size and matu-
ration. Frontiers in Ecology and the Environment 11:181–187.
Varshney, G. K., J. Lu, D. E. Gildea, H. Huang, W. Pei, Z. Yang, S. C.
Huang et al. 2013. A large-scale zebrafish gene knockout resource for
the genome-wide study of gene function. Genome Research 23:727–735.
Weger, B. D., M. Sahinbas, G. W. Otto, P. Mracek, O. Armant, D. Dolle,
K. Lahiri et al. 2011. The light responsive transcriptome of the zebra-
fish: function and regulation. PLoS ONE 6:e17080.
Whiteley, A. R., A. Bhat, E. P. Martins, R. L. Mayden, M. Arunachalam,
S. Uusi-Heikkil€a, A. T. Ahmed et al. 2011. Population genomics of
wild and laboratory zebrafish (Danio rerio). Molecular Ecology
20:4259–4276.
Vital, C., and E. P. Martins 2011. Strain differences in zebrafish (Danio
rerio) social roles and their impact on group task performance. Jour-
nal of Comparative Psychology 125:278–285.
Worm, B., R. Hilborn, J. K. Baum, T. A. Branch, J. S. Collie, C. Costello,
M. J. Fogarty et al. 2009. Rebuilding global fisheries. Science 325:578–
585.
Supporting Information
Additional Supporting Information may be found in the online version
of this article:
Figure S1. Outlier loci, which showed no replicable (consistent)
response to selection but were detected by the outlier test (FDist
method).
Figure S2. Three typical size-selective fishing scenarios (see Table S10
for the parameter values).
Figure S3. Simulated population-level consequences of life-history
changes induced by size-selective harvesting.
Figure S4. Sensitivity of the population growth rate ʎ.Appendix S1 Methods and results.
Table S1. Final growth and condition models with their covariates
and t-statistics for each selection line.
Table S2. Maturity ogive models for each selection line.
Table S3. Differences in PC1 score (estimated marginal means)
derived from the final model among the selection lines.
Table S4. The SNP name, chromosome location, map position (Mb),
FST-value, heterozygosity and the adjusted P-value (for empirical FSThigher than simulated FST, false discovery rate set at 0.1, at 95 % confi-
dence interval level) of the outlier loci detected using the FDist method.
© 2015 The Authors. Evolutionary Applications published by John Wiley & Sons Ltd 8 (2015) 597–620 619
Uusi-Heikkil€a et al. Evolutionary legacy of size-selective harvest

Table S5. Outlier loci responding to balancing selection: type of the
variant (UTR = untranslated region, D = downstream gene variant,
I = inter-genic variant, In = intron variant), gene name, and gene func-
tion.
Table S6. Outlier loci with the most pronounced, replicable allele fre-
quency divergence among selection treatments.
Table S7. Outlier SNPs that were in linkage disequilibrium (LD) with
a nearby SNP (LD SNP) and the physical distance in kilobase pairs
between them.
Table S8. Maturation- and growth-related parameters estimated for
each treatment based on the biphasic growth model (Lester et al. 2004).
Table S9. Model parameters used in the zebrafish Leslie-matrix
model.
Table S10. Three typical size-selective fishing scenarios.
620 © 2015 The Authors. Evolutionary Applications published by John Wiley & Sons Ltd 8 (2015) 597–620
Evolutionary legacy of size-selective harvest Uusi-Heikkil€a et al.

1
SUPPORTING INFORMATION
METHODS AND RESULTS
Zebrafish rearing conditions – S1
We used wild zebrafish in our experiment to ensure maximum genetic variation
(heterozygosity across 384 single nucleotide polymorphisms was 0.42, n = 60) and to
minimize the possibility that the fish had previously experienced domestication selection or
inbreeding. Throughout the rearing phase for each generation, all six populations (three
selection lines with two replicates each, N = 450 per replicate) were maintained in separate
tanks (volume 320 l) in a light-dark (14L:10D) and temperature-controlled (mean ± sd, 27.01
°C ± 1.23 °C) recirculation facility with an inflow rate of 0.25 l s-1
. The recirculation system
was run with tap water and the water quality was controlled weekly for pH (8.41 ± 0.11),
nitrite (< 0.3 mg l-1
) and ammonium (< 0.05 mg l-1
), and daily for oxygen levels (8.00 ± 0.21
mg l-1
). The stocking density per holding tank was 0.9 ± 0.2 individuals l-1
. All individuals
were reared in identical densities to control for density effects and to minimize the potential
bias of dominance hierarchies on feeding success. Fish were fed ad libitum five times a day
with Artemia nauplii and commercial flake food (TetraMin; 47 % protein, 10 % fat).
Hatchlings were fed ad libitum seven times per day with commercial food for larval fish (Sera
Micron, 52 % protein, 7 % fat) until they were large enough to feed Artemia nauplii (at age 15
d).
Life-time growth and analysis of life-history traits – S2
Methods
To estimate the evolutionary response of life-time growth under ad libitum feeding, we
stocked F9-generation offspring (selection halted for three generations) from each selection
line into three liter rearing boxes at age 20 days (d). The density was standardized to 10
individuals per box (0.3 individuals l-1
). We established 20 replicate boxes for the large fish,

2
20 boxes for the small fish and 20 boxes for the random fish. However, only 16 replicate
boxes for the large, 14 for the small, and 18 for the random fish were used when modeling
growth because the remaining replicate boxes experienced high rates of handling mortality
and / or fish escapees. We measured the fish every ~15 d between 30 and 210 d of age. We
could not accurately measure fish larvae younger than 30 d without causing injury or death.
Growth data were combined for sexes because we could not determine sex noninvasively in
juveniles. Combined sexes should not bias our growth estimates because of low sexual
dimorphism in zebrafish body size (Spence and Smith 2006).
To estimate key life-history traits, we used a function-valued trait approach to infer juvenile
growth rate (h), reproductive investment (g) and maximum asymptotic length (L∞) from
treatment- and replicate-specific growth curves. To this end, we applied the biphasic growth
model (Lester et al. 2004)
to length-at-age data (females and males combined) in each
experimental population. The biphasic growth model comprises two functions that together
account for the change in growth that occurs with maturation (i.e., investment in reproduction,
g): a linear function that describes immature growth, and a widely-used von Bertalanffy
(asymptotic) function that describes adult growth. Because we did not know the age (T) at
which fish in each selection line began to invest in reproduction, we fitted the biphasic model
to all integer values of T over a plausible range and then selected the fit that minimized the
residual sum of squares. For each integer value of T, we estimated all other life-history
parameters as follows. First, we fitted a linear model to the supposed immature data points to
estimate immature growth rate (h; mm d-1
) and the x-intercept (t1; d). We then used published
equations (Lester et al. 2004) to predict i) daily instantaneous mortality rate (M) from T and t1,
ii) daily investment in reproduction (g) from M; iii) asymptotic length (L∞; mm) from h and g;
iv) the exponential rate at which the average individual approaches L∞ (k) from g; and v) the
x-intercept of adult growth (t0) from g, T, and t1. This approach to predicting life-history traits

3
from model parameters assumed that life-history parameters in each selection line were
optimally adapted to treatment conditions.
We used the output from the biphasic growth model to test for evolved differences in life-
history traits (h, g, T, L∞ and M) among the selection lines. The response variable in each
analysis was the average, replicate box-specific value predicted by the biphasic growth model.
For all statistical analyses, we used linear mixed-effects model and set selection line as a
predictive variable and selection line replicate as a random variable.
Literature
Lester, N. P., B. J. Shuter, and P. A. Abrams 2004. Interpreting the von Bertalanffy model of
somatic growth in fishes: the cost of reproduction. Proceedings of the Royal Society B:
Biological Sciences 271:1625–31. doi:10.1098/rspb.2004.2778.
Spence, R., and C. Smith. 2006. Mating preference of female zebrafish, Danio rerio, in
relation to male dominance. Behavioral Ecology 17: 779–83. doi:10.1093/beheco/arl016.
Probabilistic maturation reaction norm (PMRN) – S3
Methods
To estimate PMRNs for each selection line, we conducted a maturation experiment, similar to
our previous work (Uusi-Heikkilä et al. 2011), using offspring from the F8-generation
(selection halted for two generations). The larvae were reared in the five liter rearing boxes
for the first 20 d after which they were transferred into 45 glass aquaria (volume 45 l) in a
recirculation holding facility. We established five replicate aquaria per selection line per diet.
Fish were reared in equal densities (1.3 individuals per liter) and environmental conditions
until age 85 d, after which we induced variation in growth and maturation by applying one of
three feeding regimes: 1 %, 2 % and 4 % dry food of the body weight daily. Thereby, we

4
“sampled” fish from different portions of the probabilistic maturation reaction norm (PMRN)
to derive the full plasticity in maturation timing as a function of growth variation. Fish were
exposed to these diets until age 190 d. Every 10 d we lethally assessed the SL and maturation
status of approximately 15 randomly sampled females from each aquarium (Uusi-Heikkilä et
al. 2011).
To estimate the PMRNs, we used the demographic estimation method (Barot et al. 2004),
which involves estimation of maturity ogives, modeling growth rates and estimation of the
PMRNs based on the maturity ogives and growth model. We estimated the maturity ogives
for each selection line (treatment replicates were pooled because they did not differ
significantly from one another) across all diets by including age, length, and relative condition
factor (Uusi-Heikkilä et al. 2011) as predictor variables and diet as a random variable:
o(a, l, c, d) ~ a + l + c + d
In the ogive model (o), age (a) in days, standard length (l) in mm and relative condition factor
(c) were continuous variables and the random effect, diet (d), was a categorical variable. The
model was additionally tested with the quadratic terms of age (a2), length (l
2) and relative
condition factor (c2) and with the interactions of age, length and relative condition.
Growth in length was modeled with linear multiple regressions with age as a predictor
variable and diet as a random variable. Relative condition was modeled similarly by using
age, length and their interactions as predictor variables, and diet as a random variable. In
growth and condition models, the quadratic and cubic terms of age (a2, a
3) and length (l
2, l
3)
were added to the model to test the non-linearity of the predicted relationships.
The PMRNs were constructed for each selection line separately using the following
estimation model:
m(a, l, c) = o(a, l, c, d) – o(a[i] – a[i – 1], l – Δl, c - Δc) / 1 – o(a[i] – a[i – 1], l – Δl, c – Δc),
where m refers to the probability of maturing. It was calculated from the maturity ogive, o(a,
l, c, d) and the mean age-specific growth increments in length (Δl) and the mean age-specific

5
changes in relative condition (Δc), which were included from the growth and condition
models (Uusi-Heikkilä et al. 2011).
Results
During the maturation experiment, independent of the diet to which the fish were exposed in
order to induce environmental differences in growth, 19.7 % of the small-selected fish
matured (58 females), whereas 44.9 % (106 females) of the large-selected and 28.4 % of the
random fish (74 females) matured. When pooled across the diets and the experimental period
of the maturation experiment (104–186 d), the small-selected fish were on average smaller
(17.1 ± 0.17 mm; mean ± SE) than the large-selected (19.3 ± 0.21 mm) and random fish (18.6
± 0.20 mm), and the small-selected fish also had lower relative condition factor (1.042 ±
0.026) compared to the random (1.097 ± 0.021) and large-selected fish (1.092 ± 0.037).
Unlike among the small-selected and random fish, the growth of the large-selected fish was
not linear. This was indicated by the significant effect of quadratic and cubic terms of age (a2,
a3) in the growth model (Table S1). The relative condition factor of the large-selected fish
decreased with length and was not affected by age (Table S1), whereas among the small-
selected and random fish the relative condition seemed to be affected by both age and length
(indicated by the significant age × length interaction; Table S1).

6
Table S1. Final growth and condition models with their covariates and t-statistics for each
selection line.
GROWTH
Selection line
Large
Random
Small
Variable
Age
Age2
Age3
Age
Age
t-value (df)
-1.644 (230)
1.844 (230)
-1.980 (230)
6.670 (257)
7.227 (290)
P-valuea
0.1016
0.0665
0.0489
<0.0001
<0.0001
RELATIVE CONDITION
Large
Random
Small
Length
Age
Length
Age × Length
Age
Length
Age × Length
-2.014 (232)
-3.643 (255)
-5.637 (255)
3.752 (255)
-3.167 (288)
-4.125 (288)
3.207 (288)
0.0452
<0.0001
<0.0001
<0.0001
0.0017
<0.0001
0.0015 a Derived from the linear mixed-effects model fit by maximum likelihood.
Table S2. Maturity ogive models for each selection line.
Selection line Variable χ2-value
a (df)
P-value
b
Large
Random
Small
Age
Length
Condition
Age
Length
Condition
Age
Length
Condition
11.768 (4,5)
38.420 (4,5)
0.7700 (4,5)
33.864 (4,5)
24.316 (4,5)
7.1502 (4,5)
7.1676 (4,5)
41.381 (4,5)
15.505 (4,5)
0.0006
<0.0001
0.3802
<0.0001
<0.0001
0.0075
0.0074
<0.0001
<0.0001 a χ
2-value from the deletion of the variable from the full model.
b P-values derived from the χ
2 –statistics.
Literature
Barot, S., M. Heino, L. O’Brien, and U. Dieckmann 2004. Estimating reaction norms for age
and size at maturation when age at first reproduction is unknown. Evolutionary Ecology
Research 6:659–78.

7
Uusi-Heikkilä, S., A. Kuparinen, C. Wolter, T. Meinelt, A. C. O'Toole, and R. Arlinghaus
2011. Experimental assessment of the probabilistic maturation reaction norm: condition
matters. Proceedings of the Royal Society B - Biological Sciences 278:709–17.
doi:10.1098/rspb.2010.1507.
Reproductive performance and early life-history traits – S4
Methods
We estimated the reproductive performance of zebrafish in each selection line for the F9-
generation fish (selection halted for three generations). At age 230 d, one female and one male
from each of the selection line replicate, whose SL and WM were first assessed, were stocked
into one three-liter spawning box for five days (altogether 20 spawning boxes per treatment).
To estimate reproductive output, we assessed daily spawning frequency and clutch size (i.e.,
the number of eggs spawned per female per spawning event). To estimate the egg fertilization
rate, fertilized eggs were separated from the unfertilized eggs. We used a previously published
protocol (Uusi-Heikkilä et al. 2012) to estimate egg size (measured as yolk diameter), egg
survival, hatching probability, larval age-at-hatch, larval length-at–hatch, and larval yolk-sac
volume. The probability of successful swim bladder inflation was estimated from seven days
old larvae, which were successfully hatched from 25 fertilized eggs placed in a Petri dish and
kept in the incubator. To estimate larval survival, 25 fertilized, healthy eggs (i.e., not suffered
from egg mortality at age 4 d) were placed in separate Petri dishes, and after hatching the
larvae were stocked into three-liter rearing boxes and fed ad libitum. At age 10 d the number
of survived larvae in each rearing box was calculated.
All statistical analyses on the early life-history traits were performed using a generalized
linear model to account for the non-normally distributed and heteroscedastic data (Crawley
2007). If data were over- or under-dispersed, the dispersion parameter was defined in the

8
model. To estimate differences in reproductive performance and in early life-history traits
among selection lines, we first fitted the full model and then used the stepwise model
reduction procedure (Crawley 2007). In all of the statistical analyses, selection line was
treated as a predictive variable and both selection line replicate, spawning day (when
estimating the effects of selection on variables measured over a five day spawning trial, i.e.,
spawning probability, clutch size and egg fertilization probability) and spawning couple were
treated as random variables. To study whether other factors related to selection, except female
and male body size, could have affected the variation in reproductive traits among the
selection lines, we analyzed the residual variation not accounted by the female and male body
size as a function of the selection treatment. In the final analyses, however, the residual
variation in the reproductive and early life-history traits (i.e., variation not explained by the
female and male body size) was unrelated to the selection treatments.
Literature
Crawley, M.J. 2007. The R Book. West-Sussex. Wiley.
Uusi-Heikkilä, S., A. Kuparinen, C. Wolter, T. Meinelt, and R. Arlinghaus 2012. Paternal
body size affects reproductive success in laboratory-held zebrafish (Danio rerio).
Environmental Biology of Fishes 93:461–74. doi:10.1007/s10641-011-9937-5.
Metabolic rate and exploration – S5
Methods
Juvenile zebrafish of the F10-generation, i.e., when selection had been halted for four
generations, (mean ± s.d. length and weight of small-selected fish: 21.9 ± 2.85 mm and 0.108
± 0.039 g [N = 42], random fish: 22.0 ± 3.48 mm and 0.104 ± 0.046 g [N = 39] and large-
selected fish: 21.8 ± 3.42 mm and 0.096 ± 0.044 [N = 41]) were fasted for 24 h and were then

9
transferred into one of seven individual 4 ml glass respirometers (Loligo Systems, Tjele,
Denmark). Respirometers were immersed in a water bath that was maintained at a constant
temperature or 25 ± 0.1 oC. The water surface was shielded with opaque polystyrene to
prevent visually disturbing the fish, and all disturbances were kept to a minimum during
measurements. After a two hour acclimation period, standard metabolic rate (SMR) was
measured as rates of oxygen uptake using intermittent stopped-flow respirometry (Steffensen
1989; Killen et al. 2011). Pilot trials determined that two hours was sufficient time for the fish
to settle, as rates of oxygen uptake did not decline further with time beyond this point. Water
flow from the external bath through the respirometers was driven by an external pump that
was set to turn on and off for alternating 15 min periods. This allowed decreases in water
oxygen content to be measured every two seconds for 15 min while the respirometer was in
the closed state, and then the respirometer was flushed with aerated water for 15 min. The
oxygen consumption during each closed phase was calculated using linear least squares
regression (excluding the first and last two minutes of each closed phase). An eighth
respirometer was left empty, to provide parallel measurements of background microbial
respiration in the system. Water oxygen levels were measured with optodes (Firesting 4-
Channel oxygen meters; Pyroscience, Germany), and oxygen uptake for each measurement
period was then calculated according to previously published protocol (Dupont-Prinet et al.
2010). For each individual, six slopes of oxygen decrease were recorded, and SMR was taken
as the mean of these measures. Rates of oxygen consumption were corrected for differences in
body size by taking the residual of oxygen uptake (mg h-1
) versus body mass (g) for each
individual, then adding this fitted value of this relationship at 0.1 g (the approximate mean
mass of all fish used in the study) (Killen et al. 2010). Differences in SMR among treatments
were examined using a linear mixed model, with SMR at 0.1 g as the dependent variable,
selection line as a categorical fixed effect, and selection line replicate as a random effect.

10
After testing for metabolic rate, we transferred test fish (19 small fish, 22 random fish and 27
large fish) to the five liter rearing boxes and let them acclimatize overnight. The following
day, each individual was tested twice (with a break of 30 min between measurements) for its
exploration behavior in an open field test in a novel environment (Ariyomo and Watt 2012).
Exploration of a novel, open field environment has been a useful measure of an individual’s
position in the shy-boldness continuum in teleost fishes (Burns 2008; Ariyomo and Watt
2012, 2013; Carter et al. 2013). The open field arena consisted of a circular tank (48.5 cm in
diameter, made of white plastic). We used system water to fill the arena to a depth of 7 cm.
Lighting was provided from two neon tubes positioned at the room ceiling, which helped to
avoid shadows or reflections within the tank. In each trial, a single fish was introduced into a
transparent plastic cylinder in the center of the arena and it was let to acclimate for five
minutes. Afterwards, the cylinder was carefully removed and the fish movement was
videotaped with a webcam for the next five minutes (1st trial). After that, we transferred the
test fish back into the rearing box. Measurements were repeated for each individual after a
break of 30 minutes (2nd
trial). Videos were analyzed using the video tracking software
EthoVision XT Version 9.0 (Noldus Information Technologies, Inc.). Position scoring started
10 s after the fish was released from the cylinder. Altogether we analyzed 250 s per individual
and per trial.
When analyzing the data, we first searched for correlation between both response variables
(i.e., velocity and time spent freezing) using a principle component analysis (PCA) for both
test trials. The first principal component (PC1) accounted for 93.8% of the total variance and
both variables loaded with 0.97 on this component (velocity in the negative direction and time
spent freezing in the positive direction). Due to this high, negative correlation, both variables
were likely to represent the same personality trait (i.e., boldness; Dahlbom et al. 2014). Both
variables were square-root transformed prior to all analyses to approach Gaussian error
distribution. We used the first principal component (PC1) as a response variable in a linear

11
mixed model in which selection treatment, experimental trial, TL, and WM were predictive
variables and individual and selection line replicate were random variables. Model fitting was
performed by first evaluating the random effects through likelihood ratio tests. We then
excluded all covariates with P > 0.1 and refitted the model. In the final model, all other
explanatory variables could be excluded, except the selection treatment (predictive variable)
and the individual (random variable). We omitted selection line replicate from the final model
as this random effect was not significant (χ²=1.96, df= 1, P=0.27) and only explained 8.7 % of
the total phenotypic variance. Based on the obtained variance of the residual error (“within
individual variance”) and the random intercept variance (“between individual variance”), we
calculated the repeatability for PC1 (Dingemanse and Dochtermann 2013).
Results
Table S3. Differences in PC1 score (estimated marginal means) derived from the final model
among the selection lines. Note that increasing PC1 score implies less explorative individuals
and individuals that freeze for a longer duration.
Selection line Estimated value SE
Confidence intervals
Large
Random
Small
-0.350
0.293
0.163
0.163
0.179
0.193
-0.676 – -0.023
-0.064 – 0.650
-0.222 – 0.547
Literature
Ariyomo, T. O., and P. J. Watt 2013. Disassortative mating for boldness decreases
reproductive success in the guppy. Behavioral Ecology 24:1320–26.
doi:10.1093/beheco/art070.

12
Ariyomo, T. O., and P. J. Watt 2012. The effect of variation in boldness and aggressiveness
on the reproductive success of zebrafish. Animal Behaviour 83:41–46.
doi:10.1016/j.anbehav.2011.10.004.
Burns, J. G. 2008. The validity of three tests of temperament in guppies (Poecilia reticulata).
Journal of Comparative Psychology 122:344–56. doi:10.1037/0735-7036.122.4.344.
Carter, A. J., W. E. Feeney, H. H. Marshall, G. Cowlishaw, and R. Heinsohn 2013. Animal
personality: what are behavioural ecologists measuring? Biological Reviews 88:465–75.
doi:10.1111/brv.12007.
Dahlbom, S. J., D. Lagman, K. Lundstedt-Enkel, L. Fredrik Sundström, and S. Winberg 2014.
Boldness predicts social status in zebrafish (Danio rerio). PloS One 9:e23565.
doi:10.1371/journal.pone/0023565.
Dingemanse, N. J., and N. A. Dochtermann 2013. Quantifying individual variation in
behaviour: mixed-effect modelling approaches. The Journal of Animal Ecology 82:39–54.
doi:10.1111/1365-2656.12013.
Dupont-Prinet, A., B. Chatain, L. Grima, M. Vandeputte, G. Claireaux, and D. J. McKenzie
2010. Physiological mechanisms underlying a trade-off between growth rate and tolerance of
feed deprivation in the European sea bass (Dicentrarchus labrax). The Journal of
Experimental Biology 213:1143–52. doi:10.1242/jeb.037812.
Killen, S. S., D. Atkinson, and D. S. Glazier 2010. The intraspecific scaling of metabolic rate
with body mass in fishes depends on lifestyle and temperature. Ecology Letters 13:184–93.
doi:10.1111/j.1461-0248.2009.01415.x.

13
Killen, S .S., S. Marras, and D. J. McKenzie 2011. Fuel, fasting, fear: routine metabolic rate
and food deprivation exert synergistic effects on risk-taking in individual juvenile European
sea bass. The Journal of Animal Ecology 80:1024–33. doi:10.1111/j.1365-
2656.2011.01844.x.
Steffensen, J. F. 1989. Some errors in respirometry of aquatic breathers: how to avoid and
correct for them. Fish Physiology and Biochemistry 6:49–59. doi:10.1007/BF02995809.
Genetic analyses – S6
Methods
We extracted DNA from the muscle tissue of fish from the founder population, F2 –
generation, F4 –generation and F7 –generation, one generation after selection was halted. We
sampled 60 fish (females and males) from the founder population and 30 fish from each
selection-line replicate per generation. From the control treatment, only fish from the F2- and
F7 -generations were used for the genetic analyses. The DNA was extracted with the QIAGEN
DNeasy Blood & Tissue Kit (www.qiagen.com) following the manufacturer’s instructions.
Samples were genotyped according to the manufacturer’s protocol on an Illumina BeadXpress
VeraCode genotyping platform (www.illumina.com) using a custom panel. We examined
variation at 371 single nucleotide polymorphisms (SNPs), which resulted in an average of
14.84 markers per chromosome with an average distance of 3.91 Mb. Map positions of the
markers were based on map locations from the Zv9 zebrafish genome assembly.
To determine if size-selective harvesting had induced genetic changes in the experimentally
exploited zebrafish populations, we used 384 genome-wide, evenly distributed single
nucleotide polymorphisms (SNPs), that were chosen from a previously analyzed wild
zebrafish dataset (Whiteley et al. 2011). We had to exclude 38 individuals due to the low
genotyping success. We excluded eight markers that were not successfully genotyped for ≥ 50

14
% of the individuals. Five additional markers deviated from Hardy-Weinberg proportions and
were excluded. Thus, we examined variation at 371 markers in 502 individuals. The outlier
analysis was conducted for F7 –generation individuals using the FDist method (Beaumont and
Nichols 1996) implemented in software LOSITAN – Selection Workbench (Antao et al.
2008). The outlier analysis identifies outlier loci as those that show significantly higher FST
than expected by processes other than selection. LOSITAN estimated outlier loci responding
significantly to divergent and balancing selection from the entire dataset of 371 SNPs. We
used an infinite alleles model and 50 000 simulations.
We also tested for linkage disequilibrium (LD), or non-random association among loci. LD is
affected by several factors including genetic drift and selection, which can, for example create
LD between genes by favoring specific gene combinations. In our study, any outlier SNPs
that were located on the same chromosome were tested for LD to establish whether these
outliers were likely to be associated with multiple sites under selection. Low LD indicates
that same SNPs are associated with different sites of selection whereas high LD could suggest
that the same SNPs are associated with the same site. We tested each pair of loci in each
population for LD using the log likelihood ratio statistics in Genepop version 4.2. The P-
values were adjusted to multiple testing with a Bonferroni correction.
Results
Two pairs of the outlier loci on chromosomes 9 (physically separated by 11,049 kb) and 10
(separated by 15,804 kb) were in significant linkage disequilibrium.
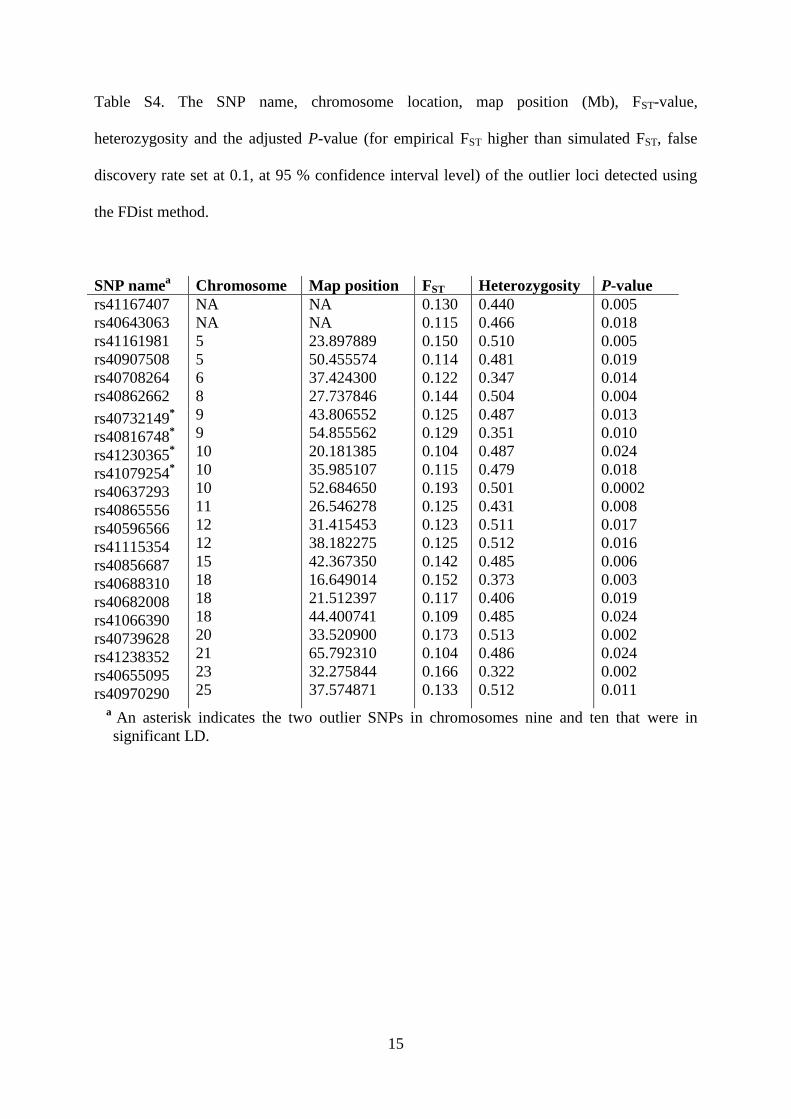
15
Table S4. The SNP name, chromosome location, map position (Mb), FST-value,
heterozygosity and the adjusted P-value (for empirical FST higher than simulated FST, false
discovery rate set at 0.1, at 95 % confidence interval level) of the outlier loci detected using
the FDist method.
SNP namea
Chromosome Map position FST Heterozygosity P-value
rs41167407
rs40643063
rs41161981
rs40907508
rs40708264
rs40862662
NA
NA
5
5
6
8
9
9
10
10
10
11
12
12
15
18
18
18
20
21
23
25
NA
NA
23.897889
50.455574
37.424300
27.737846
43.806552
54.855562
20.181385
35.985107
52.684650
26.546278
31.415453
38.182275
42.367350
16.649014
21.512397
44.400741
33.520900
65.792310
32.275844
37.574871
0.130
0.115
0.150
0.114
0.122
0.144
0.125
0.129
0.104
0.115
0.193
0.125
0.123
0.125
0.142
0.152
0.117
0.109
0.173
0.104
0.166
0.133
0.440
0.466
0.510
0.481
0.347
0.504
0.487
0.351
0.487
0.479
0.501
0.431
0.511
0.512
0.485
0.373
0.406
0.485
0.513
0.486
0.322
0.512
0.005
0.018
0.005
0.019
0.014
0.004
0.013
0.010
0.024
0.018
0.0002
0.008
0.017
0.016
0.006
0.003
0.019
0.024
0.002
0.024
0.002
0.011
rs40732149*
rs40816748*
rs41230365*
rs41079254*
rs40637293
rs40865556
rs40596566
rs41115354
rs40856687
rs40688310
rs40682008
rs41066390
rs40739628
rs41238352
rs40655095
rs40970290
a
An asterisk indicates the two outlier SNPs in chromosomes nine and ten that were in
significant LD.

16
Table S5. Outlier loci responding to balancing selection: type of the variant (UTR =
untranslated region, D = downstream gene variant, I = inter-genic variant, In = intron variant),
gene name, and gene function. Loci with parallel and consistent allele frequency changes (i.e.,
decrease or increase in all lines between the founder population and F7-generation) possibly
supporting the fecundity selection hypothesis (see Discussion in the main text) are indicated
in bold.
Outlier
SNP name
Chromosome Map position Type Gene name Function
rs40792992
rs40624233
rs40656596
rs41214240
rs41140266
rs40627378
rs40620845
rs41189461
1
1
2
3
3
6
13
14
14347199
17337934
21266167
41700947
46836905
15427030
11159374
48572107
In
UTR
UTR
UTR
D
UTR
D
I
SGCZ
klf3
afg3l2
gna12a
elavl3
irrfip1b
zbtb18
No
Part of the
sacroglycan
complex.
Interacting
selectively and
non-covalently
with any metal
ion.
Metal ion
binding (Varshney et al.
2013).
Proteolysis.
Cell migration
involved in
gastrulation (Lin
et al. 2005).
RNA binding
(Ahrens et al.
2012).
No description
available.
Encodes a zinc
finger protein
involved in
neuronal
development.
No description

17
rs40786572
rs40870101
rs40967394
rs40918563
16
18
18
20
27836773
6817729
12771702
38751644
NS
NS
UTR
UTR
description
available.
No
description
available.
glipr1b
plcg2
uts1
available.
No description
available.
Function not
characterized in
zebrafish.
Intracellular
signal
transduction.
Hormone
activity
(glycopeptide
and lipopeptide)
and metal ion
binding
(Alderman and
Bernier 2007).

18
Table S6. Outlier loci with the most pronounced, replicable allele frequency divergence
among selection treatments. Also shown are the type of the variant (S = synonymous, UTR =
untranslated region, D = downstream gene variant, I = inter-genic variant, In = intron variant),
gene name, and gene function.
SNP name Treatment Type Gene name Gene function
rs41161981
rs40907508
rs40865556
Large ≠ small
Large ≠ small
Large ≠ small
and random
D
UTR
S
las1l
LysM
ccdc120
Function not identified in
zebrafish.
The chemical reactions
and pathways resulting in
the breakdown of
macromolecules that form
part of a cell wall.
Function not formally
identified.
rs41115354
rs40856687
rs40688310
Large ≠ small
Large ≠ small
Large and
random ≠
small
I
In
UTR
No description available.
No description available.
Tryptophan
hydroxylase 2
The chemical reactions
and pathways involving
aromatic amino acid
family. Controls brain
serotonin synthesis in
human and mice.
rs41238352
rs40655095
Large ≠ small
Large ≠ small
In
S
col5a1
Function not identified in
zebrafish.
eph receptor B2b
The process of introducing
a phosphate group on to a
protein. Regulates
transcription.

19
Table S7. Outlier SNPs that were in linkage disequilibrium (LD) with a nearby SNP (LD
SNP) and the physical distance in kilobase pairs between them. The gene information, i.e., the
type of the variant (UTR = untranslated region, S = synonymous, D = downstream gene
variant, U = upstream gene variant, In = intron variant, I = inter-genic variant, NS = non
synonymous variant), the name and the function of the in which the LD SNP occurs.
Outlier
SNP name
LD SNP name Genetic
distance (kbp)
Type Gene name Function
rs41161981 rs41021709
rs41092660
rs41141381
180
19 210
22 531
UTR
S
UTR
GAB3
eef2l2
Cathepsin L
1 a
Function not
identified in
zebrafish.
Interacting
selectively and
non-covalently
with guanosine
triphosphate.
Involved in
embryonic yolk
processing
(Tingaud-
Sequeira and
Cerdà 2007).

20
rs40907508 rs41141381
rs40964259
rs40627745
rs40622039
rs40933327
4 026
5 331
17 226
18 139
30 864
UTR
D
D
U
UTR
Cathepsin L
1 a
rhobtb2a
MEGF9
pdzd3b
Checkpoint
with
forkhead
and ring
finger
domains,
E3 ubiquitin
protein
ligase
Involved in
embryonic yolk
processing
(Tingaud-
Sequeira and
Cerdà 2007).
Involved in small
GTPase-
mediated signal
transduction.
Function not
identified in
zebrafish.
Interacting
selectively and
non-covalently
with ATP.
Cell division,
mitosis, protein
binding.
rs40865556 rs40895761
rs40784742
rs40910234
6 843
7 889
8 861
D
UTR
In
dnmbp
lims1
tmem180
Function not
identified in
zebrafish.
Involved in
cardiac
contraction and
heart beating.
Function not
identified in
zebrafish.
rs41057458
rs40687123
11 633
22 624
I
S
No description available.
TANK2 Function not
identified in
zebrafish.
rs40856687 rs40769175 1 356 UTR Guanylate Involved in

21
rs41052587
9 328
cyclase
activator 1C
calcium
signaling in the
eye and in light
regulation,
circadian
rhythms and
stress response
(Scholten and
Koch 2011;
Weger et al.
2011).
No description available.
rs41238352 rs40739415
7 335 D
ddt Involved in inner
ear development.
rs40655095 rs40668802
rs40746508
rs40878095
5 258
7 319
31 390
S
UTR
NS
galnt6
CTD small
phosphatase
2
Interleukin-
1 receptor-
associated
kinase 4
Involved in
protein
glycosylation.
Involved in
neuron
differentiation.
Involved in
innate immune
response system
in zebrafish
(Stein et al.
2007).
Supporting figure legends
Figure S1. Outlier loci, which showed no replicable (consistent) response to selection but
were detected by the outlier test (FDist method). Large fish indicated with blue lines, random
fish with gray lines, and small fish with red lines.
Literature
Ahrens, M. B., J. M. Li, M. B. Orger, D. N. Robson, A. F. Schier, F. Engert, and R. Portugues
2012. Brain-wide neuronal dynamics during motor adaptation in zebrafish. Nature 485:471–
77. doi:10.1038/nature11057.

22
Alderman, S. L., and N. J. Bernier 2007. Localization of corticotropin-releasing factor,
urotensin I, and CRF-binding protein gene expression in the brain of the zebrafish, Danio
rerio. The Journal of Comparative Neurology 502:783–93. doi:10.1002/cne.21332.
Antao, T., A. Lopes, R. J. Lopes, A. Beja-Pereira, and G. Luikart 2008. LOSITAN: a
workbench to detect molecular adaptation based on a Fst-outlier method. BMC
Bioinformatics 9:323. doi:10.1186/1471-2105-9-323.
Beaumont, M. A., and R. A. Nichols 1996. Evaluating loci for use in the genetic analysis of
population structure. Proceedings of the Royal Society B: Biological Sciences 263:1619–26.
doi:10.1098/rspb.1996.0237.
Lin, F., D. S. Sepich, S. Chen, J. Topczewski, C. Yin, L. Solnica-Krezel, and H. Hamm 2005.
Essential roles of G{α}12/13 signaling in distinct cell behaviors driving zebrafish
convergence and extension gastrulation movements. The Journal of Cell Biology 169:777–87.
doi:10.1083/jcb.200501104.
Scholten, A., and K. W. Koch 2011. Differential calcium signaling by cone specific guanylate
cyclase-activating proteins from the zebrafish retina. PloS One 6:e23117.
doi:10.1371/journal.pone.0023117.
Stein, C., M. Caccamo, G. Laird, and M. Leptin 2007. Conservation and divergence of gene
families encoding components of innate immune response systems in zebrafish. Genome
Biology 8: R251. doi:10.1186/gb-2007-8-11-r251.
Tingaud-Sequeira, A., and J. Cerdà 2007. Phylogenetic relationships and gene expression
pattern of three different cathepsin L (Ctsl) isoforms in zebrafish: Ctsla is the putative yolk
processing enzyme. Gene 386:98–106. doi:10.1016/j.gene.2006.08.018.

23
Varshney, G. K., J. Lu, D. E. Gildea, H. Huang, W. Pei, Z. Yang, S. C. Huang, et al. 2013. A
large-scale zebrafish gene knockout resource for the genome-wide study of gene function.
Genome Research 23:727–35. doi:10.1101/gr.151464.112.
Weger, B. D., M. Sahinbas, G. W. Otto, P. Mracek, O. Armant, D. Dolle, K. Lahiri, et al.
2011. The light responsive transcriptome of the zebrafish: function and regulation. PloS One
6:e17080. doi:10.1371/journal.pone.0017080.
Whiteley, A. R., A. Bhat, E. P. Martins, R. L. Mayden, M. Arunachalam, S. Uusi-Heikkilä, A.
T. A. Ahmed, et al. 2011. Population genomics of wild and laboratory zebrafish (Danio
rerio). Molecular Ecology 20:4259–76.
Population growth model – S7
Methods
To explore the potential demographic effect of the life history evolution, we constructed a
deterministic Leslie-matrix population model (Arlinghaus et al. 2009) and compared model
runs with and without size-dependent harvesting. We assumed a birth-pulse population and
pre-breeding census (Caswell 2001), which is appropriate for zebrafish and a common
approach when modeling most fishes. We computed the population’s finite rate of increase
as the dominant eigenvalue of the resulting Leslie matrix A (Caswell 2001). The form of the
Leslie matrix we used was:
max 1 max
max
1 0 2 0 0 0
1
2
1
0 0 0
0 0 0
0 0 0
a a
a
f s f s f s f s
s
s
s
A , (1)

24
where af is age-specific fecundity (egg number per female at age a ) and
as is age-specific
survival probability. The time unit is a day, and the maximum age was assumed maxa = 730 (d)
(i.e., 2 years).
SL at age a (d) was modeled using the biphasic growth model (Lester et al. 2004) as:
1
(if )
3( ) (if )
3
a
a
a
L h a T
LL h a T
g
, (2a)
0 1L ht , (2b)
where g is reproductive investment (fraction of surplus energy invested into gonads), h (mm
d-1) is the daily juvenile growth increment and T (d) is the age when fish start investing their
surplus energy into reproduction. For simplicity, we modeled only females.
The age-specific fecundity af was defined as
2
1
E
0 (if )
(if )2
ba a
a T
f grb La T
w
, (3)
where Ew (mg) is the egg weight, and r represents the relative caloric density of somatic
tissue compared to eggs (Diana 1983). 1b and 2b are a constant and an exponent of the
allometric weight-length relationship, respectively. The number of eggs produced by a single
female, that is, gonad weight divided by the egg weight, was further divided by two because
only half of a particular age class was assumed to be females.
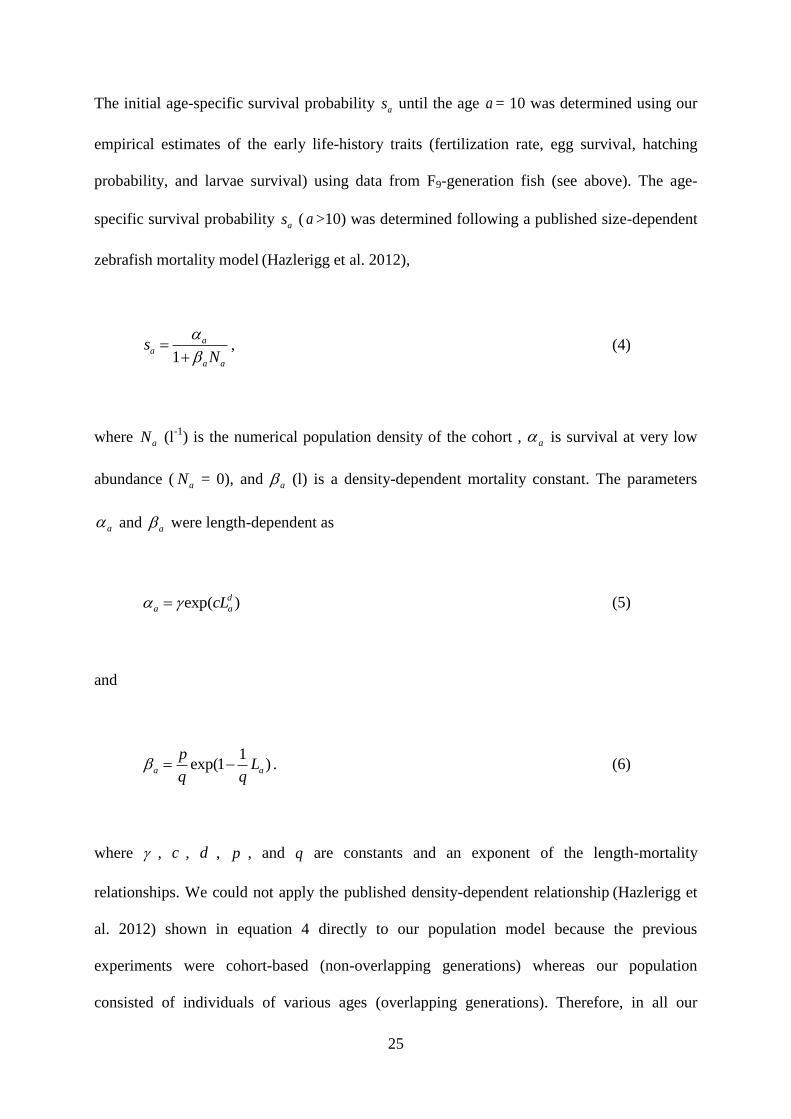
25
The initial age-specific survival probability as until the age a = 10 was determined using our
empirical estimates of the early life-history traits (fertilization rate, egg survival, hatching
probability, and larvae survival) using data from F9-generation fish (see above). The age-
specific survival probability as ( a >10) was determined following a published size-dependent
zebrafish mortality model (Hazlerigg et al. 2012),
1
aa
a a
sN
, (4)
where aN (l-1
) is the numerical population density of the cohort , a is survival at very low
abundance ( aN = 0), and a (l) is a density-dependent mortality constant. The parameters
a and a were length-dependent as
exp( )d
a acL (5)
and
1
exp(1 )a a
pL
q q . (6)
where , c , d , p , and q are constants and an exponent of the length-mortality
relationships. We could not apply the published density-dependent relationship (Hazlerigg et
al. 2012) shown in equation 4 directly to our population model because the previous
experiments were cohort-based (non-overlapping generations) whereas our population
consisted of individuals of various ages (overlapping generations). Therefore, in all our
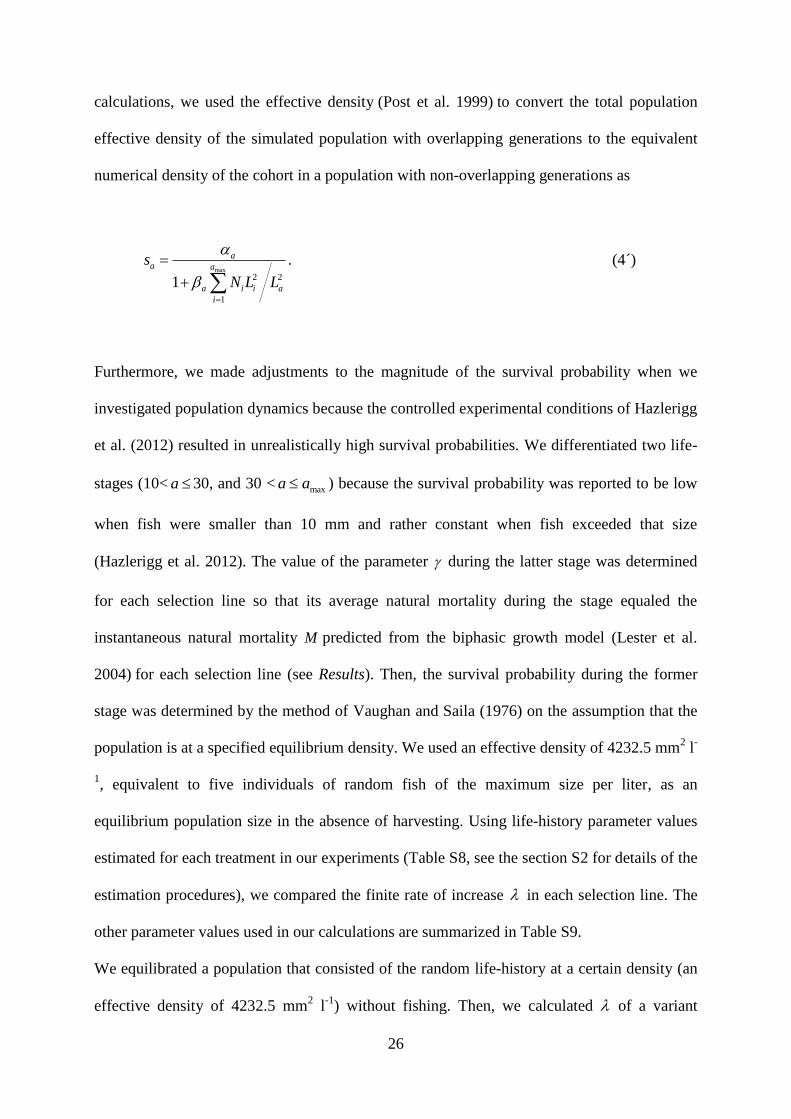
26
calculations, we used the effective density (Post et al. 1999)
to convert the total population
effective density of the simulated population with overlapping generations to the equivalent
numerical density of the cohort in a population with non-overlapping generations as
max
2 2
1
1
aa a
a i i a
i
s
N L L
. (4´)
Furthermore, we made adjustments to the magnitude of the survival probability when we
investigated population dynamics because the controlled experimental conditions of Hazlerigg
et al. (2012) resulted in unrealistically high survival probabilities. We differentiated two life-
stages (10< a 30, and 30 < maxa a ) because the survival probability was reported to be low
when fish were smaller than 10 mm and rather constant when fish exceeded that size
(Hazlerigg et al. 2012). The value of the parameter during the latter stage was determined
for each selection line so that its average natural mortality during the stage equaled the
instantaneous natural mortality M predicted from the biphasic growth model (Lester et al.
2004) for each selection line (see Results). Then, the survival probability during the former
stage was determined by the method of Vaughan and Saila (1976) on the assumption that the
population is at a specified equilibrium density. We used an effective density of 4232.5 mm2 l
-
1, equivalent to five individuals of random fish of the maximum size per liter, as an
equilibrium population size in the absence of harvesting. Using life-history parameter values
estimated for each treatment in our experiments (Table S8, see the section S2 for details of the
estimation procedures), we compared the finite rate of increase in each selection line. The
other parameter values used in our calculations are summarized in Table S9.
We equilibrated a population that consisted of the random life-history at a certain density (an
effective density of 4232.5 mm2 l
-1) without fishing. Then, we calculated of a variant

27
individual from the large- or small-selected fish in the equilibrium population of random fish.
The magnitude of depends on the time unit used in the Leslie matrix. Therefore, we also
calculated the population growth rate measured by a fixed unit of time, that is, generation time
G (d generation-1
) of the random fish as G . Generation time G was calculated using the
age-specific fecundity af and the stable age distribution
s,aN of the population, which was
obtained as an eigenvector of the Leslie matrix A as
max
max
s,
1
s,
1
a
i i
i
a
i i
i
af N
G
f N
. (7)
Next, we introduced size-selective fishing mortality aF as
max 1 2(if ),
0 (otherwise),
a
a
F L L LF
, (8)
where maxF is the maximum daily instantaneous fishing mortality, and 1L and 2L are the
lower and upper limits of a harvest slot (mm). We considered three different types of fishing
scenarios equivalent to our harvesting experiment, i.e., small-size harvested, randomly
harvested, and large-size harvested fishing (Fig. S2). In the randomly harvested and large-size
harvested scenarios, the upper limit of the harvest slot was set at 2L . To mimic a 75%
per-generation harvest rate of our experiments in the simulated population with overlapping
generations, we determined fishing mortalities so that in random fish the equilibrium
abundance of individuals of the harvested population was ~25% of the pristine population
(Table S10, Fig. S2). The lower limit of the harvest slot 1L was set at 90% of the age at

28
maturation of random fish. The maximum instantaneous fishing mortality maxF of the small-
and large-size harvested fishing scenarios was arbitrarily set at 200% of that of the randomly
harvested fishing scenario, but we also examined the sensitivity of conclusions to alternative
fishing mortality rates. When fishing was operating, the age-specific survival probabilities as
in the Leslie matrix (equation 1) was replaced with as , which was defined as
exp( )a a as s F . (9)
We calculated of the variant individuals as well as the resident individuals at a fixed
density because varies with effective density due to the density-dependent survival
probability (equation 4'). To compare the population growth rate under fishing among the
treatments, we arbitrarily chose the point when the effective density declined to 20% of the
pristine level because this is a common threshold of severe recruitment overfishing (Myers et
al. 1994).
Uncertainty bounds of the estimated were investigated by incorporating uncertainty of
empirical estimates of the parameters. For each of the three main parameters (i.e., juvenile
growth rate h , reproductive investment g , and maturation T ), we sampled a new value from
a normal distribution (s.d. was the empirically estimated standard error) and recalculated .
We repeated this procedure 100 times. We also varied the maximum instantaneous fishing
mortality maxF as well as the effective density at which was calculated and evaluated the
sensitivity of to these parameters.
We also investigated the population dynamics of each selection line to illustrate the
performance of each line with and without fishing. To that end, we imposed a certain level of
fishing mortality during the first 4000 d (about 30 generations), then stopped fishing and

29
observed the recovery processes up to the 8000 d. The starting population size was set at the
equilibrium population size of the randomly selected group without fishing.
Table S8. Maturation- and growth-related parameters estimated for each treatment based on
the biphasic growth model (Lester et al. 2004). Standard errors for the three main parameters
are shown in parentheses.
Symbol Treatment Unit
h
g
t1
T
M
Large
0.167092
(0.006203)
0.017008
(0.000720)
-35.3146
105
(2.80)
0.014522
Random
0.194131
(0.008862)
0.019956
(0.000987)
-27.9546
94
(2.99)
0.017065
Small
0.189725
(0.011728)
0.020715
(0.001260)
-26.1566
91
(2.78)
0.017719
mm
−
d
d
d-1
Table S9. Model parameters used in the zebrafish Leslie-matrix model.
Parameter Symbol Value Unit
Egg weight
Relative caloric density of somatic tissue to eggs
Constant in allometric weight-length relationship
Exponent of allometric weight-length relationship
Constant in length-natural mortality relationship
Exponent in length-natural mortality relationship
Constant in length-natural mortality relationship
Constant in length-natural mortality relationship
wE
r
b1
2b
c
d
p
q
0.170
0.71
0.025
3.0
0.05
1.0
0.00022
6.8
mg
−
mg mm-b
2
−
mm-d
−
ind-1
mm
mm

30
Results
Although the small-selected life-histories showed the slowest population decline among the
treatments during the period when large-size harvested fishing (representing a minimum-
length limit) was operating (Fig. 2F in the main text), small-selected populations showed the
severest population decline of all when the other two types of fishing selectivities (unselective
harvesting according to size and harvest slot) were operating (Fig. S3). This implied that life-
history traits of small-selected fish were well adapted to large-size selective harvesting, but
not to harvesting in general. Large-selected fish and random fish showed a similar
performance when small-size harvested fishing (a harvest slot) was operating (Table 5 in the
main text, Fig. S3A) but the large-selected life-history was superior to both the random-
selected and the small-selected life-history in the absence of fishing.
When the maximum instantaneous fishing mortality maxF of the three typical fishing scenario
(Fig. S2) was varied, the population growth rate of large-selected life history was
consistently lower than that of random-selected life history although the differences between
the two were small (Fig. S4A). By contrast, the performance of small-selected life history
relative to the random-selected life history varied with maxF as follows (Fig. S4B): when
small-size harvested fishing was operating, the of small-selected fish was consistently
lower than that of random fish (Fig. S4B). When random-size harvested fishing was operating,
the of small-selected fish was also lower than that of random fish except when the fish
population almost went extinct (Fig. S4B, see also Fig. S4C). However, when large-size
harvested fishing was operating, the of small-selected fish relative to that of random fish
was higher and increased as maxF increased (Fig. S4B). Another important finding of the
sensitivity analysis was that the population growth rate of the large-selected life history
relative to random life history increased as the effective density of the fish population
increased (Fig. 4D). By contrast, the performance of the small-selected life history relative to

31
the random-selected life history was largely independent of the effective density of the fish
population (Fig. 4E).
Table S10. Three typical size-selective fishing scenarios.
Fishing scenarios Fmax L1 L2
Small-size harvested
Randomly harvested
Large-size harvested
0.018250
0.009125
0.018250
20.822
20.822
23.745
24.100
∞
∞
The lower limit of the harvest slot 1L was set at 90% of the age at maturity of random fish.
The maximum instantaneous fishing mortality maxF of the small- and large-size harvested
scenarios is set at 200% of that of the randomly harvested scenario.
Supporting figure legends
Figure S2. Three typical size-selective fishing scenarios (see Table S10 for the parameter
values). Red, gray, and blue symbols and lines represent large-size, random, and small-size
harvested scenarios, respectively. Dashed line represents length at maturity of random fish.
Figure S3. Simulated population-level consequences of life-history changes induced by size-
selective harvesting. Population recovery was monitored after (A) small-size harvested (a
variant of a harvest slot) or (B) randomly harvested fishing operated for the first 4000 days.
Red, gray, and blue symbols and lines represent populations of small-selected, random, and
large-selected fish, respectively.
Figure S4. Sensitivity of the population growth rate . (A – C) maxF of the three fishing
scenarios (Fig. S2, Table S10) were varied. (A) of large-selected fish relative to random
fish. (B) of small-selected fish relative to the random fish. (C) Equilibrium density of

32
random fish relative to the pristine population (i.e., maxF = 0).
maxF of the three typical fishing
scenarios were determined to mimic a 75% per-generation harvest rate of our experiments (i.e.
the relative equilibrium density is 0.25, dotted line). (D, and E) under the three fishing
scenarios was calculated at various effective density relative to the pristine population (i.e.,
maxF = 0). (D) of large-selected fish relative to random fish. (E) of small-selected fish
relative to the random fish. Red, gray, and blue symbols and lines represent large-size,
random, and small-size harvested scenarios, respectively.
Literature
Arlinghaus, R., S. Matsumura, and U. Dieckmann 2009. Quantifying selection differentials
caused by recreational fishing: development of modeling framework and application to
reproductive investment in pike (Esox lucius). Evolutionary Applications 2:335–55.
doi:10.1111/j.1752-4571.2009.00081.x.
Caswell, H. 2001. Matrix Population Models. Sunderland. Sinauer Associates.
Diana, J. S. 1983. Growth, maturation, and production of Northern pike in three Michigan
lakes. Transactions of the American Fisheries Society 112:38–46.
Hazlerigg, C. R. E., K. Lorenzen, P. Thorbek, J. R. Wheeler, and C. R. Tyler 2012. Density-
dependent processes in the life history of fishes: evidence from laboratory populations of
zebrafish Danio rerio. PloS One 7:e37550. doi:10.1371/journal.pone.0037550.
Lester, N. P., B. J. Shuter, and P. A. Abrams 2004. Interpreting the von Bertalanffy model of
somatic growth in fishes: the cost of reproduction. Proceedings of the Royal Society B:
Biological Sciences 271:1625–31. doi:10.1098/rspb.2004.2778.

33
Meyers, R. A., A. A. Rosenberg, P. M. Mace, N. Barrowman, and V. R. Restrepo 1994. In
search of thresholds for recruitment overfishing. ICES Journal of Marine Science 51:191-205.
Post, J. R., E. A. Parkinson, and N. T. Johnston 1999. Density-dependent processes in
structured fish populations: interaction strenghts in whole-lake experiments. Ecological
Monographs 69:155–75.
Vaughan, D. S., and S. B. Saila 1976. A method for determining mortality rates using the
Leslie matrix. Transactions of the American Fisheries Society 105:380–83.

0.0
0.2
0.4
0.6
0.8
1.0
Large Random Small
Locus rs41167407 0.0
0.2
0.4
0.6
0.8
1.0
Large Random Small
Locus rs40708264 0.0
0.2
0.4
0.6
0.8
1.0
Large Random Small
Locus rs40862662 0.0
0.2
0.4
0.6
0.8
1.0
Large Random Small
Locus rs40732149
0.0
0.2
0.4
0.6
0.8
1.0
Large Random Small
Locus rs40637293 0.0
0.2
0.4
0.6
0.8
1.0
Large Random Small
Locus rs41079254 0.0
0.2
0.4
0.6
0.8
1.0
Large Random Small
Locus rs40596566 0.0
0.2
0.4
0.6
0.8
1.0
Large Random Small
Locus rs40682008
0.0
0.2
0.4
0.6
0.8
1.0
Large Random Small
Locus rs40739628
0.0
0.2
0.4
0.6
0.8
1.0
Large Random Small
Locus rs40970290 0.0
0.2
0.4
0.6
0.8
1.0
Large Random Small
Locus rs40816748 0.0
0.2
0.4
0.6
0.8
1.0
Large Random Small
Locus rs40643063
0.0
0.2
0.4
0.6
0.8
1.0
Large Random Small
Locus rs41066390 0.0
0.2
0.4
0.6
0.8
1.0
Large Random Small
Locus rs41230365
Alle
le F
requ
ency
Selection line

10 15 20 25 30
0.00
00.
005
0.01
00.
015
0.02
0
Fish length (mm)
Fm
ax (
d−1)

0 2000 4000 6000 8000
0.0
2.5
5.0
7.5
10.0
fishing
(A)
Time (d)
Den
sity
(fis
h l−1
)
0 2000 4000 6000 8000
0.0
2.5
5.0
7.5
10.0
fishing
(B)
Time (d)
Den
sity
(fis
h l−1
)

0.00 0.01 0.02 0.03
0.99
91.
000
1.00
1
Fmax (d−1)
Rel
ativ
e po
pula
tion
grow
th r
ate
(A)
0.00 0.01 0.02 0.03
0.99
1.00
1.01
Fmax (d−1)
Rel
ativ
e po
pula
tion
grow
th r
ate
(B)
0.00 0.01 0.02 0.03
0.0
0.5
1.0
Fmax (d−1)
Rel
ativ
e de
nsity
(C)
0.0 0.5 1.0
0.99
91.
000
1.00
1
Relative effective density
Rel
ativ
e po
pula
tion
grow
th r
ate
(D)
0.0 0.5 1.0
0.99
1.00
1.01
Relative effective density
Rel
ativ
e po
pula
tion
grow
th r
ate
(E)