Embed Size (px)
Citation preview
The evolution of world export
sophistication and the Italian trade
anomaly
Michele Di Maio
Universita di Macerata
Federico Tamagni∗
Scuola Superiore Sant’Anna, Pisa
∗[email protected]; [email protected]. The Authors are very grateful to Alessandro An-
timiani, Giulio Bottazzi, Luca De Benedictis, Giovanni Dosi, Fabio Sdogati, Lucia Tajoli and
two anonymous referees for insightful comments and suggestions. The work also benefited from
discussions with participants to the 11th International Schumpeter Society Conference in Nice-
Sophia Antipolis, 21-24 June, 2006; participants to the 47a Riunione della Societa Italiana degli
Economisti in Verona, 27-28 October, 2006, and the CNR meeting ’Internazionalizzazione e
Sistema Produttivo Italiano’, 22-23 February, 2007. The usual disclaimers apply.
1

Abstract
This work provides an empirical assessment of the sophistication level of
the Italian international specialization pattern from 1980 to recent years. In
particular we present an original analysis which explores the intertemporal
co-evolution of the newly proposed PRODY index of export sophistication
(Hausmann et al. 2005, 2007) with standard measures of revealed compar-
ative advantage. We argue that the results of this exercise can shed light on
the Italian ’trade specialization anomaly’ [JEL Codes: C14, F14 ].
Questo lavoro presenta un’analisi empirica del grado di sophistication
delle esportazioni italiane per il periodo dal 1980 fino ad anni recenti. Pro-
poniamo, in particolare, un originale tentativo di comparazione fra l’evoluzione
della distribuzione settoriale dei vantaggi comparati rivelati, e la dinam-
ica degli indici PRODY, recentemente introdotti nella letteratura che lega
crescita economica e caratteristiche delle esportazioni (Hausmann et al.
2005, 2007). I risultato di questo esercizio fornisce alcuni nuovi spunti in-
terpretativi sulle anomalie della specializzazione internazionale italiana.
2

1 Introduction
There is widespread consensus among economists and policy makers on the idea
that economic growth of a country is to an important extent determined by its
external performance. A number of theoretical models has also shown that the
strength of this link heavily depends on the sophistication levels associated with
the specialization pattern of a country (Kaldor, 1966; Thirwall, 1979; Pasinetti,
1981; Dosi et al., 1990; Grossman and Helpman, 1991). This theoretical apparatus
has been largely employed in the debate on the performance of the Italian economy,
and often invoked to support the claim that one major difficulty for the country
lies in its mis-directed pattern of specialization.1 Indeed, it is very well known that
Italy is characterized by a peculiar ’trade specialization anomaly’ (Onida, 1999),
consisting of a) strong comparative advantages in low-skilled and labor intensive
sectors, implying that Italy, in terms of specialization, is much more similar to an
emerging economy than to countries with comparable levels of per-capita income;
and b) a remarkably high degree of persistence of such a peculiar structure of
specialization (Epifani , 1999; De Benedictis, 2005; Monti, 2005).
The view that the sophistication content of the specialization pattern does
matter for economic growth, despite theoretically well grounded, it is very difficult
to test empirically. The results of the few studies attempting to do that strongly
indicate that openness is not growth enhancing per se, but, rather, it is impor-
tant to consider the type and the characteristics of the sectors which a country
is specialized into. Dalum et al. (1999) convincingly show that the technologi-
cal characteristics of the specialization pattern are important to explain growth
differentials. Similarly, Feenstra and Rose (2000) find a strong relationship be-
tween what they call an ’advanced export structure’, on the one hand, and higher
productivity levels and faster growth rates, on the other.
1For an opposite view see Faini (2004).
3
An important contribution to this line of research comes from the recent work
by Hausmann et al. (2005, 2007), also developed in Rodrik (2006), where a new
quantitative measure of sophistication of exports is presented. Specifically, they
introduce an index – called PRODY – which returns, for each traded sector (prod-
uct), a weighted average of the per-capita incomes of the countries which are ex-
porting in that particular sector (product). Sectors are therefore ranked in terms
of their productivity/income content, whence the name of the index. Based on
this, a measure of the overall sophistication associated with the export vector of a
country – called EXPY – is also computed, and shown to be a good predictor of
subsequent growth.
This recent evidence, supporting that the specific type of products exported
do matter for the growth records of a country, with more sophisticated sectors
displaying higher growth enhancing potentials, turns particularly relevant when
considering the Italian economy. Indeed, the most remarkable feature of the Italian
’specialization anomaly’ is that Italy, notwithstanding its apparently misdirected
specialization pattern, has for a long time enjoyed satisfactory growth records.
The problem is that such positive link does not seem to characterize the country
anymore. Why ? Can the evolution of world trade sophistication help explaining
the trend observed in recent years ?
Our paper is an attempt to answer these questions. To do that, we structure
the study into three steps.
The first contribution of the article is to pursue an analysis of the intertemporal
evolution of the PRODY index. Extending the work by Hausmann et al. (2005,
2007) we highlight some crucial dynamic properties of this measure and then com-
pute its value for three reference years, 1980, 1990, and 2000, over a sample of 90
countries and 777 traded products. We find evidence of significant changes occured
in the sectoral ranking of sophistication levels during the last twenty years, and
4
we argue that the entry of many low-medium income countries into international
trade is largely responsible for the observed dynamics. Then, as a second step, we
turn to Italy and describe the characteristics and the evolution of the specializa-
tion pattern of the country in between 1977 and 2004. The exercise is conducted
with a finer level of sectoral disaggregation with respect to previous studies about
Italy, but our results confirm much of the existing evidence: the structure of com-
parative advantages has been highly persistent and characterized by a pronounced
bimodality. Finally, we present two complementary methodologies which are use-
ful to evaluate the sophistication levels associated with the specialization pattern
of a country. The first one is based on the EXPY index presented in Hausmann
et al.(2005, 2007). The second represents our original contribution and consists of
exploring the co-evolution of the sectoral PRODY indexes with a standard measure
of sectoral specialization. Both the methods are then applied to Italy, allowing to
provide a quantitative assessment of the evolution of export sophistication in this
country over the period considered.
Overall, our findings suggest a possible answer to our initial questions. Ulti-
mately, the evolution of world trade seems the very reason why the ’specialization
anomaly’ of Italy, which did not prevent to achieve sufficiently good growth per-
formances in the past, has instead started to become a point of weakness for the
economy in more recent years, since the late ’90s at least. Indeed, while the changes
occured in the PRODY indexes reveal that, during the last two decades, the entry
of new competitors (emerging countries in particular) as well as a vast world-wide
redistribution of production have significantly changed the relative gains associ-
ated to exporting in each specific sector, Italy has remained stuck to its initial
specialization pattern. A problem then arises because most of the sectors wherein
Italy has persistently been, and still is, highly specialized, are characterized by an
intertemporal decrease in the associated PRODY index, entailing a reduction in
5

their sophistication content as compared to the past.
The paper is organized as follows. In Section 2 we introduce the PRODY index
and provide a theoretical discussion of its crucial dynamic properties. Section 3
presents a set of parametric and non-parametric exercises exploring the evolution
of the index during the period 1980-2000. The evolution of the Italian special-
ization patterns is then analyzed in Section 4. Section 5 applies to Italy the two
methodologies proposed to evaluate the sophistication associated with interna-
tional specialization of a country, namely the EXPY index and our novel analysis
of the co-evolution of the PRODY indexes with sectoral comparative advantages.
Section 6 concludes and suggests directions for future research.
2 Measuring sophistication of exports: the PRODY
index
In this section we introduce the PRODY index, discussing its use as a measure of
sophistication of traded sectors, and we describe some of its dynamic properties.
Recently proposed in Hausmann et al. (2005, 2007), the index is defined as
PRODYl =N∑
i=1
si,l · yi , (1)
where yi stands for the real per capita GPD of the i-th (i = 1, 2, ..., N) country
exporting in sector l, while the weight
si,l =RCAi,l
∑
i RCAi,l
(2)
normalizes country i’s Balassa index of Revealed Comparative Advantage (RCA)
with respect to those of all the countries exporting in the same sector (Rodrik,
6
2006).2
The PRODY index is thus a sectoral measure returning a weighted average
of the levels of development (proxied by per-capita income) of all the countries
producing and exporting in a given sector. By construction, sectors with high
values of PRODY are those where high income countries play a major role in world
exports. Therefore, under the reasonable assumption that high income/high wage
countries display a strong presence in sectors wherein comparative advantages
are determined by factors other than labor cost (such as know-how, technological
content, intrinsic quality, and so on), then sectors with an high PRODY index
are more sophisticated than sectors with a low value of the index. To the extent
that such factors set the stage for non-perfectly competitive environments, an high
value of PRODY in a given sector also signals that higher profit margins and, thus,
greater growth opportunities are associated with producing and exporting in that
sector.3
In the study of Hausmann et al. (2005, 2007) a static analysis is provided,
computing a single value of each sectoral PRODY index as a three-year average
for 1999-2001. We pursue a complementary dynamic perspective, and examine
the evolution of the PRODY indexes over time. The idea is that intertemporal
changes in both the value and the ranking of the indexes can reveal if significant
mobility and transformations have taken place in world production and trade over
2Recall that the Balassa-RCA index is defined as:
RCAlit =Xlit/Xit
Xlw/Xw
(3)
where X denotes the value of exports, l the sector, i the country, t the year considered, and
w stands for the world economy. The index measures the importance (in terms of value) of
sector l in the export bundle of country i with respect to the importance of sector l in worldwide
export flows. If the index is bigger (smaller) than 1, then country i is said to be specialized
(de-specialized) in sector l.3On this interpretation see also Lall et al. (2006).
7
time. In addition, recalling the above mentioned relationship between sophistica-
tion and the growth enhancing opportunities stemming from exports, intertempo-
ral changes in PRODY may also indicate whether the potential contribution to
economic growth associated with trading specific goods has changed with time.
Therefore, following the dynamics of the PRODY index should provide us with a
quantitative assessment of these events.
In order to understand and interpret the observed intertemporal movements of
the index it is however necessary to describe how the index responds to changes in
its main determinants. These are a) the income levels and the extent of specializa-
tion of the countries involved in world exports of each sector; and b) the number of
exporting countries in each sector, resulting from entry and exit dynamics. From
the above definition 1, one can make the following statements. First, an increase
(decrease) recorded in the per-capita income of one of the countries exporting in
sector l increases (decreases) the value of the PRODY index of the same sector l,
proportionally to the share of world exports of sector l which pertains to that coun-
try. Second, the effect on the PRODY index of sector l due to an intertemporal
change recorded in the degree of specialization of one of the countries exporting in
the same sector l depends in a non-trivial way on the simultaneous modifications
occuring in the distribution of export shares across all the countries involved in
world exports of sector l (see Di Maio and Tamagni (2007) for a derivation). Third,
the way in which entry and exit of different exporting countries affect the value of
each sectoral PRODY crucially depends on the relative income levels of the new
as compared to the already exporting countries: the higher (lower) the per-capita
income of the entrant country vis a vis the income level of the incumbents, and
the stronger the increase (the decrease) which is expected in the index of a given
sector.4
4See Proposition 1 in the Appendix for a precise statement and a formal proof of this property
8
The last consideration is particularly important for two reasons which are both
closely connected with the dynamic perspective which we pursue here. First, be-
cause the property provide a guidance to attach an economic interpretation to
the empirical evidence about the evolution of the PRODY indexes which we are
going to present in the next section. Second, the peculiar effects of entry and exit
of different exporting countries makes explicit that our attempt to follow the in-
tertemporal evolution of PRODY indexes requires specific care in the construction
of the dataset. Indeed, in order to avoid mis-measurement of each sectoral index
over time, it is not enough to gather information on the largest possible number of
countries. It is also essential to maximize the number of countries for which data
are available and reliable over the entire sample period considered.5
3 Evidence on the dynamics of PRODY
In this section we present our empirical analysis of the evolution of the sectoral
PRODY indexes, focusing on the dynamics observed across three reference years,
1980, 1990 and 2000. Exploring parametric and non-parametric exercises our main
goal is to document the extent and the directions of the changes occured.
We use Penn World Tables 6.2 for data on per-capita income, measured in
1996 US dollars, PPP adjusted. Trade data come instead from the UN Commodity
Trade Statistics Database (COMTRADE). For each country present in the dataset,
the latter reports detailed yearly figures on the value of exports in 777 sectors
(SITC Rev.2 classification, 4-digit) and aggregate data on the economy wide level
of exports.
of the index.5See the data description section of the Appendix for a detailed explanation of the choices
made in order to cope with these issues.
9
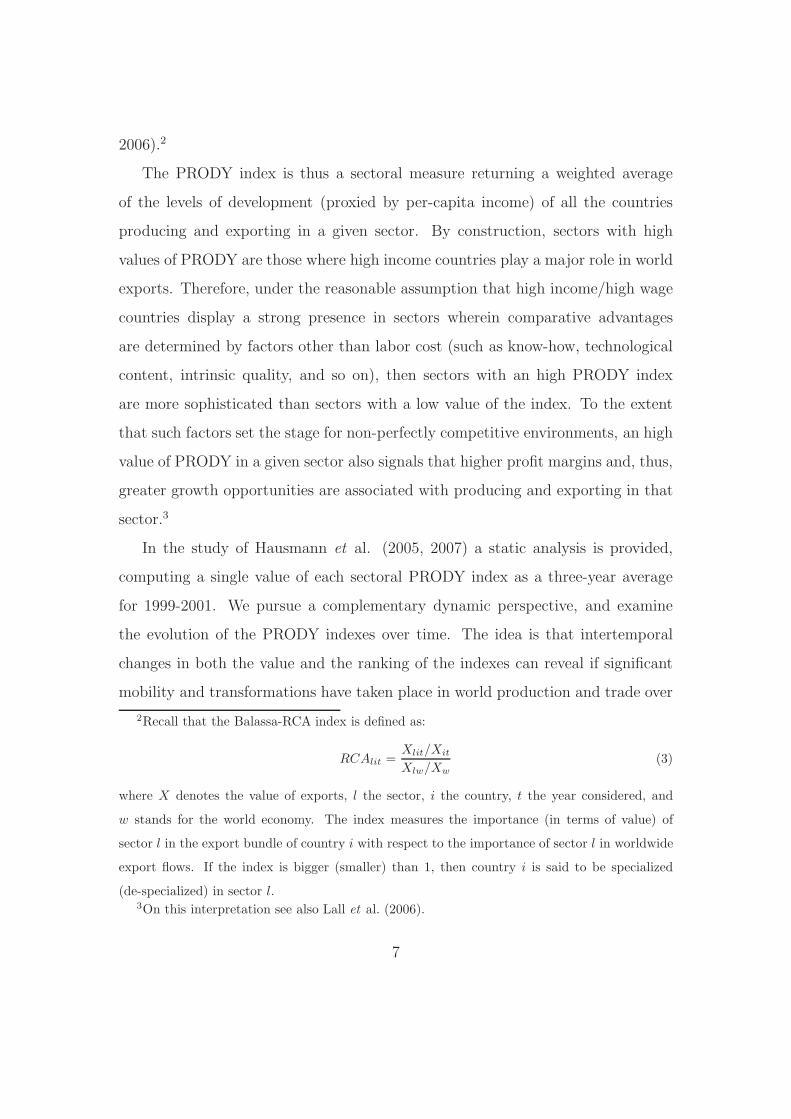
Table 1: PRODY index, descriptive statistics
1980 1990 2000
Min. 200 92 123
1st Qu. 6,567 6,304 4,568
Median 10,051 9,882 8,172
Mean 9,582 9,904 8,591
3rd Qu. 12,860 13,441 11,740
Max. 20,740 20,571 24,420
SD 4,177 4,562 4,851
Values in 1996 PPP-adjusted USD per capita.
3.1 Descriptive statistics and average dynamics
Basic descriptive statistics, presented in Table 1, are already revealing of two
empirical characteristics of the index. First, from a static point of view, the
reported numbers testify that PRODY varies greatly across sectors: within each
year the standard deviation (SD) is indeed quite high, and the index can take on
values ranging from hundreds to tens of thousands of 1996 per capita USD. Second,
considering the intertemporal dynamics of the index, one observes that significant
changes have occured over the considered years. On the one hand, the steadily
increase registered in the SD suggests that the distance between minimum and
maximum levels of sophistication has widened. On the other hand, the behavior
of the other statistics seems to indicate a leftward shift in the distribution of the
index, suggesting that the importance of sectors characterized by low PRODY
has risen, especially in the second decade: the 1-st quartile and the median both
decrease steadily, whereas the mean and the 3-rd quartile, after an increase in
10
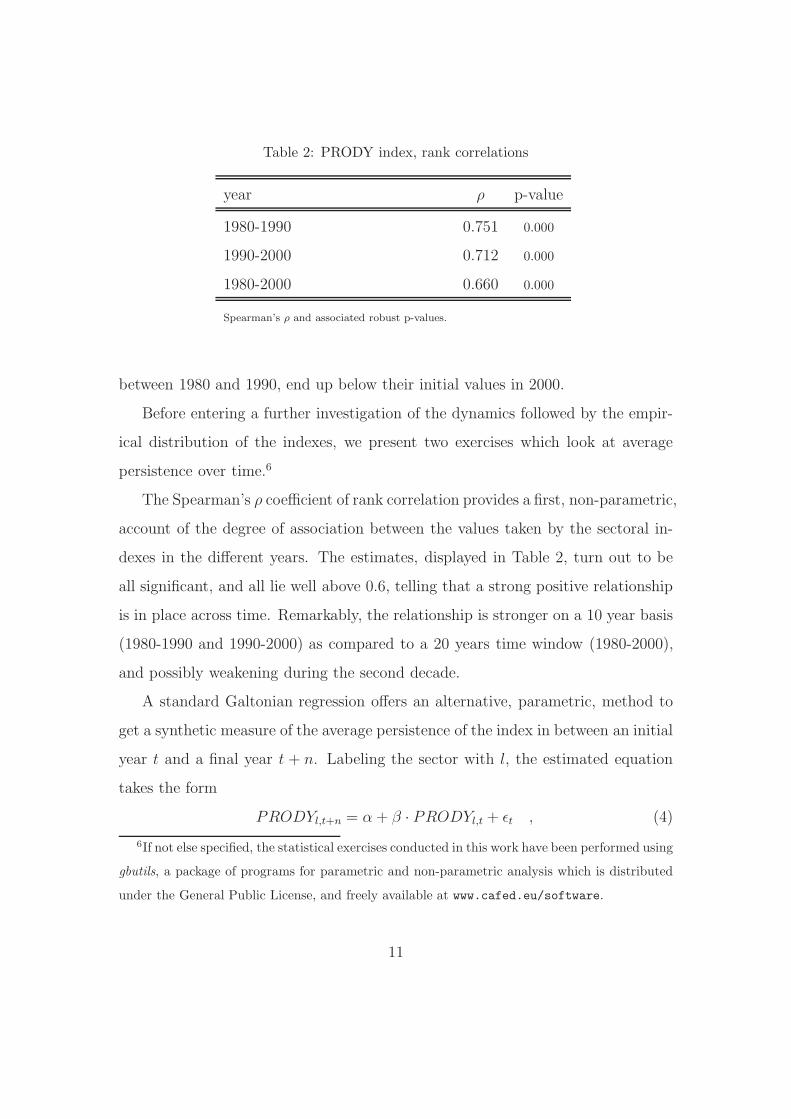
Table 2: PRODY index, rank correlations
year ρ p-value
1980-1990 0.751 0.000
1990-2000 0.712 0.000
1980-2000 0.660 0.000
Spearman’s ρ and associated robust p-values.
between 1980 and 1990, end up below their initial values in 2000.
Before entering a further investigation of the dynamics followed by the empir-
ical distribution of the indexes, we present two exercises which look at average
persistence over time.6
The Spearman’s ρ coefficient of rank correlation provides a first, non-parametric,
account of the degree of association between the values taken by the sectoral in-
dexes in the different years. The estimates, displayed in Table 2, turn out to be
all significant, and all lie well above 0.6, telling that a strong positive relationship
is in place across time. Remarkably, the relationship is stronger on a 10 year basis
(1980-1990 and 1990-2000) as compared to a 20 years time window (1980-2000),
and possibly weakening during the second decade.
A standard Galtonian regression offers an alternative, parametric, method to
get a synthetic measure of the average persistence of the index in between an initial
year t and a final year t + n. Labeling the sector with l, the estimated equation
takes the form
PRODYl,t+n = α + β · PRODYl,t + ǫt , (4)
6If not else specified, the statistical exercises conducted in this work have been performed using
gbutils, a package of programs for parametric and non-parametric analysis which is distributed
under the General Public License, and freely available at www.cafed.eu/software.
11

Table 3: PRODY index, Galtonian regression.
1980-1990 1990-2000 1980-2000
α 2215.29* 1288.79* 1386.96*(330) (270) (310)
β 0.802* 0.737* 0.752*(0.032) (0.030) (0.034)
Obs. 777 777 777
R2adj 0.539 0.480 0.418
F 909.1* 717.8* 559.3*
(*) Significant at 1% confidence level.
where the coefficient β captures what happens to the conditional average of the
cross-sectoral distribution.
The estimates in Table 3 substantially mimic the results obtained with Spear-
man’s ρ. The coefficient β is indeed significant, positive and high (above 0.7) in
all the instances, confirming that, in general, a strong positive correlation is in
place over time. Moreover we again observe that the strength of the relationship
is decreasing as we move from a 10 years to a 20 years time window.7
3.2 Distributional dynamics
Focusing on average behavior of the PRODY indexes over time, although infor-
mative, presents some limitations, in particular for what concerns the so-called
Galton-fallacy problem, discussed at length in the context of cross-country growth
regressions (among the many, see Quah, 1996; Durlaf and Quah, 1999). This
potential drawback can be overcome by focusing on the properties of the entire
7Robust standard errors are obtained via a standard ”sandwich” estimator of the vari-
ance/covariance matrix.
12
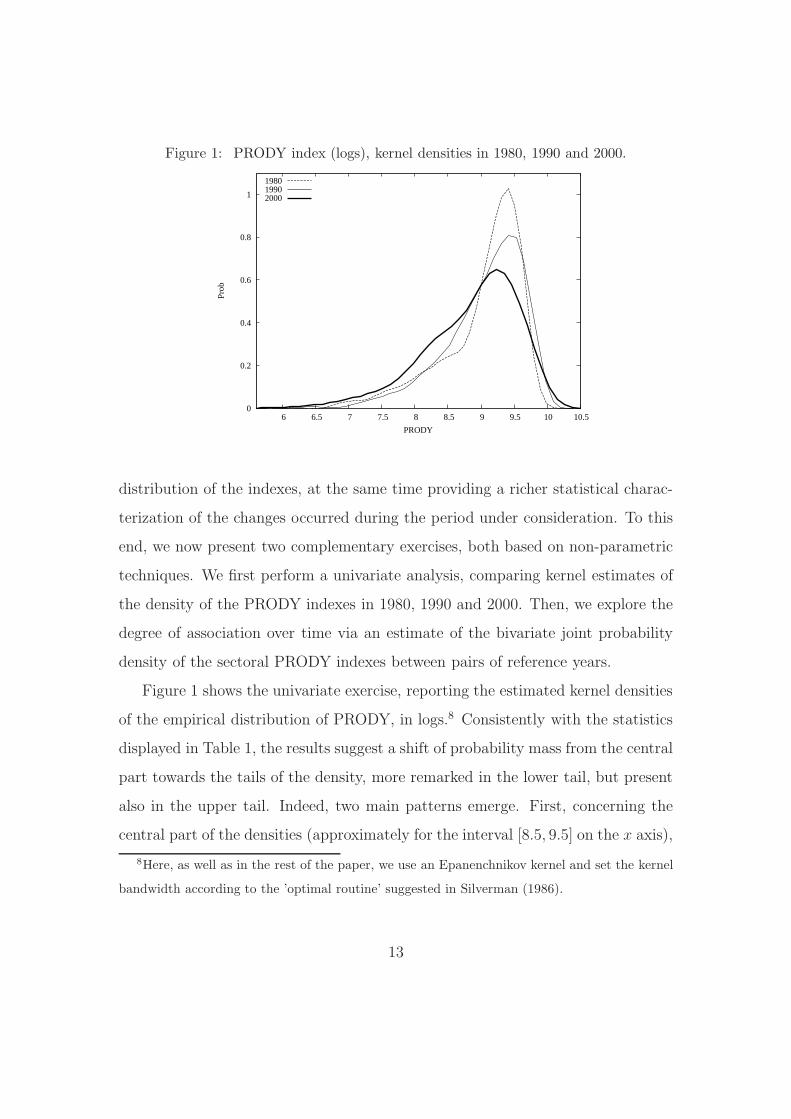
Figure 1: PRODY index (logs), kernel densities in 1980, 1990 and 2000.
0
0.2
0.4
0.6
0.8
1
6 6.5 7 7.5 8 8.5 9 9.5 10 10.5
Prob
PRODY
198019902000
distribution of the indexes, at the same time providing a richer statistical charac-
terization of the changes occurred during the period under consideration. To this
end, we now present two complementary exercises, both based on non-parametric
techniques. We first perform a univariate analysis, comparing kernel estimates of
the density of the PRODY indexes in 1980, 1990 and 2000. Then, we explore the
degree of association over time via an estimate of the bivariate joint probability
density of the sectoral PRODY indexes between pairs of reference years.
Figure 1 shows the univariate exercise, reporting the estimated kernel densities
of the empirical distribution of PRODY, in logs.8 Consistently with the statistics
displayed in Table 1, the results suggest a shift of probability mass from the central
part towards the tails of the density, more remarked in the lower tail, but present
also in the upper tail. Indeed, two main patterns emerge. First, concerning the
central part of the densities (approximately for the interval [8.5, 9.5] on the x axis),
8Here, as well as in the rest of the paper, we use an Epanenchnikov kernel and set the kernel
bandwidth according to the ’optimal routine’ suggested in Silverman (1986).
13

Figure 2: Contour plots of the joint kernel density of PRODY in subsequent years:
1980-1990 (left) and 1980-2000 (right).
0 5000 10000 15000 20000
PRODY 1990
0
5000
10000
15000
20000
PRO
DY
198
0
0 5000 10000 15000 20000
PRODY 2000
0
5000
10000
15000
20000
PRO
DY
198
0
it is observed that, although the shapes and the location of the peaks are similar,
the estimate for 1980 is much more concentrated around the modal value, while
the height of the peak falls steadily in the two subsequent reference years. Second,
looking outside the central part, both the tails are heavier in 2000 than they are
in 1980, while the distance between the minimum and the maximum value of the
support become wider as long as one moves from the initial to the final year.
Figure 2 tries to add some more information about the occurred movements.
We estimate the joint probability that the PRODY index takes on a certain value
y in a reference year and a value x in a subsequent year. Bivariate densities are
again obtained via kernel techniques, and contour plots are reported, with darkest
gray corresponding to areas where the estimated density is higher. Pairs (x, y)
lying on an imaginary positively sloped bisector represent sectors for which the
PRODY index remains unchanged in the two years, while points above (below)
the bisector correspond to sectors where the index decreases (increases).
We first comment on the left panel, where we plot the relationship between
1980 and 1990. Consistently with Figure 1, we find that the sectoral distribution
14

of PRODY experiences substantial changes. Indeed, even if the contour surfaces
are clearly positively sloped, confirming the positive association between the two
years which was already uncovered by Spearman’s ρ and Galtonian regression
(see Section 3.1), much of the probability mass actually lies above an imaginary
positively sloped bisector. This suggests that in 1990 the importance of sectors
with low-medium levels of sophistication content has increased with respect to
1980. A similar conclusion holds looking at the comparison between 1980 and
2000, plotted in the right panel of Figure 2. The sign of the relationship is again
positive, suggesting remarkable stability in the ranking of the sectoral indexes.
But, in addition to that, one also observes a shift of probability mass towards the
left-up corner, producing a further increase in the portion of density above the
bisector. As compared to the left panel, this means that an even greater number
of sectors have experienced a decrease in the index between 1980 and 2000.
3.3 Interpretation
Overall, the analyses of this section testify significant modifications in the PRODY
indexes during the period under consideration: the values become more heteroge-
neous, with most of the sectors experiencing a reduction, and some, less numerous,
characterized by an increase.
The dynamic properties of the index (discussed in Section 2) allows us to attach
an economic interpretation to our findings. Recall, first of all, the above discus-
sion concerning the effects induced on the value of PRODY by entry and exit of
different countries in world exports of each sector. We argued that the PRODY
index of a given sector is more likely to decrease when low-medium income coun-
tries start exporting in that sector. The clearcut left-swing of the probability mass
observed between 1980 and 2000, as well as the decrease observed in the value of
PRODY for many sectors, represent two findings quite consistent with this story.
15
This allows to read our evidence as robustly indicating that the important modifi-
cations occured in world trade characteristics over the last two decades are largely
attributable to the increased number of low-medium developed countries starting
to export in many of the sectors considered. In addition, we also highlighted that
the PRODY index of a given sector is increasing in the value of the per capita
incomes of the countries already exporting in that sector. This helps explaining
the increased distance between minimum and maximum values of the index, and
it might also offer an interpretation for the increase observed over time in the
weight of the upper tail. Two processes, non mutually exclusive, seem to be at
work. Sectors whose PRODY indexes increase might either be sectors where high
income incumbent countries are increasing their specialization over time, or they
might represent markets where other high income countries become new exporters
during the period.9
A straightforward and remarkable implication of the relevant changes charac-
terizing the sophistication levels of traded sectors in between 1980 and 2000 is
that what is sophisticated, and, thus, worth exporting in 1980 does not necessarily
coincide with what is sophisticated in 2000. To the extent that sophistication of
exports, as captured by the PRODY index, also represents a good proxy for the
potential contribution to aggregate growth stemming from exporting in each par-
ticular sector, the main message we draw is that it is not irrelevant to ask whether
the international specialization of a country has evolved towards one direction or
another during the same period. A sort of dichotomy seems indeed emerging be-
tween a (small) group of sectors which steadily remain highly sophisticated over
the years, and the vast majority of the other sectors, which become instead less
9Such interpretations get reinforced if one looks at entry and exit patterns in each sector. For
specific and instructive examples, see the analysis in the Appendix, where we describe in greater
detail the dynamics of the top 20 sectors in the yearly distribution of PRODY.
16

and less sophisticated, and, thus, less and less capable to sustain growth. This
suggests that, in order to assess if the pattern of specialization of a country is
sound, an interesting exercise can be performed trough comparing the evolution of
the PRODY index of each sector with the evolution of the comparative advantages
in the same sector.
In the last part of the article we apply this idea considering the Italian case.
Before coming to that, we investigate the basic characteristics of the Italian spe-
cialization pattern.
4 The evolution of the Italian pattern of special-
ization
In this section we characterize the specialization pattern of Italy by looking at the
symmetric index of Revealed Comparative Advantage, which is a useful and widely
used transformation of the classical Balassa-RCA index (Dalum et al. (1998),
Laursen (2000), Brasili et al. (2000)).10 The symmetric RCA is defined as
RCAi,l =RCAi,l − 1
RCAi,l + 1(5)
where, as before, l and i indicate the sector and the country, respectively.
As compared to the classical Balassa formulation, the RCA index keeps the
rank-ordering of the sectors unchanged, but takes on values in [−1, 1], with 0 as
demarcation value between specialization and de-specialization. While the stan-
dard Balassa index does not put any upper bound to the extent of comparative
advantage of a sector, the merit of transformation (5) is to deserve equal emphasis
10Other studies applying RCA to the Italian case are De Benedictis and Tamberi (2004) and De
Benedictis (2005). Robustness of results was checked against the use of the traditional Balassa
index, but we did not find any relevant variation in the main findings reported below.
17
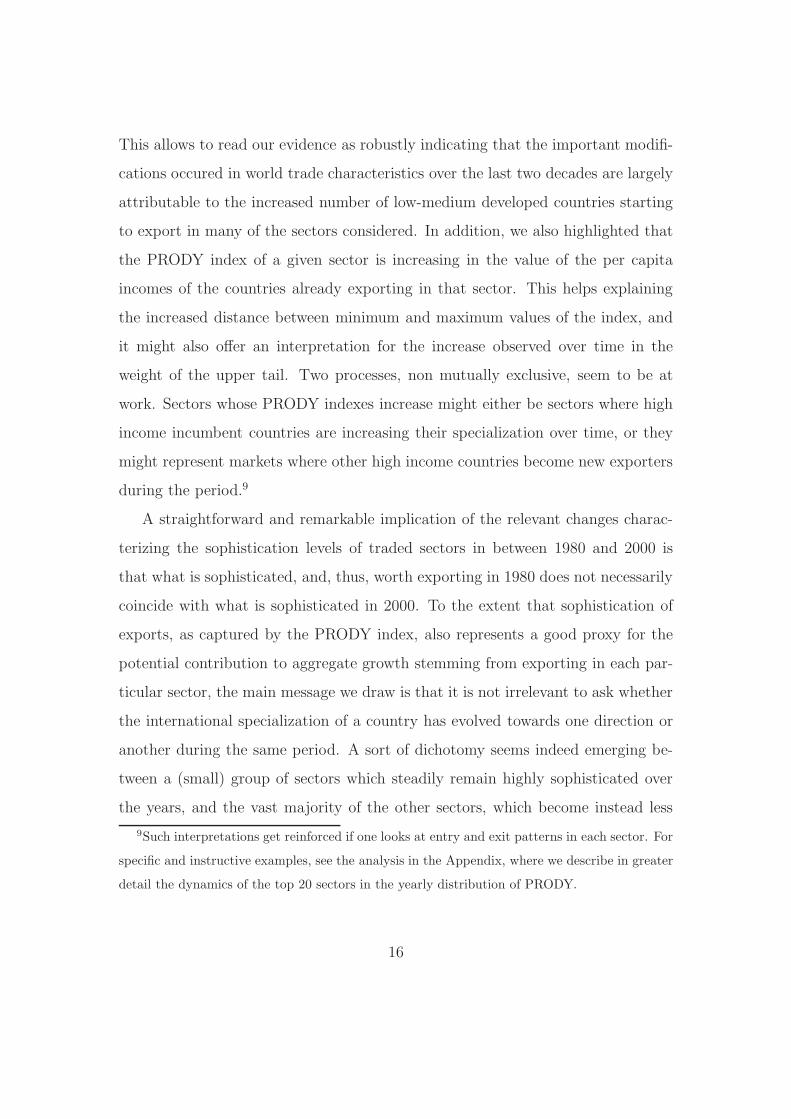
Table 4: RCA of Italy, rank correlations
year ρ p-value
1980-1990 0.807 0.000
1990-2000 0.853 0.000
1980-2000 0.723 0.000
Spearman’s ρ and associated robust p-values.
to comparative advantages and disadvantages of a country.11
We consider the period 1977-2004, the time window for which 4-digit trade
data are available for this country from COMTRADE. In parallel with the analysis
performed on the PRODY index, we first present evidence on the average dynamics
of RCA, and then focus on the characteristics of the entire distribution of the index.
The first exercise is presented in Table 4. Here we show the Spearman’s rank
correlations between the values of the RCA indexes computed in our ’usual’ refer-
ence years: 1980, 1990, and 2000. The displayed estimates are all significant and
always lie above 0.7, giving a first hint that the structure of the Italian interna-
tional specialization has been fairly persistent during the period under considera-
tion. This result has been already documented for Italy, and is much in accordance
with what it is commonly observed for other developed countries. What is more
peculiar of the Italian case is that persistence has increased over time, as suggested
by the higher coefficient estimated between 1990 and 2000.12
Next, we run a Galtonian regression of the form
RCAl,t+n = α + β · RCAl,t + ǫ , (6)
11For a deeper comparison between the classical Balassa-RCA index and the symmetric RCA
index see De Benedictis and Tamberi (2001).12For a cross-country comparison see De Benedictis and Tamberi (2004).
18

Table 5: RCA of Italy, Galtonian Regression
1980-1990 1990-2000 1980-2000
α -0.095* 0.026* -0.037*(0.011) (0.011) (0.013)
β 0.754* 0.852* 0.736*(0.020) (0.021) (0.022)
N.Obs. 777 777 777
R2adj 0.646 0.684 0.580
F 1418* 1680* 1073.6*
(*) Significant at 1% confidence level.
where l stands once again for the sector, while t and t+n indicate the initial and the
final year, respectively. The results for the 10 and 20 years time windows, reported
in Table 5, confirm what already noted.13 Indeed, the value of the β coefficients
are positive, significant and quite high, revealing considerable persistence in the
average cross-sectoral level of specialization. In addition, we again observe that
persistence is higher in the second period: the estimated value of β1990−2000 is about
0.85, against an estimated β1980−1990 of about 0.75.
Finally, changing the focus from the average behavior to the properties of the
entire distribution of the RCA indexes, we estimate the kernel density for each
year in the sample period.
A first remarkable finding concerns the high stability found over time: the main
characteristics of the yearly distributions, such as width of supports and overall
shape, remain substantially unchanged. Accordingly, Figure 3 reports only the
estimates for 1980, 1990 and 2000, since these reference years are informative of
13Robust standard errors are obtained via a standard ”sandwich” estimator of the vari-
ance/covariance matrix.
19

Figure 3: RCA of Italy, kernel densities over time
0
0.1
0.2
0.3
0.4
0.5
0.6
0.7
-1 -0.5 0 0.5 1
Prob
RCA
198019902000
the results observed over the entire period considered. The most clearcut property
is certainly represented by the strong bimodality appearing in all the years, with
a first peak placed below the demarcation value RCA = 0, and a second mode
located above that threshold. This feature is broadly in agreement with the evi-
dence reported in De Benedictis (2005), and reveals that the structure of Italian
comparative advantages is characterized by the coexistence of two different groups
of sectors: one group where Italy is and has steadily been highly specialized, and
one where Italy is and has persistently been highly de-specialized.14
In order to add statistical precision to the graphical analysis, we investigate
the presence of more than one mode in the distributions via a standard test (Sil-
verman 1986). This procedure is based on the ”critical smoothed bandwidth” of
the kernel density estimator, h(m).15 In practice, h(m) provides a test statistic
14Despite the similarity of results, there are two differences with De Benedictis (2005). First,
we use a larger sample of sectors, including non-manufacturing sectors. Second, we consider a
finer level of sectoral aggregation.15The ”critical smoothed bandwidth” is the smallest possible value of the bandwidth param-
20

Table 6: RCA of Italy, test for m-modality
Year H0: number of modes = m h(m) p-value
1980 m = 1 0.217 0.004
m = 2 0.069 0.957
1990 m = 1 0.196 0.010
m = 2 0.112 0.179
2000 m = 1 0.211 0.016
m = 2 0.094 0.529
Critical bandwidth, h(m), and associated bootstrapped p-values.
for the null hypothesis that a density has m modes, against the alternative that
the number of modes is greater than m: a large value of h(m) supports the pres-
ence of more than m modes, thus rejecting the null.16 Table 6 shows the critical
bandwidths and the estimated p-values of the test for the three reference years
of the analysis. As usual, the null hypothesis is rejected whenever the estimated
p-value is smaller than standard levels of significance. Based on this, the presence
of bimodality is accepted in all the instances, further corroborating the impression
drawn from graphical analysis. Similar results obtained in the other years suggest
eter producing an estimated density with m modes. The test is built upon the idea that if
the underlying density has m + 1 modes, then a ”large” value of h(m) is expected because a
considerable amount of smoothing is required to obtain a m-mode density from a (m + 1)-mode
density.16In order to determine how ”large” h(m) should be to reject the null, a bootstrap test is
employed. From the estimated density, N samples with replacement are drawn, and the critical
bandwidth hn(m) (n = 1, . . . , N) consistent with m-modality is computed. An estimate of the p-
value associated with the corresponding critical bandwidth is then given by #hn(m) > h(m)/N .
Numbers reported in the Table are obtained with N = 1000 replications.
21
that bimodality is persistent over the entire sample period.
Summing up, our data confirms that the Italian pattern of specialization is
characterized by two basic features: high (possibly increasing) degree of persistence
and bimodality in the structure of comparative advantages.
5 Measuring the sophistication content of the
Italian specialization pattern
The characteristics of the Italian comparative advantages, even if interesting per se,
do not provide any information about the sophistication level associated with the
specialization pattern of a country. Sophistication however represents a relevant
issue, since it allows to establish a link with the growth enhancing opportunities
possibly resulting from exporting in different sectors, thereby providing a quan-
titative basis to judge whether the specialization pattern of a country is ’sound’.
To close this gap, in this section we perform two exercises, both exploiting the
PRODY index as a measure of sophistication. We first follow Hausmann et al.
(2005, 2007) and employ the PRODY indexes to compute for Italy a country-wide
index, called EXPY, which is intended to capture the overall sophistication content
associated with the export vector of the country. We then experiment our original
contribution. We compare the evolution of the Italian comparative advantages in
each traded sector with the evolution of the PRODY indexes in the same sector.
In this way, we attempt to understand if, given the documented changes in world
trade sophistication, the highly persistent structure of specialization of Italy has
become more or less favorable to economic growth than in the past.
22
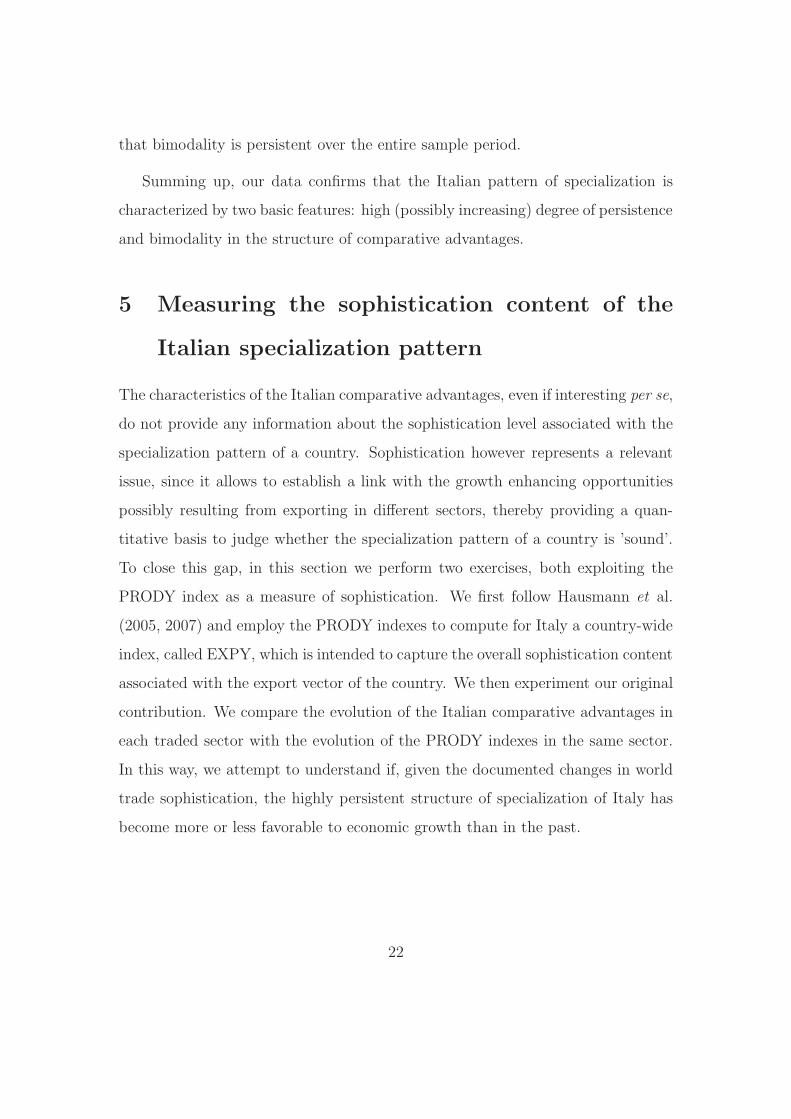
5.1 EXPY index of Italy
The EXPY index is defined as the weighted sum of the PRODY indexes of all the
sectors wherein a country is exporting, with weights given by the share of each
sector in the export vector of the country. Formally
EXPYi,t =∑
l
(xl,i
Xi
)
t
PRODYl,T , (7)
where xl,i is the value of country i’s export in sector l, Xi is the value of country i’s
overall exporting activity, and T is a reference year in which each sectoral PRODYl
is computed. The latter is fixed over time, so that an observed intertemporal
change in EXPY only results from how the sectoral export shares change year by
year.17
Taking a three-year average 1999-2001 as the reference year T for the value of
PRODY, Hausmann et al. (2005, 2007) compute the evolution of the EXPY index
for a large panel of countries during the 90’s. They show that the index is highly
correlated with per capita GDP and that countries with higher EXPY are those
which also grow more rapidly, even after controlling for initial income per head,
human capital levels, and time-invariant country-specific characteristics. One can
therefore conclude that, ceteris paribus, rich (poor) countries tend to export goods
which are exported by other rich (poor) countries, and that producing and export-
ing goods exported by richer countries represent an effective route to faster growth.
In other words, it is what an economy exports that matters for growth, rather than
its extent of specialization. Such beneficial effect of sophistication on the overall
economic performance of a country also implies that, in general, an intertemporal
increase in the EXPY index can be interpreted as a positive signal. Indeed, it
means that a country is increasingly involved in the export of sectors with high
17The EXPY index is similar to the ’income level of exports’ presented in Michaely (1984),
and to the ’sophistication level of exports’ proposed by Lall et al. (2006).
23
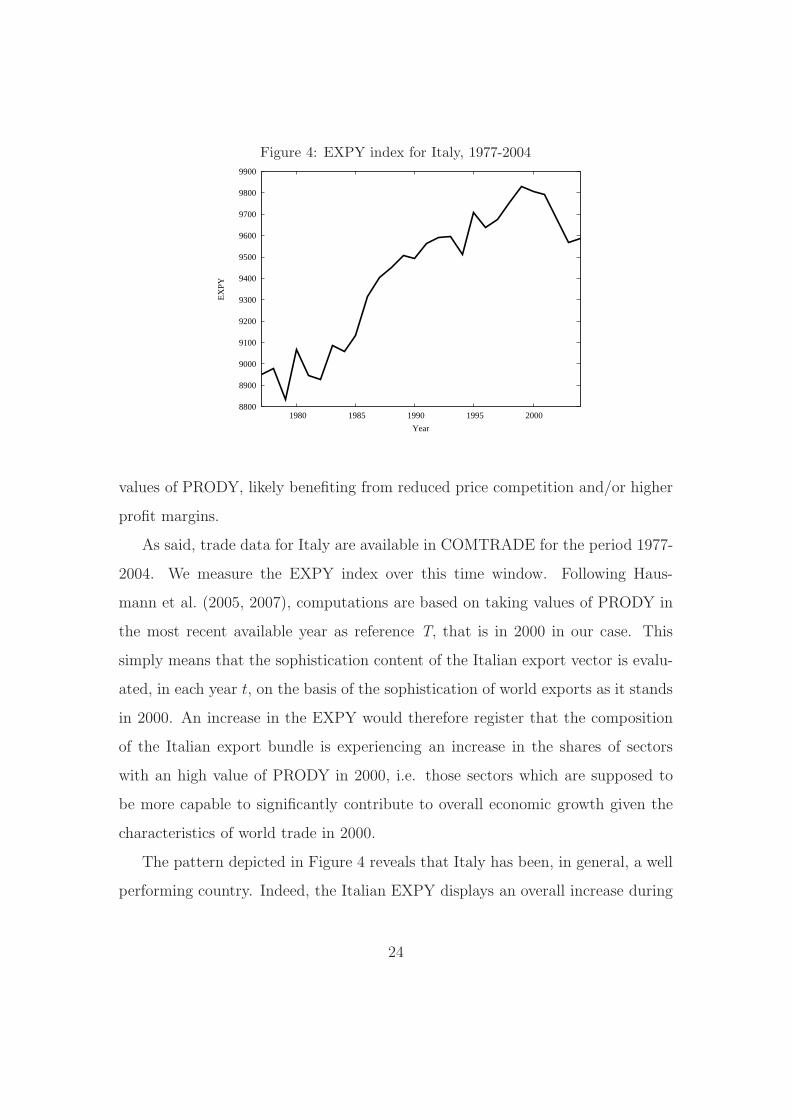
Figure 4: EXPY index for Italy, 1977-2004
8800
8900
9000
9100
9200
9300
9400
9500
9600
9700
9800
9900
1980 1985 1990 1995 2000
EX
PY
Year
values of PRODY, likely benefiting from reduced price competition and/or higher
profit margins.
As said, trade data for Italy are available in COMTRADE for the period 1977-
2004. We measure the EXPY index over this time window. Following Haus-
mann et al. (2005, 2007), computations are based on taking values of PRODY in
the most recent available year as reference T, that is in 2000 in our case. This
simply means that the sophistication content of the Italian export vector is evalu-
ated, in each year t, on the basis of the sophistication of world exports as it stands
in 2000. An increase in the EXPY would therefore register that the composition
of the Italian export bundle is experiencing an increase in the shares of sectors
with an high value of PRODY in 2000, i.e. those sectors which are supposed to
be more capable to significantly contribute to overall economic growth given the
characteristics of world trade in 2000.
The pattern depicted in Figure 4 reveals that Italy has been, in general, a well
performing country. Indeed, the Italian EXPY displays an overall increase during
24

the period, passing from 8900 per capita USD in 1977 to around 9600 per capita
USD in 2004. However, the dynamics from 1999 onwards display a reduction
which brings the sophistication content of the Italian export bundle back to the
values taken at the beginning of the 90’s. Since changes in the EXPY reflect
changes occurred in the composition of the export vector, the general finding is
that a virtuous redistribution of export shares, with highly sophisticated sectors
increasing their importance, has taken place in Italy only until the end of the 90’s.
In the most recent years, instead, the weight of sectors associated with low-medium
levels of sophistication has become more relevant, enough to cause a sharp break
in the evolution of the index.18
5.2 Dynamics of the PRODY index and the evolution of
the Italian comparative advantages
We now propose a different and novel way to use the information provided by the
PRODY indexes. While the EXPY index gives a measure of overall sophistication
content of the export vector of a country, taking the PRODY indexes fixed in
time, our idea is to exploit the information coming from computing the PRODY
indexes in different years. The basic intuition is the following. Given the intertem-
poral changes in the PRODY indexes discussed in Section 3, it is quite likely that
sophistication levels has changed for many traded goods during the years consid-
ered: sectors with high (low) PRODY in 1980 are not necessarily sectors where
PRODY is high (low) in 2000. Thus, one might want to understand if the extent
of specialization of a country in each different sector has evolved consistently with
18Of course, one could also construct the EXPY index taking the PRODY indexes of 1980 or
1990. This simply changes the benchmark year against which one is comparing the evolution of
export sophistication of a country. The main result that EXPY of Italy has performed better in
the past than in recent years is however not affected by these alternative choices.
25
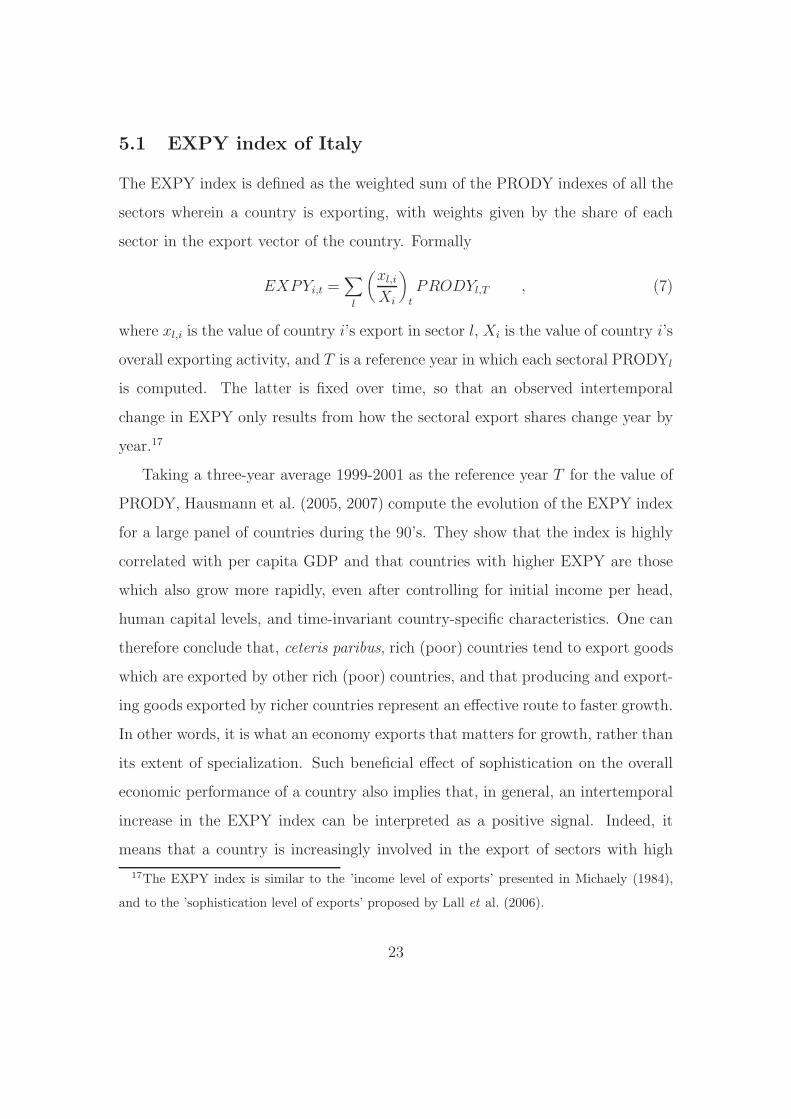
Figure 5: Italian RCA vs PRODY, non parametric regression for 1980, 1990 and 2000.
0 5 10 15
050
0010
000
1500
020
000
2500
0
RCA ITALY 1980
PR
OD
Y 1
980
0 5 10 15
050
0010
000
1500
020
000
2500
0
RCA ITALY 1990
PR
OD
Y 1
990
0 5 10 15
050
0010
000
1500
020
000
2500
0
RCA ITALY 2000
PR
OD
Y 2
000
the changing sophistication associated to the same sector. This naturally leads to
investigate the intertemporal co-evolution of the PRODY indexes with standard
measures of sectoral specialization. We apply this idea to Italy, performing simple,
but revealing, exercises which take the classical Balassa-RCA index as a measure
of specialization.
As before, we focus on 1980, 1990 and 2000 to give an idea of the intertemporal
dynamics. In the three panels of Figure 5 the x-axis shows the Italian RCA in the
777 sectors covered by the available dataset, computed for each of the reference
years and plotted against the corresponding value of the PRODY index. We also
present the result of a non-parametric regression exploring the shape and the
strength of the relationship between the two variables.19
Since, as repeatedly argued, sectors with high PRODY are likely to be sectors
wherein comparative advantages are determined by factors other than labor cost
(high quality or high technological content, for instance), thereby entailing higher
margins per unit of output sold and higher growth opportunities for the countries
19The estimates are obtained with R (see http://www.r-project.org), using the standard set-
tings of the sm and kernsmooth packages. We also report the confidence bands, giving a measure
of the statistical significance of the estimate.
26
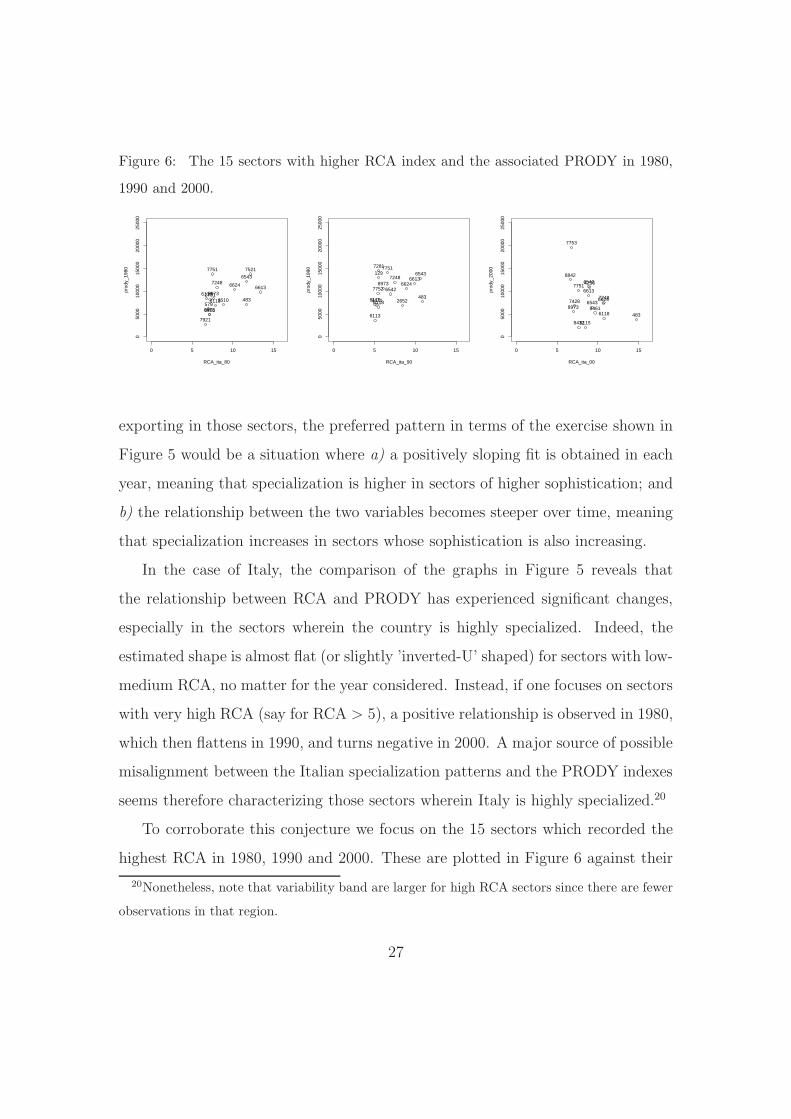
Figure 6: The 15 sectors with higher RCA index and the associated PRODY in 1980,
1990 and 2000.
0 5 10 15
050
0010
000
1500
020
000
2500
0
RCA_ita_80
prod
y_19
80
7921
6118
57969788451
2731
7751
8973
6113
7248
8510
6624
6543
483
7521
6613
0 5 10 15
050
0010
000
1500
020
000
2500
0
RCA_ita_90
prod
y_19
90
6115
6113
8471
7752
6118
1297281
8973
7751
6542
7248
2652
66246613
6543
483
0 5 10 15
050
0010
000
1500
020
000
2500
0
RCA_ita_00
prod
y_20
00
8842
7753
89737428
7751
84326115
6613
65424235
65438461
66247248
6118 483
exporting in those sectors, the preferred pattern in terms of the exercise shown in
Figure 5 would be a situation where a) a positively sloping fit is obtained in each
year, meaning that specialization is higher in sectors of higher sophistication; and
b) the relationship between the two variables becomes steeper over time, meaning
that specialization increases in sectors whose sophistication is also increasing.
In the case of Italy, the comparison of the graphs in Figure 5 reveals that
the relationship between RCA and PRODY has experienced significant changes,
especially in the sectors wherein the country is highly specialized. Indeed, the
estimated shape is almost flat (or slightly ’inverted-U’ shaped) for sectors with low-
medium RCA, no matter for the year considered. Instead, if one focuses on sectors
with very high RCA (say for RCA > 5), a positive relationship is observed in 1980,
which then flattens in 1990, and turns negative in 2000. A major source of possible
misalignment between the Italian specialization patterns and the PRODY indexes
seems therefore characterizing those sectors wherein Italy is highly specialized.20
To corroborate this conjecture we focus on the 15 sectors which recorded the
highest RCA in 1980, 1990 and 2000. These are plotted in Figure 6 against their
20Nonetheless, note that variability band are larger for high RCA sectors since there are fewer
observations in that region.
27
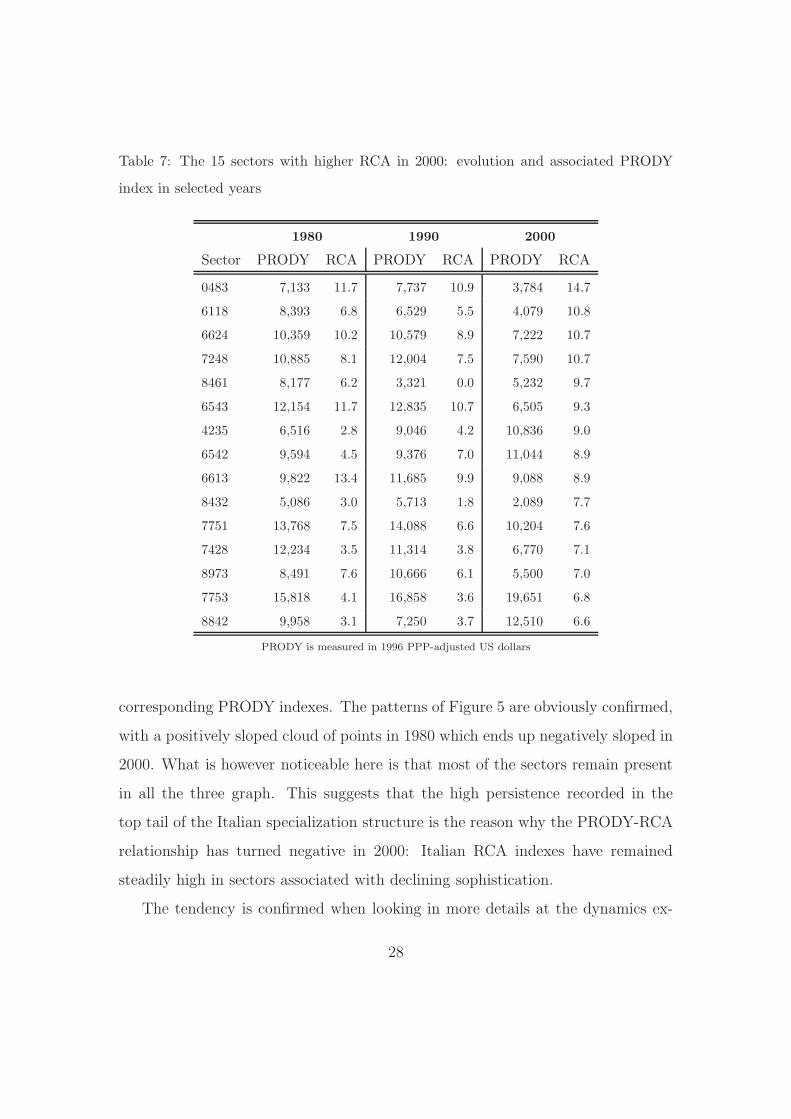
Table 7: The 15 sectors with higher RCA in 2000: evolution and associated PRODY
index in selected years
1980 1990 2000
Sector PRODY RCA PRODY RCA PRODY RCA
0483 7,133 11.7 7,737 10.9 3,784 14.7
6118 8,393 6.8 6,529 5.5 4,079 10.8
6624 10,359 10.2 10,579 8.9 7,222 10.7
7248 10,885 8.1 12,004 7.5 7,590 10.7
8461 8,177 6.2 3,321 0.0 5,232 9.7
6543 12,154 11.7 12,835 10.7 6,505 9.3
4235 6,516 2.8 9,046 4.2 10,836 9.0
6542 9,594 4.5 9,376 7.0 11,044 8.9
6613 9,822 13.4 11,685 9.9 9,088 8.9
8432 5,086 3.0 5,713 1.8 2,089 7.7
7751 13,768 7.5 14,088 6.6 10,204 7.6
7428 12,234 3.5 11,314 3.8 6,770 7.1
8973 8,491 7.6 10,666 6.1 5,500 7.0
7753 15,818 4.1 16,858 3.6 19,651 6.8
8842 9,958 3.1 7,250 3.7 12,510 6.6
PRODY is measured in 1996 PPP-adjusted US dollars
corresponding PRODY indexes. The patterns of Figure 5 are obviously confirmed,
with a positively sloped cloud of points in 1980 which ends up negatively sloped in
2000. What is however noticeable here is that most of the sectors remain present
in all the three graph. This suggests that the high persistence recorded in the
top tail of the Italian specialization structure is the reason why the PRODY-RCA
relationship has turned negative in 2000: Italian RCA indexes have remained
steadily high in sectors associated with declining sophistication.
The tendency is confirmed when looking in more details at the dynamics ex-
28
perienced by some of these sectors. In Table 7 we take the 15 sectors displaying
higher levels of specialization in 2000, and follow the “history” of their RCA and
PRODY indexes back in time, over the usual reference years. As expected sectors
with high and stable RCA are sectors wherein Italy is known to exhibit tradi-
tionally high comparative advantages, such as in sector 483 (Pasta and Similar
Products), in sector 6118 (Leather, specially dressed or finished) and in sector
6624 (Non-refractory Ceramic Bricks, Tiles, Pipes and Similar Products). In all
of these instances the RCA steadily increases, while the associated PRODY falls
significantly. Other sectors follow a similar pattern. In sector 7751 (Household
Type Laundry Equip.) the RCA is stable, but PRODY decreases from 13768 to
less than 10204 per capita USD. Sector 6115 (Sheep and Lamb Skin Leather) and
sector 8432 (Suits and Costumes for womens, of Textile fabrics) are particularly
instructive: the RCA more than doubles over time, while the PRODY index in
2000 is less than one half of its value in 1980. Obviously, there are also cases
wherein increased or stable specialization occurs in sectors recording an increase
in their PRODY index. Yet, the above regressions seem to offer a reasonable ap-
proximation: the top tail of the Italian structure of specialization is characterized
by an inverse relationship between the dynamics of world export sophistication in
a given sector and the evolution of the extent specialization in the same sector.
6 Conclusion and further research
This paper provides an empirical characterization of the sophistication of the Ital-
ian specialization pattern and of its evolution from the early 80’s to recent years,
with the goal to propose original evidence on useful to evaluate the well-known
Italian ’trade specialization anomaly’.
To this end, we employ a number of measures and methodologies. We begin
29

exploring the inter-temporal dynamics of the PRODY index, a newly proposed
measure of sophistication of traded goods. Extending the original work of Haus-
mann et al. (2005, 2007), we investigate the dynamic properties of the index and
gather novel empirical evidence on its evolution over time across 1980, 1990 and
2000. Our findings show that sophistication levels have changed with time, sig-
naling that sectors characterized by higher sophistication content at the beginning
of the sample period might well have become less sophisticated in more recent
years, and viceversa. This implies that each country, in order to enjoy the growth
enhancing opportunities associated with exporting in sophisticated sectors, must
continually adapt its positioning in international markets, trying to pursue a close
consistency with the evolution of world trade sophistication. Our analysis also
gives some indication of the possible causes lying behind the observed changes. In
particular, the evolution of the empirical distribution of the index over the period
considered seems largely resulting from the increasing role played by low-medium
developing countries in many sectors, as well as from the increasing ’leadership’ of
rich countries in more sophisticated sectors.
The second contribution of the paper is to suggest that, in order to evalu-
ate whether the specialization pattern of a country is well directed or not, one can
fruitfully compare the evolution of the sectoral PRODY indexes with the evolution
of standard measures of sectoral specialization. The application of this methodol-
ogy to Italy reveals that, by the late 90’s, the sectors where the country has been,
and still is, highly specialized, are characterized by an intertemporal reduction in
the value of the associated PRODY index. The implications for a further qual-
ification of the Italian ’trade specialization anomaly’ are relevant. Our analysis
indeed shows that, even if the highly persistent specialization pattern of Italy does
not need to represent a problem per se, the worries about the Italian ’anomaly’
are justified. While world trade is rapidly evolving, Italy is stuck with its tradi-
30

tional structure of comparative advantages, characterized by strong specialization
in sectors which, in the last years, have become less and less sophisticated, and,
thus, less and less capable to sustain growth.
The present work could be extended in various directions. We sketch here some
of the developments which are left for future work. In this work we computed RCA
measures, and, consequently, the PRODY indexes, using world-wide trade flows.
It could instead be interesting to consider specific sub-groups of countries. For
instance, one could compute RCA and PRODY only considering OECD export
flows, or, alternatively, split the analysis into two parts, distinguishing developed
vis a vis low-medium income countries. One could also think of changing the
sample of sectors considered by the analysis. Indeed, while keeping a fine level of
sectoral aggregation is important for many purposes, ’aggregating back’ the data
could help identifying common patterns across sectors which share specific char-
acteristics. Grouping sectors by Pavitt classes or by labour vs. capital intensive
sectors, would for instance allow to link sophistication with innovation and tech-
nology dynamics. Finally, it could be interesting to replicate our analysis of the
RCA-PRODY co-evolution with other countries. Such an attempt would indeed
provide a test of the proposed methodology, and it would also offer a basis to iden-
tify similarities and differences in the observed patterns of specialization. In turn,
this international comparison may also suggest some useful hints to understand
why the Italian specialization pattern has been accompanied by decreasing sophis-
tication levels in recent years. Indeed while our analysis documents this fact, it is
beyond the aims of this paper to discuss which may have been its cause(s). Many
of these factors, likely to require a study of micro data at firm level, might in fact
be specific of the Italian case and do not need not affect other countries. Think
about questions like, have the numerous exchange rates depreciation episodes re-
duced the incentives for the firms to upgrade their products (De Nardis and Trau,
31

2005) ? Or, moving to more indirect causes, is there little behavioral inclination
on the part of the Italian firms to translate productivity and profitability into
higher growth (Bottazzi et al., 2008) ? Have labour market reforms implemented
in the second half of the nineties pushed to much attention on cost saving policies,
instead than favoring productivity growth (Saltari and Travaglini, 2006) ? Have
credit markets failed to sustain the best performing firms (Fagiolo and Luzzi, 2006;
Angelini and Generale, 2008) ? All of these issues have possibly been relevant. Fur-
ther research is needed, because the symptoms described in this paper certainly
call for a careful diagnosis as well as for an appropriate cure.
References
ANGELINI P. – GENERALE A., “On the evolution of firm size distributions”,
American Economic Review, vol.98, no.1, 2008, pp. 426-38.
BOTTAZZI G. – SECCHI A. – TAMAGNI F., “ Productivity, Profitability and
Financial Performance”, Industrial and Corporate Change, vol. 147, no. 4, 2008,
pp. 711-751.
BRASILI A. – HELG R. – EPIFANI P., “On the dynamics of trade patterns”, De
Economist, vol. 148, no. 2, 2000, pp. 233-257.
DALUM B. – LAURSEN K. – VERSPAGEN B., “Does specialization matter for
growth ?”, Industrial and Corporate Change, vol. 8, no. 2, 1999, pp. 267-288.
DALUM B. – LAURSEN K. – VILLUMSEN G., “Structural change in OECD
export specialization pattern: De-specialization and stickiness”, International
Review of Applied Economics, vol. 12, 1998, pp. 447-467.
32
DE BENEDICTIS L., “ Three decades of Italian comparative advantages”, The
World Economy, vol. 28, 2005, pp. 1679-1709.
DE BENEDICTIS L. – TAMBERI M., “A note on the Balassa index of revealed
comparative advantage”, 2001, mimeo.
DE BENEDICTIS L. – TAMBERI M., “Overall specialization empirics: techniques
and applications”, Open Economies Review, vol. 15, 2004, pp. 323-346.
DE NARDIS S. – TRAU F., Il modello che non c’era. L’Italia e la divisione
internazionale del lavoro industriale, Rubbettino, 2005.
DI MAIO M. – TAMAGNI F., “The Evolution of World Trade and the Italian
Anomaly: A New Look”, Centro Studi Luca d’Agliano Development Working
Papers, no. 227, 2007.
DOSI G. – PAVITT K. – SOETE L., The Economics of Technical Change and
International Trade, New York, Harvester Wheatsheaf, 1990.
DURLAUF S.N. – QUAH D.T., “The new empirics of economic growth”, in Hand-
book of Macroeconomics, TAYLOR J. – WOODFORD M. (eds.), Amsterdam,
North-Holland, 1999.
EPIFANI P., “Sulle determinanti del modello di specializzazione internazionale
dell’Italia”, Politica Economica, vol. 15, no. 2, 1999, pp. 195-224.
FAGIOLO G. – LUZZI A., “Do liquidity constraints matter in explaining firm
size and growth ? Some evidence from the Italian manufacturing industry”,
Industrial and Corporate Change, vol.15, no. 1, 2006, pp. 173-202.
FAINI R., “Fu vero declino ? L’Italia negli anni ’90”, Il Mulino, 2004, pp. 1072-
1083.
33
FEENSTRA R.C. – ROSE A.K., “Putting things in order: patterns of trade dy-
namics and growth”, The Review of Economics and Statistics, vol. 82, no. 3,
2000, 369-382.
GROSSMAN G.M. – HELPMAN E., Innovation and Growth in the Global Econ-
omy, Cambridge, MIT Press, 1991.
HAUSMANN R. – HWANG J. – RODRIK D., “What you export matters”, NBER
Working Paper, no. 11905, 2005.
HAUSMANN R. – HWANG J. – RODRIK D., “What you export matters”, Jour-
nal of Economic Growth, vol. 12, 2007, pp. 1-25.
KALDOR N., Causes of the slow rate of growth of the United Kingdom, Cambridge,
Cambridge University Press, 1966.
LALL S. – WEISS J. – ZHANG J., “The sophistication of exports: a new measure
of product characteristics”, QEH Working Paper Series, no. 123, 2006.
LAURSEN K., Specialization, trade and growth, London, Routhledge, 2000.
MONTI P., “Caratteristiche e mutamenti della specializzazione delle esportazioni
italiane”, Temi di Discussione no. 559, Banca d’Italia, 2005.
MICHAELY M., Trade, income levels, and dependence, Amsterdam, North-
Holland, 1984.
ONIDA F., “Quali prospettive per il modello di specializzazione internazionale
dell’Italia ?”, Economia Italiana, vol. 3, 1999, pp. 573-626.
PASINETTI, L. L., Structural change and economic growth, Cambridge, Cam-
bridge University Press, 1981.
34
QUAH D.T., “Empirics for economic growth and convergence”, European Eco-
nomic Review, vol. 90, 1996, pp. 1353-1375.
RODRIK D., “What’s so special about China’s exports ?”, China & World Econ-
omy, vol. 14, 2006, pp. 1-19.
SALTARI E. – TRAVAGLINI G., Le radici del declino economico. Occupazione e
produttivita in Italia nell’ultimo decennio, Torino, UTET, 2006.
SILVERMAN B.W., Density estimation for statistics and data analysis, London,
Chapman and Hall, 1986.
THIRWALL A.P., “The balance of payments constraint as an explanation of inter-
national growth rate differences”, Banca Nazionale del Lavoro Quarterly Review,
vol. 3, 1979, pp. 245-53.
35
Appendix
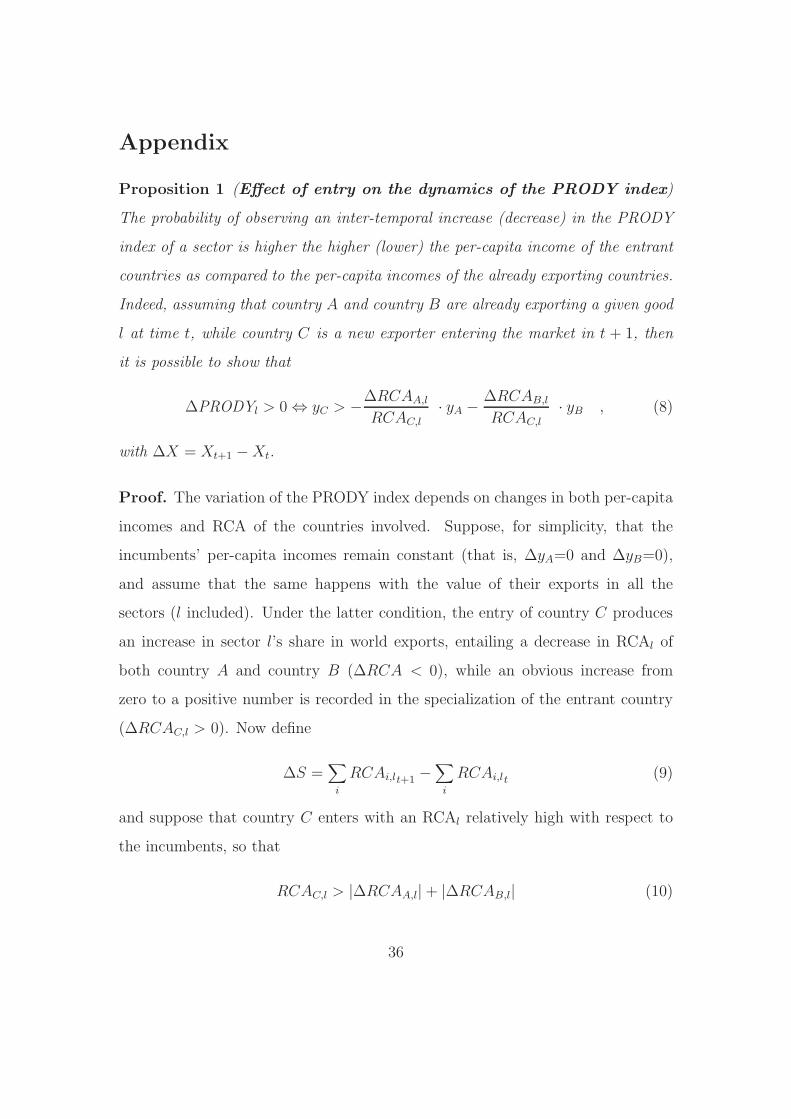
Proposition 1 (Effect of entry on the dynamics of the PRODY index)
The probability of observing an inter-temporal increase (decrease) in the PRODY
index of a sector is higher the higher (lower) the per-capita income of the entrant
countries as compared to the per-capita incomes of the already exporting countries.
Indeed, assuming that country A and country B are already exporting a given good
l at time t, while country C is a new exporter entering the market in t + 1, then
it is possible to show that
∆PRODYl > 0 ⇔ yC > −∆RCAA,l
RCAC,l
· yA −∆RCAB,l
RCAC,l
· yB , (8)
with ∆X = Xt+1 − Xt.
Proof. The variation of the PRODY index depends on changes in both per-capita
incomes and RCA of the countries involved. Suppose, for simplicity, that the
incumbents’ per-capita incomes remain constant (that is, ∆yA=0 and ∆yB=0),
and assume that the same happens with the value of their exports in all the
sectors (l included). Under the latter condition, the entry of country C produces
an increase in sector l’s share in world exports, entailing a decrease in RCAl of
both country A and country B (∆RCA < 0), while an obvious increase from
zero to a positive number is recorded in the specialization of the entrant country
(∆RCAC,l > 0). Now define
∆S =∑
i
RCAi,lt+1 −∑
i
RCAi,lt(9)
and suppose that country C enters with an RCAl relatively high with respect to
the incumbents, so that
RCAC,l > |∆RCAA,l| + |∆RCAB,l| (10)
36
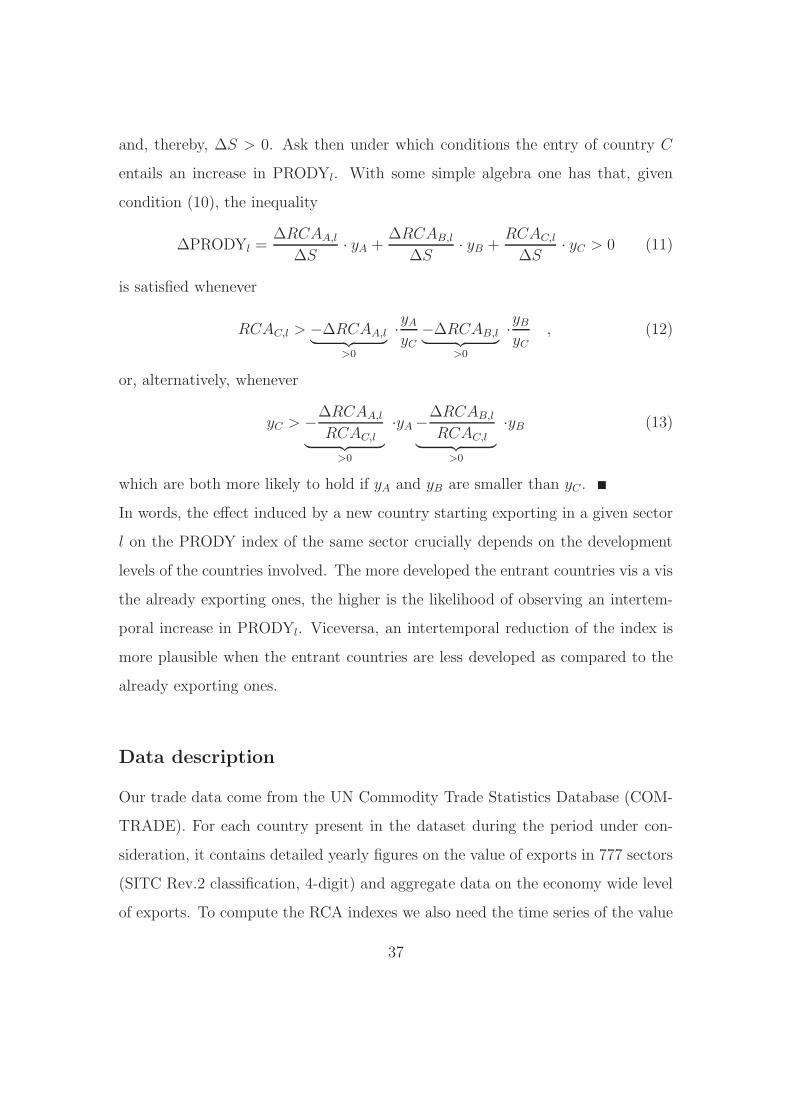
and, thereby, ∆S > 0. Ask then under which conditions the entry of country C
entails an increase in PRODYl. With some simple algebra one has that, given
condition (10), the inequality
∆PRODYl =∆RCAA,l
∆S· yA +
∆RCAB,l
∆S· yB +
RCAC,l
∆S· yC > 0 (11)
is satisfied whenever
RCAC,l > −∆RCAA,l︸ ︷︷ ︸
>0
·yA
yC
−∆RCAB,l︸ ︷︷ ︸
>0
·yB
yC
, (12)
or, alternatively, whenever
yC > −∆RCAA,l
RCAC,l︸ ︷︷ ︸
>0
·yA −∆RCAB,l
RCAC,l︸ ︷︷ ︸
>0
·yB (13)
which are both more likely to hold if yA and yB are smaller than yC .
In words, the effect induced by a new country starting exporting in a given sector
l on the PRODY index of the same sector crucially depends on the development
levels of the countries involved. The more developed the entrant countries vis a vis
the already exporting ones, the higher is the likelihood of observing an intertem-
poral increase in PRODYl. Viceversa, an intertemporal reduction of the index is
more plausible when the entrant countries are less developed as compared to the
already exporting ones.
Data description
Our trade data come from the UN Commodity Trade Statistics Database (COM-
TRADE). For each country present in the dataset during the period under con-
sideration, it contains detailed yearly figures on the value of exports in 777 sectors
(SITC Rev.2 classification, 4-digit) and aggregate data on the economy wide level
of exports. To compute the RCA indexes we also need the time series of the value
37

of world exports in each single sector, as well as the figures about the overall value
of world exports. Both the series are available in COMTRADE. The major caveat
concerns the number of countries included, which varies from year to year, for rea-
sons going from simple non-reporting to processes of integration and separation,
changes of name, and so on, occured during in the period considered. The same
happens also with the Penn World Tables 6.2, from which we get the data about
real per-capita GDP. This fact represents a potential drawback for our specific
purpose of following the evolution of the PRODY indexes over time. Indeed, as
mentioned in the text (and suggested by Proposition 1), a careful construction of
the index would require non-missing observations on a large panel of countries over
the entire sample period considered, so that observed changes in each sectoral in-
dex truly results from actual trade and income dynamics, rather than from a mere
loss of data in a particular year.
To cope with this point, a first choice we made was to restrict the attention
to three years (1980, 1990 and 2000), as reference for inter-temporal comparisons.
Then, one would be tempted to consider only those countries for which both trade
and income data are available in these years. Yet one can follow a better strat-
egy allowing to fully exploit the trade data. To understand how just consider the
definition of the index (see equation 1 in the text) and recall that si,l, the weights
assigned to the per-capita GDP of each country, are computed considering the
RCA of all the countries exporting good l in each year. Take, for instance, the
hypothetical situation where only two countries, say the US and Bangladesh, ex-
port in sector l, and imagine that income data for all the years are available from
Penn World Tables for the US only.21 Further, suppose that Bangladesh, given
21Incidentally, note that this is likely to be the typical situation which one has to face in
practice, since non-reporting rates (actually for both trade and income data) are usually much
higher among low-medium income countries, especially at the beginning of the time period.
38
its relatively un-differentiated export bundle, is highly specialized in commodity l,
while the US have a moderate RCAl, implying that si,l is very high for Bangladesh
(say 0.9) and very low (0.1) for the US. Now, excluding Bangladesh tout court
from the sample only because its income data are not reported in all the years
would assign a weight si,l = 1 to the US, resulting in a value of PRODYl artifi-
cially high and equal to the per-capita income of the US. Therefore, we proceed in
two steps. We first compute the si,l using export data of all the countries present
in the COMTRADE dataset in each single reference year, no matter whether the
same countries are present in the Penn World Tables in the same years.22 It is
only after this step that we worry about which country can be included in the
balanced panel needed for a correct computation of each sectoral PRODY index.
At this point, in order to keep inter-temporal comparability under control as much
as possible, one cannot do much better than simply focusing on those countries for
which per-capita GDP is available in all of the three reference years. Whenever
possible, we try to ”save” as many countries as we can, keeping track, in particular,
of unification or separation processes, as well as of changes in the official name of
the states.23 In the end, we are left with 90 countries.
22Of course not all the countries do export in all of the 777 sectors, and when a zero is reported
in COMTRADE one has simply to assume that it is precisely because that particular country is
not exporting in that particular sector.23For instance, COMTRADE reports exports data for Benelux in 1980 and 1990, but for Bel-
gium and Luxembourg, separately, in 2000. Our choice is to keep the two countries together into a
fictitious aggregate entity, attributing to it the sum of the two countries’ per-capita GDP, divided
by two. The same we do with Slovak Republic and Czech Republic, reported as Czechoslovakia
in 1980, before they split.
39
The dynamics of the PRODY index: four sectoral examples
To offer additional understandings of the evolution of the PRODY indexes over
time, we perform an instructive albeit simple investigation. In Table 8 we report
the values of PRODY for the 20 best ranked sectors in each of the three reference
years. Then, we go back to the rough export-income data and identify which
countries are involved in world exports of these sectors in each year, and reconstruct
the evolution of the associated si,l, the normalized RCA appearing in the definition
of PRODY. This exercise allows to give a flavour of the various dynamics present
in the data.
The most common are well exemplified by 4 sectors. The first interesting
pattern emerges in Sector 6733 (Angles, Shapes, Sections and Sheet Pilling of Iron
or Steel), ranked first in 2000. This provides an example of a sector displaying
an high value of PRODY simply because one of the countries with the higher per
capita income in 2000, namely Luxembourg, exhibits a very high normalized RCA
in this sector (approximately 0.45).24
24Note that sector 6733 is not in the top 20, neither in 1990, nor in 1980, apparently in contrast
with one might expect, given a certain degree of stability the observed in the ranking. The reason
for this evidence is particularly interesting, as it shows how sensitive the index is with respect
to data constraints. Indeed what happens here is simply that, as mentioned above, for 1980
and 1990 we only have export data about Benelux, rather that about Belgium and Luxembourg
separately, so that we need to build a fictitious ”aggregate country” attributing to Benelux the
sum of per capita GDP of Belgium and Luxembourg, divided by two. Thus, the extent of
specialization in this sector in 1980 and 1990, presumably very high for Luxembourg alone, is
mitigated by the low specialization of Belgium, resulting into a normalized RCA for Benelux as a
whole which is much lower than that for Luxembourg alone. The same happens with per capita
incomes: aggregating the two countries fictitiously lowers the income of the -presumably- most
specialized actor in this sector, Luxembourg. Both the effects are clearly likely to be responsible
for the disappearance of sector 6733 from the list in 1980 and 1990. Haven’t we coped with these
data driven problems, 6733 would have probably had an high index also before 2000.
40

Table 8: The 20 sectors with highest PRODY index, selected years.
1980 1990 2000
Sector PRODY Sector PRODY Sector PRODY
3415 20,740 451 20,571 6733 24,420
6880 19,580 7268 20,320 121 24,329
7268 19,488 9510 20,048 6812 22,886
7187 18,406 2860 19,394 6880 22,879
2226 18,188 8996 19,313 6631 22,080
7245 17,917 7741 19,302 5147 22,069
5147 17,885 2120 19,147 5156 21,835
7129 17,811 7251 19,099 6647 21,557
7126 17,366 8744 19,011 8813 21,130
7911 17,266 121 18,981 7251 20,544
6812 17,239 6642 18,937 5332 20,364
7252 16,884 7259 18,875 6644 19,977
8996 16,753 7252 18,844 7268 19,962
5163 16,739 7423 18,671 5827 19,797
7264 16,587 5827 18,670 7753 19,651
7412 16,556 6411 18,635 6572 19,609
7434 16,545 8851 18,556 6412 19,560
5411 16,535 5411 18,457 7213 19,479
7784 16,521 7931 18,402 7412 19,387
7246 16,473 7264 18,376 6418 19,160
Values in 1996 PPP-adjusted US dollars
Instructive dynamics are also followed by sector 121 (Bacon, Ham and other
Dried, Salted, Smoked Meat), second in 2000. We have here an example of a
sector where the PRODY index moves together with the GDP of the countries
which display a stable leadership in world exports of this sector, and ends up
ranking well exactly because the main exporters are rich countries. Indeed, in all
of the reference years considered, Denmark is the most specialized country, with a
normalized RCA of about 0.45 in 2000 and 0.5 in the previous periods, while Italy,
Luxembourg and The Netherlands represent substantially all the remaining part,
41
with si,l varying between 0.1 and 0.2. Thus, it is not surprising that the PRODY
index follows the increase characterizing the incomes of Denmark and of the other
main players: out of the top 20 in 1980 (PRODY ≃ 12000 per capita USD, not
reported in the Table), the sector moves to the tenth place in 1990 and ends up
second in 2000.
Sector 6812 (Platinum and Other Metals of the Platinum), ranked third in 2000,
provides a clearcut example of a falling PRODY due to low-medium developing
countries entering world exports. Indeed, although the UK is also important in this
sector (with si,l ≃ 0.2), Switzerland is the main responsible for the high ranking in
2000, since its normalized RCA is approximately 0.6 and its GDP per capita is one
of the highest in this year. The sector is well positioned (12th) also in 1980, when
very few countries, and mainly rich (Switzerland and the UK) are significantly
specialized in the export of this industry. On the contrary, the value of the index
falls dramatically to approximately 9500 per capita USD (around the 400th place)
in 1990. The reason for this decline is that many countries enter the market in
1990, and they are all countries with low-medium levels of per-capita income.
Accordingly, though the extent of specialization of the rich countries active in the
sector (Switzerland and the UK) remains similar to that of 1980, the weights si,l
assigned to their per-capita incomes in the computation of the index are much
lower. What happens with Switzerland is particularly striking, with si,l ≃ 0.04 in
1990. This kind of pattern is what Figure 1 suggest to have likely occured over
time in many industries: the entry of low developing countries during the years
considered has likely produced a widespread reduction in the values of PRODY.
Then, if rich countries take again the leadership, or at least a prominent role in
terms of relative weight (this is the case for Switzerland in 2000) the index becomes
high again. If instead low-medium income countries keep a strong presence, the
index continues its fall. This latter evolution is well exemplified by the dynamics
42

in Sector 3415 (Coal Gas, Water Gas, Producer Gas and Similar Gases). Ranked
first in 1980, when Switzerland has a very high normalized RCA, this sector goes
out of the top 20 in the following years, when Switzerland is becoming less and
less present (si almost zero in 2000), while low income countries (Zimbabwe, Chad
and Qatar) acquire the highest shares by the end of the sample period.
43