Embed Size (px)
Citation preview
GENETICS | INVESTIGATION
The Evolution of Selfing Is Accompanied byReduced Efficacy of Selection and Purging
of Deleterious MutationsRamesh Arunkumar,*,1 Rob W. Ness,† Stephen I. Wright,* and Spencer C. H. Barrett*
*Department of Ecology and Evolutionary Biology, University of Toronto, Toronto, Ontario, Canada, M5S 3B2, and †Institute ofEvolutionary Biology, University of Edinburgh, Ashworth Laboratories, EH9 3FL Edinburgh, Scotland
ABSTRACT The transition from outcrossing to selfing is predicted to reduce the genome-wide efficacy of selection because of the lowereffective population size (Ne) that accompanies this change in mating system. However, strongly recessive deleterious mutations exposed inthe homozygous backgrounds of selfers should be under strong purifying selection. Here, we examine estimates of the distribution offitness effects (DFE) and changes in the magnitude of effective selection coefficients (Nes) acting on mutations during the transition fromoutcrossing to selfing. Using forward simulations, we investigated the ability of a DFE inference approach to detect the joint influence ofmating system and the dominance of deleterious mutations on selection efficacy. We investigated predictions from our simulations in theannual plant Eichhornia paniculata, in which selfing has evolved from outcrossing on multiple occasions. We used range-wide sampling togenerate population genomic datasets and identified nonsynonymous and synonymous polymorphisms segregating in outcrossing andselfing populations. We found that the transition to selfing was accompanied by a change in the DFE, with a larger fraction of effectivelyneutral sites (Nes, 1), a result consistent with the effects of reduced Ne in selfers. Moreover, an increased proportion of sites in selfers wereunder strong purifying selection (Nes . 100), and simulations suggest that this is due to the exposure of recessive deleterious mutations.We conclude that the transition to selfing has been accompanied by the genome-wide influences of reduced Ne and strong purifyingselection against deleterious recessive mutations, an example of purging at the molecular level.
KEYWORDS mating system; selection efficacy; Eichhornia paniculata; effective population size; dominance
MATING system transitions provide important opportu-nities to investigate the influence of genetic drift
and natural selection on plant genomes. The evolution ofpredominant self-fertilization (selfing) from cross-fertilization(outcrossing) is recognized as the most frequent evolutionarytransition involving the reproductive systems of floweringplants (Stebbins 1957). Although selfing may be favored inthe short term, due to the transmission advantage of selfingvariants and ability of individuals to set seed in pollen-limitedconditions, selfing species represent only 10–15% of angio-sperms and predominant selfing is often viewed as an evolu-tionary dead end (reviewed in Igic and Busch 2013; Wrightet al. 2013; Barrett et al. 2014). The ephemeral nature ofselfing lineages may be primarily due to the accumulation of
deleterious mutations (Charlesworth et al. 1993a). Also, a re-duced rate of fixation of beneficial mutations can limit theability of selfing populations to adapt to changing environ-ments (Glémin and Ronfort 2013). Nevertheless, empirical sup-port for selfing as an evolutionary dead end is mixed (reviewedin Takebayashi and Morrell 2001; Igic and Busch 2013). Char-acterizing the frequency of mutations and selection pressuresacting on them in selfing populations should provide insightinto why some populations persist while others go extinct.
Theoretical models predict the efficacy of selection shouldbe lower in genomes of selfing compared to outcrossingpopulations, because all else being equal, the effective pop-ulation size (Ne) is reduced in selfers (Charlesworth et al.1993b; Charlesworth and Wright 2001; Wright et al. 2008).In selfers, Ne is reduced owing to restricted recombination butalso by demographic factors because single individuals havethe ability to found colonies resulting in population bottlenecks(Baker 1955; Lloyd 1980; Charlesworth and Wright 2001;Pannell and Fields 2014). With a genome-wide reduction inthe Ne of selfers, genetic drift will become more prevalent,reducing genetic variation and limiting the efficacy of selection.
Copyright © 2015 by the Genetics Society of Americadoi: 10.1534/genetics.114.172809Manuscript received November 15, 2014; accepted for publication December 24,2014; published Early Online December 30, 2014.Supporting information is available online at http://www.genetics.org/lookup/suppl/doi:10.1534/genetics.114.172809/-/DC1.1Corresponding author: 25 Willcocks St., Toronto, ON, Canada, M5S 3B2.E-mail: [email protected]
Genetics, Vol. 199, 817–829 March 2015 817

Moreover, greater linkage among weakly selected sites underopposing selective forces may interfere with selection efficiency(McVean and Charlesworth 2000; Comeron et al. 2008). Thus,both demographic and genetic processes in selfing populationscan interact to reduce the efficacy of natural selection.
Early investigations of the genomic consequences of tran-sitions from outcrossing to selfing based on divergence amongrelated outcrossing and selfing species provided limited supportfor theoretical predictions of a reduced efficacy of selectionin selfing populations [e.g., Arabidopsis (Wright et al. 2002),Mimulus (Sweigart and Willis 2003), Caenorhabditis (Cutteret al. 2006), and Triticeae (Haudry et al. 2008; Escobar et al.2010)]. More recent findings of elevated levels of deleteriouspolymorphisms or a greater frequency of unpreferred codons inselfing Arabidopsis (Cao et al. 2011; Qiu et al. 2011), Eichhornia(Ness et al. 2012), Capsella (Qiu et al. 2011; Brandvain et al.2013; Slotte et al. 2013), Collinsia (Hazzouri et al. 2013), andNeurospora (Gioti et al. 2013) are consistent with the hypothe-sis of relaxed selection in selfing populations.
The efficacy of selection in selfing populations will also beaffected by how strongly recessive mutations are masked byheterozygosity. A negative relation between the dominanceof mutations and their deleterious effects has been hy-pothesized (Simmons and Crow 1977; Crow and Simmons1983). Since deleterious mutations are on average partiallyrecessive (h � 0.2–0.25; Agrawal and Whitlock 2011;Manna et al. 2011), the more homozygous backgrounds ofselfing populations offer fewer chances for the masking ofmutations, and this should result in more effective selectionagainst deleterious mutations (Pollak 1987; Caballero and Hill1992; Charlesworth 1992; Glémin 2007). Indeed, theory pre-dicts that strongly deleterious, highly recessive mutations aremore likely to be purged by selection after recurrent inbreeding(Hedrick 1994; Wang et al. 1999), even though both stronglyand mildly deleterious mutations contribute to inbreeding de-pression (Charlesworth and Charlesworth 1999; Wang et al.1999; Charlesworth and Willis 2009). If a large proportion ofdeleterious mutations are strongly recessive, selfing populationscould persist if deleterious mutation load is purged (Barrett andCharlesworth 1991; Glémin and Ronfort 2013). Purging hasbeen documented across mammals, insects, mollusks, andplants, based on assays of fitness traits (Crnokrak and Barrett2002). More recently, Szövényi et al. (2014) using divergence-based metrics found genomic evidence for stronger selectivepressures acting on a moss species with haploid-dominant lifecycle undergoing intragametophytic selfing. However, theyfound no evidence for the role of reduced Ne.
One reason for the weak empirical support for theoreticalexpectations on changes in selection efficacy could be thatthe effects of reduced Ne and increased homozygosity coun-teract one another in selfers. A reduction in Ne is expected tolower selection efficacy, whereas increased homozygosityshould make selection more efficient by exposing recessivemutations. Glémin (2007) predicted that relaxed selectionshould be detected under a range of mutation and popula-tion size parameters in spite of the countervailing effect of
homozygosity. Moreover, he found that divergence-basedmeasures of selection were more likely to reveal differencescompared to those based on polymorphism data. However,recently derived selfing lineages, which may be most com-mon, are unlikely to have had sufficient time to accumulatemany substitutions.
An approach for investigating the counteracting effects ofreduced Ne and increased homozygosity is to characterizethe underlying distribution of fitness effects of mutationsusing polymorphism data. In particular, the method ofKeightley and Eyre-Walker (2007), jointly estimates selec-tive and demographic parameters to infer the distribution offitness effects (hereafter DFE) of new nonsynonymous muta-tions. This method allows a single population size changemaking it more robust to violations of assumptions due todemographic history and summarizes the effective strength ofselection (Nes) acting on new nonsynonymous mutations. Inselfing populations with reduced Ne, we expect a shift in theDFE such that there are a higher proportion of effectively neu-tral mutations (Nes , 1). More efficient purging of recessivedeleterious mutations may shift the DFE in the opposite direc-tion, resulting in a higher fraction of strongly deleterious muta-tions. However, the DFE approach assumes all mutations arecodominant (h= 0.5). It is therefore unclear if this approach iscapable of uncovering the joint effects of the dominance ofmutations and genetic drift on patterns of selection.
We had two main objectives in this study. The first was todetermine the extent to which the DFE inference approachmay be useful for characterizing changes in selection efficacyfollowing the transition from outcrossing to selfing, undera range of dominance parameters. To do this, we usedforward population genetic simulations exploring how theestimated DFE shifts when the rate of selfing in a populationincreases. Our second objective was to investigate empiricalsupport for theoretical predictions on the genomic conse-quences of the transition to selfing in the diploid aquaticflowering plant Eichhornia paniculata (Pontederiaceae) usingthe DFE inference approach.
Eichhornia paniculata populations possess a wide rangeof mating systems ranging from outcrossing to predominantselfing (Barrett and Husband 1990). This variation is associatedwith the evolutionary breakdown of tristyly, a floral polymor-phism in which outbreeding populations are composed of threefloral morphs maintained by negative frequency-dependentmating. All tristylous populations occur in the arid caatingaregion of Northeast Brazil, where the species occurs in ephem-eral ponds and ditches. Stochastic forces associated with smallpopulation size have destabilized tristyly on multiple occasionsresulting in the spread and fixation of selfing variants (Barrettet al. 1989; Husband and Barrett 1992, 1993). This fixation ofthese variants has accompanied transitions in morph structurefrom stylar trimorphism through dimorphism to monomor-phism. Independent transitions to selfing associated withlong-distance dispersal have given rise to selfing populationsin the Caribbean and Central America (Barrett et al. 2009).Mid-styled selfing variants occur commonly on Jamaica and
818 R. Arunkumar et al.

Cuba, whereas long-styled selfing variants are restricted toa few small isolated populations in Nicaragua and Mexico.Roughly 60% of the variation in outcrossing rates in E. paniculatacan be explained by the morph structure of populations and thefrequency of selfing variants (Barrett and Husband 1990).Because trimorphic populations are predominantly out-crossing and monomorphic populations exhibit high ratesof selfing, we use morph structure as a proxy for outcross-ing rate in our study. Studies of allozyme variation andnucleotide diversity indicate that monomorphic popula-tions of E. paniculata have low levels of heterozygosity(Glover and Barrett 1987; Barrett and Husband 1990;Husband and Barrett 1993; Ness et al. 2010), consistentwith high selfing and/or colonization bottlenecks associ-ated with long-distance dispersal. Purging of genetic loadhas been documented in E. paniculata based on a studyon fitness traits (Barrett and Charlesworth 1991), butas yet there is no molecular genetic evidence for thisphenomenon.
Our investigations address the following questions: (1) Isthe DFE inference approach of Keightley and Eyre-Walker(2007) able to separate the contrasting genomic signals ofreduced selection efficacy and stronger purifying selectionagainst recessive mutations accompanying the transitionto selfing? (2) Is there empirical support for these con-trasting genomic signals based on the transition to selfingin E. paniculata? Our findings demonstrate that the DFEapproach provides a valuable tool for investigating thegenomic consequences of selfing, and that in E. paniculatatransitions to selfing are accompanied by genome-wideinfluences of reduced Ne and the purging of recessive del-eterious mutations.
Materials and Methods
Genome structure and content of simulated datasets
Using forward simulations, we investigated how patterns ofselection change following the shift to selfing. We conductedforward simulations using the software SLiM (Messer 2013),which implements a Wright–Fisher model with selection andnonoverlapping generations. We started with a completelyoutcrossing population (t = 1) composed of 1000 individuals(census size, N) with 100-Mbp genomes and constantgenome-wide mutation (m = 73 1029 per site per generation)and recombination (r = 5 3 1028 per site per generation)rates. Genomes were composed of alternating 800 bp of non-coding (NC) and 200 bp of coding (C) DNA. All NC sites and25% of C sites were neutral. The remaining 75% of sites incoding regions had selection coefficients drawn from a gammadistribution with shape parameter (b) of 0.3 and Ns of 0.5, 5,15, 25, 35, 45, 55, 65, 75, 85, or 95. The proportion of siteswith a given Ns is shown in Supporting Information, FigureS1. We assumed there were no beneficial mutations. To iso-late the effect of the dominance of mutations, we used fixedh of 0.2, 0.5, or 0.8 across the entire genome.
Varying outcrossing rate, N, or r
We conducted three sets of simulations varying the outcrossingrate (t), N, or r parameters one at a time. In the first, we ransimulations for 10N generations and then introduced a splitleading to a second population. The population resulting fromthe split had the same N as the ancestral outcrossing popula-tion (t = 1) but we decreased t to 0.02, effectively simulatinga shift to selfing. From this set of simulations we estimated therealized Ne for selfing population by calculating the reductionin synonymous diversity. We ran a second set of simulations inwhich the population resulting from the split had the same Nas the realized Ne of selfers from the first set of simulations, butwith the outcrossing rate unchanged (t = 1). From the first setof simulations, we also calculated the effective recombinationrate (re) of the selfing population using the equation re =routcrosser 3 (1 2 Fis), where Fis is the coefficient of inbreeding(Nordborg 2000). As we were unable to change r midwayduring the simulations, we ran a third set of simulations wherethe ancestral outcrossing population had the same r as the re ofselfers from the first set of simulations. For this set of simula-tions, we did not create a population split. We ran all simula-tions for another 6N generations to allow populations to reachequilibrium, as expected under coalescent predictions. Duringthis period, we randomly sampled eight individuals from eachpopulation at each 1N interval, and calculated the number ofnonsynonymous and synonymous mutations that had accumu-lated independently. We use these values to generate foldedallele frequency spectra (hereafter AFS). We estimated theDFEs for all simulated datasets using the approach of Keightleyand Eyre-Walker (2007), as described in the section below. Foreach Nes category in the DFE, we generated confidence inter-vals (C.I.s) based on 120 independent runs. We performed two-sample t-tests to compare the DFEs of simulated outcrossingand selfing populations using R (R Development Core Team2011). We also reported the expected DFE for the outcrossingpopulation represented as a gamma distribution using the b
and Ns parameters. As a distribution of Ns was used, we calcu-lated the DFE for each Ns value and scaled the individual DFEsby their proportional contribution to the genome (Figure S1).To generate the expected DFE for the selfing population underan additive model, we first scaled the Ns parameter by theobserved reduction in synonymous diversity accompanyingthe shift to selfing but leaving b unchanged. Further, we mul-tiplied Ns by 1.96 to account for the homozygosity of selfinggenomes (1 + Fis, see Caballero and Hill 1992).
Jointly varying h and Ns
We ran separate simulations to assess the joint impact of thedominance level of mutations and strength of purifyingselection acting on them. In these additional simulations, weassumed h = 0.2 and Ns = 95 for 31.5% of the sites in the Cregion to simulate strongly recessive deleterious sites. Theremaining 43.5% of the sites in the C region had h = 0.5and Ns ranging from 0.5 to 85 to simulate partially codominantweakly and strongly deleterious sites. After simulating a split
Genomic Consequences of Selfing 819

to a predominant selfing population (t = 0.02), we calculatedthe average fitness and number of neutral and deleteriousmutations that accumulated in eight randomly sampled indi-viduals. As SLiM outputs haploid chromosomes, we randomlypaired two genomes to construct a diploid individual. Fora given site in each of these individuals, the fitness effectof nonsynonymous mutations that were present once was1 2 hs. If the same mutation occurred in both chromosomecopies, its fitness effect was 1 2 s as they would be homozy-gous. The fitness of an individual was the multiplicative prod-uct of the fitness effect of all mutations in their genome. Note,because highly selfing populations are mostly homozygous,this procedure does not simulate the true genotypic compo-sition of the population, but allows for a more direct compar-ison with outcrossers of fitness and deleterious mutationaccumulation. We estimated the DFEs for the simulated data-sets using the approach of Keightley and Eyre-Walker (2007),as described in the section below. We generated C.I.s basedon 120 independent runs of simulations and performeda two-way analysis of variance with mating system and timeas factors using R (R Development Core Team 2011).
Estimating selective and demographic parameters
We inferred the DFE for each dataset using the source codeversion of the DFE-a software available from Peter Keightley’swebsite (http://lanner.cap.ed.ac.uk/~eang33/est-dfe-files.tar.gz). To ensure our parameter estimates from this maximumlikelihood method reached global optima, we randomized thestarting values for mean selection against deleterious mutations(NeE(s)), b, and t2 parameters and ran the program 10 times.From the output estimates across the runs, we chose the param-eters that resulted in the highest maximum likelihood. We re-port the proportion of mutations falling into a given Nes rangeof the DFE (,1, 1–10, 10–100, and .100).
Sampling of Eichhornia paniculata populations
We sampled open-pollinated seeds from 20 populations ofE. paniculata across the species range, including 10 outcrossing(tristylous) and 10 selfing populations (Table S1). All out-crossing populations were from Northeast Brazil. Ness et al.(2010) found that the outcrossing populations from this regionclustered in the same genetic structure group. We studieda subsample of the genotypes used by Ness et al. (2010).The selfing populations originated from Cuba (n= 3), Jamaica(n = 5), Mexico (n = 1), and Nicaragua (n = 1). We grewplants under uniform glasshouse conditions at the University ofToronto. To maximize our sampling effort, we selected oneindividual per population following the scattered sampling ap-proach (Wakeley and Lessard 2003; Städler et al. 2009), whichassumes that alleles coalesce faster within compared to be-tween demes, thus maximizing the number of unique allelesrepresented.
Nucleic acid extraction and sequencing
We extracted both RNA and DNA from floral buds ofE. paniculata. We chose floral buds as they contain both game-
tophytic and sporophytic genes increasing our samplingbreadth. We extracted RNA using the Spectrum Plant TotalRNA kit (Sigma-Aldrich). The extracted RNA samples wereused to make Illumina TruSeq RNA libraries that were se-quenced using the 100-bp paired end protocol on IlluminaHiSequation 2000 at the McGill University and GénomeQuébec Innovation Centre. The samples were sequenced acrosstwo lanes with 10 samples multiplexed in each lane, with out-crossing and selfing samples evenly distributed across thelanes. We further extracted genomic DNA from the floral budsof the Mexican sample using a modified variant of the CTABextraction protocol (Doyle and Doyle 1987, 1990; Edwardset al. 1991) treating the lysed cells with ribonuclease A toremove contaminant RNA. An Illumina TruSeq DNA librarywas prepared from this sample and sequenced on a separatelane on the Illumina HiSequation 2000. After sequencing, weremoved reads of ,50 bp and reads with .10% of “N” basesusing a custom Perl script, retaining�92% of the original data.The raw sequence data are available under accession no.SRP049636 at the Sequence Read Archive (http://www.ncbi.nlm.nih.gov/sra), and the associated BioProject accession no. isPRJNA266681 (http://www.ncbi.nlm.nih.gov/bioproject/).
Assembly and identification of coding regions
Although Ness et al. (2011) generated a transcriptome ref-erence for E. paniculata, we conducted an independent as-sembly as the greater number of genotypes, longer reads,and new assembly software facilitated more accurate con-struction of contigs. Nevertheless, we followed a similar ap-proach as in Ness et al. (2011). We chose selfing genotypesto generate the consensus assembly under the expectation thattheir more homozygous genomes would limit the problemcaused by alleles that appear heterozygous but actually belongto paralogous loci. We generated a de novo assembly from theJamaican transcriptome samples using the programs Velvet1.2.08 (Zerbino and Birney 2008) and Oases 0.2.08 (Schulzet al. 2012). We found the best parameters for the assemblyusing VelvetOptimser 2.2.4 (Zerbino 2010) that indicated thatk-mers with a length of 75–85 were optimal. The assembledreference transcriptome had a total size of 65.53 Mbp with anN50 of 2.2 kb (Figure S2). For the contigs in the assembledreference, we predicted the location of coding regions throughBLAST searches to known proteins in plant databases and re-moved contigs without any matches. We did this using a com-bination of tBLASTx (Altschul et al. 1990) to Viridiplantaedatabase and GeneWise 2.4.1 (Birney et al. 2004). After iden-tifying coding regions in assembled contigs, we trimmed basesbefore start and after stop codons using custom Perl scriptsretaining 29,336 loci at the end of this step.
Read mapping
After generating the reference assembly, we mapped all readsfrom E. paniculata transcriptome samples and the genomicDNA sample to the assembly. First, we mapped short readswith Burrows-Wheeler Aligner (BWA, v0.6.2-r126) using de-fault parameters (Li and Durbin 2009). Further, we used the
820 R. Arunkumar et al.

BWA “sampe” command to combine the paired end readmapping results together and Samtools “view” command(Samtools v0.1.18 r982:295; Li et al. 2009) to convert themapping results into a binary alignment format (BAM format).After the first round of read mapping, we used Stampy 1.0.20software with default parameters (Lunter and Goodson 2011)to map more divergent reads, as well as to identify insertionsand deletions (indels). Approximately 92% of filtered reads foreach sample mapped successfully. Next, we processed the readmapping output into a format required for variant calling soft-ware using four programs (SamFormatConverter, ReorderSam,AddOrReplaceReadGroups, and BuildBamIndex) that were partof the Picard tools package 1.100 using default settings (http://picard.sourceforge.net). The processed BAM files are availableunder accession no. SRP049636 at the Sequence Read Archive(http://www.ncbi.nlm.nih.gov/sra).
Variant calling and filtering
After read mapping, we identified single nucleotide poly-morphisms (SNPs) segregating among E. paniculata tran-scriptome samples using a set of programs from theGenome Analysis Toolkit (GATK) v2.7-4-g6f46d11 (Depristoet al. 2011). We first used RealignerTargetCreator andIndelRealigner with default parameters and identified andrealigned sequences within �3 kb of an indel where errone-ous mismatches were more likely to have occurred. Further,we ran UnifiedGenotyper with the BadCigar read filter tocall invariants sites, SNPs, and indels from all samples. Fora given variant, we allowed for a maximum of six alternatealleles to be genotyped. We performed a number of filteringsteps to minimize spurious SNP calls. From the UnifiedGeno-typer output, we only retained sites for which Phred scaledquality score (QUAL) was .60 and depth in each individualsequenced was .20. We only retained a SNP if the Phredscaled genotype quality (GQ) for all samples was .60. Wealso excluded 5 bp on either side of an indel where spuriousSNP calls are likely to be made. For the SNPs identified in theoutcrossing genotypes, we performed a test for Hardy–Weinbergequilibrium (Wigginton et al. 2005) as implemented inVCFtools (v0.1.11) (Danecek et al. 2011). We validated SNPcalls by comparisons to a range-wide polymorphism datasetfor E. paniculata generated by Barrett et al. (2009) and Nesset al. (2010). These studies extensively sampled 225 E. pan-iculata individuals from 25 populations across Brazil, the Ca-ribbean, and Central America. We performed a custom BLASTsearch comparing the 10 EST-derived nuclear loci investi-gated by these authors to our reference using the make-blastdb and blastn programs, part of the NCBI BLAST+toolkit, version 2.2.26 (Camacho et al. 2009). Seven nuclearloci matched contigs in our dataset that we had removedduring the filtering stages. We aligned the remaining threenuclear loci and sequences for the best matching contig in ourstudy using MUSCLE (Edgar 2004) as implemented inMEGA6 (Tamura et al. 2013) excluding sites with gaps. Onlythe alignment between EP0314 and the best matching locusfrom our study (Locus_13533) identified polymorphic sites
segregating in both sets of sequences and the region-specificpolymorphisms segregating in our samples matched thoseidentified in the previous studies (Table S2).
Filtering paralogous sequences
If duplicated regions were assembled into a single contig,differences between paralogs might erroneously be called asa polymorphic difference at a single site. To address this wefirst removed loci containing sites heterozygous in all 10selfing genotypes identified with the aid of VCFtools(v0.1.11) (Danecek et al. 2011). Such variants are unlikelyto be real, given the largely homozygous backgrounds ofselfing populations and the occurrence of at least two in-dependent transitions to selfing (Barrett et al. 2009). Sec-ond, we mapped genomic reads from a selfing genotypefrom Mexico to the transcriptome reference. We used theSamtools “depth command” (Samtools v0.1.18 r982:295; Liet al. 2009) to find depth per site and used a custom Perlscript to calculate the mean across a given contig. We re-moved loci with ,153 or .603 genomic coverage (FigureS3) based on the assumption that coverage should be evenacross the entire genome.
Removing shared variant sites
To focus on contemporary selection pressures, we used onlysites that were unique to each lineage in comparisons ofselection efficacy between outcrossing and selfing popula-tions. We used a custom Perl script to convert the Uni-fiedGenotyper VCF output into a FASTA format. Next, weidentified polymorphic sites that were shared betweenoutcrossing and selfing populations using a custom Perlscript. We substituted bases at those sites in our FASTAfiles to “N” using a script from http://raven.iab.alaska.edu/~ntakebay/teaching/programming/perl-scripts/perl-scripts.html (selectSites.pl). We retained a total of 16,416 transcriptsat the end of the filtering stages. Note that our simulationsused a similar approach, as only lineage-specific mutationswere analyzed while inferring the DFE.
Comparing outcrossing and selfing populations ofEichhornia paniculata
We first processed the output from the SNP filtering stepsand generated the necessary variables so we could comparethe efficacy of selection in outcrossing and selfing popula-tions. Because selfers are more highly homozygous thanoutcrossers, they have effectively half the number ofchromosomes. Therefore, we generated a haploid copy ofthe diploid chromosome for each individual and randomlychose one of the bases at a given heterozygous site usinga custom Perl script. As we only had two samples fromCentral America, we were unable to characterize the AFSand therefore we did not include the Central Americanpopulations in most comparisons. To keep the number ofchromosomes analyzed the same while performing compar-isons, 8 of the 10 outcrossing genotypes from Brazil wererandomly selected.
Genomic Consequences of Selfing 821

Estimating the strength of selection acting on mutationsin Eichhornia paniculata populations
We used the Polymorphorama script (Andolfatto 2007;Haddrill et al. 2008) to generate locus-specific nonsynony-mous and synonymous folded AFS and number of invariantsites for the outcrossing and selfing populations. This pro-gram includes twofold degenerate sites while calculating theAFS. Twofold degenerate sites might inflate the number ofnonsynonymous compared to synonymous polymorphismsresulting in biased conclusions on estimates of selection. How-ever, Williamson et al. (2014) reported that DFE inferenceswere unaffected by the use of such twofold sites. We generated200 bootstrap replicate E. paniculata datasets, after resamplingrandomly across the loci using R (R Development Core Team2011), and generated the sums and means for each dataset.We inferred the DFE for each replicate dataset as describedearlier in this section. For the resulting Nes categories in theDFE, we generated mean values and 95% C.I.s across the 200bootstrap replicates. To generate the C.I.s, we excluded thetop and bottom 2.5% of bootstrap replicates and used thesmallest and largest values from the remainder to representthe lower and upper limits of the C.I., respectively. We deter-mined whether the Nes categories from the DFE differedbetween outcrossing and selfing populations using the random-ization test following Keightley and Eyre-Walker (2007). A dif-ference in one Nes category of the DFE will not be independentof differences in the others. Finally, we used the b and NeE(s)parameters estimated by the DFE-a software to plot the cumu-lative proportion of nonsynonymous mutations. This allowed usto have more confidence in our inferences from the DFE, even ifmutations of extremely large deleterious effect (Nes .. 100)were absent in the samples analyzed.
Results
Inferring the DFE of simulated outcrossing andselfing populations
Fixed dominance coefficients across the genome: Usingforward simulations, we investigated changes in selectionefficacy in outcrossing and selfing populations after a splitfrom a common outcrossing ancestor. After 6N generations,there was �75% reduction in synonymous diversity followingthe shift to selfing. As the level of dominance across the entiregenome was increased from 0.2 to 0.8, the DFE of outcrossingpopulations shifted such that a larger fraction of sites wasinferred to be under stronger levels of selection (Figure 1).The DFE of outcrossers under h = 0.5 matched the expect-ations based on the given Ns and b parameters. Consistentwith expectations, there was a deficit of sites in the Nes. 100category of the DFE of the outcrossing population under h =0.2, when compared to the level expected under an additivemodel. In contrast, the DFE for selfing populations remainedlargely the same as the level of dominance increased. Underall three dominance levels, there was an excess of sites understronger levels of selection than expected due to the Ne re-
duction and increased homozygosity accompanying the shiftto selfing. Under h = 0.2, pn/ps was smaller in selfers com-pared to outcrossers (Table S3), a significantly larger fractionof sites was in the Nes . 100 category, and a significantlysmaller fraction of sites was in the Nes 10–100 categories ofthe estimated DFE of selfers (Figure 1, Table S4), consistentwith the effects of purging. In contrast, under h = 0.8, selfershad a larger pn/ps (Table S3) and a significantly larger andsmaller fraction of sites in the Nes , 1 and Nes 10–100 cate-gories, respectively (Figure 1, Table S4). These results indicatethat with increasingly recessive mutations there is power todetect a purging effect in selfing populations, whereas withincreasing dominance there is evidence for a greater proportionof effectively neutral mutations compared with outcrossingpopulations.
Nonequilibrium demographic factors: The difference be-tween the expected and estimated proportion of stronglyselected sites in selfing populations may reflect a failure tofully control for nonequilibrium demographic factors causedby the transition to selfing and the effects of Hill–Robertsoninterference. Under all dominance levels, the synonymousAFS for outcrossing and selfing populations were skewed to-ward rare variants, compared to expectations under neutralequilibrium (Figure S4, A and B). However, such a skew wasnot observed in the outcrossing population when we includedmutations that were shared between both populations(Figure S4C). The skew was likely due to the use of uniquemutations to estimate selection pressures, which will be rare,given their recent origin. In contrast, selfers still showeda skewed AFS even when all mutations were included (FigureS4D). The inclusion of shared mutations did not affect infer-ences about the effect of the dominance of mutations onselection efficacy (Figure S5). However, there was a largerdifference between the observed and expected numberof mutations in the Nes . 100 category under h = 0.5and h = 0.8. Additionally, as the simulated genomes hada much larger fraction of noncoding compared to codingregions (Figure S1), our analysis may be biased by the factthat a large proportion of neutral sites would have been farfrom selected sites. Using synonymous mutations occurringonly within coding regions did not affect the observed differ-ences between the DFEs of outcrossing and selfing popula-tions (Figure S6), although the estimated C.I.s were larger.
Reduced Ne and stronger background selection: To disen-tangle how reduced Ne and re interact with the dominance ofmutations, we varied these parameters one at a time, simu-lating outcrossing populations with equivalent reductions ineffective size and recombination to our simulated selfing pop-ulation. There was an increase in the fraction of sites in thelower Nes categories of the observed DFE under N = 250,equivalent to the realized neutral Ne of the previously simu-lated selfing population, when compared to N= 1000 (Figure2). The observed DFEs for N = 250 under all dominancelevels harbored a greater fraction of sites in the larger Nes
822 R. Arunkumar et al.

categories when compared to the expected levels. However,simulating this reduction in Ne did not show the purgingsignal we observed in selfing populations; there was no evi-dence for a significant increase in the proportion of stronglyselected mutations in simulations with recessive mutations(compare Figure 2C with Figure 1). The DFE of the outcross-ing population with r = 1.96 3 1029 per site per generation,equivalent to the realized re of previously simulated selfingpopulations, had a larger fraction of mutations in smaller Nescategories when compared to the DFE of the outcrossing pop-ulation with r = 5 3 1028 per site per generation under h =0.5 and under h = 0.8 (Figure 1 and Figure S7). However,this change was not as large as the level expected due to theNe reduction accompanying the shift to selfing. As with thesimulations of outcrossing populations subjected to reducedNe, we found no evidence of the purging signal of a largerfraction of strongly deleterious mutations compared with theancestral outcrosser, again showing that this signal is specificto the transition to selfing. Thus, these simulations indicatethat the signal of increased proportions of strongly selectedsites is a unique effect of the transition to selfing and drivenby the purging effect of increased homozygosity.
Mixed dominance coefficients across genome: When bothdominance and selection coefficients were jointly varied,selfers accumulated more nonsynonymous mutations com-pared to outcrossers, even though both accumulated thesame number of synonymous mutations (Figure 3A). Therewas a greater decline in the fitness of selfers compared tooutcrossers over 6N generations (Figure 3B). We further in-vestigated how such mutation accumulation influenced theselection efficacy for outcrossing and selfing populations.Mean pn for simulated outcrossers and selfers was 1.98 31025 and 3.64 3 1026, respectively; mean ps for simulatedoutcrossers and selfers was 4.94 3 1025 and 8.53 3 1026,respectively. After the split from the common outcrossing an-cestor, the estimated DFE of the selfing population shiftedsuch that a significantly larger fraction of sites were in theNes , 1 category at 1N and 3N generations (Figure 4, TableS5). Also, there was a significantly larger fraction of sites inthe Nes . 100 category of the selfing population during thefirst 4N generations. The interaction between mating systemand time was a significant factor influencing the proportion ofmutations in the Nes , 1 and Nes. 100 categories. Moreover,the number of sites in each Nes category of the DFE fluctuatedover generations. When there were both weakly selected ad-ditive sites and strongly selected recessive sites in the simu-lated genome, the DFE approach inferred the occurrence ofmore very weak and very strong deleterious mutations in
Figure 2 Distribution of fitness effects (DFE) of new nonsynonymousmutations for simulated outcrossing populations of two census sizes (N)under various fixed dominance coefficients (h = 0.2, 0.5, or 0.8). Shownare (A) the expected DFEs, (B) h = 0.5, (C) h = 0.2, and (D) h = 0.8.Simulations illustrate the change in DFE for both populations after 6Ngenerations after the split of a population of N = 250 from the commonancestral population of N = 1000. The coding regions were under variousselection coefficients (Ns = 0.5–95) all sampled from a gamma distribu-tion with shape parameter (b) of 0.3. We generated the expected DFEsfor the populations represented as a gamma distribution using the b andNs parameters. We generated the observed DFEs by randomly samplingand generating allele frequency spectra using eight genomes from pop-ulations of 1000 in size. Shown are the mean proportions of sites for eachNes category and their respective confidence intervals based on 120 sim-ulations.
Figure 1 Distribution of fitness effects (DFE) of new nonsynonymousmutations for simulated outcrossing (t = 1.00) and selfing (t = 0.02)populations under various fixed dominance coefficients (h = 0.2, 0.5 or0.8). Nes is the product of Ne and the selection coefficient (s). Shown are(A) the expected DFEs, (B) h = 0.5, (C) h = 0.2, and (D) h = 0.8. Simulationsillustrate the change in DFE for both populations after 6N generations aftera split from the common outcrossing ancestor. The coding regions wereunder various selection coefficients (Ns = 0.5–95) all sampled from a gammadistribution with shape parameter (b) of 0.3. We generated the expectedDFE for the outcrossing population represented as a gamma distributionusing the b and Ns parameters. We generated the expected DFE for theselfing population by scaling the Ns parameter by the observed 75% re-duction in synonymous diversity in selfers and multiplying it by 1.96 toaccount for effective dominance levels of mutations in selfing genomeswhile leaving b unchanged. We generated the observed DFEs by randomlysampling and generating allele frequency spectra using eight genomesfrom populations of 1000 in size. Shown are the mean proportions of sitesfor each Nes category and their respective confidence intervals based on120 simulations.
Genomic Consequences of Selfing 823

selfers, although such effects varied with the time since thetransition to selfing. Thus, with a model with varying domi-nance coefficients, it is possible to detect signals of both re-laxed purifying selection and purging, although the relaxedselection signal is less prevalent, despite an observed declinein fitness in selfing populations.
Inferring the DFE of outcrossing and selfing populationsof Eichhornia paniculata
Selection and demographic parameters: Of the 16,416loci, 4485 were polymorphic in outcrossers and 1586 werepolymorphic in selfers, after excluding variants sharedbetween outcrossing and selfing populations. Polymorphicloci in outcrossers and selfers had between 1–40 and 1–20segregating sites, respectively, with the distribution of poly-morphisms per locus right skewed (Figure S8). Mean pn foroutcrossers and selfers was 4.93 3 1024 and 8.99 3 1025,respectively; mean ps for outcrossers and selfers was 3.09 31023 and 5.62 3 1024, respectively. We identified 20,388nonsynonymous and 32,384 synonymous polymorphisms inoutcrossers and 3613 nonsynonymous and 5730 synonymouspolymorphisms in selfers (Table S6). There was an excess ofrare nonsynonymous compared to synonymous polymor-phisms in both outcrossing and selfing populations (Figure5). Selfers had a slight deficit of rare synonymous polymor-phisms compared to outcrossers. Randomization tests, asimplemented in Keightley and Eyre-Walker (2007), indicatedthere were significantly fewer sites in the Nes: 1–10 and 10–100 categories and a significantly greater proportion of sitesin the Nes . 100 in selfers compared to outcrossers (Figure6). Although we did not detect a significant difference for theNes , 1 category at the 5% level, there was a general trendfor a larger number of mutations in this category for selfingpopulations. Our plots of the cumulative proportion of non-synonymous mutations indicate that selfers had a marginallylarger fraction of mutations with Nes , 3 (Figure S9).
Data filtering: As inferring the DFE is dependent on the AFSbeing compared, we investigated how different quality cut-offs and filtering affected the patterns observed. A single sitequality cut-off for both invariant and variant sites coulddisproportionally exclude invariant sites. However, in ourcase, reducing the quality cut-off for both sites did not affectthe DFE inference for outcrossing and selfing populations(Figure S10). We also excluded an additional 245 loci thatcontained at least one site heterozygous in two or more self-ers, a more stringent filter for potential paralogs (Table S7).Removing such loci from the comparisons did not alter ourinferences (Figure S11). Less than 3% of polymorphic sitesacross outcrossing genotypes departed from Hardy–Weinbergequilibrium at the 5% level and these sites were localized to73 loci. Again, removal of these loci did not affect our infer-ences on differences between outcrossing and selfing geno-types (Figure S12). Finally, we investigated how the relativeproportions of nonsynonymous and synonymous polymor-phisms per loci influenced our results. As the distribution of
pn /ps was right skewed (Figure S13), we excluded 135 locithat had pn/ps. 1 in either outcrossers or selfers and repeatedthe DFE analyses. Although we still observed an excess of sitesin the Nes . 100 category in selfers, there was substantialoverlap in the proportion of sites in the Nes , 1 category be-tween outcrossers and selfers (Figure S14 and Table S8).
Pooling independent shifts to selfing: We investigatedwhether pooling additional samples from an independenttransition to selfing influenced the AFS and the inferredDFE. As the inclusion of the two additional samples fromCentral America resulted in a total of 10 selfing samples, werepeated the analyses using all 10 outcrossing genotypes tokeep the number of chromosomes compared the same. Withthe inclusion of the additional selfing genotypes, we stillobserved an excess of rare nonsynonymous compared tosynonymous polymorphisms in both outcrossing and selfingpopulations (Figure S15). In the synonymous AFS, selfingpopulations had a deficit of singletons and an excess ofdoubletons compared to outcrossing populations. Moreover,we found that using the randomization tests, the underlyingDFE and all discrete Nes categories (Figure S16) were sig-nificantly different between outcrossing and selfing popula-tions at the 0.5% level.
Figure 3 The type and effects of mutations accumulated by four simu-lated outcrossing (black) and four simulated selfing (gray) individuals over6N generations after a split from a common outcrossing ancestor whenboth dominance and selection coefficients were jointly varied. We randomlysampled eight haploid genomes from populations of 1000 in size. Thegenomes were randomly paired to create four diploid individuals. Shownare (A) the number of nonsynonymous and synonymous mutations thataccumulated in the genomes and (B) mean and 95% confidence intervalsfor the fitness of individuals.
824 R. Arunkumar et al.

Discussion
Our forward population-genetic simulations demonstratethat reduced Ne and increased purging, accompanying thetransition to selfing, can be detected by estimating the un-derlying distribution of deleterious mutational effects. Oursimulations show that this is not expected under a singledominance coefficient for nonsynonymous mutations, butcan be explained if there is a mixture of strongly selectedrecessive mutations that experience effective purging inselfing populations, and more weakly selected additivemutations subject to relaxed selection. Our empirical studyof E. paniculata revealed a small increase in the proportionof effectively neutral nonsynonymous mutations and a sig-nificant increase in the proportion of strongly selected sitesin selfing compared to outcrossing populations. The spreadin the distribution of selective coefficients observed in boththe simulated and empirical datasets is consistent with theeffects of both purging and a reduced efficacy of selectionin selfing populations.
Consequences of reduced Ne in selfing populations
Our simulations revealed an increased number of sites thatwere under weaker purifying selection following the tran-sition to selfing as a result of reduced Ne and re. Further,relaxed selection was driven largely by partially dominantrather than recessive mutations. The observed pattern is con-sistent with theoretical predictions that selection should beless efficient in selfers (reviewed in Charlesworth and Wright2001). In both the simulated and empirical results, the esti-mated magnitude of relaxed selection appears to be small(Figure 4 and Figure 6), and there may be several reasonsfor this. First, it is possible that even a large reduction in Ne
does not substantially alter the DFE in selfing populations ifa significant proportion of mutations are strongly selected(Nes ..1). Second, the relatively recent evolutionary transi-tion to selfing in E. paniculata (see Ness et al. 2010) may nothave allowed for sufficient time for the effects of reduced Ne tobe detected at genome-wide scales. However, our simulationsexamining the shift to selfing over 6N generations did not finda very large reduction in the Nes , 1 category of the DFE andpatterns of relaxed selection disappeared after 3N generations.Although reduced Ne may only moderately reduce genome-wide selection efficacy, our simulation results imply that suchsubtle shifts may be associated with early and cumulativedeclines in fitness in selfing populations (Figure 3).
The smaller than expected reduction in the efficacy ofselection following the shift to selfing in the forward simulationsmight suggest that the DFE inference approach underestimatesthe effects of reduced Ne. If the method underestimated themagnitude of relaxed selection, it could explain why the ob-served shift in the empirical data toward effectively neutral sitesin the DFE of selfers was relatively weak. An alternate possibility
Figure 4 Distribution of fitness effects (DFE) of new nonsynonymousmutations for simulated outcrossing (t = 1.00) and selfing (t = 0.02)populations when both dominance and selection coefficients werejointly varied. Within the coding region of the genome in the simu-lations, 31.5% of sites had h = 0.2 and Ns = 95, 43.5% of the siteshad h = 0.5 and Ns ranging from 0.5 to 85, and the remaining hadh = 0.5 and Ns = 0. Simulations illustrate the change in DFE for bothpopulations over 6N generations after a split from the common out-crossing ancestor. We generated DFEs by randomly sampling andgenerating allele frequency spectra using eight genomes from pop-ulation sizes of 1000. Nes is the product of Ne and the selectioncoefficient (s). Shown are the mean proportions of sites for eachNes category and their respective confidence intervals based on120 simulations.
Figure 5 Folded nonsynonymous and synonymous allele frequency spec-tra for outcrossing and selfing populations of Eichhornia paniculata. Hap-loid chromosomes from one individual from each of eight outcrossingpopulations from Northeast Brazil and eight selfing populations fromthe Caribbean were used to generate the frequency spectra. Eight out-crossing individuals from the 10 that were sequenced were randomlyselected to keep the number of chromosomes sampled the same whileperforming the comparison.
Genomic Consequences of Selfing 825

is that even genome-wide polymorphism datasets have limitedpower to detect relaxed selection (and see Glémin 2007), par-ticularly when there are multiple and contrasting forces actingon the genome. Consistent with this suggestion, the differencebetween pn/ps in simulated outcrossers and selfers under anadditive model incorporating mixed dominance and selectioncoefficients was small. Even so, the empirical pattern of re-laxed selection became less apparent when we excluded lociwith pn /ps . 1, indicating they might be contributing togenome-wide patterns.
Our empirical results demonstrate demographic effectsassociated with the colonization history of selfing populationsof E. paniculata. Pooling genotypes from independent shifts toselfing had a significant influence on the AFS, as indicated bythe excess of doubletons in selfers. The Central Americangenotypes were fixed for alternate alleles compared to sam-ples from the Caribbean, probably explaining this result. Eich-hornia paniculata occurs in ephemeral aquatic habitats andpopulations experience striking annual variation in size, in-cluding frequent local extinctions (Barrett and Husband1997; Husband and Barrett 1998). Recent studies suggestthat nonsynonymous mutations reach equilibrium faster thansynonymous mutations after bottlenecks; therefore compari-sons of the two could generate spurious signals of relaxedselection (Pennings et al. 2014; Simons et al. 2014). BecauseE. paniculata only colonized the Caribbean �125,000 yearsago (Ness et al. 2010), populations from that region mightnot have had sufficient time to recover from founding events.If the fit of demographic models for selfing populations wasless accurate compared to outcrossing populations, our signalof relaxed selection could, in part, reflect this effect. However,
we found that even when the synonymous spectra did notmeet neutral expectations, the inference of the DFE was sim-ilar to the case when the spectra did match such expectations.Although the demographic correction implemented in theDFE inference approach should account for distortions ofthe AFS away from equilibrium, it is unclear if the marginaltrend of relaxed selection in the empirical data, which wassignificant when samples from separate origins were pooled,was influenced by violations of neutral expectations. Our sim-ulations gave us qualitatively similar differences in the DFE tothe empirical data and provided evidence for a fitness declineand the accumulation of deleterious mutations in selfing pop-ulations (Figure 3). These results suggest that the weak trendobserved in our empirical results reflects a true signal of thereduced efficacy of selection in selfing populations.
Exposure of recessive deleterious mutations
We observed a large proportion of strongly deleterious sites inthe DFEs obtained from both simulated and empirical data. Byusing forward simulations, we found the DFE approach wasable to infer the effect of varying dominance levels of muta-tions on patterns of selection. As deleterious mutations becamemore dominant, the effective strength of selection actingagainst them in outcrossing populations increased. In contrast,the dominance level of mutations had little effect in selfingpopulations, where the largely homozygous background ofgenotypes exposes the deleterious effects of recessive anddominant mutations. Further, our simulations indicated theDFE approach was able to identify how both partiallydominant and strongly recessive deleterious mutations shapeselection efficacy experienced by selfers and outcrossers.Linkage between neutral, weakly, and strongly deleteriousmutations, under variable dominance coefficients, may havecomplicated attempts to disentangle their individual effects onthe DFE but did not lead to any directional biases. Overall, oursimulation results indicated the empirical patterns of increasedaccumulation of effectively neutral and strongly deleteriousmutations occur across a wide range of selection and domi-nance coefficients, after transitions to selfing. Previous experi-mental studies in E. paniculata, involving multigenerationalfitness comparisons of phenotypic traits following selfing andoutcrossing, were unable to detect significant inbreeding de-pression in selfing populations from the Caribbean and theauthors proposed that this was largely a result of purging ofgenetic load (Barrett and Charlesworth 1991). Our findingsare consistent with this earlier study in providing molecularevidence to support the purging hypothesis.
A key question is whether the observed excess of stronglydeleterious mutations in selfing populations was, in part, dueto the methods used to infer selection efficacy. The approachof Keightley and Eyre-Walker (2007) is known to impreciselyinfer the DFE when the distribution is multimodal (Kousathanasand Keightley 2013) and overestimates the strength of pu-rifying selection in the face of linked selection (Messer andPetrov 2013). Also, the DFE estimation approach infersthe proportion of mutations that are strongly deleterious
Figure 6 Distribution of fitness effects (DFE) of new nonsynonymousmutations for outcrossing and selfing Eichhornia paniculata. Nes is theproduct of Ne and the selection coefficient (s). Eight Caribbean selfingand eight outcrossing individuals were used to generate the DFEs. Eightoutcrossing samples from the 10 that were sequenced were randomlyselected to keep the number of chromosomes sampled the same whileperforming the comparisons. Error bars on top of each Nes category are95% confidence intervals from 200 bootstrap replicates generated byresampling over loci. We used a randomization test (see Keightley andEyre-Walker 2007) to compare outcrossing and selfing populations and toassess significance at 0.5% level (indicated by *).
826 R. Arunkumar et al.

(Nes . 100) from the b parameter, even if no such muta-tions segregate in samples. However, plotting the DFE asa continuous distribution indicated there was a greaterspread of selection coefficients in selfers. Furthermore, themagnitude of the shift toward effectively neutral sites insimulated selfing populations was lower than expecteddue to reduced Ne, or the level experienced by simulatedoutcrossing population with a census size equivalent to therealized Ne of the selfers. Both of these results suggest thatcountervailing homozygosity effects stifle a unidirectionalchange in the DFE. Therefore, the observed patterns areconsistent with an effect of both purging and reduced effi-cacy of selection in selfing populations, even if estimates ofthe magnitude of the effect may be imprecise.
At this stage we are unable to assess if an assumption ofthe DFE inference approach, namely that all sites experi-enced independent selection pressures, was violated in ourstudy. It seems probable that this assumption would be violatedin selfing populations, with many neutral sites linked todeleterious ones. In this case, the DFE approach might over-estimate the proportion of deleterious sites. However, overshort distances in the genome our bootstrapping by locusapproach addresses some of the uncertainty due to linkageblocks, as some bootstrap replicates may not contain all of thegenes within a given block. Furthermore, our simulationssuggest the patterns we observed are expected under a modelthat incorporates both strongly recessive deleterious mutationsand slightly deleterious, more additive mutations, consistentwith a role for purging of harmful recessive alleles and anaccumulation of weakly deleterious mutations.
Finally, we have not considered the effects of beneficialmutations in interpreting the results of our study. Recessivebeneficial mutations may also be exposed in selfing populationsleading to selective sweeps. As beneficial mutations are ex-pected to be fixed rapidly after they appear in selfing popula-tions, they are unlikely to have been segregating in the smallnumber of E. paniculata samples used in our study. Linkagebetween recessive beneficial and deleterious mutations shouldincrease the time taken for sweeps to occur (Hartfield andGlémin 2014). Hence, future studies estimating the rate ofadaptation in selfing populations should consider the influenceof strongly deleterious mutations, as our results indicate thatthey can influence genome-wide patterns of selection.
Acknowledgments
We thank Wei Wang for providing many of the Perl scriptsused in this study and Khaled M. Hazzouri, Young Wha Lee,and Epitawalage Niroshini for providing their modified DNAextraction protocol, and Aneil F. Agrawal for helpfuldiscussion. This research was funded by Discovery grantsfrom the Natural Sciences and Engineering Research Councilof Canada (NSERC) to S.C.H.B. and S.I.W. R.A. was supportedby student fellowships from a Ministry of Training, Collegesand Universities Ontario graduate scholarship (OGS), Univer-sity of Toronto, and NSERC.
Literature Cited
Agrawal, A. F., and M. C. Whitlock, 2011 Inferences about thedistribution of dominance drawn from yeast gene knockoutdata. Genetics 187: 553–566.
Altschul, S. F., W. Gish, M. Miller, E. W. Myers, and D. J. Lipman,1990 Basic local alignment search tool. J. Mol. Biol. 215: 403–410.
Andolfatto, P., 2007 Hitchhiking effects of recurrent beneficialamino acid substitutions in the Drosophila melanogaster ge-nome. Genome Res. 17: 1755–1762.
Baker, H. G., 1955 Self-compatibility and establishment after‘long-distance’ dispersal. Evolution 9: 347–349.
Barrett, S. C. H., and B. C. Husband, 1990 Variation in outcross-ing rate in Eichhornia paniculata: the role of demographic andreproductive factors. Plant Species Biol. 5: 41–56.
Barrett, S. C. H., and D. Charlesworth, 1991 Effect of a change inthe level of inbreeding on the genetic load. Nature 352: 522–524.
Barrett, S. C. H., and B. C. Husband, 1997 Ecology and genetics ofephemeral plant populations: Eichhornia paniculata (Ponteder-iaceae) in N.E. Brazil. J. Hered. 88: 277–284.
Barrett, S. C. H., M. T. Morgan, and B. C. Husband, 1989 Thedissolution of a complex genetic polymorphism: the evolution ofself-fertilization in tristylous Eichhornia paniculata (Pontederia-ceae). Evolution 43: 1398–1416.
Barrett, S. C. H., R. W. Ness, andM. Vallejo-Marín, 2009 Evolutionarypathways to self-fertilization in a tristylous plant species. New Phy-tol. 183: 546–556.
Barrett, S. C. H., R. Arunkumar, and S. I. Wright, 2014 The de-mography and population genomics of evolutionary transi-tions to self-fertilization in plants. Phil. Trans. R. Soc. B. 369:20130344.
Birney, E., M. Clamp, and R. Durbin, 2004 GeneWise and Ge-nomewise. Genome Res. 14: 988–995.
Brandvain, Y., T. Slotte, K. M. Hazzouri, S. I. Wright, and G. Coop,2013 Genomic identification of founding haplotypes revealsthe history of the selfing species Capsella rubella. PLoS Genet.9: e1003754.
Caballero, A., and W. G. Hill, 1992 Effects of partial inbreeding onfixation rates and variation of mutant genes. Genetics 131: 493–507.
Camacho, C., G. Coulouris, V. Avagyan, N. Ma, J. Papadopouloset al., 2009 BLAST+: architecture and applications. BMC Bio-informatics 10: 421.
Cao, J., K. Schneeberger, S. Ossowski, T. Günther, S. Bender et al.,2011 Whole-genome sequencing of multiple Arabidopsis thali-ana populations. Nat. Genet. 43: 956–963.
Charlesworth, B., 1992 Evolutionary rates in partially self-fertilizingspecies. Am. Nat. 140: 126–148.
Charlesworth, B., and D. Charlesworth, 1999 The genetic basis ofinbreeding depression. Genet. Res. 74: 329–340.
Charlesworth, D., and S. I. Wright, 2001 Breeding systems andgenome evolution. Curr. Opin. Genet. Dev. 11: 685–690.
Charlesworth, D., and J. H. Willis, 2009 The genetics of inbreed-ing depression. Nat. Rev. Genet. 10: 783–796.
Charlesworth, D., M. T. Morgan, and B. Charlesworth, 1993a Mutationaccumulation in finite outbreeding and inbreeding populations.Genet. Res. 61: 39–56.
Charlesworth, B., M. T. Morgan, and D. Charlesworth, 1993b Theeffects of deleterious mutations on neutral molecular variation.Genetics 134: 1289–1303.
Comeron, J. M., A. Williford, and R. M. Kliman, 2008 The Hill-Robertson effect: evolutionary consequences of weak selectionand linkage in finite populations. Heredity 100: 19–31.
Crow, J. F., and M. J. Simmons, 1983 The mutation load inDrosophila, pp. 1–35 in The Genetics and Biology of Drosophila,
Genomic Consequences of Selfing 827

edited by H. L. C. M. Ashburner, and J. N. Thomson. AcademicPress, London.
Cutter, A. D., J. D. Wasmuth, and M. L. Blaxter, 2006 The evolu-tion of biased codon and amino acid usage in nematode ge-nomes. Mol. Biol. Evol. 23: 2303–2315.
Crnokrak, P., and S. C. H. Barrett, 2002 Purging the genetic load:a review of the experimental evidence. Evolution 56: 2347–2358.
Danecek, P., A. Auton, G. Abecasis, C. A. Albers, E. Banks et al.,2011 The variant call format and VCFtools. Bioinformatics 27:2156–2158.
DePristo, M., E. Banks, R. Poplin, K. V. Garimella, J. R. Maguireet al., 2011 A framework for variation discovery and genotyp-ing using next-generation DNA sequencing data. Nat. Genet. 43:491–498.
Doyle, J. J., and J. L. Doyle, 1987 A rapid DNA isolation procedure forsmall quantities of fresh leaf tissue. Phytochem. Bull. 19: 11–15.
Doyle, J. J., and J. L. Doyle, 1990 Isolation of plant DNA fromfresh tissue. Focus 12: 13–15.
Edgar, R. C., 2004 MUSCLE: multiple sequence alignment withhigh accuracy and high throughput. Nucleic Acids Res. 32:1792–1797.
Edwards, K., C. Johnstone, and C. Thompson, 1991 A simple andrapid method for the preparation of genomic plant DNA for PCRanalysis. Nucleic Acids Res. 19: 1349.
Escobar, J. S., A. Cenci, J. Bolognini, A. Haudry, S. Laurent et al.,2010 An integrative test of the dead-end hypothesis of selfingevolution in Triticeae (Poaceae). Evolution 64: 2855–2872.
Gioti, A., J. E. Stajich, and H. Johannesson, 2013 Neurospora andthe dead-end hypothesis: genomic consequences of selfing inthe model genus. Evolution 67: 3600–3616.
Glémin, S., 2007 Mating systems and the efficacy of selection atthe molecular level. Genetics 177: 905–916.
Glémin, S., and J. Ronfort, 2013 Adaptation and maladaptation inselfing and outcrossing species: new mutations vs. standing var-iation. Evolution 67: 225–240.
Glover, D. E., and S. C. H. Barrett, 1987 Genetic variation incontinental and island populations of Eichhornia paniculata(Pontederiaceae). Heredity 59: 7–17.
Haddrill, P. R., D. Bachtrog, and P. Andolfatto, 2008 Positive andnegative selection on noncoding DNA in Drosophila simulans.Mol. Biol. Evol. 25: 1825–1834.
Hartfield, M., and S. Glémin, 2014 Hitchhiking of deleterious al-leles and the cost of adaptation in partially selfing species. Ge-netics 196: 281–293.
Haudry, A., A. Cenci, C. Guilhaumon, E. Paux, S. Poirier et al.,2008 Mating system and recombination affect molecular evo-lution in four Triticeae species. Genet. Res. 90: 97–109.
Hazzouri, K. M., J. S. Escobar, R. W. Ness, L. Killian Newman, A. M.Randle et al., 2013 Comparative population genomics in Col-linsia sister species reveals evidence for reduced effective pop-ulation size, relaxed selection, and evolution of biased geneconversion with an ongoing mating system shift. Evolution 67:1263–1278.
Hedrick, P. W., 1994 Purging inbreeding depression and the prob-ability of extinction: full-sib mating. Heredity 73: 363–372.
Husband, B. C., and S. C. H. Barrett, 1992 Effective populationsize and genetic drift in tristylous Eichhornia paniculata (Ponte-deriaceae). Evolution 46: 1875–1890.
Husband, B. C., and S. C. H. Barrett, 1993 Multiple origins of self-fertilization in tristylous Eichhornia paniculata (Pontederia-ceae): inferences from style morph and isozyme variation. J.Evol. Biol. 6: 591–608.
Husband, B. C., and S. C. H. Barrett, 1998 Spatial and temporalvariation in population size of Eichhornia paniculata in ephem-eral habitats: implications for metapopulation dynamics. J. Ecol.86: 1021–1031.
Igic, B., and J. W. Busch, 2013 Is self-fertilization an evolutionarydead end? New Phytol. 198: 386–397.
Keightley, P. D., and A. Eyre-Walker, 2007 Joint inference of thedistribution of fitness effects of deleterious mutations and pop-ulation demography based on nucleotide polymorphism fre-quencies. Genetics 177: 2251–2261.
Kousathanas, A., and P. D. Keightley, 2013 A comparison of mod-els to infer the distribution of fitness effects of new mutations.Genetics 193: 1197–1208.
Lloyd, D. G., 1980 Demographic factors and mating patterns inangiosperms, pp. 67–88 in Demography and evolution in plantpopulations, edited by O. T. Solbrig Blackwell, Oxford.
Li, H., and R. Durbin, 2009 Fast and accurate short read align-ment with Burrows-Wheeler Transform. Bioinformatics 25:1754–1760.
Li, H., B. Handsaker, A. Wysoker, T. Fennell, J. Ruan et al., 2009 Thesequence alignment/map format and SAMtools. Bioinformatics25: 2078–2079.
Lunter, G., and M. Goodson, 2011 Stampy: A statistical algorithmfor sensitive and fast mapping of Illumina sequence reads. Ge-nome Res. 21: 936–939.
McVean, G. A. T., and B. Charlesworth, 2000 The effects of Hill-Robertson interference between weakly selected mutations onpatterns of molecular evolution and variation. Genetics 155:929–944.
Messer, P. W., 2013 SLiM: Simulating evolution with selectionand linkage. Genetics 194: 1037–1039.
Messer, P. W., and D. A. Petrov, 2013 Frequent adaptation and theMcDonald–Kreitman test. Proc. Natl. Acad. Sci. USA 110: 8615–8620.
Manna, F., G. Martin, and T. Lenormand, 2011 Fitness land-scapes: an alternative theory for the dominance of mutation.Genetics 189: 923–937.
Ness, R. W., S. I. Wright, and S. C. H. Barrett, 2010 Mating-systemvariation, demographic history and patterns of nucleotide diversityin the tristylous plant Eichhornia paniculata. Genetics 184: 381–392.
Ness, R. W., M. Siol, and S. C. H. Barrett, 2011 De novo sequenceassembly and characterization of the floral transcriptome incross-and self-fertilizing plants. BMC Genomics 12: 298.
Ness, R. W., M. Siol, and S. C. H. Barrett, 2012 Genomic conse-quences of transitions from cross- to self-fertilization on theefficacy of selection in three independently derived selfingplants. BMC Genomics 13: 611.
Nordborg, M., 2000 Linkage disequilibrium, gene trees and selfing:an ancestral recombination graph with partial self-fertilization.Genetics 154: 923–929.
Pannell, J. R., and P. D. Fields, 2014 Evolution in subdividedplant populations: concepts, recent advances and future direc-tions. New Phytol. 201: 417–432.
Pennings, P. S., S. Kryazhimskiy, and J. Wakeley, 2014 Loss andrecovery of genetic diversity in adapting populations of HIV.PLoS Genet. 10: e1004000.
Pollak, E., 1987 On the theory of partially inbreeding finite pop-ulations. I. Partial selfing. Genetics 117: 353–360.
Qiu, S., K. Zeng, T. Slotte, S. I. Wright, and D. Charlesworth,2011 Reduced efficacy of natural selection on codon usagebias in selfing Arabidopsis and Capsella species. Genome Biol.Evol. 3: 868–880.
R Development Core Team, 2011 R: A language and environmentfor statistical computing, R Foundation for Statistical Computing,Vienna.
Schulz, M. H., D. R. Zerbino, M. Vingron, and E. Birney, 2012 Oases:Robust de novo RNA-seq assembly across the dynamic range ofexpression levels. Bioinformatics 28: 1086–1092.
Simons, Y. B., M. C. Turchin, J. K. Pritchard, and G. Sella, 2014 Thedeleterious mutation load is insensitive to recent population his-tory. Nat. Genet. 46: 220–224.
828 R. Arunkumar et al.

Simmons, M. J., and J. F. Crow, 1977 Mutations effecting fitnessin Drosophila populations. Annu. Rev. Genet. 11: 49–78.
Slotte, T., K. M. Hazzouri, J. A. Ågren, D. Koenig, F. Maumus et al.,2013 The Capsella rubella genome and the genomic consequen-ces of rapid mating system evolution. Nat. Genet. 45: 831–835.
Städler, T., B. Haubold, C. Merino, W. Stephan, and P. Pfaffelhuber,2009 The impact of sampling schemes on the site frequencyspectrum in nonequilibrium subdivided populations. Genetics182: 205–216.
Stebbins, G. L., 1957 Self fertilization and population variabilityin the higher plants. Am. Nat. 91: 337–354.
Sweigart, A. L., and J. H. Willis, 2003 Patterns of nucleotide di-versity in two species of Mimulus are affected by mating systemand asymmetric introgression. Evolution 57: 2490–2506.
Szövényi, P., N. Devos, D. J. Weston, X. Yang, Z. Hock et al.,2014 Efficient purging of deleterious mutations in plants withhaploid selfing. Genome Biol. Evol. 6: 1238–1252.
Takebayashi, N., and P. L. Morrell, 2001 Is self-fertilization anevolutionary dead end? Revisiting an old hypothesis with ge-netic theories and a macroevolutionary approach. Am. J. Bot.88: 1143–1150.
Tamura, K., G. Stecher, D. Peterson, A. Filipski, and S. Kumar,2013 MEGA6: Molecular Evolutionary Genetics Analysis ver-sion 6.0. Mol. Biol. Evol. 30: 2725–2729.
Wakeley, J., and S. Lessard, 2003 Theory of the effects of popu-lation structure and sampling on patterns of linkage disequilib-rium applied to genomic data from humans. Genetics 164:1043–1053.
Wang, J., W. G. Hill, D. Charlesworth, and B. Charlesworth,1999 Dynamics of inbreeding depression due to deleteriousmutations in small populations: mutation parameters and in-breeding rate. Genet. Res. 74: 165–178.
Wigginton, J. E., D. J. Cutler, and G. R. Abecasis, 2005 A note onexact tests of Hardy-Weinberg equilibrium. Am. J. Hum. Genet.76: 887–893.
Williamson, R. J., E. B. Josephs, A. E. Platts, K. M. Hazzouri, A.Haudry et al., 2014 Evidence for widespread positive andnegative selection in coding and conserved noncoding regionsof Capsella grandiflora. PLoS Genet. 10: e1004622.
Wright, S. I., B. Lauga, and D. Charlesworth, 2002 Rates andpatterns of molecular evolution in inbred and outbred Arabidop-sis. Mol. Biol. Evol. 19: 1407–1420.
Wright, S. I., R. W. Ness, J. P. Foxe, and S. C. H. Barrett, 2008 Genomicconsequences of outcrossing and selfing in plants. Int. J. PlantSci. 169: 105–118.
Wright, S. I., S. Kalisz, and T. Slotte, 2013 Evolutionary conse-quences of self-fertilization in plants. Proc. R. Soc. B 280:20130133.
Zerbino, D. R., and E. Birney, 2008 Velvet: algorithms for de novoshort read assembly using de bruijn graphs. Genome Res. 18:821–829.
Zerbino, D. R., 2010 Using the velvet de novo assembler for short-read sequencing technologies. Curr. Protoc. Bioinformatics 31:11.5.1–11.5.12.
Communicating editor: L. C. Moyle
Genomic Consequences of Selfing 829

GENETICSSupporting Information
http://www.genetics.org/lookup/suppl/doi:10.1534/genetics.114.172809/-/DC1
The Evolution of Selfing Is Accompanied byReduced Efficacy of Selection and Purging
of Deleterious MutationsRamesh Arunkumar, Rob W. Ness, Stephen I. Wright, and Spencer C. H. Barrett
Copyright © 2015 by the Genetics Society of AmericaDOI: 10.1534/genetics.114.172809

2 SI R. Arunkumar et al.
Figure S1 Genome structure implemented in the simulations. Each genome was 100 Mbp comprised of alternating 800 bp noncoding (NC) and 200 bp coding (C) regions. All sites in NC and 25% of sites in C were neutral with h=0.5 and the remaining 75% of C were under varying selection coefficients.

R. Arunkumar et al. 3 SI
Figure S2 Length distribution of all contigs from the de novo assembly of six Jamaican genotypes of Eichhornia paniculata using Velvet‐Oases. The summary statistics for the assembly are shown in the table within the figure. The N50 value shows that 50% of all bases in the assembled reference are in contigs of size corresponding to this value or larger.
4 SI R. Arunkumar et al.
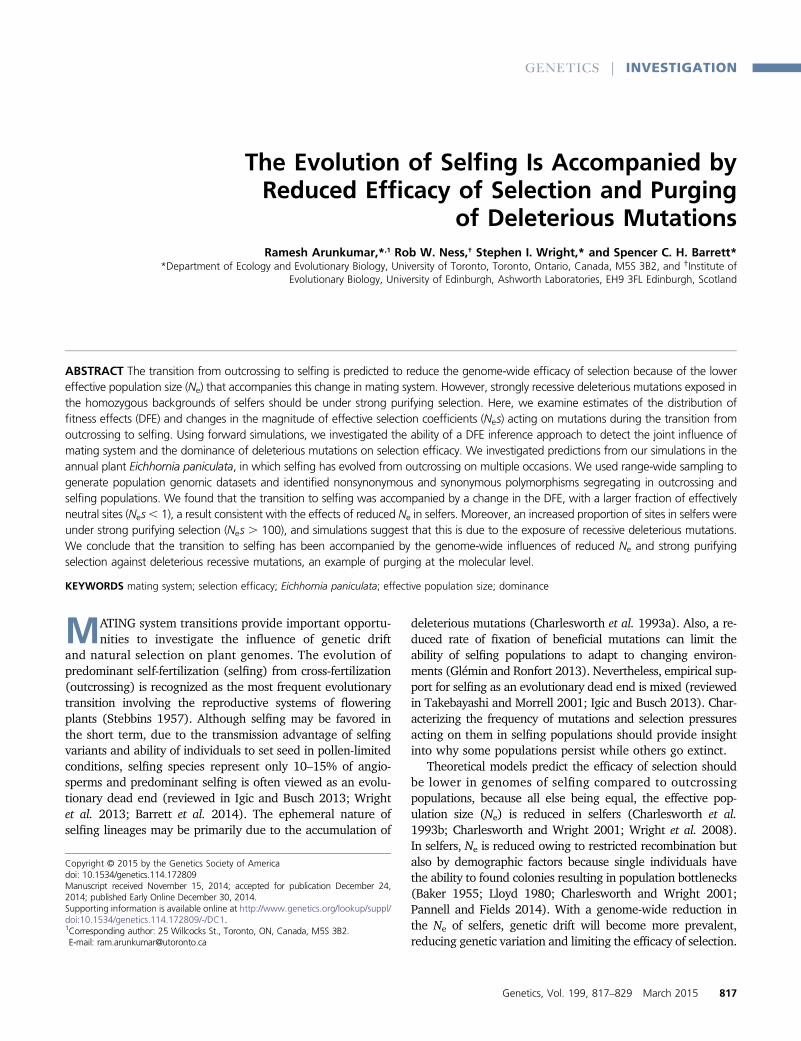
Figure S3 Coverage distribution of genomic reads from one selfing Mexican genotype of Eichhornia paniculata mapped to the de novo transcriptome reference.

R. Arunkumar et al. 5 SI
Figure S4 Folded synonymous allele frequency spectra for simulated outcrossing (t=1.00) and selfing (t=0.02) populations under various fixed dominance coefficients (h=0.2, 0.5, or 0.8). We generated the allele frequency spectra by randomly sampling eight genomes from populations of size 1000. To generate the frequency spectra we either used A) mutations unique to outcrossing population, B) mutations unique to selfing population, C) mutations unique to outcrossing populations and shared between outcrossing and selfing populations, or D) mutations unique to selfing populations and shared between outcrossing and selfing populations. The white open bars depict the neutral equilibrium expectation.

6 SI R. Arunkumar et al.
Figure S5 Distribution of fitness effects (DFE) of new nonsynonymous mutations or simulated outcrossing (t=1.00) and selfing (t=0.02) populations under various fixed dominance coefficients (h=0.2, 0.5, or 0.8) when both mutations unique to each population and mutations shared between populations were used to estimate selective and demographic parameters. Nes is the product of Ne and the selection coefficient (s). Shown are A) the expected DFEs, B) h=0.2, C) h=0.5, and D) h=0.8. Simulations illustrate the change in DFE for both populations after 6N generations after a split from the common outcrossing ancestor. We generated the expected DFE for the outcrossing population represented as a gamma distribution using supplied β and Ns parameters. We generated the expected DFE for the selfing population by scaling supplied Ns parameter by the observed 75% reduction in synonymous diversity in selfers and multiplying it by 1.96 to account for effective dominance levels of mutations in selfing genomes while leaving β unchanged. We generated observed DFEs by randomly sampling and generating allele frequency spectra using eight genomes from populations of size 1000. The coding regions were under various selection coefficients (Ns=0.5‐95) all sampled from a gamma distribution with shape parameter (β) 0.3. Shown are the mean proportions of sites for each Nes category and their respective confidence intervals based on 120 simulations.

R. Arunkumar et al. 7 SI
Figure S6 Distribution of fitness effects (DFE) of new nonsynonymous mutations for simulated outcrossing (t=1.00) and selfing (t=0.02) populations under various fixed dominance coefficients (h=0.2, 0.5, or 0.8) when synonymous mutations occurred only within coding regions were used to estimate demographic parameters. Nes is the product of Ne and the selection coefficient (s). Shown are A) the expected DFEs, B) h=0.2, C) h=0.5, and D) h=0.8. Simulations illustrate the change in DFE for both populations after 6N generations after a split from the common outcrossing ancestor. We generated the expected DFE for the outcrossing population represented as a gamma distribution using supplied β and Ns parameters. We generated the expected DFE for the selfing population by scaling supplied Ns parameter by the observed 75% reduction in synonymous diversity in selfers and multiplying it by 1.96 to account for effective dominance levels of mutations in selfing genomes while leaving β unchanged. We generated observed DFEs by randomly sampling and generating allele frequency spectra using eight genomes from populations of size 1000. The coding regions were under various selection coefficients (Ns=0.5‐95) all sampled from a gamma distribution with shape parameter (β) 0.3. Shown are the mean proportions of sites for each Nes category and their respective confidence intervals based on 120 simulations.

8 SI R. Arunkumar et al.
Figure S7 Distribution of fitness effects (DFE) of new nonsynonymous mutations for simulated outcrossing populations with recombination rate (r) of either 5×10‐8 or 1.96×10‐9 per site per generation under various fixed dominance coefficients. Shown are A) the expected DFEs, B) h=0.2, C) h=0.5, and D) h=0.8. Simulations illustrate the DFE for both populations after 16N generations. The coding regions were under various selection coefficients (Ns=0.5‐95) all sampled from a gamma distribution with shape parameter (β) 0.3. The population had a constant mutation rate (μ=7×10‐9 per site per generation) and population size (N=1000) during the simulation runs. We generated the expected DFE under N=1000 for an outcrossing population represented as a gamma distribution using supplied β and Ns parameters. We expected DFE under N=250 by scaling supplied Ns parameters while leaving β unchanged. We generated the observed DFEs by randomly sampling and generating allele frequency spectra using eight genomes. Shown are the mean proportions of sites for each Nes category and their respective confidence intervals based on 120 simulations.

R. Arunkumar et al. 9 SI
Figure S8 Distribution of polymorphisms per contig for eight outcrossing Eichhornia paniculata populations from N.E. Brazil and eight selfing populations from the Caribbean. Of the 16416 loci, 4485 were polymorphic in outcrossers and 1586 were polymorphic in selfers.

10 SI R. Arunkumar et al.
Figure S9 Cumulative distribution of fitness effects (DFE) of new nonsynonymous mutations for outcrossing and selfing populations of Eichhornia paniculata. Nes is the product of Ne and the selection coefficient (s). Eight Caribbean selfing samples and eight outcrossing individuals were used to generate the DFEs. Eight outcrossing samples from the 10 that were sequenced were randomly selected to keep the number of chromosomes sampled the same while performing the comparisons. The shape (β) and mean selection against deleterious mutations (N*E(s)) parameter estimates from the approach of Keightley and Eyre‐Walker (2007) were used to plot the gamma distributions. For outcrossers, β=0.3691, ‐N*E(s)=365.16; for selfers β=0.2517, ‐N*E(s)=3112.84.

R. Arunkumar et al. 11 SI
Figure S10 Distribution of fitness effects (DFE) of new nonsynonymous mutations for outcrossing and selfing populations of Eichhornia paniculata under varying quality cut‐off scores (QUAL) for invariant and variant sites. Nes is the product of Ne and the selection coefficient (s). Eight Caribbean selfing samples and eight outcrossing individuals were used to generate the DFEs. Eight outcrossing samples from the 10 that were sequenced were randomly selected to keep the number of chromosomes sampled the same while performing the comparisons. Error bars for each Nes category are 95% confidence intervals from 200 bootstrap replicates generated by resampling over loci.

12 SI R. Arunkumar et al.
Figure S11 Distribution of fitness effects (DFE) of new nonsynonymous mutations for outcrossing and selfing populations of Eichhornia paniculata after 245 loci containing sites heterozygous in two or more selfing populations were excluded from analyses. Nes is the product of Ne and the selection coefficient (s). Eight Caribbean selfing samples and eight outcrossing individuals were used to generate the DFEs. Eight outcrossing samples from the 10 that were sequenced were randomly selected to keep the number of chromosomes sampled the same while performing the comparisons. Error bars for each Nes category are 95% confidence intervals from 200 bootstrap replicates generated by resampling over loci.

R. Arunkumar et al. 13 SI
Figure S12 Distribution of fitness effects (DFE) of new nonsynonymous mutations for outcrossing and selfing populations of Eichhornia paniculata after 73 loci containing sites that violated assumptions of Hardy‐Weinberg equilibrium in outcrossing populations were excluded from analyses. Nes is the product of Ne and the selection coefficient (s). Eight Caribbean selfing samples and eight outcrossing individuals were used to generate the DFEs. Eight outcrossing samples from the 10 that were sequenced were randomly selected to keep the number of chromosomes sampled the same while performing the comparisons. Error bars for each Nes category are 95% confidence intervals from 200 bootstrap replicates generated by resampling over loci.

14 SI R. Arunkumar et al.
Figure S13 Distribution of πn/πs for polymorphic contigs among eight outcrossing Eichhornia paniculata populations from N.E. Brazil and eight selfing populations from the Caribbean. Of the 16416 loci, 4485 were polymorphic in outcrossers and 1586 were polymorphic in selfers.

R. Arunkumar et al. 15 SI
Figure S14 Distribution of fitness effects (DFE) of new nonsynonymous mutations for outcrossing and selfing populations of Eichhornia paniculata after 135 loci with πn/πs>1 in either population were excluded from analyses. Nes is the product of Ne and the selection coefficient (s). Eight Caribbean selfing samples and eight outcrossing individuals were used to generate the DFEs. Eight outcrossing samples from the 10 that were sequenced were randomly selected to keep the number of chromosomes sampled the same while performing the comparisons. Error bars for each Nes category are 95% confidence intervals from 200 bootstrap replicates generated by resampling over loci.

16 SI R. Arunkumar et al.
Figure S15 Folded nonsynonymous and synonymous allele frequency spectra for outcrossing and selfing populations of Eichhornia paniculata. We used haploid chromosomes from one individual each from 10 outcrossing and 10 selfing populations to generate the frequency spectra. Populations from the entire range of E. paniculata were sampled, with outcrossing populations from N.E. Brazil and selfing populations from the Caribbean and Central America.

R. Arunkumar et al. 17 SI
Figure S16 Distribution of fitness effects (DFE) of new nonsynonymous mutations for outcrossing and selfing populations of Eichhornia paniculata. Nes is the product of Ne and the selection coefficient (s). Ten outcrossing samples from N.E. Brazil and 10 selfing samples from the Caribbean and Central America were used to generate the DFE. Error bars for each Nes category are 95% confidence intervals from 200 bootstrap replicates generated by resampling over loci. We used a randomisation test (see Keightley and Eyre‐Walker 2007) to compare outcrossing and selfing populations and to assess significance at 0.5% level (indicated by *).
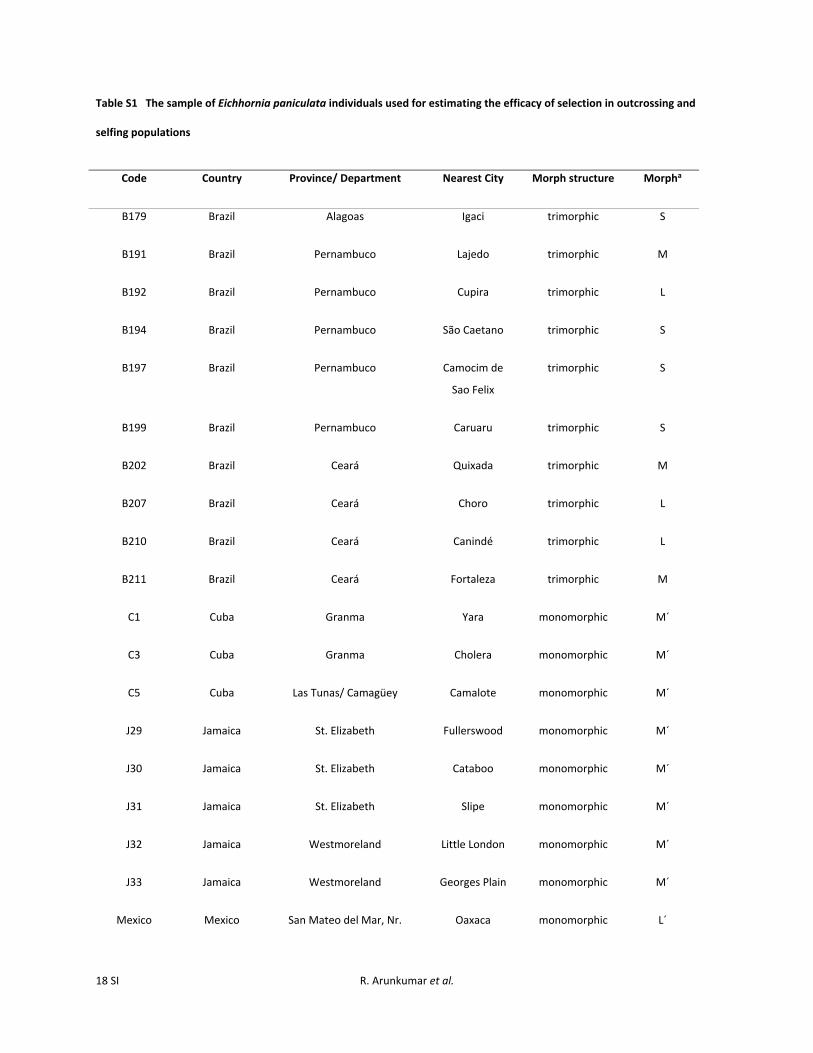
18 SI R. Arunkumar et al.
Table S1 The sample of Eichhornia paniculata individuals used for estimating the efficacy of selection in outcrossing and
selfing populations
Code Country Province/ Department Nearest City Morph structure Morpha
B179 Brazil Alagoas Igaci trimorphic S
B191 Brazil Pernambuco Lajedo trimorphic M
B192 Brazil Pernambuco Cupira trimorphic L
B194 Brazil Pernambuco São Caetano trimorphic S
B197 Brazil Pernambuco Camocim de
Sao Felix
trimorphic S
B199 Brazil Pernambuco Caruaru trimorphic S
B202 Brazil Ceará Quixada trimorphic M
B207 Brazil Ceará Choro trimorphic L
B210 Brazil Ceará Canindé trimorphic L
B211 Brazil Ceará Fortaleza trimorphic M
C1 Cuba Granma Yara monomorphic M´
C3 Cuba Granma Cholera monomorphic M´
C5 Cuba Las Tunas/ Camagüey Camalote monomorphic M´
J29 Jamaica St. Elizabeth Fullerswood monomorphic M´
J30 Jamaica St. Elizabeth Cataboo monomorphic M´
J31 Jamaica St. Elizabeth Slipe monomorphic M´
J32 Jamaica Westmoreland Little London monomorphic M´
J33 Jamaica Westmoreland Georges Plain monomorphic M´
Mexico Mexico San Mateo del Mar, Nr. Oaxaca monomorphic L´

R. Arunkumar et al. 19 SI
Tehuantepec
Nicaragua Nicaragua Rivas Rio Las Lajas monomorphic L´
aL=long‐styled morph, L´=selfing variant of the L‐morph, M=mid‐styled morph, M´=selfing variant of the M‐morph, S=short‐styled morph. Data from Barrett et al. (2009) and Ness et al. (2010).

20 SI R. Arunkumar et al.
Table S2 Polymorphisms segregating in Eichhornia paniculata populations identified in aligned portions of EST‐derived
nuclear locus EP0314 from Barrett et al. (2009) and Ness et al. (2010) and the best matching contig from this study
Site 127 148 177 217 228 262 266 298 634 652 655 733
Brazil South selfer
(t=0)a C C G C C G A C C A/C C/T C/?
Brazil South
outcrosser (t>0.8)a A/C C/T G C/T C/G C/G/T A/G C/G C/T/? A/C/T/? C/T/? C/?
Brazil North
outcrosser (t>0.8)a C C G C C G A C C/T C C C/?
Caribbean (t<0.15)a A C A/G C C T G C T/C C C C
Central America (t=0)a C C G C C G A C C/? C/? C/? C/?
Brazil_sample1b C C G C C G A C C C C C
Brazil_sample2b C C G C C G A C C C C C
Brazil_sample3b C C G C C G A C T C C C
Brazil_sample4b C C G C C G A C C C C C
Brazil_sample5b C C G C C G G G C T C C
Brazil_sample6b C C G C C G A C C C C C
Brazil_sample7b C C G T C C G G C C C C
Brazil_sample8b A C A C C G G C T C C C
Brazil_sample9b C C G C C G A C C C C C
Brazil_sample10b C T G T C C A C C T C C
Caribbean_sample1b A C A C C T G C T C C C
Caribbean_sample2b A C A C C T G C T C C C

R. Arunkumar et al. 21 SI
Caribbean_sample3b A C A C C T G C T C C C
Caribbean_sample4b A C A C C T G C T C C C
Caribbean_sample5b A C A C C T G C T C C C
Caribbean_sample6b A C A C C T G C T C C C
Caribbean_sample7b A C A C C T G C T C C C
Caribbean_sample8b A C A C C T G C T C C C
Central
America_sample1b C C G C C G A C C C C C
Central
America_sample2b C C G C C G A C C C C G
aPolymorphisms identified in populations sampled in Barrett et al. (2009) and Ness et al. (2010)
bPolymorphisms identified in the 10 outcrossing and 10 selfing populations from this study

22 SI R. Arunkumar et al.
Table S3 Nonsynonymous and synonymous diversity of simulated outcrossing and selfing populations under fixed
dominance levels for all mutations
Dominance of mutations (h) Mating system πn πs πn/πs
0.2 Outcrosser 1.63E‐05 3.51E‐05 0.46
0.2 Selfer 3.82E‐06 8.75E‐06 0.44
0.5 Outcrosser 1.36E‐05 3.41E‐05 0.40
0.5 Selfer 3.67E‐06 8.88E‐06 0.41
0.8 Outcrosser 1.24E‐05 3.34E‐05 0.37
0.8 Selfer 3.73E‐06 8.73E‐06 0.43

R. Arunkumar et al. 23 SI
Table S4 P‐values from a two‐sample t‐test comparing Nesa categories of simulated outcrossing and selfing populations
under fixed dominance levels for all mutations
Dominance of mutations (h) <1 1‐10 10‐100 >100
0.2 0.257 0.479 0.002** <0.001***
0.5 0.163 0.415 0.609 0.651
0.8 <0.001*** 0.181 0.030* 0.275
aNes is the product of Ne and the selection coefficient (s)
*Significant at the 5% level
**Significant at the 1% level
***Significant at the 0.1% level

24 SI R. Arunkumar et al.
Table S5 Two‐way analysis of variance comparing the Nesa categories of simulated outcrossing and selfing populations
under varying dominance for mutations
P‐values
Factor Degrees of freedom <1 1‐10 10‐100 >100
Mating system 1 0.049* 0.012* <0.001*** <0.001***
Time (N) 5 0.011* 0.089 0.243 0.121
Mating system * Time (N) 5 0.011* 0.056 0.092 0.028*
Error 1428
aNes is the product of Ne and the selection coefficient (s)
*Significant at the 5% level
***Significant at the 0.1% level

R. Arunkumar et al. 25 SI
Table S6 Counts of nonsynonymous and synonymous invariant sites and minor allele frequency spectra bins summed across
loci for eight outcrossing and eight selfing populations of Eichhornia paniculata
Invariant 1 2 3 4
Outcrosser nonsynonymous 5205480 14392 3552 1702 742
Outcrosser synonymous 1438285 19738 6799 3933 1914
Selfer nonsynonymous 5177565 2478 561 402 172
Selfer synonymous 1454240 3562 918 910 340

26 SI R. Arunkumar et al.
Table S7 Number of loci containing sites heterozygous across multiple selfing populations from the Caribbean
Sites Number of loci containing such sites
Heterozygous in two or more populations 245
Heterozygous in three or more populations 140
Heterozygous in four or more populations 113
Heterozygous in five or more populations 97
Heterozygous in six or more populations 87

R. Arunkumar et al. 27 SI
Table S8 P‐values from randomisation tests as applied in Keightley and Eyre‐Walker (2007) comparing the Nes<1a category
between DFEs of eight outcrossing and eight selfing Eichhornia paniculata populations under various filtering conditions
Comparisons P‐values
Original, Figure 6 0.190
Including sites with QUAL>30, Figure S10 0.190
Including sites with QUAL>0, Figure S10 0.267
Excluding 245 loci with sites heterozygous in >1 selfers, Figure S11 0.370
Excluding 73 loci with sites violating Hardy‐Weinberg in outcrossers, Figure S12 0.250
Excluding 135 loci with πn/πs>1 in outcrossers or selfers, Figure S14 0.533
aNes is the product of Ne and the selection coefficient (s)