Embed Size (px)
Citation preview

Weekly Research Reports
Enjoy Your Comfort Zone.
Invest Smart. Build Wealth.
The Evolution of Knowledge based Research…

CONTENTSCONTENTS
Top Sectors for the Week
COMFORT PICK OF THE WEEK
Title Page No.
Comfort Pick Of The Week 03-04
Top Sectors for the Week 05-12
Weekly Pivot Table (Equities) 13
Weekly Pivot Table (Commodities) 14
Disclaimer 15

COMFORT PICK OF THE WEEKLet Your Money Grow Confidently !
Enjoy Your Comfort Zone.
Invest Smart. Build Wealth.
March with StrengthComfort Securities Ltd.
Comfort Pick Of The Week… Getting rich is easy with help of Comfort Pick Of The Week.
This weekly research report helps you to identify the best five momentum stocks for the week. ‘Pick of the week’ is best among the mentioned five and is always with detailed ‘Technical & Macro outlook’.
The trick to “Get Rich quickly and to Stay Rich forever” is a combination of alertness and awareness. With the right information on stocks from Comfort Pick Of The Week, your money is likely to grow confidently and living the “rich” life, is achievable.
STOCKS CMP BIAS TRADING/ INVESTMENT STRATEGY
COMFORT PICK OF THE WEEKLet Your Money Grow Confidently !
www.comfortsecurities.co.inEnjoy Your Comfort Zone.
Invest Smart. Build Wealth.
Monday09th July, 2018
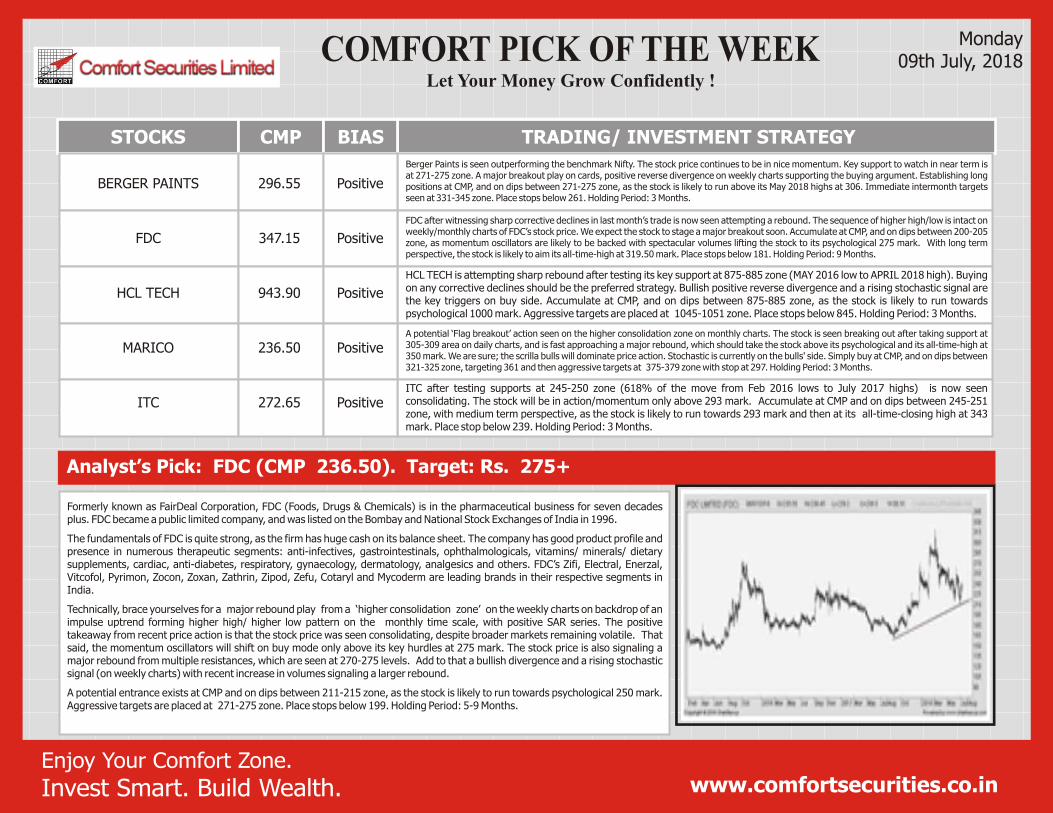
Analyst’s Pick: FDC (CMP 236.50). Target: Rs. 275+
Formerly known as FairDeal Corporation, FDC (Foods, Drugs & Chemicals) is in the pharmaceutical business for seven decades plus. FDC became a public limited company, and was listed on the Bombay and National Stock Exchanges of India in 1996.
The fundamentals of FDC is quite strong, as the firm has huge cash on its balance sheet. The company has good product profile and presence in numerous therapeutic segments: anti-infectives, gastrointestinals, ophthalmologicals, vitamins/ minerals/ dietary supplements, cardiac, anti-diabetes, respiratory, gynaecology, dermatology, analgesics and others. FDC’s Zifi, Electral, Enerzal, Vitcofol, Pyrimon, Zocon, Zoxan, Zathrin, Zipod, Zefu, Cotaryl and Mycoderm are leading brands in their respective segments in India.
Technically, brace yourselves for a major rebound play from a ‘higher consolidation zone’ on the weekly charts on backdrop of an impulse uptrend forming higher high/ higher low pattern on the monthly time scale, with positive SAR series. The positive takeaway from recent price action is that the stock price was seen consolidating, despite broader markets remaining volatile. That said, the momentum oscillators will shift on buy mode only above its key hurdles at 275 mark. The stock price is also signaling a major rebound from multiple resistances, which are seen at 270-275 levels. Add to that a bullish divergence and a rising stochastic signal (on weekly charts) with recent increase in volumes signaling a larger rebound.
A potential entrance exists at CMP and on dips between 211-215 zone, as the stock is likely to run towards psychological 250 mark. Aggressive targets are placed at 271-275 zone. Place stops below 199. Holding Period: 5-9 Months.
BERGER PAINTS 296.55 Positive
FDC 347.15 Positive
HCL TECH 943.90 Positive
MARICO 236.50 Positive
ITC 272.65 Positive
Berger Paints is seen outperforming the benchmark Nifty. The stock price continues to be in nice momentum. Key support to watch in near term is at 271-275 zone. A major breakout play on cards, positive reverse divergence on weekly charts supporting the buying argument. Establishing long positions at CMP, and on dips between 271-275 zone, as the stock is likely to run above its May 2018 highs at 306. Immediate intermonth targets seen at 331-345 zone. Place stops below 261. Holding Period: 3 Months.
FDC after witnessing sharp corrective declines in last month’s trade is now seen attempting a rebound. The sequence of higher high/low is intact on weekly/monthly charts of FDC’s stock price. We expect the stock to stage a major breakout soon. Accumulate at CMP, and on dips between 200-205 zone, as momentum oscillators are likely to be backed with spectacular volumes lifting the stock to its psychological 275 mark. With long term perspective, the stock is likely to aim its all-time-high at 319.50 mark. Place stops below 181. Holding Period: 9 Months.
HCL TECH is attempting sharp rebound after testing its key support at 875-885 zone (MAY 2016 low to APRIL 2018 high). Buying on any corrective declines should be the preferred strategy. Bullish positive reverse divergence and a rising stochastic signal are the key triggers on buy side. Accumulate at CMP, and on dips between 875-885 zone, as the stock is likely to run towards psychological 1000 mark. Aggressive targets are placed at 1045-1051 zone. Place stops below 845. Holding Period: 3 Months.
A potential ‘Flag breakout’ action seen on the higher consolidation zone on monthly charts. The stock is seen breaking out after taking support at 305-309 area on daily charts, and is fast approaching a major rebound, which should take the stock above its psychological and its all-time-high at 350 mark. We are sure; the scrilla bulls will dominate price action. Stochastic is currently on the bulls' side. Simply buy at CMP, and on dips between 321-325 zone, targeting 361 and then aggressive targets at 375-379 zone with stop at 297. Holding Period: 3 Months.
ITC after testing supports at 245-250 zone (618% of the move from Feb 2016 lows to July 2017 highs) is now seen consolidating. The stock will be in action/momentum only above 293 mark. Accumulate at CMP and on dips between 245-251 zone, with medium term perspective, as the stock is likely to run towards 293 mark and then at its all-time-closing high at 343 mark. Place stop below 239. Holding Period: 3 Months.

Top Sectors for the Week
Top Sectors for the Week is a Technical and Macro report containing everything you need to have…a clear, precise and detailed view on the five top momentum sectors... listed in BSE. This detailed multi-analyzed Macro-Technical report is a smart way to enter or exit an outperforming or underperforming sector using the relative strength function.
Top Sectors for the Week reports have an unbeatable track record...You can look out for our previous reports at our website www.comfortsecurities.co.in
Enjoy Your Comfort Zone.
Invest Smart. Build Wealth.
Relative Strength Performancewith Comfort Securities Ltd.
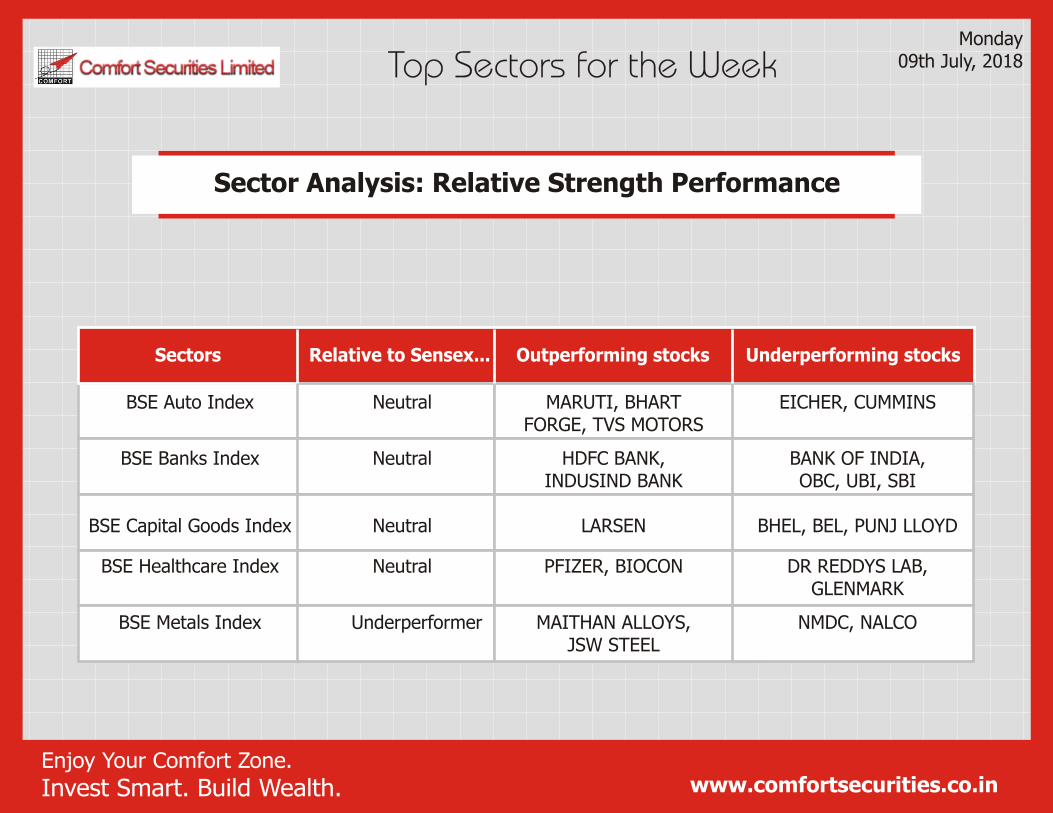
Sector Analysis: Relative Strength Performance
Top Sectors for the Week
www.comfortsecurities.co.inEnjoy Your Comfort Zone.
Invest Smart. Build Wealth.
Sectors Relative to Sensex... Outperforming stocks Underperforming stocks
Monday09th July, 2018
BSE Auto Index Neutral MARUTI, BHART EICHER, CUMMINSFORGE, TVS MOTORS
BSE Banks Index Neutral HDFC BANK, BANK OF INDIA, INDUSIND BANK OBC, UBI, SBI
BSE Capital Goods Index Neutral LARSEN BHEL, BEL, PUNJ LLOYD
BSE Healthcare Index Neutral PFIZER, BIOCON DR REDDYS LAB, GLENMARK
BSE Metals Index Underperformer MAITHAN ALLOYS, NMDC, NALCOJSW STEEL
Top Sectors for the Week
From Comfort Research Desk…
www.comfortsecurities.co.inEnjoy Your Comfort Zone.
Invest Smart. Build Wealth.
Sensex: 35,658:
The Week That Was: The benchmark Nifty ended last week’s trade, just above the dotted lines; indicating that investors are unperturbed or have got used to the continued spat between the U.S & China. The key positive catalysts were the activity in India's service industry which rebounded in June to 52.6, its highest since June 2017, from 49.6 in May. The Nikkei Manufacturing Purchasing Managers' Index, too rose to 53.1 in June from May's 51.2, the highest since December. Meanwhile, the Union Cabinet approved a hike in minimum support prices (MSP) for Kharif crops by 1.5 times of the input cost for the 2018-19 season. This was another positive trigger havin a positive effect on the overall economy.
The Sensex and the Nifty, both, settled well above their psychological 35000 & 10700 mark respectively. Sensex ended in green in three out of the five trading sessions of the week. The BSE MidCap index slipped 0.38% and the BSE SmallCapinched up 0.17% in the week gone by, underperforming Sensex.
Amongst Sectoral indices, the major outperformers on weekly basis were BSE Auto index, up 3.5%, followed by BSE FMCG Index, up 1.4% and the BSE IT Index, up 0.02%. The indices which fell in last week’s trade were BSE Metal index, down 3.5% followed by BSE Reality index, down 1.4%.
Among the BSE-30 stocks, the major gainers were: BAJAJ AUTO, MARUTI SUZUKI, and then HERO MOTO CORP; which were up 7.5%, 5.5%, and 4.7% respectively. The top three losers of the week were: NTPC, BHARTI AIRTEL, and POWERGRID down 5.8%, 5% and 2.9% respectively.
Meanwhile, Wall Street ended Friday’s session modestly higher after the labor market reading came in stronger than expected, supporting the thesis that economic fundamentals remain healthy despite trade-war anxieties.
For the week, the Dow ended higher 0.8%, the S&P rose 1.5%, while the Nasdaq gained 2.4%.
Week Ahead: Dalal Street is most likely to start the week on a positive note on backdrop of a strong close at our stock markets in Friday’s trade and a positive session at Wall Street in Friday’s trade. Focus will immediately shit to Q1 earning season: Prominent firms announcing Q1 are:
Monday: DISHTVTuesday: INDUSINDBK, TCSThursday: CYIENT, KARANATAKA BANK.Friday: BAJAJCORP, INFY
Amongst macro data, the street will brace for the announcement of May industrial production data to be released on Thursday, July 12. India’s industrial activity gained pace in April led by manufacturing and mining activity. The index of industrial production rose 4.9 per cent in April over a year ago.
All anxious eyes will also be on the progress on monsoon. As per reports, heavy rains hit parts of Maharashtra, Gujarat, Goa and Karnataka on Saturday. Well, this should boost confidence at bulls’ camp for sure.
Meanwhile, the street will keep a close eye on the movement of Indian Rupee and the Crude-Oil prices as that could influence investors’ sentiment.
Technically, the key interweek hurdles to watch on Sensex are at 36,101 & on Nifty, its 10,951. Downside support now placed at 34750 zone and then major supports lie at psychological 33,500 mark.
For the current week, we expect the benchmark Sensex to trade with slight positive bias amidst positive momentum play. Aggressive traders can look to establish long positions only on any corrective declines with strict stop below 33501 on Sensex.
Among other stocks looking bright are: BIOCON, TCS, TATA ELXSI, MARICO, INDUSIND BANK, EXIDE INDUSTRIES, IGL, KPIT, BAJAJ FINANCIAL. We are negative on stocks like NMDC, NALCO, Reliance Infra, DR REDDYS LAB, OBC, Bank Of India, and Bank Of Baroda. Among sectoral indices, we shift our bias on BSE Bankex to neutral amidst overbought technical conditions.
Meanwhile, for this week, our most preferred pair strategies are:
Long INDUSIND BANKN & Short BANK OF BARODA.
Top Sectors for the Week
www.comfortsecurities.co.inEnjoy Your Comfort Zone.
Invest Smart. Build Wealth.
BSE Auto Index vs Sensex
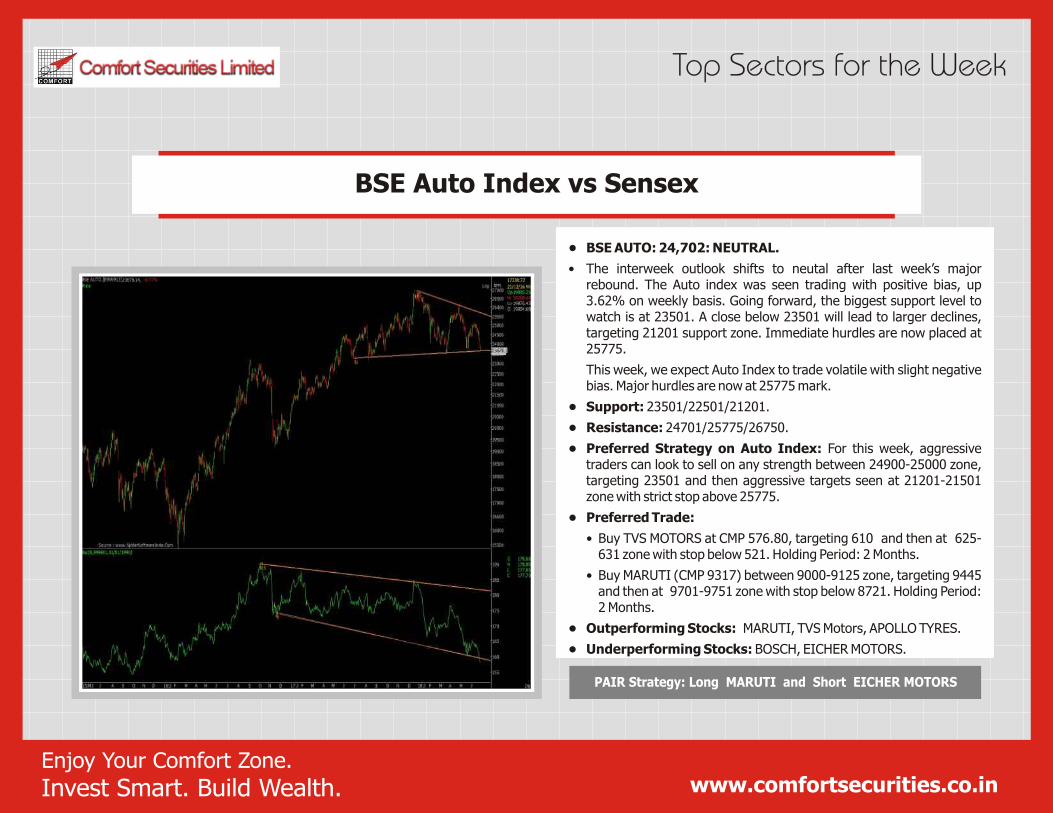
• BSE AUTO: 24,702: NEUTRAL.
• The interweek outlook shifts to neutal after last week’s major rebound. The Auto index was seen trading with positive bias, up 3.62% on weekly basis. Going forward, the biggest support level to watch is at 23501. A close below 23501 will lead to larger declines, targeting 21201 support zone. Immediate hurdles are now placed at 25775.
This week, we expect Auto Index to trade volatile with slight negative bias. Major hurdles are now at 25775 mark.
• Support: 23501/22501/21201.
• Resistance: 24701/25775/26750.
• Preferred Strategy on Auto Index: For this week, aggressive traders can look to sell on any strength between 24900-25000 zone, targeting 23501 and then aggressive targets seen at 21201-21501 zone with strict stop above 25775.
• Preferred Trade:
• Buy TVS MOTORS at CMP 576.80, targeting 610 and then at 625-631 zone with stop below 521. Holding Period: 2 Months.
• Buy MARUTI (CMP 9317) between 9000-9125 zone, targeting 9445 and then at 9701-9751 zone with stop below 8721. Holding Period: 2 Months.
• Outperforming Stocks: MARUTI, TVS Motors, APOLLO TYRES.
• Underperforming Stocks: BOSCH, EICHER MOTORS.
PAIR Strategy: Long MARUTI and Short EICHER MOTORS
Top Sectors for the Week
www.comfortsecurities.co.inEnjoy Your Comfort Zone.
Invest Smart. Build Wealth.
BSE Banks Index vs Sensex
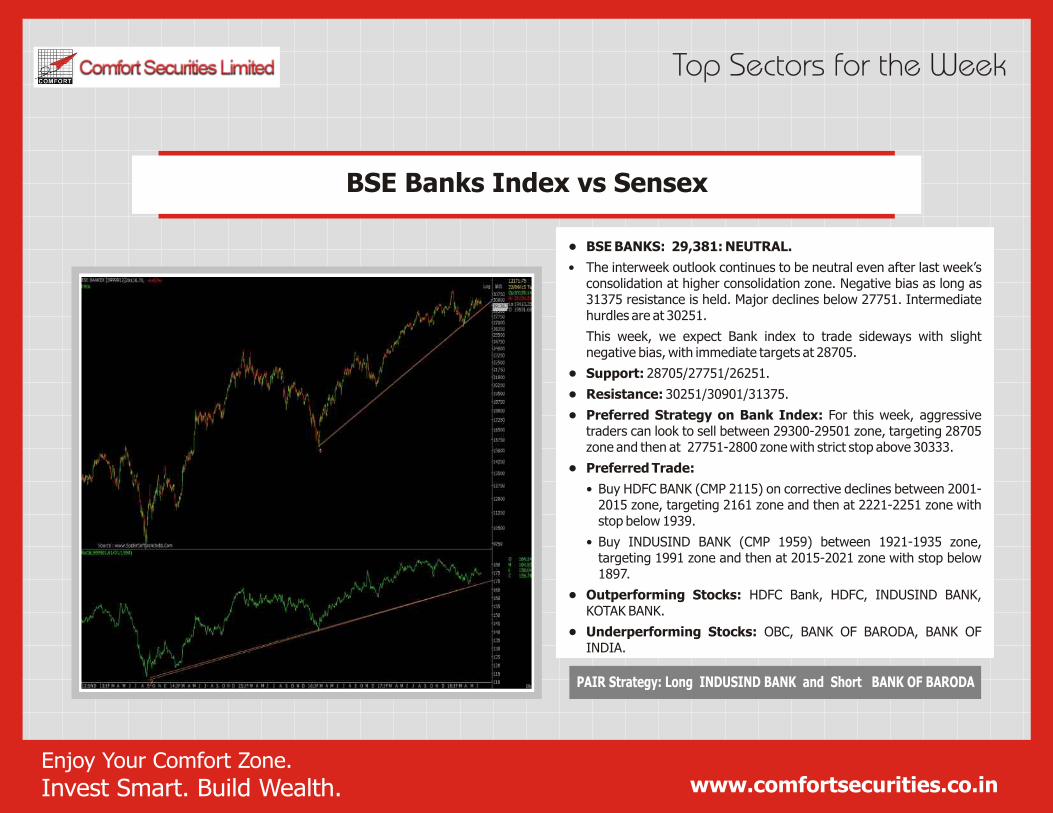
PAIR Strategy: Long INDUSIND BANK and Short BANK OF BARODA
• BSE BANKS: 29,381: NEUTRAL.
• The interweek outlook continues to be neutral even after last week’s consolidation at higher consolidation zone. Negative bias as long as 31375 resistance is held. Major declines below 27751. Intermediate hurdles are at 30251.
This week, we expect Bank index to trade sideways with slight negative bias, with immediate targets at 28705.
• Support: 28705/27751/26251.
• Resistance: 30251/30901/31375.
• Preferred Strategy on Bank Index: For this week, aggressive traders can look to sell between 29300-29501 zone, targeting 28705 zone and then at 27751-2800 zone with strict stop above 30333.
• Preferred Trade:
• Buy HDFC BANK (CMP 2115) on corrective declines between 2001-2015 zone, targeting 2161 zone and then at 2221-2251 zone with stop below 1939.
• Buy INDUSIND BANK (CMP 1959) between 1921-1935 zone, targeting 1991 zone and then at 2015-2021 zone with stop below 1897.
• Outperforming Stocks: HDFC Bank, HDFC, INDUSIND BANK, KOTAK BANK.
• Underperforming Stocks: OBC, BANK OF BARODA, BANK OF INDIA.
Top Sectors for the Week
www.comfortsecurities.co.inEnjoy Your Comfort Zone.
Invest Smart. Build Wealth.
BSE Capital Goods Index vs Sensex
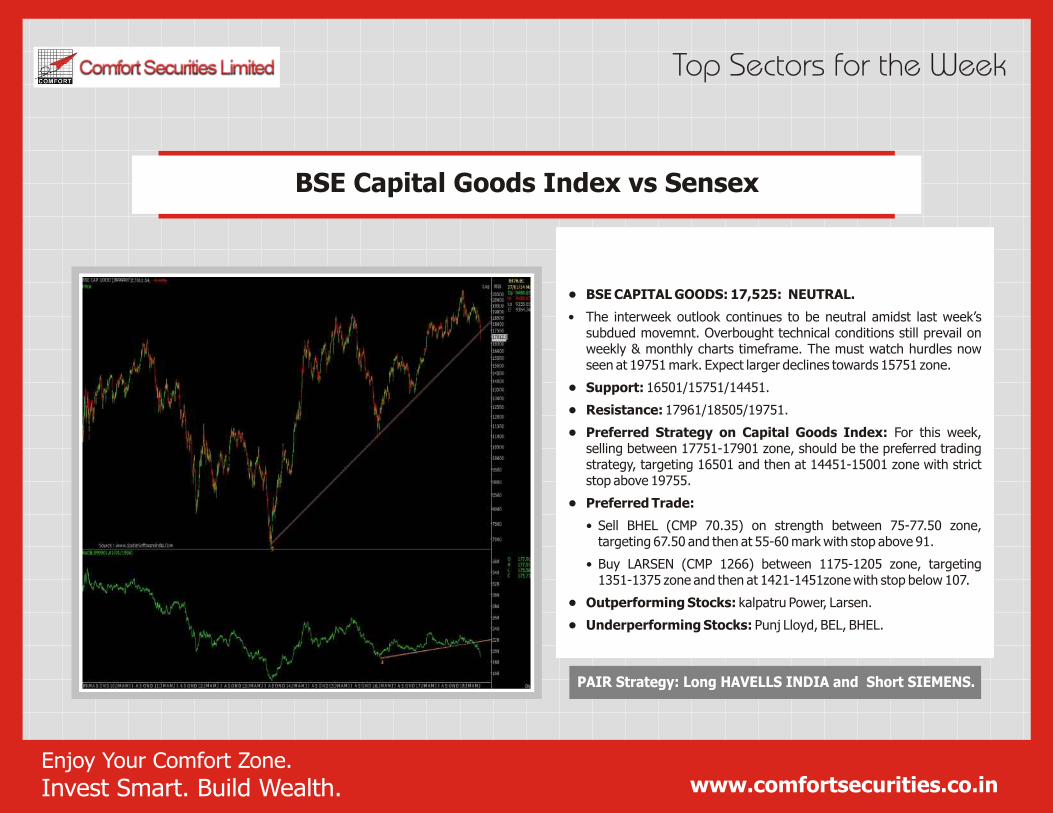
PAIR Strategy: Long HAVELLS INDIA and Short SIEMENS.
• BSE CAPITAL GOODS: 17,525: NEUTRAL.
• The interweek outlook continues to be neutral amidst last week’s subdued movemnt. Overbought technical conditions still prevail on weekly & monthly charts timeframe. The must watch hurdles now seen at 19751 mark. Expect larger declines towards 15751 zone.
• Support: 16501/15751/14451.
• Resistance: 17961/18505/19751.
• Preferred Strategy on Capital Goods Index: For this week, selling between 17751-17901 zone, should be the preferred trading strategy, targeting 16501 and then at 14451-15001 zone with strict stop above 19755.
• Preferred Trade:
• Sell BHEL (CMP 70.35) on strength between 75-77.50 zone, targeting 67.50 and then at 55-60 mark with stop above 91.
• Buy LARSEN (CMP 1266) between 1175-1205 zone, targeting 1351-1375 zone and then at 1421-1451zone with stop below 107.
• Outperforming Stocks: kalpatru Power, Larsen.
• Underperforming Stocks: Punj Lloyd, BEL, BHEL.
Top Sectors for the Week
www.comfortsecurities.co.inEnjoy Your Comfort Zone.
Invest Smart. Build Wealth.
BSE Healthcare Index vs Sensex
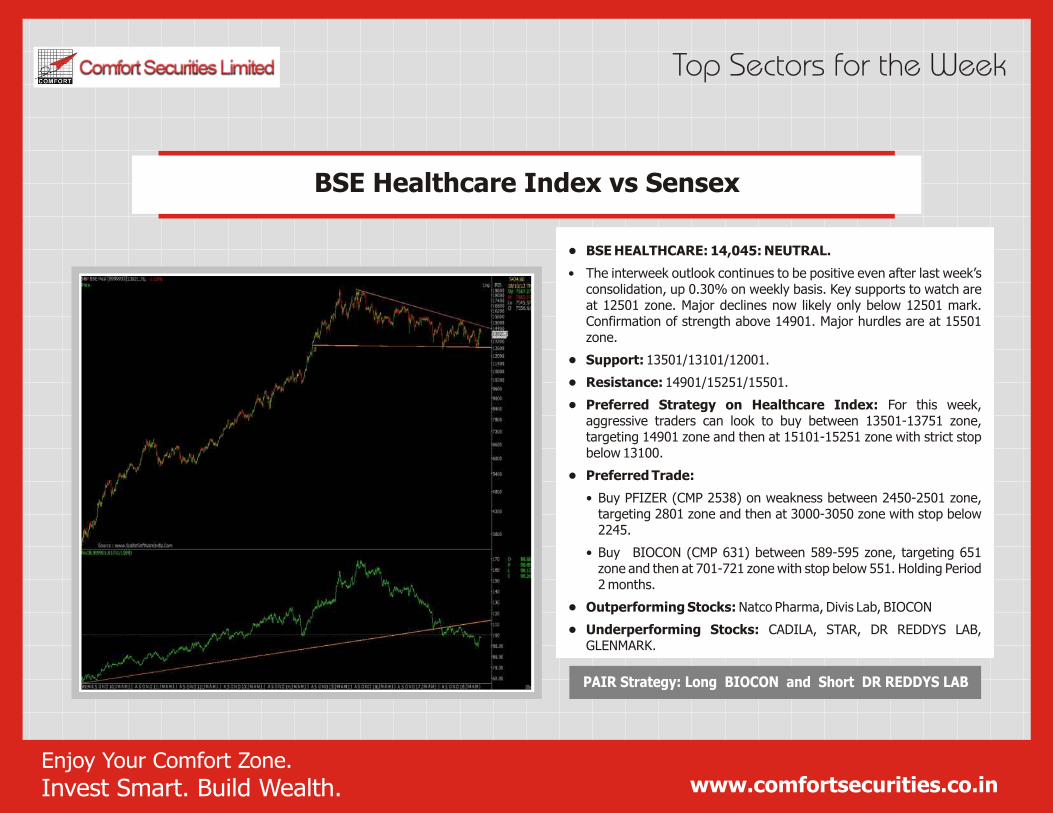
PAIR Strategy: Long BIOCON and Short DR REDDYS LAB
• BSE HEALTHCARE: 14,045: NEUTRAL.
• The interweek outlook continues to be positive even after last week’s consolidation, up 0.30% on weekly basis. Key supports to watch are at 12501 zone. Major declines now likely only below 12501 mark. Confirmation of strength above 14901. Major hurdles are at 15501 zone.
• Support: 13501/13101/12001.
• Resistance: 14901/15251/15501.
• Preferred Strategy on Healthcare Index: For this week, aggressive traders can look to buy between 13501-13751 zone, targeting 14901 zone and then at 15101-15251 zone with strict stop below 13100.
• Preferred Trade:
• Buy PFIZER (CMP 2538) on weakness between 2450-2501 zone, targeting 2801 zone and then at 3000-3050 zone with stop below 2245.
• Buy BIOCON (CMP 631) between 589-595 zone, targeting 651 zone and then at 701-721 zone with stop below 551. Holding Period 2 months.
• Outperforming Stocks: Natco Pharma, Divis Lab, BIOCON
• Underperforming Stocks: CADILA, STAR, DR REDDYS LAB, GLENMARK.
Top Sectors for the Week
www.comfortsecurities.co.inEnjoy Your Comfort Zone.
Invest Smart. Build Wealth.
BSE Metals Index vs Sensex
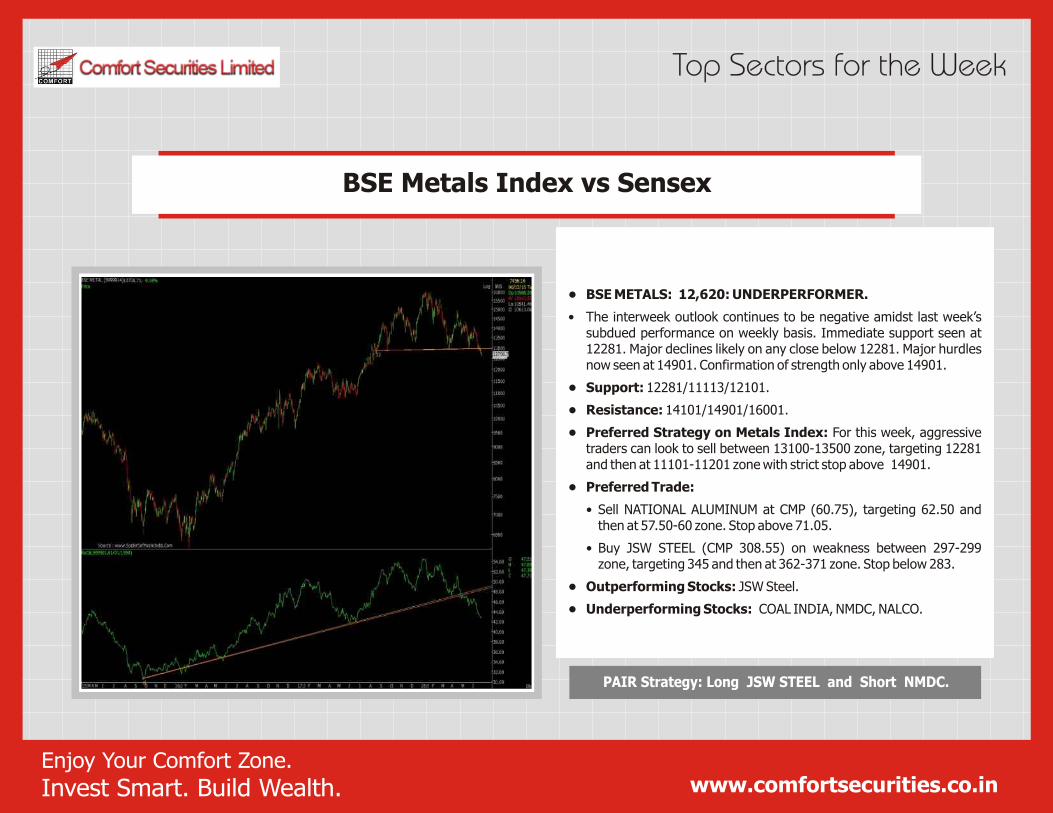
PAIR Strategy: Long JSW STEEL and Short NMDC.
• BSE METALS: 12,620: UNDERPERFORMER.
• The interweek outlook continues to be negative amidst last week’s subdued performance on weekly basis. Immediate support seen at 12281. Major declines likely on any close below 12281. Major hurdles now seen at 14901. Confirmation of strength only above 14901.
• Support: 12281/11113/12101.
• Resistance: 14101/14901/16001.
• Preferred Strategy on Metals Index: For this week, aggressive traders can look to sell between 13100-13500 zone, targeting 12281 and then at 11101-11201 zone with strict stop above 14901.
• Preferred Trade:
• Sell NATIONAL ALUMINUM at CMP (60.75), targeting 62.50 and then at 57.50-60 zone. Stop above 71.05.
• Buy JSW STEEL (CMP 308.55) on weakness between 297-299 zone, targeting 345 and then at 362-371 zone. Stop below 283.
• Outperforming Stocks: JSW Steel.
• Underperforming Stocks: COAL INDIA, NMDC, NALCO.
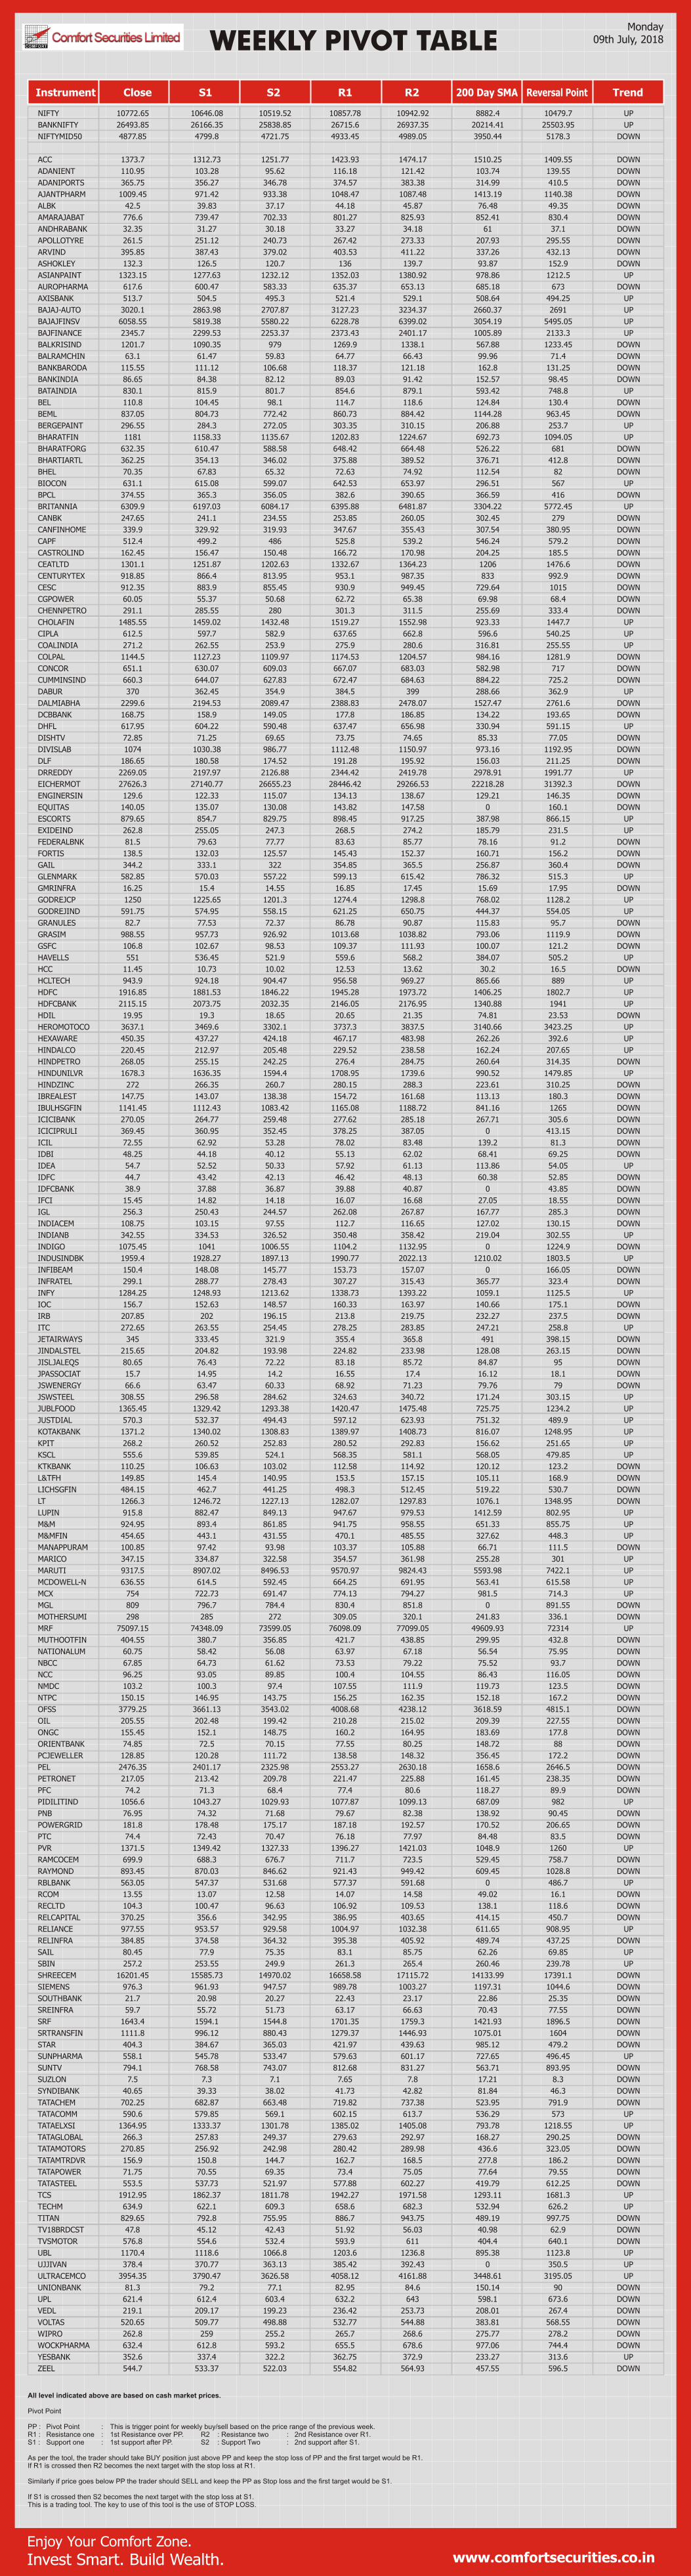
Instrument Close S1 S2 R1 R2 200 Day SMA Reversal Point Trend
WEEKLY PIVOT TABLE
www.comfortsecurities.co.inEnjoy Your Comfort Zone.
Invest Smart. Build Wealth.
All level indicated above are based on cash market prices.
Pivot Point
PP : Pivot Point : This is trigger point for weekly buy/sell based on the price range of the previous week.R1 : Resistance one : 1st Resistance over PP. R2 : Resistance two : 2nd Resistance over R1.S1 : Support one : 1st support after PP. S2 : Support Two : 2nd support after S1.
As per the tool, the trader should take BUY position just above PP and keep the stop loss of PP and the first target would be R1.If R1 is crossed then R2 becomes the next target with the stop loss at R1.
Similarly if price goes below PP the trader should SELL and keep the PP as Stop loss and the first target would be S1.
If S1 is crossed then S2 becomes the next target with the stop loss at S1.This is a trading tool. The key to use of this tool is the use of STOP LOSS.
Monday09th July, 2018
NIFTY 10772.65 10646.08 10519.52 10857.78 10942.92 8882.4 10479.7 UP
BANKNIFTY 26493.85 26166.35 25838.85 26715.6 26937.35 20214.41 25503.95 UP
NIFTYMID50 4877.85 4799.8 4721.75 4933.45 4989.05 3950.44 5178.3 DOWN
ACC 1373.7 1312.73 1251.77 1423.93 1474.17 1510.25 1409.55 DOWN
ADANIENT 110.95 103.28 95.62 116.18 121.42 103.74 139.55 DOWN
ADANIPORTS 365.75 356.27 346.78 374.57 383.38 314.99 410.5 DOWN
AJANTPHARM 1009.45 971.42 933.38 1048.47 1087.48 1413.19 1140.38 DOWN
ALBK 42.5 39.83 37.17 44.18 45.87 76.48 49.35 DOWN
AMARAJABAT 776.6 739.47 702.33 801.27 825.93 852.41 830.4 DOWN
ANDHRABANK 32.35 31.27 30.18 33.27 34.18 61 37.1 DOWN
APOLLOTYRE 261.5 251.12 240.73 267.42 273.33 207.93 295.55 DOWN
ARVIND 395.85 387.43 379.02 403.53 411.22 337.26 432.13 DOWN
ASHOKLEY 132.3 126.5 120.7 136 139.7 93.87 152.9 DOWN
ASIANPAINT 1323.15 1277.63 1232.12 1352.03 1380.92 978.86 1212.5 UP
AUROPHARMA 617.6 600.47 583.33 635.37 653.13 685.18 673 DOWN
AXISBANK 513.7 504.5 495.3 521.4 529.1 508.64 494.25 UP
BAJAJ-AUTO 3020.1 2863.98 2707.87 3127.23 3234.37 2660.37 2691 UP
BAJAJFINSV 6058.55 5819.38 5580.22 6228.78 6399.02 3054.19 5495.05 UP
BAJFINANCE 2345.7 2299.53 2253.37 2373.43 2401.17 1005.89 2133.3 UP
BALKRISIND 1201.7 1090.35 979 1269.9 1338.1 567.88 1233.45 DOWN
BALRAMCHIN 63.1 61.47 59.83 64.77 66.43 99.96 71.4 DOWN
BANKBARODA 115.55 111.12 106.68 118.37 121.18 162.8 131.25 DOWN
BANKINDIA 86.65 84.38 82.12 89.03 91.42 152.57 98.45 DOWN
BATAINDIA 830.1 815.9 801.7 854.6 879.1 593.42 748.8 UP
BEL 110.8 104.45 98.1 114.7 118.6 124.84 130.4 DOWN
BEML 837.05 804.73 772.42 860.73 884.42 1144.28 963.45 DOWN
BERGEPAINT 296.55 284.3 272.05 303.35 310.15 206.88 253.7 UP
BHARATFIN 1181 1158.33 1135.67 1202.83 1224.67 692.73 1094.05 UP
BHARATFORG 632.35 610.47 588.58 648.42 664.48 526.22 681 DOWN
BHARTIARTL 362.25 354.13 346.02 375.88 389.52 376.71 412.8 DOWN
BHEL 70.35 67.83 65.32 72.63 74.92 112.54 82 DOWN
BIOCON 631.1 615.08 599.07 642.53 653.97 296.51 567 UP
BPCL 374.55 365.3 356.05 382.6 390.65 366.59 416 DOWN
BRITANNIA 6309.9 6197.03 6084.17 6395.88 6481.87 3304.22 5772.45 UP
CANBK 247.65 241.1 234.55 253.85 260.05 302.45 279 DOWN
CANFINHOME 339.9 329.92 319.93 347.67 355.43 307.54 380.95 DOWN
CAPF 512.4 499.2 486 525.8 539.2 546.24 579.2 DOWN
CASTROLIND 162.45 156.47 150.48 166.72 170.98 204.25 185.5 DOWN
CEATLTD 1301.1 1251.87 1202.63 1332.67 1364.23 1206 1476.6 DOWN
CENTURYTEX 918.85 866.4 813.95 953.1 987.35 833 992.9 DOWN
CESC 912.35 883.9 855.45 930.9 949.45 729.64 1015 DOWN
CGPOWER 60.05 55.37 50.68 62.72 65.38 69.98 68.4 DOWN
CHENNPETRO 291.1 285.55 280 301.3 311.5 255.69 333.4 DOWN
CHOLAFIN 1485.55 1459.02 1432.48 1519.27 1552.98 923.33 1447.7 UP
CIPLA 612.5 597.7 582.9 637.65 662.8 596.6 540.25 UP
COALINDIA 271.2 262.55 253.9 275.9 280.6 316.81 255.55 UP
COLPAL 1144.5 1127.23 1109.97 1174.53 1204.57 984.16 1281.9 DOWN
CONCOR 651.1 630.07 609.03 667.07 683.03 582.98 717 DOWN
CUMMINSIND 660.3 644.07 627.83 672.47 684.63 884.22 725.2 DOWN
DABUR 370 362.45 354.9 384.5 399 288.66 362.9 UP
DALMIABHA 2299.6 2194.53 2089.47 2388.83 2478.07 1527.47 2761.6 DOWN
DCBBANK 168.75 158.9 149.05 177.8 186.85 134.22 193.65 DOWN
DHFL 617.95 604.22 590.48 637.47 656.98 330.94 591.15 UP
DISHTV 72.85 71.25 69.65 73.75 74.65 85.33 77.05 DOWN
DIVISLAB 1074 1030.38 986.77 1112.48 1150.97 973.16 1192.95 DOWN
DLF 186.65 180.58 174.52 191.28 195.92 156.03 211.25 DOWN
DRREDDY 2269.05 2197.97 2126.88 2344.42 2419.78 2978.91 1991.77 UP
EICHERMOT 27626.3 27140.77 26655.23 28446.42 29266.53 22218.28 31392.3 DOWN
ENGINERSIN 129.6 122.33 115.07 134.13 138.67 129.21 146.35 DOWN
EQUITAS 140.05 135.07 130.08 143.82 147.58 0 160.1 DOWN
ESCORTS 879.65 854.7 829.75 898.45 917.25 387.98 866.15 UP
EXIDEIND 262.8 255.05 247.3 268.5 274.2 185.79 231.5 UP
FEDERALBNK 81.5 79.63 77.77 83.63 85.77 78.16 91.2 DOWN
FORTIS 138.5 132.03 125.57 145.43 152.37 160.71 156.2 DOWN
GAIL 344.2 333.1 322 354.85 365.5 256.87 360.4 DOWN
GLENMARK 582.85 570.03 557.22 599.13 615.42 786.32 515.3 UP
GMRINFRA 16.25 15.4 14.55 16.85 17.45 15.69 17.95 DOWN
GODREJCP 1250 1225.65 1201.3 1274.4 1298.8 768.02 1128.2 UP
GODREJIND 591.75 574.95 558.15 621.25 650.75 444.37 554.05 UP
GRANULES 82.7 77.53 72.37 86.78 90.87 115.83 95.7 DOWN
GRASIM 988.55 957.73 926.92 1013.68 1038.82 793.06 1119.9 DOWN
GSFC 106.8 102.67 98.53 109.37 111.93 100.07 121.2 DOWN
HAVELLS 551 536.45 521.9 559.6 568.2 384.07 505.2 UP
HCC 11.45 10.73 10.02 12.53 13.62 30.2 16.5 DOWN
HCLTECH 943.9 924.18 904.47 956.58 969.27 865.66 889 UP
HDFC 1916.85 1881.53 1846.22 1945.28 1973.72 1406.25 1802.7 UP
HDFCBANK 2115.15 2073.75 2032.35 2146.05 2176.95 1340.88 1941 UP
HDIL 19.95 19.3 18.65 20.65 21.35 74.81 23.53 DOWN
HEROMOTOCO 3637.1 3469.6 3302.1 3737.3 3837.5 3140.66 3423.25 UP
HEXAWARE 450.35 437.27 424.18 467.17 483.98 262.26 392.6 UP
HINDALCO 220.45 212.97 205.48 229.52 238.58 162.24 207.65 UP
HINDPETRO 268.05 255.15 242.25 276.4 284.75 260.64 314.35 DOWN
HINDUNILVR 1678.3 1636.35 1594.4 1708.95 1739.6 990.52 1479.85 UP
HINDZINC 272 266.35 260.7 280.15 288.3 223.61 310.25 DOWN
IBREALEST 147.75 143.07 138.38 154.72 161.68 113.13 180.3 DOWN
IBULHSGFIN 1141.45 1112.43 1083.42 1165.08 1188.72 841.16 1265 DOWN
ICICIBANK 270.05 264.77 259.48 277.62 285.18 267.71 305.6 DOWN
ICICIPRULI 369.45 360.95 352.45 378.25 387.05 0 413.15 DOWN
ICIL 72.55 62.92 53.28 78.02 83.48 139.2 81.3 DOWN
IDBI 48.25 44.18 40.12 55.13 62.02 68.41 69.25 DOWN
IDEA 54.7 52.52 50.33 57.92 61.13 113.86 54.05 UP
IDFC 44.7 43.42 42.13 46.42 48.13 60.38 52.85 DOWN
IDFCBANK 38.9 37.88 36.87 39.88 40.87 0 43.85 DOWN
IFCI 15.45 14.82 14.18 16.07 16.68 27.05 18.55 DOWN
IGL 256.3 250.43 244.57 262.08 267.87 167.77 285.3 DOWN
INDIACEM 108.75 103.15 97.55 112.7 116.65 127.02 130.15 DOWN
INDIANB 342.55 334.53 326.52 350.48 358.42 219.04 302.55 UP
INDIGO 1075.45 1041 1006.55 1104.2 1132.95 0 1224.9 DOWN
INDUSINDBK 1959.4 1928.27 1897.13 1990.77 2022.13 1210.02 1803.5 UP
INFIBEAM 150.4 148.08 145.77 153.73 157.07 0 166.05 DOWN
INFRATEL 299.1 288.77 278.43 307.27 315.43 365.77 323.4 DOWN
INFY 1284.25 1248.93 1213.62 1338.73 1393.22 1059.1 1125.5 UP
IOC 156.7 152.63 148.57 160.33 163.97 140.66 175.1 DOWN
IRB 207.85 202 196.15 213.8 219.75 232.27 237.5 DOWN
ITC 272.65 263.55 254.45 278.25 283.85 247.21 258.8 UP
JETAIRWAYS 345 333.45 321.9 355.4 365.8 491 398.15 DOWN
JINDALSTEL 215.65 204.82 193.98 224.82 233.98 128.08 263.15 DOWN
JISLJALEQS 80.65 76.43 72.22 83.18 85.72 84.87 95 DOWN
JPASSOCIAT 15.7 14.95 14.2 16.55 17.4 16.12 18.1 DOWN
JSWENERGY 66.6 63.47 60.33 68.92 71.23 79.76 79 DOWN
JSWSTEEL 308.55 296.58 284.62 324.63 340.72 171.24 303.15 UP
JUBLFOOD 1365.45 1329.42 1293.38 1420.47 1475.48 725.75 1234.2 UP
JUSTDIAL 570.3 532.37 494.43 597.12 623.93 751.32 489.9 UP
KOTAKBANK 1371.2 1340.02 1308.83 1389.97 1408.73 816.07 1248.95 UP
KPIT 268.2 260.52 252.83 280.52 292.83 156.62 251.65 UP
KSCL 555.6 539.85 524.1 568.35 581.1 568.05 479.85 UP
KTKBANK 110.25 106.63 103.02 112.58 114.92 120.12 123.2 DOWN
L&TFH 149.85 145.4 140.95 153.5 157.15 105.11 168.9 DOWN
LICHSGFIN 484.15 462.7 441.25 498.3 512.45 519.22 530.7 DOWN
LT 1266.3 1246.72 1227.13 1282.07 1297.83 1076.1 1348.95 DOWN
LUPIN 915.8 882.47 849.13 947.67 979.53 1412.59 802.95 UP
M&M 924.95 893.4 861.85 941.75 958.55 651.33 855.75 UP
M&MFIN 454.65 443.1 431.55 470.1 485.55 327.62 448.3 UP
MANAPPURAM 100.85 97.42 93.98 103.37 105.88 66.71 111.5 DOWN
MARICO 347.15 334.87 322.58 354.57 361.98 255.28 301 UP
MARUTI 9317.5 8907.02 8496.53 9570.97 9824.43 5593.98 7422.1 UP
MCDOWELL-N 636.55 614.5 592.45 664.25 691.95 563.41 615.58 UP
MCX 754 722.73 691.47 774.13 794.27 981.5 714.3 UP
MGL 809 796.7 784.4 830.4 851.8 0 891.55 DOWN
MOTHERSUMI 298 285 272 309.05 320.1 241.83 336.1 DOWN
MRF 75097.15 74348.09 73599.05 76098.09 77099.05 49609.93 72314 UP
MUTHOOTFIN 404.55 380.7 356.85 421.7 438.85 299.95 432.8 DOWN
NATIONALUM 60.75 58.42 56.08 63.97 67.18 56.54 75.95 DOWN
NBCC 67.85 64.73 61.62 73.53 79.22 75.52 93.7 DOWN
NCC 96.25 93.05 89.85 100.4 104.55 86.43 116.05 DOWN
NMDC 103.2 100.3 97.4 107.55 111.9 119.73 123.5 DOWN
NTPC 150.15 146.95 143.75 156.25 162.35 152.18 167.2 DOWN
OFSS 3779.25 3661.13 3543.02 4008.68 4238.12 3618.59 4815.1 DOWN
OIL 205.55 202.48 199.42 210.28 215.02 209.39 227.55 DOWN
ONGC 155.45 152.1 148.75 160.2 164.95 183.69 177.8 DOWN
ORIENTBANK 74.85 72.5 70.15 77.55 80.25 148.72 88 DOWN
PCJEWELLER 128.85 120.28 111.72 138.58 148.32 356.45 172.2 DOWN
PEL 2476.35 2401.17 2325.98 2553.27 2630.18 1658.6 2646.5 DOWN
PETRONET 217.05 213.42 209.78 221.47 225.88 161.45 238.35 DOWN
PFC 74.2 71.3 68.4 77.4 80.6 118.27 89.9 DOWN
PIDILITIND 1056.6 1043.27 1029.93 1077.87 1099.13 687.09 982 UP
PNB 76.95 74.32 71.68 79.67 82.38 138.92 90.45 DOWN
POWERGRID 181.8 178.48 175.17 187.18 192.57 170.52 206.65 DOWN
PTC 74.4 72.43 70.47 76.18 77.97 84.48 83.5 DOWN
PVR 1371.5 1349.42 1327.33 1396.27 1421.03 1048.9 1260 UP
RAMCOCEM 699.9 688.3 676.7 711.7 723.5 529.45 758.7 DOWN
RAYMOND 893.45 870.03 846.62 921.43 949.42 609.45 1028.8 DOWN
RBLBANK 563.05 547.37 531.68 577.37 591.68 0 486.7 UP
RCOM 13.55 13.07 12.58 14.07 14.58 49.02 16.1 DOWN
RECLTD 104.3 100.47 96.63 106.92 109.53 138.1 118.6 DOWN
RELCAPITAL 370.25 356.6 342.95 386.95 403.65 414.15 450.7 DOWN
RELIANCE 977.55 953.57 929.58 1004.97 1032.38 611.65 908.95 UP
RELINFRA 384.85 374.58 364.32 395.38 405.92 489.74 437.25 DOWN
SAIL 80.45 77.9 75.35 83.1 85.75 62.26 69.85 UP
SBIN 257.2 253.55 249.9 261.3 265.4 260.46 239.78 UP
SHREECEM 16201.45 15585.73 14970.02 16658.58 17115.72 14133.99 17391.1 DOWN
SIEMENS 976.3 961.93 947.57 989.78 1003.27 1197.31 1044.6 DOWN
SOUTHBANK 21.7 20.98 20.27 22.43 23.17 22.86 25.35 DOWN
SREINFRA 59.7 55.72 51.73 63.17 66.63 70.43 77.55 DOWN
SRF 1643.4 1594.1 1544.8 1701.35 1759.3 1421.93 1896.5 DOWN
SRTRANSFIN 1111.8 996.12 880.43 1279.37 1446.93 1075.01 1604 DOWN
STAR 404.3 384.67 365.03 421.97 439.63 985.12 479.2 DOWN
SUNPHARMA 558.1 545.78 533.47 579.63 601.17 727.65 496.45 UP
SUNTV 794.1 768.58 743.07 812.68 831.27 563.71 893.95 DOWN
SUZLON 7.5 7.3 7.1 7.65 7.8 17.21 8.3 DOWN
SYNDIBANK 40.65 39.33 38.02 41.73 42.82 81.84 46.3 DOWN
TATACHEM 702.25 682.87 663.48 719.82 737.38 523.95 791.9 DOWN
TATACOMM 590.6 579.85 569.1 602.15 613.7 536.29 573 UP
TATAELXSI 1364.95 1333.37 1301.78 1385.02 1405.08 793.78 1218.55 UP
TATAGLOBAL 266.3 257.83 249.37 279.63 292.97 168.27 290.25 DOWN
TATAMOTORS 270.85 256.92 242.98 280.42 289.98 436.6 323.05 DOWN
TATAMTRDVR 156.9 150.8 144.7 162.7 168.5 277.8 186.2 DOWN
TATAPOWER 71.75 70.55 69.35 73.4 75.05 77.64 79.55 DOWN
TATASTEEL 553.5 537.73 521.97 577.88 602.27 419.79 612.25 DOWN
TCS 1912.95 1862.37 1811.78 1942.27 1971.58 1293.11 1681.3 UP
TECHM 634.9 622.1 609.3 658.6 682.3 532.94 626.2 UP
TITAN 829.65 792.8 755.95 886.7 943.75 489.19 997.75 DOWN
TV18BRDCST 47.8 45.12 42.43 51.92 56.03 40.98 62.9 DOWN
TVSMOTOR 576.8 554.6 532.4 593.9 611 404.4 640.1 DOWN
UBL 1170.4 1118.6 1066.8 1203.6 1236.8 895.38 1123.8 UP
UJJIVAN 378.4 370.77 363.13 385.42 392.43 0 350.5 UP
ULTRACEMCO 3954.35 3790.47 3626.58 4058.12 4161.88 3448.61 3195.05 UP
UNIONBANK 81.3 79.2 77.1 82.95 84.6 150.14 90 DOWN
UPL 621.4 612.4 603.4 632.2 643 598.1 673.6 DOWN
VEDL 219.1 209.17 199.23 236.42 253.73 208.01 267.4 DOWN
VOLTAS 520.65 509.77 498.88 532.77 544.88 383.81 568.55 DOWN
WIPRO 262.8 259 255.2 265.7 268.6 275.77 278.2 DOWN
WOCKPHARMA 632.4 612.8 593.2 655.5 678.6 977.06 744.4 DOWN
YESBANK 352.6 337.4 322.2 362.75 372.9 233.27 313.6 UP
ZEEL 544.7 533.37 522.03 554.82 564.93 457.55 596.5 DOWN
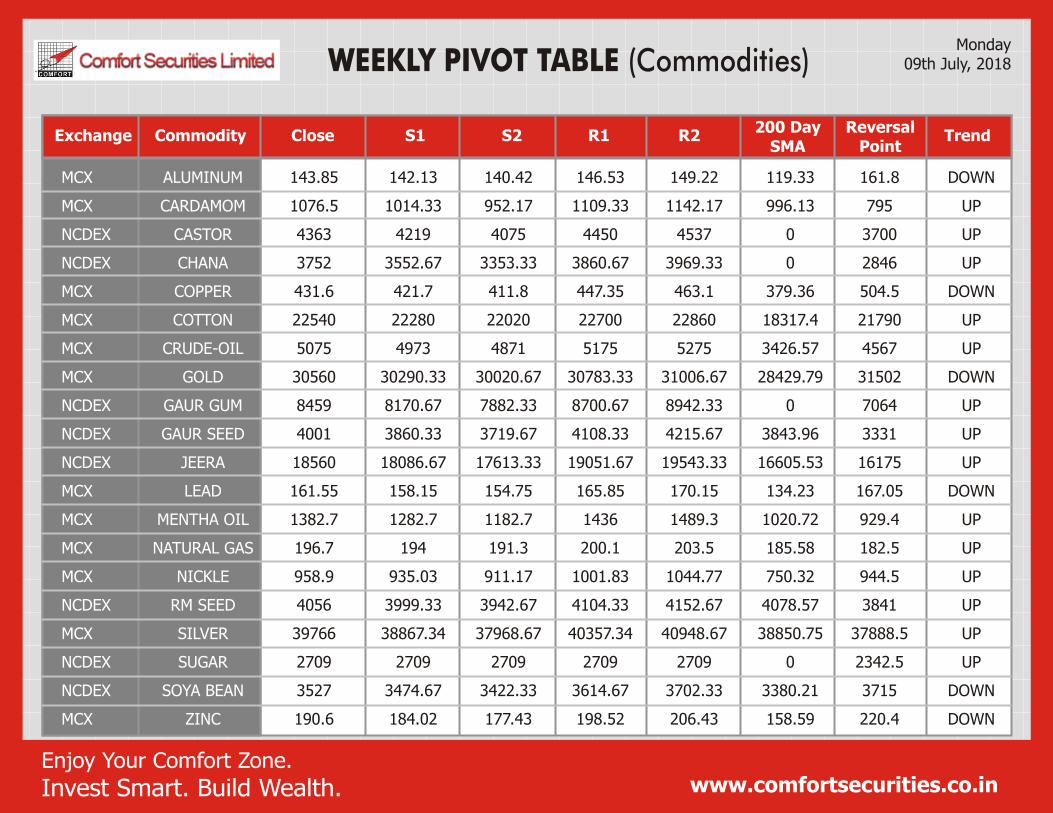
CommodityExchange Close S1 S2 R1 R2200 Day
SMA Reversal
Point Trend
WEEKLY PIVOT TABLE (Commodities)
www.comfortsecurities.co.inEnjoy Your Comfort Zone.
Invest Smart. Build Wealth.
MCX ALUMINUM
MCX CARDAMOM
NCDEX CASTOR
NCDEX CHANA
MCX COPPER
MCX COTTON
MCX CRUDE-OIL
MCX GOLD
NCDEX GAUR GUM
NCDEX GAUR SEED
NCDEX JEERA
MCX LEAD
MCX MENTHA OIL
MCX NATURAL GAS
MCX NICKLE
NCDEX RM SEED
MCX SILVER
NCDEX SUGAR
NCDEX SOYA BEAN
MCX ZINC
143.85 142.13 140.42 146.53 149.22 119.33 161.8 DOWN
1076.5 1014.33 952.17 1109.33 1142.17 996.13 795 UP
4363 4219 4075 4450 4537 0 3700 UP
3752 3552.67 3353.33 3860.67 3969.33 0 2846 UP
431.6 421.7 411.8 447.35 463.1 379.36 504.5 DOWN
22540 22280 22020 22700 22860 18317.4 21790 UP
5075 4973 4871 5175 5275 3426.57 4567 UP
30560 30290.33 30020.67 30783.33 31006.67 28429.79 31502 DOWN
8459 8170.67 7882.33 8700.67 8942.33 0 7064 UP
4001 3860.33 3719.67 4108.33 4215.67 3843.96 3331 UP
18560 18086.67 17613.33 19051.67 19543.33 16605.53 16175 UP
161.55 158.15 154.75 165.85 170.15 134.23 167.05 DOWN
1382.7 1282.7 1182.7 1436 1489.3 1020.72 929.4 UP
196.7 194 191.3 200.1 203.5 185.58 182.5 UP
958.9 935.03 911.17 1001.83 1044.77 750.32 944.5 UP
4056 3999.33 3942.67 4104.33 4152.67 4078.57 3841 UP
39766 38867.34 37968.67 40357.34 40948.67 38850.75 37888.5 UP
2709 2709 2709 2709 2709 0 2342.5 UP
3527 3474.67 3422.33 3614.67 3702.33 3380.21 3715 DOWN
190.6 184.02 177.43 198.52 206.43 158.59 220.4 DOWN
Monday09th July, 2018
Comfort Securities Ltd.
DISCLAIMER: This is solely for information of clients of Comfort Securities Ltd. and does not construe to be an investment advice. It is also not intended as an offer or solicitation for the purchase and sale of any financial instruments. Any action taken by you on the basis of the information contained herein is your responsibility alone and Comfort Securities Ltd. its subsidiaries or its employees or associates will not be liable in any manner for the consequences of such action taken by you. We have exercised due diligence in checking the correctness and authenticity of the information contained in this recommendation, but Comfort Securities Ltd. or any of its subsidiaries or associates or employees shall not be in any way responsible for any loss or damage that may arise to any person from any inadvertent error in the information contained in this recommendation or any action taken on basis of this information.
Technical analysis studies market psychology, price patterns and volume levels. It is used to forecast future price and market movements. Technical analysis is complementary to fundamental analysis and news sources. The recommendations issued herewith might be contrary to recommendations issued by Comfort Securities Ltd. in the company research undertaken as the recommendations stated in this report is derived purely from technical analysis. Comfort Securities Ltd. has based this document on information obtained from sources it believes to be reliable but which it has not independently verified; Comfort Securities Ltd. makes no guarantee, representation or warranty and accepts no responsibility or liability as to its accuracy or completeness. The opinions contained within the report are based upon publicly available information at the time of publication and are subject to change without notice. The information and any disclosures provided herein are in summary form and have been prepared for informational purposes. The recommendations and suggested price levels are intended purely for trading purposes. The recommendations are valid for the day of the report however trading trends and volumes might vary substantially on an intraday basis and the recommendations may be subject to change. The information and any disclosures provided herein may be considered confidential. Any use, distribution, modification, copying, forwarding or disclosure by any person is strictly prohibited. The information and any disclosures provided herein do not constitute a solicitation or offer to purchase or sell any security or other financial product or instrument. The current performance may be unaudited. Past performance does not guarantee future returns. There can be no assurance that investments will achieve any targeted rates of return, and there is no guarantee against the loss of your entire investment.
POTENTIAL CONFLICT OF INTEREST DISCLOSURE (as on date of report)Disclosure of interest statement – • Analyst interest of the stock /Instrument(s): - No. • Firm interest of the stock / Instrument (s): - No.
Enjoy Your Comfort Zone. Invest Smart. Build Wealth. www.comfortsecurities.co.in
Registered Office Mumbai:
Comfort Securities Ltd.
A-301, Hetal Arch, S.V. Road, Opp. Natraj Mkt.,
Malad (W), Mumbai 400 064
Phone: 91-22-28811259, 28449765, 28825509
Fax: 91-22-28892527
Email: [email protected]
Comfort Securities Limited
605, 6th Floor, DDA2 Building,
New Delhi 110058,
Janakpuri District Center,
Janakpuri, Delhi, 110058
011 4568 0560
Comfort Securities Ltd
2nd Floor, Shop No S14, T 14,
Friends Tower, Sanjay Place,
Agra


![[INFOGRAPHIC]:The Highs and Lows of a Graphic Design Career](https://img.pdfslide.us/doc/110x75/547b9066b4af9fc3158b4ed5/infographicthe-highs-and-lows-of-a-graphic-design-career.jpg)