Embed Size (px)
Citation preview

The Evolution of High Incomes in Northern America:Lessons from Canadian Evidence
By EMMANUEL SAEZ AND MICHAEL R. VEALL*
The evolution of income inequality duringthe process of development has attracted enor-mous attention in the economics literature, aswell as in the political sphere. Understandingthe relative roles of “natural” economicprogress such as technological change versuspolicy interventions such as taxation, redistribu-tion, and regulation in shaping the distributionof income requires analyzing long-term serieson inequality. Income tax statistics are the onlysource of income distribution data available onan annual basis for extended periods of time,and are still the best source to study upper-income groups. Recent studies have used in-come tax statistics to construct an inequalitytime series for various countries over the courseof the twentieth century (Thomas Piketty, 2003,for France; Piketty and Saez, 2003, for theUnited States; Anthony B. Atkinson, 2002, forthe United Kingdom). All these studies havefound dramatic declines in the top incomeshares in the first part of the century, but thepattern has been different in the last two or threedecades: an almost complete recovery in theUnited States, some recovery in the UnitedKingdom, and no recovery in France. This di-
vergence casts doubt on pure technological ex-planations, although other explanations are stilltentative.
These “high income” studies raise three im-portant issues. First, and most important, do taxstatistics reveal real changes in income concen-tration rather than changes in tax reporting be-havior, following tax changes? Many U.S.studies have shown, for example, that tax-induced income shifting between the individualand corporate tax base can have dramatic effectson reported individual incomes (see, e.g., RogerH. Gordon and Joel Slemrod, 2000; and Saez,2004). Second, an increase in cross-sectionalincome concentration over time, as in theUnited States and the United Kingdom in recentyears, has very different welfare consequencesdepending on whether or not it is associatedwith increases in income mobility, and none ofthe previous studies has analyzed the mobilityquestion for high-income earners. Finally, therehas been a substantial rise in married women’slabor force participation in recent decades. Towhat extent is the increase in U.S. top incomes(which must be calculated at a family level forthe United States because of its family-basedincome taxation) due to increases in spousalincome correlation rather than increased indi-vidual income concentration?
This study sheds new light on these threeissues by using Canadian income tax statisticsbeginning in 1920 (the first year such statisticswere produced) to estimate a homogeneous se-ries of income shares and income compositionfor various upper-income groups within the topdecile. Our series are based on individual in-come because personal income taxes in Canadaare based on individual income (not family in-come as in the United States). For more recentyears, we use a micro-data set of a kind notavailable for the United States—a large panelbased on tax returns but linked by family—toanalyze wage income concentration, mobilitywithin top income groups, and the differencesbetween the patterns of individual and familyincome concentration.
* Saez: University of California, Department of Eco-nomics, 549 Evans Hall #3880, Berkeley, CA 94720 (e-mail: [email protected]); Veall: Department ofEconomics and SEDAP, McMaster University, Hamilton,Ontario, Canada L8S 4M4 (e-mail: [email protected]).We thank Tony Atkinson, David Card, Deb Fretz, BruceMeyer, Thomas Piketty, two anonymous referees, and nu-merous seminar participants for helpful discussions andcomments. We also thank Claude Bilodeau, Eric Olson, andHelene Roberge of Statistics Canada for their assistancewith computations from the Longitudinal AdministrativeDatabase; Emmanuel Manolikakis of Statistics Canada foradditional national accounting data; Josee Begin, GioiaCampagna, Kevin Kennedy, and Ron Naylor of the CanadaCustoms and Revenue Agency for additional taxation data;and Simo Goshev, Alan Macnaughton, Mohammad Raha-man, Matthew Stewart, and the Canadian Tax Foundationlibrary for assistance and expertise. Financial support fromthe Sloan Foundation, NSF Grant SES-013496, and fromthe Social Sciences and Humanities Research Council ofCanada to the SEDAP program is gratefully acknowledged.
831

Our estimated top shares series shows that,similar to the French, British, and Americanexperiences, top income shares in Canada fellsharply during World War II with no recoveryduring the next three decades. Over the last 20years, top income shares in Canada have in-creased dramatically, almost as much as in theUnited States. This change has remained largelyunnoticed because it is concentrated within thetop percentile of the Canadian income distribu-tion and thus can be detected only with taxreturn data covering very high incomes. As inthe United States, the increase is largely due toa surge in top wages and salaries. As a result,the composition of income in the top incomegroups has also shifted in Canada since WorldWar II: many more high-income individualsderive their principal income from employmentinstead of as a return to capital.
The recent surge in Canadian top incomeshares does not seem to be mainly the conse-quence of tax-induced changes in behavior, in-cluding tax-reporting behavior. The Canadianreduction in marginal tax rates was much moremodest than in the United States and did notinduce shifting between the corporate and per-sonal income tax base. Moreover, much of theCanadian surge occurred when there were nomajor tax changes. There is evidence (includinga formal regression analysis we present) that thesurge in Canadian top incomes has a U.S. asso-ciation, perhaps because many high-income Ca-nadians have the option of leaving to work inthe United States. If this “brain drain threat”explanation (or some other U.S.-related expla-nation) is correct, it would imply that the surgein top reported incomes in the United States hasnot just been a tax-induced change in tax-reporting behavior. Otherwise, it is difficult toreconcile the association between top U.S. andCanadian incomes.1
Longitudinal micro-data show that incomemobility for high-income earners in Canada hasbeen stable or has even decreased slightly since1982. Similarly, top income shares based onthree- or five-year averages display the samesurge as those based on single-year income.
This suggests that the recent increase in cross-sectional income concentration is associatedwith a large increase in the concentration oflifetime resources and welfare. Using the familylinkages in the Canadian micro-data, we alsoshow that the increase in income concentrationis identical at the family and individual levels.
To the best of our knowledge, this is the firsttime that Canadian income tax statistics havebeen used to construct long-term series on in-equality in Canada. McKinley L. Blackburn andDavid E. Bloom (1993) summarize a number ofstudies that examine both individual and familyincome inequality in Canada in the postwarperiod. The view that emerges from their sum-mary is that changes in inequality from the late1940s to the 1980s were modest. Andrew Heiszet al. (2001) summarize more recent Canadianinequality research, which largely finds that Ca-nadian earnings inequality has increased since1980, but by much less than in the UnitedStates. Most of the studies discussed in thesepapers are based on survey data and none ex-amines the war/prewar period or focuses on topshares.
The paper is organized as follows. Section Idescribes our data sources and outlines our es-timation methods. In Section II, we present andanalyze the trends in top income shares andtheir composition. Section III focuses on therecent increase in Canadian top incomes andprovides a systematic comparison with the U.S.experience. Finally, Section IV offers a briefconclusion. All series and complete technicaldetails of our methodology are gathered in ap-pendices of our working paper version (Saezand Veall, 2003).
I. Data and Methodology
Our estimates are from personal income taxreturn statistics compiled annually by the Cana-dian federal taxation authorities since 1920. It isimportant to note that income taxes in Canadahave always been assessed at the individuallevel and not at the family level, as they are inthe United States. Thus, most of our series arebased on individual (and not family) income.Before World War II, because of high exemp-tions, only about 2 to 8 percent of individualshad to file tax returns and therefore, by neces-sity, we must restrict our analysis to the top 5percent of the income distribution (denoted as
1 The question of whether the surge in top U.S. incomesis due to supply-side effects following tax cuts or to non-tax-related effects is still debated (see Saez, 2004, for arecent survey). The Canadian evidence could be consistentwith either explanation of the U.S. surge.
832 THE AMERICAN ECONOMIC REVIEW JUNE 2005

P95–100).2 Beginning with World War II, wecan extend our analysis to the top decile (P90–100). We also construct series for a number offiner fractiles e.g., P90–95, P95–99, P99–100(the top 1 percent), P99.5–100 (the top 0.5percent), P99.9–100 (the top 0.1 percent), andP99.99 (the top 0.01 percent). Each fractile isdefined relative to the total number of adults(aged 20 and above) from the Canadian census(not the number of tax returns filed). Table 1gives thresholds and average incomes for a se-lection of fractiles for Canada in 2000.
We define income as gross income before alldeductions and including all income items re-ported on personal tax returns: salaries andwages, self-employment and small business netincome, partnership and fiduciary income, div-idends, interest, other investment income, andother smaller income items. Because capitalgains are realized infrequently in a lumpy way,are volatile, and before 1972 were not taxableand hence not reported on tax returns, we focusmainly on series excluding capital gains.3 Ourincome definition is before personal incometaxes and personal payroll taxes, but after em-
ployers’ payroll taxes and corporate incometaxes.
Our principal data consist of tables of thenumber of tax returns, the amounts reported,and the income composition (since 1946) for alarge number of income brackets. As the top tailof the income distribution is very well approx-imated by Pareto distributions, we can usesimple parametric interpolation methods to es-timate the thresholds and average income levelsfor each fractile. For the years when micro-data are available, we check that the errorsintroduced by the interpolation method arenegligible.4
We then estimate shares of income by divid-ing the income amounts accruing to each frac-tile by 80 percent of personal income, notincluding transfers from the National Ac-counts.5,6 After analyzing the top share data, weturn to the composition of income, concentrat-ing on the period since 1946 when compositiondata were first published. Using this publishedinformation and a simple linear interpolationmethod, we decompose the amount of incomefor each fractile into employment income,
2 All taxpayers with income above the exemption thresh-old are required to file a return. The exemption threshold issubstantially lower for single persons than for married cou-ples. Therefore, in the years when fewer than 5 percent ofindividuals filed, we use data on singles and a simpleextrapolation method to estimate our income shares. (SeeSaez and Veall, 2003, for details of this procedure and itsvalidation.)
3 Saez and Veall (2003) analyze this issue in detail andshow that series with and without capital gains are verysimilar and display the same general pattern for the period1972–2000.
4 Atkinson (2003) discusses this issue in much moredetail.
5 We used tax returns to compute the level of top in-comes and national accounts to compute the total incomedenominator dates from the famous Simon Kuznets (1953)study on American inequality.
6 Personal income is higher than total income from taxreturns because it includes such non-taxable items as im-puted rent, imputed interest, etc. In recent years, in whichvirtually all adults with income file tax returns, total incomefrom tax returns has always been very close to 80 percent ofpersonal income net of transfers.
TABLE 1—THRESHOLDS AND AVERAGE INCOMES IN TOP GROUPS IN CANADA, 2000
Thresholds(1)
Income level(2)
Fractiles(3)
Number oftax units
(4)
Averageincome
(5)
Full population 22,807,585 $24,859P90 $59,232 P90–95 1,140,379 $66,310P95 $75,670 P95–99 912,303 $95,982P99 $145,774 P99–99.5 114,038 $171,728P99.5 $210,150 P99.5–99.9 91,230 $303,035P99.9 $530,311 P99.9–99.99 20,527 $923,385P99.99 $2,396,050 P99.99–100 2,281 $4,695,923
Notes: Computations based on income tax return statistics. Income is defined as annual grossincome excluding capital gains and before individual taxes. Amounts are expressed in 2000Canadian dollars. In year 2000, 1 US dollar � 1.5 Canadian dollars.Source: Table A and Table B3, row 2000, in Saez and Veall (2003).
833VOL. 95 NO. 3 SAEZ AND VEALL: THE EVOLUTION OF HIGH INCOMES IN NORTHERN AMERICA

entrepreneurial income (self-employment andsmall business income), and capital income (ex-cluding capital gains).
We produce top wage share series for theperiod 1972 to 2000, using composition tablesfor 1972 to 19817 and longitudinal micro-filesof tax returns (covering 20 percent of the totaltax-filing population, over 4 million records in2000) available beginning in 1982. In this case,fractiles are defined relative to the total numberof individuals with positive wages. (Throughoutthis paper, “wages” or “wage income” includessalaries or any other type of employment earn-ings, including exercised stock options.) Wealso link married couples and recompute topwage income shares at the family level. In thatcase, each fractile is defined relative to the totalnumber of families (single adults and couples)with positive wage income. We also use thelongitudinal structure of the micro-data to studyincome mobility. We compute mobility matri-ces for all our income groups for one-, two-, andthree-year lags, and top income shares usingreal income averaged over three and five yearsinstead of single-year income.8
II. Top Income Shares
A. Trends
Figure 1, panel A, displays the income shareof Canada’s top 5 percent (P95–100) from 1920to 2000. Before World War II, the top 5-percentincome share in Canada displayed sharpcounter-cyclical fluctuations, varying between30 and 40 percent of total income. There areparticularly noticeable declines during the de-pression of 1920–1921 and the Great Depres-sion of 1930–1933, suggesting that the businesscycle was an important influence. The top5-percent income share declines drastically dur-ing the World War II years, from almost 40percent in 1938 to less than 25 percent in 1945.After World War II, the top 5-percent incomeshare declines very slowly (now with very smallfluctuations) from 25 percent to 22 percent by
the mid-1980s, then jumping substantially toabout 29 percent in 2000. Therefore, the Cana-dian evidence suggests that the twentieth cen-tury decline in inequality took place preciselyduring World War II. This evidence is verymuch in line with American (Piketty and Saez,2003), French (Piketty, 2003), and British (At-kinson, 2002) findings.9 The Kuznets (SimonKuznets, 1955) inverted U-curve theory of in-equality (where inequality first rises and thenfalls as the economy develops) does not fit wellwith the Canadian experience.
In order to understand these changes in topincome shares in Canada, we decompose the topdecile into three groups, P90–95, P95–99, andP99–100, and depict their income shares inpanel B of Figure 1. Three aspects should benoted. First, the counter-cyclical pattern beforeWorld War II appears to be stronger for P95–99than for the top percentile. Second, the dropduring World War II is larger for the top per-centile (from 18 percent in 1939 to 10 percent in1945) than for P90–95 and P95–99. Third, andmost importantly, the upturn during the last twodecades is also concentrated in the top percen-tile (whose share increased from about 7.5 per-cent in the late 1970s to 13.5 percent in 2000,while the P90–95 and P95–99 shares were vir-tually flat).
Examination of the very top groups (P99.9–100 and P99.99–100) in Figure 2 reinforcesthese three empirical findings. In particular, theP99.99–100 share drops by more than half from1938 to 1945, continues to drop until the mid-1970s (in contrast to the lower groups) and thenrecovers so strongly that it almost recovers to itspre–World War II level. This surge is somewhatsmaller than comparable estimates for theUnited States from Piketty and Saez (2003),also included in Figure 2.
The remainder of the paper will be aimed atunderstanding the three key facts: the counter-cyclical pattern of top income shares (except thevery top income share) in the prewar period, thesharp fall of top income shares during WorldWar II (with the most dramatic decline at thevery top) with no recovery after the war, and thesurge in top income shares over the last 20 years
7 Top wage shares for 1972 to 1981 are estimated usingthe number of tax returns reporting wages and the amount ofwages reported by income brackets (Saez and Veall, 2003).
8 In this case, our adult population and denominator aredefined as the average across the relevant years.
9 In the United States, the fall in top income shares doesnot start before U.S. entry into World War II in 1941,providing further evidence that the fall is closely related tothe war.
834 THE AMERICAN ECONOMIC REVIEW JUNE 2005

(characterized by an extreme concentration atthe top). We begin with an analysis of thecomposition of incomes reported by the topincome groups.
B. The Composition of Top Incomes
From 1920 to 1945, systematic and detailedcomposition of income is not available in
FIGURE 1. TOP INCOME SHARES IN CANADA, 1920–2000
Source: Table B1, columns P95–100, P90–95, P95–99, and P99–100, in Saez and Veall(2003).
835VOL. 95 NO. 3 SAEZ AND VEALL: THE EVOLUTION OF HIGH INCOMES IN NORTHERN AMERICA

Canadian personal income tax data. The taxstatistics, however, include some data on occu-pation summarized in Saez and Veall (2003).This evidence suggests that well-compensatedemployees formed a very important fraction ofthe top 5 percent of income earners, and prob-
ably the overwhelming majority of the P95–99group.10 If wages are nominally rigid in the
10 This is also the pattern in France (Piketty, 2003) and inthe United States (Piketty and Saez, 2003) and will be
FIGURE 2. THE INCOME SHARES OF THE TOP INCOME GROUPS IN CANADA
AND THE UNITED STATES, 1920–2000
Sources: Canada, Table B1, columns P99.9–100 and P99.99–100, in Saez and Veall (2003).United States, Table II, columns P99.9–100 and P99.99–100, in Piketty and Saez (2003).
836 THE AMERICAN ECONOMIC REVIEW JUNE 2005

short run, this can explain why the P95–99share is so clearly counter-cyclical in Canada’sprewar period, as sharp downturns of the pre-war period were associated with sharp defla-tions. The top 1 percent of the incomedistribution is less counter-cyclical, likely be-cause it contains many more entrepreneurs andcapital income earners.
Our Canadian top share series display a sharpdrop during World War II, and that drop islarger for the very top groups. This fall can beexplained, in part, by the fiscal shock in thecorporate sector. As part of financing the war,Canada substantially increased taxes on corpo-rations. Moreover, corporations reduced theirpayout ratios during the war because of the highdemand for investment, and perhaps also toavoid the personal income tax, which imposedextremely high marginal tax rates (in excess of90 percent) on the highest incomes. Hence verytop incomes, composed primarily of dividends,declined during the war. The shares of incomegroups P90–95 and P95–99, composed mostlyof well-compensated employees, also fell. Saezand Veall (2003) confirm these results by show-ing that salary earners gained significantly rel-ative to nonsalaried employees in terms ofemployment and compensation during the down-turns of 1920–1921 and the Great Depression,but lost significantly during World War II.11
From 1946 on, detailed tables on the compo-sition of income are published annually; hencewe are able to construct series for each fractilewithin the top decile. Figure 3 shows the com-position of income for each fractile in 1946(panel A) and 2000 (panel B). Comparing thetwo panels, the share of individual income thatis wages is inversely related to individual in-come in the 1946 cross section, but that wageshare rises so substantially for high-incomegroups that by 2000 the inverse relationship iseliminated. For high-income groups, the shareof income that is “entrepreneurial income” (in-come from self-employment or direct businessproprietorship) falls very sharply. Moreover,the share of income that is capital (dividends,
interest, and other investment income, exclud-ing capital gains) also falls for high-incomegroups, even though the share of capital incomein Personal Income from the National Accountsis about the same in 2000 as it is in 1946 (Saezand Veall, 2003). Therefore, the self-employedbusiness proprietors and capital income earnershave been in large part replaced by highly com-pensated employees at the very top of the in-come distribution.
The decline in the importance of capital in-come at high incomes suggests that the topcapital income earners were never able to con-stitute fortunes as large (relative to the averageincome) as those of the prewar period. Pikettyand Saez (2003) argue in the case of the UnitedStates that the most natural explanation is thedevelopment of a progressive income and estatetax system, which since the beginning of WorldWar II has reduced substantially the after-taxreturns earned by wealthy individuals. Thesame may well apply to Canada. The recentsurge in top incomes in both countries (and inCanada the repeal of federal and provincial es-tate taxes in the 1970s and 1980s) may restorethe importance of capital income in the comingyears.
III. The Recent Increase in Top Incomes
A. Top Wage Incomes
Our previous evidence suggests that the re-cent upturn in top income shares in Canada isthe consequence of an unprecedented surge inthe pay of the top compensated employees. Wenow examine this issue more fully using thedetail available in the micro-files that begin in1982. In this subsection, we focus on wageincome and offer some tentative explanationsfor the surge. In the following subsections, weconsider aspects that have been raised in theU.S. context as alternative possible explana-tions for the increased concentration of income:family composition, income mobility, andchanges in taxation.
Figure 4, panel A, displays the share of wagesaccruing to the P90–95, P95–99, and the toppercentile of the wage income distribution inCanada (bold lines) and the United States(dashed lines). We begin this figure in 1972using extrapolations based on composition ta-bles published for the 1972–1981 period. Our
confirmed in our analysis of Canadian income compositionafter World War II.
11 The most direct explanation is that war labor regula-tions set strict bounds on the raises that corporations wereable to give to their high-salary employees.
837VOL. 95 NO. 3 SAEZ AND VEALL: THE EVOLUTION OF HIGH INCOMES IN NORTHERN AMERICA
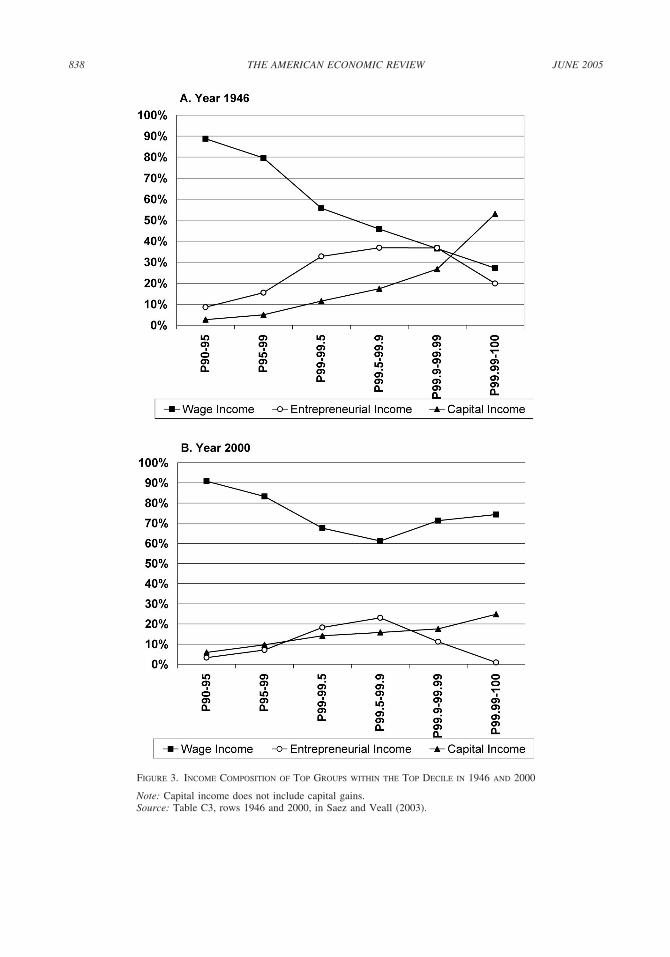
FIGURE 3. INCOME COMPOSITION OF TOP GROUPS WITHIN THE TOP DECILE IN 1946 AND 2000
Note: Capital income does not include capital gains.Source: Table C3, rows 1946 and 2000, in Saez and Veall (2003).
838 THE AMERICAN ECONOMIC REVIEW JUNE 2005

top groups are now defined relative to the totalnumber of individuals (Canada) or families(United States) with positive wage income. Itshows that, as with the total income shares, the
increase in Canada is concentrated within thetop percentile. In Canada, the shares of P90–95and P95–99 are almost flat, while the P99–100share doubles from around 5 percent in the late
FIGURE 4. THE TOP WAGE INCOME SHARES IN CANADA AND THE UNITED STATES,1972–2000
Note: United States series are based on family earnings while Canadian series are based onindividual earnings.Source: Canada, Table D2, panel A, columns P90–95, P95–99, P99–100, and P99.9–100, inSaez and Veall (2003). United States, Piketty and Saez (2003), Table IV, col. P90–95,P95–99, P99–100, and P99.9–100, updated to 2000.
839VOL. 95 NO. 3 SAEZ AND VEALL: THE EVOLUTION OF HIGH INCOMES IN NORTHERN AMERICA

1970s to over 10 percent in 2000. Interestingly,as displayed in Figure 4, the surge in top wageshares in the United States was not as concen-trated at the very top, as it was in Canada:P95–99 increases significantly from 10.5 per-cent to almost 13 percent from 1972 to 2000.12
Panel B of Figure 4 displays the top 0.1–percent wage income share in Canada and theUnited States (from Piketty and Saez, 2003).Over the 1972–2000 period, the top 0.1–percentwage income share in Canada increased morethan fourfold, from about 1 percent to 4.3 per-cent, and accounts for most of the gains accru-ing to the top 1 percent. The surge in the top 0.1–percent wage income share in Canada tracks thetop 0.1–percent wage income share in the UnitedStates very closely. Given that taxation changeswere different in the two countries and henceare unlikely to provide a complete explanation(more on this in Section III D), one possibilitycould be that the two economies have experi-enced very similar technological change andthus distributions of earnings in both countrieshave followed a similar path. A second possibleexplanation might be competition for highlyskilled executives driven by the U.S. market.Canadian executives and other professionalscan relatively easily move and find jobs in theUnited States as part of what is sometimescalled the brain drain. Therefore, Canadianfirms might attempt to retain their best-paidemployees by increasing their salaries.
The brain drain threat explanation seemsmore convincing to us than the technology ex-planation for a number of reasons. First, if tech-nological change (such as an improvement ininformation technology) is viewed as economy-wide, this would seem to suggest that gainswould be distributed more broadly across Can-ada’s highly-skilled workers, rather than beconcentrated at the top. Second, European
countries experienced the same change in tech-nology as did Canada and the United States.Piketty (2003) has demonstrated, however, thatFrance has not had an increase in inequality atthe top of the wage distribution.13 Third, if themigration threat explanation is true, then groupswith higher mobility costs (or smaller benefitsfrom moving) should experience a smaller risein their compensation. Three pieces of evidencesuggest that this is the case.
First, the surge in inequality at the top is moreconcentrated in Canada than in the UnitedStates. The benefits from moving are clearlyhigher for the very top wage earners (who ex-perienced the greatest increase in compensationin the United States, both in absolute and rela-tive terms). If the cost of moving is fixed, thoseat the very top are most likely to move, andU.S.–driven competition should be stronger atthe top, producing a more concentrated rise ininequality in Canada than in the United States.Ross Finnie (2002) finds that migration by Ca-nadians is in fact much more likely among thosewith high incomes.
Second, as shown in Figure 4, panel B, thesurge in top income shares started earlier in theUnited States than in Canada. Mahmood Iqbal(1999) documents the brain drain and concludesthat emigration of high-income Canadian work-ers to the United States increased during the1980s, especially after 1995 when the NorthAmerican Free Trade Agreement (NAFTA) al-lowed highly skilled workers to receive tempo-rary work visa permits much more easily. Thebrain drain pressures from the United States,therefore, correspond to the increase in topwage shares in Canada, suggesting that the lat-ter might well have been driven by the former.
Third, the French-speaking community inQuebec may be more reluctant to move to theUnited States because of cultural differences.Finnie (2002, 2004) finds that Quebec franco-phones are much less likely to migrate interpro-vincially and internationally than residents of12 Hence, in contrast to Canada, U.S. studies using sur-
vey data such as the Current Population Survey were largelyable to document the surge in high wages. (See LawrenceKatz and David Autor, 1999, and Daron Acemoglu, 2002,for recent surveys of these U.S. studies.) Another veryimportant difference between the United States and Canadais the pattern of inequality at the bottom. Low-incomeearners have lost dramatically in the United States relativeto Canada, explaining why overall inequality measures suchas the Gini coefficient have increased much more in theUnited States than in Canada (see Blackburn and Bloom,1993; Michael C. Wolfson and Brian B. Murphy, 2000).
13 British top income shares have increased significantlyas well since 1980, although less than in the United Statesor Canada (see Atkinson, 2002). This is consistent with themigration threat explanation, as we expect mobility to theUnited States from the United Kingdom to be higher thanfrom continental Europe, but lower than from Canada. Nat-urally, however, there are many other differences amongthese countries: these patterns are merely suggestive.
840 THE AMERICAN ECONOMIC REVIEW JUNE 2005

other provinces, and than Quebec anglophones.Figure 5 displays the top 1-percent wage sharefor francophones in Quebec and for Canadiansin all other provinces from 1982 to 2000.14 Thefigure demonstrates that the rise in the top1–percent income share has been much moremodest for francophones in Quebec (from about4.5 percent to 6.5 percent) than for the rest ofthe provinces (from less than 6 percent to morethan 11 percent). Moreover, as a group, anglo-phones in Quebec experience a surge in topwage shares similar to those in the rest of theprovinces.15 This evidence is consistent withthe brain drain threat explanation and is moredifficult to reconcile with pure technology
change (which we would expect to spreadquickly across Canadian provinces).
The surge in top executive compensation inthe United States is perhaps the most importantfactor that has driven up top wage incomeshares and is due in large part to the develop-ment of stock options. In Canada, CEO com-pensation has clearly also surged16 even thoughthe development of stock options has beenslower because CEOs do not receive as favoredan overall tax treatment (Kenneth J. Klassenand Amin Mawani, 2000).
In contrast to the United States, on Canadiantax returns, profits from stock-option exercisescan be separated out from wages and salaries.Saez and Veall (2003) use data obtained fromthe Canada Customs and Revenue Agency todocument that the fraction of total employmentincome from the exercise of stock options rose
14 Francophones are defined in the data as those whocomplete their income tax returns in French. Hence analternative explanation for the smaller rise in francophonetop income shares could involve high-income francophoneschoosing to file in English. Without independent informa-tion on language status, we cannot rule this out. We do note,however, that accounting firms in Quebec almost invariablyallow a client to choose filing language. We also note thatour tax-based data do not contain information about educa-tion or occupation, so we cannot determine whether thosewho file in French are different in other respects.
15 For Quebec anglophones, the top 1–percent share in-creases from less than 7 percent in 1982 to over 14 percentin 2000.
16 Data on CEO compensation in Canada during the1970s and 1980s are fragmentary. Using reported compen-sation for the top ten CEOs in 1978 (The Financial Post,June 9, 1979, pp. 1 and 14) and roughly comparable valuesfor 2000 (Report on Business Magazine (Globe and Mail),July 2002, pp. 115–16), we find that the ratio of average topten CEO compensation (including stock options) to averagewage income was about 40 in 1978, but almost 1,000 in theyear 2000, similar to the surge in CEO pay in the UnitedStates (see, e.g., Piketty and Saez, 2003).
FIGURE 5. THE TOP 1 PERCENT WAGE INCOME SHARE OF QUEBEC FRANCOPHONES VERSUS
ALL FILERS FROM THE REST OF CANADA, 1982–2000
Note: Francophones defined as those filing a tax return in French.Source: Table D4, panel A and B, column P99–100, in Saez and Veall (2003).
841VOL. 95 NO. 3 SAEZ AND VEALL: THE EVOLUTION OF HIGH INCOMES IN NORTHERN AMERICA

from less than 0.1 percent before 1990 to about1.5 percent in 2000. They show, however, thatsince 1978, the share of income received by thetop 0.1 percent of earners would still have in-creased by a factor of 3.5 if stock options hadbeen completely excluded, instead of by a factorof 4.3 with stock options fully included.
B. Family versus Individual Units
Canadian income taxes are assessed at theindividual level, whereas U.S. income taxes arebased on family income (as U.S. married cou-ples almost always file a joint return).17 ThusCanadian top income shares based on individualincome and U.S. top income shares based onfamily income might not be comparable (Atkin-son, 2003). This question is particularly impor-tant given the recent large increase in marriedwomen’s labor force participation. The Cana-dian tax return micro-data allow us to link theincomes of spouses and explore this issue.18
Figure 6 plots the top 1–percent wage incomeshare estimated at the individual level (as re-ported above) and at the family level (as in theUnited States) for 1982 to 2000. Both the leveland pattern of the two graphs are almost iden-tical, suggesting that changes in the correlationof earnings among spouses have had no effecton top income shares. Given this Canadian ev-idence, it seems likely that the recent dramaticincrease in family income concentration docu-mented in the United States is also due primarilyto an increase in individual income concentration.
C. Mobility
Has the surge in top incomes been accompa-nied by an increase in mobility for the high–
income groups? Using 1982–2000 longitudinaltax return data, we explore this issue in twoways. First, we recompute top income sharesbased on average income over three or fiveyears instead of a single year. If high incomeswere relatively transitory, we would expect tosee less concentration when incomes are mea-sured over a longer time period. Figure 7, panelA, plots the top 0.1–percent income share usingone-, three- and five-year centered averages.The three curves match almost perfectly, sug-gesting that income mobility has not increasedsignificantly in recent years.
Second, and more directly, panel B reportsthat the probability of remaining in the top 0.1–percent group is about 60 percent one year later,50 percent two years later, and between 40percent and 50 percent three years later. Thissuggests that mobility at the top is quite modest.Consistent with our panel A results, there is noincrease in mobility after 1982, perhaps even aslight decrease. Similar results apply to all topgroups and strongly suggest that the surge inannual income concentration that we have doc-umented is associated with a similar increase inlonger-term income concentration and wel-fare.19 From the Canadian findings, it seemsplausible that the surge in top U.S. incomes isalso not primarily due to increased mobility.20
D. The Role of Taxation
For the United States, a number of studieshave argued that the surge in top U.S. incomesin the 1980s might not reflect actual incomechanges, but rather changes in the way incomesare reported (Saez, 2004). For example, a large
17 The Canadian personal income tax system in principleattributes capital income to the individual saver. Hence,there are attempts to prevent tax evasion through transfersfrom high-earning to low-earning spouses.
18 Individuals in the tax return micro-data sample arematched to spouses using the universe of tax filers. Mostmatching uses tax form self-reports of the Social InsuranceNumber of the spouse (registered or common law). Addi-tional matches are made based on address, individual namesand ages, and the identification of any other individualsresident at the same address. According to internal StatisticsCanada calculations, the gross count of couples matched isvery close to independent demographic estimates of thenumber of such couples.
19 More generally, Michael Baker and Gary Solon(2003) and Charles M. Beach et al. (2003) have used tax-based data to conclude that the overall increase in annualearnings inequality in Canada was not due to increasedearnings variability, although they do not consider top in-comes specifically.
20 Because of lack of adequate data, top income mobilityin the United States has not been examined in publishedwork. A number of studies (e.g., Moshe Buchinsky andJennifer Hunt, 1999, and Peter Gottschalk, 1997), however,have used survey data to find more generally that the in-crease in measured U.S. inequality is not due to increasedmobility. Audra Bowlus and Jean-Marc Robin (2004) use alifetime model of wage/employment mobility to concludethat the U.S. distribution of lifetime labor income has be-come more unequal over the last 20 years.
842 THE AMERICAN ECONOMIC REVIEW JUNE 2005

fraction of the jump in U.S. top income sharesfrom 1986 to 1988 (see Figure 2) is due to shiftsfrom the corporate sector to the personal sector(as the top personal tax rate became lower thanthe corporate tax rate after 1987). The Canadianexperience casts new light on this issue in twoways.
First, the climb in Canadian top reported in-comes is unlikely due to tax-induced shiftingfrom the corporate sector. Canadian corporatetax rates remained relatively stable until 1987,have since declined, and in any case are offsetin the personal income tax by a dividend taxcredit, which reduces the double taxation ofdividends. Also, in contrast to the United States,for the Canadian top 0.01–percent income earn-ers, the share of business income reported onpersonal income tax returns as a percentage oftotal income reported has been relatively stableand very low, between 1 percent and 3 percentof total income over the last 20 years (Saez andVeall, 2003, Table C3).
Second, changes in marginal tax rates in Can-ada have been different in both timing and de-gree. Figure 8, panel A, presents Canada’saverage marginal personal income tax rate for1960 to 2000 (weighted by income) for those inthe top 0.1 percent, along with their income
share,21 while panel B presents the same for theUnited States (Saez, 2004). While marginal taxrates for the top 0.1 percent are about the samein the 1960s and the 1990s in Canada (around50 percent), U.S. marginal tax rates dropped dra-matically from about 70 percent in the early 1960sto less than 30 percent in the mid-1980s (and thenincreased to around 40 percent in the 1990s).
It is clear from Figure 8 that the U.S. top 0.1–percent income share surge has so far beenlarger. There is perhaps also some indicationthat Canadian top shares started to increase dur-ing the 1980s at the time of some significantCanadian marginal tax rate cuts, although someof the effect was temporary (see below). But itis striking that between 1990 and 2000, topshares surged very similarly in both countries,particularly after 1995. This occurred eventhough there was very little further change inCanadian marginal tax rates facing these top-income individuals, and in spite of the substan-tial increase in the relevant U.S. marginal
21 In Canada, provincial income taxes represent a signif-icant portion of total income taxes. Therefore, Figure 8displays marginal tax rates including both the federal andOntario provincial income tax (as Ontario contains over 50percent of top income earners in 2000).
FIGURE 6. TOP 1 PERCENT WAGE INCOME SHARE FOR INDIVIDUALS AND FAMILIES IN
CANADA
Note: For families, top 1 percent defined relative to the total number of couples and singleadults with positive wage income.Source: Table D2, panels A and B, column P99–100, in Saez and Veall (2003).
843VOL. 95 NO. 3 SAEZ AND VEALL: THE EVOLUTION OF HIGH INCOMES IN NORTHERN AMERICA

personal income tax rates in 1993 (as empha-sized by Piketty and Saez, 2003). Therefore, thedramatic climb in Canadian top reported in-comes is unlikely to have been induced bychanges in Canadian tax rates. If, as tentativelyargued previously, some of the surge in Cana-
dian top incomes is due to brain drain threats (orsome other association with U.S. factors), itmust be the case that the surge in top U.S. wageincomes is real and not entirely due to changesin the way U.S. incomes are reported for taxpurposes. Otherwise, those changes in the United
FIGURE 7. MOBILITY OF HIGH-INCOME EARNERS IN CANADA, 1982–2000
Source: Authors’ computations based on the Longitudinal Administrative Database.
844 THE AMERICAN ECONOMIC REVIEW JUNE 2005

States could not have increased incentives forCanadian top earners to move to the United States.
There are other things to learn from theCanada–United States comparison shown in
Figure 8. First, as noted, there is clear evidencein Canada, as in the United States, of a short-term response to cuts in marginal tax rates. Forexample, there was a substantial tax cut in
FIGURE 8. MARGINAL TAX RATES AND INCOME SHARE FOR THE TOP 0.1 PERCENT
IN CANADA AND THE UNITED STATES, 1960–2000
Note: Marginal tax rates in Canada include federal and Ontario provincial income taxes, aswell as applicable surtaxes and credits. Estimation details are provided in Appendix, SectionE, of Saez and Veall (2003). United States (Saez, 2004) computations use micro tax returndata and TAXSIM calculator (does not include state income taxes).Source: Canada marginal tax rate computations based on Table E1 in Saez and Veall (2003).
845VOL. 95 NO. 3 SAEZ AND VEALL: THE EVOLUTION OF HIGH INCOMES IN NORTHERN AMERICA

Canada in 1988, and panel A shows a sharpincrease in the 0.1-percent income share be-tween 1987 and 1989, which is partially re-versed by 1990. Several other figures showsimilar spikes, and it is particularly clear in thetop wage series in Figure 4. This suggests thatthis short-term response was at least in part thathighly compensated employees were shiftingsome of their compensation into the lower taxrate years. Austan Goolsbee (2000) found sim-ilar effects for the U.S. tax increase of 1993.Mary-Anne Sillamaa and Veall (2001) analyzedthe Canadian tax cut of 1988 by comparingincomes in years 1986 and 1989. Consistentwith our results, they found significant and largeelasticities for high-income groups. Our topshare series, however, shows that their elasticityestimates capture the short-term spike responsebut likely overstate the long-run response to thetax change.22
In order to test more formally that top incomeshare movements in Canada are primarily due to
U.S. developments rather than to changes inmarginal tax rates in Canada, we estimate sim-ple regression models of the form:
Log�TOP1%SHAREt� � � � � Log�1 � MTRt�
� � Log�TOP1%SHAREUSt� � ut
where TOP1%SHAREt is the share of incomereceived by the top 1–percent earners in Canadain year t, TOP1%SHAREUSt is the equivalentU.S. variable, and MTRt is the average (income-weighted) marginal tax rate applicable to the top1–percent group in Canada in year t. (We alsoestimate the corresponding regression for thetop–0.1 percent share.) The central parameter is�, the elasticity of top reported incomes (as ashare of all reported incomes) with respect tothe net-of-tax rate (defined as one minus themarginal tax rate). (See Saez (2004) for a dis-cussion of identification assumptions.)
Results for these time series regressions arereported in Table 2. The Newey-West procedure(with 8 lags) is used to correct the standard errorsfor possible heteroskedasticity and serial correla-tion. Panel A focuses on incomes for the fullperiod 1920 to 2000, while panel B focuses onwage incomes for the recent period 1972 to 2000.Columns 1 and 2 report results for the top 1
22 Sillamaa and Veall (2001) use four years of the samemicro-data set used as part of this study. They find much lowertax responsiveness for low-income groups, consistent with theU.S. findings of Jon Gruber and Saez (2002). Robert Gagne etal. (2000) use provincial-level aggregate data over the 1972–1996 period and find a large tax responsiveness for high-income individuals, but only for the 1988–1996 period.
TABLE 2—MARGINAL TAX AND U.S. EFFECTS ON CANADIAN TOP INCOME SHARES
Top 1 percent Top 0.1 percent
No U.S. control(1)
U.S. control(2)
No U.S. control(3)
U.S. control(4)
Panel A. Income Shares from 1920 to 2000
Elasticity 0.826 0.476 0.961 0.299(0.126) (0.130) (0.294) (0.168)
log (U.S. top income share) 0.458 0.610(0.093) (0.101)
Number of Observations 81 81 81 81
Panel B. Wage Income Shares from 1972 to 2000
Elasticity 2.550 0.177 3.023 0.278(0.762) (0.345) (0.544) (0.258)
log (U.S. top income share) 0.759 0.857(0.175) (0.059)
Number of observations 29 29 29 29
Notes: Estimates obtained by time-series regression of log (Canadian top income share) on aconstant, log (1 � Canadian marginal tax rate). Results are from OLS regressions withstandard errors corrected for heteroskedasticity and autocorrelation using the Newey-Westprocedure with 8 lags. In columns 2 and 4, log (U.S. top income share) is added as anadditional right-hand-side variable.
846 THE AMERICAN ECONOMIC REVIEW JUNE 2005

percent, and columns 3 and 4 for the top 0.1percent. Columns 1 and 3 exclude the U.S. sharevariable. In that case, the estimated elasticities ofincome shares with respect to net-of-tax rates arearound 0.8 to 1 for incomes and around 2.5 to 3for wage incomes for the recent period. The rea-son these elasticity estimates are so enormous isthat the entire surge in top wage income shares isattributed to the very modest decrease in Canadianmarginal tax rates since 1972. Columns 2 and 4use the full regression model with the log U.S.income share as an additional independent vari-able. This has a dramatic effect on the estimatedtax elasticities, which drop to around 0.3 to 0.5 forincomes and around 0.2 to 0.3 (not significantlydifferent from zero at the 5-percent level) for wageincomes. The coefficient on the U.S. log incomeshare is large and very significant and would im-ply that a 10-percent increase in the top U.S. wageincome share leads to an 8-percent increase in thetop Canadian wage income share. Even if we donot accept such a causal interpretation, the resultsreinforce our informal analysis and make it clearthat Canadian top income changes are much morestrongly associated with similar U.S. changes thanwith Canadian tax developments. This in turn isevidence that U.S. changes are more than changesin U.S. tax reporting behavior.
IV. Conclusion
This paper has used personal income tax datato construct homogeneous series of top incomeshares in Canada over the course of the twenti-eth century. A number of important findingshave emerged. First, and most striking, are theclose parallels between the patterns and compo-sition of top incomes in Canada and the UnitedStates. Both countries experienced a sharp dropin top shares during World War II, with norecovery before the 1970s. During the last twodecades, however, the top groups have largelyrecovered their prewar levels. Interestingly, thisrecent increase in income concentration has notbeen associated with increased mobility at thetop of the income distribution in Canada. More-over, both countries have experienced the sameshift in the composition of top incomes. Today,earners of employment income have, to a largeextent, replaced capital income earners at thetop of the income distribution in both Canada andthe United States.
The Canadian experience may help us un-derstand the role of taxation in explaining therecent increase in top income shares in theUnited States. Although the drop in marginaltax rates since the 1960s has been much moremodest in Canada than in the United States,the surge in top incomes has been almost aslarge in Canada as in the United States. Theanalysis of top Canadian incomes is moretransparent because it is not plagued withshifts between the personal and corporatesectors, which makes the U.S. results moredifficult to interpret. Moreover, the concen-tration of the surge in the last decade andamong only the very top income shares sug-gests that tax changes in Canada cannot be thesole cause. While clear evidence of short-termresponses to taxation can be found in Canada,it could be very misleading to equate suchresponses to the permanent long-run effectsof tax changes.
The surge in top wages in Canada is laterand more concentrated within very top groupsthan in the United States, and is much lesspronounced for francophones in Quebec. Wesuggest that this is evidence in favor of abrain drain explanation: the threat of migra-tion to the United States by highly skilledCanadian executives or professionals mayhave driven the surge in top wage shares inCanada. This would be consistent with thesmaller surge found for the United Kingdom(Atkinson, 2002) and the lack of a surge inFrance (Piketty, 2003). These internationaldifferences are difficult to reconcile with asimple skill-bias technological explanation.In any case, the relationship between the Ca-nadian and U.S. surges suggests strongly thatthe latter cannot be the consequence ofchanges in the way U.S. incomes are reportedfor tax purposes. The remaining puzzle is whysuch a surge took place in the United States inthe first place.
REFERENCES
Acemoglu, Daron. “Technical Change, Inequal-ity, and the Labor Market.” Journal of Eco-nomic Literature, 2002, 40(1), pp. 7–72.
Atkinson, Anthony B. “Top Incomes in theUnited Kingdom over the Twentieth Cen-tury.” University of Oxford, Discussion
847VOL. 95 NO. 3 SAEZ AND VEALL: THE EVOLUTION OF HIGH INCOMES IN NORTHERN AMERICA
Papers in Economics and Social History: No.43, 2002.
Atkinson, Anthony B. “Measuring Top Incomes:Methodological Issues.” Unpublished Paper,2003.
Baker, Michael and Solon, Gary. “Earnings Dy-namics and Inequality among Canadian Men,1976 –1992: Evidence from LongitudinalIncome Tax Records.” Journal of Labor Eco-nomics, 2003, 21(2), pp. 267–88.
Beach, Charles M.; Finnie, Ross and Gray,David. “Earnings Variability and EarningsInstability of Women and Men in Canada:How Do the 1990s Compare to the 1980s?”Canadian Public Policy, 2003, 29(0), pp.S41– 63.
Blackburn, McKinley L. and Bloom, David E.“The Distribution of Family Income: Mea-suring and Explaining Changes in the 1980sfor Canada and the United States,” in DavidCard and Richard B. Freeman, eds., Smalldifferences that matter: Labor markets andincome maintenance in Canada and theUnited States. Chicago: University of Chi-cago Press, 1993, pp. 233–64.
Bowlus, Audra J. and Robin, Jean-Marc. “TwentyYears of Rising Inequality in U.S. LifetimeLabour Income Values.” Review of Eco-nomic Studies, 2004, 71(3), pp. 709 – 42.
Buchinsky, Moshe and Hunt, Jennifer. “WageMobility in the United States.” Review ofEconomics and Statistics, 1999, 81(3), pp.351–68.
Finnie, Ross. “Leaving and Coming Back toCanada: Evidence from LongitudinalData.” Queen’s University, Kingston,School of Policy Studies Working Papers:No. 32, 2002.
Finnie, Ross. “Who Moves? A Panel LogitModel Analysis of Inter-Provincial Migrationin Canada.” Applied Economics, 2004,36(16), pp. 1759–79.
Gagne, Robert; Nadeau, Jean-Francois and Vail-lancourt, Francois. “Taxpayers’ Response toTax-Rate Changes: A Canadian PanelStudy.” University of Montreal, CIRANOScientific Series Papers: No. 2000s–59, 2000.
Goolsbee, Austan. “What Happens When YouTax the Rich? Evidence from ExecutiveCompensation.” Journal of Political Econ-omy, 2000, 108(2), pp. 352–78.
Gordon, Roger H. and Slemrod, Joel B. “Are“Real” Responses to Taxes Simply Income
Shifting between Corporate and Personal TaxBases?” in Joel B. Slemrod, ed., Does Atlasshrug? The economic consequences of taxingthe rich. Cambridge, MA: Harvard Univer-sity Press, 2000, pp. 240–80.
Gottschalk, Peter. “Inequality, Income Growth,and Mobility: The Basic Facts.” Journal ofEconomic Perspectives, 1997, 11(2), pp. 21–40.
Gruber, Jon and Saez, Emmanuel. “The Elastic-ity of Taxable Income: Evidence and Impli-cations.” Journal of Public Economics, 2002,84(1), pp. 1–32.
Heisz, Andrew; Jackson, Andrew and Picot, Gar-nett. “Distributional Outcomes in Canada inthe 1990s,” in Keith Banting, Andrew Sharpeand France St-Hilaire, eds., The review ofeconomic performance and social progress:The longest decade: Canada in the 1990s.Montreal: McGill–Queen’s University Press,2001, pp. 247–72.
Iqbal, Mahmood. “Are We Losing Our Minds?Policy Options, 1999, 20(7), pp. 34–38.
Katz, Lawrence F. and Autor, David H. “Changesin the Wage Structure and Earnings Inequal-ity,” in Orley Ashenfelter and David Card,eds., Handbook of labor economics, Vol. 3A.Amsterdam: Elsevier Science, North-Holland,1999, pp. 1463–1555.
Klassen, Kenneth J. and Mawani, Amin. “TheImpact of Financial and Tax Reporting In-centives on Option Grants to CanadianCEOs.” Contemporary Accounting Research,2000, 17(2), pp. 227–62.
Kuznets, Simon. Shares of upper income groupsin income and savings. New York: NationalBureau of Economic Research, 1953.
Kuznets, Simon. “Economic Growth and IncomeInequality.” American Economic Review,1955, 45(1), pp. 1–28.
Piketty, Thomas. “Income Inequality in France,1901–1998.” Journal of Political Economy,2003, 111(5), pp. 1004–42.
Piketty, Thomas and Saez, Emmanuel. “IncomeInequality in the United States, 1913–1998.”Quarterly Journal of Economics, 2003,118(1), pp. 1–39.
Saez, Emmanuel. “Reported Incomes and Mar-ginal Tax Rates, 1960–2000: Evidence andPolicy Implications.” National Bureau ofEconomic Research, Inc., NBER WorkingPapers: No. 10273, 2004.
Saez, Emmanuel and Veall, Michael R. “The Evo-
848 THE AMERICAN ECONOMIC REVIEW JUNE 2005

lution of High Incomes in Canada, 1920–2000.” National Bureau of EconomicResearch, Inc., NBER Working Papers: No.9607, 2003.
Sillamaa, Mary-Anne and Veall, Michael R. “TheEffect of Marginal Tax Rates on TaxableIncome: A Panel Study of the 1988 Tax Flat-
tening in Canada.” Journal of Public Eco-nomics, 2001, 80(3), pp. 341–56.
Wolfson, Michael C. and Murphy, Brian B. “In-come Inequality in North America: Doesthe 49th Parallel Still Matter?” CanadianEconomic Observer, 2000, 13(8), pp. 3.1–3.22.
849VOL. 95 NO. 3 SAEZ AND VEALL: THE EVOLUTION OF HIGH INCOMES IN NORTHERN AMERICA