Embed Size (px)
Citation preview

c© The Author(s) 2012. Published by Oxford University Press, on behalf of the Society of Systematic Biologists. All rights reserved.For Permissions, please email: [email protected]:10.1093/sysbio/sys002
The Evolution of Defense Mechanisms Correlate with the Explosive Diversificationof Autodigesting Coprinellus Mushrooms (Agaricales, Fungi)
LASZLO G. NAGY1,∗ , JUDIT HAZI1, BALAZS SZAPPANOS2, SANDOR KOCSUBE1, BALAZS BALINT3,GABOR RAKHELY4, CSABA VAGVOLGYI1, AND TAMAS PAPP1
1Department of Microbiology, Faculty of Science and Informatics, University of Szeged, Kozep fasor 52., H-6726 Szeged, Hungary;2Institute of Biochemistry, Biological Research Centre, Hungarian Academy of Sciences, Temesvari krt. 62., H-6726 Szeged, Hungary;
3Cancer Epigenetics and Biology Program (PEBC), The Bellvitge Institute for Biomedical Research (IDIBELL), Hospital Duran i Reynals,Av. Gran Via de L’Hospitalet 199-203, 08907—L’Hospitalet de Llobregat, Barcelona, Spain; and 4Department of Biotechnology,
Faculty of Science and Informatics, University of Szeged, Kozep fasor 52., H-6726 Szeged, Hungary;∗Correspondence to be sent to: Department of Microbiology, Faculty of Science and Informatics, University of Szeged, Kozep fasor 52.,
H-6726 Szeged, Hungary; E-mail: [email protected].
Received 11 March 2011; reviews returned 23 May 2011; accepted 3 October 2011Associate Editor: Mark Fishbein
Abstract.—Bursts of diversification are known to have contributed significantly to the extant morphological and speciesdiversity, but evidence for many of the theoretical predictions about adaptive radiations have remained contentious. Despitetheir tremendous diversity, patterns of evolutionary diversification and the contribution of explosive episodes in fungi arelargely unknown. Here, using the genus Coprinellus (Psathyrellaceae, Agaricales) as a model, we report the first explosivefungal radiation and infer that the onset of the radiation correlates with a change from a multilayered to a much simplerdefense structure on the fruiting bodies. We hypothesize that this change constitutes a key innovation, probably relaxingconstraints on diversification imposed by nutritional investment into the development of protective tissues of fruitingbodies. Fossil calibration suggests that Coprinellus mushrooms radiated during the Miocene coinciding with global radiationof large grazing mammals following expansion of dry open grasslands. In addition to diversification rate–based methods,we test the hard polytomy hypothesis, by analyzing the resolvability of internal nodes of the backbone of the putativeradiation using Reversible-Jump MCMC. We discuss potential applications and pitfalls of this approach as well as howbiologically meaningful polytomies can be distinguished from alignment shortcomings. Our data provide insights intothe nature of adaptive radiations in general by revealing a deceleration of morphological diversification through time.The dynamics of morphological diversification was approximated by obtaining the temporal distribution of state changesin discrete traits along the trees and comparing it with the tempo of lineage accumulation. We found that the numberof state changes correlate with the number of lineages, even in parts of the tree with short internal branches, and peaksaround the onset of the explosive radiation followed by a slowdown, most likely because of the decrease in available niches.[Autodigestion; diversification; fungi; hard polytomy; key innovation; speciational model; stochastic character mapping;veil.]
Episodes of accelerated speciation are believed tohave produced much of Earth’s extant diversity. Classicexamples of explosive diversification are found amongplants (Richardson et al. 2001; Klak et al. 2004; Eganand Crandall 2008; Valente et al. 2010) and animals(Verheyen et al. 2003; Joyce et al. 2005; Kozak et al.2006; Rundell and Price 2009), but no examples areknown among fungi or microbes, most probably be-cause of the lack of a continuous fossil record andcomprehensive phylogenies. Advanced phylogeneticmethods now permit the investigation of the tempoand mode of diversification in the absence of a contin-uous well-documented fossil evidence. With the fungalgenus Coprinellus (Psathyrellaceae, Agaricomycetes) asa model, in this paper, we report on explosive speciationin fungi for the first time and examine various aspects ofthe accumulation of morphological diversity within thisradiation. Coprinellus is a monophyletic group of fungiwith spectacular autodigesting fruiting bodies, whichproduce chitinolytic enzymes to digest themselves into ablackish fluid and are used as models in developmentalbiology (Lim and Choi 2009). Coprinellus comprises oneof four lineages in the Psathyrellaceae with autodigest-ing fruiting bodies and we have recently demonstratedthat switches between nonautodigesting and autodi-
gesting fruiting bodies represent a distinguished periodof evolution, referred to as coprinoidization (Nagy et al.2010; Nagy et al. 2011). Coprinoidization entails a se-ries of morphological and physiological changes thataccelerate the ontogeny of the fruiting bodies. It hasbeen hypothesized that the fast ontogeny enables thesemushrooms to colonize substrates with considerablyfluctuating water content. However, patterns of the di-versification of autodigesting lineages and their fit inthe environment are still poorly understood.
The theory of adaptive radiations predicts a relation-ship between the rates of phenotypic and species diver-sification (Schluter 2000; Purvis 2004), but evidence forthis has remained marginal due to the small number ofcarefully studied examples and the scarcity of suitablemorphological data sets (Pagel 1999a, 2006; Harmonet al. 2003; Purvis 2004; Ricklefs 2004; Adams et al. 2009;Agrawal et al. 2009; Organ et al. 2009; Lanfear et al.2011). Because adaptive radiations are characterized byrapid partitioning of the available niches and the phe-notype space, a correlation between morphological andspecies diversification can be viewed as phylogeneticevidence for an adaptive radiation as compared withnonadaptive radiations (Kozak et al. 2006; Rundell andPrice 2009). Furthermore, a high rate of trait evolution
Advance Access publication on January 4, 2012
Syst. Biol. 61(4):595–607, 2012
595
at Clark U
niversity on June 18, 2012http://sysbio.oxfordjournals.org/
Dow
nloaded from
SYSTEMATIC BIOLOGY VOL. 61
early in the radiation, followed by a deceleration, hasbeen suggested as rapidly radiating species fill availableniches (Schluter 2000; Kozak et al. 2006; Agrawal et al.2009), but experimental evidence for this is scarce, andits generality throughout the tree of life remains to beestablished. Recently developed models and theoreticalconsiderations imply association between trait evolu-tion and species diversification, but few studies havedemonstrated its existence (Hunter and Jernvall 1995;Hunter 1998; de Queiroz 2002; Donoghue 2005), evenfewer have shown causality (Hodges and Arnold 1995).Such key innovation hypotheses predict that certainintrinsic evolutionary innovations boost diversificationby opening new niches to the organisms or increasetheir fitness (Sanderson and Donoghue 1994; Hodgesand Arnold 1995; Hunter 1998). Despite their perplex-ing morphological diversity, key innovation hypotheseshave not been proposed for fungi so far. Within Coprinel-lus, previous taxonomic classifications took advantageof various characteristics of the veil, a protective layeron the cap and stipe surfaces, the size and color of thefruiting bodies, size and shape of the spores, the pres-ence, absence, and shape of specialized hairs on the capsurface and habitat. It is noteworthy that, within thePsathyrellaceae, hairs occur exclusively in Coprinellusand that the proportion of coprophilous species is alsothe highest there. Despite elaborate taxonomic knowl-edge of these groups, the evolution of, and thus thepotential effect on diversification, the abovementionedtraits are not known. Therefore, in this study, we at-tempt to single out those that may be associated withspecies diversification.
In this paper, we examine the temporal dynamicsof the diversification of the Psathyrellaceae with em-phasis on morphological traits. We use multigene datasets of the Psathyrellaceae and Coprinellus (this latternearly complete at the species level) to make inferencesabout the tempo of species accumulation and performancestral character state reconstructions to find morpho-logical traits that explain differences in diversificationbetween clades.
MATERIALS AND METHODS
Taxon Sampling, Generation of Sequence Data, andAlignment
To design taxon sampling for phylogeny reconstruc-tion, we collected taxonomic information relating tospecies of Psathyrellaceae, with special emphasis onCoprinellus, from two major sources: literature searchesand taxonomic identification and examination of herbar-ium specimens. Species for inclusion in phylogeneticanalyses were selected to ensure maximum taxonomiccoverage in all clades of the family, while, at the sametime maintaining the proportions of true diversity ineach clade. To mitigate further the bias originatingfrom cases of inhomogeneous species concepts, werelied on two critical monographs in the case of Eu-ropean species for Coprinopsis, Coprinellus, and Parasola
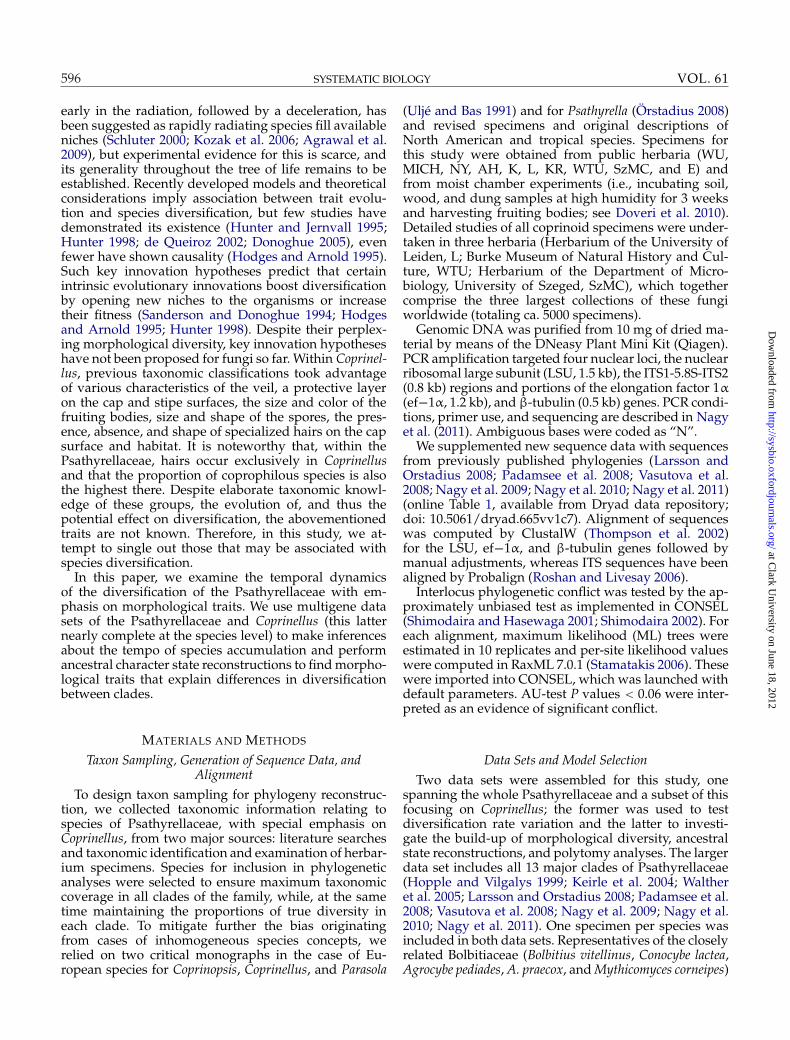
(Ulje and Bas 1991) and for Psathyrella (Orstadius 2008)and revised specimens and original descriptions ofNorth American and tropical species. Specimens forthis study were obtained from public herbaria (WU,MICH, NY, AH, K, L, KR, WTU, SzMC, and E) andfrom moist chamber experiments (i.e., incubating soil,wood, and dung samples at high humidity for 3 weeksand harvesting fruiting bodies; see Doveri et al. 2010).Detailed studies of all coprinoid specimens were under-taken in three herbaria (Herbarium of the University ofLeiden, L; Burke Museum of Natural History and Cul-ture, WTU; Herbarium of the Department of Micro-biology, University of Szeged, SzMC), which togethercomprise the three largest collections of these fungiworldwide (totaling ca. 5000 specimens).
Genomic DNA was purified from 10 mg of dried ma-terial by means of the DNeasy Plant Mini Kit (Qiagen).PCR amplification targeted four nuclear loci, the nuclearribosomal large subunit (LSU, 1.5 kb), the ITS1-5.8S-ITS2(0.8 kb) regions and portions of the elongation factor 1α(ef−1α, 1.2 kb), and β-tubulin (0.5 kb) genes. PCR condi-tions, primer use, and sequencing are described in Nagyet al. (2011). Ambiguous bases were coded as “N”.
We supplemented new sequence data with sequencesfrom previously published phylogenies (Larsson andOrstadius 2008; Padamsee et al. 2008; Vasutova et al.2008; Nagy et al. 2009; Nagy et al. 2010; Nagy et al. 2011)(online Table 1, available from Dryad data repository;doi: 10.5061/dryad.665vv1c7). Alignment of sequenceswas computed by ClustalW (Thompson et al. 2002)for the LSU, ef−1α, and β-tubulin genes followed bymanual adjustments, whereas ITS sequences have beenaligned by Probalign (Roshan and Livesay 2006).
Interlocus phylogenetic conflict was tested by the ap-proximately unbiased test as implemented in CONSEL(Shimodaira and Hasewaga 2001; Shimodaira 2002). Foreach alignment, maximum likelihood (ML) trees wereestimated in 10 replicates and per-site likelihood valueswere computed in RaxML 7.0.1 (Stamatakis 2006). Thesewere imported into CONSEL, which was launched withdefault parameters. AU-test P values < 0.06 were inter-preted as an evidence of significant conflict.
Data Sets and Model Selection
Two data sets were assembled for this study, onespanning the whole Psathyrellaceae and a subset of thisfocusing on Coprinellus; the former was used to testdiversification rate variation and the latter to investi-gate the build-up of morphological diversity, ancestralstate reconstructions, and polytomy analyses. The largerdata set includes all 13 major clades of Psathyrellaceae(Hopple and Vilgalys 1999; Keirle et al. 2004; Waltheret al. 2005; Larsson and Orstadius 2008; Padamsee et al.2008; Vasutova et al. 2008; Nagy et al. 2009; Nagy et al.2010; Nagy et al. 2011). One specimen per species wasincluded in both data sets. Representatives of the closelyrelated Bolbitiaceae (Bolbitius vitellinus, Conocybe lactea,Agrocybe pediades, A. praecox, and Mythicomyces corneipes)
596
at Clark U
niversity on June 18, 2012http://sysbio.oxfordjournals.org/
Dow
nloaded from

2012 NAGY ET AL.—MUSHROOM DIVERSIFICATION
were used to root the family level phylogeny. The P. can-dolleana clade was inferred sister to Coprinellus; thus, weused P. candolleana, P. badiophylla, and P. leucotephra asoutgroups for the smaller data set.
We selected nucleic acid models for the data sets us-ing the AICc criterion, as implemented in jModeltest(Posada 2008). During model selection, the proportionof invariant sites (I) was not considered, since this basi-cally accounts for the same phenomenon as the gammadistribution, and unidentifiability problems have beenreported when the two parameters are applied simul-taneously for the same data set in Bayesian MCMCframeworks (Rannala 2002; Stamatakis 2006). As best-fitmodels, jModeltest selected the GTR + G model for theITS1, ITS2, nrLSU, ef−1α, and β-tubulin gene regions,whereas for the 5.8S gene, the JC69 model was sug-gested. The partitioning regime used in all phylogeneticanalyses have been adopted from our previous work,in which several alternative partitioned models havebeen compared on the basis of Bayes Factors (Nagyet al. 2011). Thus, for all analyses, data were partitionedinto ITS1 (1–905), 5.8S (906–1082), ITS2 (1083–1889),nrLSU (1890–3189), ef−1α (3190–3852), and β-tubulin(3853–4228) regions, and the evolutionary model wasestimated for each partition separately.
Phylogenetic Analyses
Analyses of the 69-taxon data set.—Phylograms for thesmaller data set were inferred in MrBayes and BayesPhy-logenies (Pagel and Meade 2007a) to compare thetopologies and posterior probabilities across the twoprograms and models. We ran the Markov chains for30,000,000 generations, sampling every 1000th gener-ation. In BayesPhylogenies, we inferred trees undermixture models, which represent a generalization of theGTR + G model to include intrapartition heterogeneitiesin evolutionary patterns (Pagel and Meade 2005), byestimating 4 GTR + G matrices for each partition inour case. MrBayes was launched with four incremen-tally heated chains and two simultaneous replicates,whereas in BayesPhylogenies, three replicates with onlyone chain per replicate were run. A burn-in with widesafety margins was established as 15,000,000 genera-tions by checking the convergence of likelihoods inTracer 1.4 (Rambaut and Drummond 2008b) and topo-logical convergence by using AWTY (Wilgenbusch et al.2004). The resulting 15,000 trees were used to compute50% Majority Rule phylograms from the output of eachprogram. Posterior probabilities higher than 0.94 wereconsidered significant.
We also inferred trees for this data set under theassumption of a molecular clock in BEAST 1.6.1(Rambaut and Drummond 2008a). We used an uncor-related lognormal relaxed molecular clock model andthe partitioning regime outlined above. The tree priorwas set to the Yule process. Twenty-five million gener-ations were run, and the sampling frequency was set toevery 1000th generation. Thus, we sampled 25,000 trees,
of which the first 15,000 were discarded as burn-in.BEAST analyses were run in three replicates. TreeAnno-tator was used to find the Maximum Clade Credibilitytree. The output of this analysis was used to constructlineages through time (LTT) plots (see below).
The 242-taxon data set.—We inferred phylograms for thisdata set by using MrBayes 3.1.2. Data partitioning, mod-els, and chain length for this analysis were as above forthe smaller alignment, but the sampling frequency wasset to 100 and an ML empirical prior for branch lengthswas invoked. This latter aimed to mitigate systematicoverestimation of branch length reported for MrBayes,which can result in unrealistic branch lengths and in-flation of Bayesian posterior probabilities for long trees(Brown et al. 2010; Marshall 2010). We formalized theparameter of the exponential prior on branch lengthsas λ = −ln(0.5)/Ψ, where Ψ is the mean of the branchlengths taken from a ML tree.
Like the smaller data set, the 242-taxon alignmentwas analyzed under an uncorrelated lognormal relaxedmolecular clock model in BEAST. To avoid potential ef-fects of prior choice on the estimation of diversificationrates, we ran identical analyses under both tree priorsimplemented in BEAST: the Yule model and the Birth–Death model. Chain length, sampling, and burn-in wereas above. All other parameters were left at their defaultvalues. Chronograms were calibrated with dates fromour previous study, in which several indirect and fossiland composite calibrations outside the Psathyrellaceaewere compared (Nagy et al. 2010). We defined a normalprior distribution for the genera Parasola, Coprinellus,and Coprinopsis with a mean and standard deviationchosen to include the range of credible values obtainedby six calibration schemes (Nagy et al. 2011), excludingthe extreme estimates yielded by the Heckman et al.(2001) calibration (see Nagy et al. 2011, p. 311). Thus,we set mean/standard deviation of 50/20, 95/30, and80/25 for the most recent common ancestors of Coprinel-lus, Coprinopsis, and Parasola, respectively.
Polytomy Analyses
Explosive radiations are usually characterized by ex-plosive, if not simultaneous accumulation of lineages.In such cases, the relationships of the resulting speciesare best described by a star phylogeny, also called ahard polytomy, whereas bifurcating trees represent apoor description of the evolutionary history. Althoughexpansive polytomies constitute the key signature of ex-plosive diversification (Valente et al. 2010), it is difficultto reject the null hypothesis that the polytomy is causedby an inadequate or insufficient sample of characters.Therefore, we propose a new framework for examin-ing adaptive radiations by analyzing the resolvabilityof internal nodes via Bayesian analysis. For this, weemployed Phycas 1.2.0 (Lewis et al. 2010), a BayesianMCMC package, to estimate the posterior probabili-ties of internal nodes of Coprinellus being polytomies.To visit incompletely resolved trees, besides traditional
597
at Clark U
niversity on June 18, 2012http://sysbio.oxfordjournals.org/
Dow
nloaded from
SYSTEMATIC BIOLOGY VOL. 61
Larget-Simon moves, the MCMC proposal mechanismin Phycas uses “add-edge” and “delete-edge” moves,which allow jumps between trees of different resolu-tion. This reversible-jump MCMC method, when runlong enough, directly measures the posterior probabil-ity of a node being resolvable.
We examined the effects of various prior distributionson the results by applying two qualitatively differentprior distributions, “resolution class” and “polytomy”priors. Within both categories, four “prior strength” val-ues (δ = 0.5, δ = 1.0, δ = e and δ = e2) correspondingto the informativeness of the prior were tested (Fig. 1,online Fig. 3). With a prior strength of δ, a topology ora resolution class has δ times the probability comparedwith a more or a less resolved topology or resolutionclass, respectively. A resolution class is defined as theuniverse of trees with the same number of polytomicnodes (Lewis et al. 2010). Thus, δ = 0.5 represents a“polytomy unfriendly” prior, δ = 1.0 is a flat prior,whereas δ > 1.0 puts higher prior probability on less re-
solved trees. Of the flat priors, a resolution class prior isa completely uninformative distribution with regard tothe resolvability of nodes, whereas the polytomy prioris not, since it puts equal probability on each topology,and there are many more incompletely resolved topolo-gies than fully resolved ones. To examine prior impactfurther, we ran analyses on each gene and the com-bined alignment separately and with sampling fromthe prior only, resulting in 64 MCMC runs in total. Theef−1α gene was omitted from these analyses, since itwas available for <50% of setulose Coprinellus species.We partitioned the data as above and ran 100,000 cycles(1 cycle equals ca. 200 “traditional” Bayesian genera-tions [Lewis et al. 2010]) in the trials of prior impact andsingle-gene analyses and 200,000 cycles in the final anal-yses of the combined data set. The topology prior forthe final analyses was an uninformative resolution classprior (δ = 1.0). Every 10th cycle was sampled. Burn-inwas set to 50,000 and 100,000 cycles for the single-geneand final analyses, respectively.
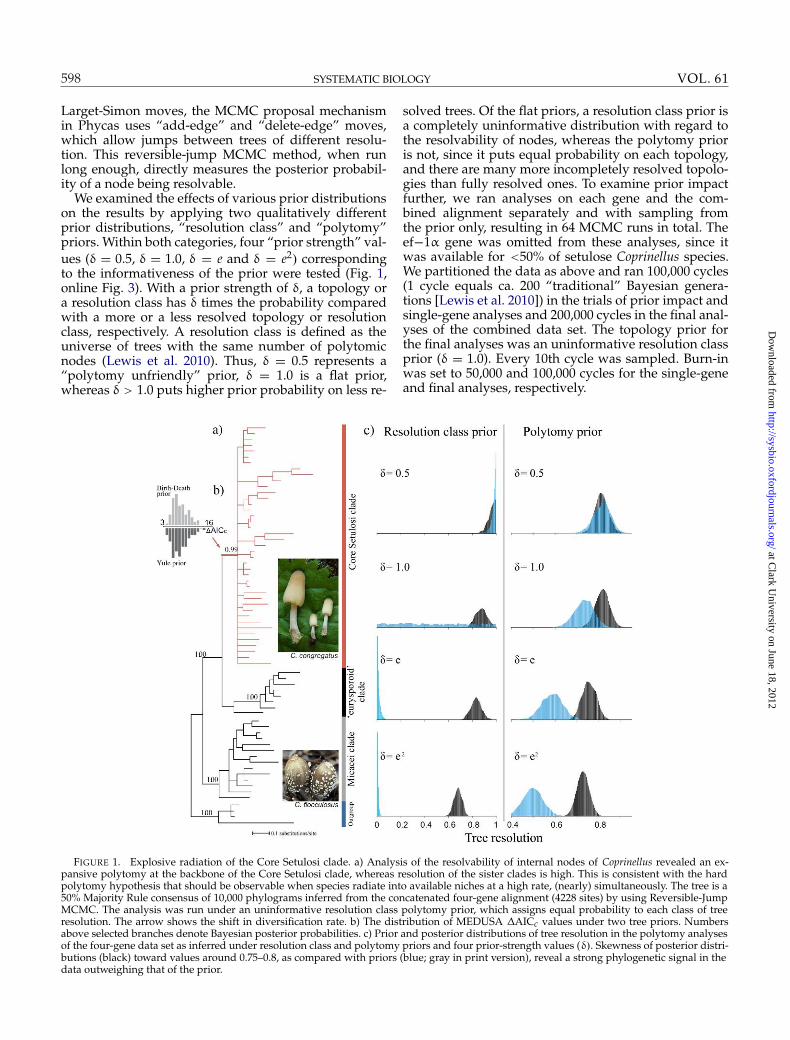
FIGURE 1. Explosive radiation of the Core Setulosi clade. a) Analysis of the resolvability of internal nodes of Coprinellus revealed an ex-pansive polytomy at the backbone of the Core Setulosi clade, whereas resolution of the sister clades is high. This is consistent with the hardpolytomy hypothesis that should be observable when species radiate into available niches at a high rate, (nearly) simultaneously. The tree is a50% Majority Rule consensus of 10,000 phylograms inferred from the concatenated four-gene alignment (4228 sites) by using Reversible-JumpMCMC. The analysis was run under an uninformative resolution class polytomy prior, which assigns equal probability to each class of treeresolution. The arrow shows the shift in diversification rate. b) The distribution of MEDUSA ΔAICc values under two tree priors. Numbersabove selected branches denote Bayesian posterior probabilities. c) Prior and posterior distributions of tree resolution in the polytomy analysesof the four-gene data set as inferred under resolution class and polytomy priors and four prior-strength values (δ). Skewness of posterior distri-
598
butions (black) toward values around 0.75–0.8, as compared with priors (blue; gray in print version), reveal a strong phylogenetic signal in thedata outweighing that of the prior.
at Clark U
niversity on June 18, 2012http://sysbio.oxfordjournals.org/
Dow
nloaded from

2012 NAGY ET AL.—MUSHROOM DIVERSIFICATION
Analyses of Diversification
LTT plots were constructed for the Core Setulosi cladeand the Micacei clade, using the R package APE (Paradiset al. 2004). We drew a sample of 1000 + 1000 chrono-grams from the 2 replicates of the BEAST analyses andpruned the trees to contain species of the Core Setu-losi and Micacei clades only. Net rates of diversification(speciation – extinction) were calculated for clades com-prising more than 10 taxa according to Nee (2001) in theLaser R package (Rabosky 2006). For these analyses, weused the 242 taxon data set and sampled 1000 ultramet-ric phylogenies in BEAST assuming both the Yule andBD processes.
We applied the Measuring Evolutionary Diversifi-cation Using Stepwise AIC (MEDUSA) framework tofind shifts in diversification rates in the presence oftaxonomic information for each of the clades (Alfaroet al. 2009). Briefly, the method estimates rates of theBirth–Death model and stepwisely adds breakpointsto the phylogeny, stopping the procedure when thelikelihood of the resulting n-breakpoint model is notsignificantly better than that of the model with n − 1sets of rates (specified by the AICc cutoff value). We per-formed MEDUSA analyses by using the R library Geiger(Harmon et al. 2008) on a sample of 50 + 50 chrono-grams under the Yule and BD tree priors. To avoideffects of sparse sampling in the outgroup, we re-moved the outgroup taxa and retained M. corneipesonly. We examined the robustness of our results to theMEDUSA analysis parameters “cutAtStem”, “model-Limit”, and “estimateExtinction”. We compiled speciesrichness data from the most recent monographic treat-ments of the genera Coprinopsis, Coprinellus, Parasola,and Psathyrella (for details, see online information) andour revisions of herbarium type and voucher specimens.The taxonomic study of Psathyrellaceae species is for-tunately immune to substantial differences in speciesconcepts, with few notable exceptions (as opposedto other species-rich fungal groups, e.g., Cortinarius,Inocybe, Russula, etc.). Based on morphological similar-ity, 62 unsampled species were assigned a relationshipand formalized as a richness table used in the MEDUSAanalyses. Even with this depth of sampling, it is likelythat some species remained uninvolved, but their distri-bution is certainly random, so they introduce no bias inour analyses.
Analyses of Morphological Evolution
We inferred the temporal distribution of characterstate changes along the phylogeny by using 42 taxonom-ically informative morphological/ecological traits (for alist and description, see online Figs. 4 and 5). To obtaina Bayesian sample of state changes, we used stochasticcharacter mapping by drawing n “mutational maps”,consistent with the ancestral states and the prior dis-tribution on rates. The mutational maps provide infor-mation about the duration of a state along a particularbranch, which can be used to calculate the total distance
of the state changes from the tips/root. Under Marko-vian models, longer branches are expected to give moreopportunity to a character to change, which rendersmolecular branch length information in explosive radi-ations (with many short internal branches) misleading.Thus, what is desired is a method that uses only the in-formation in the terminals of the tree, which we accom-plished by using a tree with each branch of unit length(Agrawal et al. 2009). We employed SIMMAP 1.5.1(Bollback 2006) to draw 1000 mutational maps from theposterior distribution for each of the 100 post-burn-intrees and morphological/ecological traits. Optimizationof priors followed Ekman et al. (2008), by countingthe average number of state changes for each char-acter under parsimony (in MacClade 4.08) and defin-ing a gamma distribution with a mean at the inferrednumber of state changes. The gamma distribution wasdiscretized using 60 rate categories, and the total treelength was rescaled to 1.0 in all cases. We then calcu-lated the distance of the state changes from the root andfrom the terminals using the original branch lengthsof the trees. Thus, bias arising from the short internalbranches during the rapid diversification could be over-come (Cunningham 1999). Subsequently, we dividedthe timescale to 1000 discrete bins, counted the num-ber of state changes in each, and normalized with thenumber of lineages present in each bin. We repeated theanalyses both with samples of chronograms and phylo-grams under binary and multistate coding of traits (seeonline information). A perl package for performing theabove analyses is available from the authors.
Morphological Model Inferences and Ancestral StateReconstructions
We took an empirical Bayesian approach to infermodels and reconstruct ancestral states for traits, whichshow a characteristic distribution within the CoreSetulosi and Micacei clades and based on superficialinspection of ancestral state reconstructions in SIMMAPmay correlate with shifts in diversification rates. In thismanner, the presence of hairs and a macroscopicallydiscernable veil have been identified as candidates.Both were modeled by continuous time Markov mod-els in BayesTraits 1.0 (Pagel and Meade 2007b) underspeciational and gradual modes of evolution. To selectbest-fit models, we first estimated rates by ML on 100phylogenies under gradual and speciational modes ofevolution. We then compared models implying no gains(q01 = 0), no losses (q10 = 0), and equal rates of gainand loss (Nagy et al. 2010) (Table 2) and chose the onewith the fewest parameters not rejected against the freemodel by the LRT-like statistic for nonnested models(Pagel and Meade 2007b).
Ancestral state reconstructions were performed onthe gradual and speciational trees for four clades: thegenus Coprinellus, Micacei clade, Core Setulosi clade,and All-Setulosi clade (eurysporoid clade + Core-Setulosi). Nodes were defined by the “mrca” command,
599
at Clark U
niversity on June 18, 2012http://sysbio.oxfordjournals.org/
Dow
nloaded from

SYSTEMATIC BIOLOGY VOL. 61
and ancestral states were estimated by ML for eachtree in the sample. A fully Bayesian method was alsoconsidered, but with regard to the dependence of pos-terior distributions on the prior and the difficulties infinding reliable priors, we took ML instead. Both modelinferences and ancestral state reconstructions were per-formed on a sample of 1000 phylograms of the 69-taxondata set obtained from MrBayes.
RESULTS
Data Sets
As a result of revisions of herbarium specimens,we included 69 species in the smaller data set (taxonsampling 88%), whereas the larger one comprised 242species with a taxon sampling density > 70% in mostclades (except for three small groups, the Cystoagaricus,Psathyrella calcarea, and P. cotonea clades; Table 1), whichprobably constitutes the most comprehensive family-level agaric phylogeny to date. The data set includesseveral unnamed species, mainly in the genera Parasola,Coprinopsis, and Coprinellus but also in psathyrelloidclades. A detailed taxonomic treatment of these speciesis in preparation for submission to a mycological jour-nal or has been published elsewhere (Nagy 2006; Doveriet al. 2010; Hazi et al. 2011) (online Fig. 6).
After the exclusion of ambiguously aligned regions,both concatenated alignments comprised 4228 sites ofnucleic acid. The approximately unbiased test did notindicate significant conflict among the data sets. Al-most all the species were represented by at least twogenes (mostly ITS and LSU), 172 by three regions, and91 by all four gene regions. PCR amplifications of twoor more loci from C. singularis, C. simulans, C. parvulus,and C. ephemerus failed. This latter turned out to be rarerthan previously assumed, whereas the closely relatedC. congregatus is very common. Comparison with for-merly published phylogenies revealed that the missingdata did not influence the recovery and support values
TABLE 1. Taxon sampling density in Psathyrellaceae clades
Percentage of species included in theClades phylogeny reconstruction (%)
Coprinopsis 77Core Setulosi clade 85Coprinellus p.p. 1 82Cystoagaricus clade 54eurysporoid clade 100Lacrymaria clade 88Parasola 88Psathyrella calcarea clade 60Psathyrella candolleana clade 80Psathyrella cotonea clade 50Psathyrella fusca clade 82Psathyrella gracilis clade 73Psathyrella senex clade 100a
Psathyrella spadiceogriseae clade 75
Note: Clade diversities were compiled from literature and revisions ofherbarium specimens.aThis clade may contain some additional species, for which it is diffi-cult to establish clear affinities.
of larger clades, since the gross topology of the treeis congruent with that obtained for the species repre-sented by all four genes and a 126-taxon tree with amuch smaller proportion of missing data (Nagy et al.2010; Nagy et al. 2011). All newly generated sequenceshave been deposited in GenBank (online Table 1).
Phylogenetic Analyses
Trees inferred for the 242-taxon data set in BEAST andMrBayes were congruent, differing only in the place-ment of the Lacrymaria clade, a basal relationship whichproved difficult to resolve (Larsson and Orstadius 2008;Padamsee et al. 2008; Nagy et al. 2010; Nagy et al.2011). In all analyses, Coprinellus was split into threestrongly supported clades, which we denote as CoreSetulosi, eurysporoid, and Micacei clades (Fig. 1, onlineFigs. 1 and 2), corresponding to the morphologicallyestablished sections Setulosi, Setulosi p.p., and Micacei +Domestici, respectively (Ulje 2005). Within Coprinellus,the position of C. sabulicola was somewhat uncertain,appearing either as a sister species to the eurysporoidclade or basal to the eurysporoid + Core Setulosi clade.
Polytomy Analyses
Reversible-Jump MCMC runs converged quickly tothe stationary distributions as judged from the conver-gence of likelihoods and split posterior probabilities.Under all 32 prior settings (8 different priors on 4 datasets each), the majority of the sampled trees had oneor more polytomies. With uninformative polytomy pri-ors, which assign equal probability to each distinct treetopology, including resolved and unresolved ones,the mean resolution varied between 0.8 [95% highestposterior density (HPD): 0.7–0.89] for β-tubulin, 0.73(95% HPD: 0.64–0.82) for nrLSU, 0.77 (95% HPD: 0.70–0.84) for ITS, and 0.87 (95% HPD: 0.82–0.93) for theconcatenated data set, which together correspond to 5–22 unresolved nodes per tree. The resolution of the 50%Majority Rule consensus trees was much lower, with thehighest resolution achieved in the combined analysis(0.56, 30 unresolved nodes). Uninformative resolutionclass priors are much more conservative, though, themean resolution of sampled trees is highly consistentwith those obtained under polytomy priors: 0.58 (95%HPD: 0.43–0.76) for β-tubulin, 0.71 (95% HPD: 0.62–0.80) for nrLSU, 0.76 (95% HPD: 0.64–0.84) for ITS, and0.87 (95% HPD: 0.78–0.97) for the concatenated dataset (online Fig. 3). Comparison of MCMC sampling oftrees with and without data reveals a strong signal inour data with regard to the resolvability of internalnodes. Although there was a positive correlation be-tween mean resolution of the sampled topologies andincreasing alignment length, even with all three genescombined, the Markov Chains spent >99% of their timeat unresolved topologies under a uniform prior and>80% when a prior favoring fully resolved trees wasassumed. Polytomies were inferred most frequently for
600
at Clark U
niversity on June 18, 2012http://sysbio.oxfordjournals.org/
Dow
nloaded from
2012 NAGY ET AL.—MUSHROOM DIVERSIFICATION
the basal nodes of the Core Setulosi clade, whereasrelationships within both the eurysporoid and theMicacei clade were almost fully resolved on the 50%consensus phylograms (Fig. 1a).
Diversification Analyses
By fitting models of diversification with zero, oneor more shifts in diversification rates to an ultrametric242-taxon phylogeny of the Psathyrellaceae (by usingthe MEDUSA framework [Alfaro et al. 2009]), we foundthat the phylogeny is best described by a birth–deathmodel in which the tempo of diversification increaseson the branch leading to the Core Setulosi clade (Fig. 1,online Figs. 1 and 2). The AICc values did not differsignificantly across the tree samples obtained underthe Yule and BD speciation priors in BEAST (ΔAICc =3.02 – 15.69). Models with multiple diversification rateshifts yielded significantly worse likelihood values onall trees. The rate shift has been located on the branchleading to the Core Setulosi clade. Varying the param-eters “CutAtStem”, and “EstimateExtinction” did nothave considerable effect on the results.
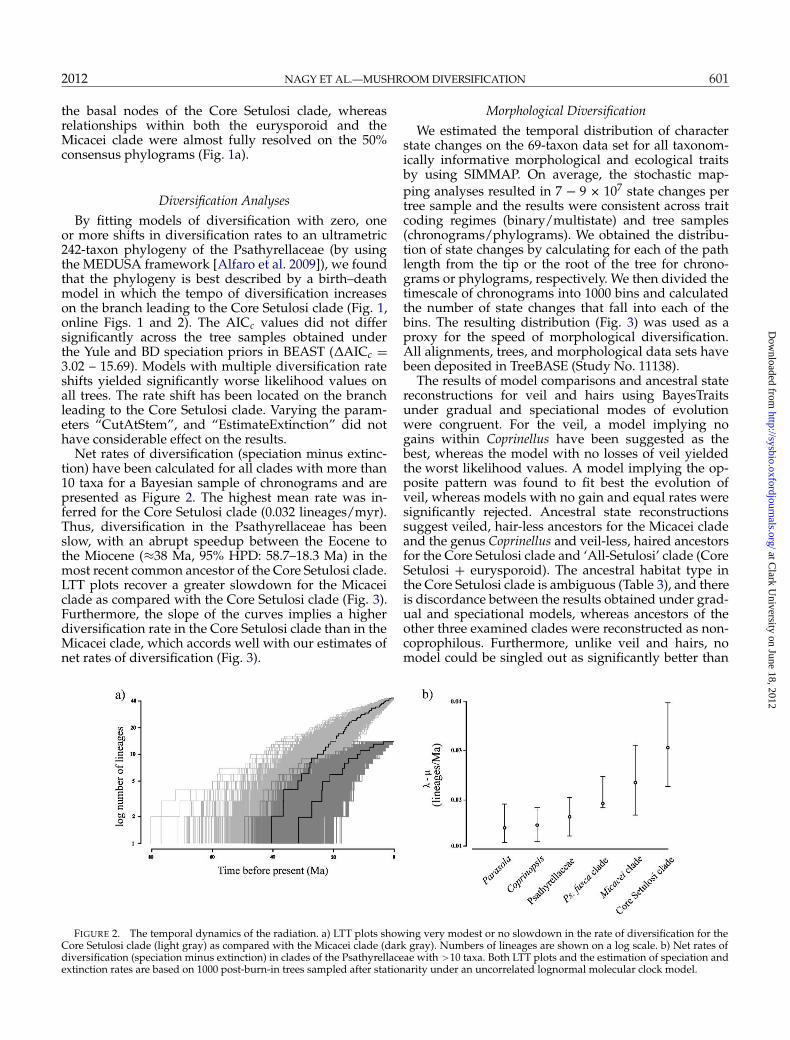
Net rates of diversification (speciation minus extinc-tion) have been calculated for all clades with more than10 taxa for a Bayesian sample of chronograms and arepresented as Figure 2. The highest mean rate was in-ferred for the Core Setulosi clade (0.032 lineages/myr).Thus, diversification in the Psathyrellaceae has beenslow, with an abrupt speedup between the Eocene tothe Miocene (≈38 Ma, 95% HPD: 58.7–18.3 Ma) in themost recent common ancestor of the Core Setulosi clade.LTT plots recover a greater slowdown for the Micaceiclade as compared with the Core Setulosi clade (Fig. 3).Furthermore, the slope of the curves implies a higherdiversification rate in the Core Setulosi clade than in theMicacei clade, which accords well with our estimates ofnet rates of diversification (Fig. 3).
Morphological Diversification
We estimated the temporal distribution of characterstate changes on the 69-taxon data set for all taxonom-ically informative morphological and ecological traitsby using SIMMAP. On average, the stochastic map-ping analyses resulted in 7 − 9 × 10⁷ state changes pertree sample and the results were consistent across traitcoding regimes (binary/multistate) and tree samples(chronograms/phylograms). We obtained the distribu-tion of state changes by calculating for each of the pathlength from the tip or the root of the tree for chrono-grams or phylograms, respectively. We then divided thetimescale of chronograms into 1000 bins and calculatedthe number of state changes that fall into each of thebins. The resulting distribution (Fig. 3) was used as aproxy for the speed of morphological diversification.All alignments, trees, and morphological data sets havebeen deposited in TreeBASE (Study No. 11138).
The results of model comparisons and ancestral statereconstructions for veil and hairs using BayesTraitsunder gradual and speciational modes of evolutionwere congruent. For the veil, a model implying nogains within Coprinellus have been suggested as thebest, whereas the model with no losses of veil yieldedthe worst likelihood values. A model implying the op-posite pattern was found to fit best the evolution ofveil, whereas models with no gain and equal rates weresignificantly rejected. Ancestral state reconstructionssuggest veiled, hair-less ancestors for the Micacei cladeand the genus Coprinellus and veil-less, haired ancestorsfor the Core Setulosi clade and ‘All-Setulosi’ clade (CoreSetulosi + eurysporoid). The ancestral habitat type inthe Core Setulosi clade is ambiguous (Table 3), and thereis discordance between the results obtained under grad-ual and speciational models, whereas ancestors of theother three examined clades were reconstructed as non-coprophilous. Furthermore, unlike veil and hairs, nomodel could be singled out as significantly better than
FIGURE 2. The temporal dynamics of the radiation. a) LTT plots showing very modest or no slowdown in the rate of diversification for theCore Setulosi clade (light gray) as compared with the Micacei clade (dark gray). Numbers of lineages are shown on a log scale. b) Net rates ofdiversification (speciation minus extinction) in clades of the Psathyrellaceae with >10 taxa. Both LTT plots and the estimation of speciation andextinction rates are based on 1000 post-burn-in trees sampled after stationarity under an uncorrelated lognormal molecular clock model.
601
at Clark U
niversity on June 18, 2012http://sysbio.oxfordjournals.org/
Dow
nloaded from

SYSTEMATIC BIOLOGY VOL. 61
FIGURE 3. Deceleration of morphological diversification in the Core Setulosi clade. The diagram shows the relative frequency of statechanges in 37 binary morphological traits as inferred by stochastic mapping and normalized with the number of branches in each of the 1000discrete bins the timescale was divided to. One-thousand mappings were performed on each of 100 post-burn-in speciational trees, and thedistance of the state changes from the tips was traced back by using the original branch lengths of the (ultrametric) trees. The same results wereobtained for an alternative trait coding regime (42 characters in total) and for phylograms. The “y” axis denoted the number of state changesper lineage per tree sample. The long left tail is caused by uncertainty in the tree sample. Dashed line shows the mean age of the Core Setulosiclade (38.4 Ma). “Q” stands for Quaternary.
others, except for the one in which gains of coprophylyare impossible, which was significantly worse than oth-ers (2 (ln L1 − ln L0) = 12.39 and 7.02 under gradual andspeciational models, respectively).
DISCUSSION
Polytomy Analyses
To test whether species emerged (nearly) simulta-neously, we employed a Bayesian sampler that usesReversible-Jump MCMC (Lewis et al. 2005, 2010) tovisit both resolved and unresolved topologies. In theReversible-Jump MCMC framework, the frequency oftrees in the posterior distribution that include a poly-tomy at the node of interest can be used to estimate theposterior probability of that node being a hard polytomy,given the data set used. Traditional Bayesian approacheshave been shown to become unpredictable and tend toplace high posterior probability on any arbitrary res-olution around the polytomous node in case one triesto resolve a node that exists as a hard polytomy in na-ture (Lewis et al. 2005). In real biological examples, suchsettings can occur when the tree contains “branches”along which no or very few substitutions have occurred,as expected in (neutrally evolving) loci when either thespeciation rate is high or the rate of molecular evolutionis too low to reconstruct the branch properly.
If used to examine explosive radiations, distinguish-ing methodical artifacts from biologically meaningfulpolytomies can be challenging. Such artifacts involve theconflict between data partitions and insufficient lengthof alignments, as well as incongruence in tree samplesas a result of poor topological convergence, all of whichcan produce a high proportion of polytomous nodes onthe phylogeny. Low resolution caused by conflicting tree
signal between alignments (e.g., because of introgres-sion, incomplete lineage sorting, or reticulate evolution)can be accounted for by using traditional combinabil-ity tests (Shimodaira 2002), whereas the contributionof alignment length to the lack of resolution is moredifficult to assess objectively. Previous attempts to testthe hard polytomy hypothesis were based on the sta-tistical comparison of polytomous and resolved trees(Fishbein et al. 2001) or the presence of phylogeneticsignal along paths between species of the putative ra-diation at various distances from each other (Jackmanet al. 1999). Sister clades to the putative radiation canprovide a clue for that since they can be regarded asinternal controls when their resolvability is comparedwith that of the clade of the putative radiation, giventhat taxon sampling and the rate of molecular evolu-tion are approximately the same in both. In our exam-ple, the resolution of the Micacei and eurysporoid cladescontrast significantly with that of the Core Setulosi clade,suggesting that the expansive polytomy in the latter isnot a result of the brevity of the concatenated alignment,given that the distribution of the phylogenetic signal inthe alignment is uniform across the tree. As a counterex-ample, in single-gene analyses, we observed the lossof resolution for all three clades simultaneously whenonly β-tubulin was analyzed (online Fig. 3). In this case,the lack of resolution could most likely be attributedto the weakness of the phylogenetic signal in the dataset, (the β-tubulin alignment was only 375-bp long). Inthis case, the extent to which the shape of posterior dis-tributions differ from that of priors can provide a cluefor the strength of the signal in the data. This is partic-ularly problematic when early evolutionary events arebeing scrutinized, such as class- or phylum-level phylo-genies. It has been proposed that the resolution of suchearly divergences may require a tremendous number of
602
at Clark U
niversity on June 18, 2012http://sysbio.oxfordjournals.org/
Dow
nloaded from
2012 NAGY ET AL.—MUSHROOM DIVERSIFICATION
alignment sites, which even phylogenomic studies mayfail to produce (Fishbein et al. 2001; James et al. 2006;Hackett et al. 2008; Struck et al. 2011). In a previousexample, parametric bootstrapping suggested that unre-alistically long alignments (>107 sites) may be requiredto resolve basal relationships in the Saxifragales, an ex-ample of multifurcating speciation (Fishbein et al. 2001).Polytomy analyses might prove particularly useful forresolving old explosive radiations, where methods us-ing estimates of speciation and extinction rates fail due toproblems in taxon sampling and the detection of extinctlineages. In general, polytomy analyses can complementthe shortcomings of currently routinely applied diver-sification rate–based methods for detecting explosiveradiations. Since polytomy analyses do not require theestimation of speciation and extinction rates, they are ex-pected to be less prone to bias in taxon sampling and treeimbalance. The nonoverlapping assumptions of poly-tomy analyses and diversification rate–based methodsdescribed above enable a more comprehensive examina-tion of putative explosive radiations.
During our analyses of Coprinellus, the Markov chainsspent on average >99% of their time at unresolved trees.Although priors on tree topology had a considerable ef-fect on the posterior distribution of tree resolvability,the shape of the posterior was dominated by the phy-logenetic signal from the data, and comparison of thedifferent prior-posterior pairs revealed an unambiguouspattern about node resolvability (Figs. 1 and 2). Whenuninformative priors on tree topology were enforced,the number of unresolved nodes per single-gene treevaried between 5 and 22 (mean tree resolution: 0.64 –0.93), centered on the backbone of the Core Setulosiclade (Fig. 1), suggesting that it constitutes a hard poly-tomy and conforms to a period of rapid diversificationearly in the evolution of this clade. Another explanationfor the lack of resolution may be the conflicting phylo-genetic signal in the data or inadequate length of thealignment. Both can be excluded in our case, since noconflict was detected between the genes and the lengthof the concatenated alignment (4228 sites) is comparableto some of the most elaborate species-level data sets.
Evolution of Morphological Traits
The theory of adaptive radiations predicts that thebuild up of morphological diversity should be rapidearly in the radiation, possibly followed by a deceler-ation as the availability of niches limits diversification(Schluter 2000; Kozak et al. 2006; Rabosky and Lovette2008). It recently became possible to study such pro-cesses for continuously varying traits in a phylogeneticframework (Pagel 1999b; Freckleton and Harvey 2006;Agrawal et al. 2009). Here, we present a framework fordiscrete traits that is analogous to observing the overallmorphological diversity within a clade at successive timeintervals, a philosophy similar to that of LTT plots. Nor-malization of the number of state changes by the num-ber of lineages in each successive time interval outlines
a figure of the speed and temporal dynamics of mor-phological diversification by using discrete traits. Onepotential limitation of this approach is that numerouscharacters are needed to reliably estimate the dynamicsof diversification, an aspect requiring further study.
Model-based inferences of phenotypic evolutionalong phylogenetic trees have a great potential, espe-cially for poorly fossilizing organisms and/or traits.However, modeling the effects of speciation/extinctionon phenotypic evolution and vice versa has a num-ber of assumptions that may or may not be met undersome evolutionary processes. One of the most impor-tant questions may be whether and when the rate ofmolecular evolution can be extrapolated to the rateof phenotypic evolution and, thus, whether molecularbranch length (even if estimated accurately) representsa good approximation of the number of state changesin phenotypic traits. Phylogenetic inference from puta-tive neutrally evolving loci fails to capture the amountand nature of evolutionary events along a branch of atree when either the tempo of speciation or phenotypicevolution differ from that of molecular evolution con-siderably. Adaptive radiations are typical such cases,when the use of molecular branch length for compara-tive studies of nonmolecular characters (morphological,behavioral, etc.) cannot be justified (Cunningham 1999).By disregarding branch length information (in the spe-ciational model), our analysis used only the distributionof character states in the terminals and the number ofinternal nodes to infer the placement and number ofcharacter transitions along a phylogenetic path. The“chance” for inferring adaptive radiation with suchsettings is higher than with molecular branch lengths,however, the use of molecular branch lengths would in-troduce a much bigger bias in model-based analyses byrepulsing state changes from the short internal branchesof the radiation. In this respect, our approach is simi-lar to parsimony mapping except that it allows multiplesubstitutions to occur along a particular branch. Whethera molecular branch length model, a speciational modelin which the branch lengths correspond to the numberof speciation events (Agrawal et al. 2009) are set equallength (present study), or a model in which branchlengths for each character are transformed by a ML op-timized scaling factor (κ or λ, [Pagel 1994, 1997]) wouldyield the least biased test of adaptive radiation usingdiscrete traits requires further theoretical and empiricalstudy. Models not assuming a constant rate of trait evo-lution across the phylogeny (Skinner 2010) may providean alternative to laboring with branch lengths, althoughthe dependency of the estimation of transition probabil-ities on branch lengths and the difficulty of keeping thenumber of parameters and the variance of the estimatelow would not be eliminated.
We found that the accumulation of morphologicaldiversity correlates with that of lineages, even in partsof the tree with short internal branches, suggesting anelevated rate of morphological diversification early inCore Setulosi clade followed by a deceleration (Fig. 4).The number of state changes peaks around the onset of
603
at Clark U
niversity on June 18, 2012http://sysbio.oxfordjournals.org/
Dow
nloaded from

SYSTEMATIC BIOLOGY VOL. 61
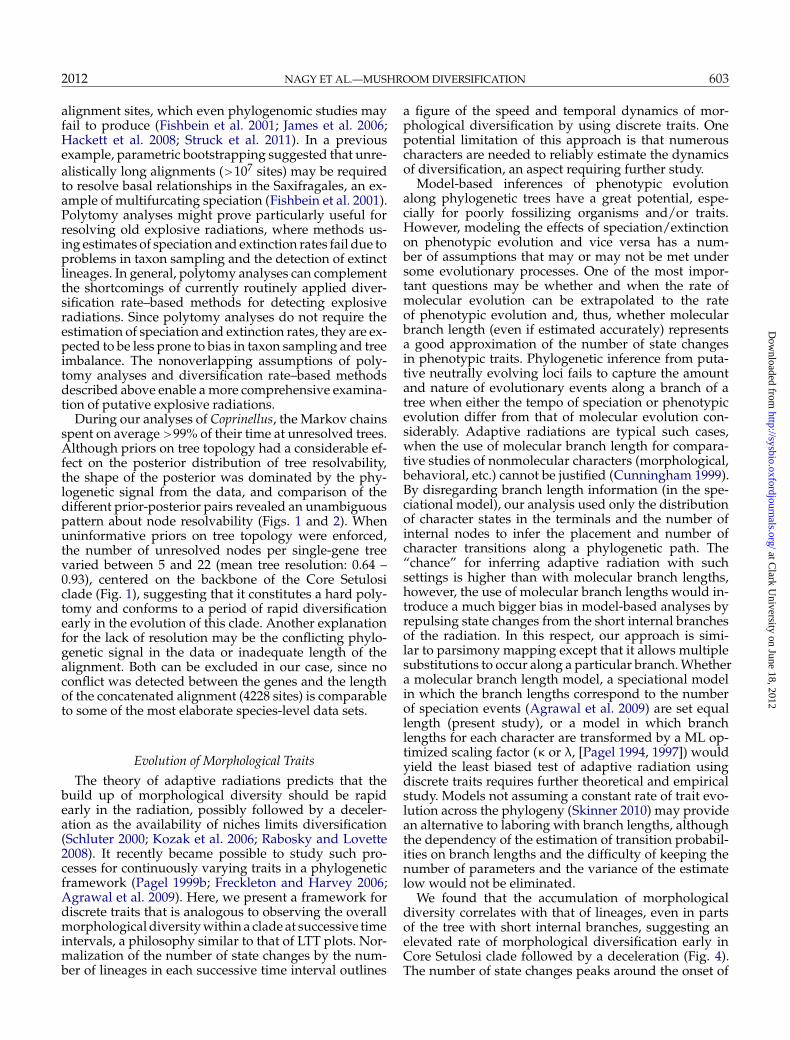
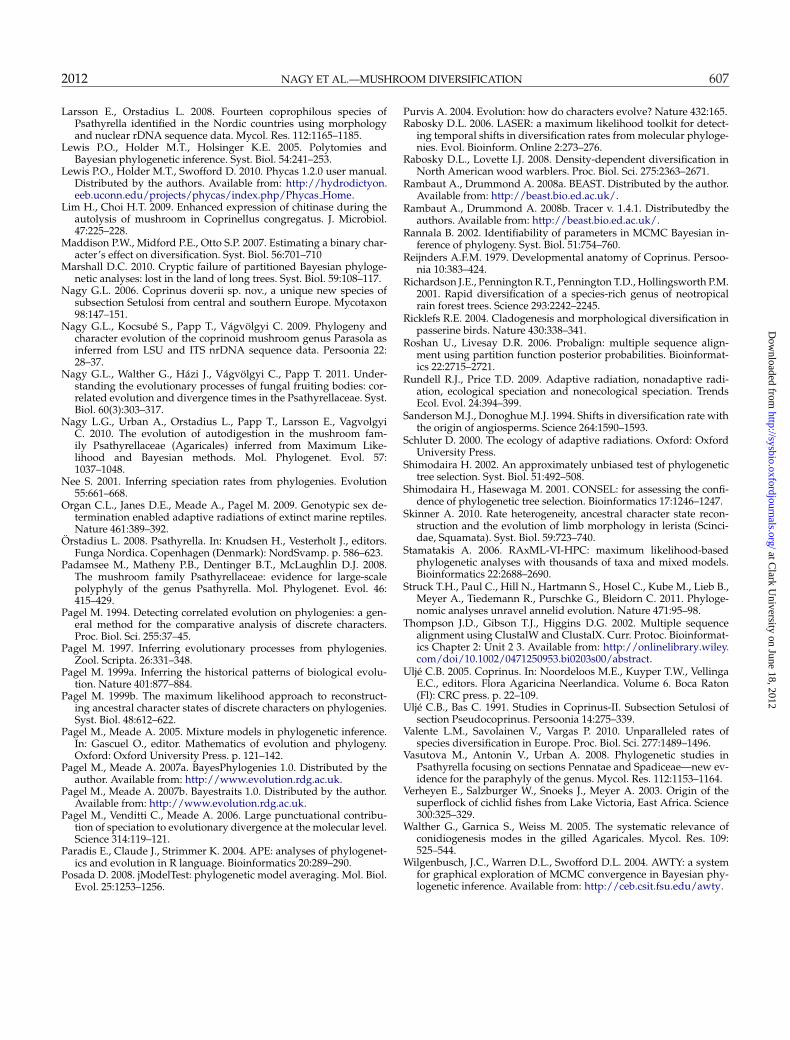
FIGURE 4. Hairs on the cap surface of Coprinellus pellucidus. Hairsevolve by elongation of the apical region of cap cells (visible as thebackground of hair coverage), whereas veil structures of other Co-prinellus species is composed of many layers of spherical cells that dif-ferentiate from the underlying cap tissues. The scale bar is 200 μm forthe right image.
the radiation, suggesting a “rapid-early” morphologicaldiversification for the Core Setulosi clade. This observa-tion underpins one of the central theoretical predictionsof adaptive radiations, that is, a high rate of trait changeearly in the history of the clade followed by a slowdownas the number of available niches decrease (Schluter2000; Purvis 2004; Agrawal et al. 2009).
Are There Morphological Traits Correlated withDiversification?
The Core Setulosi clade shares many life historytraits with the rest of the family, such as autodiges-tive fruiting bodies, habitat preferences, and geographic
distribution. Therefore, ecological or dispersal eventsalone cannot explain the observed differences in diver-sity. Key innovation hypotheses have been proposed asan explanation of changes in speciation rates in responseto the emergence of traits relaxing certain constraints ondiversification. Therefore, we looked for traits that showa correlation with the shift in diversification rate. Oneof the most spectacular traits that may affect the di-versification capacity of Coprinellus species are velarstructures (online Fig. 4/p-s), which cover the youngfruiting bodies of several fungal groups and displaysubstantial morphological diversity in the Psathyrel-laceae. Velar structures are widespread and conservedin Agaricomycete fungi and take several forms, includ-ing volvae or patches of Amanita species and ring orcollar-like structures. All veil structures serve to protectimmature fruiting bodies and spore-bearing surfacesand are known in the majority of agaric families. Hairs(also called pilocystidia, specialized elongate cells of thecap tissue, Fig. 4, online Fig. 4) represent another type ofcap covering structure found only in Coprinellus, wherethe Core Setulosi clade contains >90% of haired species.Ancestral state reconstructions show that there is a re-ciprocal relationship between the presence of veil andhairs, that is, the veil in Coprinellus species with hairs isreduced or absent (Table 2). Both structures serve to pro-tect fruiting bodies from mycophagous insects and/ormoisture. Comparisons of unidirectional models of traitevolution with bidirectional, equal rates, and unequalrates models suggest that evolving hairs is the preferredway for Coprinellus species (Tables 2 and 3), whereas thebest-fit model for the veil implies that gains are impos-sible and that veil coverage has been lost in Coprinellus(2 (ln L1 − ln L0) = 4.87 − 18.62). Branches along whichreduction of the veil may have taken place are close toor identical to those which gave rise to hairs (Table 3),suggesting that hairs took over the defense function ofvelar structures. During the ontogeny of the mushroom,development of hairs via elongation of the apical partof the cap cells does not require differentiation of highlyspecific layers of the cap as the veil does (Reijnders
TABLE 2. Comparison of models of traits evolution for putative key innovations under speciational and gradual modes of evolution
Presence of macroscopically Habitat coprophilous Presence of hairs on thevisible veil (lnL) (lnL) cap surface (lnL)
Speciational (k) modeUnconstrained model −78,619 −275, 307 −133, 669Constrained model q01 = q10 −99, 054 −278, 032 −16, 278a
Constrained model q01 = 0 −78,619 −337, 254a −170, 747a
Constrained model q10 = 0 −171, 726a −276, 284 −133,668
Gradual modeUnconstrained model −80, 288 −267, 523 −134, 071Constrained model q01 = q10 −112, 152a −273, 625 −170, 205a
Constrained model q01 = 0 −80,288 −302, 614a −175, 645a
Constrained model q10 = 0 −177, 481a −271, 186 −134,071
Notes: The likelihoods reported are means of lnL values obtained for 100 phylogenies. The models containing the fewest parameters not rejectedby the hypothesis test [2(lnL1− lnL0) < 2.00, where L1 is the unconstrained model and L0 is the alternative, constrained model] are shown inbold.aDenotes that the model yields significantly worse [2(lnL1− lnL0) > 2.00] likelihood values than the unconstrained model. q01 stands for therate of gain of veil, coprophyly and hairs, q10 stands for rates of loss.
604
at Clark U
niversity on June 18, 2012http://sysbio.oxfordjournals.org/
Dow
nloaded from
2012 NAGY ET AL.—MUSHROOM DIVERSIFICATION
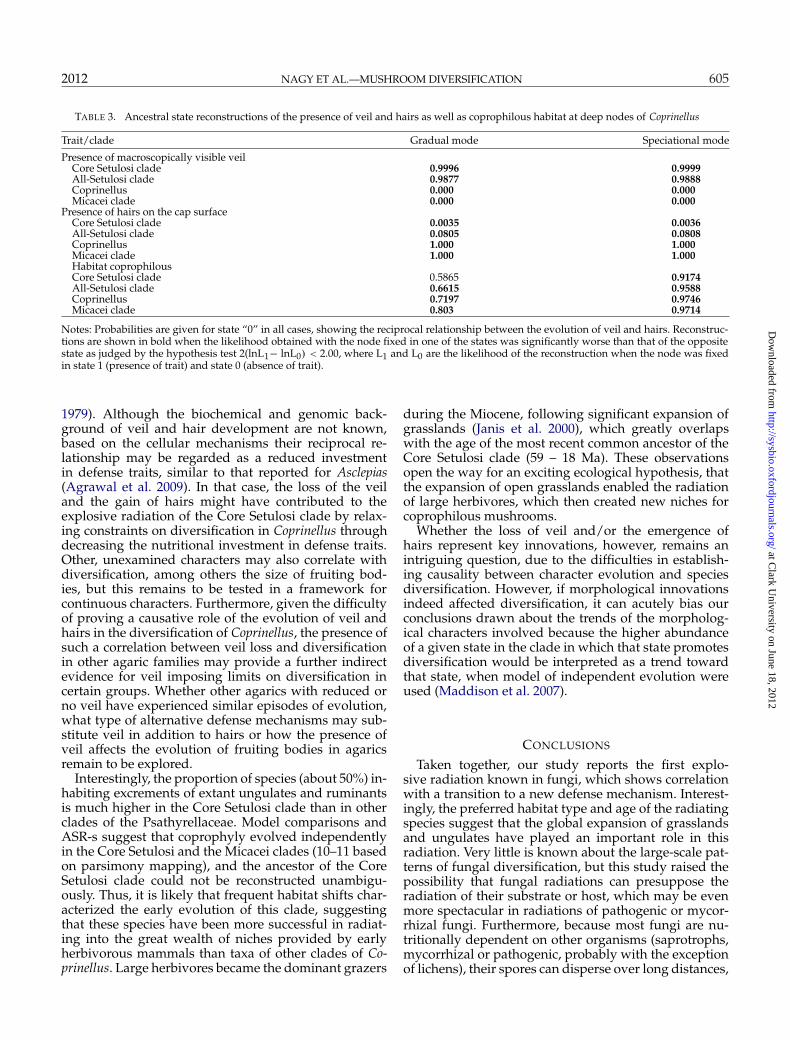
TABLE 3. Ancestral state reconstructions of the presence of veil and hairs as well as coprophilous habitat at deep nodes of Coprinellus
Trait/clade Gradual mode Speciational mode
Presence of macroscopically visible veilCore Setulosi clade 0.9996 0.9999All-Setulosi clade 0.9877 0.9888Coprinellus 0.000 0.000Micacei clade 0.000 0.000
Presence of hairs on the cap surfaceCore Setulosi clade 0.0035 0.0036All-Setulosi clade 0.0805 0.0808Coprinellus 1.000 1.000Micacei clade 1.000 1.000Habitat coprophilousCore Setulosi clade 0.5865 0.9174All-Setulosi clade 0.6615 0.9588Coprinellus 0.7197 0.9746Micacei clade 0.803 0.9714
Notes: Probabilities are given for state “0” in all cases, showing the reciprocal relationship between the evolution of veil and hairs. Reconstruc-tions are shown in bold when the likelihood obtained with the node fixed in one of the states was significantly worse than that of the oppositestate as judged by the hypothesis test 2(lnL1− lnL0) < 2.00, where L1 and L0 are the likelihood of the reconstruction when the node was fixedin state 1 (presence of trait) and state 0 (absence of trait).
1979). Although the biochemical and genomic back-ground of veil and hair development are not known,based on the cellular mechanisms their reciprocal re-lationship may be regarded as a reduced investmentin defense traits, similar to that reported for Asclepias(Agrawal et al. 2009). In that case, the loss of the veiland the gain of hairs might have contributed to theexplosive radiation of the Core Setulosi clade by relax-ing constraints on diversification in Coprinellus throughdecreasing the nutritional investment in defense traits.Other, unexamined characters may also correlate withdiversification, among others the size of fruiting bod-ies, but this remains to be tested in a framework forcontinuous characters. Furthermore, given the difficultyof proving a causative role of the evolution of veil andhairs in the diversification of Coprinellus, the presence ofsuch a correlation between veil loss and diversificationin other agaric families may provide a further indirectevidence for veil imposing limits on diversification incertain groups. Whether other agarics with reduced orno veil have experienced similar episodes of evolution,what type of alternative defense mechanisms may sub-stitute veil in addition to hairs or how the presence ofveil affects the evolution of fruiting bodies in agaricsremain to be explored.
Interestingly, the proportion of species (about 50%) in-habiting excrements of extant ungulates and ruminantsis much higher in the Core Setulosi clade than in otherclades of the Psathyrellaceae. Model comparisons andASR-s suggest that coprophyly evolved independentlyin the Core Setulosi and the Micacei clades (10–11 basedon parsimony mapping), and the ancestor of the CoreSetulosi clade could not be reconstructed unambigu-ously. Thus, it is likely that frequent habitat shifts char-acterized the early evolution of this clade, suggestingthat these species have been more successful in radiat-ing into the great wealth of niches provided by earlyherbivorous mammals than taxa of other clades of Co-prinellus. Large herbivores became the dominant grazers
during the Miocene, following significant expansion ofgrasslands (Janis et al. 2000), which greatly overlapswith the age of the most recent common ancestor of theCore Setulosi clade (59 – 18 Ma). These observationsopen the way for an exciting ecological hypothesis, thatthe expansion of open grasslands enabled the radiationof large herbivores, which then created new niches forcoprophilous mushrooms.
Whether the loss of veil and/or the emergence ofhairs represent key innovations, however, remains anintriguing question, due to the difficulties in establish-ing causality between character evolution and speciesdiversification. However, if morphological innovationsindeed affected diversification, it can acutely bias ourconclusions drawn about the trends of the morpholog-ical characters involved because the higher abundanceof a given state in the clade in which that state promotesdiversification would be interpreted as a trend towardthat state, when model of independent evolution wereused (Maddison et al. 2007).
CONCLUSIONS
Taken together, our study reports the first explo-sive radiation known in fungi, which shows correlationwith a transition to a new defense mechanism. Interest-ingly, the preferred habitat type and age of the radiatingspecies suggest that the global expansion of grasslandsand ungulates have played an important role in thisradiation. Very little is known about the large-scale pat-terns of fungal diversification, but this study raised thepossibility that fungal radiations can presuppose theradiation of their substrate or host, which may be evenmore spectacular in radiations of pathogenic or mycor-rhizal fungi. Furthermore, because most fungi are nu-tritionally dependent on other organisms (saprotrophs,mycorrhizal or pathogenic, probably with the exceptionof lichens), their spores can disperse over long distances,
605
at Clark U
niversity on June 18, 2012http://sysbio.oxfordjournals.org/
Dow
nloaded from

SYSTEMATIC BIOLOGY VOL. 61
and to our best knowledge, their distribution is rarely asstructured as that of plants and animals, thus are rarelyendemisms and—according to the dominant view—speciate mainly sympatrically (Giraud et al. 2008), itfollows that explosive fungal radiations are less likelyto fill geographically isolated habitats (such as islands)but more often dependent on the evolution of otherorganisms and/or intrinsic evolutionary innovations.
SUPPLEMENTARY MATERIAL
FUNDING
This work was supported by the Fungal ResearchTrust (to L.G.N.) and the Hungarian Research Fund(NN75255 to T.P.).
ACKNOWLEDGMENTS
We thank Luke Harmon for providing R code for thediversification analyses, Leif Orstadius, Jan Cervenka,Derek Schafer, Tommy Knuttson for loaning materials,and Paul O. Lewis, Gabor M. Kovacs and Zsolt Penzesfor discussions on polytomy analyses.
REFERENCES
Adams D.C., Berns C.M., Kozak K.H., Wiens J.J. 2009. Are rates ofspecies diversification correlated with rates of morphological evo-lution? Proc. Biol. Sci. 276:2729–2738.
Agrawal A.A., Fishbein M., Halitschke R., Hastings A.P., RaboskyD.L., Rasmann S. 2009. Evidence for adaptive radiation from aphylogenetic study of plant defenses. Proc. Natl Acad. Sci. U.S.A.106:18067–18072.
Alfaro M.E., Santini F., Brock C., Alamillo H., Dornburg A., RaboskyD.L., Carnevale G., Harmon L.J. 2009. Nine exceptional radiationsplus high turnover explain species diversity in jawed vertebrates.Proc. Natl Acad. Sci. U.S.A. 106:13410–13414.
Bollback J.P. 2006. SIMMAP: stochastic character mapping of discretetraits on phylogenies. BMC Bioinformatics 7:88.
Brown J.M., Hedtke S.M., Lemmon A.R., Lemmon E.M. 2010. Whentrees grow too long: investigating the causes of highly inaccurateBayesian branch-length estimates. Syst. Biol. 59:145–161.
Cunningham C.W. 1999. Some limitations of ancestral character-statereconstruction when testing evolutionary hypotheses. Syst. Biol.48:665–674.
de Queiroz K. 2002. Contingent predictability in evolution: key traitsand diversification. Syst. Biol. 51:917–929.
Donoghue M.J. 2005. Key innovations, convergence, and success:macroevolutionary lessons from plant phylogeny. Paleobiology31:77–93.
Doveri F., Sarrocco S., Pecchia S., Forti M., Vannacci G. 2010. Co-prinellus mitrinodulisporus, a new species from chamois dung.Mycotaxon 114:351–360.
Egan A.N., Crandall K.A. 2008. Divergence and diversification inNorth American Psoraleeae (Fabaceae) due to climate change. BMCBiol. 6:55.
Ekman S., Andersen H.L., Wedin M. 2008. The limitations of an-cestral state reconstruction and the evolution of the ascus in theLecanorales (lichenized Ascomycota). Syst. Biol. 57:141–156.
Freckleton R.P., Harvey P.H. 2006. Detecting non-brownian trait evo-lution in adaptive radiations. PLoS Biol. 4:e373.
Fishbein M., Hibsch-Jetter K., Soltis D.E., Hufford L 2001. Phylogenyof the Saxifragales (Angiosperms, Eudicots): an example of rapid,ancient radiation. Syst. Biol. 50:817–847.
Giraud T., Refregier G., Le Gac M., de Vienne D.M., Hood M.E. 2008.Speciation in fungi. Fungal Genet. Biol. 45:791–802.
Hackett S.J., Kimball R.T., Reddy S., Bowie R.C., Braun E.L.,Braun M.J., Chojnowski J.L., Cox W.A., Han K.L., HarshmanJ., Huddleston C.J., Marks B.D., Miglia K.J., Moore W.S., Shel-don F.H., Steadman D.W., Witt C.C., Yuri T. 2008. A phyloge-nomic study of birds reveals their evolutionary history. Science320:1763–1768.
Harmon L.J., Schulte J.A. 2nd, Larson A., Losos J.B. 2003. Tempoand mode of evolutionary radiation in iguanian lizards. Science301:961–964.
Harmon L.J., Weir J.T., Brock C.D., Glor R.E., Challenger W. 2008.GEIGER: investigating evolutionary radiations. Bioinformatics24:129–131.
Hazi J., Nagy G.L., Vagvolgyi C., Papp T. 2011. Coprinellus radicellus,a new species northern distribution. Mycol. Prog. 10:363–371.
Heckman D.S., Geiser D.M., Eidell B.R., Stauffer R.L., Kardos N.L.,Hedges S.B. 2001. Molecular evidence for the early colonization ofland by fungi and plants. Science 293:1129–1133.
Hodges S.A., Arnold M.L. 1995. Spurring plant diversification: are flo-ral nectar spurs a key innovation? Proc. Biol. Sci. 262:343–348.
Hopple J.S. Jr., Vilgalys R. 1999. Phylogenetic relationships in themushroom genus Coprinus and dark-spored allies based on se-quence data from the nuclear gene coding for the large ribosomalsubunit RNA: divergent domains, outgroups, and monophyly. Mol.Phylogenet. Evol. 13:1–19.
Hunter J.P. 1998. Key innovations and the ecology of macroevolution.Trends Ecol. Evol. 13:31–36.
Hunter J.P., Jernvall J. 1995. The hypocone as a key innovation in mam-malian evolution. Proc. Natl Acad. Sci. U.S.A. 92:10718–10722.
Jackman T.R., Larson A., de Queiroz K., Losos J.B. 1999. Phylogeneticrelationships and tempo of early diversification in Anolis lizards.Syst. Biol. 48:254–285.
James T.Y., Kauff F., Schoch C.L., Matheny P.B., Hofstetter V., Cox C.J.,Celio G., Gueidan C., Fraker E., Miadlikowska J., Lumbsch H.T.,Rauhut A., Reeb V., Arnold A.E., Amtoft A., Stajich J.E., HosakaK., Sung G.H., Johnson D., O’Rourke B., Crockett M., Binder M.,Curtis J.M., Slot J.C., Wang Z., Wilson A.W., Schussler A., Long-core J.E., O’Donnell K., Mozley-Standridge S., Porter D., LetcherP.M., Powell M.J., Taylor J.W., White M.M., Griffith G.W., DaviesD.R., Humber R.A., Morton J.B., Sugiyama J., Rossman A.Y., RogersJ.D., Pfister D.H., Hewitt D., Hansen K., Hambleton S., ShoemakerR.A., Kohlmeyer J., Volkmann-Kohlmeyer B., Spotts R.A., SerdaniM., Crous P.W., Hughes K.W., Matsuura K., Langer E., Langer G.,Untereiner W.A., Lucking R., Budel B., Geiser D.M., Aptroot A.,Diederich P., Schmitt I., Schultz M., Yahr R., Hibbett D.S., LutzoniF., McLaughlin D.J., Spatafora J.W., Vilgalys R. 2006. Reconstruct-ing the early evolution of Fungi using a six-gene phylogeny. Nature443:818–822.
Janis C.M., Damuth J., Theodor J.M. 2000. Miocene ungulates and ter-restrial primary productivity: where have all the browsers gone?Proc. Natl Acad. Sci. U.S.A. 97:7899–7904.
Joyce D.A., Lunt D.H., Bills R., Turner G.F., Katongo C., Duftner N.,Sturmbauer C., Seehausen O. 2005. An extant cichlid fish radiationemerged in an extinct Pleistocene lake. Nature 435:90–95.
Keirle M.R., Hemmes D.E., Desjardin D.E. 2004. Agaricales of theHawaiian Islands 8: Agaricaceae: Coprinus and Podaxis, Psathyrel-laceae: Coprinellus, Coprinopsis and Parasola. Fung. Div. 15:33–124.
Klak C., Reeves G., Hedderson T. 2004. Unmatched tempo of evolutionin Southern African semi-desert ice plants. Nature 427:63–65.
Kozak K.H., Weisrock D.W., Larson A. 2006. Rapid lineage accumu-lation in a non-adaptive radiation: phylogenetic analysis of diver-sification rates in eastern North American woodland salamanders(Plethodontidae: Plethodon). Proc. Biol. Sci. 273:539–546.
Lanfear R., Ho S.Y., Love D., Bromham L. 2011. Mutation rate islinked to diversification in birds. Proc. Natl Acad. Sci. U.S.A. 107:20423–20428.
606
Supplementary material, including data files and/oronline-only appendices, can be found in the Dryad datarepository (doi:10.5061/dryad.665vv1c7).
at Clark U
niversity on June 18, 2012http://sysbio.oxfordjournals.org/
Dow
nloaded from
2012 NAGY ET AL.—MUSHROOM DIVERSIFICATION
Larsson E., Orstadius L. 2008. Fourteen coprophilous species ofPsathyrella identified in the Nordic countries using morphologyand nuclear rDNA sequence data. Mycol. Res. 112:1165–1185.
Lewis P.O., Holder M.T., Holsinger K.E. 2005. Polytomies andBayesian phylogenetic inference. Syst. Biol. 54:241–253.
Lewis P.O., Holder M.T., Swofford D. 2010. Phycas 1.2.0 user manual.Distributed by the authors. Available from: http://hydrodictyon.eeb.uconn.edu/projects/phycas/index.php/Phycas Home.
Lim H., Choi H.T. 2009. Enhanced expression of chitinase during theautolysis of mushroom in Coprinellus congregatus. J. Microbiol.47:225–228.
Maddison P.W., Midford P.E., Otto S.P. 2007. Estimating a binary char-acter’s effect on diversification. Syst. Biol. 56:701–710
Marshall D.C. 2010. Cryptic failure of partitioned Bayesian phyloge-netic analyses: lost in the land of long trees. Syst. Biol. 59:108–117.
Nagy G.L. 2006. Coprinus doverii sp. nov., a unique new species ofsubsection Setulosi from central and southern Europe. Mycotaxon98:147–151.
Nagy G.L., Kocsube S., Papp T., Vagvolgyi C. 2009. Phylogeny andcharacter evolution of the coprinoid mushroom genus Parasola asinferred from LSU and ITS nrDNA sequence data. Persoonia 22:28–37.
Nagy G.L., Walther G., Hazi J., Vagvolgyi C., Papp T. 2011. Under-standing the evolutionary processes of fungal fruiting bodies: cor-related evolution and divergence times in the Psathyrellaceae. Syst.Biol. 60(3):303–317.
Nagy L.G., Urban A., Orstadius L., Papp T., Larsson E., VagvolgyiC. 2010. The evolution of autodigestion in the mushroom fam-ily Psathyrellaceae (Agaricales) inferred from Maximum Like-lihood and Bayesian methods. Mol. Phylogenet. Evol. 57:1037–1048.
Nee S. 2001. Inferring speciation rates from phylogenies. Evolution55:661–668.
Organ C.L., Janes D.E., Meade A., Pagel M. 2009. Genotypic sex de-termination enabled adaptive radiations of extinct marine reptiles.Nature 461:389–392.
Orstadius L. 2008. Psathyrella. In: Knudsen H., Vesterholt J., editors.Funga Nordica. Copenhagen (Denmark): NordSvamp. p. 586–623.
Padamsee M., Matheny P.B., Dentinger B.T., McLaughlin D.J. 2008.The mushroom family Psathyrellaceae: evidence for large-scalepolyphyly of the genus Psathyrella. Mol. Phylogenet. Evol. 46:415–429.
Pagel M. 1994. Detecting correlated evolution on phylogenies: a gen-eral method for the comparative analysis of discrete characters.Proc. Biol. Sci. 255:37–45.
Pagel M. 1997. Inferring evolutionary processes from phylogenies.Zool. Scripta. 26:331–348.
Pagel M. 1999a. Inferring the historical patterns of biological evolu-tion. Nature 401:877–884.
Pagel M. 1999b. The maximum likelihood approach to reconstruct-ing ancestral character states of discrete characters on phylogenies.Syst. Biol. 48:612–622.
Pagel M., Meade A. 2005. Mixture models in phylogenetic inference.In: Gascuel O., editor. Mathematics of evolution and phylogeny.Oxford: Oxford University Press. p. 121–142.
Pagel M., Meade A. 2007a. BayesPhylogenies 1.0. Distributed by theauthor. Available from: http://www.evolution.rdg.ac.uk.
Pagel M., Meade A. 2007b. Bayestraits 1.0. Distributed by the author.Available from: http://www.evolution.rdg.ac.uk.
Pagel M., Venditti C., Meade A. 2006. Large punctuational contribu-tion of speciation to evolutionary divergence at the molecular level.Science 314:119–121.
Paradis E., Claude J., Strimmer K. 2004. APE: analyses of phylogenet-ics and evolution in R language. Bioinformatics 20:289–290.
Posada D. 2008. jModelTest: phylogenetic model averaging. Mol. Biol.Evol. 25:1253–1256.
Purvis A. 2004. Evolution: how do characters evolve? Nature 432:165.Rabosky D.L. 2006. LASER: a maximum likelihood toolkit for detect-
ing temporal shifts in diversification rates from molecular phyloge-nies. Evol. Bioinform. Online 2:273–276.
Rabosky D.L., Lovette I.J. 2008. Density-dependent diversification inNorth American wood warblers. Proc. Biol. Sci. 275:2363–2671.
Rambaut A., Drummond A. 2008a. BEAST. Distributed by the author.Available from: http://beast.bio.ed.ac.uk/.
Rambaut A., Drummond A. 2008b. Tracer v. 1.4.1. Distributedby theauthors. Available from: http://beast.bio.ed.ac.uk/.
Rannala B. 2002. Identifiability of parameters in MCMC Bayesian in-ference of phylogeny. Syst. Biol. 51:754–760.
Reijnders A.F.M. 1979. Developmental anatomy of Coprinus. Persoo-nia 10:383–424.
Richardson J.E., Pennington R.T., Pennington T.D., Hollingsworth P.M.2001. Rapid diversification of a species-rich genus of neotropicalrain forest trees. Science 293:2242–2245.
Ricklefs R.E. 2004. Cladogenesis and morphological diversification inpasserine birds. Nature 430:338–341.
Roshan U., Livesay D.R. 2006. Probalign: multiple sequence align-ment using partition function posterior probabilities. Bioinformat-ics 22:2715–2721.
Rundell R.J., Price T.D. 2009. Adaptive radiation, nonadaptive radi-ation, ecological speciation and nonecological speciation. TrendsEcol. Evol. 24:394–399.
Sanderson M.J., Donoghue M.J. 1994. Shifts in diversification rate withthe origin of angiosperms. Science 264:1590–1593.
Schluter D. 2000. The ecology of adaptive radiations. Oxford: OxfordUniversity Press.
Shimodaira H. 2002. An approximately unbiased test of phylogenetictree selection. Syst. Biol. 51:492–508.
Shimodaira H., Hasewaga M. 2001. CONSEL: for assessing the confi-dence of phylogenetic tree selection. Bioinformatics 17:1246–1247.
Skinner A. 2010. Rate heterogeneity, ancestral character state recon-struction and the evolution of limb morphology in lerista (Scinci-dae, Squamata). Syst. Biol. 59:723–740.
Stamatakis A. 2006. RAxML-VI-HPC: maximum likelihood-basedphylogenetic analyses with thousands of taxa and mixed models.Bioinformatics 22:2688–2690.
Struck T.H., Paul C., Hill N., Hartmann S., Hosel C., Kube M., Lieb B.,Meyer A., Tiedemann R., Purschke G., Bleidorn C. 2011. Phyloge-nomic analyses unravel annelid evolution. Nature 471:95–98.
Thompson J.D., Gibson T.J., Higgins D.G. 2002. Multiple sequencealignment using ClustalW and ClustalX. Curr. Protoc. Bioinformat-ics Chapter 2: Unit 2 3. Available from: http://onlinelibrary.wiley.com/doi/10.1002/0471250953.bi0203s00/abstract.
Ulje C.B. 2005. Coprinus. In: Noordeloos M.E., Kuyper T.W., VellingaE.C., editors. Flora Agaricina Neerlandica. Volume 6. Boca Raton(Fl): CRC press. p. 22–109.
Ulje C.B., Bas C. 1991. Studies in Coprinus-II. Subsection Setulosi ofsection Pseudocoprinus. Persoonia 14:275–339.
Valente L.M., Savolainen V., Vargas P. 2010. Unparalleled rates ofspecies diversification in Europe. Proc. Biol. Sci. 277:1489–1496.
Vasutova M., Antonin V., Urban A. 2008. Phylogenetic studies inPsathyrella focusing on sections Pennatae and Spadiceae—new ev-idence for the paraphyly of the genus. Mycol. Res. 112:1153–1164.
Verheyen E., Salzburger W., Snoeks J., Meyer A. 2003. Origin of thesuperflock of cichlid fishes from Lake Victoria, East Africa. Science300:325–329.
Walther G., Garnica S., Weiss M. 2005. The systematic relevance ofconidiogenesis modes in the gilled Agaricales. Mycol. Res. 109:525–544.
Wilgenbusch, J.C., Warren D.L., Swofford D.L. 2004. AWTY: a systemfor graphical exploration of MCMC convergence in Bayesian phy-logenetic inference. Available from: http://ceb.csit.fsu.edu/awty.
607
at Clark U
niversity on June 18, 2012http://sysbio.oxfordjournals.org/
Dow
nloaded from