Embed Size (px)
Citation preview

Paper prepared for the Conference on “Promoting Resilience through Social Protection in Sub-Saharan Africa”, organised by the European Report of Development in Dakar, Senegal, 28-30 June, 2010.
Mobilising EuropEan rEsEarch For DEvElopMEnt policiEs
ThE EvoluTion AnD imPACT of SoCiAl SECuRiTy in SouTh AfRiCA Ingrid Woolard, Southern Africa Labour and Development Research Unit, University of Cape TownKenneth Harttgen, University of GöttingenStephan Klasen, University of Göttingen
2
The views expressed in this paper are those of the authors, and should not be taken to be the views of the European Report on Development, of the European Commission or of the European Union Member States.
2
SouThERn AfRiCA lAbouR AnD DEvEloPmEnT RESEARCh uniT, univERSiTy of CAPE Town
AbstrActThe current economic downturn and the sharp increase in social assistance expenditure in recent years has shown the importance of the social security system of South Africa in order to alleviate poverty and to prevent people from falling into poverty. These size, shape and design aspects of the social assistance system make South Africa an interesting case study, and the objective of this paper is to provide a detailed examination of the South African case. Are cash transfers well-targeted and re-distributive? Do we know if they enhance human capital accumulation? Are they fiscally sustainable? Have changes in social policy been evidence-based or rights based? After a description of the historical background and the evolution of the social assistance system of South Africa, we provide an analysis of the impact on poverty, and review the impacts on micro-outcomes, such as health, education and labour supply. We find that the South African social assistance is a very effective policy instrument to fight poverty and to improve education and health, especially of children living in poor households. Such impacts are crucial for longer-run poverty alleviation. We also have a closer look at the costs of the social assistance system in South Africa and its fiscal sustainability, which has also important implications for other countries in sub-Saharan Africa which are considering implementing a social assistance system.
Acknowledgements: this paper greatly benefited from discussions with, and comments from, Mahmood Messkoub, Giorgia Giovanetti, and participants at the ERD Meeting Promoting Resilience through Social Protection in sub-Saharan Africa held in Dakar 2010. Funding from the EU via the ERD is gratefully acknowledged.
ingrid woolard Southern Africa Labour and Development Research Unit, University of Cape Town [email protected]
Kenneth harttgen University of Göttingen [email protected]
Stephan Klasen University of Göttingen [email protected]
THE EVOLUTION AND IMPACT OF SOCIAL SECURITY IN SOUTH AFRICA
3
1. Introduction Although improvements have been made, levels of poverty are still high in South Africa, while varying across the provinces. On average, around one fourth of the population in South Africa lives with less than 1.25 USD PPP per day. In 2009, UNDP reported a Human Development Index (HDI) value of 0.68 for South Africa, which ranks the country as number 129 of 182 countries for which the HDI was published; much of this is due to the large impact of the AIDS pandemic on life expectancy, but even without this, education and health indicators are relatively poor. Besides the persistently high level of the poverty rate, South Africa is among the countries with the highest income inequalities in the world. In 2007, the Gini co-efficient was 57.8 (UNDP 2009). In addition, South Africa suffers from persistently high rates of unemployment, which are above 20% or even around 30%, depending on the unemployment definition.
A social security system provides an important safety-net for the long-term poor population and for the mitigation of economic shocks. Social grants can provide transfers for the most vulnerable population groups, such as the elderly, the disabled, and children, while forms of social insurance such as unemployment benefit provide support to workers who lost their jobs. Non-contributory cash transfers, in particular, are an important income support for poor households. At the time of the transition to democracy in 1994, the South African social security system was already notably well developed for a middle-income country (Lund 1993; van der Berg 1997; Case & Deaton 1998). This fact can be ascribed to the way that the system developed under apartheid as a welfare state for whites and was then expanded under social and political pressure to incorporate other groups (van der Berg 1997). Since Post-apartheid, the system has expanded markedly, with a large increase in the take-up of disability grants and the roll-out of child support grants to the care-givers of about three-fifths of children. Most of these policies are implemented through unconditional cash transfers. The phase of recession in the past years has shown the importance of the social security system of South Africa, because it has increased the number of unemployed people, thereby reducing household income for many South Africans. There has been also an increase in the number of people claiming social grants.
The importance of social cash transfers (conditional and unconditional) in South Africa are, by way of exception, compared to other African countries (Lund 2001, van der Berg 1997, Case and Deaton 1997). Since the time of apartheid, South Africa has established a substantial social security system with wide coverage of the South African population. The Social Assistance Act of 1992 extended the social security measures to all South African citizens. The social security system in South Africa has two main objectives. The first objective is to reduce poverty among people vulnerable to low-income, such as the elderly, children, and people with disabilities who cannot participate fully in the labour market. The second objective is to increase investments in health, nutrition, and education, in order to increase human capital to accelerate economic growth and development. Other objectives are social security to prevent destitution in the face of shocks, social compensation and re-distribution (Republic of South Africa 1997).
Many South Africans cannot afford voluntary contributions to medical schemes and/or retirement funds, especially at the lower end of the income distribution, which results in an incomplete coverage. Hence, social cash transfers, both conditional as well as unconditional, have become an important strategy for reducing poverty and promoting social development. However, there exist many challenges in establishing social assistance transfers in sub-Saharan African countries. For example, first, there is fear that social cash transfers could lead to a decline in labour force participation. Second, there is fear that social assistance transfers could crowd out public investment in infrastructure, such as free provision of primary and secondary education and primary health care. Third, the fiscal sustainability of social transfer programmes requires strong political commitment and the potential of re-distribution of public spending.

THE EVOLUTION AND IMPACT OF SOCIAL SECURITY IN SOUTH AFRICA
4
These size, shape and design aspects of the social assistance system make South Africa an interesting case study, and the objective of this paper is to provide a detailed examination of the South African case. Are cash transfers well-targeted and re-distributive? Do we know if they enhance human capital accumulation? Are they fiscally sustainable? Have changes in social policy been evidence-based or rights based?
The rest of the paper is organised as follows. Section 2 provides a descriptive overview of the social security system of South Africa, focusing on non-contributory social grants schemes. Section 3 provides a review of the impact of the social grants system of South Africa on poverty, education, health, nutrition, inequality, and the labour market. Section 4 analyses the fiscal costs of the South African social security system and discusses its main problems. In Section 5, we discuss what can be learnt from the South African social security system for other sub-Saharan African countries when implementing a nationwide social security system with a focus on the fiscal affordability. Finally, Section 6 concludes.
2. Social Security in South Africa
2.1 Social security, social assistance and social insurances
There are two separate aspects of social security: the insurance concept (social insurance) and the re-distribution concept (social assistance). The social insurance prong of South Africa’s social security system is far smaller than the social assistance prong. The insurance concept focuses on insuring workers against the risk of income loss. Most programmes based upon this concept are financed through premiums, and benefits depend on contributions. In addition to this central question of whether to focus on social insurance or social assistance, there are a large number of design issues which affect both systems. with regard to social insurance, critical questions are whether membership and contributions are voluntary or mandatory, whether there are public subsidies to these systems and who benefits from them, and how broad their coverage of risks are. With regard to social assistance, critical design questions are whether they are conditional or unconditional, cash or in-kind, and whether they are universal or targeted.
While discussing these design issues in this paper, we mainly focus on the social assistance programmes in order to ensure that our discussion is located within a complete picture of the social security system. Social grants are an important instrument for social assistance within the overall social protection framework. Unlike conditional cash transfers, social grants are typically not tied to a specific conditionality in order to receive the transfers. Social grants do not only provide households with income transfers, they can also support second-order effects that further accelerate the reduction of poverty. In particular, households that receive social grants might be more likely to send young children to school, provide better nutrition for children, and look for work more intensively, extensively and successfully than workers in comparable households that do not receive social grants. It is shown below that social grants programmes can be effectively targeted and can be one of the most pro-poor forms of government expenditure.
Figure 1 below shows the basic architecture of South Africa’s social security system. Five major social assistance grants exist in South Africa: the Child Support Grant (CS), the State Old Age Pensions (SOAP), the Disability Grant (DG), the Foster Child Grant (FCG), and the Care Dependency Grant (CDG). The eligibility for each grant is dependent on an income-based means test. The South African Social Security Agency (SASSA) is responsible for the implementation of the social grants in South Africa.1 The
1 The South African Social Security Agency (SASSA) is monitored and evaluated by the National Department for Social Development (DSD).

THE EVOLUTION AND IMPACT OF SOCIAL SECURITY IN SOUTH AFRICA
5
government is also responsible for three primary social insurance mechanisms: the Unemployment Insurance Fund (UIF), the Compensation Funds, and the Road Accident Fund. The state of South Africa is also responsible for the regulation of voluntary funds: in particular, the state regulates voluntary insurance schemes, such as medical schemes and retirement funds (Republic of South Africa 2010).
Figure 1: Social security in South Africa
Source: Republic of South Africa (2010).
Let us briefly describe the various instruments: the Compensation Funds provide medical care and income benefits to workers who are injured while at work, or who develop occupational diseases. These are statutory funds for which membership and contribution is mandatory, but effectively restricted to the formal economy. The Compensation Funds also pay survivor-benefits to the families of workers that are fatally injured while working. While this covers occupational health, other aspects of health-care are dealt with differently: the South African population receives primary medical care either through the public health system or through contributory medical schemes which fund health services for members in the private (and sometimes also public) health-care sectors.2 Free primary health-care was extended to the whole population from 1 April 2006 (Harrison 2009). The Road Accident Fund provides compensation for the loss of earnings, loss of support, and compensation for general damages, and medical and funeral costs for the victims of road accidents caused by the negligent or wrongful driving of another motorist. We do not analyse these funds further as they provide very specific risk benefits that are not directly related to poverty alleviation.
For the purposes of this paper, the Unemployment Insurance Fund (UIF) is of much greater significance. The UIF provides short-term unemployment insurance, paying benefits in the event of unemployment, illness, maternity, the adoption of a child, and death. Benefits are only paid in the period immediately after the loss of employment with a maximum length of 238 days. All private-sector formal-sector workers and their employers must contribute a levy of 1 percent of their salary to the Unemployment Insurance Fund.
In addition to the UIF, South Africa has also established Public Work Programmes (PWP) in order to insure workers against income-losses due to unemployment. Public Work Programmes have been important interventions in developing countries for many years. Public Work Programmes are particularly effective at addressing the issue of vulnerability
2 Since 1994, South Africa has provided free health-care for pregnant women and children under the age of 6 in public health facilities.
Social Grants
Child Support Grant,
State Old Age Pension,
Disability, Foster Care,
Grant-In-Aid, War
Veterans, Care
Dependency
Statutory Funds
Unemployment Insurance
Fund
Compensation Funds
Road Accident Fund
Voluntary Funds
Medical Schemes
Retirement Funds
Government Tax Workers &
Employers
Road Users

THE EVOLUTION AND IMPACT OF SOCIAL SECURITY IN SOUTH AFRICA
6
to poverty and in crisis situations. They can significantly mitigate the effects of negative covariate and idiosyncratic shocks on poor households. Often, these programmes provide unskilled manual workers with short-term employment on projects such as road construction and maintenance, irrigation infrastructure, re-forestation, and soil conservation. Most jobs created by the PWP are government-funded infrastructure projects (for example, road building) or social projects (for example early Childhood Development (ECD) Programmes).3 In recent years, Public Work Programmes have been used in several countries (for example, Bangladesh, India, Ethiopia, Kenya, Zimbabwe, South Africa, Tanzania, and Ghana). As shown below, the public works programme in South Africa, even in its planned extended version, is quite limited in coverage, and thus plays a rather small role in the overall social protection system. Hence, Public Work Programmes should not be interpreted as a form of insurance against unemployment.
“Re-distribution” programmes, on the other hand, do not focus on workers alone and the key element is poverty relief. In South Africa, the term “social assistance grants” refers to non-contributory and income-tested benefits provided by the state to vulnerable groups such as the disabled, the elderly and children in poor households. Benefits are financed out of general tax revenues, and hence there is no link between contributions and benefits.
The major grant types in South Africa consist of the State Old Age Pension (for income-eligible persons over the age of 60), the Disability Grant (for income-eligible prime age adults that are temporarily or permanently unable to work because of poor heath or disability), the Child Support Grant (CSG), currently for children under 16, but being extended to the age of 18, who are residing with low-income care-givers and the Foster Care Grant (for children that have been placed with a foster parent by order of a court). By April 2010, 14 million people (out of a population of 49 million) were benefiting from social assistance grants. Of these, 2.5 million were receiving Old Age Pensions, 1.3 million were receiving Disability Grants, 9.4 million children were benefiting from Child Support Grants and 570,000 children were benefiting from Foster Care Grants. Most recipients of the CSG in South Africa use the form of direct collection of their grant, rather than through the banking system, even in urban areas. In rural areas, the main reason for direct collection is the limited access to the banking systems or the cost for travelling to the bank.4
The elderly in South Africa have two main sources of income: state old age pensions and private pensions. Many people are not able to save adequately for retirement and rely on the state old age pension fund. The aim of social pension transfers is twofold. First, they aim to reduce the risk of negative impact shocks in the short run and to provide an insurance mechanism. Second, they aim to provide a re-distribution instrument to reduce inequalities within countries.
The primary goal of the CSG is to ensure that the primary caregivers of children living in poverty are able to finance the health and education of their children. The CSG is the largest unconditional cash transfer programme in South Africa with regard to the number of beneficiaries. On average, the CSGs account for 40 percent of household income in the poorest quintile, and some 5% overall (see UNICEF 2008a and Figure 5 below).
3 It should be noted that the job opportunities created by the Public Work Programmes are short-term jobs.
4 UNICEF (2008a) has estimated that around 40 percent of households in South Africa have a banking account.
THE EVOLUTION AND IMPACT OF SOCIAL SECURITY IN SOUTH AFRICA
7
2.2. Historical background and evolution of the social security system
This section provides the historical context, which gave rise to the broad coverage of the young and the elderly while providing little direct support to prime age adults. Non-contributory social pensions were instituted in 1928 for the white and the coloured populations,5 who were not covered by occupational retirement insurance. Pensions were subject to both age criteria and a means test in order to ensure that only the poor were targeted. The white population dependent on social pensions remained relatively small despite an increasingly liberal means test, as occupational retirement insurance covered the majority of the white population. In 1943, take-up rates amongst the elderly were 40 percent for whites and 56 percent for coloureds (van der Berg 1997). By that year, only 4 percent of all social-assistance spending was on Africans and this consisted merely of targeted relief and pensions for the blind (van der Berg 1997).
In 1944, the (pre-apartheid) Smuts government extended social old-age pensions to Africans, though benefit levels were less than one tenth of those for whites. By 1958 (a decade into the apartheid era), Africans made up 60 percent of the 347,000 social old-age pensioners, although they received only 19 percent of old-age pension spending (van der Berg 1997).
The 1970s and 1980s were a period in which the apartheid government worked hard to give the “independent homelands” political legitimacy. Ironically, a major impetus for what Kruger (1992) describes as the “de-racialisation” of social assistance came from attempts to bolster the homeland system of racial separation. This led to a rapid increase in the funds flowing to the homelands for old age pensions. The coverage of the African elderly population increased steadily and by 1993 there were almost twice as many African pensioners inside the homelands as outside (van der Berg 1997).
In the late 1970s, the principle of moving to parity in social spending levels was reluctantly accepted (van der Berg 1997). From that time onwards, fiscal expenditure on social assistance rose rapidly in the attempt to incorporate all race groups into the system and to provide similar levels of benefits. Spending on social old-age pensions rose from 0.6 percent of GDP in 1970 to 1,8 percent of GDP by 1993 (van der Berg 1997). Fiscal constraints precluded increasing the benefits for all race groups to those previously enjoyed by white pensioners, so white benefits were eroded while African benefits were rapidly increased (see Section 4 on the financial affordability of South Africa’s social security system). As shown in Figure 2, African pension benefits rose five-fold in real terms between 1970 and 1993 while white pension benefits fell by a third.6
5 South Africa under apartheid used race as a primary classification of the population into African, Coloured, Indian and White groups. Statistics continue to be collected using these classifications. The term “black” is used to signify African, Coloured and Indian people, in the context where black signifies all previously disenfranchised groups.
6 See, also, Section 4 on the evolution and coverage of the social security system in South Africa providing information on the shares of beneficiaries by population groups.

THE EVOLUTION AND IMPACT OF SOCIAL SECURITY IN SOUTH AFRICA
8
Figure 2 Monthly value of pension benefits, by race, 1960-2010 (constant 2010
PPP$ prices)
Source: nominal data from 1960 to 1994 kindly provided by Servaas van der Berg (personal communication); data from 1995 onwards (Republic of South Africa, various years). Data deflated to 2010 prices using headline CPI and a PPP$ exchange rate of 4.67 in 2010.
The 1992 Social Assistance Act finally did away with all discriminatory provisions. Thus, the social pensions and grants which had been set up to protect the white population gradually expanded their eligibility rules to include all South Africans.
“This [made] it... an unusually comprehensive system compared with that found in other developing countries.” (Lund, 1993: 22).
As discussed below, social pensions remain the largest and most important grant in South Africa. Inspired by the apparent success of the grant in reaching its intended beneficiaries and in reducing poverty (see below), other grants were subsequently added (or revised) in order to broaden coverage to vulnerable groups that might not benefit from the social pensions. One of these components is the disability grant. It is the only grant intended for working age adults. It goes to disabled and chronically ill persons over the age of eighteen but below the age at which they would be eligible for the old age pension. The means test is the same as for the old age pension. The main criterion is that the person should be disabled to the extent that they are unable to support themselves. Permanent grants are awarded to those who are permanently disabled. Temporary grants are awarded for a shorter period, for example six months, to those who are expected to regain the ability to support themselves. Numbers for the disability grant increased significantly in the late 1990s but have levelled off in the last decade. Today, about 6 percent of working age adults receive a disability grant each month.
Thus, improved coverage and parity in benefits occurred for old age pensions and, to a lesser extent, for disability grants. However, in the case of child grants, the incoming post-apartheid government had to confront a highly inequitable inheritance. Before the transition in 1994, little was spent on children, and expenditure was highly unequal in terms of race. This is still reflected in the 1995/96 fiscal year, with only 12 percent of the social assistance budget being devoted to child grants. At the transition, three grants were directed at children. A Foster Care Grant was directed at children that had been placed with foster parents through a court order. A Care Dependency Grant (CDG) was given to care-givers of children who are severely disabled to the extent that they needed full-time care. Finally, there was a State Maintenance Grant. We deal with this grant first, as this is by far the most important, and its post-apartheid evolution is important.
The State Maintenance Grant was intended for a parent or guardian living with a child under eighteen years of age if the applicant was unmarried, widowed or separated, had
THE EVOLUTION AND IMPACT OF SOCIAL SECURITY IN SOUTH AFRICA
9
been deserted by their spouse for more than six months, had a spouse who received a social grant, or had a spouse who had been in prison, a drug treatment centre or a similar institution for more than six months. Applicants had to prove that they had made efforts to apply for private maintenance from the other parent but had been unsuccessful in doing so. There were limitations not only on non-parent receipt of the grant, but also on eligibility with regard to children born outside of marriage. As a result of significant differences in both rules and how the rules were applied, very few African children and their care-givers received the grant.
The new ANC government (African National Congress) quickly recognised that providing equal access to the State Maintenance Grant would have severe fiscal implications. Simulations based upon household survey data suggested that there would be a more than twenty-fold increase in expenditure if care-givers became aware of their rights (Haarman & Haarman 1996). To be fair to the government of the day, the fiscal implications were not their only consideration. The State Maintenance Grant was also deemed to be inappropriate for the South African context, with its underlying basis that the only children in need were those living with single mothers. There were clearly many children in need who lived with both or neither of their parents. As Simkins and Dlamini (1992) put it at the time, “transfer payments in support of children have traditionally assumed a nuclear family context, whereas this is by no means the only basis of social organization”.
The government moved swiftly to institute reform. In December 1995, the Lund Committee was established in order to evaluate the existing system of state support and to explore new alternative policy options targeting children and families. It recommended a new strategy which included a child-linked grant with a lower monetary value than that of the State Maintenance Grant, but targeted at a much wider group of beneficiaries.
The Child Support Grant (CSG) was introduced in April 1998, at a level of R100 (South African Rand) (approx. $37 PPP) per month for each child younger than seven years of age. Applicants for the grant were required to pass a means test (based upon household income), produce certain documents, and demonstrate efforts to secure funds from other sources. In contrast to the SMG, which was more family-oriented, the CSG was had a strong focus on children, meaning that the CSG transfer should be independent of the child’s family structure. Legally, the grant must be paid to the “primary care-giver”, which is, in 98 5 percent of the cases, a female person in the household in which the child lives (Agüero et al., 2007). The strict nature of the requirements prevented many genuine care-givers of poor children from applying for the grant. A year later, only 21,997 children had been signed up. In response to the low take-up rate, the government altered the means test from a household based measure to one which considered only the income of the primary care-giver plus that of his/her spouse (net of other social assistance grants).
When the CSG was introduced, it included several conditionalities. Applicants were initially expected to participate in “development programmes” and to have proof that the children for whom they were applying were immunised. The requirement with regard to development programmes was dropped after it became clear that such programmes simply did not exist in many areas. The requirement of immunisation was dropped when it was recognised that it often discriminated against children who were already disadvantaged in terms of access to services. Since beginning of 2010, the Child Support Grant has become conditional to the enrolment of the children in receipt of the assistance (Republic of South Africa 2010). Up until 2008, different thresholds were applied for formal urban and informal rural areas, in recognition of the fact that access to education, health and employment was lower in the latter.
In the year 2000, the South African Cabinet appointed a Committee of Inquiry into Comprehensive Social Security (the Taylor Committee), which examined the shortcomings of the existing system. Under the leadership of Prof. Viviene Taylor, the Committee recommended the introduction of a universal grant to all South Africans (a Basic Income Grant), beginning with the extension of the Child Support Grant to all

THE EVOLUTION AND IMPACT OF SOCIAL SECURITY IN SOUTH AFRICA
10
children. Following the submission of the report, the Department of Social Development extended the grant from age of 7 to the age of 14, doubling its scope. In his January 2002 State-of-the-Nation Address, President Mbeki announced a government-led campaign to “register all who are eligible for the child grant” (Samson and others 2008). The President’s strong commitment sent a clear message to the bureaucracy that social grants provided the central pillar for the poverty eradication strategy. By April 2003, 2.6 million children had been signed up for the grant and the take-up continued to escalate.
Since that time, this grant has been dramatically expanded. Older age groups have been gradually included. As from the year 2010, all (income eligible) children born after 1996 will receive the CSG until they turn eighteen. The means test has also been relaxed. In October 2008, the means test was increased to ten times the value of the grant for single care-givers (and double that for married care-givers) , which means the means test automatically keeps pace with inflation. Up until that time, the means test had been fixed at the same nominal level of R800 in urban areas and R1,100 in rural areas for ten years. In the most extreme example, this meant that the means test for a married caregiver in an urban area changed from an income ceiling of R800 (approx. $183 PPP) per month to R4,600 (approx. $1,053 PPP).
The Foster Child Grant (FCG) is paid to those who have gone through a court process to become registered as the foster parents of the child. The Grant is intended for children up to the age of 18 who are “in need of care” and who are not receiving such care from their biological parents. This includes children who are abused as well as children in trouble with the law. The grant is not primarily intended to deal with poverty, and thus has no means test except if the child has independent income. Because the Grant is several times larger than the CSG, there is a clear incentive to care-givers to choose the FCG over the CSG if they have the opportunity to do so. The significant difference between the two amounts is a legacy of the haphazard way in which the grant system came into being. The Lund Committee was aware of this problem when it deliberated, but could not propose a higher amount for the CSG if it was to keep within the budget limit in its terms of reference, and also did not want to recommend lowering the value of Foster Care Grant.7
The Expended Public Works Programme (EPWP) was introduced in 2004. Public Work Programmes in South Africa are aimed to be direct interventions to create employment by increasing labour intensity of all government programmes. At the beginning of 2009, a second phase of the EPWP began. This five-year expansion of the programme is called EPWP II, and its aim is to increase the number of full-year equivalent jobs opportunities to over 400,000 over the next five years (National Security 2009).8
2.2. Coverage of the social insurance and social grants system
We now turn to the coverage of existing social protection systems, summarised in Table 1, and again begin with the existing social insurance programmes. In 2008/09, 44,200 people in South Africa claimed unemployment benefits Leibbrandt et al., (2010). This number stands in contrast to the severe number of unemployed South Africans, which was at 4,125,000 in 2009 (Statistics South Africa 2009). This means that only 10
7 The Care Dependency Grant (CDG) is given to the care-givers of children who are severely disabled to the extent that they need full-time care. Thus, if such care were not available in the home, they would need to be institutionalised. The grant is available for children from 1 to 18 years of age.
8 The aim of the government in South Africa is to extend the EWPW to more than 40,000 full-time equivalent jobs per year (National Treasury 2009), which would be (if affordable) a considerably important instrument to fight short-term poverty.

THE EVOLUTION AND IMPACT OF SOCIAL SECURITY IN SOUTH AFRICA
11
percent of the unemployed population benefit from the Unemployment Insurance Fund (UIF). However, the reason for this surprisingly low coverage is partly explained by the fact that around 55 percent of the unemployed have never worked before and therefore have not contributed to the UIF (Statistics South Africa 2009). Another reason for the low coverage is that around 44 percent of the unemployed have been jobless for more than one year, which means that the period of payment has been exceeded. This indicates that the UIF has an important role only to ensure income replacements on a short-term basis, allowing people to cope with employment shocks, but it cannot be seen as an instrument to reduce the risk of long-term unemployment. The main problem of the UIF is that it only mitigates the effects of a short-term unemployment. However, more people in South Africa are becoming unemployed for longer periods than the UIF provides for.
In contrast to social insurance, the social grants of South Africa have an extensive reach. Table 1 shows that around 14 million South Africans are benefiting from social assistance. On average, the value of social assistance transfers grew 12 percent per year between 2006/07 and 2009/10. There are several reasons for the increases in social assistance. First, the absolute numbers of beneficiaries has increased. Second, it is the result of inflation adjustments to the grant values, adjustments to the means tests threshold, equalisation of the old age grants from 65 years to 60 years and the extension of the child support grant to eligible children up to the age of 18.
Table 1: Social security beneficiaries in South Africa
2006/07 2007/08 2008/09 2009/10
Social grants
Recipients 11,983,141 12,374,770 13,066,118 13,958,894
Unemployment Insurance Fund
Recipients per month 154,546 140,086 164,301 207,967
Compensation Fund
Claims registered 213,246 209,830 203,711 234,266
Road Accident Fund
Claims registered 170,418 267,133 294,771 196,405
Expanded public works programme
Full-time equivalent jobs 85,702 146,359 184,642 –
Work opportunities 316,814 440,266 570,815 –
Medical schemes
Members 2,985,350 3,233,490 3,388,582 3,463,642
Dependents 4,141,993 4,371,746 4,486,244 4,636,935
Pension and provident funds1
Active members 7,370,436 7,273,897 – –
Pensioners 1,971,682 2,138,272 – –
Source: Republic of South Africa (2010). Note that for some programs, data are not available for the past two years.
THE EVOLUTION AND IMPACT OF SOCIAL SECURITY IN SOUTH AFRICA
12
It is estimated that, in 2009, approximately 8 million workers (and their employers) contributed to the Fund but only 10 percent of the 4.1 million unemployed received any unemployment benefits9 (Leibbrandt et al., 2010). Part of the explanation for this large gap between the number of unemployed and the number of people drawing benefit from the Fund lies in the fact that more than half of the unemployed report that they have never worked (Statistics South Africa 2008) and thus have not made contributions to the UIF. Of those that have worked before, almost half have been unemployed for more than a year and would have exhausted their benefits if they had they ever been eligible for them.
While the UIF clearly has an important role to play in providing replacement income to the short-term unemployed with work experience, the vast majority of the unemployed fall outside of this system. In the 2009/10 fiscal year, the UIF paid out benefits amounting to R8.2 billion (approx. $1.7 billion PPP) which is less than one-tenth of the amount spent on cash transfers in the same year; all of the beneficiaries are formal sector workers, most coming from the upper parts of the income distribution chain. As the UIF is the major prong of the social security system that is directed at vulnerable sections of the working age population, the system as a whole is heavily skewed towards income support for the young, the elderly and the disabled with little direct support to the unemployed.
The low coverage and low amount pay-outs shows that, even in a middle-income country as rich as South Africa, unemployment insurance is a very weak instrument to deal with the risks of unemployment, let alone cover its longer-term consequences for poverty and destitution. Given the even higher levels of informality in other sub-Saharan African countries, the scope for unemployment insurance to play an important role in providing social protection is minimal.
During the last five years, the size of the Extended Public Works Programme (EPWP) has been increased steadily, and it provided 1.4 million work opportunities between 2004/05 and 2008/09 (Leibbrandt et al., 2010 and 2010a). During this period, expenditure of the EWPW increased from R7.8 billion (2004/05) to R54.2 billion (2008/09) (Department of Public Works 2009). However, a large part of the expenditure was material costs, such as building materials. Hemson et al., (2008) estimated the wage-costs of the EWPW at around 8 percent of the total costs in infrastructure projects and 48 percent in social sector projects.
Coverage of basic health care is considerably lower than the coverage of the major social grants in South Africa. Table 2 shows the medical aid coverage in South Africa between 2002 and 2009. Although the number of people covered by the medical aid scheme rose steadily between 2002 and 2009, the share of the people that are covered by the medical aid scheme is well below that of the Child Support Grant and that of the State-Old Pension Fund. In 2009, 16.9 percent of the population was covered.
9 Since the maximum benefit period is 238 days, this implies that less than 10 per cent of the unemployed are receiving unemployment benefits at any given time.

THE EVOLUTION AND IMPACT OF SOCIAL SECURITY IN SOUTH AFRICA
13
Table 2: Medical aid coverage
Indicator Year
(N=1000) 2002 2003 2005 2007 2009 Number covered by a medical aid scheme 7,063 6,894 6,618 6,920 8,293 Number not covered by medical aid scheme 38,280 39,160 40,497 41,142 40,743
Subtotal 45,343 46,054 47,114 48,062 49,035 Percentage covered by a medical aid scheme 15.6 15.0 14.0 14.4 16.9
Do not know 137 56 43 134 19
Unspecified 53 6 41 61 327
Total population 45,533 46,116 47,198 48,257 49,382
Source: Statistics South Africa (2009).
In addition, the coverage of the medical aid scheme is very uneven distributed between population sub-group, which is shown in Table 3. Whereas the male population shows coverage of 17 percent, the female population shows a slightly lower coverage of 16 percent. Black Africans and coloured African show considerable lower coverage than white South Africans.10
Table 3: Medical aid coverage by population group and sex
Population group Covered Not covered
Total without
unspecified Total with unspecified
Total 8,293 40,743 49,074 49,382
Male 4,062 19,666 23,749 23,901
Female 4,231 21,076 25,325 25,480
Black African 3,503 35,417 38,945 39,193
Male 1,740 17,055 18,807 18,931
Female 1,764 18,362 20,137 20,261
Coloured 942 3,455 4,405 4,439
Male 462 1,656 2,124 2,140
Female 480 1,799 2,281 2,299 Indian/Asian 543 731 1,275 1,282
Male 270 364 634 637
Female 272 367 641 645
White 3,305 1,140 4,451 4,468
Male 1,590 591 2,184 2,193
Female 1,715 549 2,266 2,276
Source: Statistics South Africa (2009).
Table 4 shows that the coverage of the social assistance system has increased during the past five years. On average, the total number of beneficiaries increased by 6.3 percent annually between 2005 and 2009. Only the War Veterans Grant and the Disability Grant have declined in terms of number of recipients between 2005 and 2009. Looking at the evolution of the coverage of the social assistance system in South Africa, the largest annual growth rates are found for Northern Cape with 13.8 percent.
10 See, also, Table A1 in the Appendix.

THE EVOLUTION AND IMPACT OF SOCIAL SECURITY IN SOUTH AFRICA
14
Table 4: Social grants beneficiaries numbers by type and province in South
Africa
2005/06 2006/07 2007/08 2008/09 2009/10 % grow (average
Type of grant annual)
Old age 2,144,117 2,195,018 2,218,993 2,343,995 2,534,082 4.3%
War veterans 2,832 2,340 1,963 1,599 1,248 -18.5%
Disability 1,319,536 1,422,808 1,413,263 1,371,712 1,310,761 -0.2%
Foster care 312,614 400,503 443,191 476,394 569,215 16.2% Care dependency 94,263 98,631 101,836 107,065 119,307 6.1%
Child support 7,044,901 7,863,841 8,195,524 8,765,354 9,424,281 7.5%
Total 10,918,263 11,983,141 12,374,770 13,066,118 13,958,894 6.3%
Province
Eastern Cape 2,094,642 2,244,303 2,291,898 2,346,773 2,498,410 4.5%
Free State 678,522 723,698 755,665 765,553 814,991 4.7%
Gauteng 1,318,981 1,406,445 1,451,967 1,537,795 1,638,747 5.6%
KwaZulu-Natal 2,498,888 2,931,722 3,033,463 3,317,229 3,478,811 8.6%
Limpopo 1,640,032 1,751,512 1,798,859 1,894,038 2,019,849 5.3%
Mpumalanga 836,451 901,386 925,171 977,704 1,037,971 5.5%
Northern Cape 213,512 232,102 307,095 326,516 357,517 13.8%
North West 888,065 1,001,629 980,018 1,014,571 1,089,135 5.2%
Western Cape 749,170 790,344 830,634 885,938 1,023,463 8.1%
Total 10,918,263 11,983,141 12,374,770 13,066,118 13,958,894 6.3%
Source: Republic of South Africa (2010).
We now have a closer look on the coverage of the Old-Age Pension Fund and the Child Support Grant, the two main social grants in South Africa. Table 5a shows the take-up rates of the State Old Pension Fund scheme. At national level, the take-up rate is around 80 percent and differences between provinces are not very large, which indicates an overall high coverage (UNICEF 2008).
Table 5a: Take-up of State Old Pension (2000)
National/ Province
Grant Recipients, take-up rate
Number of eligible recipients
Take-up rate
Number of eligible recipients not receiving SOAP
National 1,767,591 2,185,321 80.9% 417,730 Western Cape 115,210 144048 80.0% 28,838 Eastern Cape 359,973 440,935 81.6% 80,962 Northern Cape 30,040 37,530 80.0% 7,490
Free State 93,003 115,723 80.4% 22,720 KwaZulu Natal 358,184 445,656 80.4% 87,472
Northwest 139,114 167,269 83.2% 28,155
Gauteng 304,931 414,663 73.5% 109,732 Mpumalanga 97,852 110,697 88.4% 12,845
Limpopo 269,284 308,800 87.2% 39,516
Source: Samson et al., (2004).
In 1990, the coverage of the social cash transfer targeted to children was very low. Only 0.2 percent of children in South Africa have benefited from the State Maintenance Grants (SMGs). At the end of 1995, the new democratic government of South Africa established the Lund Committee with the objective to evaluate the existing system of social assistance and to identify alternative policy options. In 1993, the last year for which racially disaggregated welfare spending data is available, only 0.2% of

THE EVOLUTION AND IMPACT OF SOCIAL SECURITY IN SOUTH AFRICA
15
African children were in receipt of maintenance grants, while 1.4% of white children, 4.0% of Indian children and 5.0% of coloured children received the grant (Lund 2008).
The introduction of the Child Support Grant in 1998 provides a good example of how a programme can be improved if it is found to be working ineffectively. In the first years after the introduction of the CSG, take-up rates remained very low, of around 15 percent in 2000 (Samson et al., 2004), which is shown in Table 5b. Surveys of provincial social development offices identified contradictory interpretations of the means tests, and conditionalities for the Child Support Grant severely undermined the take-up. For example, single mothers had to provide “proof of [their] efforts” to obtain private maintenance from the father of the child, proof of immunisation and health clinic registration, and proof of their efforts to secure employment or to join a development programme (Samson et al., 2006).11
Table 5b: Take-up of Child Support Grant (2000
National/ Province
Number of grant recipients
Number of eligible grant recipients, aged 0-7
Take-up rate
Number of those eligible but not receiving CSG
National 463,699 3,069,536 15.1% 2,605,837
Western Cape 59,407 103,868 57.2% 44,461
Eastern Cape 63,038 658,966 9.6% 595,928
Northern Cape 19,734 42,676 46.2% 22,942
Free State 18,573 171,027 10.9% 152,454
KwaZulu Natal 70,660 808,375 8.7% 737,715
Northwest 34,341 196,209 17.5% 161,868
Gauteng 107,493 386,601 27.8% 279,108
Mpumalanga 43,704 185,113 23.6% 141,409
Limpopo 46,749 516,701 9.0% 469,952
Source: Samson et al., (2004).
Based upon our own survey estimates, take-up rates disaggregated by population sub-groups are presented in Tables 6a and 6b, which reflect the proportion of eligible individuals in each racial group receiving the grant (6a) and the share of households receiving grants.12 We see clear racial differentials in the recipients of state grants in South Africa. Table 6a shows that around 84 percent of all Africans are eligible to receive the SOAP, and 60 percent to receive the CSG, compared to 23 percent and 2 percent of the white population. These differentials are translated into the actual share of households of the respective population group receiving state grants. Almost 60 percent of the Africans with children receive the CSG compared with less then 2 percent of the white population with children.
11 50 percent of the recipients waited 2 to 3 months before the grant went to payment, 11
percent less than one month, 27 percent between 1 and 2 months and 12 percent more than 3 months (UNICEF 2008a).
12 Eligibility is defined according to age. Eligibility for the SOAP required males to be aged 63 and above and the corresponding age for females is 60. Males between the ages of 18 and 63 are eligible for the DG, as are females between the ages of 18 and 60. Children under the age of 14 are eligible for the CSG.

THE EVOLUTION AND IMPACT OF SOCIAL SECURITY IN SOUTH AFRICA
16
Table 6a: Recipients of State Grants
SOAP DG CSG
Yes No Total Yes No Total Yes No Total
African 83.94 16.06 100 4.40 95.60 100 60.47 39.53 100
Coloured 83.92 16.08 100 6.57 93.43 100 28.93 71.07 100
Asian/Indian 84.14 15.86 100 7.94 92.06 100 15.07 84.93 100
White 23.32 76.68 100 3.07 96.93 100 2.50 97.50 100
Total 68.87 31.13 100 4.55 95.45 100 54.02 45.98 100
Table 6b: Households of State Grants
SOAP DG CSG
Yes No Total Yes No Total Yes No Total
African 14.55 85.45 100 7.47 92.53 100 58.53 41.47 100
Coloured 16.49 83.51 100 10.03 89.97 100 28.31 71.69 100
Indian/Asian 18.68 81.32 100 7.96 92.04 100 19.44 80.56 100
White 7.36 92.64 100 4.86 95.14 100 1.91 98.09 100
Total 13.90 86.10 100 7.37 92.63 100 49.65 50.35 100
Source: National Income Dynamics Study, 2008.
Note: All observations are weighted by the post-stratification weight included in the individual derived dataset.
As shown in Figure 3, by the year 2000 (two years into the programme), only 150,000 children were receiving their entitlement. After that, Figure 3 shows a sharp rise in the number of children receiving Child Support Grant. In 2009, more than 9 million children benefited from the grants. It is clear that take-up rates increased substantially between 2002 and 2005 by the extension to children under the age of 7 and by the extension of the CSG to reach all poor children up to the age of 14 in 2005. However, Figure 3 also reveals a sharp increase in the beneficiaries among the younger age group (0-6), showing the overall increased coverage of the programme. Estimates based upon survey data suggest that this change in the means test should have brought an additional 1.5 million children into the net (Leibbrandt et al., 2010).
Figure 3: Number of children receiving the Child Support Grant, by year and age group
Source: South African Social Security Agency, special request

THE EVOLUTION AND IMPACT OF SOCIAL SECURITY IN SOUTH AFRICA
17
Our own survey estimates suggest that 70 percent are income-eligible for the Child Support Grant, amounting to about 15 million eligible beneficiaries, and thus the take-up remains far below that rate. There are a number of reasons for this. First, take-up among infants is very low partly because care-givers procrastinate and/or because there is often a delay in obtaining a birth certificate for the child. Second, our simulations use the new means test, which may not have been widely communicated. Third, and of greater concern, some groups seem to be outside of the reach of the grant.
UNICEF (2008a) estimated an exclusion error of around 20 percent, which means that 20 percent of all households eligible for the grant are not benefiting. The main reasons are identified to be barriers as a result of problems with documentation. UNICEF (2008a) identified problems with the documentation required to apply for social assistance as the main barrier to the benefits, such as obtaining the required birth certificate of the child and the identity of the main care-giver. About 50 percent of households which are eligible but are not receiving the grant did not have the right documentation.
One of the most “at risk” segments of the child population is that of orphans. Figure 4 below indicates how many orphans under the age of 15 are currently receiving social assistance according to 2008 data from the National Income Dynamics Study.13 What is most striking is the high number of paternal orphans receiving grants, particularly the Child Support Grant, and the low number of maternal orphans receiving grants. This concurs with evidence found in Case, Hosegood and Lund (2004) that the probability of a child receiving a grant decreases when the mother is absent. The same conclusion is drawn by Woolard, Carter and Aguero (2008) using the KwaZulu-Natal Income Dynamic Study (KIDS) data. Children living with their widowed fathers are the least likely to be receiving grants. Unsurprisingly, orphans who have lost both parents are the most likely to be receiving the Foster Care Grant. What is unexpected, though, is the fact that, aside from paternal orphans, orphans are less likely to receive the Child Support Grant than children with both parents. This may be a result of the more complex documentation required without the child’s mother as caregiver/when the care-giver is not the child’s mother.
Figure 4: Percentage of children receiving social assistance, by vital status of parents
Source: National Income Dynamics Study, 2008
13 Unfortunately, there is no information on grant receipt for children over the age of 15.

THE EVOLUTION AND IMPACT OF SOCIAL SECURITY IN SOUTH AFRICA
18
Table 7 shows the value of the different grants in South Africa per month and its value as a percentage of monthly median per capita income. The highest monthly payments are received through the Old-Age Pension and the Disability Grant, which account for 175% of the annual median per capita income.
Table 7: Value of the grants in 2010
Grant type 2010 value in Rands (and approx. $ PPP) per month
Grant value as percentage of median per capita income*
Old Age Pension R1080 (PPP$230) 175% Disability Grant R1080 (PPP$230) 175% Child Support Grant R250 (PPP$53) 40% Foster Care Grant R710 (PPP$150) 115%
*Note: per capita income is from the 2008 National Income Dynamics Study, inflated to 2010 prices using headline CPI.
Source: Republic of South Africa (2010).

THE EVOLUTION AND IMPACT OF SOCIAL SECURITY IN SOUTH AFRICA
19
3. The impact of the social assistance in South Africa
3.1 Impact on household poverty
Non-contributory pension programmes have been established in several other countries in Latin America and Africa, including Argentina, Brazil, Namibia, and Botswana. Barrientos and Lloyed-Sherlock (2002) reviewed the research on the social and economic impact of these pension programmes and find an overall positive impact on poverty reduction.
The immediate objective of cash transfer programmes is to alleviate hardship among vulnerable groups.14 In this part of the paper, we take an aggregate look at the extent to which cash transfers in South Africa achieve this aim. Precise measurement of the impact of specific programmes on poverty is a largely intractable problem because of the difficulties involved in establishing a legitimate counterfactual as a benchmark. As a result, studies tend to focus on determining whether cash transfer programmes target the poor, and on comparing the adequacy of household income with and without the pension income component (Barrientos and Lloyd-Sherlock 2002). This is the approach that we follow in this section.
In Figure 5, we disaggregate household income sources by income quintile in order to highlight the role of social assistance grants in providing income support to the poorest households. It is striking that two-thirds of the income to the bottom quintile comes from social assistance grants, with most of this income coming from child grants (the Child Support Grant, the Foster Care Grant and the Care Dependency Grant combined). As households move up the income distribution chain, labour market income becomes increasingly important and reliance on social assistance is commensurately reduced.15
Figure 5: Sources of household income, by quintile
Source: NIDS, 2008.
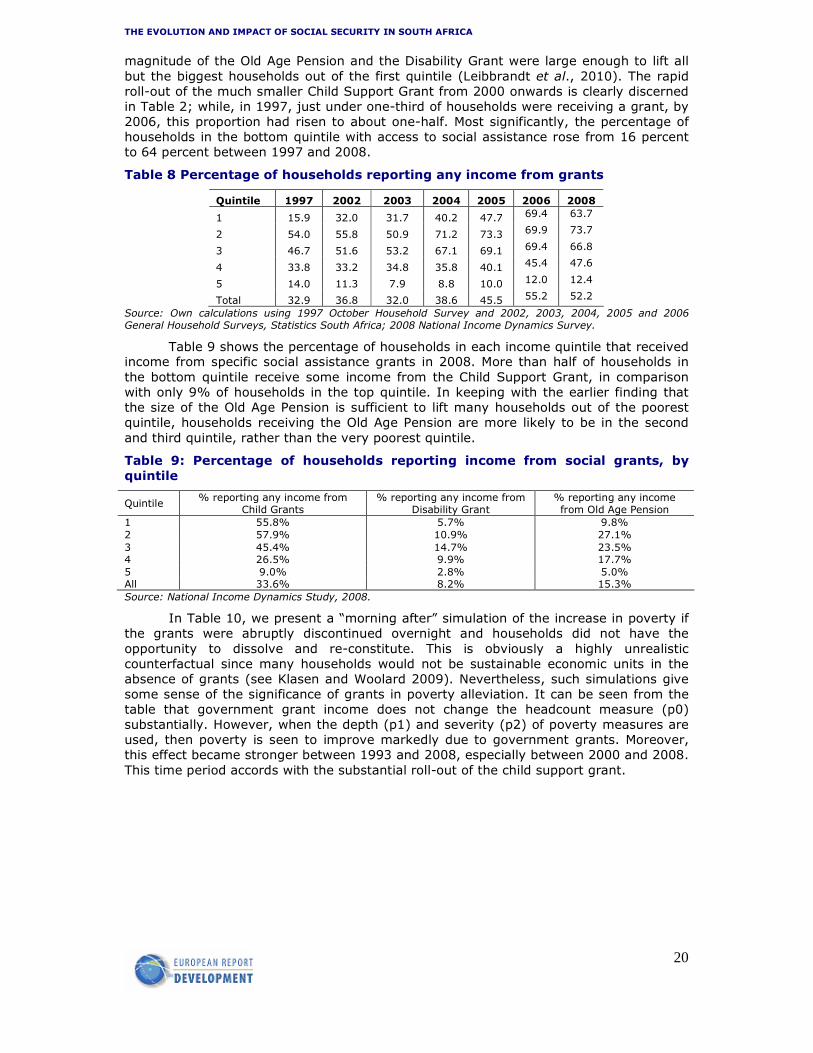
Table 8 shows the proportion of households reporting access to cash transfers. It is notable that, in 1997, households in quintile 2 were much more likely to be receiving a grant than households in quintile 1. The reason for this is straightforward: the
14 For example, poverty headcount rates are lower for households that benefit from pensions than non-benefiting households in Brazil.
15 A study by Kakwani and Subbarao (2005) examines the profile of the elderly population in 15 African countries. They find that the elderly, on average, face higher poverty rates than other population sub-groups, especially when the elderly have become either the main income earner or care-giver for children.
THE EVOLUTION AND IMPACT OF SOCIAL SECURITY IN SOUTH AFRICA
20
magnitude of the Old Age Pension and the Disability Grant were large enough to lift all but the biggest households out of the first quintile (Leibbrandt et al., 2010). The rapid roll-out of the much smaller Child Support Grant from 2000 onwards is clearly discerned in Table 2; while, in 1997, just under one-third of households were receiving a grant, by 2006, this proportion had risen to about one-half. Most significantly, the percentage of households in the bottom quintile with access to social assistance rose from 16 percent to 64 percent between 1997 and 2008.
Table 8 Percentage of households reporting any income from grants
Quintile 1997 2002 2003 2004 2005 2006 2008
1 15.9 32.0 31.7 40.2 47.7 69.4 63.7
2 54.0 55.8 50.9 71.2 73.3 69.9 73.7
3 46.7 51.6 53.2 67.1 69.1 69.4 66.8
4 33.8 33.2 34.8 35.8 40.1 45.4 47.6
5 14.0 11.3 7.9 8.8 10.0 12.0 12.4
Total 32.9 36.8 32.0 38.6 45.5 55.2 52.2
Source: Own calculations using 1997 October Household Survey and 2002, 2003, 2004, 2005 and 2006 General Household Surveys, Statistics South Africa; 2008 National Income Dynamics Survey.
Table 9 shows the percentage of households in each income quintile that received income from specific social assistance grants in 2008. More than half of households in the bottom quintile receive some income from the Child Support Grant, in comparison with only 9% of households in the top quintile. In keeping with the earlier finding that the size of the Old Age Pension is sufficient to lift many households out of the poorest quintile, households receiving the Old Age Pension are more likely to be in the second and third quintile, rather than the very poorest quintile.
Table 9: Percentage of households reporting income from social grants, by quintile
Quintile % reporting any income from
Child Grants % reporting any income from
Disability Grant % reporting any income from Old Age Pension
1 55.8% 5.7% 9.8% 2 57.9% 10.9% 27.1% 3 45.4% 14.7% 23.5% 4 26.5% 9.9% 17.7% 5 9.0% 2.8% 5.0% All 33.6% 8.2% 15.3% Source: National Income Dynamics Study, 2008.
In Table 10, we present a “morning after” simulation of the increase in poverty if the grants were abruptly discontinued overnight and households did not have the opportunity to dissolve and re-constitute. This is obviously a highly unrealistic counterfactual since many households would not be sustainable economic units in the absence of grants (see Klasen and Woolard 2009). Nevertheless, such simulations give some sense of the significance of grants in poverty alleviation. It can be seen from the table that government grant income does not change the headcount measure (p0) substantially. However, when the depth (p1) and severity (p2) of poverty measures are used, then poverty is seen to improve markedly due to government grants. Moreover, this effect became stronger between 1993 and 2008, especially between 2000 and 2008. This time period accords with the substantial roll-out of the child support grant.

THE EVOLUTION AND IMPACT OF SOCIAL SECURITY IN SOUTH AFRICA
21
Table 10: Poverty with and without government grants
Poverty when income includes government grants
Year Poverty line=approx. $223 PPPper capita per month Poverty line=approx$121 PPP per capita per month p0 p1 p2 p0 p1 p2
1993 0.72 0.47 0.36 0.56 0.32 0.22 2000 0.71 0.45 0.33 0.54 0.29 0.19
2008 0.70 0.44 0.32 0.54 0.28 0.18 Poverty when income excludes government grants
Year Poverty line=approx$223 PPP per capita per month Poverty line=approx$121 PPP per capita per month p0 p1 p2 p0 p1 p2 1993 0.73 0.53 0.43 0.60 0.4 0.32
2000 0.72 0.5 0.4 0.57 0.37 0.29 2008 0.71 0.54 0.46 0.60 0.44 0.37
Source: Own calculations using data from Project for Statistics on Living Standards and Development (SALDRU, 1993), Income and Expenditure Survey (Stats SA, 2000) and National Income Dynamics Study (SALDRU, 2008).
Table 11 suggests that, without government grants, poverty would have worsened over time, rather than been improved. A major reason for this is the fact that the post-apartheid labour market has operated in such a way as to leave an increasing number of South African households outside the ambit of employment and earnings. Households can be linked directly to the labour market through employment and the earnings of residents or indirectly through remittance income from migrant workers and other remitters. Table 11 shows that the share of households with no direct or indirect link to the labour market rose sharply, from 30 percent in 1997 to 42 percent in 2008. The rapid expansion of the grants has coincided with these substantial changes in the number of households with no link to the labour market. Thus, there is little doubt that the post-apartheid record on poverty alleviation would have been much more dismal than it has been without the expansion of the social security system (see Table 10).
Table 11: Household labour market attachment and access to grants of the unemployed (%)
1997 2006 2008
No-one employed, no remittances, no social grants 11.8 13.2 16.9
No-one employed, no remittances, social grants 17.5 24.7 24.9
No-one employed, remittances 21.3 11.2 12.9
1 employed 35.8 39.4 36.6
2 or more employed 13.5 11.5 9.4
Total 100.0 100.0 100.0
Source: 1997 October Household Survey; September 2006 Labour Force Survey, Statistics South Africa and 2008 NIDS data.
Note: This table is only done for selected years owing to the absence of data on either remittances or labour market status in other surveys.
In sum, the social transfer system of South Africa has a considerable impact on poverty. The positive impact on poverty reduction has also been found by other researchers. For example, Case and Deaton (1998) have estimated that the poverty headcount would be five percentage points higher without the pension scheme in South Africa. Similar impacts are also found by Jenson (2004), who estimated a reduction in poverty among the elderly population of between 26 and 33 percent, depending of the existence of additional private pensions. Also Leibbrandt et al., (2010) and Palacios and Sluchynsky (2006) identified the expansion of social grants in South Africa in the past recent years as an important factor for poverty alleviation.

THE EVOLUTION AND IMPACT OF SOCIAL SECURITY IN SOUTH AFRICA
22
3.2 Impact on education, health and nutrition
Cash transfer programmes provide a predictable and reliable source of income, which can have significant effects upon the capacity of households to invest in human and physical capital, and thus break the intergenerational transmission of poverty. In this section, we review the existing evidence on the impact on cash transfers on education and health. We also review the substantial, albeit mixed, literature on the impact of the grants on possible negative incentive effects on labour supply. Most of the existing literature has focused on the Old Age Pension, which has been around much longer that the Child Support Grant. We focus here on papers that take an econometric approach. For a broader review of both quantitative and qualitative studies, see Budlender and Woolard (2006).
Case and Deaton (1998), using data from the 1993 Project for the Study of Living Standards and Development (PSLSD), found that pension income is spent like other income, i.e., “a Rand is a Rand”. They also found that, due to the very high prevalence of three-generation and skip-generation households amongst South Africa’s African population, young children were found disproportionately in households receiving pensions, and that pension money received by women was more likely to be spent in ways that enhance child outcomes (such as on food and school fees). The effectiveness of the SOAP in South Africa has also been found by other researchers (for a review, see Barrientos and Lloyed-Sherlock (2002)). Initially, targeted to the elderly to provide a social safety-net, the benefits from the pensions are found to be distributed among household members, because the majority of the elderly population live in multi-generational households (Samson 2004).
The Old Age Pension not only reaches the elderly, but also children. Because a large share of the elderly in South Africa lives in multi-generational households with children, the social pensions system is also an effective instrument to increase the household income of children living in poor households. Literature also exists on the incentive effects of the South African pension scheme, such as the impact on private transfers, or the spill-over effects on health and education within multiple generation households, greater investment in food production and reduced labour supply.
For example, Duflo (2000) examines the extent to which allocating resources to women, rather than to men, affects the distributional outcome and, in particular, investments in children. Her study also uses the 1993 PSLSD data, and focuses on children under five. More than a quarter of African children of this age group are found to live in the same household as an Old Age Pension recipient. The impact on children is measured through weight-for-height and height-for-age. The presence of a woman eligible for the Old Age Pension results in an increase in girls’ (but not boys’) weight-for-height and height-for-age z-scores, She finds no effect on either boys’ or girls’ nutritional outcomes when pensions are received by men. The paper is important for two reasons. Firstly, she presents robust evidence that children are benefiting from a cash transfer programme intended for a completely different target group. Secondly, because these effects differ by the gender of the person who receives the transfer, the paper rejects the unitary model of the household in which all household income is pooled and then allocated according to a joint household utility function.
Edmonds, Mammen and Miller (2005) use a non-parametric regression discontinuity design to examine changes in household composition associated with the Old Age Pension. They find that households in which a person reaches pension age experience a decrease in women aged 30 to 39 and an increase in young children (under five) and women aged 18 to 23. Using data from a 1999 child labour survey, Edmonds (2006) identifies changes in schooling and child labour when a household member becomes eligible for a pension. School attendance and completed schooling rise and market work declines. The effects are limited to pension-eligible men, a result that Edmonds attributes to greater liquidity constraints for men. Because Edmonds examines children above the age of 5 his results are not necessarily inconsistent with Duflo’s results for younger children.

THE EVOLUTION AND IMPACT OF SOCIAL SECURITY IN SOUTH AFRICA
23
Case and Ardington (2006) investigated whether having a pensioner in the household reduces the negative impact of maternal orphanhood on schooling. They find that having a female pensioner mitigates the impact of orphanhood with regard to enrolment and progression, but does not do so with regard to school-related expenses. Having a male pensioner in the household has a negative effect on progression, and an insignificant effect on enrolment and school-related expenditure. They conclude that cash transfers to the care-givers of orphans are not likely to help orphans to equalise their schooling attainment to that of non-orphans, given that orphans in rich households also suffer deficits.
Hamoudi and Thomas (2005) examined the impact of pensions on the educational attainment of children using the 1998 national Demographic and Health Survey. They look at children aged from 6 to 19, and estimate total years of schooling based upon current or last grade. Overall, the authors find that pension income has a greater beneficial impact on girls’ education than boys’ education. This accords with results of earlier analyses (such as Duflo, 2000), but adds the nuance that, for older children (aged from 13 to 19), a male pension tends to increase education among boys and decrease education among girls, whereas a female pension has little effect on either. Among younger children (aged from 6 to 12), female pension has a positive effect on girls and no effect on boys.
The research on the effects of the pension scheme on the labour market shows more mixed findings. For example, while Bertrand’s (2001) early research on the Old Age Pension suggested that it had substantial negative effects on adult labour supply, Bertrand, Mullainathan, and Miller (2003) found that the labour supply of household members living in a pension-income receiving household decreased, suggesting that pension receipt represents an income shock to the household level. Jenson (2004) found no such impact on the labour supply.
The work of Ardington, Case, and Hosegood (2008) also disputed the earlier findings of Bertrand, Mullainathan, and Miller (2003). This study made use of data on non-resident (migrant) household members and panel data, which allowed the authors to control for time-invariant differences between pension recipients and non-recipients. Their results suggested that the Old Age Pension had a positive effect on adult labour supply - the probability that prime-age adults are employed is approximately 3 percentage points higher in households with at least one pension recipient. Like Posel, Fairburn and Lund (2006), they argued that the Old Age Pension relieved financial and child-care constraints, which were short-run impediments to migrating.
More recently, Ranchhod (2010) has used panel data from the national Labour Force Survey to look at the impact of the cessation of the pension (either due to a pensioner dying or out-migrating) on household formation and labour supply. For people who maintained their residency status across waves, he found large and statistically significant increases in employment rates after cessation for middle-aged females and males (9.3 and 8.1 percentage points in each case), as well as for older adult females and males (10.3 percentage points in each case). These findings are consistent with those of Bertrand, Mullainathan, and Miller (2003) but at odds with those of Posel, Fairburn and Lund (2006) and Ardington, Case and Hosegood (2008).
Numerous studies have also documented the success of the CSG in terms of cost-effectiveness and reducing poverty gaps. A recent UNIFEC report (UNICEF 2008) analyses the impact of the CSG on child nutrition and school attendance status using data from the Africa’s General Household Survey (GHS) (2002-2004). Agüero, Carter and Woolard (2009) used data from the KwaZulu-Natal Income Dynamics Study (KIDS) to test whether receipt of the CSG during the first 36 months of a child’s life had an impact on child nutrition as measured by height-for-age. The paper conditioned on a measure of the eagerness of the mother in an attempt to capture the true causal effect of the CSG. The authors found that children who received the CSG during the first three years of their life (i.e., during the so-called “nutritional window” during which adult height is largely determined) had significantly higher height-for-age than those who did not. Agüro et al., (2007) analyse the impact of the CSG on the nutritional status of

THE EVOLUTION AND IMPACT OF SOCIAL SECURITY IN SOUTH AFRICA
24
children and show that the unconditional CSG has a positive impact on the nutritional status of children measured by child height or age. In contrast to the literature on the elasticity of nutrition with regard to income, these positive impacts can be fostered by the fact that the benefits are transferred directly to women.16
Samson et al., (2004) evaluate the system of social grants in South Africa. The study evaluates the impact of the system on health, education, housing and vital services, and on labour market participation and productivity, and estimate the macro-economic impact of social assistance grants. Using the South African 2003 Labour Force Survey and the 2006 Income and Expenditure Survey, the study reveals a substantial impact of the South African social assistance system on reducing poverty and an improvement in the well-being of households and individuals. At the same time, the study also found a positive impact on the labour market participation and productivity, resulting in a positive macro-economics impact.17
In summary, we do not know a great deal with a high degree of certainty. It seems clear that access to either a pension or a child grant can improve the health status of both the beneficiaries and other household members, by improving their nutrition and access to health-care. Second, there is some evidence that older people, particularly women, are inclined to allocate this income in ways which directly benefit more vulnerable household members, such as young children. Evidence about the impact of cash transfers on the labour supply of beneficiaries and their household members is mixed, however. Basic economic theory suggests that cash transfers are an injection of non-labour income into the households and, as such, should have an income effect on both direct and indirect beneficiaries in the household. Thus, these transfers may well have the effect of reducing incentives for work.
3.3 Conditional versus unconditional cash transfers
An interesting question is that the South African grant system represents an unconditional (but means-tested) cash transfer system. Thus, we have an experiment of large grants that are conditional which can be compared to the Latin American experience, where large conditional cash transfer programmes have been instituted in the past two decades. In particular, the question arises as to whether conditionality might improve the performance of the South African grants.
Conditional cash transfers have several innovative characteristics. First, they have sophisticated targeting mechanisms, second, beneficiaries receive cash transfers rather than in-kind transfers, and, third, cash transfers are conditional on certain requirements such as school attendance, health clinic visits, etc. Thus, conditional cash transfers aim to fight poverty both in the short-term by providing cash transfers, and also in the long-term by increasing human capital through the conditionalities of the programmes.18
16 The CSG is also a very important instrument for fighting the impact of HIV/AIDS, because many children live as orphans within other households or with other households member and need financial support to be able to get educated and remain healthy (Meintjes et al., 2003).
17 In addition, Maitra and Ray (2003) examine the behavioural impact of private and public transfers in South Africa. Their results show that crowding out of private transfers is only a concern among the non-poor households. In addition, they confirm a positive impact of private and public transfers on poverty reduction.
18 The most famous example of these developing-country-designed integrated poverty programmes is the Mexican program on education, health and nutrition (PROGRESA). The programme provides cash transfers to very poor households conditional on the children’s school attendance. This means that poor families are paid to send their children to school and to health clinics. PROGRESA builds on the understanding that health, under-nutrition, and education are very closely interlinked on the fight for poverty reduction. The lessons from PROGRESA have been spread throughout Latin American countries in recent years. Similar approaches are, for example, the Bolsa-Família Programme in Brasilia, Familias por la Inclusión Social in Argentina, Solidario in Chile, Familias en Acción in Colombia, Superemonos in Costa

THE EVOLUTION AND IMPACT OF SOCIAL SECURITY IN SOUTH AFRICA
25
Although Mexico’s Progresa is a conditional cash transfer, it is also exclusively assigned women. It has been shown in the literature that Progresa has positive effects on the nutritional status of children (for example, Behrman and Hoddinot 2005). However, is not clear whether the positive effects are not only driven by the conditionality of the transfer, but also a result of the way in which the resources are allocated within the household.
The relatively low costs compared to traditional in-kind assistance programmes is another interesting and attractive characteristic of the CCTs. For example, the Brazil’s Bolsa Família Programme and the Mexico’s Oportunidades, which are the largest CCTs in Latin America, cost much less than 1 percent of the GDP. The literature on the impact evaluation of CCTs has shown promising impacts on reducing poverty. Positive impacts have been identified on education and on health outcomes and nutritional status of children, while no major negative impact on labour force participation rate has been found. In addition, there is also evidence that CCTs have reduced inequality within countries.
As discussed earlier, when the Child Support Grant was first introduced, it was intended that the grant would be a conditional cash transfer. Applicants needed to provide proof that the child had been immunised, that they were participating in development programmes, that they had not refused employment without good reason, and that they had attempted to secure private maintenance for the child from the other parent if they were separated or divorced. The requirement with regard to development programmes was dropped after it became obvious that such programmes simply did not exist in many areas. The requirement with regard to immunisation was dropped when it was recognised that it often discriminated against children who were already disadvantaged in terms of access to health services. As discussed above, the initial take-up of the grant was slow, partly as a result of the conditions. Once the regulations were changed and an increased effort was put into rolling out the grant, take-up increased rapidly.
Grants are seen as constituting an important element of the post-1994 South African government’s rights-based approach, in line with the right to social security granted in the Constitution. This rights-based approach does not square easily with the imposition of conditions. In spite of this (and the early experience of the problems associated with implementing behavioural conditions) the issue of conditionalities has re-surfaced regularly in the last decade. Most recently, the extension of the child grant to children up until the time they turn eighteen, coincided with renewed efforts by the government to impose behavioural conditions.
Conditional on what? Having decided that it would be reasonable to impose conditions, the government gave thought to what might be appropriate conditions. In order to enhance to formulation of human capital, the question is what conditionalities serve best to reach this goal. In Sub-Saharan Africa, conditionalities on health might be more difficult to enforce than conditionalities on education because especially ion poor rural areas the supply of health infrastructure is much worse than that of the education system. In addition, poor household might also be more willing to change behavior with respect to school attendance than to change their attitude toward preventive health care (Perez Ribas et al., 2008).
Rica, Programa de Asignación Familiar in Honduras, Programa de Avance Mediante la Salud y la Educación in Nicaragua, and Proyecto 300 in Uruguay. In sum, conditional cash transfer programmes in Latin America, focusing on health, nutrition and education, turned out to be key components of successful policies to end poverty.

THE EVOLUTION AND IMPACT OF SOCIAL SECURITY IN SOUTH AFRICA
26
As of 1 January 2010, care-givers of child support grant beneficiaries:
“need to ensure that children for whom they are in receipt of a grant are enrolled and attending school. Regular proof of school enrolment needs to be submitted to the Department of Social Development, along with reports from the school. Upon receipt of any information regarding a child not attending school the Department of Social Development will send a social worker to investigate and put in place steps to ensure that the child attends school. While punitive measures such as stopping the grant are not envisaged, these provisions will allow government to improve school attendance and provide the necessary support to households where needed.” (Republic of South Africa, 2010).
This is a very soft conditionality, since the grant will not be stopped if a child does not attend school. In addition, by “regular proof of enrolment”, the government actually means once a year, meaning that the intervention of a social worker may come too late to be effective. Also, given the shortage of social workers and the demands on them, it seems unlikely that monitoring and intervention will be a priority area for the Department of Social Development.
Nevertheless, even a soft conditionality may have some effect if care-givers believe that they are required to send their children to school in order to obtain the grant. However, it is unclear whether there really is a demand-side problem with school enrolment. As shown in Figure 6, enrolment in school is already very high (even for the older age groups).
Figure 6: School enrolment, ages 0-17
Source: General Household Survey, 2009.
School attendance is generally perceived to be a much bigger problem (Budlender 2008). Conditioning on school attendance would entail a significant administrative burden on the Department of Education, and would require inter-sectoral co-ordination between the Departments of Social Development and the Department of Education. It is unclear whether the administrative capacity exists to implement a proper monitoring and reporting system. It would also be much more costly to implement than a condition related to enrolment.
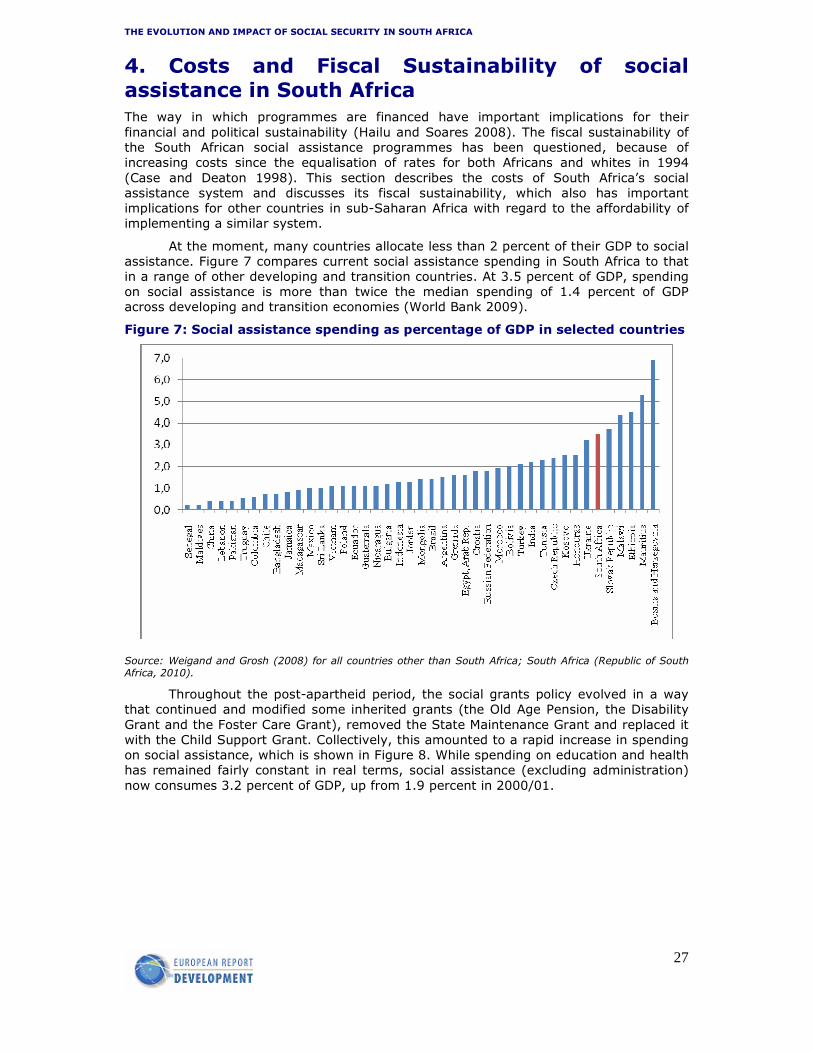
THE EVOLUTION AND IMPACT OF SOCIAL SECURITY IN SOUTH AFRICA
27
4. Costs and Fiscal Sustainability of social assistance in South Africa The way in which programmes are financed have important implications for their financial and political sustainability (Hailu and Soares 2008). The fiscal sustainability of the South African social assistance programmes has been questioned, because of increasing costs since the equalisation of rates for both Africans and whites in 1994 (Case and Deaton 1998). This section describes the costs of South Africa’s social assistance system and discusses its fiscal sustainability, which also has important implications for other countries in sub-Saharan Africa with regard to the affordability of implementing a similar system.
At the moment, many countries allocate less than 2 percent of their GDP to social assistance. Figure 7 compares current social assistance spending in South Africa to that in a range of other developing and transition countries. At 3.5 percent of GDP, spending on social assistance is more than twice the median spending of 1.4 percent of GDP across developing and transition economies (World Bank 2009).
Figure 7: Social assistance spending as percentage of GDP in selected countries
Source: Weigand and Grosh (2008) for all countries other than South Africa; South Africa (Republic of South Africa, 2010).
Throughout the post-apartheid period, the social grants policy evolved in a way that continued and modified some inherited grants (the Old Age Pension, the Disability Grant and the Foster Care Grant), removed the State Maintenance Grant and replaced it with the Child Support Grant. Collectively, this amounted to a rapid increase in spending on social assistance, which is shown in Figure 8. While spending on education and health has remained fairly constant in real terms, social assistance (excluding administration) now consumes 3.2 percent of GDP, up from 1.9 percent in 2000/01.

THE EVOLUTION AND IMPACT OF SOCIAL SECURITY IN SOUTH AFRICA
28
Figure 8 Social Expenditures as a percentage of GDP
Source: South African National Treasury Annual Budget Reviews, 1999-2010 & Intergovernmental Fiscal Reviews, 1999-2000.
Absolute numbers of Figure 8 are presented in Table 12, which shows the expenditure for social grants by type and province in South Africa. Table 12 reveals the differences in the levels of expenditures by the type of the grant. The SOAP and the CSG are the largest grant types with regard to the overall expenditures, closely followed by the Disability Grant. In addition, Table 12 reveals the sharp annual increase in the social grants expenditure during the last five years. Public funding for the health sector constitutes around 4 percent of the GDP and around 14 percent of the main budget (Republic of South Africa 2010).19
Table 12: Social grants expenditure by type and province in South
2006/07 2007/08 2008/09 2009/10 2010/11 2011/12 2012/13 % growth
(average
R million annual)
Old age 21,222 22,801 25,934 29,991 34,058 37,521 39,973 11.1%
War veterans 25 22 20 18 15 13 12 -11.5%
Disability 14,261 15,280 16,474 16,853 17,379 18,012 19,432 5.3%
Foster care 2,851 3,414 3,934 4,362 5,232 6,159 6,704 15.3%
Care dependency 1,006 1,132 1,292 1,356 1,580 1,799 1,898 11.2%
Child support 17,559 19,625 22,348 27,273 30,860 34,830 38,513 14.0%
Grant-in-aid 67 87 90 95 102 108 115 9.4%
Social relief of distress 41 106 623 132 143 151 160 25.5%
Total 57,032 62,467 70,715 80,080 89,368 98,594 106,808 11.0%
Province
Eastern Cape 10,599 11,636 12,557 14,543
Free State 3,706 4,122 4,573 5,225
Gauteng 6,747 7,318 8,289 9,317
KwaZulu-Natal 13,890 15,105 17,590 19,531
Limpopo 7,636 8,439 9,656 10,909
Mpumalanga 3,928 4,322 4,943 5,573
Northern Cape 1,285 1,622 1,962 2,196
North West 4,912 5,187 5,711 6,513
Western Cape 4,329 4,716 5 434 6,273
Total 57,032 62,467 70,715 80,080
Source: Republic of South Africa (2010).
19 For health expenditures, see Table A2.
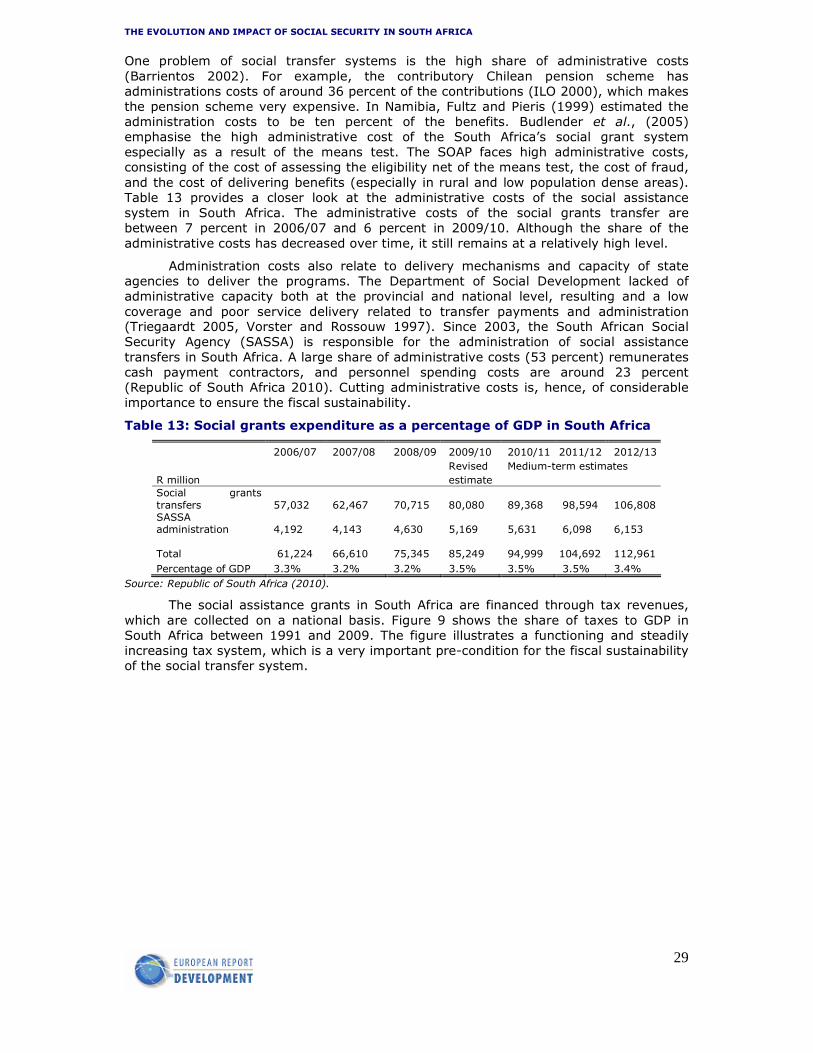
THE EVOLUTION AND IMPACT OF SOCIAL SECURITY IN SOUTH AFRICA
29
One problem of social transfer systems is the high share of administrative costs (Barrientos 2002). For example, the contributory Chilean pension scheme has administrations costs of around 36 percent of the contributions (ILO 2000), which makes the pension scheme very expensive. In Namibia, Fultz and Pieris (1999) estimated the administration costs to be ten percent of the benefits. Budlender et al., (2005) emphasise the high administrative cost of the South Africa’s social grant system especially as a result of the means test. The SOAP faces high administrative costs, consisting of the cost of assessing the eligibility net of the means test, the cost of fraud, and the cost of delivering benefits (especially in rural and low population dense areas). Table 13 provides a closer look at the administrative costs of the social assistance system in South Africa. The administrative costs of the social grants transfer are between 7 percent in 2006/07 and 6 percent in 2009/10. Although the share of the administrative costs has decreased over time, it still remains at a relatively high level.
Administration costs also relate to delivery mechanisms and capacity of state agencies to deliver the programs. The Department of Social Development lacked of administrative capacity both at the provincial and national level, resulting and a low coverage and poor service delivery related to transfer payments and administration (Triegaardt 2005, Vorster and Rossouw 1997). Since 2003, the South African Social Security Agency (SASSA) is responsible for the administration of social assistance transfers in South Africa. A large share of administrative costs (53 percent) remunerates cash payment contractors, and personnel spending costs are around 23 percent (Republic of South Africa 2010). Cutting administrative costs is, hence, of considerable importance to ensure the fiscal sustainability.
Table 13: Social grants expenditure as a percentage of GDP in South Africa
2006/07 2007/08 2008/09 2009/10 2010/11 2011/12 2012/13
Revised Medium-term estimates
R million estimate Social grants transfers 57,032 62,467 70,715 80,080 89,368 98,594 106,808 SASSA administration 4,192 4,143 4,630 5,169 5,631 6,098 6,153
Total 61,224 66,610 75,345 85,249 94,999 104,692 112,961
Percentage of GDP 3.3% 3.2% 3.2% 3.5% 3.5% 3.5% 3.4%
Source: Republic of South Africa (2010).
The social assistance grants in South Africa are financed through tax revenues, which are collected on a national basis. Figure 9 shows the share of taxes to GDP in South Africa between 1991 and 2009. The figure illustrates a functioning and steadily increasing tax system, which is a very important pre-condition for the fiscal sustainability of the social transfer system.
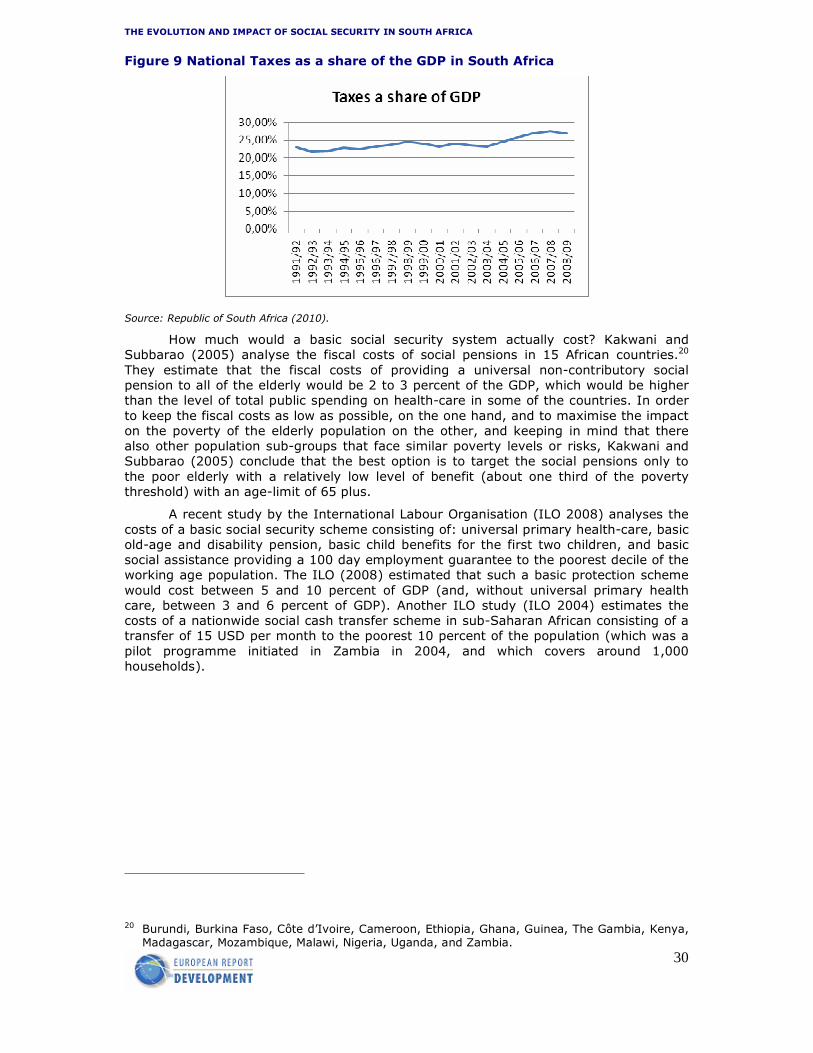
THE EVOLUTION AND IMPACT OF SOCIAL SECURITY IN SOUTH AFRICA
30
Figure 9 National Taxes as a share of the GDP in South Africa
Source: Republic of South Africa (2010).
How much would a basic social security system actually cost? Kakwani and Subbarao (2005) analyse the fiscal costs of social pensions in 15 African countries.20 They estimate that the fiscal costs of providing a universal non-contributory social pension to all of the elderly would be 2 to 3 percent of the GDP, which would be higher than the level of total public spending on health-care in some of the countries. In order to keep the fiscal costs as low as possible, on the one hand, and to maximise the impact on the poverty of the elderly population on the other, and keeping in mind that there also other population sub-groups that face similar poverty levels or risks, Kakwani and Subbarao (2005) conclude that the best option is to target the social pensions only to the poor elderly with a relatively low level of benefit (about one third of the poverty threshold) with an age-limit of 65 plus.
A recent study by the International Labour Organisation (ILO 2008) analyses the costs of a basic social security scheme consisting of: universal primary health-care, basic old-age and disability pension, basic child benefits for the first two children, and basic social assistance providing a 100 day employment guarantee to the poorest decile of the working age population. The ILO (2008) estimated that such a basic protection scheme would cost between 5 and 10 percent of GDP (and, without universal primary health care, between 3 and 6 percent of GDP). Another ILO study (ILO 2004) estimates the costs of a nationwide social cash transfer scheme in sub-Saharan African consisting of a transfer of 15 USD per month to the poorest 10 percent of the population (which was a pilot programme initiated in Zambia in 2004, and which covers around 1,000 households).
20 Burundi, Burkina Faso, Côte d’Ivoire, Cameroon, Ethiopia, Ghana, Guinea, The Gambia, Kenya, Madagascar, Mozambique, Malawi, Nigeria, Uganda, and Zambia.

THE EVOLUTION AND IMPACT OF SOCIAL SECURITY IN SOUTH AFRICA
31
5. Lessons learned for other countries The main question of this section is what lessons can be learned from the social assistance system of South Africa with regard to the effects on welfare and with regard to the applicability of social protection programmes in other countries of sub-Saharan Africa. South Africa’s experience with social security provides important lessons for other sub-Saharan African countries concerning the practical implementation of social security schemes with regard to poverty reduction, reduction in gender inequalities, incentive effects, improvements in education and health, and also in terms of financing and fiscal sustainability. For example, several African countries such as Mozambique, Namibia, Tanzania and Zambia have recently begun to take the necessary steps towards a basic social security scheme.
The empirical research has shown that social grants in South Africa are targeted effectively, and that they build a considerable pro-poor public spending instrument both in the short-term, as well as in the medium- and long-term. In particular, social grants not only provide poor households with income to reduce their vulnerability to short-term poverty, households receiving grants are also more likely to send their children to school and provide better nutrition and health-care for their children. Broad evidence exists that the social grants system in South Africa is an effective policy instrument to reduce poverty and gender inequalities, and it has proven to be in important instrument to improve the education and health status of children in particular.
South Africa’s experience with social security has also provided important lessons for countries in terms of important pre conditions to allow financial re-distribution. First, South Africa has a well functioning and sustainable tax base which allows for fiscal planning and the re-distribution of resources towards social spending. Second, another important pre-condition for financing the social grant systems was the high degree of initial inequality, which creates a situation in which those individuals in the upper end of the income distribution can afford the taxes required to pay for social grants. Similar success stories are found in countries in which the initial income inequality was (and still is) also on a very high level, such as Brazil, and Namibia. Although not eligible, the relatively high levels of inequality in many sub-Saharan African countries can also be seen as an important scope for re-distribution and an important starting-point for implementing a social grants system.
Can public resources in African countries be re-allocated towards social security programmes? The question of whether countries in sub-Saharan Africa have the financial capacities to adopt the successful social protection programmes that South Africa has is difficult to answer. The answer will depend heavily on the share of the administrative costs of the social grant system in reaching the poor.
Figure 7 has shown that even given the current fiscal situation, there is considerable scope to extend the social security schemes in many African countries. But this would require re-allocations of the budget resources. It is often assumed that social cash transfers are not affordable for sub-Saharan African countries, but this view has changed in recent years since poor countries have also developed steps to establish nationwide social cash transfers. Most African countries have increased their domestic revenues through a higher share of taxes as a percentage of GDP.
Lessons can also be learned from practical problems. A key challenge in implementing the social security system in South Africa was the means-test. For example, the administrative requirements of the means test are identified to be the highest entry barriers for receiving grants, and are, therefore, the main constraint for higher take-up rates. This is especially observed in very poor rural areas. Overall, inclusion and exclusion errors in South Africa’s social grants system are relatively low. For example, UNICEF (2008a) estimated an exclusion error of around 20 percent, which means that 20 percent of all households eligible for the grant are not benefiting. The main reasons for these barriers have been identified as the results of problems with documentation when applying for social assistance, such as obtaining the required birth certificate of the child and the identity of the main care-giver. About 50 percents of

THE EVOLUTION AND IMPACT OF SOCIAL SECURITY IN SOUTH AFRICA
32
household that are eligible but do not receive benefits did not have the right documentation.
THE EVOLUTION AND IMPACT OF SOCIAL SECURITY IN SOUTH AFRICA
33
6. Conclusion The sharp increase in social assistance expenditure in South Africa in recent years has two major implications. First, it shows the considerable importance of social security in order to alleviate poverty and to prevent people from falling into poverty. Second, the increasing expenditure has also highlighted the need for appropriate and affordable saving mechanisms for low-income earners. A basic retirement saving and income protection scheme must be affordable for poor households, simple in design and cost-effective.
In some respects, South Africa is an exceptional case for a developing country. The most important of these aspects for this paper is the extent of its social assistance provision, with cash transfers going to more than a quarter of the population. The second is that it is a middle-income country with almost no public debt, and thus the cash transfer programmes are financed from tax revenue rather than from donor funding or borrowing. The third is the extreme inequality in the country. The South Africa government is committed to reducing inequality and poverty, and re-distribution via progressive taxes and pro-poor cash transfers is seen to be an efficient way to accomplish this.
In this paper, we have shown that the falls in poverty that we have seen in the country over the last post-apartheid period are largely due to the expansion of social grants. Also, drawing on the benefit-incidence literature (van der Berg (2001 and 2009)), it seems clear that the disbursement of these grants has been strongly re-distributionist. Thus, at aggregate level, there is no doubt that they have impacted favourably on poverty and inequality. That said, we have shown that these outcomes are the result of very large increases in social spending and it would have been surprising to see no aggregate effects at all. In addition, providing evidence of these effects is not the same thing as making the case that these social grants are the best policy instruments for alleviating poverty. This requires an assessment of the grants against a set of alternative policies.
Having provided evidence of aggregate impacts, we moved on to discuss the body of work that has assessed the impacts of the grants on key micro-outcomes such as health, education and labour supply. There is evidence that the money flowing into households through grants has been used in part to improve health and education outcomes for household members other than the direct beneficiary. Such impacts are crucial for longer-run poverty alleviation. At the same time, the evidence on the labour supply effects of the grants is more mixed; with grants seeming not only to promote migration in search of employment, but also seeming to provide some dis-incentive for working-age household members to look for work.
The review of the South African Social Security schemes still reveals many knowledge gaps regarding the question of what can be learned with regard to introducing similar schemes in other sub-Saharan African countries. For example, how large are the administrative costs relative to costs of payments? What institutional conditions must be pre-existing? What are the determinants of coverage and how realistic is it that non-contributory transfers can cover the majority of the population?
What do we need to know? Relatively little is known about the linkages between government social spending and private social spending (for example, remittances), in particular, to what extent public spending might lead to a crowding out of private safety-net mechanisms. We also need to know more on the gender specific impact of social grants. Also little is known about the impact of social grants on labour migration.
So far, little is known about the problem of potential poverty trap issues regarding supplementary transfer schemes when they exist alongside contributory schemes. In particular, a relatively low means test threshold could discourage the participation in contributory transfer schemes because this would imply a tax on any savings (Palacios and Sluchynsky 2006).
THE EVOLUTION AND IMPACT OF SOCIAL SECURITY IN SOUTH AFRICA
34
References Agüero, Jorge, Michael Carter and Ingrid Woolard. 2009. The Impact of Unconditional Cash Transfers on Nutrition: The South African Child Support Grant. Working Paper 06/08. School of Development Studies, University of KwaZulu-Natal.
Agüero, J. M, M.R. Carter and I. Woolard. 2007. The Impact of Unconditional Cash Transfers on Nutritional: The South African Child Support Grant. International Poverty Centre Working Paper No. 39. International Poverty Centre.
Ardington , Cally, Anne Case & Victoria Hosegood. 2009. Labor supply responses to large social transfers: Longitudinal evidence from South Africa, American Economic Journal: Applied Economics 1(1)
Barrientos, A. 2002. Comparing Pension Schemes in Chile, Singapore, Brazil and South Africa. UNRISD.
Barrientos, A. and P. Lloyd-Sherlock. 2002. Non-Contributory Pensions and Social Protection. Social Protection Sector, International Labour Organization.
Barrientos, Armando and Peter Lloyd-Sherlock. 2002. Non contributory pensions and social protection. Paper for the series ‘Issues in Social Protection’, published by the Social Protection Sector, International Labour Organization, Geneva.
Behrman, J.R. and J. Hoddinot. 2005. Programme Evaluation with Unobserved Heterogeneity and Selective Implementation: The Mexican PROGRESA Impact on Child Nutrition. Oxford Bulletin of Economics and Statistics, 67(4): 547-569.
Bertrand, Marianne, Sendhil Mullainathan and Douglas Miller. 2003. Public policy and extended families: Evidence from pensions in South Africa. World Bank Economic Review 17 (1): 27-50 .
Boler, Tania. and Ian Timæus. 2006. Father Figures: Why Fathers and Cash Grants Matter in Responding to the Impact of AIDS on Education. Centre for Population Studies, London School of Hygiene and Tropical Medicine. Power Point presentation. London.
Budlender, D. 2008. Feasibility and appropriateness of attaching behavioural conditions to a social support grant for children aged 15-17 years. Unpublished report commissioned by the Department of Social Development. Community Agency for Social Enquiry, Johannesburg.
Budlender, Rosa and Hall. 2005. At All Costs? Applying the Means Test for the Child Support Grant. Cape Town: Children’s Institute & Centre for Actuarial Research, University of Cape Town.
Budlender, D and Woolard, I. 2006. The Impact of the South African Child Support and Old Age Grant on Children’s schooling and work. Geneva, International Labour Office.
Case, Anne. 2001. Does money protect health status? Evidence from South African pensions, NBER Working Paper 8495.
Case, A. and C. Ardington .2008. The Impact of Parental Death on School Enrolment and Achievement: Longitudinal Evidence from South Africa. Demography. Volume 43 (3): 401–420.
Case, Anne, Victoria Hosegood and Frances Lund. 2005. The Reach and Impact of Child Support Grants: Evidence from KwaZulu-Natal. Development Southern Africa 22 (4): 467-82.
Case, A, V. Hosegood and F. Lund. 2004. The Reach and Impact of Child Support Grants: Evidence from KwaZulu-Natal. Development Southern Africa Vol.2, No.4.
Case Anne and Angus Deaton. 1998. Large cash transfers to the elderly in South Africa. Economic Journal 108 (450): 1330-1361.
Department of Public Works. 2009. Reaching the one million target. Expended Public Works Programme five-year report, 2004/05-2008/09. Department of Public Works, South Africa.
Devereux, S. 2001. Social pensions in Namibia and South Africa, IDS Discussion Paper 379, Institute of Development Studies.

THE EVOLUTION AND IMPACT OF SOCIAL SECURITY IN SOUTH AFRICA
35
DFID. 2005. Can low-income countries in Africa afford social transfers? Social Protection Briefing Note Series No. 2. DFID.
Duflo Esther. 2003. Grandmothers and granddaughters: Old-age pensions and intra-household allocation in South Africa. World Bank Economic Review 17 (1): 1-25
Duflo, Esther. 2000. Child health and household resources in South Africa: Evidence from the Old Age Pension program. American Economic Review 90 (2): 393-398
Edmonds Eric, Mammen Kristen and Douglas Miller. 2005. Rearranging the family? Income support and elderly living arrangements in a low-income country, Journal of Human Resources 40 (1): 186-207.
Edmonds Eric. 2006. Child labor and schooling responses to anticipated income in South Africa. Journal of Development Economics 81 (2). 386-414.
Fultz, E. and B. Pieris. 1999. Social Security Schemes in Southern Africa, Discussion Paper No. 11, ILO, Geneva.
Haarman, Claudia, and Dirk Haarman 1996. A Contribution Towards a New Family Support System in South Africa. Report for the Lund Committee on Child and Family Support.
Hailu, D. and F.V. Soares. 2008. Cash Transfers in Africa and Latin America: An Overview, Poverty in Focus No 18, International Poverty Centre, Brasilia.
Hamoudi, Amar. and Duncan Thomas .2005. Pension Income and the Well-Being of Children and Grandchildren: New Evidence from South Africa. California Center for Population Research On-Line Working Paper Series.
Harrison, D. 2009. An Overview of Health and Health care in South Africa 1994-2010: Priorities, Progress and Prospects for New Gain. A Discussion Document Commissioned by the Henry J. Kaiser Family Foundation to Help Inform the National Health Leaders’ Retreat Muldersdrift, January 24-26 2010.
ILO. 2000. World Labour Report 2000: Income Security and Social Protection in a changing World, ILO, Geneva.
ILO. 2008. Can Low-income Countries afford Basic Social Security? Social Security Policy Briefings No 3, ILO, Geneva
Jensen, R. 2004. Do public transfers displace the benefits of private transfers: evidence from
South Africa. Journal of Public Economics (88) 1, pp. 89-112.
Kakwani, N. and K. Subbarao. 2005. Ageing and Poverty in Africa and the Role of Social Pensions. The World Bank, Africa Human Development.
Kruger, John. 1992. State provision of social security: Some theoretical, comparative and historical perspectives with reference to South Africa. Master's thesis. Stellenbosch: University of Stellenbosch.
Kruger, John. 1998. From Single Parents to Poor Children: Refocusing South Africa’s Transfers to Poor Households with Children. Paper to ISSA's 2nd International Research Conference on Social Security. Summing up the Evidence: The Impact of Incentives and Targeting on Social Security. Jerusalem.
Leibbrandt, M., I. Woolard, H. McEwen, and C. Koep. 2010. Employment and inequality outcomes in South Africa: What role for labour market and social policies.. Southern Africa Labour and Development Research Unit, School of Economics, University of Cape Town.
Leibbrandt, Murray, Woolard, Ingrid, Finn, Arden and Jonathan Argent. 2010. Trends in South African Income Distribution and Poverty since the Fall of Apartheid. OECD Social, Employment and Migration Working Papers, No. 101.
Lund, F. 2001. Child Support Grant. Mimeo. University of Natal.
Lund, Frances.1993. State Social Benefits in South Africa, International Social Security Review 46(1): 5-25.Paper 5572, NBER: Cambridge, MA. Africa 14(4) 481-503
Maitra, P. and R. Ray. 2003. The effect of transfers on household expenditure patterns and poverty in South Africa. Journal of Development Economics, 71: 23-49.

THE EVOLUTION AND IMPACT OF SOCIAL SECURITY IN SOUTH AFRICA
36
Meintjies, Budlender, Giese and Johnson. 2003. Children in Need of Care or in Need of Cash? Questioning Social Security Provisions for Orphans in the Context of the South African AIDS Pandemic. A Joint Working Paper by the Children’s Institute and the Centre for Acturial Research. University of Cape Town, Cape Town.
National Income Dynamics Study. (NIDS) 2008. University of Cape Town.
National Treasury. 2009. Budget review. Pretoria: Government Printer.
Palacios, R. and O. Sluchynsky. 2006. Social Pensions – Part I: Their role in the overall pension system. World Bank: Washington.
Posel, Dori, Fairburn, James and Frances Lund. 2006. Labour migration and households: A reconsideration of the effects of the social pension on labour supply in South Africa", Economic Modelling 23(5): 836-853.
Project for Statistics on Living Standards and Development. 1993. Southern Africa Labout and Development Research Unit, University of Cape Town: Cape Town.
Ranchod, Vimal. 2010. Household responses to adverse income shocks: Pensioner out-migration and mortality in South Africa. Unpublished mimeograph. University of Cape Town. Cape Town.
Ranchod, Vimal. 2006. The effect of the South African old age pension on labour supply of the elderly. South African Journal of Economics 74 (4): 725-744.
Ribas, R.P. and F.V. Soares. 2008. The Impact of CTTs – What we now and what we are not sure about, Poverty in Focus No 18, International Poverty Centre, Brasilia.
Republic of South Africa. 2010. Budget review 2010. National Treasury Republic of South Africa: Pretoria.
Samson, M., Kaniki, S., van Niekerk, I. and Mac Quene, K. 2007. An Options Assessment with Respect to Making the State Old-Age Pension Universal. Commissioned and published by the Department of Social Development, Republic of South Africa.
Samson, Michael, Ingrid van Niekerk and Kenneth McQuene. 2006. “Designing and Implementing Social Transfer Programmes: A Guide to Management Arrangements for Social Transfers in the Form of Cash.” Economic Policy Research Unit EPRI Press. Cape Town.
Samson, M., U. Lee, A. Ndlebe, K. Mac Quene, I. van Niekerk, V. Gandhi, T. Harigaya, and C. Abraham. 2004. The Social and Economic Impact of South Africa’s Social Security System Commissioned by the Economics and Finance Directorate, Dept. of Social Development Produced by the Economic Policy Research Institute.
Simkins, Charles and Themba Dlamini. 1992. The Problem of Supporting Poor Children in South Africa. In Burman, S. & Preston-Whyte, E. (eds.), Questionable Issue: Illegitimacy in South Africa, 16-42. Cape Town: Oxford University Press.
Statistics South Africa. 2000. Income and Expenditure Survey. Statistics South Africa: Pretoria.
Statistics South Africa. 1997. October Household Survey. Statistics South Africa: Pretoria.
Statistics South Africa. 2002. General household Survey. Statistics South Africa. Pretoria.
Statistics South Africa. 2003. General Household Survey. Statistics South Africa. Pretoria.
Statistics South Africa. 2004. General Household Survey, Statistics South Africa. Pretoria.
Statistics South Africa. 2005. General Household Survey, Statistics South Africa. Pretoria.
Statistics South Africa. 2005a. Labor Force Survey, 2005. Statistics South Africa. Pretoria.
Statistics South Africa. 2006. General Household Survey, Statistics South Africa. Pretoria.
Statistics South Africa. 2007. General Household Survey, Statistics South Africa. Pretoria.

THE EVOLUTION AND IMPACT OF SOCIAL SECURITY IN SOUTH AFRICA
37
Statistics South Africa. 2008. General Household Survey, Statistics South Africa. Pretoria.
Statistics South Africa. 2009. General Household Survey, Statistics South Africa. Pretoria.
Triegaardt, J.D. 2005. The Child Support Grant in South Africa. A social policy for poverty alleviation? International Journal of Social Welfare, 14: 249-255.
UNDP. 2009. Human Development Report 2009. Overcoming barriers: Human mobility and Development. UNDP, New York.
UNICEF. (2008). Quantitative Analysis of the Impact of the Child Support Grant. UNICEF.
UNICEF. (2008a). Review of the Child Support Grant – Uses, Implementation and Obstacles. UNICEF.
Van der Berg, Servaas. 1997. South African social security under apartheid and beyond. Development South Africa. 14: 4, 481 — 503.
Van der Berg, Servaas. 2001. Redistribution through the budget: Public expenditure incidence in South Africa, 1993-1997. Social Dynamics. 27:1, 140 — 164
Van der Berg, Servaas. 2009. Fiscal incidence of social spending in South Africa, 2006. Stellenbosch Economic Working Papers: 10/09.
Vorster J, Rossouw H, Muller G. 2000. Phasing out the State Maintenance Grant within the Context of Developmental Social Welfare. Research Report to the Department of Welfare. Datadesk, Department of Sociology, University of Stellenbosch.
World Bank . 2009. Levels and Patterns of Safety Net Spending in Developing and Transition Countries. Safety Net Primer. The World Bank.Washington DC.
Weigand, Christine and Margaret Grosh. 2008 Levels and Patterns of Safety Net Spending in Developing and Transition Countries. Social Protection Discussion Paper No. 0817. The World Bank: Washington DC.
Woolard, I, Carter, M., and Aguero, J. 2006. Analysis of the Child Support Grant: Evidence from the KwaZulu-Natal Income Dynamics Study, 1993–2004. Report to the Department of Social Development, December 2005. Unpublished manuscript.

THE EVOLUTION AND IMPACT OF SOCIAL SECURITY IN SOUTH AFRICA
38
Appendix Table A1: Medical aid coverage by province and population group
N( 1000)
Province Covered Not Covered Total
Total Black African
Coloured
Indian/ Asian
White Total
Black African
Coloured
Indian/ Asian
White Total
Black African
Coloured
Indian/ Asian
White
South Africa 8,293 3,503 942 543
3,305
40,743
35,417 3,455 731
1,140
49,035
38,920 4,397 1,273
4,445
Western Cape
1,356 123 596 16 621 3,969 1,473 2,326 21 148 5,325 1,596 2,922 37 770
Eastern Cape 752 384 85 * 273 5,850 5,438 333 * 75 6,601 5,822 418 13 349 Northern Cape 176 51 56 * 69 968 558 382 * 25 1,144 608 438 * 94
Free State 519 281 * * 225 2,365 2,191 67 * 101 2,884 2,472 77 * 325 KwaZulu-Natal
1,297 639 27 281 350 9,084 8,419 61 513 92
10,382 9,058 88 794 442
North West 470 328 * * 133 2,949 2,782 52 * 110 3,419 3,110 57 * 243
Gauteng 2,793 1,032 153 226
1,381 7,709 6,856 209 153 491
10,502 7,887 363 379
1,873
Mpumalanga 479 317 * * 151 3,112 3,011 19 14 68 3,592 3,328 30 15 219
Limpopo 450 349 * * 101 4,736 4,689 * 11 30 5,186 5,038 * 11 131
Source: Statistics South Africa (2009).

THE EVOLUTION AND IMPACT OF SOCIAL SECURITY IN SOUTH AFRICA
39
Table A2: Health expenditures in public and private sectors
2006/07 2007/08 2008/09 2009/10 2010/11 2011/12 2012/13
R million Outcome Estimate Forecast
Public sector National department of health1 3,136 3,829 4,755 5,134 5,301 5,604 5,826 Provincial departments of health 51,938 60,645 72,444 87,596 93,465 101,435 107,833
Defence 1,602 1,743 2,024 2,265 2,468 2,634 2,855
Correctional services 234 261 282 300 318 339 359
Police 234 298 463 405 577 721 787 Local government (own revenue) 1,317 1,478 1,625 1,793 1,829 1,865 1,977
Workmen compensation 1,415 1,287 1,415 1,529 1,651 1,718 1,821
Road accident fund 488 764 797 740 860 980 1 039
Total public sector health 60,364 70,305 83,805 99,762 106,469 115,297 122,496
Private sector
Medical scheme 58,349 65,468 74,089 81,128 88,754 96,653 105,255
Out of pocket 26,596 31,183 34,270 36,498 38,833 41,125 43,551
Medical insurance 2,056 2,179 2,452 2,660 2,870 3,126 3,404
Employer private 982 1,041 1,172 1,271 1,372 1,494 1,627
Total private sector health 87,983 99,871 111,983 121,557 131,829 142,398 153,837
Donors or NGOs 2,503 3,835 5,212 6,319 5,787 5,308 5,574
Total 150,850 174,011 201,000 227,638 244,085 263,003 281,907
Source: Republic of South Africa (2010).