Embed Size (px)
Citation preview

The Evaluation of Charter School Impacts
June 30, 2010
Presentation at the 2010 IES Research Conference
Philip Gleason ● Melissa Clark
Christina Clark Tuttle ● Emily Dwoyer
What are the impacts of charter schools on student achievement and other outcomes?
What characteristics of charter schools and their environments are related to charter schools' impacts?
Study Questions
2
Careful monitoring of admissions lotteries at 36 charter middle schools in 15 states
Sample: 2,330 applicants to charter schools in study
Data– State assessments in reading and math
– Other outcomes from school records
– Surveys of students, parents, and principals
Experimental Design Based on Admissions Lotteries
3
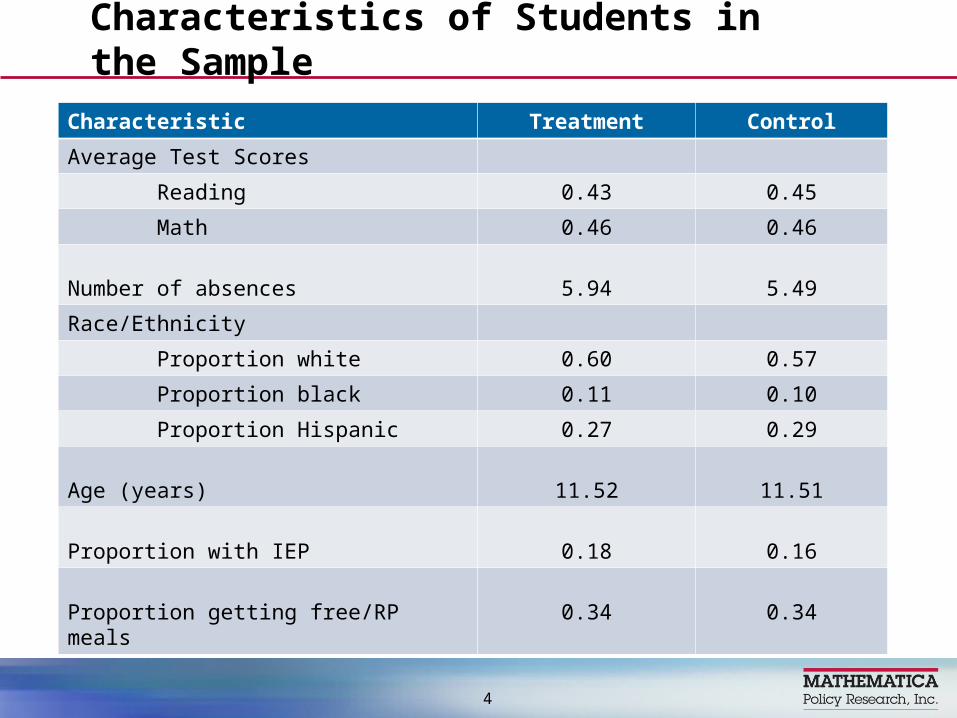
Characteristics of Students in the Sample
4
Characteristic Treatment Control
Average Test Scores
Reading 0.43 0.45
Math 0.46 0.46
Number of absences 5.94 5.49
Race/Ethnicity
Proportion white 0.60 0.57
Proportion black 0.11 0.10
Proportion Hispanic 0.27 0.29
Age (years) 11.52 11.51
Proportion with IEP 0.18 0.16
Proportion getting free/RP meals 0.34 0.34
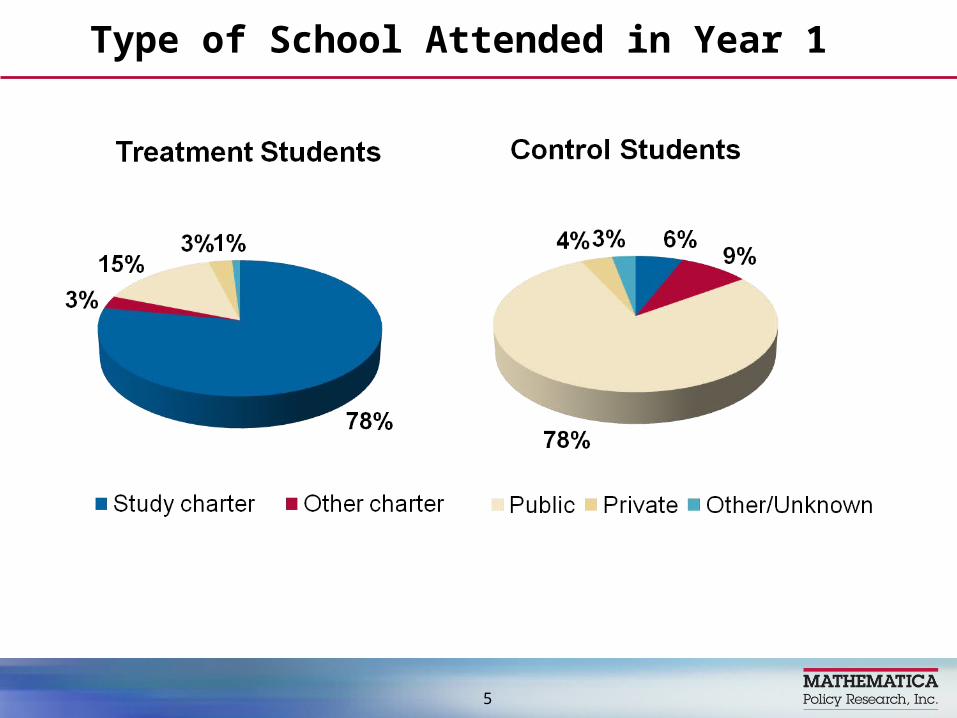
Type of School Attended in Year 1
5
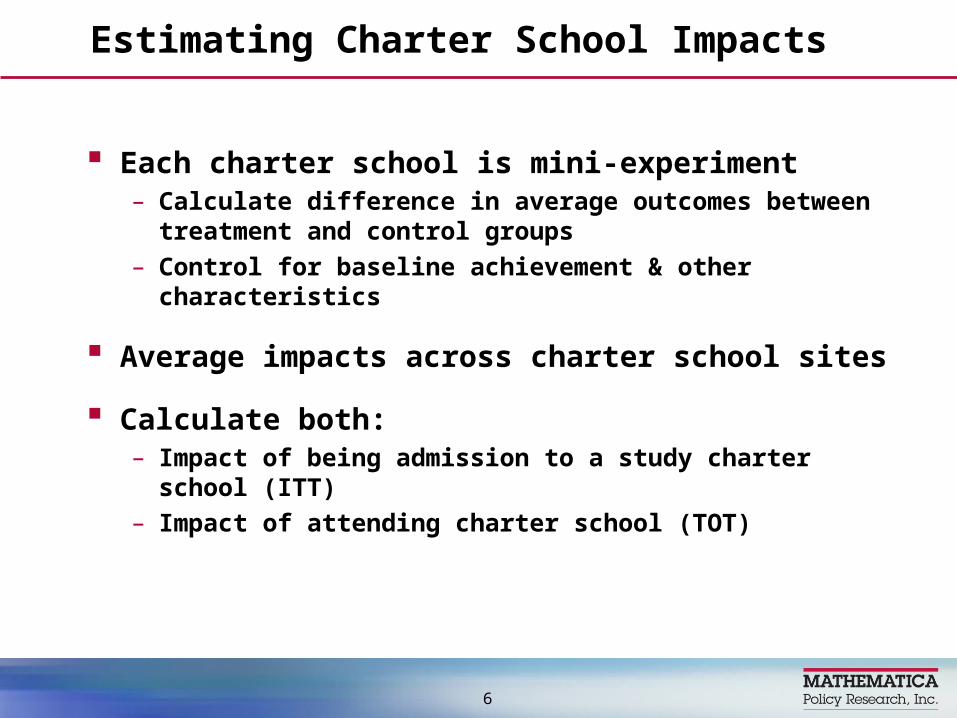
Each charter school is mini-experiment– Calculate difference in average outcomes between
treatment and control groups– Control for baseline achievement & other characteristics
Average impacts across charter school sites
Calculate both:– Impact of being admission to a study charter school (ITT)– Impact of attending charter school (TOT)
Estimating Charter School Impacts
6
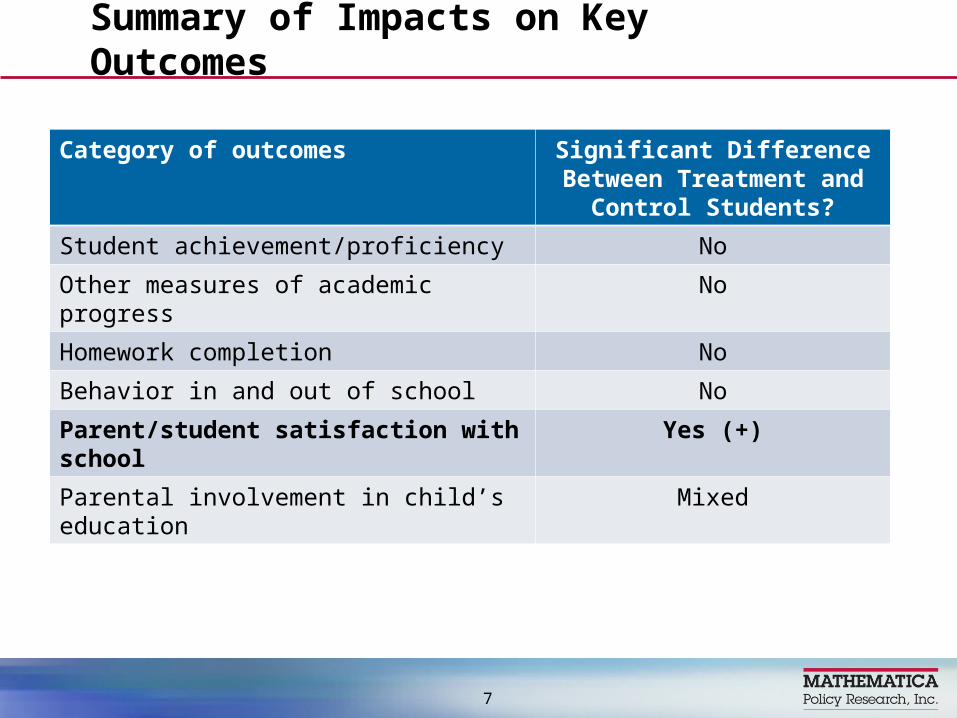
Summary of Impacts on Key Outcomes
7
Category of outcomes Significant Difference Between Treatment and
Control Students?
Student achievement/proficiency No
Other measures of academic progress No
Homework completion No
Behavior in and out of school No
Parent/student satisfaction with school Yes (+)
Parental involvement in child’s education Mixed
8
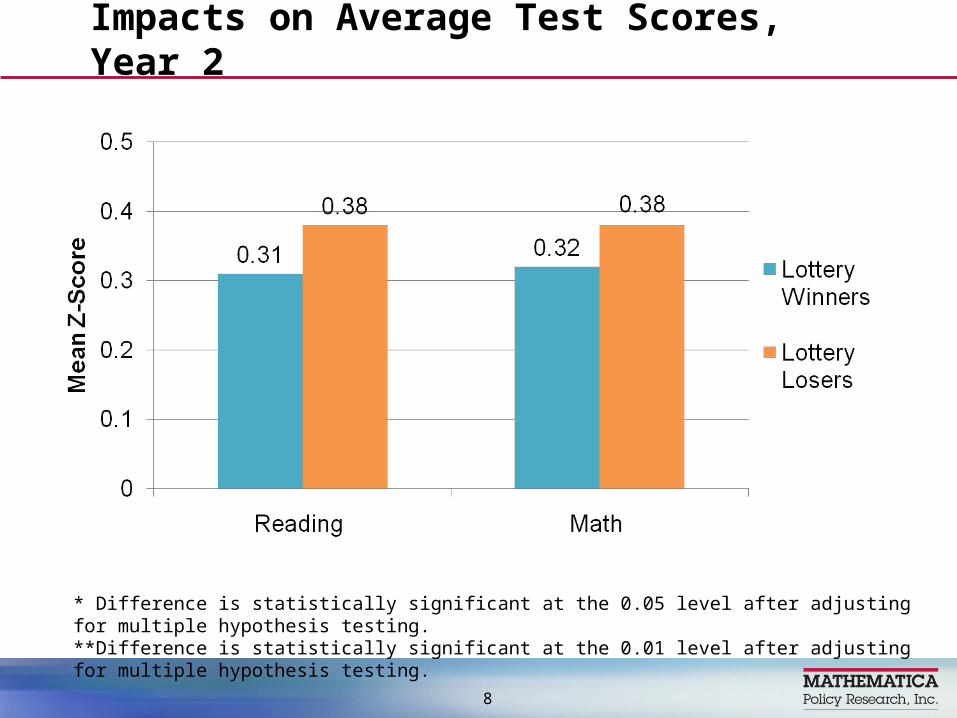
* Difference is statistically significant at the 0.05 level after adjusting for multiple hypothesis testing.**Difference is statistically significant at the 0.01 level after adjusting for multiple hypothesis testing.
Impacts on Average Test Scores, Year 2
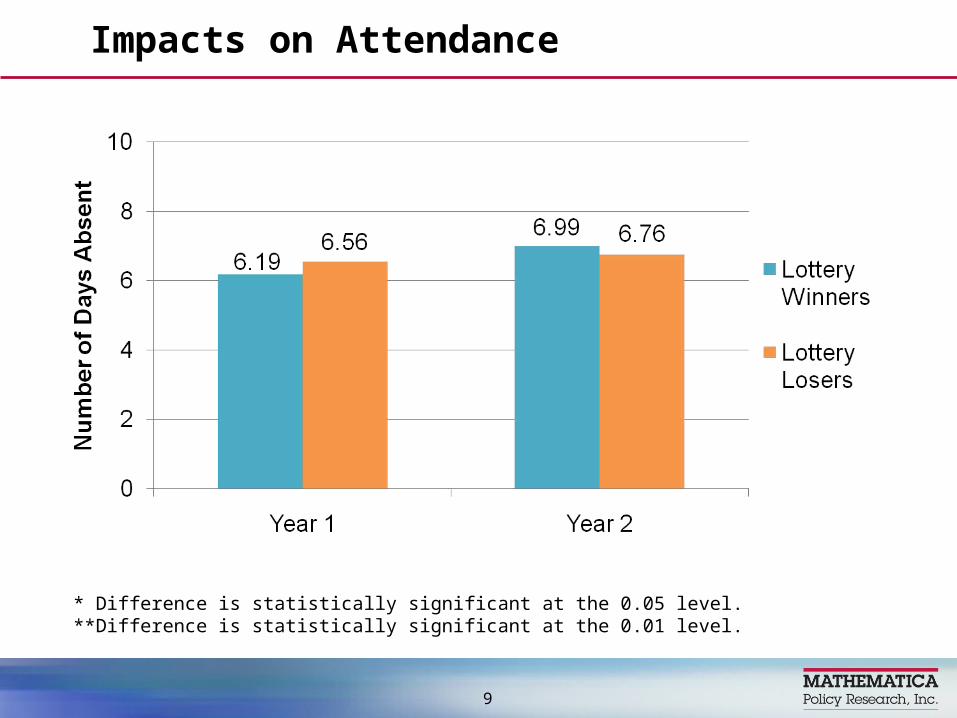
Impacts on Attendance
9
* Difference is statistically significant at the 0.05 level.**Difference is statistically significant at the 0.01 level.
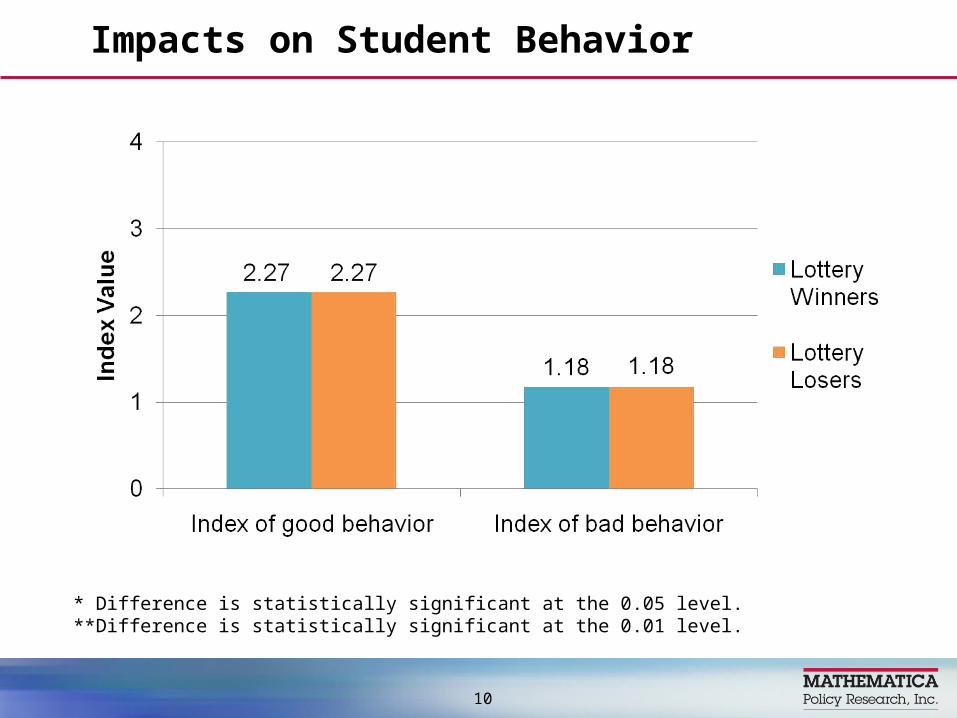
Impacts on Student Behavior
10
* Difference is statistically significant at the 0.05 level.**Difference is statistically significant at the 0.01 level.
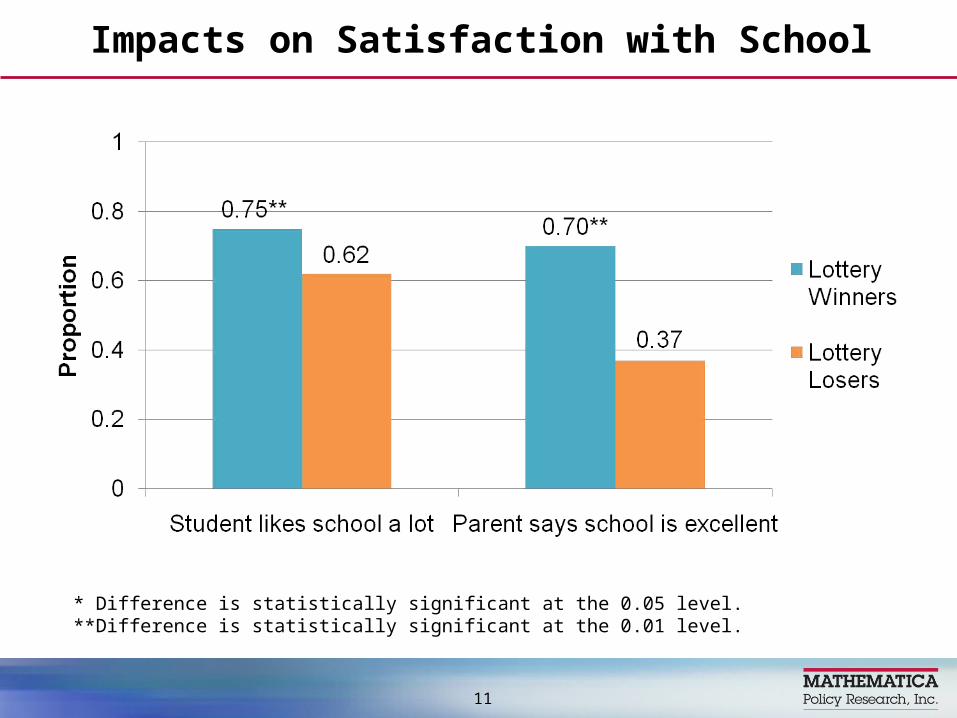
Impacts on Satisfaction with School
11
* Difference is statistically significant at the 0.05 level.**Difference is statistically significant at the 0.01 level.
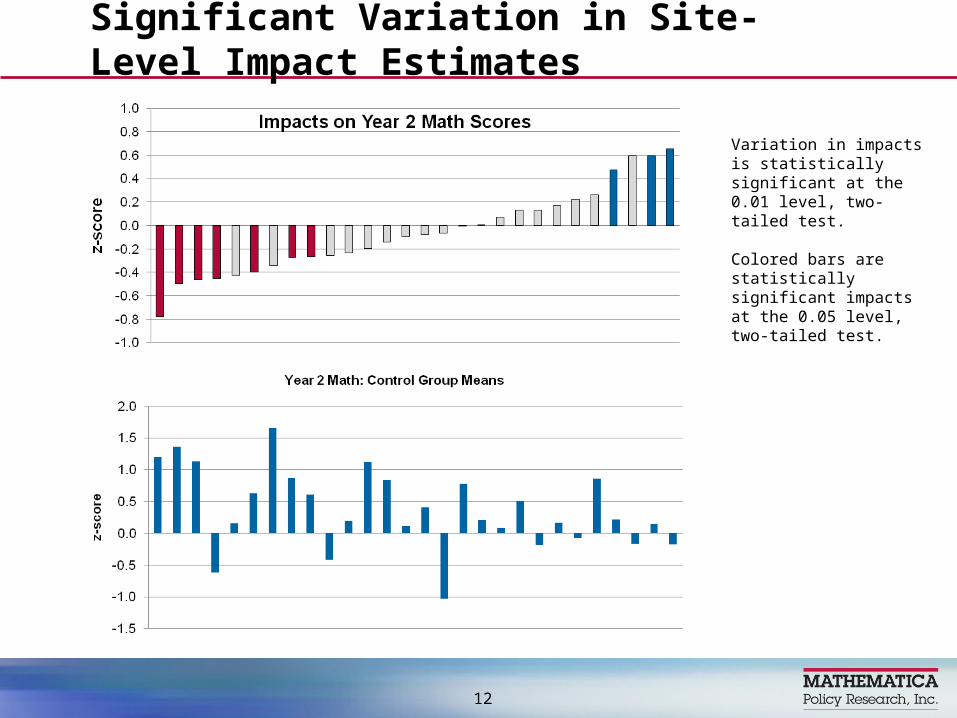
Significant Variation in Site-Level Impact Estimates
12
Variation in impacts is statistically significant at the 0.01 level, two-tailed test.
Colored bars are statistically significant impacts at the 0.05 level, two-tailed test.
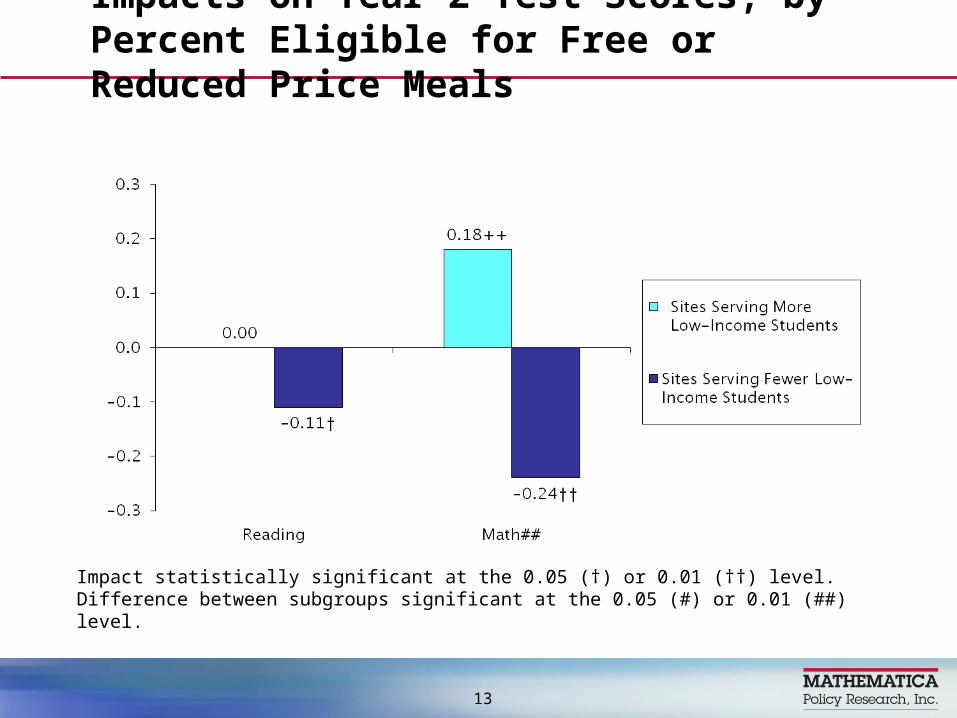
Impacts on Year 2 Test Scores, by Percent Eligible for Free or Reduced Price Meals
13
Impact statistically significant at the 0.05 (†) or 0.01 (††) level.Difference between subgroups significant at the 0.05 (#) or 0.01 (##) level.
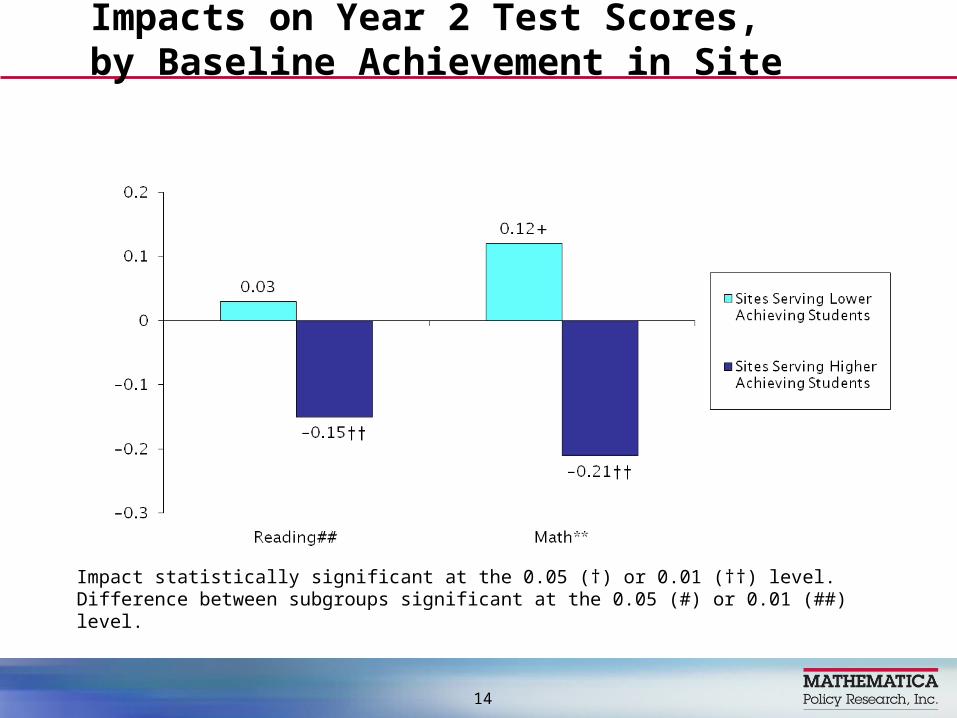
Impacts on Year 2 Test Scores, by Baseline Achievement in Site
14
Impact statistically significant at the 0.05 (†) or 0.01 (††) level.Difference between subgroups significant at the 0.05 (#) or 0.01 (##) level.
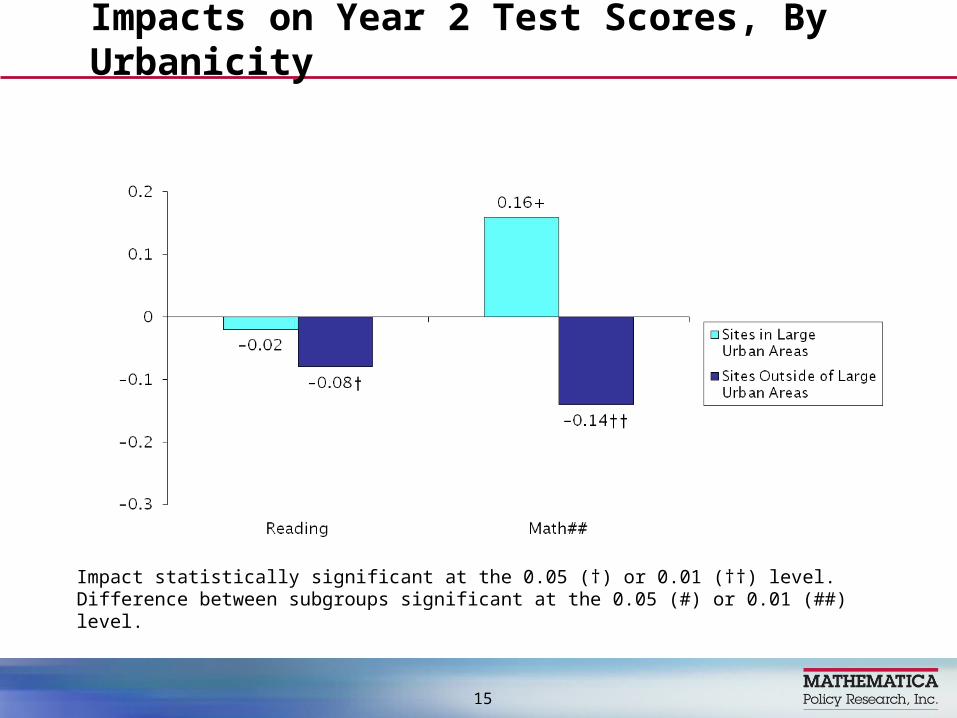
Impacts on Year 2 Test Scores, By Urbanicity
15
Impact statistically significant at the 0.05 (†) or 0.01 (††) level.Difference between subgroups significant at the 0.05 (#) or 0.01 (##) level.
No significant impacts on student achievement– Positive impacts on student/parent satisfaction with
school
Impacts vary significantly across sites
Most successful schools were those serving disadvantaged students, in large urban areas
Summary of Key Findings
16
First study to provide experimental estimates for a national sample of charter schools
Existing experimental studies limited to large urban areas (Boston, NYC)– They find positive impacts, consistent with our
results for large urban areas
Existing national studies are nonexperimental– They find insignificant or slightly negative results,
consistent with our overall impact estimates
Contribution to Literature
17
Report available at – http://ies.ed.gov/ncee/pubs/20104029/pdf/20104030.pdf– http://www.mathematica-mpr.com
Please contact:– Philip Gleason, Project Director
• [email protected]– Christina Clark Tuttle
• [email protected] – Melissa Clark
For More Information
18
Supplemental Slides
19
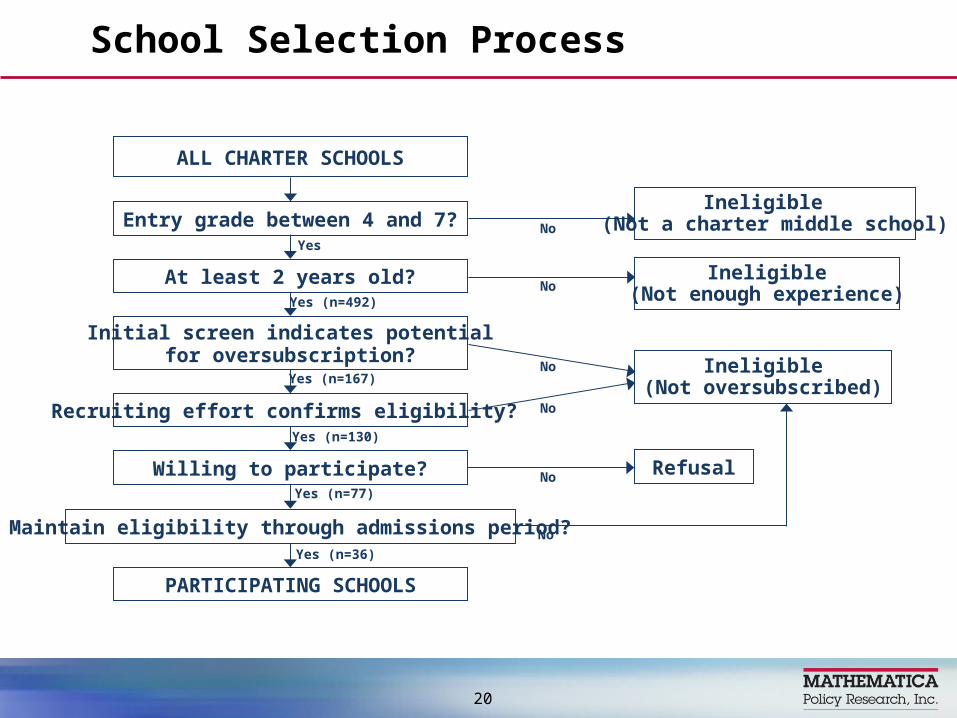
School Selection Process
20
Yes (n=77)
Yes (n=167)
ALL CHARTER SCHOOLS
NoYes
Ineligible (Not a charter middle school)Entry grade between 4 and 7?
At least 2 years old?
Initial screen indicates potentialfor oversubscription?
Ineligible(Not enough experience)
Recruiting effort confirms eligibility?
Willing to participate?
Ineligible(Not oversubscribed)
PARTICIPATING SCHOOLS
Refusal
Yes (n=492)
Yes (n=130)
Yes (n=36)
No
No
No
No
NoMaintain eligibility through admissions period?
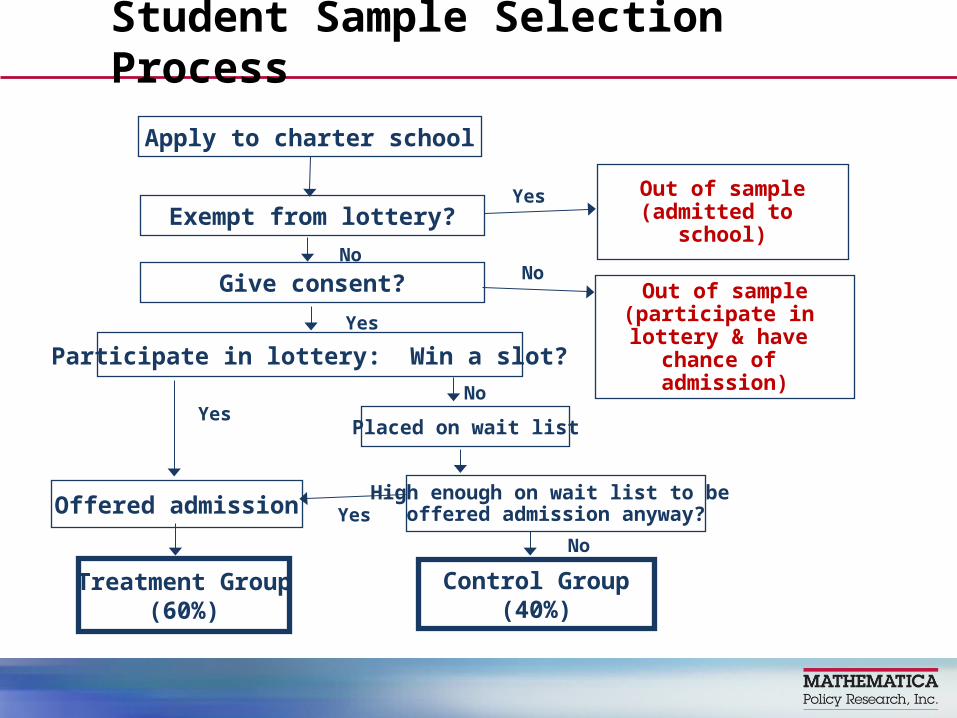
Student Sample Selection Process
Yes
Apply to charter school
Yes
No
No
No No
Out of sample(admitted to
school)
Yes
Yes
Exempt from lottery?
Give consent?
Participate in lottery: Win a slot?
Out of sample(participate in lottery & have
chance of admission)
Offered admission
Placed on wait list
High enough on wait list to be offered admission anyway?
Treatment Group(60%)
Control Group(40%)

Data Collection Timeline
22
Instrument Cohort 1 Cohort 2
Baseline survey Spring/Summer 2005 Spring/Summer 2006
School records
Baseline year 2004-2005 2005-2006
1st follow-up year 2005-2006 2006-2007
2nd follow-up year 2006-2007 2007-2008
Student/parent surveys
Student survey Spring 2006 Spring 2007
Parent survey Spring 2006 Spring 2007
Principal surveys
Study schools Fall 2006 Fall 2007
Non-study charter schools Fall 2007
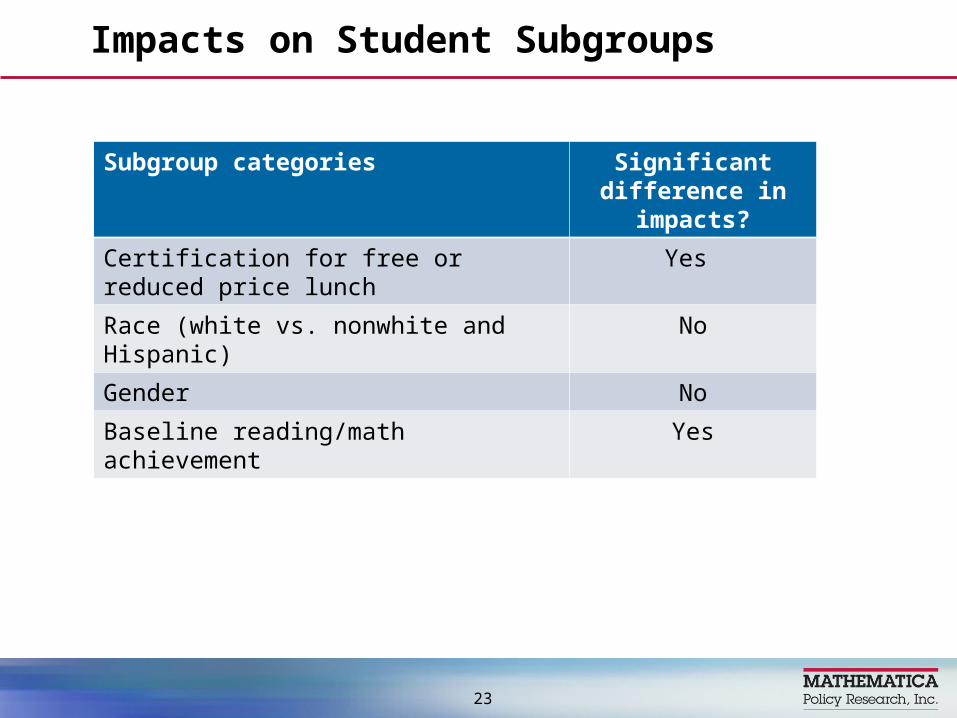
Impacts on Student Subgroups
23
Subgroup categories Significant difference in
impacts?
Certification for free or reduced price lunch Yes
Race (white vs. nonwhite and Hispanic) No
Gender No
Baseline reading/math achievement Yes
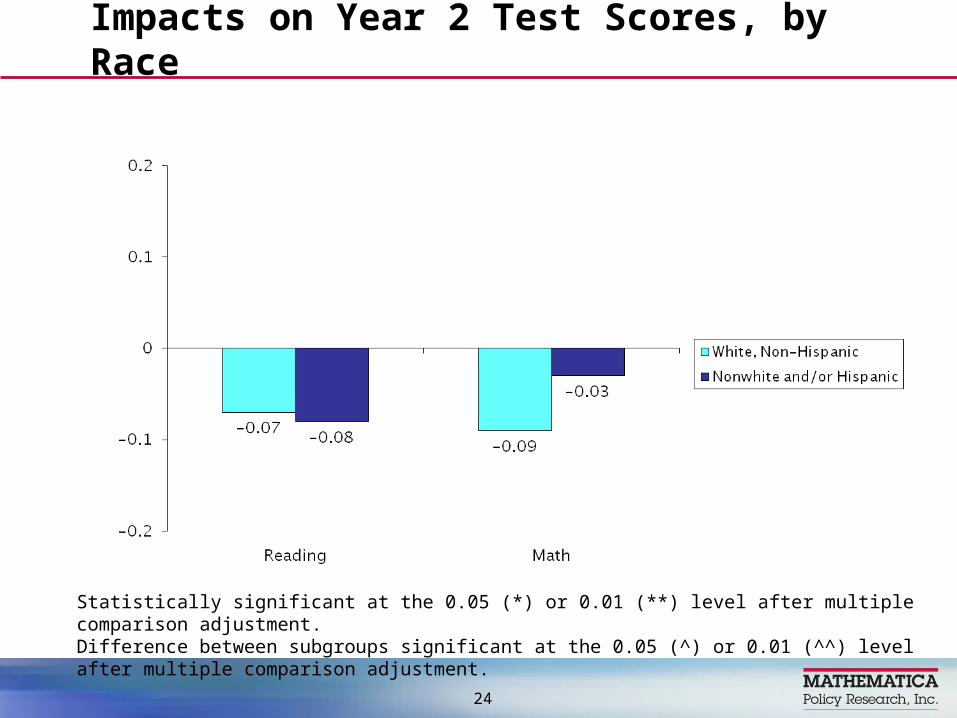
Impacts on Year 2 Test Scores, by Race
24
Statistically significant at the 0.05 (*) or 0.01 (**) level after multiple comparison adjustment.Difference between subgroups significant at the 0.05 (^) or 0.01 (^^) level after multiple comparison adjustment.
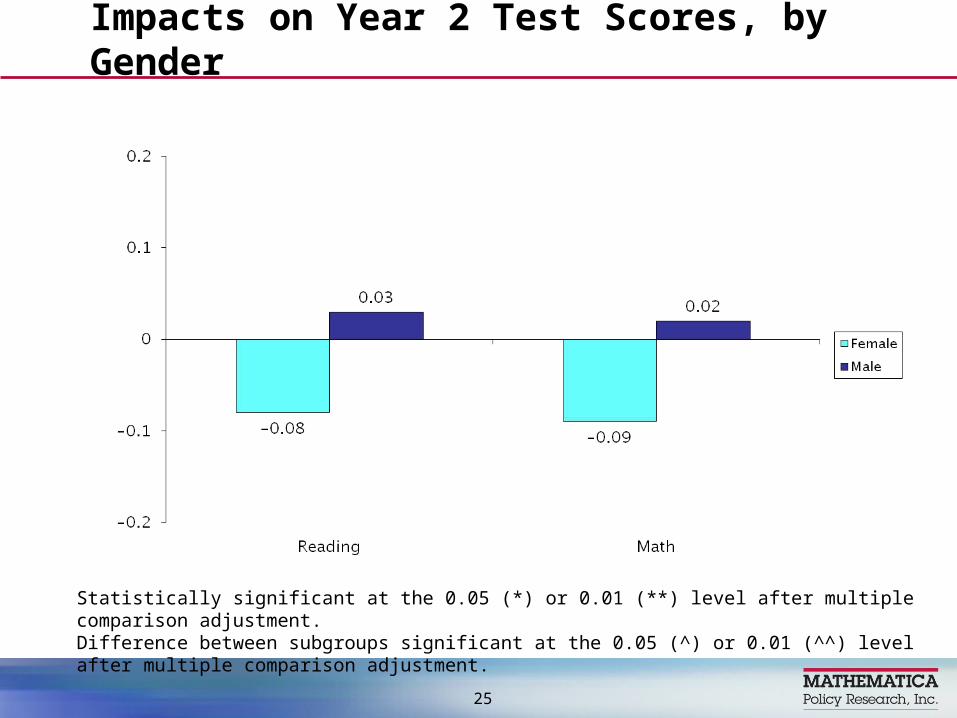
Impacts on Year 2 Test Scores, by Gender
25
Statistically significant at the 0.05 (*) or 0.01 (**) level after multiple comparison adjustment.Difference between subgroups significant at the 0.05 (^) or 0.01 (^^) level after multiple comparison adjustment.
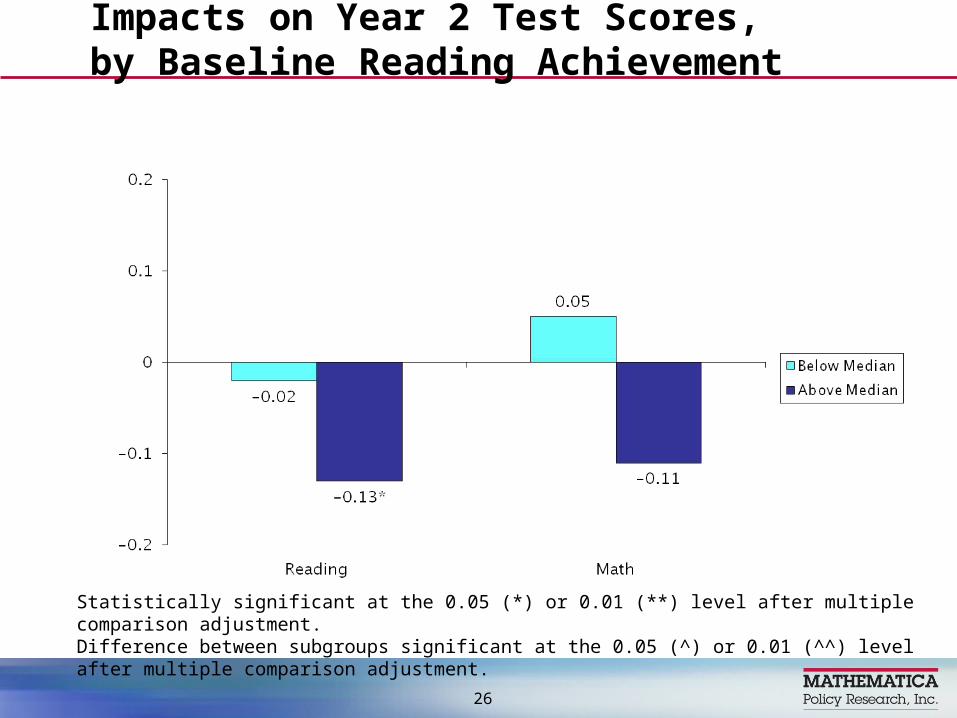
Impacts on Year 2 Test Scores, by Baseline Reading Achievement
26
Statistically significant at the 0.05 (*) or 0.01 (**) level after multiple comparison adjustment.Difference between subgroups significant at the 0.05 (^) or 0.01 (^^) level after multiple comparison adjustment.
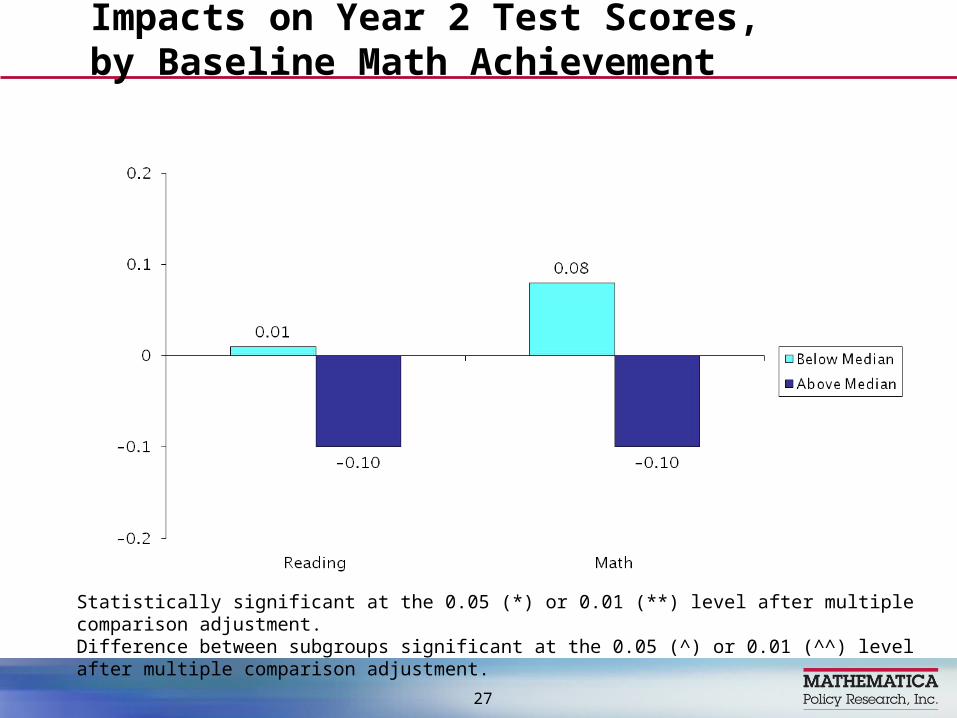
Impacts on Year 2 Test Scores, by Baseline Math Achievement
27
Statistically significant at the 0.05 (*) or 0.01 (**) level after multiple comparison adjustment.Difference between subgroups significant at the 0.05 (^) or 0.01 (^^) level after multiple comparison adjustment.