Embed Size (px)
Citation preview

NCEE 2010-4029 U.S. DEPARTMENT OF EDUCATION
The Evaluation of Charter School Impacts Final Report

This page is intentionally left blank.

June 2010 Philip Gleason Melissa Clark Christina Clark Tuttle Emily Dwoyer Mathematica Policy Research Marsha Silverberg Project Officer Institute of Education Sciences
NCEE 2010-4029 U.S. DEPARTMENT OF EDUCATION
The Evaluation of Charter School Impacts
Final Report

U.S. Department of Education Arne Duncan Secretary Institute of Education Sciences John Q. Easton Director National Center for Education Evaluation and Regional Assistance John Q. Easton Acting Commissioner June 2010 The report was prepared for the Institute of Education Sciences under Contract No. ED-01-C0039/0010. The project officer is Marsha Silverberg in the National Center for Education Evaluation and Regional Assistance. IES evaluation reports present objective information on the conditions of implementation and impacts of the programs being evaluated. IES evaluation reports do not include conclusions or recommendations or views with regard to actions policymakers or practitioners should take in light of the findings in the reports. This report is in the public domain. Authorization to reproduce it in whole or in part is granted. While permission to reprint this publication is not necessary, the citation should be: Gleason, P., Clark, M., Tuttle, C. C., and Dwoyer, E. (2010). The Evaluation of Charter School Impacts: Final Report (NCEE 2010-4029). Washington, DC: National Center for Education Evaluation and Regional Assistance, Institute of Education Sciences, U.S. Department of Education. To order copies of this report,
• Write to ED Pubs, U.S. Department of Education, P.O. Box 22207, Alexandria, VA 22304. • Call in your request toll free to 1-877-4ED-Pubs. If 877 service is not yet available in your area,
call 800-872-5327 (800-USA-LEARN). Those who use a telecommunications device for the deaf (TDD) or a teletypewriter (TTY) should call 800-437-0833.
• Fax your request to 703-605-6794. • Order online at www.edpubs.gov.
This report also is available on the IES website at http://ies.ed.gov/ncee. Upon request, this report is available in alternate formats such as Braille, large print, audiotape, or computer diskette. For more information, please contact the Department’s Alternate Format Center at 202-260-9895 or 202-205-8113.

v
ACKNOWLEDGMENTS
This study was made possible by the efforts of many individuals and organizations over a six-year period. We greatly appreciate the willingness of study charter school principals and other administrative staff to participate in the evaluation, as well as their contributions in providing us access to their lotteries and admissions processes and endless patience in answering questions about how these processes worked. Without their active involvement, this study would not have been possible.
The study and this report benefitted greatly from input at various stages from Paul Hill at the University of Washington’s Center on Reinventing Public Education. We also thank the study’s technical working group for their contributions. The group included Tom Cook, Jay Greene, Laura Hamilton, Rick Hanushek, Helen Ladd, Rebecca Maynard, Robert Meyer, and Larry Orr. At Mathematica Policy Research, Brian Gill and Peter Schochet provided critical technical review and comments. We also thank two anonymous reviewers for their thoughtful comments and suggestions.
The study would not have been possible without contributions from many other individuals at Mathematica as well as our research partner, Optimal Solutions Group (OSG). Rita Stapulonis led all aspects of the data collection effort for the beginning years of the study and Robert Olsen provided input to the study design and school recruiting efforts. Monica Leal Priddy oversaw the evaluation activities at OSG and made valuable contributions to the school recruiting and data collection efforts. We also thank other OSG staff for their contributions, including Mark Turner, Ja-Nee Jackson, Mark Partridge, Veronika Peleschuk, and Amy Peterson. At Mathematica, Alex Bogin, Stacie Feldman, Annalee Kelly, and Chris Rafferty served as liaisons to participating charter schools, as well as assisted with other aspects of data collection. Expert research assistance was provided by Jeff Holt, Dominic Harris, Rita Zota, Laura Guy, Patricia Seunarine, Kathleen Paganelli, Bonnie Hart, Jeff Grigg, and Jill Bowdon. Jennifer Baskwell led the production of the report, with assistance from Donna Dorsey, Susie Moore, and Lisa Walls. Last but not least, we would like to thank the staff at Mathematica’s Princeton Survey Operations Center for collecting the data used for the analysis, and the team of charter school recruiters, who worked diligently to secure the participation of the study’s charter schools.

This page is intentionally left blank.

vii
DISCLOSURE OF POTENTIAL CONFLICTS OF INTEREST
The research team for this evaluation consists of a prime contractor, Mathematica Policy Research; its subcontractor, Optimal Solutions Group; and a consultant, Paul Hill at the University of Washington’s Center on Reinventing Public Education. None of these organizations or their key staff members have financial interests that could be affected by findings from the study. None of the members of the Technical Working Group, convened by the research team to provide advice and guidance, have financial interests that could be affected by findings from the study.

This page is intentionally left blank.

ix
CONTENTS
EXECUTIVE SUMMARY ........................................................................................... xvii
I INTRODUCTION .......................................................................................................... 1
A. Charter Schools as a Reform Strategy .................................................................. 1
B. Study Overview ..................................................................................................... 3
II EVALUATION DESIGN ................................................................................................ 5
A. Recruiting Charter Middle Schools for the Study................................................... 5
B. Recruiting Students into the Study and the Admissions Lotteries Held by Participating Charter Schools ................................................................................ 7
1. Student Eligibility for the Study (Intake and Consent) ................................... 8 2. Charter School Lotteries and Waiting List Admissions .................................. 9 3. Primary Analysis Sample ............................................................................. 11
C. Data Used in the Study ....................................................................................... 12
D. Outcome Measures ............................................................................................. 16
E. Overview of the Analytic Approach ..................................................................... 18
1. Impact Analysis............................................................................................ 18 2. Examining Factors Related to Charter School Impacts ............................... 22
III SCHOOLS AND STUDENTS PARTICIPATING IN THE STUDY .............................. 25
A. How Did Participating Schools Differ from Other Charter Middle Schools? ........ 25
B. How Did Schools Attended by Lottery Winners Differ from Those Attended by Lottery Losers? ............................................................................................... 30
C. How Did Lottery Winners and Lottery Losers Compare at the Time of the Lotteries? ............................................................................................................. 34
D. How Did Students Who Applied to Study Charter Schools Differ from Students Who Did Not Apply? ............................................................................. 34
E. What Proportion of Lottery Winners and Losers Changed Schools Each Year? ................................................................................................................... 37
IV IMPACTS ON STUDENTS AND PARENTS .............................................................. 41
A. Academic Achievement ....................................................................................... 41
B. Other Measures of Performance and Effort in School ......................................... 47

x
C. Student Well-Being .............................................................................................. 47
D. Student Behavior and School Disciplinary Action ................................................ 52
E. Satisfaction with and Perceptions of School ....................................................... 55
F. Parent Involvement ............................................................................................. 58
V EXPLORING THE RELATIONSHIP BETWEEN CHARTER SCHOOL CHARACTERISTICS AND IMPACTS ........................................................................ 61
A. Do Charter School Impacts Vary? ....................................................................... 63
B. What Charter School Policies and Practices Are Related to Impacts? ............... 65
C. How Are the Characteristics of Study Charter Schools’ Student Populations Related to Impacts? ............................................................................................ 70
D. Exploratory Investigation of Why Certain Study Charter Schools Had More Positive or Negative Impacts ............................................................................... 74
VI CONTRIBUTION OF STUDY FINDINGS TO THE RESEARCH LITERATURE ON CHARTER SCHOOL ACHIEVEMENT IMPACTS ...................................................... 75
A. What Do We Know from Other Studies? ............................................................. 75
B. Are This Study’s Findings Consistent with Previous Research? ......................... 77
1. Average Impacts .......................................................................................... 78 2. Variation in Charter School Impacts ............................................................ 78 3. Charter School Impacts on Subgroups of Students ..................................... 79 4. Policies and Practices Associated with Charter School Impacts ................. 80
REFERENCES ........................................................................................................................... 87
APPENDIX A: SELECTING THE CHARTER SCHOOL AND STUDENT SAMPLES .............. A-1
APPENDIX B: CALCULATION OF SAMPLE WEIGHTS .......................................................... B-1
APPENDIX C: OUTCOME MEASURES FOR THE IMPACT ANALYSIS ................................ C-1
APPENDIX D: ANALYTIC METHODS ...................................................................................... D-1
APPENDIX E: SUPPLEMENTAL MATERIALS FOR CHAPTER III .......................................... E-1
APPENDIX F: SUPPLEMENTAL TABLES FOR CHAPTER IV ................................................. F-1
APPENDIX G: SUPPLEMENTAL TABLES FOR CHAPTER V ................................................ G-1

xi
TABLES
ES.1 Characteristics of Schools Attended by Lottery Winners and Lottery Losers ..................................................................................................... xix
II.1 Charter Middle Schools Participating in the Study, by Census Subregion .............................................................................................................. 7
II.2 Schedule of Data Collection Activities ................................................................. 13
II.3 Outcome Measures for the Charter School Impact Evaluation ........................... 16
II.4 Factors Potentially Related to Charter School Impacts ....................................... 24
III.1 Characteristics of Study Charter Schools and Nonstudy Charter Middle Schools .................................................................................................... 26
III.2 Characteristics of Schools Attended by Lottery Winners and Schools Attended by Lottery Losers ................................................................................. 31
III.3 Baseline Characteristics of Lottery Winners and Losers in Main Analysis Sample .................................................................................................. 35
III.4 Comparison of Lottery Participants with All Students in Their Schools ............... 38
III.5 Percent of Students Changing Schools ............................................................... 39
IV.1 Impacts on Student Achievement ........................................................................ 42
IV.2 Impacts on State Proficiency Levels.................................................................... 48
IV.3 Impacts on Other Measures of Academic Performance ...................................... 49
IV.4 Impacts on Student Effort in School .................................................................... 50
IV.5 Impacts on Other Measures of Student Well-Being ............................................ 51
IV.6 Impacts on School Disciplinary Action and Student Misbehavior in School .............................................................................................................. 53
IV.7 Impacts on Student Behavior Outside of School ................................................. 54
IV.8 Impacts on Student and Parent Satisfaction with School .................................... 56
IV.9 Impacts on Student and Parent Perceptions of School Environment .................. 57
IV.10 Impacts on Parental Involvement in Student's Education ................................... 59
V.1 Factors Potentially Influencing Charter School Impacts ...................................... 62

xii
V.2 Summary of Estimated Relationships Between Site Characteristics and Charter School Impacts Based on Bivariate Associations, Multivariate Regressions, and Subgroup Analysis ................................................................. 66
VI.1 Summary of Charter School Impacts on Achievement from Selected Research Studies ................................................................................................ 82
A.1 Number of Potentially Eligible Charter Schools, by Census Sub-regions ....................................................................................................... A-5
A.2 Schedule of Lottery Dates at Study Charter Schools ........................................ A-9
A.3 Exemptions from Study Schools’ Admissions Lotteries ..................................... A-9
A.4 Pre-Lottery and Post-Lottery Consent Collections at Selected Study Charter Schools .................................................................................... A-11
A.5 Overall Consent Collection .............................................................................. A-11
A.6 Characteristics of Study Charter School Lotteries ........................................... A-12
A.7 Type of School Attended in Years 1 and 2, by Treatment Status and Timing of Admissions Offers ........................................................................... A-14
A.8 Response Rates .............................................................................................. A-16
C.1 Outcome Measures for the Charter School Impact Evaluation ......................... C-5
C.2 Means, Standard Deviations, Sample Sizes, and Reliability of Outcome Measures for the Charter School Impact Evaluation ......................... C-7
C.3 Mapping of State Proficiency Levels to Study Proficiency Categories .............. C-9
D.1 Minimum Detectable Effect Sizes on Student Achievement .............................. D-5
D.2 Covariates Included in Impact Analysis Models ................................................ D-8
E.1 Percentage of Schools with Valid Data on School Characteristics .................... E-5
E.2 Percentage of Students in Analytic Sample with Valid Data on School Characteristics ................................................................................................... E-6
E.3 Type of School Attended During Baseline and Follow-up Period, by Treatment Status ............................................................................................... E-6
E.4 School Characteristics: Study Schools Versus Other Charter Middle Schools .............................................................................................................. E-9
E.5 Academic Programming: Study Schools Versus Other Charter Middle Schools ............................................................................................................ E-11
E.6 Characteristics of Leadership and Staff: Study Schools Versus Other Charter Schools ............................................................................................... E-13

xiii
E.7 Student Characteristics and Outcomes: Study Schools Versus Other Charter Middle Schools ................................................................................... E-14
E.8 Autonomy and Accountability: Study Schools Versus Other Charter Middle Schools ................................................................................................ E-16
E.9 School Characteristics: Schools Attended by Lottery Winners Versus Schools Attended by Lottery Losers ................................................................ E-18
E.10 Academic Programming: Schools Attended by Lottery Winners Versus Schools Attended by Lottery Losers ................................................................ E-19
E.11 Characteristics of Leadership and Staff: Schools Attended by Lottery Winners Versus Schools Attended by Lottery Losers ..................................... E-20
E.12 Student Characteristics and Performance: Schools Attended by Lottery Winners Versus Schools Attended by Lottery Losers ......................... E-21
E.13 Autonomy: Schools Attended by Lottery Winners Versus Schools Attended by Lottery Losers ............................................................................. E-22
E.14 Baseline Characteristics of Lottery Winners and Lottery Losers in Full Sample .................................................................................................. E-23
E.15 Baseline Characteristics of Lottery Winners and Losers Included in Analysis of Year 2 Test Score Data................................................................. E-25
F.1 Impacts on Student Achievement Sensitivity of Impact Estimates to Method of Aggregating Site-Level Impacts........................................................ F-7
F.2 Impacts on Student Achievement Sensitivity of Impact Estimates to Adjustment for Covariates ................................................................................. F-8
F.3 Impacts on Student Achievement Sensitivity of Impact Estimates to Rules for Dropping or Retaining Sites ........................................................... F-9
F.4 Impacts on Student Achievement Sensitivity of Impact Estimates to Approach for Accounting for Missing Data ...................................................... F-10
F.5 Impacts on Student Achievement Sensitivity of Impact Estimates to Clustering of Standard Errors .......................................................................... F-11
F.6 Impacts on Student Achievement Sensitivity to Definition of Treatment Status ............................................................................................. F-12
F.7 Impacts on Student Achievement by Certification for Free or Reduced-Price Lunch ...................................................................................... F-13
F.8 Impacts on Student Achievement by Race...................................................... F-14
F.9 Impacts on Student Achievement by Gender .................................................. F-15
F.10 Impacts on Student Achievement by Baseline Reading Achievement .................................................................................................... F-16

xiv
F.11 Impacts on Student Achievement by Baseline Math Achievement .................................................................................................... F-17
G.1 Correlation of Factors Included in Analysis of Factors Associated with Charter School Impacts ........................................................... G-9
G.2 Bivariate Association Between Factors and Charter School Impacts ............................................................................................................ G-10
G.3 Association Between Factors and Charter School Impacts, Multivariate Regressions ................................................................................. G-11
G.4 Association Between Factors and Charter School Impacts on Student/Parent Satisfaction, Bivariate Regressions ................................... G-12
G.5 Impacts on Student Achievement by Level of Autonomy in Site .............................................................................................................. G-13
G.6 Impacts on Student Achievement by Revenue in Site ..................................... G-14
G.7 Impacts on Student Achievement by Total Enrollment in Site .............................................................................................................. G-15
G.8 Impacts on Student Achievement by Hours of Operation of Site .............................................................................................................. G-16
G.9 Impacts on Student Achievement by Student-Teacher Ratio in Site .............................................................................................................. G-17
G.10 Impacts on Student Achievement by Ability Grouping in Site .......................... G-18
G.11 Impacts on Student Achievement by Percent Certified for Free and Reduced-Price Lunch in Site............................................................ G-19
G.12 Impacts on Student Achievement by Average Baseline Reading Achievement in Site ......................................................................................... G-20
G.13 Impacts on Student Achievement by Average Baseline Math Achievement in Site ......................................................................................... G-21
G.14 Impacts on Student Achievement by Average Baseline Reading and Math Achievement in Site ......................................................................... G-22
G.15 Impacts on Student Achievement by Percent White in Site ............................ G-23
G.16 Impacts on Student Achievement by Site Urbanicity ....................................... G-24

xv
FIGURES
ES.1 Characteristics of Students in the Sample ........................................................... xx
ES.2 Average Year 2 Test Scores of Lottery Winners and Losers ............................ xxiii
ES.3 Student and Parent Satisfaction with School Among Lottery Winners and Losers .......................................................................................... xxiv
ES.4 Measures of Student Effort and Well-Being, Lottery Winners and Losers ......................................................................................................... xxiv
ES.5 Impacts on Year 2 Test Scores, by Income Status (as determined by eligibility for the free and reduced-price lunch program) ............ xxv
ES.6 Distribution of Site-Level Impact Estimates ....................................................... xxvi
ES.7 Impacts on Year 2 Test Scores, by Characteristics of Charter Schools’ Student Populations: Economic Status .............................................. xxvii
ES.8 Impacts on Year 2 Test Scores, by Characteristics of Charter Schools’ Student Populations: Mean Baseline Test Scores ............................ xxviii
I.1 Federal Appropriations for the Public Charter School Programs, 2000-2010 ............................................................................................ 2
II.1 Flow of Charter Schools Through Selection Process ............................................ 6
II.2 Sample Selection Process..................................................................................... 8
II.3 Type of School Attended During Year 1, by Treatment Status ............................ 20
IV.1 Impacts on Year 2 Test Scores, by Certification for Free or Reduced Price Lunch .......................................................................................... 44
IV.2 Impacts on Year 2 Test Scores, by Race ............................................................ 45
IV.3 Impacts on Year 2 Test Scores, by Gender ........................................................ 45
IV.4 Impacts on Year 2 Test Scores, by Baseline Reading Achievement ........................................................................................................ 46
IV.5 Impacts on Year 2 Test Scores, by Baseline Math Achievement ........................................................................................................ 46
V.1 Distribution of Site-Level Impact Estimates ......................................................... 64
V.2 Impacts on Year 2 Test Scores, by Charter School Revenues ........................... 67
V.3 Average Enrollment in Treatment and Control Schools, by Site’s Enrollment Status .................................................................................................................. 68

xvi
V.4 Impacts on Year 2 Test Scores, by School Enrollment ....................................... 69
V.5 Impacts on Year 2 Test Scores, by Use of Ability Grouping ................................ 70
V.6 Impacts on Year 2 Test Scores, by Percentage Eligible for Free or Reduced-Price Meals in Site ............................................................................................... 71
V.7 Mean Percentage Eligible for Free or Reduced-Price School Meals at Sites Serving More Versus Fewer Disadvantaged Students ........................... 71
V.8 Impacts on Year 2 Test Scores, by Mean Baseline Achievement in Site .................................................................................................................. 72
V.9 Impacts on Year 2 Test Scores, by Urbanicity .................................................... 73
A.1 Flow of Charter Schools Through Selection Process ........................................ A-4
A.2 Student Sample Selection Process ................................................................... A-7
G.1 Percentage of Peers Meeting State Proficiency Standards at Sites Serving More Versus Fewer Disadvantaged Students ......................... G-7

xvii
EXECUTIVE SUMMARY
Charter schools, first launched in the 1990s, are an important and growing component of the public school system in the United States. As of November 2009, more than 5,000 charter schools served over 1.5 million students—approximately three percent of all public school students—in 40 states and the District of Columbia (Center for Education Reform 2009). Charter schools are intended to play a key role in school improvement under the existing Elementary and Secondary Education Act (No Child Left Behind) as well as the programs established under the American Recovery and Reinvestment Act of 2009. However, there remains considerable debate as to whether, how, and under what circumstances charter schools improve the outcomes of students who attend them. This report summarizes the results of a new study: the Evaluation of Charter School Impacts, a large-scale randomized trial of the effectiveness of charter schools funded by the Institute of Education Sciences and conducted by Mathematica Policy Research and its partners.1
The evaluation, which we conducted in 36 charter middle schools across 15 states, compares outcomes of students who applied and were admitted to these schools through randomized admissions lotteries (lottery winners) with the outcomes of students who also applied to these schools and participated in the lotteries but were not admitted (lottery losers). This analytic approach produces the most reliable impact estimates. But because the study could only include charter middle schools that held lotteries, the results do not necessarily apply to the full set of charter middle schools in the U.S.
Key findings from the evaluation include:
• On average, charter middle schools that hold lotteries are neither more nor less successful than traditional public schools in improving student achievement, behavior, and school progress. Participating schools had no significant impacts on math or reading test scores either a year or two years after students applied, other measures of academic progress (such as attendance or grade promotion), or student conduct within or outside of school. Being admitted to a study charter school did significantly and consistently improve both students’ and parents’ satisfaction with school.
• The impact of charter middle schools on student achievement varies significantly across schools. Across 28 sites (covering 32 schools), the effects on reading scores after two years were estimated to be greater than zero in 11 sites and less than zero in 17 sites (with magnitudes ranging from -0.43 to +0.33 standard deviation units), with 4 of the individual site estimates statistically significant. The estimated effects on math scores were greater than zero in 10 sites and less than zero in 18 of the 28 sites (-0.78 to +0.65 standard deviation units), with 10 of the site estimates statistically significant.
• In our exploratory analysis, for example, we found that study charter schools serving more low income or low achieving students had statistically significant positive effects on math test scores, while charter schools serving more advantaged students—those with higher income and prior achievement—had
1 The evaluation team also included Optimal Solutions Group and Paul Hill of the University of Washington’s
Center on Reinventing Public Education.

xviii
significant negative effects on math test scores. Charter middle schools in large urban areas also had significant positive impacts on math achievement compared to negative impacts in other locales, although urbanicity was no longer an influential factor once such characteristics as students’ demographics and income levels were controlled for. There were also differential effects on reading achievement, with negative and significant impacts for study charter schools serving more advantaged students and no impacts for study charter schools serving fewer advantaged students.
• Some operational features of charter middle schools are associated with more positive (or less negative) impacts on achievement. These features include smaller enrollments and the use of ability grouping in math or English classes. Although impacts differed for study charter schools with longer- versus shorter- hours of operations or higher versus lower revenue per student, these features were no longer significant once other school and student characteristics were controlled for. We found no statistically significant relationships between achievement impacts and the charter schools’ policy environment, including the extent of its decision-making autonomy, the type of authorizer and how the authorizer held the school accountable, and whether it was operated by a private organization.
What Kinds of Charter Schools Participated in the Study?
To be eligible for the study, charter middle schools had to meet two important criteria.2 First, they had to have been in operation for at least two years, on the grounds that these schools were likely to be relatively stable in their organization and procedures. Second, each participating charter middle school had to have more applicants to their entry grade (4-7) in the year of the study than they could accommodate and to hold an admissions lottery to determine which students would be admitted. Not all charter schools met these criteria or agreed to participate in the study, and those that did participate differed in some ways from other charter middle schools nationally. In addition to operating longer than other charter middle schools in the country (7.0 versus 5.9 years), based on study data, participating schools served more advantaged students. For example, a smaller proportion of students in study charter schools were eligible for free or reduced-price school meals (44 versus 62 percent), came from minority racial or ethnic groups (47 versus 62 percent), or scored below the proficient level on their state assessment at the time they applied to the charter school (for example, 34 versus 49 percent in math). On the other hand, study charter schools were statistically similar to other charter middle schools in their location (urban versus suburban or rural), size, per student revenues, and teacher qualifications.
Study charter schools—attended by 78 percent of the lottery winners—were different from the schools their students would have attended if they had not won entrance to the charter school through the admissions lottery; in other words, schools attended by lottery losers (Table 1). Compared to the schools that lottery losers attended, lottery winners attended schools that:
2 Middle schools were chosen primarily because of the likely availability of test score data from school records for
this group. By relying on school records for test scores, we were able to avoid administering a test to sample members, reducing evaluation costs and the burden on sample members.

xix
• were smaller (484 versus 736 students)
• had longer school days (7.2 versus 6.7 hours)
• were less likely to have a library (64 versus 88 percent) or gym (53 versus 79 percent)
• operated more autonomously
There were no statistically significant differences in the racial/ethnic distribution of students, percentage of students eligible for free or reduced-price school meals, student-teacher ratios, or length of the school year at the two sets of institutions. However, there were differences of 10 percentage points or more for some student characteristics, and some of these differences nearly reached the level of statistical significance: the average percentage of white, non-Hispanic students at schools attended by lottery winners was 56 versus 46 percent at schools attended by lottery losers (p-value = 0.191); the average percentage of students eligible for free or reduced-price meals was 33 versus 45 percent (p-value = 0.055) respectively.
Table ES.1. Characteristics of Schools Attended by Lottery Winners and Lottery Losers
Schools Lottery Winners Attended
Schools Lottery Losers Attended Difference
Enrollment (Means) Total enrollment 484 736 -252†† Student-teacher ratio 15.1 15.9 -0.8
Time in School (Means) Length of school day, in hours 7.2 6.7 0.4† Length of school year, in days 181.2 179.9 1.3
School Facilities (Percentages) Library 64% 88% -25%†† Gym 53% 79% -27%†† Counselor 81% 88% -7% Nurse’s office 72% 85% -13%
Method of Organizing Classes (Percentages) Some/all math classes grouped by ability level 39% 56% -17% Some/all English classes grouped by ability level 36% 46% -9%
Characteristics of Students at School (Means) Percentage of Hispanic students 26% 32% -5% Percentage of white students 56% 46% 10% Percentage of black students 12% 16% -3% Percentage of students receiving free or reduced-price lunches 33% 45% -12%
Autonomy Indexa (Mean) 4.1 1.4 2.6††
a The autonomy index measures the extent to which principals report that they have control over decisions relating to staffing, budgetary matters, curriculum/instruction, or other school policies. The index has possible values ranging from 1 to 5, with higher values reflecting greater control over these decisions.
†Difference is statistically significant at the 0.05 level, two-tailed test. ††Difference is statistically significant at the 0.01 level, two-tailed test.
What Kinds of Students Applied to Study Schools and Participated in the Study?
On average, 7 out of 10 students met their state proficiency level in reading (71 percent) and math (66 percent) in the year they applied (Figure 1). Fifty-eight percent were white, 11 percent black, and more than one quarter (28 percent) were of Hispanic origins. In terms of eligibility for special programs and services, one third of participating applicants qualified for the

federal free or reduced-price lunch program, 17 percent had an individualized education plan (IEP), and 9 percent were limited English proficient or English language learners.
By comparing the characteristics of the students not offered admission to study charter schools (that is, the lottery losers) with the full populations of students at the schools they attended during the follow-up period, we were able to examine how applicants to the charter schools in the study differed from other students living in the area who did not apply to the charter schools. The charter school applicants were more likely to have achieved proficiency on their state reading tests (73 versus 57 percent) as well as their state math test (58 versus 45 percent).
Figure ES.1. Characteristics of Students in the Sample
0.710.66
0.58
0.11
0.28
0.34
0.17
0.09
0.00
0.20
0.40
0.60
0.80
Proficient: Reading
Proficient: Math
White Black Hispanic FRP IEP LEP
Proportion
FRP = Free or reduced-price school meals. IEP = Individualized education plan. LEP = Limited English proficient or English language learner. How Were the Impacts Estimated?
To estimate charter schools impacts, we compared outcomes of lottery winners to those of lottery losers in each participating site, controlling for students’ background characteristics. We then averaged impacts over all the sites to produce an overall estimate of the impact of being admitted to a study charter school.
xx

Study Design
Participating Schools: Charter middle schools that held admissions lotteries in their entry grade were recruited to participate in the study during the 2004-2005 and 2005-2006 school years. The evaluation included 36 schools in 15 states.
Participating Students: Applicants to the schools’ entry grade who participated in the schools’ admissions lotteries and for whom we obtained parental consent formed the student sample. Students admitted to the school outside the lottery process were excluded. The primary analysis sample was also restricted to students who took the state assessment in the previous year (typically those who attended traditional public schools). This sample included 2,330 students.
Research Design: Lottery winners who were offered admission to a participating charter school—either at the time of the lottery or through the beginning of the school year—formed the study’s treatment group. The control group comprised lottery losers who were not offered admission. Study team members observed participating schools’ lotteries and monitored the entire admissions process at each school.
Analysis: In each participating charter school, impacts were estimated by comparing average outcomes among lottery winners with those of lottery losers over the two years following the lottery, controlling for students’ background characteristics. An average impact was calculated over all participating schools. We conducted a variety of tests to determine the sensitivity of the results to the specific methods used to define the analysis sample and estimate impacts. For an exploratory analysis examining the relationship between achievement impacts and schools’ characteristics and policy environments, we used the main impact model to estimate the correlation between a site’s impact and the school characteristic or policy of interest.
Outcomes: The primary outcome of interest was student achievement, as measured by students’ performance on their state tests in reading and math. Because the tests varied from state to state, we converted scores to a comparable scale (z-scores) for the analysis. In addition, we conducted an exploratory analysis of charter schools’ impacts on several other outcomes, including student effort in school, behavior, and attitudes, as well as parental involvement and satisfaction. These additional outcomes came from school administrative records and student and parent surveys.
We also estimated the impact of actually attending a charter school, as opposed to simply being offered admission to the school. Most of the students offered admission to study charter schools as lottery winners ultimately attended those schools (78 percent), and another 3 percent attended a non-participating charter school nearby. The remaining lottery winners chose to attend a traditional public school (15 percent), a private school (3 percent), or were either home schooled or the school type was unknown (1 percent). Most students who did not win the charter school lotteries attended a traditional public school (78 percent). However 15 percent attended a charter school (6 percent attended one participating in the study and 9 percent attended a non-study charter school)3, 4 percent attended a private school, and the remaining 3 percent were either home schooled or their school type was unknown. To take into account the fact that not all lottery winners attended a charter school and that some lottery losers did attend a charter school, we used a standard statistical modeling approach in which the lotteries act as an “instrumental variable” for charter school
xxi
3 Lottery losers who attended a participating charter middle school were students who were either mistakenly
admitted to the school despite a losing lottery draw or who were admitted to the school after the first half of the school year following the school lottery. Because these students were admitted after we had made a final determination of their treatment status and they did not receive the full charter school treatment, they remained in the control group.
xxii
attendance. The results of our analysis were similar regardless of whether we estimated the impact of being admitted to a study charter school or the impact of actually attending a charter school.
The primary outcome of interest for this study was student achievement, as reflected by students’ performance on state tests in reading and math. Because the tests varied from state to state, we converted scores to a comparable scale for the analysis. The converted scores, or z-scores, reflect students’ performance on their state test relative to the typical student in that state and grade. This is a standard approach in examining assessment data across multiple states.
What Was the Average Impact of Study Charter Schools?
The main goal of the study was to estimate charter school impacts on student achievement. In addition, to further our understanding of charter schools’ influence, we conducted an exploratory analysis of charter schools’ impacts on several other outcomes, including student effort in school, behavior, and attitudes, as well as parental involvement and satisfaction.4 Estimating impacts on all these outcomes, the study found the following:
• On average, study charter schools did not have a statistically significant impact on student achievement. Although students admitted to charter middle schools through lotteries scored lower on state reading and math assessments (by 0.06 to 0.07 standard deviations in Year 2—the second year after the lottery) than students who applied but were not admitted (lottery losers), these differences were not statistically significant after adjusting for multiple treatment-control comparisons; thus these findings may be false discoveries (Figure 2).5
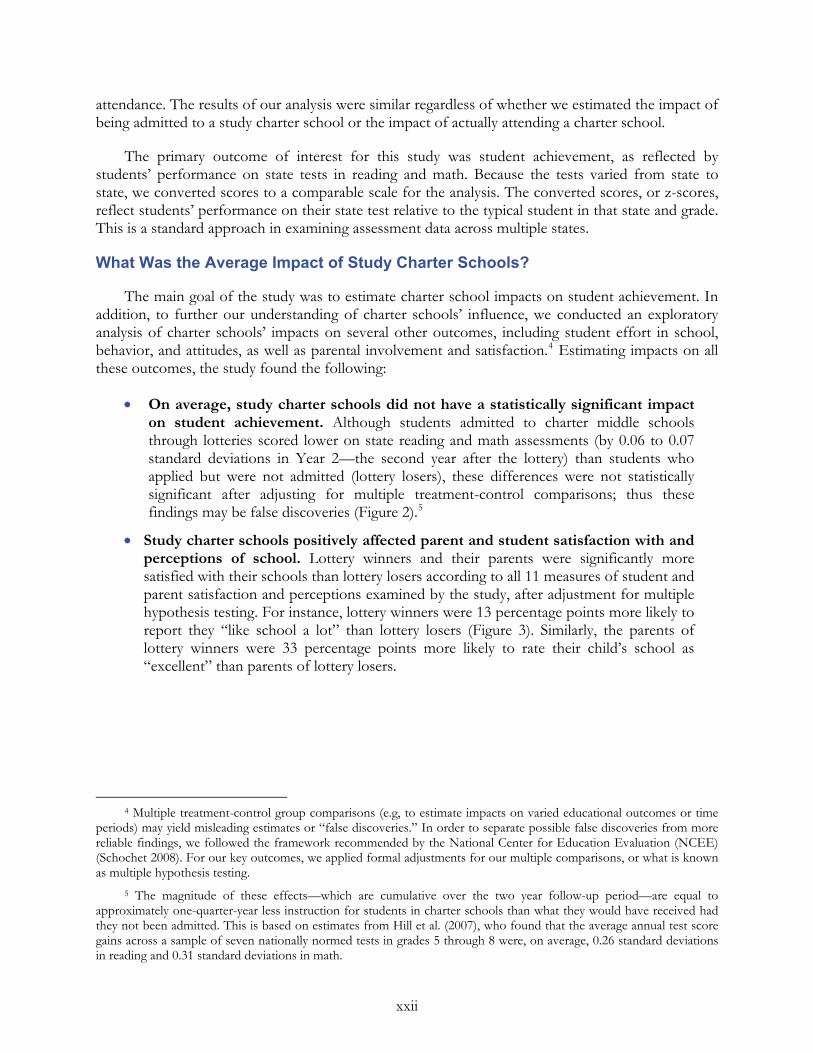
• Study charter schools positively affected parent and student satisfaction with and perceptions of school. Lottery winners and their parents were significantly more satisfied with their schools than lottery losers according to all 11 measures of student and parent satisfaction and perceptions examined by the study, after adjustment for multiple hypothesis testing. For instance, lottery winners were 13 percentage points more likely to report they “like school a lot” than lottery losers (Figure 3). Similarly, the parents of lottery winners were 33 percentage points more likely to rate their child’s school as “excellent” than parents of lottery losers.
4 Multiple treatment-control group comparisons (e.g, to estimate impacts on varied educational outcomes or time
periods) may yield misleading estimates or “false discoveries.” In order to separate possible false discoveries from more reliable findings, we followed the framework recommended by the National Center for Education Evaluation (NCEE) (Schochet 2008). For our key outcomes, we applied formal adjustments for our multiple comparisons, or what is known as multiple hypothesis testing.
5 The magnitude of these effects—which are cumulative over the two year follow-up period—are equal to approximately one-quarter-year less instruction for students in charter schools than what they would have received had they not been admitted. This is based on estimates from Hill et al. (2007), who found that the average annual test score gains across a sample of seven nationally normed tests in grades 5 through 8 were, on average, 0.26 standard deviations in reading and 0.31 standard deviations in math.

Figure ES.2. Average Year 2 Test Scores of Lottery Winners and Losers
0.310.33
0.370.39
0.00
0.10
0.20
0.30
0.40
0.50
Reading Math
Lottery Winners
Lottery Losers
z-Score
Note: Test scores shown here are based on students’ performance on state assessments across multiple
states. To make scores comparable across states, they were standardized into effect size or z-score units, in which a one unit change represents one standard deviation among all of the students in a state
+Difference in means is statistically significant at the 0.05 level after adjusting for multiple hypothesis testing. ++Difference in means is statistically significant at the 0.01 level after adjusting for multiple hypothesis testing.
• Study charter schools did not significantly affect most other outcomes examined. The study estimated charter schools’ impacts on 35 other outcomes, including absences, suspensions, and other measures of student performance, as well as survey-based measures of student effort in school, student well-being, student behavior and attitudes, and parental involvement. There was no evidence that study charter schools had any impact on the majority of these outcomes.6 For instance, there were no significant differences between lottery winners and losers in the proportion reporting that they worked hard in school or expected to attend college (Figure 4). Similarly, there were no significant differences between the groups in the index reflecting student-reported bad behavior outside of school.
xxiii
6 There were three exceptions. Parents of lottery winners reported their children to be better adjusted than parents
of lottery losers, according to an index measuring this outcome. Parents of lottery winners were more likely than parents of lottery losers to attend events or volunteer at their child’s school, according to an index measuring parents’ presence at the child’s school, but were less likely to belong to the school’s parent-teacher association (PTA) or similar organization.
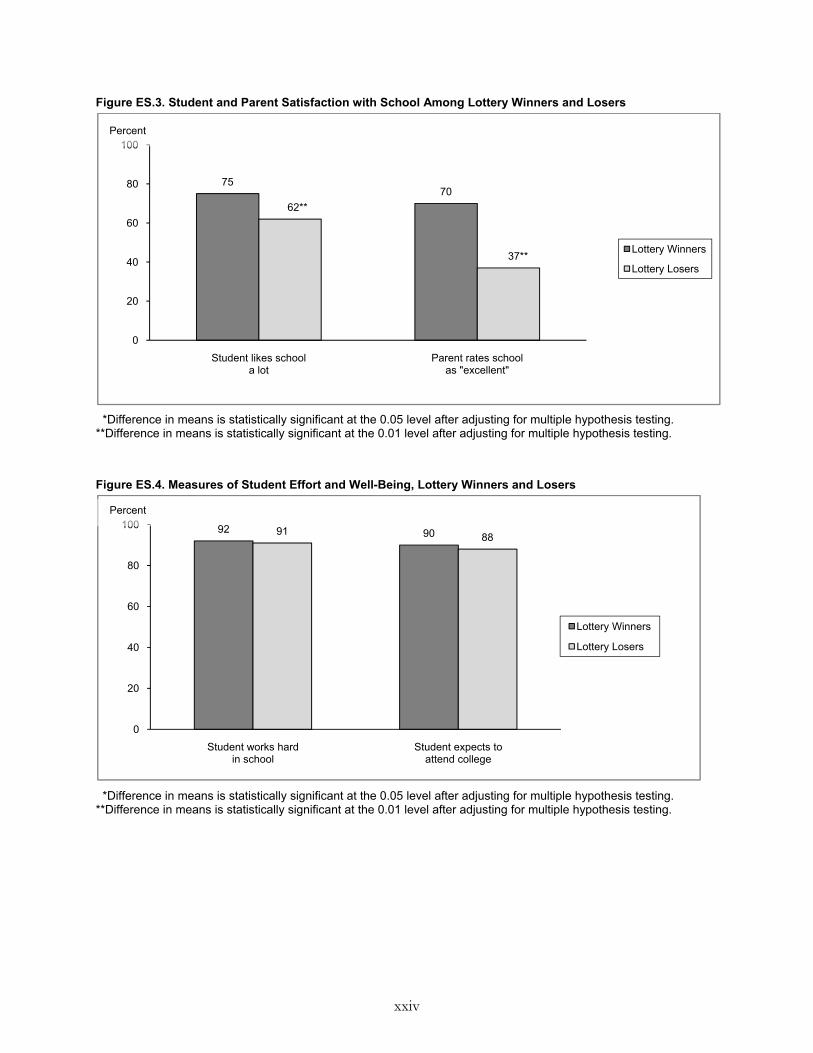
Figure ES.3. Student and Parent Satisfaction with School Among Lottery Winners and Losers
7570
62**
37**
0
20
40
60
80
100
Student likes school a lot
Parent rates school as "excellent"
Lottery Winners
Lottery Losers
Percent
*Difference in means is statistically significant at the 0.05 level after adjusting for multiple hypothesis testing. **Difference in means is statistically significant at the 0.01 level after adjusting for multiple hypothesis testing.
Figure ES.4. Measures of Student Effort and Well-Being, Lottery Winners and Losers
92 9091 88
0
20
40
60
80
100
Student works hard in school
Student expects to attend college
Lottery Winners
Lottery Losers
Percent
*Difference in means is statistically significant at the 0.05 level after adjusting for multiple hypothesis testing. **Difference in means is statistically significant at the 0.01 level after adjusting for multiple hypothesis testing.
xxiv

• Study charter schools’ impacts on student achievement were inversely related to students’ income levels. Study charter schools had a negative and statistically significant impact on test scores of higher income students (those not certified for free or reduced-price school lunches), but a positive and significant impact on Year 2 math scores among lower income students (Figure 5). The impact on Year 2 reading scores among lower income students was not statistically significant. However, the difference in impacts between the two groups was statistically significant for both reading and math.
• There was some evidence of an inverse relationship between students’ baseline achievement levels and charter school impacts on achievement. We found a strong and statistically significant negative association between students’ baseline test scores and charter schools impacts on their subsequent reading and math scores. The higher the achievement scores of their incoming students, the more negative were the estimated impacts of study charter schools. On the other hand, when we split students evenly into two groups—those with higher versus lower baseline achievement levels—differences in impacts between the two groups were not statistically significant after adjusting for multiple treatment-control comparisons.
• There were no significant differences in charter school impacts for other student subgroups. Charter school impacts were statistically similar for student subgroups defined by race and ethnicity and gender.
Figure ES.5. Impacts on Year 2 Test Scores, by Income Status (as determined by eligibility for the free and reduced-price lunch program)
-0.12**-0.14*
0.05
0.17*
-0.2
-0.1
0
0.1
0.2
Reading^ Math^^
Higher Income
Lower Income
Estimated Impact
*Impact estimate is statistically significant at the 0.05 level after adjusting for multiple hypothesis testing. **Impact estimate is statistically significant at the 0.01 level after adjusting for multiple hypothesis testing. ^Difference between estimates for subgroups is statistically significant at the 0.05 level after adjusting for multiple hypothesis testing. ^^Difference between estimates for subgroups is statistically significant at the 0.01 level after adjusting for multiple hypothesis testing.
xxv

Did Some Charter Schools Improve Student Achievement?
Although study charter schools neither positively nor negatively affected most student outcomes on average, these averages mask variation across the schools in their impacts on students. The schools’ impacts on students’ math and reading scores after two years varied widely (Figure 6). In math, for example, the lowest performing charter school led to a decline of more than half a standard deviation in students’ test scores while the highest performing school led to an increase of more than half a standard deviation; 10 of the 28 site-level estimates were statistically significant.
Figure ES.6. Distribution of Site-Level Impact Estimates
-1.0-0.8-0.6-0.4-0.20.00.20.40.60.81.0
z-sc
ore
p-value < 0.001 **
Year 2 Reading Scores
-1.0-0.8-0.6-0.4-0.20.00.20.40.60.81.0
z-sc
ore
p-value < 0.001 **
Year 2 Math Scores
Note: p-values are from tests of homogeneity of impacts.
*Variation in impacts is statistically significant at the 0.05 level, two-tailed test. **Variation in impacts is statistically significant at the 0.01 level, two-tailed test. Shaded bars are statistically significant impacts at the 0.05 level, two-tailed test.
xxvi
We examined whether there were identifiable characteristics of the study charter schools, their students, or the conditions under which they operated that were associated with impacts on student achievement. Because this analysis was correlational, we could not determine whether the school characteristics themselves directly influenced charter school effectiveness, or whether relationships between the characteristics and impacts were driven by some other factor we did not measure that was associated both with the characteristics we examined and with charter school effectiveness. Nonetheless, these results may suggest avenues for more rigorous research in the future.
We found that the characteristics of the students served by study charter schools were strongly related to the schools’ impacts on student achievement, particularly in math. Schools serving the largest proportions of disadvantaged and lower achieving students had more positive and statistically significant impacts; schools serving the smallest proportions of these students had negative and statistically significant impacts. The differences between the two groups of schools were also statistically significant.
• On average, the study schools with the highest proportions of disadvantaged students (based on their eligibility for free or reduced-price school meals) had a positive impact on Year 2 math scores of 0.18 (Figure 7). Schools with the lowest proportions of disadvantaged students had, on average, a negative impact on math scores of -0.24.
• Study schools with average student baseline achievement above the median had a negative impact on Year 2 math scores of -0.21 standard deviations, while schools with average student achievement below the median had a positive impact of 0.12 standard deviations (Figure 8).
Figure ES.7. Impacts on Year 2 Test Scores, by Characteristics of Charter Schools’ Student Populations: Economic Status
0.00
0.18††
-0.11†
-0.24††-0.30
-0.20
-0.10
0.00
0.10
0.20
Reading Math
Schools Serving More Economically Disadvantaged Students
Schools Serving Fewer Economically Disadvantaged Students
##
Estimated Impact
†Impact estimate is statistically significant at the 0.05 level. ††Impact estimate is statistically significant at the 0.01 level. #Difference between estimates in two sets of sites is statistically significant at the 0.05 level. ##Difference between estimates in two sets of sites is statistically significant at the 0.01 level.
xxvii

Figure ES.8. Impacts on Year 2 Test Scores, by Characteristics of Charter Schools’ Student Populations: Mean Baseline Test Scores
0.03
0.12†
-0.15††
-0.21††
-0.30
-0.20
-0.10
0.00
0.10
0.20
Reading Math
Schools Serving Lower Achieving Students
Schools Serving Higher Achieving Students
####
Estimated Impact
†Impact estimate is statistically significant at the 0.05 level. ††Impact estimate is statistically significant at the 0.01 level. #Difference between estimates in two sets of sites is statistically significant at the 0.05 level. ##Difference between estimates in two sets of sites is statistically significant at the 0.01 level.
Study schools located in large urban areas had a significant positive impact on Year 2 math
scores of 0.16 standard deviations, compared with a significant negative impact of -0.14 standard deviations for schools outside of large urban areas. The difference between impacts for urban versus non-urban schools was also significant. However, once we accounted for both student and school characteristics, there were no significant differences between the impacts of study charter schools located in versus outside of large urban areas.
We also examined whether achievement impacts were associated with selected school policies and practices. Because impacts were estimated by comparing outcomes for lottery winners versus lottery losers, we also measured the school characteristics as the difference between schools attended by lottery winners (the study charter school in most cases) and the schools attended by lottery losers (typically traditional public schools). For example, the school enrollment measure reflected how much larger or smaller the study charter school was than nearby traditional public schools that the lottery losers attended.
Key characteristics associated with charter school impacts on student achievement included:
• Enrollment: Smaller charter schools had significantly less negative impacts than larger charter schools. For each 100 student increase in enrollment, the estimated impact on Year 2 mathematics was -0.06 standard deviation units more negative (p-value of the correlation<=0.001).
• Ability Grouping: Charter schools more likely to use ability grouping for math (relative to schools attended by lottery losers) had significantly less negative impacts than charter schools less likely to use ability grouping. The same was not the case for reading.
We examined several other aspects of school operations, including the length of the school day and year (hours of operation), the student-teacher ratio, and the experience level of teachers. When the “hours of operation” measure was examined in isolation, we found that charter school impacts
xxviii

xxix
on math achievement were significantly different for schools with longer versus shorter hours of operation. Impacts were also significantly related to the student-teacher ratio, when that characteristic was examined in isolation. However, we did not find evidence of a significant relationship between these characteristics and charter school impacts once we controlled for other aspects of charter school operations and student characteristics.
Finally, we examined a variety of policy-related characteristics of charter schools, including measures of their number of years operating, autonomy, accountability, revenues, type of authorizer, and management structure. With one exception (revenues per student), we found no evidence that these measures of the policy environment in which charter schools operated were related to their impacts on student achievement. In the case of per student revenues, we found a significant relationship between revenues and impacts on math achievement in models that did not account for other charter school characteristics, but this relationship was no longer statistically significant once we controlled for these other charter school characteristics.
Looking Ahead
The estimated relationships between charter school characteristics and impacts described above reinforce the notion that not all charter schools are the same—some are more effective than nearby traditional public schools, and others are less effective. Among charter schools popular enough to hold lotteries, overall, our results suggest that they are no more successful than nearby traditional public schools in boosting student achievement. However, those located in large urban areas and serving disadvantaged students are the most successful in doing so, a finding consistent with other recent lottery-based studies on charter schools in large urban areas (Abdulkadiroglu et al. 2009; Hoxby et al. 2009). Our study was not able to determine why these charter schools appear to be more effective than others, but further investigation focused on better understanding the reasons for this relationship would provide useful information for policymakers and educators seeking to improve student achievement through the expansion and adaptation of charter schools.

This page is intentionally left blank.

1
I. INTRODUCTION
Charter schools are an important and growing component of the public school system in the United States. As of November 2009, more than 5,000 charter schools served about 1.5 million students—approximately three percent of all public school students—in 40 states and the District of Columbia (Center for Education Reform 2009). Charter schools are intended to play a key role in school improvement under the existing Elementary and Secondary Education Act (No Child Left Behind) and current federal reform efforts.7 In this report, we summarize the results of the first large-scale randomized trial of the effectiveness of charter schools in several states. We describe the impacts on student achievement and other outcomes of 36 charter middle schools in 15 states and explore the circumstances under which charter schools are most or least likely to be successful.
A. Charter Schools as a Reform Strategy
Charter schools are public schools that are established on the basis of a contract, or charter, that a private board holds with a charter authorizer over some pre-determined number of years. As part of the contract, charter schools are released from many state and district regulations that govern traditional public schools, including those involving staffing, curriculum, and budget decisions. In exchange for this flexibility, charter schools are expected to be accountable for the quality of student outcomes and may be closed by their authorizer if they fail to meet expectations. Charter schools are typically open enrollment schools—in most cases, any student within the district or state in which the school is located may attend the school if space is available.
The charter school authorizer may be a traditional public school district, state education agency, college or university, or some other entity. As with other public schools, charter schools receive funding from the state and district on the basis of enrollment, although the amount of funding per pupil may deviate from that of the traditional public schools in a given jurisdiction (Gill et al. 2007). State law determines the organizations that may authorize charter schools, the terms under which charter schools may be authorized, funding rules, and the conditions under which the schools may operate.
The charter school movement in the United States is nearly two-decades-old. The first charter school opened its doors in Minnesota in 1992, and growth in the number of charter schools and the number of students served by the schools has been steady since that time (Center for Education Reform 2010). The number of states permitting charter schools grew rapidly during the 1990s, as did the number of charter schools and enrolled students. The growth in the number of charter schools and number of enrolled students continued to increase into the 2000s even though only four new states passed authorizing legislation between 1999 and 2003 and none did so between 2004 and 2009 (US Charter Schools 2010). Charter schools may see another period of significant growth in response to guidelines drafted in July 2009 for grant applications under the Race to the Top Fund established under the American Recovery and Reinvestment Act of 2009. The criteria for aid receipt include the extent to which a given state’s laws do “not prohibit or effectively inhibit increasing the
7 ESEA, Title V, Part B, Subpart 1 (Public Charter Schools). In addition, a recent statement by U.S. Secretary of
Education Arne Duncan suggested that the federal government supports a role for charter schools in states’ efforts to turn around their lowest-performing schools (see statement released June 25, 2009, at http://www.ed.gov/news/pressreleases/2009/06/06252009.html).

number of charter schools or otherwise restrict student enrollment in charter schools.”8 As of August 2009, four states (Delaware, Illinois, Louisiana, and Tennessee) had enacted new laws to raise or eliminate existing charter caps (National Alliance for Public Charter Schools 2009b).9
The federal government has played an increasingly important role in supporting charter schools during their brief history. In 1994, Congress created the Public Charter School Program (PCSP) as part of the reauthorization of the Elementary and Secondary Education Act. The PCSP was designed to promote charter school growth and development by providing start-up funding grants and technical assistance. Federal appropriations for the PCSP had declined somewhat between 2004 and 2008 but increases in recent years (to $256 million in FY 2010) have returned the program to the funding levels of earlier in the decade (Figure I.1).10
Figure I.1. Federal Appropriations for the Public Charter School Programs, 2000-2010
Source: U.S. Department of Education’s Public Charter School Program information webpage
(http://www.ed.gov/programs/charter/index.html).
2
8 See Notice of Proposed Priorities for the Race to the Top Fund, available at
http://www.ed.gov/programs/racetothetop/index.html. 9 Charter caps are limits on charter school growth, most commonly on the number of charter schools allowed to
open (either annually or overall) or on the number of students each school may serve. The majority of states with charter laws—26 of 40 plus the District of Columbia before recent legislative reforms—has some type of cap (National Alliance for Public Charter Schools 2009a).
10 See http://www.ed.gov/programs/charter/index.html for more information about the PCSP.

3
The expansion of the charter school sector and its prominence in reform efforts has led to growing interest in understanding the impacts on the students who attend these schools and on public school systems more generally. Proponents argue that their autonomy permits schools to innovate, test new ideas, and bring competitive pressures to improve traditional public school systems. Critics are concerned that charter schools draw students and resources away from traditional public schools and that inadequate oversight will lead to many low-quality charter schools.
Research studies are increasingly informing the debate about the effectiveness of charter schools. As described in several recent literature reviews (Gill et al. 2007; Betts and Tang 2008; Bifulco and Bulkley 2008; National Alliance for Public Charter Schools 2009), studies have focused largely on schools’ impacts on student achievement. Some recent evaluations have used experimental designs based on charter school admissions lotteries—comparing outcomes of lottery winners to lottery losers--but most have used non-experimental methods. Findings from the studies have been mixed (see Chapter VI for an overview of the prior research).
B. Study Overview
To address some of the limitations of previous research on charter schools, the National Center for Education Evaluation and Regional Assistance of the U.S. Department of Education contracted with Mathematica Policy Research and its subcontractor, Optimal Solutions Group, in 2003 to carry out the Evaluation of Charter School Impacts. The study uses an experimental design in order to ensure that differences in outcomes between students admitted to charter schools and those not admitted to charter schools are attributable to differences in student’s school experiences rather than to selection bias—pre-existing differences in the characteristics of students who “select” or choose to apply to a charter school versus students who do not.
This study of the impacts of charter middle schools on student achievement and other outcomes was designed to be opportunistic, taking advantage of existing charter school lotteries and the availability of state assessment data. As with the other existing lottery-based studies, the study reduces concerns about selection bias. Unlike the other lottery-based studies, however, which have each focused on charter schools in a single large urban area, the study covers charter schools across small and large towns and cities in a broad set of states. It also examines a wide range of outcomes beyond student test scores. In addition, it is unique in that the design includes careful monitoring and documentation of participating schools’ admissions lotteries and subsequent admissions processes, ensuring the validity of the random assignment process.
The study is organized around two key objectives. The first objective is to shed light on the average impact of charter schools. Understanding the impact of the average charter school is important because some federal and state policy is based on assumptions about the effectiveness of charter schools in general.11 However, emerging evidence suggests that charter schools vary greatly in their characteristics and effectiveness, just as do traditional public schools (Lake 2008; Center for Research on Education Outcomes 2009). Thus, policymakers are also interested in understanding the factors that may be associated with charter school impacts. Information on the factors associated with the most or least effective charter schools is likely to be useful in the development of improved charter school-related policies and programs.
11 For example, the current ESEA and the Race to the Top program encourage districts to convert low-performing
schools into charter schools.
4
Guided by these objectives, the Evaluation of Charter School Impacts sets out to answer two key research questions:
1. What are the impacts of the study’s charter middle schools on students’ academic achievements and on other student and parent outcomes?
2. How are the characteristics of study charter schools and their environments related to these schools’ impacts on student achievement?
We note two key limitations of our design in addressing the research questions. First, while the experimental design minimizes selection bias, and thus ensures a high level of internal validity, the study’s external validity is limited. That is, while the study provides rigorous estimates of the impacts of the charter schools included in the study, the impact estimates apply only to participating schools and may not be generalized to the set of all charter schools nationally. Second, an assumption underlying the study’s experimental design is that study charter schools did not influence the performance of the traditional public schools and other schools against which the charter schools compete for students. If the study schools influenced these schools, then both the treatment and control group students in the study sample could have been influenced by the study charter schools, potentially affecting the study’s impact estimates.
We address the above research questions in the remainder of the report. In the first chapters, we describe the study design (Chapter II) and the schools and students in the study that are the basis for the analysis (Chapter III). In Chapter, IV, we present the main study impacts. In Chapter V, we present the results of an exploratory analysis of the relationship between study charter schools’ impacts and the characteristics of these schools and measures of the environment in which they operate. Finally, in Chapter VI, we describe the study’s findings in the context of the overall research literature on charter school achievement impacts.
5
II. EVALUATION DESIGN
The strength of the study design rests on the random assignment of students through the lotteries held by oversubscribed charter schools—schools that have a larger number of applicants than they have spaces available. The lottery winners formed the treatment group for the evaluation, while the lottery losers formed the control group. The outcomes of the lottery losers represent the counterfactual for the evaluation—what would have happened to the lottery winners had they not been admitted to a study charter school. The randomized lotteries ensure that the only systematic difference between the treatment and control groups is whether they were admitted to the study charter school—on average, there should be no differences in the characteristics, motivation, or expectations of the students or their parents. Therefore, comparing the outcomes of the two groups yields reliable estimates of the causal effects of being offered admission to the charter schools in the study. Statistical models can then use the random assignment to estimate the effects of actually attending—as opposed to simply being offered admission—to a study charter school.
Carrying out the evaluation entailed four steps. First, we recruited a set of oversubscribed charter schools to participate in and be the focus of the study. Second, we recruited students to participate in the study, and the study team monitored the process by which participating charter schools randomly assigned these students into or out of the schools using admissions lotteries. Third, we collected data measuring the characteristics and outcomes among the student sample as well as the characteristics of their schools. Finally, we analyzed the data we collected and estimated impacts. These steps are described in greater detail below.
A. Recruiting Charter Middle Schools for the Study
The evaluation focuses on the impacts of oversubscribed charter middle schools among students who applied to these schools and were admitted through a lottery. We based eligibility for the study on three criteria. First, the school’s entry grade had to be between grades 4 and 7.12 Second, the school had to have been operating as a charter school for at least two years at the time it was recruited to minimize the chances that participating schools would still be under development and thus undergo a substantial amount of change during the evaluation period. Third, the school had to be sufficiently oversubscribed—that is, to have more applicants than could be offered admission to the school.13
We recruited schools over a two-year period from any state with eligible charter schools. The first cohort of schools were those holding admissions lotteries for the 2005–2006 school year, and the second cohort were those holding lotteries for the 2006–2007 school year. Using national databases, we identified 492 potentially eligible charter schools—that is, charter middle schools that had been open at least two years at the time they were recruited. Figure II.1 summarizes the
12 This grade range was chosen primarily on the basis of the availability of both baseline and follow-up test score
data from school records. By relying on school records for test scores, we were able to avoid administering a test to sample members, thus reducing evaluation costs and the burden on sample members. While schools with 4th grade entry were eligible for inclusion in the study sample, the primary analysis sample only includes schools with entry grades ranging from 5 to 7—we refer to these as “middle schools.”
13 A fourth criterion, that the charter school serve a general population of students (as opposed to students with specific behavior issues, for example), did not limit the sample in practice, given the oversubscription criteria.

recruiting process, which included an initial screening phase, active school recruiting, and a variety of follow-up activities designed to ensure that the schools were sufficiently oversubscribed to participate in the study.
Figure II.1. Flow of Charter Schools Through Selection Process
6
Yes (n=77)
Yes (n=167)
ALL CHARTER SCHOOLS
NoYes
Ineligible (Not a charter middle school)Entry grade between 4 and 7?
At least 2 years old?
Initial screen indicates potentialfor oversubscription?
Ineligible(Not enough experience)
Recruiting effort confirms eligibility?
Willing to participate?
Ineligible(Not oversubscribed)
PARTICIPATING SCHOOLS
Refusal
Yes (n=492)
Yes (n=130)
Yes (n=36)
No
No
No
No
NoMaintain eligibility through admissions period?
Although 77 schools both agreed to participate and initially appeared eligible for the study,
ultimately 36 charter schools in 32 sites remained eligible through the study period and participated in the study.14 The other schools that initially appeared eligible were not sufficiently oversubscribed and were dropped from the sample before any outcome data were collected.15 These schools either had an unexpectedly small number of applicants and so did not hold a lottery, or they held a lottery and formed a randomly ordered waiting list of students not admitted at the lottery but ultimately admitted all or nearly of these students from the waitlist to fill slots in place of lottery winners who chose not to attend.16 An important lesson learned during the evaluation was that the ebb and flow
14 In general, each site corresponded to a single charter school. However, five pairs of participating charter schools
had common applicants to their lotteries—we refer to these as “dual applicants.” We treated four of these pairs of schools as single, combined sites in the analysis. The fifth pair of schools included two with dual applicants in cohort 2 but only one of these schools was in the cohort 1 sample. This school was treated as a single site for cohort 1 and, combined with the other in the pair, was treated as a separate site for cohort 2. Thus, the final sample included 32 sites.
15 In addition to the schools that were not oversubscribed, a small number of charter schools we recruited (less than five) were eliminated because they used a first-come, first-served admissions process, rather than an admissions lottery. Others (again, less than five) held a lottery but their admissions process was such that we could not obtain parental consent for study participation from a sufficient number of students who participated in the lottery.
16 We required there to have been no fewer than five lottery losers (for whom we obtained parental consent) who were not offered admission from the waiting list and thus remained in the control group.

7
of charter school admissions and the schools’ own difficulties in projecting their admissions flows makes it difficult to identify schools that will be eligible for a lottery-based study. Table II.1 shows the distribution of Census subregions with participating charter schools.17 Appendix A provides details of the school selection process.
Table II.1. Charter Middle Schools Participating in the Study, by Census Subregion
Subregion Number of Charter Schools
New England 7 Middle Atlantic 3 East North Central 1 West North Central 1 South Atlantic 9 East and West South Central 3 Mountain 6 Pacific 6
Totala 36 aThe 36 participating charter schools include 5 that contributed student samples to both study cohorts, 15 that contributed student samples to cohort 1 alone, and 16 that contributed student samples to cohort 2 alone.
B. Recruiting Students into the Study and the Admissions Lotteries Held by Participating Charter Schools
The student sample for the Evaluation of Charter School Impacts was determined by the admissions process of charter schools participating in the study (Figure II.2). The full study sample (2,904 students) consisted of those who applied to study schools, participated in the schools’ admissions lotteries, and for whom parental consent was obtained. As described below, for the main analysis, we further restricted the sample to a set of 2,330 students for whom we could most reliably estimate charter school impacts. The outcomes of the random lotteries and the schools’ admissions processes following the lotteries determined whether students were classified in the treatment group (1,400 lottery winners) or control group (930 lottery losers).
17 The states with participating schools include most of the states with large numbers of charter schools nationally.
Among the 492 charter middle schools potentially eligible for the study, 78 percent were in a state that ultimately contributed one or more schools to the study.

Figure II.2. Sample Selection Process
Yes (n=2904; 56%)
Apply to charter schooln=6356
Yes (n=1002; 16%)
No (n=1160; 71%)
No (n=1631; 57%)
No (n=2280; 44%)
No (n=5354; 84%)
Out of sample(admitted to
school)
Yes (n=481;29%)
Yes (n=1263; 43%)
Exempt from lottery?
Give consent?
Participate in lottery: Win a slot?
Out of sample(but participate in
lottery & have chance of
being admitted)
Offered admission
Placed on wait list
High enough on wait list to be offered admission anyway?
Treatment Group(n=1744; 60%)
Control Group(n=1160; 40%)
1. Student Eligibility for the Study (Intake and Consent)
Students became eligible for the study when they applied to a participating charter school at the school’s entry grade.18 However, only students who applied during the school’s primary application period and participated in the school’s admissions lottery were included in the evaluation sample. Students who applied too late to participate in the admissions lottery were not included. We also excluded students admitted to the school outside of the lottery process because they had a sibling already enrolled or were exempt from the lottery for some other reason. Across the participating schools, 16 percent of the students who applied to the entry grade were exempt from the school lotteries and were not candidates for the study sample. Another measure of the prevalence of exemptions is that participating schools filled 31 percent of their slots with exempt students.19
8
18 The entry grade is defined as the lowest grade served by the school. At one school in the study, students were
included in the sample if they applied either to the entry grade or the next higher grade served by the school. This charter school admitted a substantial number of students and held an admissions lottery at each of these grades.
19 Across participating schools, 1,002 students of the 6,356 total applicants (including those for whom we did not obtain consent) were exempt. All participating charter schools exempted from their lotteries siblings of students already enrolled at the school; seven schools exempted children of staff or board members; and one school each exempted siblings of alumni, children of military personnel, and applicants who attended a particular feeder elementary school in the previous school year.

9
Parental consent to participate in the study was obtained for eligible applicants prior to the schools’ admissions lotteries.20 Obtaining consent prior to the lottery ensured that there was no systematic relationship between the likelihood of consent for a given student and whether he or she was offered admission to the school (and thus was in the treatment group) or not offered admission (and thus was in the control group). The average consent rate among lottery participants in participating charter schools was 62 percent and was statistically equivalent for lottery winners and losers (62 percent and 61 percent, respectively).21
2. Charter School Lotteries and Waiting List Admissions
Participating charter schools’ admissions lotteries typically were held in the winter or spring prior to the school year for which students were applying for admission, with 80 percent of study schools’ lotteries held in February or March. Among study schools’ lotteries, 83 percent were held in public, while 17 percent were conducted privately. To ensure that study schools conducted admissions lotteries consistent with the principles of random assignment, study team members attended these lotteries in person.22 First, we monitored the lottery to ensure that the mechanism for selecting lottery winners and determining the randomly ordered waiting list was truly random. Second, we documented both the lottery process and outcomes. Documenting the lottery process involved recording how the lottery was conducted and whether there were special features of the process, such as exemptions, stratification, or special rules for siblings who applied at the same time. Documenting lottery outcomes involved recording the list of initial lottery winners and the randomly ordered waiting list.
After documenting the lottery outcomes, we confirmed with the school that our record of the lottery results matched the record of the school and, if there were discrepancies, worked to resolve them. We found that our record of the lottery results nearly always matched that of the school at the time of the lottery. However, we discovered that when we later asked schools to provide the current status of their lottery/waiting list (that is, whether lottery winners had accepted or declined the admissions offer and whether additional students had been offered admission) they sometimes provided a list that was at odds with the original waiting list. For example, a school may have moved
20 Among the 41 school lotteries, there were four exceptions to the rule that all parental consent forms be obtained
prior to the lottery. In these four schools, we obtained parental consent both before and after the lottery because we had a process in place that could not be completed before the lottery but could be used to obtain consent for a large proportion of all lottery participants, including both winners and losers. Consent rates in these four sites were similar for lottery winners (89 percent) and lottery losers (87 percent). See Appendix A for additional details.
21 The consent rate varied widely across sites, depending on when the school agreed to participate in the study and its application process. During the study’s first year of recruiting, several schools agreed to participate midway through their application periods, leaving relatively little time to obtain consent prior to the lottery. Two other factors limited the study team’s ability to obtain consent at selected schools. First, some schools had informal procedures for families to submit applications and did not wish to (or were unable to) incorporate the study’s consent materials into their application processes. Second, at several participating charter schools, large numbers of students submitted applications immediately before the lottery, leaving little time for the study team to follow up with applicants and obtain consent if they had failed to return consent materials with their initial applications.
22 There were two study schools that held lotteries not observed by a study team member due to unforeseen circumstances that led the school to conduct the lottery prior to their previously announced lottery date. In these cases, the study team observer spoke with the school principal and/or admissions director to discuss how the lottery was conducted and review any unexpected issues that arose during its course. In addition, the study team obtained documentation on the results of the lottery—the list of initial lottery winners and the randomly ordered waiting list—as soon as possible after the lottery was completed.

10
students to the bottom of the list if they had indicated that they had made other plans for the upcoming school year. We always kept our original lottery list (validated by the school) and used it as a basis for determining students’ treatment status for the study.
Most of the admissions lotteries were straightforward and included no unexpected or unusual occurrences.23 Nearly all of the study schools (33 of 36) used some sort of mechanical process for conducting the lottery, such as blindly selecting the names of applicants from a box or cage; the three remaining schools used a computerized process. We observed two possible complications to the basic lottery process:
1. Stratification. Three study charter schools used stratified lottery procedures to ensure that a pre-specified number of students with a particular characteristic were admitted to the school. In the one study school in which sample members consisted of applicants to two grades, the lottery was stratified by grade. In the other two cases, the school held separate lotteries to admit a certain number of students from strata defined by their neighborhood of residence.24 This procedure resulted in applicants from different strata having different probabilities of admission to the school.
2. Sibling Rules. Most study charter schools had special rules for siblings applying together to ensure that the admissions decision for each sibling was the same.25 Among the 36 study schools, 24 entered each sibling in the lottery, and if one won the lottery and was offered admission, the other automatically would be offered admission regardless of their own lottery outcome. This approach kept siblings together, but resulted in their having a higher probability of admission than nonsiblings. Three schools entered siblings jointly (as a single entry) in the lottery, ensuring that the outcome of the lottery would be the same for each sibling without changing their probability of admission.
For charter schools with a straightforward lottery process that did not include stratification or multiple-entry sibling rules, each lottery participant had the same probability of winning the lottery and being admitted. However, for schools with stratification and/or special sibling rules, different
23 There were two exceptions among the lotteries we observed. In one case, the school entered two students two
times in the lottery, giving them twice the chance of being selected as a lottery winner and offered admission. We accounted for this higher probability of admission in calculating sample weights for this site. In the other case, four students inadvertently were excluded from the first lottery. In this case, the school held a second lottery to determine the place of those four students in the overall lottery.
24 An alternative form of stratification occurred when a school wished to give one set of applicants preference over another in admissions. The school selected both groups of applicants at random, but all applicants from the preferred group were admitted before any from the lower priority group. For example, a school might have given preference to applicants from within district boundaries over applicants from outside those boundaries. In this case, if there were more applicants from within the district than there were available seats at the school, the school would randomize the district applicants and make all offers to those students, with those district applicants not offered admission placed at the top of the waiting list. The school then would randomize the out-of-district applicants and place them, in order, at the end of the within-district list. In this situation, the applicants from the lower priority group (who had no chance of being admitted to the school) were excluded from the study sample. At least four study schools stratified applicants in this manner.
25 This situation is distinct from the case of applicants who had siblings already attending the school (and received lottery exemptions for this reason). Instead, this situation involves two or more siblings applying to the school at the same time who do not have any brothers or sisters already attending the school.

11
lottery participants may have had different admission probabilities. We used sample weights in the analysis to account for sample members’ admission probabilities, as described in Appendix B. A key lesson learned in the process of monitoring charter schools’ lotteries and admissions processes for this evaluation was that charter school lotteries can be quite complicated, so not knowing the specific procedures used in the lotteries could lead to inaccuracies in the analysis.
Study charter schools not only selected lottery winners to be offered admission immediately, but continued to randomly select applicants (until all had been chosen) as part of the lottery to form a randomly ordered waiting list. Following the lottery, schools admitted additional students from this waiting list as spaces in the school became available. If some lottery winners declined the offer or did not show up on the first day of school, for example, the school would admit students at the top of the waiting list. They continued to do so until all available spaces at the school had been filled, a process that sometimes extended into the beginning of the school year (Figure II.2).26 Among students in the evaluation, 29 percent of those who ultimately were offered admission to the school received their offer at some time after the lottery. All students who were admitted in the lottery or were offered admission in proper order from the randomly ordered waiting list (whether or not they opted to attend) were included in the study’s treatment group, while all other students who participated in the lottery were included in the control group. More information about the sample selection process is available in Appendix A.
3. Primary Analysis Sample
As described above, the full evaluation sample of students included those who participated in the admissions lottery at a study school and for whom we obtained parental consent. The primary sample we used in conducting the main impact analysis was restricted in two additional ways. First, we included only sample members for whom we obtained baseline data on student achievement scores. Second, we included only students at the charter school sites at which we successfully obtained data on student outcomes for a sufficiently high number and percentage of both lottery winners and lottery losers. 27
We chose to restrict the primary analysis sample to those students for whom we obtained achievement data for the baseline year (the school year before lottery winners enrolled in study charter schools) to minimize differences in the availability of outcome data for lottery winners and lottery losers, as these differences could bias the impact estimates. Students with baseline achievement data were likely to have attended a public school in the baseline year and thus also were
26 There were some special cases. First, as mentioned earlier, five pairs of charter schools in the sample shared
some common, or “dual,” applicants—each pair of schools was treated as a single, combined site in the analysis. The 218 dual applicants in the sample may have been lottery winners at both schools in the site, one of the two schools, or neither. In sites with dual applicants, we classified those who were offered admission to either (or both) of the two schools as lottery winners, and those who were not offered admission to either school as lottery losers. Second, sample members may have been admitted to charter schools even though their place on the school’s waiting list indicated that they should not have been offered admission. These students may have gotten into the charter schools through an administrative error, or because there was an opening in the school very late in the school year. They were defined as lottery losers and remained in the control group. We refer to these students as control group crossovers. In the first follow-up year, 6 percent of control group students attended the study charter school. As discussed later, we attempt to account for control group crossover in our estimates of the impact of attending a charter school.
27 While our primary impact analysis sample was subject to these restrictions, we conducted sensitivity tests using the full study sample to ensure that our impact estimates were not strongly influenced by the sample restrictions.

12
more likely to have attended a public school and have achievement data in the follow-up years, regardless of whether they won or lost the lottery.28 For instance, among students without baseline achievement data, 63 percent of lottery winners and 30 percent of lottery losers had valid first follow-up (Year 1) math scores. Rates of missing follow-up scores and the disparity between lottery winners and losers were considerably lower among the sample with valid baseline data—among this sample, 94 percent of lottery winners and 89 percent of lottery losers had valid Year 1 math scores. This restriction led us to drop 538 students from the analysis sample. The study’s experimental design was not compromised by this sample restriction because it was based on a baseline (pre-lottery) measure.29 Our use of this restriction is consistent with analyses of charter school impacts reported in most of the other lottery-based studies of charter schools.30
The second restriction was imposed to ensure the validity of within-site impact estimates, which were averaged to form the overall impact estimates. For the sample from a given site to be considered valid, it had to meet the following three criteria: (1) it had to include at least five lottery winners and five lottery losers with valid data for the outcome being examined; (2) the overall percentage of sample members with valid data for the outcome had to be at least 50 percent in each group; (3) the difference in the proportion of lottery winners and losers with valid data for that outcome could be no larger than 30 percentage points. For sites meeting these criteria, we considered the lottery-based experimental design to have been completed successfully and we retained the site in the primary analysis sample. If the site failed to meet one or more of those criteria, we considered the implementation of the study’s experimental design to be questionable and dropped the site’s students from the primary analysis sample used to estimate impacts for that outcome. Most of the study’s sites met all three criteria and were included in the primary analysis sample for all outcomes.31
C. Data Used in the Study
To measure the effects of charter schools on student and parent outcomes and assess whether any achievement effects are related to characteristics of these schools or the environment in which they operate, the evaluation drew from six sources of data, described more fully below: (1) a baseline survey, (2) administrative records, (3) a parent survey, (4) a student survey, (5) a
28 More than half (52 percent) of the students without baseline achievement data attended a private school or were
home schooled when they applied to a study charter school, compared with less than one percent of those with baseline achievement data. Among those who attended a private school or were home schooled when they applied to the charter school, 90 percent of lottery winners attended a public school (typically the study charter school) during the first follow-up period, compared with only 34 percent of lottery losers.
29 Eighty-two percent of lottery winners and 81 percent of lottery losers had valid baseline achievement data. 30 In their lottery-based study of charter schools in Boston, for example, Abdulkadiroglu et al. (2009) used a similar
sample restriction. Hoxby and Murarka (2009) restricted the sample upon which their impact estimates were based to students with some test score availability, although they allowed this to be either in the baseline or follow-up period. Non-experimental studies of charter school impacts that compare test scores of students in charter schools with their test scores prior to their entry into a charter school also restrict the sample to those with valid achievement data during a baseline period (for example, Sass 2006; Hanushek et al. 2007; Bifulco and Ladd 2006; Zimmer et al. 2009).
31 Of the 32 sites, 3 (containing a total of 64 lottery participants) were excluded from all four student achievement impact estimates. One additional site (containing 77 lottery participants) was excluded from the Year 1 math impact estimates, and one additional site (containing 143 lottery participants) was excluded from the Year 2 test score impact estimates.

13
principal survey, and (6) a charter school authorizer survey. The data collection structure and schedule is summarized in Table II.2.
• Baseline Survey. When parents applied for their children to be admitted to the charter schools participating in the study in spring 2005 and spring 2006, they were asked to complete a baseline survey.32 The survey collected demographic and socioeconomic information from parents at the time of application, as well as their reasons for applying to the participating charter school and information on other schools to which they were applying. The overall response rate on the baseline survey among analysis sample members was 91 percent—92 percent among lottery winners and 90 percent among control group members (see Appendix Table A.8 for more detail on data collection response rates).
Table II.2. Schedule of Data Collection Activities
Activity
Schedule
Cohort 1 Cohort 2
Baseline Survey Spring/Summer 2005 Spring/Summer 2006
Administrative Records Baseline Fall 2005
(Covers 2004-05 SY) Fall 2006
(Covers 2005-06 SY) First follow-up (Year 1) Fall 2006
(Covers 2005-06 SY) Fall 2007
(Covers 2006-07 SY) Second follow-up (Year 2) Fall 2007
(Covers 2006-07 SY) Fall 2008
(Covers 2007-08 SY)
Parent Survey Spring 2006 Spring 2007
Student Survey Spring 2006 Spring 2007
Principal Surveys Schools attended by sample members Fall 2006 Fall 2007 Nonstudy charter schools Fall 2007
Authorizer & State Surveys Spring 2007
32 Among the first cohort of the student sample, 67 percent filled out a hard-copy version of the baseline survey,
while 33 percent completed the survey by telephone. In the second cohort, 99 percent completed the survey by telephone.

14
• Administrative Records. Records were collected from the state, district, or school each student attended to measure such key outcomes as student achievement (based on state test scores), attendance, and disciplinary incidents. These records were obtained for the baseline year as well as the following two years. Among members of our analysis sample, we have valid administrative records data on test scores for 93 percent of sample members in the first follow-up year (Year 1) and 88 percent in the second follow-up year (Year 2). In Year 1, we obtained valid math scores for 94 percent of lottery winners and 89 percent of lottery losers, and valid reading scores for 95 percent of lottery winners and 89 percent of lottery losers. In Year 2, we obtained valid math scores for 90 percent of lottery winners and 84 percent of lottery losers, and valid reading scores for 91 percent of lottery winners and 84 percent of lottery losers.33
• Parent Survey. We administered a short telephone survey to the parents of sample members in spring 2006 and spring 2007, during the first year of follow-up for each cohort. These interviews provided information on parents’ attitudes about their children’s schools, assessment of their children’s behavior, and reports on their involvement in their children’s education and schools. The parent survey response rate was 83 percent—85 percent among lottery winners and 80 percent among lottery losers.
• Student Survey. Along with the parent survey, a short telephone survey of the student sample was administered in spring 2006 and spring 2007. These interviews provided information on students’ behavior, both in and out of school, and their attitudes about school. The response rate on the student survey was 78 percent—81 percent among lottery winners and 73 percent among lottery losers.
• Principal Survey. We administered a principal survey by mail, with telephone follow-up, to two groups of respondents.
- Principals of study sample members: In fall 2006 and fall 2007, this survey was administered to principals of schools that sample members attended, including the participating charter schools. The survey included questions on various characteristics of these schools, including their level of autonomy, the curriculum/instructional approach, and other aspects of their operations. Overall, we obtained survey data from the principals of 86 percent of students in the sample, including 92 percent of lottery winners and 77 percent of lottery losers.34
33 See Appendix D for a discussion of sensitivity analyses designed to examine whether the key impact estimates
changed if we used different approaches for dealing with the differential attrition rates among treatment and control group students.
34 The percentage of lottery winners for whom we obtained principal survey data is higher than the percentage for lottery losers because most lottery winners attended study charter schools, which had already agreed to participate in the study at the time we administered the principal survey. Lottery losers, by contrast, typically attended traditional public schools that were not directly the subject of the study and whose principals were not aware of the study at the time we asked them to complete the survey.

15
- Principals of all charter middle schools in the U.S.: The same survey was conducted in fall 2007 with the principal of any charter middle school who had not already completed the survey on the basis of being in the study. Seventy percent of principals of nonparticipating charter middle schools completed this survey.
• Authorizer and State Surveys. In spring 2007, we conducted a survey of the authorizers of participating charter schools. The survey included various indicators of authorizers’ monitoring of charter schools, which we used to develop a measure of the level of accountability to which study charter schools were held. The respondents for this questionnaire were identified as the key staff members at the authorizing entities responsible for oversight of the charter school, or schools, in the study. The sample was made up of the 25 authorizing entities of the 36 study charter schools. We achieved an 80 percent response rate. We also conducted a survey of state officials in study states (states where study charter schools were located) in spring 2007. Respondents to this questionnaire were the states’ department of education staff members responsible for assessment and accountability issues as well as issues related to charter schools (and possibly other public schools). The survey was sent to each of the 15 states represented in the study, and 80 percent of these surveys were completed.
For each of the surveys that collected data on the student sample, the response rate among lottery winners was higher than among lottery losers. The differential ranged from one percentage point (baseline survey) to 8 percentage points (student survey). To account for possible attrition bias, we constructed nonresponse weights by adjusting our basic sampling weights according to an individual’s likelihood of having valid data for a particular outcome. We tested the sensitivity of our primary impact estimates to possible attrition bias by estimating impacts using these nonresponse weights. We present these estimates in Appendix F.
In addition to these sources of data collected by the study team, we used three sources of secondary data to provide school-level information not collected as part of the principal survey. These sources of data provided information for schools attended by students in the study sample, as well as for nonstudy charter middle schools, and are discussed in more detail in Appendix E.
• Common Core of Data (CCD) and Private School Survey (PSS): Data from the National Center for Education Statistics were used to replace missing data on selected school characteristics from the study’s principal survey in cases in which the school’s principal did not complete the survey. For example, if we were unable to obtain data on the school’s racial/ethnic distribution or the percentage of students eligible for free or reduced-price school meals, we obtained the information from the CCD or PSS if possible.35
35 This type of imputation occurred when the principal survey was not completed by the principal of the school
attended by a treatment or control student, but there was valid CCD or PSS data. We had CCD or PSS data for the schools attended by 95 percent of sample members and principal survey data for 92 percent of treatment students and 77 percent of control students.

16
• School Data Direct Website:36 We obtained information on school performance—the proportion of a school’s students classified as proficient on the state assessment—from this website.
• School-Specific Report Cards: These report cards, located on state department of education websites, provided the proportion proficient on the state assessment when it was missing on the School Data Direct website. Between data collected from this source and the School Data Direct website, we obtained valid measures of school-level performance on the state assessment for all 36 study charter schools and 90 percent of all other schools attended by students in the primary analysis sample.
D. Outcome Measures
While the main outcome of interest was student achievement, we also estimated impacts on several other secondary or exploratory outcomes. Overall, the outcomes we examined included 50 measures in 10 domains, shown in Table II.3. See Appendix C for additional information on these outcome variables.
Table II.3. Outcome Measures for the Charter School Impact Evaluation
Domain Outcome Measure
Student achievement Year 1 state reading assessment z-scores Year 2 state reading assessment z-scores Year 1 state math assessment z-scores Year 2 state math assessment z-scores
State proficiency levels Year 1 Reading Whether scored at “advanced” level or higher Whether scored at “proficient” level or higher Whether scored at “partially proficient” level or higher Year 2 Reading Whether scored at “advanced” level or higher Whether scored at “proficient” level or higher Whether scored at “partially proficient” level or higher Year 1 Math Whether scored at “advanced” level or higher Whether scored at “proficient” level or higher Whether scored at “partially proficient” level or higher Year 2 Math Whether scored at “advanced” level or higher Whether scored at “proficient” level or higher Whether scored at “partially proficient” level or higher
Other measures of academic performance Number of days absent in Year 1 Number of days absent in Year 2
Late to school 5 or more days Promotion to next grade in Year 1 Promotion to next grade in Year 2
Student effort in school Whether student reports completing homework “mostly” or ”always” Whether student reports completing homework “always”
36 The School Data Direct website (http://www.schooldatadirect.org/) is maintained by the State Education Data
Center of the Council of Chief State School Officers.

Table II.3 (continued)
Domain Outcome Measure Whether parent reports that student works hard
Other measures of student well-being Whether student expects to attend college Whether parent expects student to attend college Count of extracurricular activities Parent report of how well-adjusted student is Index of parent concerns about student
Student misbehavior in school Whether student was suspended in Year 1 Whether student was suspended in Year 2 Whether student reports being sent out of class 5 or more times Whether parent reports being called about student’s behavior Whether parent reports student has behavioral problems in school
Student behavior outside of school Student-reported good behavior index Student-reported bad behavior index
Student and parent satisfaction with school Whether student reports liking school “a lot” Student-reported index of teachers
Grade student gives to school Index of student’s feelings about school Whether parent’s overall rating of school is “excellent” Whether parent “strongly agrees” child likes school a lot Parent-reported school satisfaction index Parent-reported index of school problems
Student and parent perceptions of school environment
Index of how often school calls parent Parent-reported index of school’s academic difficulty Student-reported index of school’s disciplinary environment
Parental involvement Index of parent’s involvement in child’s education Index of parent’s presence at child’s school Whether parent is a member of the PTA
aThe scoring on this index is reversed from other indexes in the domain (i.e., higher values have a negative interpretation).
PTA = Parent-Teacher Association.
To measure student achievement, we relied on student test scores from state assessments approved by the U.S. Department of Education for use in accountability reporting under the Elementary and Secondary Education Act. Because sample members were spread across 15 states, each of which administered a different assessment, test scores had to be converted to a comparable scale for the analysis. We converted all scores to z-scores, defined as the student’s raw score on the state assessment minus the mean score on the test among all students in the state who took the test, divided by the standard deviation of the scores for that same group, by grade level.37 Thus, students’ z-scores reflect their performance on the state assessment relative to the typical student in that state and grade.
37 This approach for analyzing state assessment data in educational studies involving multiple states is one of the
approaches recommended by a recent report on the use of state tests in education experiments (May et al. 2009). It is also similar to the approach used by two other recent multistate studies of charter school impacts (Zimmer et al. 2009; CREDO 2009).
17

18
As a secondary measure, we also estimated impacts on the percentage of students meeting various state-defined standards (for instance, “proficient” or “basic”) in each site. An increase in the percentage meeting a particular standard may not represent the same gain in achievement across states, as standards vary from state to state. Nonetheless, this measure is policy relevant and can provide a sense of how well students are meeting standards defined by their own state. Each of the other outcomes is scaled in a consistent manner across students in the study, and impacts were estimated directly with no rescaling of these other measures.
E. Overview of the Analytic Approach
This study had two analytic components. The first involved estimating the impact of charter schools on student and parent outcomes. The second involved relating these impacts to the charter schools’ conditions or environments so as to generate hypotheses about the factors that might lead charter schools to be more or less effective.
1. Impact Analysis
In this report, we present two sets of estimates of the impact of study charter schools:
• Intent-to-Treat (ITT) Impact Estimates. These estimates represent the impact of being offered admission to a study charter school, relative to not being admitted but having all of the other educational options available to students in the area.
• Treatment-on-the-Treated (TOT) Impact Estimates. These estimates represent the impact of attending a charter school, relative to attending some other type of school.
a. Estimating the Impact of the Offer of Admission to a Study Charter School
As a first step in the impact analysis, we estimated the impact of being offered the opportunity to attend a given charter middle school (the ITT estimate) separately for each of the study’s charter school sites. Because student admission to each charter school was randomly determined through the admissions lottery, a simple comparison of the mean outcomes of the lottery winners and lottery losers in each site would provide an unbiased impact estimate of admission to the school(s) in that site. However, to obtain more precise site-level impact estimates, we adjusted for baseline student characteristics in a regression model. These characteristics included reading and math scores from the two years prior to the charter school admission year (the baseline year and the previous “pre-baseline” year), attendance and disciplinary records from the year prior to admission, race, ethnicity, gender, family income and poverty status, parental education, and other characteristics. The full set of covariates is provided in Appendix Table D.2.
For each site-level impact estimate, we also computed the associated effect size reflecting the magnitude of the impact relative to the extent to which the outcome varies among students in the sample. For a given site, we calculated the effect size by dividing the impact estimate by the standard deviation of the outcome measure among control group students at that site.38 Effect sizes, which
38 In the case of binary outcomes, we instead computed the effect size as the Cox index (the log odds ratio divided
by 1.65), as described in the What Works Clearinghouse Procedures and Standards Handbook Version 2.0 (U.S. Department of Education 2008).

19
rescale impact estimates to a common metric, may facilitate comparison with other studies that examine similar outcome measures.39
To produce an overall estimate of the impact of admission to a study charter school, we averaged the separate impact estimates for each charter school site. Similarly, we averaged the site-level effect sizes to estimate the overall effect size of admission to a study charter school. Details of the impact estimation model and computation of average impacts and effect sizes are provided in Appendix D. Because the set of participating charter schools was not randomly selected, the resulting impact estimates do not generalize to all charter schools nationally.
For the secondary analyses, we used the same analytic approach as for the full sample (above) and estimated impacts for subgroups of students (defined by their race/ethnicity, gender, certification for free or reduced price lunch, and baseline academic achievement) and subgroups of schools (defined by a variety of school characteristics). Finally, we assessed the sensitivity of the main impact results to alternative estimation strategies, including different ways of weighting the impact estimates across sites, determining which sites to include, and accounting for missing outcome data, as well as to estimating models with no covariates. In Appendix D, we provide more detail about how we estimated subgroup impacts and conducted sensitivity tests.
b. Estimating the Impact of Attending a Charter School
While most lottery winners attended the study charter school to which they were admitted in the year following the lottery, 22 percent did not (Figure II.3). A smaller percentage of lottery losers attended some charter school, with 6 percent attending a study charter school and 9 percent attending another nearby charter school. To investigate the effects of study charter middle schools on the students who actually attended these schools, we followed a standard approach for estimating TOT impacts (Angrist et al. 1996), using admission to a study charter school through the lotteries as an “instrumental variable” for charter school attendance.40 Results reflect the impact of attending a charter school—either a study charter school or a nearby nonstudy charter school—attended by any of the lottery winners or lottery losers. As with the ITT estimates, we estimated the TOT impacts in each site and then averaged these estimates over all sites to produce an overall TOT impact estimate. We provide additional details in Appendix D.
39 Because student test scores were converted to z-scores for comparability across states and grades in the analysis,
the main impact estimates on test scores can also be thought of as effect sizes but have a slightly different interpretation than the effect sizes for test scores presented in the report. The impacts on z-scores reflect impacts on students’ performance relative to other students in that state and grade, while the estimated effect sizes for test scores represent impacts on students’ performance relative to the control group sample in that site.
40 It is important to use this approach, rather than simply examining the correlation between charter school attendance and student outcomes, because charter school attendance is not randomly determined. Once a student is admitted, she may accept or decline the offer for a variety of reasons, including motivation or academic ability, which may influence her outcomes, whether or not she chooses to attend. Simply examining the relationship between attendance and outcomes would confound the decision to attend with these other factors and could provide a biased estimate of charter school impacts. To address this problem, the instrumental variables approach uses the randomly determined results of the admissions lotteries to obtain a predicted value of charter school attendance that is highly correlated with actual attendance but uncorrelated with other student characteristics. It then estimates the relationship between predicted attendance and student outcomes to obtain unbiased estimates of the impact of attending a charter school. This approach was used by the other major lottery-based studies of charter school impacts to estimate the effects of actually attending one of the schools being studied (for example, see Hoxby and Rockoff 2004; Hoxby and Murarka 2009; Abdulkadiroglu et al. 2009; and Dobbie and Fryer 2009).

Figure II.3. Type of School Attended During Year 1, by Treatment Status
78%
3%
15%
3% 0% 1%
Lottery Winners
Study charter school
Other charter school
Traditional public school
Private school
Home school
Unknown
6%9%
78%
4%1% 2%
Lottery Losers
Study charter school
Other charter school
Traditional public school
Private school
Home school
Unknown
Note: For comparability with the impact analysis, percentages are estimated at the site level and averaged
across sites. Comparable statistics on type of school attended in the baseline year and Year 2 are shown in Appendix Table E.3.
20

c. Multiple Hypothesis Testing
Analysis of multiple outcomes and population subgroups that result in multiple treatment-control comparisons may yield misleading estimates or “false discoveries.” Because we were examining 50 outcomes and several population subgroups, we applied the framework recommended by the National Center for Education Evaluation (NCEE) (Schochet 2008) for addressing this issue. Under this framework, we applied formal adjustments for our multiple comparisons, or what is known as multiple hypothesis testing. (See Appendix D for further details on our approach.)
The adjustment for multiple hypothesis testing provides more rigorous impact estimates—results that are statistically significant only prior to this adjustment are more likely to be spurious and are not as reliable.41 For this reason, we base our main conclusions on the results after the adjustment for multiple hypothesis testing. Nonetheless, because of the lack of universal agreement on the need for this adjustment or the most appropriate method for making it, in both the results tables and the text we indicate whether results are statistically significant both before and after the adjustment.
Symbols Used to Denote Statistical Significance
Significance at Conventional Levels
†Treatment-control difference is statistically significant at the 0.05 level before adjustment for multiple hypothesis testing.
††Treatment-control difference is statistically significant at the 0.01 level before adjustment for multiple hypothesis testing.
Significance After Adjusting for Multiple Hypothesis Testing
*Treatment-control difference is statistically significant at the 0.05 level after adjustment for multiple hypothesis testing.
**Treatment-control difference is statistically significant at the 0.01 level after adjustment for multiple hypothesis testing.
d. Statistical Precision
The statistical precision of an impact evaluation is influenced by the sample size and the number of outcomes examined, as well as the structure of the analytic model. Our final study sample provided a high (80 percent) probability of detecting as statistically significant an impact on student test scores as small as 0.14 standard deviations over the two-year study period, or 0.07 standard deviations for each of the two study years. 42 This is equivalent to roughly 25 percent of a year of
21
41 Our hypothesis tests apply a 5 percent critical value. Thus, after the adjustment for multiple hypothesis testing,
there is only a 5 percent chance that a statistically significant estimate is due to chance rather than to a true effect of charter schools. Before the adjustment, the probability that a statistically significant estimate is spurious (that is, that the significant estimate represents a false discovery) exceeds 5 percent.
42 These power calculations take into account the adjustment for multiple hypothesis tests in the student achievement domain. Without this adjustment, the study has a high probability of detecting as statistically significant an impact on student test scores as small as 0.12 standard deviations over the two-year study period (equivalent to roughly 20 percent of a year of additional instruction).

22
additional instruction.43 An impact of this size would be smaller than the achievement impacts found in two recent lottery-based studies (Abdulkadiroglu et al. 2009; Dobbie and Fryer 2009). We provide more detail on the study’s statistical power in Appendix D.
2. Examining Factors Related to Charter School Impacts
Given the variability in the characteristics and operations of charter schools as described in Chapter III, as well as the policy environments they face, it is of great interest to know more about the circumstances under which these schools are more or less successful in boosting student achievement. The analysis we performed was exploratory and non-experimental. School characteristics and other factors were not randomly assigned to particularly charter schools and were likely correlated with other factors that we were unable to measure directly. For instance, the degree of autonomy may have been associated with other features of a state’s education policy, and these other policies, rather than autonomy itself, may have been responsible for any observed relationships between charter school impacts and autonomy. Thus, the estimated relationships between the factors examined in this analysis and charter school impacts cannot be interpreted as causal. Rather, the estimated relationships may be suggestive of factors that could contribute to charter school success and are worthy of further research.
Because we were relating these factors to impacts, we measured many of the factors in the same way that we estimated impacts—in relative terms, or as the difference in a particular characteristic between the schools that lottery winners attended and the schools that lottery losers attended.44 For example, the factor capturing classroom time was based on the difference between the total number of classroom hours in schools attended by lottery winners (primarily the participating charter school) and the total number of classroom hours in schools attended by lottery losers. The analysis of this type of factor addressed the question: “Were certain school strategies correlated with charter schools’ ability to affect student outcomes?”
However, the approach for defining factors could not necessarily capture all of the strategies that charter schools may have employed to influence student outcomes. Charter schools may have influenced student outcomes by changing a variety of tangible and intangible aspects of the school. They also may have influenced outcomes by implementing existing strategies in a more (or less) effective way than traditional public schools. Thus, we wanted to examine whether certain types of charter schools were more (or less) successful in improving student outcomes, either because they identified and implemented the right strategies or because they more successfully implemented common strategies. This led to a subset of factors based on the characteristics of the study charter school alone, such as an indicator for whether the school was authorized by a school district, or a characteristic of the target population of the students served by the school. The analysis of this type
43 This is based on estimates from Hill et al. (2007) of the average annual gain in test scores in standard deviation
units across grade levels. Based on a sample of seven nationally normed tests, they show that the average annual test score gain is 0.26 standard deviations over grades 5 through 8 in reading and 0.31 standard deviations in math.
44 In one case—the factor reflecting per pupil student revenues—we would have liked to measure the factor as the difference between treatment and control schools but did not have the data to do so. On the principal survey, we asked the principals of charter schools to report their revenues, since we felt that they would be knowledgeable about the school’s financial situation. At traditional public schools, on the other hand, we did not ask principals about per pupil revenues because we did not expect that they would have full information (as much of the information would be maintained at the district level) to report a comprehensive figure comparable to that reported by the charter schools.

23
of factor addressed the question: “Were certain types of charter schools more successful than others in affecting student outcomes?”
Substantively, a wide variety of school- and site-level factors may have been associated with charter schools’ effectiveness. We focused our analysis on factors related to the policy environment in which the charter schools operated, schools’ operations or policies that had the potential to directly influence students’ experiences on a day-to-day basis, or characteristics of the target populations of students served by the schools. See Table II.4 for a description of the factors in this analysis.
Analyzing factors related to charter school impacts makes sense only if there is meaningful variation in impacts across the charter schools in the study. After estimating impacts, we conducted a test to determine whether there was statistically significant variation in these impacts.45
From there, we examined the relationship between the factors and the estimated impacts of the charter schools in the study in three ways:
1. We examined the bivariate relationships between each of the factors and schools’ impacts on students’ math and reading test scores. Positive and statistically significant interactions between a given factor and the impact implied that charter school sites with a high value of the factor tended to have less negative or more positive impacts on achievement than sites with a low value of the factor.
2. We estimated the multivariate relationships between groups of factors and schools’ impacts on math and reading test scores. In effect, this allowed us to examine the relationship between each factor and impacts on test scores while controlling for the values of several other factors in a multivariate framework.
3. We used selected factors to define subgroups of charter school sites and estimated separate subgroup impacts among students at sites with high values of the factor, as well as among those at sites with low values. For example, we used the factor representing the percentage of students eligible for free or reduced-price meals to divide sites into those in which the charter school served a highly disadvantaged student population (those with high values of this factor) and those in which the charter school served a less disadvantaged population (those with low values of the factor). We then estimated impacts on student test scores separately for each of these subgroups of sites, focusing on whether the charter schools in each group had a statistically significant impact on the outcome, as well as whether the impacts of the two subgroups were significantly different from one another.
In Appendix D, we provide additional detail on the definition of each factor and the three different approaches to analyzing the relation between these factors and charter school impacts.
45 Specifically, this was a test of the null hypothesis of the homogeneity of impacts (Lipsey and Wilson 2001). See
Appendix D for details.

24
Table II.4. Factors Potentially Related to Charter School Impacts
Factor
Policy Factors
Autonomy score Extent to which charter school has control over its budget, staffing, and operations, relative to control schools
Accountability score Extent to which authorizer holds charter school accountable for performance
Revenue per student Total public and private revenues per student in charter school
District authorizer Whether charter school is authorized by traditional public school district
Operated by private organization
Whether charter school is operated by a private organization, such as a charter management organization (CMO)
Age of school Number of years school has operated as a charter school
School Operations
Total enrollment Average number of students in treatment schools, relative to control schoolsa
Enrollment per grade Average number of students per grade in treatment schools, relative to control schools
Total classroom time in school year
Average number of hours of classroom time per year in treatment schools, relative to control schools
Student-teacher ratio Average enrollment divided by the number of full-time-equivalent instructional staff in treatment schools, relative to control schools
Proportion of teachers with experience
Percentage of treatment group students attending a school at which more than 2/3 of teachers were experienced (have at least 5 years of teaching experience), relative to control group students
Use of ability grouping in school
Percentage of treatment group students attending a school at which ability grouping was used in some/all math or English classes, relative to control group students
Student Characteristics
Mean baseline reading score
Mean baseline reading score on the state assessment among all sample members who participated in the lottery at the charter school
Mean baseline math score Mean baseline math score on the state assessment among all sample members who participated in the lottery at the charter school
Percentage white, non-Hispanic
Proportion of students at the charter school who are white, non-Hispanic
Percentage eligible for free/reduced-price school meals
Proportion of students at the charter school who are eligible to receive free or reduced-price school meals
Urban Charter school is located in a large urban area. aTreatment schools are defined as schools attended by students in the treatment group. Since most treatment students attended the participating charter school in a site, the average for treatment schools is dominated by the value for the participating charter school. Control schools are defined as schools attended by students in the control group.

25
III. SCHOOLS AND STUDENTS PARTICIPATING IN THE STUDY
In this study, it is particularly important to examine the characteristics of the participating charter schools and their students. Given that the evaluation draws on a purposively (rather than randomly) selected set of charter schools, it is essential to understand how the schools compare to other charter middle schools across the country. With any impact on student outcomes likely to be driven by differences between the study charter schools and the schools attended by students in the control group, it is also useful to understand the nature and extent of these differences. The validity of the impact estimates relies on the randomness of the charter school admission lotteries and the associated expectation that lottery winners and lottery losers will be similar—a comparison of observable characteristics of the two groups can provide support for this expectation. A comparison of the characteristics of charter school applicants to typical students in the charter schools’ districts can shed light on the types of students who apply to charter schools while an examination of the proportion of lottery winners and lottery losers who change schools each year can provide additional context for the study findings. In this chapter, we address each of these issues in turn.
A. How Did Participating Schools Differ from Other Charter Middle Schools?
The study focuses on the effects of charter middle schools in operation for at least two years that were “oversubscribed”; that is, schools that received enough applicants that they had to admit students through a lottery and maintain a waiting list into the school year. As described in Chapter II, however, most charter middle schools did not meet these study eligibility criteria. Oversubscribed charter middle schools that agreed to participate in the study shared some characteristics with nonparticipating charter middle schools but also differed in some important ways.46 In Table III.1, we summarize the similarities and differences.
• Study charter schools were statistically similar to other charter middle schools in location, size, and operating structure.
- Over one-third (36 percent) of study charter schools were located in large urban areas, as were 41 percent of other charter middle schools nationally.
- On average, study charter schools enrolled 387 students overall and 111 per grade, with other charter middle schools enrolling 298 students overall and 88 students per grade.
46 To address regional or state differences in school conditions or charter policies, we compared participating
charter schools not only to all nonstudy charter middle schools but also to the subset of nonstudy charter middle schools in the states in which study schools were located. The findings were similar across both sets of comparisons. In our discussion, we refer to the comparisons of study charter schools with the full sample of nonstudy charter middle schools (see Appendix E for the full set of findings). For comparability with the study charter school sample for all these comparisons, we limited the sample of nonstudy charter schools to those with an entry grade between 4 and 7 that had been operating for at least two years and that served a general population of students (as opposed to schools serving students with specific behavior issues).

26
Table III.1. Characteristics of Study Charter Schools and Nonstudy Charter Middle Schools
Charter Schools in Study
All Other Charter Schools Difference p-Value
Charter Schools in Study
Other Charter Schools, Study
States Only Difference p-Value
Located in Large Urban Area (Percentage) 36% 41% -4% 0.602 36% 38% -2% 0.826
Enrollment (Means) Total enrollment 387 298 90 0.080 387 306 82 0.145 Enrollment per grade 111 88 23 0.259 111 92 20 0.385 Student-teacher ratio 14.6 16.7 -2.1 0.150 14.6 17.1 -2.5 0.100
School Uniforms Required (Percentage) 42% 52% -11% 0.383 42% 51% -10% 0.533
Time in School (Means) School day length in hours 7.3 7.0 0.3 0.117 7.3 7.0 0.4 0.093 School year length in days 182.4 181.4 1.0 0.968 182.4 181.5 0.9 0.989
Facilities (Percentages) Library 58% 62% -3% 0.688 58% 63% -5% 0.653 Gym 53% 49% 4% 0.713 53% 45% 8% 0.547 Cafeteria 56% 68% -13% 0.071 56% 68% -13% 0.089 Child counselors 83% 70% 13% 0.080 83% 68% 16% 0.062 Nurse's office 69% 49% 21% 0.039 † 69% 49% 21% 0.030 †
Academic Programming (Percentages) Method of organizing classes
Some/all core classes grouped by ability level (English or math) 44% 39% 6% 0.650 44% 38% 7% 0.589
Organize classes into “houses” within each grade 64% 41% 23% 0.008 †† 64% 38% 26% 0.004 †† Students loop through multiple grades with teacher 40% 41% -1% 0.864 40% 40% 0% 0.806 Interdisciplinary teaching 78% 60% 18% 0.043 † 78% 60% 18% 0.044 † Paired/team teaching 51% 40% 11% 0.406 51% 40% 12% 0.348
Primary 7th grade math textbook classified as using reform approach 35% 17% 17% 0.029 † 35% 14% 20% 0.013 † Offer gifted/talented program 72% 68% 5% 0.552 72% 71% 2% 0.722 Provide Limited English Proficiency (LEP) instruction 42% 53% -12% 0.262 42% 59% -18% 0.105 Offer music and/or art program 100% 78% 22% 0.003 †† 100% 80% 20% 0.003 ††
Staff Experience of principal (mean number of years as principal) 6.1 5.7 0.5 0.562 6.1 6.1 0.1 0.839 Percentage of schools at which 2/3 of teachers have 5+ years experience 50% 34% 16% 0.060 50% 36% 14% 0.105 Midpoint of teacher salary range at school (mean) $48,168 $44,280 $3,888 0.022 † $48,168 $44,406 $3,761 0.026 † Percentage of teachers at school with full state certification (mean) 77% 78% -2% 0.924 77% 78% -1% 0.984

27
Difference p-Value
Charter Schools in Study
Other Charter Schools, Study
States Only Difference p-Value
Charter Schools in Study
All Other Charter Schools
Characteristics of Students at School (Means) Percentage Hispanic 26% 25% 1% 0.825 26% 29% -3% 0.584 Percentage White 53% 38% 15% 0.012 † 53% 40% 13% 0.029 † Percentage Black 16% 29% -13% 0.024 † 16% 24% -8% 0.128 Average daily attendance rate 95% 92% 4% 0.067 95% 91% 4% 0.064 Percentage of enrolled students suspended out-of-school 3% 9% -6% 0.031 † 3% 9% -6% 0.044 † Percentage of students receiving free or reduced-price lunches 44% 62% -18% 0.003 †† 44% 59% -15% 0.014 † Percentage of students with learning disability and/or IEP 12% 12% 0% 0.705 12% 12% 0% 0.838 Percentage of students classified as LEP 3% 9% -6% 0.069 3% 11% -8% 0.040 †
Academic Achievement of Students at School (Means) Percentage of 7th graders meeting state proficiency in math 66% 51% 15% 0.001 †† 66% 50% 16% 0.001 †† Percentage of 7th graders meeting state proficiency in reading 75% 57% 19% <0.001 †† 75% 58% 18% <0.001 ††
Autonomy Index (Mean) 4.6 5.2 -0.6 0.083 4.6 5.2 -0.6 0.088
Charter School Characteristics Age of school (mean) 7.0 5.9 1.2 0.015 † 7.0 6.1 1.0 0.050 Authorized by local school district (percentage) 56% 44% 12% 0.214 56% 42% 14% 0.178 Serves as its own district (percentage) 56% 62% -6% 0.553 56% 61% -5% 0.504 Operated by CMO (percentage) 11% 20% -9% 0.384 11% 22% -11% 0.296 Total $ revenues per student, including private funding $8,030 $8,710 -$679 0.402 $8,030 $8,634 -$604 0.486
Accountability Index (Mean) 2.59 2.45 0.14 0.296 2.59 2.43 0.16 0.303
Sample Size—Characteristics Based on Principal Survey or CCD 36 434 36 337
Sample Size—Characteristics Based on Principal Survey Alone 35 299 35 238
Sample Size—School Test Scores 36 380 36 300 †Difference is statistically significant at the 0.05 level, two-tailed test. ††Difference is statistically significant at the 0.01 level, two-tailed test.
Table III.1 (continued)

28
- More than half (56 percent) of study charter schools were authorized by a local school district—as opposed to a state board, university, or other entity—and the same proportion served as its own local education agency or district; 44 percent of other charter middle schools in the United States were authorized by a district, and 62 percent served as their own district.
- A charter management organization (CMO) operated 11 percent of study charter schools and 20 percent of other charter middle schools.
- On average, study charter schools operated a 182-day school year with an average school day of 7.3 hours versus 181 and 7.0, respectively, for nonparticipating charter middle schools.
On the above dimensions, there were no statistically significant differences between the study charter schools and nonparticipating charter middle schools in the United States.
• There were no significant differences in resources and only one difference in facilities available to study versus non-study charter middle schools.
The average total revenue per student, including private funding, for the two groups appeared to differ—$8,030 for study charter schools and $8,710 for nonstudy schools—but the difference was not statistically significant; therefore, we cannot be confident that the differences are not attributable to chance. The student-teacher ratio was 14.6 for study charter schools and 16.7 for nonstudy charter middle schools and was not statistically significant. Similar proportions of study charter schools and nonstudy charter middle schools offered a library (58 versus 62 percent), gym (53 versus 49 percent), cafeteria (56 versus 68 percent), and child counselors (83 versus 70 percent). Only the difference in nurses’ offices (69 versus 49 percent) was statistically significant.
• Study and nonstudy charter middle schools reported comparable degrees of autonomy and accountability.
As with the operational characteristics described above, there were no statistically significant differences between study and nonstudy charter middle schools in the constructed measures of schools’ autonomy and accountability.
- The index measuring schools’ autonomy reflected the extent to which schools believed that they had control over their policies and practices. Study charter schools reported autonomy over an average of 4.6 of the following 7 aspects of their operations: budgetary expenses; teacher/staff salaries; teacher tenure; curriculum; length of the school day; student discipline; and admissions. The value of the autonomy index among nonstudy charter middle schools was 5.2.
- The accountability index revealed that both sets of schools were accountable to their authorizers on at least two of four dimensions: academic requirements, nonacademic criteria (such as student demographics and budgets), frequency of reporting, and authorizer actions (including school visits and financial reports).47
47 Appendix D describes the creation of the index.

29
The value of the index was 2.59 for study charter schools and 2.45 for nonstudy schools.
• Study charter schools offered academic programming that differed from that offered by nonstudy charter middle schools, with study schools less likely to take a traditional approach.
The following differences in academic programming between study and nonstudy charter middle schools were statistically significant:
- A higher proportion of study charter schools organized classes into “houses” or other small units within grades (64 versus 41 percent).
- A higher proportion of study charter schools used some form of interdisciplinary teaching (78 versus 60 percent).
- Study charter schools were more likely to use a mathematics textbook that took a “reform approach” (35 versus 17 percent).48
- Study charter schools were more likely to offer a music and/or art program (100 versus 79 percent).
On the other hand, there were no statistically significant differences between the two groups of schools in the prevalence of other methods of classroom organization (grouping by ability, keeping students with the same teachers across grades, or team teaching) or in the availability of special programs for gifted and talented or Limited English Proficient (LEP) students.
• Teachers in study charter schools had higher salaries and may be more experienced than teachers in other charter middle schools.
On average, the study charter schools’ teachers were better paid than nonstudy charter schools’ teachers. The median of teachers’ salary range was almost $4,000 per year higher at study charter schools. In addition, the principals of the study charter schools were more likely to report that more than two-thirds of the schools’ teachers had at least five years of teaching experience (50 versus 34 percent), although the difference was just short of statistically significant (p-value = 0.060). In both types of schools, just over three-quarters of teachers (77 and 78 percent) had full state certification, according to principals. Study and nonstudy charter school principals themselves did not differ significantly in terms of years of experience as a principal (averaging 6.1 and 5.7 years respectively).
• There were significant differences between study and non-study charter middle schools in the characteristics of their students.
Study charter schools served students who were more economically advantaged, less likely to come from racial/ethnic minority groups, and more high-achieving than did nonstudy charter middle schools. The following differences in the average percentages across schools were statistically significant:
48 Appendix E provides a description of how the textbook approach was defined.

30
- At the average study charter school, 44 percent of students received free or reduced-price meals compared with 62 percent at the average nonstudy charter middle school.
- Over half of students (53 percent) at the average study charter school were white and 16 percent were black compared with 38 percent white and 29 percent black at the average nonstudy charter middle school.
- Three-fourths of study charter schools’ grade 7 students were classified as proficient or better on their state reading test compared with 57 percent of students at nonstudy charter middle schools.49 Similar differences held for other grade levels and for the state mathematics test as well as in a comparison of study charter schools to nonparticipating charter middle schools in the same set of states from which the study sample was drawn.
- A smaller proportion of students in study charter schools were suspended compared with students in nonstudy charter middle schools (3 versus 9 percent).50
- A smaller proportion of students in study charter schools were classified as LEP (3 versus 9 percent), although the difference fell just short of statistical significance (p-value = 0.069).
On the other hand, the two sets of schools served similar proportions of Hispanic students and students classified as learning disabled or with Individualized Education Plans (IEP).
Collectively, the analysis of the characteristics of study and nonstudy charter schools suggests that the oversubscribed charter middle schools in the study served a relatively advantaged and higher-achieving student population. The analysis does not imply that the study charter schools were “better” than nonparticipating charter schools but does reinforce the caution that the study’s impact estimates should not be generalized to the population of all charter middle schools nationally.
B. How Did Schools Attended by Lottery Winners Differ from Those Attended by Lottery Losers?
As noted in Chapter II, we measured the impact of admission to a study charter school by comparing a treatment group of lottery winners to a control group of lottery losers. The lottery winners in the analysis sample typically attended the study charter school to which they applied (78 percent); lottery losers, by contrast, attended a mix of other nearby schools—primarily traditional public schools (78 percent).51 The charter school impact thus depended on how the study charter
49 For some schools and states, publicly available data at the school level did not include mean scale scores and/or
percentages of students in the more refined proficiency categories. Analyses comparing school-level average student achievement are therefore limited to the average percentage of students meeting proficiency throughout the report.
50 The difference between study and nonstudy charter middle schools in the percentage of suspended students may have reflected differences in the schools’ disciplinary policies and/or differences in the behavior of students at the two sets of schools.
51 See Figure II.3 for the distribution of school type by treatment status.

31
Table III.2. Characteristics of Schools Attended by Lottery Winners and Schools Attended by Lottery Losers
Schools Lottery
Winners Attended
Schools Lottery Losers
Attended Difference p-value
Located in Large City (Percentage) 31% 31% 1% 0.949
Enrollment (Means) Total enrollment 484 736 -252 0.004 †† Enrollment per grade 154 302 -148 <0.001 †† Student-Teacher ratio 15.1 15.9 -0.8 0.486
School Uniforms Required (Percentage) 45% 38% 7% 0.501
Time in School (Means) School day length in hours 7.2 6.7 0.4 0.010 † School year length in days 181.2 179.9 1.3 0.355
Facilities (Percentages) Library 64% 88% -24% 0.006 †† Gym 54% 81% -26% 0.005 †† Cafeteria 54% 86% -32% 0.001 †† Child counselors 82% 89% -7% 0.288 Nurse's office 69% 88% -19% 0.020 †
Academic Programming (Percentages) Method of organizing classes
Some/all math classes grouped by ability level 39% 56% -17% 0.063 Some/all English classes grouped by ability level 36% 46% -9% 0.317 Organize classes into “houses” within each grade 60% 62% -2% 0.832 Students loop through multiple grades with teacher 38% 23% 15% 0.083 † Interdisciplinary teaching 72% 60% 12% 0.127 Paired/team teaching 45% 57% -11% 0.254
Primary 7th grade math textbook classified as using reform approach 35% 27% 8% 0.437 Offer gifted/talented program 73% 92% -19% 0.019 † Provide LEP instruction 50% 77% -27% 0.001 †† Offer music and/or art program 100% 98% 2% 0.037 †
Staff Experience of principal (mean number of years as principal) 6.3 5.8 0.5 0.689 Percentage of schools at which 2/3 of teachers have 5+ years experience 51% 43% 7% 0.413 Midpoint of teacher salary range at school (mean) $48,353 $48,993 -$641 0.713 Percentage of teachers at school with full state certification (mean) 79% 90% -12% 0.004 †
Characteristics of Students at School (Means) Percentage Hispanic 26% 32% -5% 0.450 Percentage White 56% 46% 10% 0.191 Percentage Black 12% 16% -3% 0.451 Average daily attendance rate 95% 95% 0% 0.647 Percentage of enrolled students suspended out-of-school 3% 6% -2% 0.033 †† Percentage of students receiving free or reduced-price lunches 33% 45% -12% 0.055 Percentage of students with learning disability and/or IEP 12% 14% -2% 0.274 Percentage of students classified as LEP 4% 11% -6% 0.005 ††

Table III.2 (continued)
32
Difference p-value
Schools Lottery
Winners Attended
Schools Lottery Losers
Attended
Academic Achievement of Students at School (Means) Percentage of 7th graders meeting state proficiency in math 61% 48% 13% 0.025 † Percentage of 7th graders meeting state proficiency in reading 71% 58% 13% 0.018 †
Autonomy Index (Mean) 4.1 1.4 2.6 <0.001 ††
Sample Size—Characteristics Based on Principal Survey or CCD 29 29
Sample Size—Characteristics Based on Principal Survey Alone 24 24
Sample Size—School Test Scores 23 23 †Difference is statistically significant at the 0.05 level, two-tailed test. ††Difference is statistically significant at the 0.01 level, two-tailed test. schools and other schools attended by lottery winners differed from the set of primarily traditional public schools attended by lottery losers. To describe what admission to a study school implied in terms of the experiences of treatment group students, we compared the characteristics of the two sets of schools.52
The schools attended by treatment and control students showed significant differences in a range of characteristics, suggesting that students offered admission to study charter schools had different experiences than those who entered the schools’ lotteries but did not receive an admission offer (Table III.2; see Appendix E for the full set of findings). Compared with the control schools attended by lottery losers, the study charter schools and other schools attended by lottery winners (the treatment schools) were characterized by the following:
• Smaller enrollments. Lottery winners attended smaller schools than lottery losers, with a mean enrollment per grade of 154 versus 302, though the student-teacher ratios in the two sets of schools were similar (15.1 compared to 15.9).
• Longer hours. The study charter schools and other schools attended by lottery winners operated for more hours per day than those attended by lottery losers (7.2 versus 6.7).
• Fewer facilities. Lottery winners had access to fewer school facilities than lottery losers. For example, the percentage of lottery winners attending schools with a library was 64 percent for the treatment group and 88 percent for the control group; the treatment schools were also less likely to have a gym or cafeteria.
52 To compare the two groups of schools, we calculated mean values for each characteristic among schools
attended by lottery winners and schools attended by lottery losers weighted by the number of students within each site. Next, we aggregated the site-level means so that each site was weighted equally and then conducted a t-test of the significance of the difference between the mean values. This approach parallels the approach we used to estimate charter school impacts on student outcomes.

33
• Less ability grouping and supplemental programming. Lottery winners were less likely than lottery losers to attend schools that offered special programs for either gifted or talented students (73 versus 92 percent) or LEP students (50 versus 77 percent). The proportion of treatment schools that grouped students by ability in mathematics classes was also lower than that of control schools (39 versus 56 percent), although the difference was just short of statistical significance (p-value = 0.063).
• Fewer teachers with full certification. On average, 79 percent of teachers at schools attended by lottery winners had full state certification versus 90 percent at schools attended by lottery losers.
• A less disadvantaged student population. Among schools participating in the U.S. Department of Agriculture’s school lunch program, 33 percent of students at treatment schools were eligible for free or reduced-price meals compared with 45 percent at control schools, although the difference was just short of statistical significance (p-value = 0.055). In addition, a smaller proportion of students at treatment were classified as LEP (4 versus 11 percent), and a smaller proportion had been suspended (3 versus 6 percent).
• A higher-achieving student population. The percentage of all enrolled students who met their state’s “proficient” or higher level in both reading and mathematics on the state assessment was 13 points higher at schools attended by lottery winners than schools attended by lottery losers. It is important to keep in mind, however, that the scores were based on all students at these schools, not just on sample members, and thus should not be interpreted as impacts of the study schools.53 The numbers do suggest, however, that lottery winners were surrounded by a group of higher-achieving peers in school than were lottery losers.
• More autonomy. Charter schools are designed to give school leaders greater freedom in designing and operating schools than is typical in traditional public schools. The differences were evident in the comparison of schools attended by lottery winners (an average of 4.1 on the autonomy index) and losers (1.4 on the index), with a higher value indicating more dimensions along which schools reported opportunities for exercising autonomy.
In a few important respects, the treatment and control schools were similar, with no statistically significant difference in student-teacher ratios and teacher salaries or experience levels. Finally, the academic programming at the treatment schools attended by lottery winners and at the control schools attended by lottery losers did not differ significantly with respect to the use of ability grouping in English class, whether the mathematics textbook could be characterized as using a “reform” approach, or the proportion of schools that used team teaching, interdisciplinary teaching, or classes organized into “houses” within each grade.
53 In addition, the figures did not include students (mostly lottery losers) who attended private schools, which did
not administer the state test.

34
C. How Did Lottery Winners and Lottery Losers Compare at the Time of the Lotteries?
The validity of the evaluation rests on the assumption that the charter school lotteries were random as well as on the associated expectation that the lottery winners and lottery losers were statistically similar at the time of the lotteries. This expectation allows any systematic differences in outcomes between the two groups to be attributed to the impact of study charter schools rather than to underlying differences between students who attended and did not attend the schools. Comparing the groups—lottery winners and losers—on a large set of baseline characteristics provides an indication of whether the charter school lotteries operated as expected.
As expected given that the admission lotteries were random, lottery winners and losers exhibited few statistically significant differences in baseline characteristics. Of the 50 characteristics in Table III.3, there were statistically significant differences between lottery winners and losers for only three.54 Lottery winners had higher pre-baseline mathematics scores (scores from two years before lottery winners enrolled in the study schools) than lottery losers and a higher rate of “partial proficiency” in these pre-baseline mathematics scores (90 versus 86 percent). On the other hand, lottery winners and losers had identical mean mathematics scores in the baseline year. Lottery winners were also less likely (47 versus 52 percent) to have family incomes above 30 percent of the poverty line. Three statistically significant differences are approximately what we would expect due to chance when examining differences in 50 characteristics with a 5 percent critical value (5 percent of 50, or roughly 2.5 statistically significant differences). This suggests that the main analysis sample of lottery winners and lottery losers was well balanced according to baseline characteristics, providing a strong foundation for the impact evaluation. We also compared baseline characteristics of lottery winners and lottery losers for all sample members, including those without baseline test scores (Table E.14), and for the set of sample members with valid Year 2 test scores, who were the main analysis sample for the estimates of impacts on that outcome (Table E.15). The comparisons also showed that lottery winners and lottery losers were well balanced with respect to baseline characteristics.55
D. How Did Students Who Applied to Study Charter Schools Differ from Students Who Did Not Apply?
Competing claims maintain that students who apply to or attend charter schools differ from students who do not apply to or attend charter schools. Some critics charge that charter schools attract the more advantaged students, “creaming” off students and their parents from the traditional
54 For consistency with our primary impact estimation model, the means presented in Table III.3 are estimated at
the site level and averaged across sites, giving equal weight to each site. We weighted estimates to account for differential probabilities of assignment to the treatment and control groups in each site.
55 Appendix Table E.14 displays comparable results for the full sample of students who applied to study charter schools, including those without baseline test scores. Table E.15 displays results for the sample included in the main analysis of the second follow-up year’s test scores (that is, those with valid, or nonmissing, test scores in both the baseline year and second follow-up year). Both samples accounted for fewer than 3 statistically significant differences in the 50 baseline characteristics.

35
Table III.3. Baseline Characteristics of Lottery Winners and Losers in Main Analysis Sample
Mean, Full
Sample
Mean, Lottery
Winners
Mean, Lottery Losers Difference
p-value of Difference
Reading Achievement
Baseline reading score (z-score units) 0.42 0.42 0.43 -0.01 0.796 Baseline reading proficiency—proportion “advanced” 0.25 0.25 0.25 0.01 0.677 Baseline reading proficiency—proportion “proficient” or higher
0.71 0.70 0.71 -0.01 0.760
Baseline reading proficiency— proportion “partially proficient” or higher
0.92 0.92 0.93 -0.01 0.304
Pre-baseline reading score (z-score units) 0.42 0.47 0.38 0.09 0.175 Pre-baseline reading proficiency—proportion “advanced” 0.26 0.28 0.24 0.04 0.086 Pre-baseline reading proficiency— proportion “proficient” or higher
0.65 0.70 0.67 0.03 0.270
Pre-baseline reading proficiency— proportion “partially proficient” or higher
0.90 0.92 0.92 0.00 0.812
Math Achievement
Baseline math score (z-score units) 0.45 0.45 0.45 0.00 0.997 Baseline math proficiency— proportion “advanced” 0.30 0.30 0.29 0.01 0.792 Baseline math proficiency— proportion “proficient” or higher 0.66 0.67 0.66 0.01 0.563 Baseline math proficiency— proportion “partially proficient” or higher
0.89 0.89 0.89 0.00 0.969
Pre-baseline math score (z-score units) 0.40 0.47 0.32 0.15 0.030 † Pre-baseline math proficiency— proportion “advanced” 0.25 0.25 0.23 0.02 0.302 Pre-baseline math proficiency— proportion “proficient” or higher
0.65 0.66 0.61 0.05 0.055
Pre-baseline math proficiency— proportion “partially proficient” or higher
0.89 0.90 0.86 0.04 0.038 †
Disciplinary Measures
Number of days absent in baseline school year 5.83 6.07 5.62 0.46 0.123 Student suspended in baseline school year (proportion) 0.03 0.04 0.03 0.01 0.539
Demographic Characteristics
White, Non-Hispanica (proportion) 0.56 0.57 0.55 0.02 0.371 Black, Non-Hispanica (proportion) 0.10 0.10 0.09 0.00 0.877 Other race, Non-Hispanica (proportion) 0.07 0.07 0.08 -0.01 0.412 Hispanic (proportion) 0.28 0.27 0.28 -0.02 0.373 Male (proportion) 0.47 0.46 0.48 -0.01 0.590 Age at start of school year 11.53 11.53 11.52 0.01 0.552 Young for grade (proportion) 0.01 0.01 0.01 0.00 0.473 Old for grade (proportion) 0.09 0.09 0.09 0.00 0.975 IEP status (proportion) 0.17 0.18 0.16 0.02 0.560 Limited English proficiency/ELL (proportion) 0.09 0.10 0.08 0.02 0.095
Family Characteristics (proportions)
Income to poverty ratio 0 to 100 percent 0.12 0.13 0.12 0.01 0.475 Income to poverty ratio 100 to 200 percent 0.20 0.21 0.19 0.02 0.362 Income to poverty ratio 200 to 300 percent 0.17 0.18 0.16 0.02 0.319 Income to poverty ratio >300 percent 0.51 0.49 0.54 -0.05 0.033 † Two parent family 0.78 0.78 0.79 -0.01 0.704 Not two-parent family, but more than one adult 0.04 0.05 0.04 0.01 0.260 English main language spoken at home 0.90 0.89 0.90 -0.01 0.577 Mother’s education: high school or less 0.23 0.23 0.24 -0.01 0.755 Mother’s education: some college 0.35 0.35 0.35 0.00 0.867 Mother’s education: college 0.42 0.42 0.42 0.00 0.924 Born in U.S. 0.92 0.92 0.92 0.00 0.895
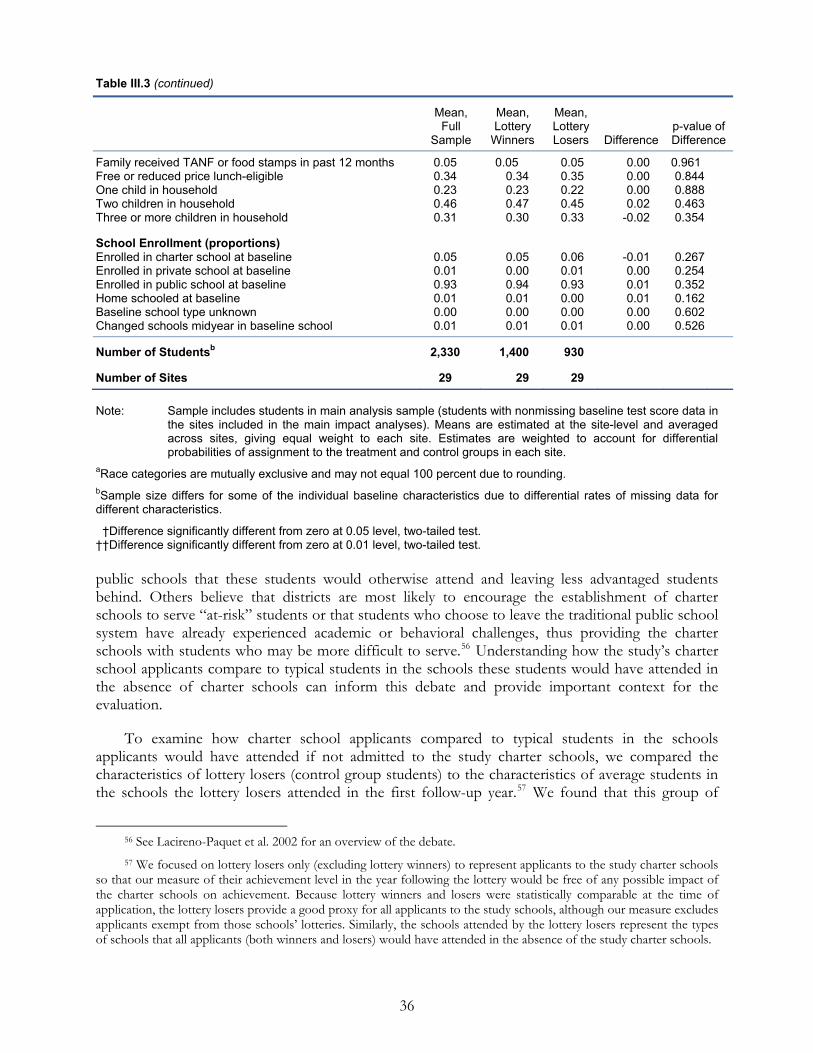
Table III.3 (continued)
36
Mean, Lottery Losers Difference
p-value of Difference
Mean, Full
Sample
Mean, Lottery
Winners
Family received TANF or food stamps in past 12 months 0.05 0.05 0.05 0.00 0.961 Free or reduced price lunch-eligible 0.34 0.34 0.35 0.00 0.844 One child in household 0.23 0.23 0.22 0.00 0.888 Two children in household 0.46 0.47 0.45 0.02 0.463 Three or more children in household 0.31 0.30 0.33 -0.02 0.354
School Enrollment (proportions) Enrolled in charter school at baseline 0.05 0.05 0.06 -0.01 0.267 Enrolled in private school at baseline 0.01 0.00 0.01 0.00 0.254 Enrolled in public school at baseline 0.93 0.94 0.93 0.01 0.352 Home schooled at baseline 0.01 0.01 0.00 0.01 0.162 Baseline school type unknown 0.00 0.00 0.00 0.00 0.602 Changed schools midyear in baseline school 0.01 0.01 0.01 0.00 0.526
Number of Studentsb 2,330 1,400 930
Number of Sites 29 29 29 Note: Sample includes students in main analysis sample (students with nonmissing baseline test score data in
the sites included in the main impact analyses). Means are estimated at the site-level and averaged across sites, giving equal weight to each site. Estimates are weighted to account for differential probabilities of assignment to the treatment and control groups in each site.
aRace categories are mutually exclusive and may not equal 100 percent due to rounding. bSample size differs for some of the individual baseline characteristics due to differential rates of missing data for different characteristics.
†Difference significantly different from zero at 0.05 level, two-tailed test. ††Difference significantly different from zero at 0.01 level, two-tailed test. public schools that these students would otherwise attend and leaving less advantaged students behind. Others believe that districts are most likely to encourage the establishment of charter schools to serve “at-risk” students or that students who choose to leave the traditional public school system have already experienced academic or behavioral challenges, thus providing the charter schools with students who may be more difficult to serve.56 Understanding how the study’s charter school applicants compare to typical students in the schools these students would have attended in the absence of charter schools can inform this debate and provide important context for the evaluation.
To examine how charter school applicants compared to typical students in the schools applicants would have attended if not admitted to the study charter schools, we compared the characteristics of lottery losers (control group students) to the characteristics of average students in the schools the lottery losers attended in the first follow-up year.57 We found that this group of
56 See Lacireno-Paquet et al. 2002 for an overview of the debate. 57 We focused on lottery losers only (excluding lottery winners) to represent applicants to the study charter schools
so that our measure of their achievement level in the year following the lottery would be free of any possible impact of the charter schools on achievement. Because lottery winners and losers were statistically comparable at the time of application, the lottery losers provide a good proxy for all applicants to the study schools, although our measure excludes applicants exempt from those schools’ lotteries. Similarly, the schools attended by the lottery losers represent the types of schools that all applicants (both winners and losers) would have attended in the absence of the study charter schools.

37
charter school applicants were, on average, higher-achieving than the average students in the schools attended by lottery losers (Table III.4). Compared to the average students in the schools and grades attended by lottery losers, control group students were 16 percentage points more likely to meet proficiency in reading and 13 percentage points more likely to meet proficiency in mathematics. They were also 5 and 7 percentage points more likely to score at the “advanced” level or higher and 7 and 8 percentage points more likely to score at the “partially proficient” level or higher in reading and mathematics, respectively, than the average student in the grade level in the schools attended by control group students.58
Control group students were less likely to be black, non-Hispanic than the average student in the schools they attended (9 versus 14 percent). Conversely, charter school applicants were 7 percentage points more likely than all students in the schools they attended to be white, non-Hispanic, but the difference did not reach the level of statistical significance (p-value = 0.060). There were no significant differences between the applicants and the average students in their schools in the percentage who were LEP or who had an IEP. The percentage eligible for free or reduced-price meals was lower among charter school applicants than among all students at their schools (39 versus 46 percent), but the difference was not statistically significant (p-value of difference = 0.067).
E. What Proportion of Lottery Winners and Losers Changed Schools Each Year?
Although a central component of school choice involves the possibility of changing schools either between or within school years, we studied a period in which sample members were making the normal transition from elementary school to middle school. Given that the charter middle schools typically attended by lottery winners may start in a different grade than the traditional public middle schools attended by most lottery losers and that studies show that transitions to a new school adversely affect student achievement (Bifulco and Ladd 2006; Sass 2006), we wanted to examine what proportion of lottery winners and lottery losers switched schools in each of the years covered by the study. If most transitions occurred in different follow-up years for lottery winners and losers, they should be a consideration in the interpretation of impacts.
58 Along with achieving at a higher level than other students in the schools they would attend if they did not attend
the charter school to which they applied, applicants to the study charter schools in our sample were also higher-achieving than the average student in their grade statewide. In particular, both lottery winners and lottery losers had mean baseline reading and mathematics scores (reported in z-score units) of about 0.45—or nearly half a standard deviation above the state average. These overall mean values across the study sample masked substantial variation in achievement level across participating charter schools, some of which served an even higher-achieving student population while others served students who were, on average, at or below the state mean achievement level.

38
Table III.4. Comparison of Lottery Participants with All Students in Their Schools
Characteristic (proportions)
Mean, Lottery Losers
Mean, Schools Lottery Losers
Attended Schools Difference
p-value of Difference
Reading Achievement Year 1 reading proficiency—“advanced” 0.22 0.17 0.05 0.045 † Year 1 reading proficiency—“proficient” or higher 0.73 0.57 0.16 <0.001 †† Year 1 reading proficiency—“partially proficient” or higher 0.91 0.84 0.07 <0.001 ††
Math Achievement Year 1 math proficiency—“advanced” 0.22 0.16 0.07 0.011 † Year 1 math proficiency—“proficient” or higher 0.58 0.45 0.13 0.001 †† Year 1 math proficiency—“partially proficient” or higher 0.81 0.73 0.08 0.004 ††
Demographic and Family Characteristics White, Non-Hispanica 0.55 0.48 0.07 0.060 Black, Non-Hispanica 0.09 0.14 -0.05 0.025 † Other race, Non-Hispanica 0.06 0.07 0.00 0.982 Hispanic 0.29 0.32 -0.03 0.510 IEP status 0.15 0.14 0.01 0.624 Limited English Proficiency/ELL 0.08 0.11 -0.03 0.073 Free or reduced price lunch-eligible 0.39 0.46 -0.07 0.067
Number of Studentsb 624
Number of Sitesc 29 Note: Data for the control group sample are from the National Charter School Evaluation. Data for the control
group schools are from the Common Core of Data. Control group sample includes those students in main analysis sample (students with nonmissing baseline test score data in the sites included in the main impact analyses). Estimates for control group schools are weighted by the proportion of control group students attending each school in each site.
aRace categories are mutually exclusive and may not equal 100 percent due to rounding. bSample size differs for some of the individual baseline characteristics due to differential rates of missing data for different characteristics. Control group sample limited to those students for whom school-level data are available. cSample for math and reading proficiency levels limited to the 25 sites in which school-level proficiency score data were available.
†Treatment-control difference significantly different from zero at 0.05 level, two-tailed test. ††Treatment-control difference significantly different from zero at 0.01 level, two-tailed test.
For several charter middle schools participating in the study, the schools’ entry grade coincided with the last year of the traditional public elementary schools attended by sample members when they applied to the study charter school. Therefore, we would expect lottery winners to change schools at a higher rate than lottery losers between the baseline and first follow-up years and would expect the reverse to be true between the first and second follow-up years.59 Indeed, as we show in
59 Because no students in the sample attended study charter schools in the baseline year, all lottery winners who
attended study charter schools changed schools between the baseline and first follow-up years. In contrast, lottery losers (as well as lottery winners who did not attend a study charter school) had the option of remaining in their current school if they were not in that school’s final grade in the baseline year. Between the first and second follow-up years, students attending a study charter school had the option of remaining at that school (none was in the final grade of his or her school) while students not attending a study charter school had to change schools if they were in their school’s final grade in the first follow-up year.

39
Table III.5, almost all lottery winners (96 percent) changed schools between the baseline and first follow-up years while only 76 percent of lottery losers changed schools between the two years. Between the first and second follow-up years, 13 percent of lottery winners changed schools versus 34 percent of lottery losers.
Table III.5. Percent of Students Changing Schools
Lottery
Winners Lottery Losers Difference
p-value of Difference
Changed school between baseline and first follow-up years 95 75 20 <0.001††
Changed school between first and second follow-up years 12 34 -21 <0.001††
Number of Students 1,301 830
Number of Sites 29 29 Note: Sample includes students in main analysis sample (students with nonmissing baseline test score data in
the sites included in the main impact analyses).
†Difference significantly different from zero at 0.05 level, two-tailed test. ††Difference significantly different from zero at 0.01 level, two-tailed test.

This page is intentionally left blank.

41
IV. IMPACTS ON STUDENTS AND PARENTS
The notion that charter schools have the potential to improve student achievement is embedded in federal education policy and programs.60 For that reason, the main goal of this study is to estimate the impact of a set of charter middle schools on student scores on state assessments in reading and mathematics. However, an examination of other outcomes—student proficiency levels on state assessments, effort in school, behavior, and attitudes as well as parent involvement and satisfaction—can further our understanding of charter schools’ influence and of how the schools may or may not contribute to academic achievement. Similarly, an examination of impacts on specific subgroups of students can enhance our understanding of the types of students for whom charter schools may be more or less effective. In this chapter, we present both the primary analyses of study charter schools’ impacts on test scores and the secondary, exploratory analyses of impacts on other outcomes and for specific student subgroups.61 We examine estimated impacts of the offer of admission to a study charter school and of charter school attendance.
We base all impact estimates on the effects of the charter schools in the study. While the institutions include a range of charter middle schools across the country, the schools in the study are limited to those that had been operating for at least two years, had sufficient waiting lists, and were willing to participate in the study. Therefore, the results may not generalize to charter middle schools more broadly or to charter elementary and high schools, which were not included in the study.
A. Academic Achievement
As described in Chapter II, we estimated impacts on student test scores one and two years after students applied to the study charter schools. The analyses indicate the following:
• On average, study charter schools did not have a statistically significant impact on student achievement.
Students admitted to participating charter middle schools through lotteries scored about the same on state reading and mathematics assessments as did students who applied but were not admitted (Table IV.1).62 None of the impact estimates was statistically significant after adjusting for
60 Both the current version of the Elementary and Secondary Education Act (No Child Left Behind Act of 2001)
and newer education reform efforts under the American Recovery and Reinvestment Act of 2009 encourage districts to convert persistently low-performing schools to charter schools.
61 As described in Appendix D, analysis of multiple outcomes and multiple population subgroups could yield misleading estimates unless adjustments are made for multiple hypothesis testing. To make the adjustments, we applied the framework recommended by Schochet (2008) and designated student achievement as the study’s sole “confirmatory” outcome domain. Impacts on all other outcomes and for population subgroups are considered exploratory and are not as rigorous as those for the confirmatory analysis. Appendix D provides further details on our approach.
62 In Table IV.1, we present both “impacts” and “effect sizes” of impacts on test scores. As described in Chapter II, with student test scores converted to z-scores for comparability across states and grades in the analysis, the main impact estimates on test scores may also be thought of as effect sizes, though with a slightly different interpretation than the effect sizes for test scores presented in the table. The impacts on z-scores reflect impacts on students’ performance relative to other students in that state and grade while the estimated effect sizes for test scores represent impacts on students’ performance relative to the control group sample in that site (and grade).

Table IV.1. Impacts on Student Achievement
42
Impact of Admission Offer (ITT)
Outcome (z-scores)
Impact of Attendance (TOT)
Mean, Lottery
Winners
Mean, Lottery Losers
Difference (Impact
Estimate) Effect Sizea p-value
Adjusted Impact
Estimate Effect Sizea p-value
Reading Achievement Year 1 0.40 0.44 -0.04 -0.07 0.214 -0.06 -0.10 0.231 Year 2 0.31 0.38 -0.07 -0.08 0.032† -0.08 -0.10 0.117
Math Achievement Year 1 0.34 0.39 -0.06 -0.06 0.061 -0.09 -0.10 0.072 Year 2 0.32 0.38 -0.06 -0.06 0.136 -0.08 -0.08 0.202
Number of Students 1,328 822 2,150 2,141
Number of Sites 29 29 Note: Means, impact estimates, and effect sizes are estimated at the site-level and averaged across sites. Means for lottery losers are not regression
adjusted; means for lottery winners are computed as the unadjusted mean for lottery losers plus the regression-adjusted impact estimate. Test scores were standardized across states by converting to z-scores (raw scores minus the state mean score for that subject and grade, divided by the standard deviation of scores for that subject and grade), and impact estimates represent charter schools’ effects on student scores relative to the typical student in that state and grade. Effect sizes divide the impact estimate by the standard deviation for lottery losers and represent the effect of charter schools on student scores relative to the typical lottery loser. The Benjamini-Hochberg procedure was used to adjust for multiple hypothesis testing within this domain. Sample sizes vary for individual outcomes.
a Because student test scores were converted to z-scores for comparability across states and grades in the analysis, the main impact estimates on test scores can also be thought of as effect sizes, but have a slightly different interpretation. The impacts on z-scores reflect impacts on students’ performance relative to other students in that state and grade, while the estimated effect sizes for test scores represent impacts on students’ performance relative to the control group sample in that site. ITT = Intent to treat. TOT = Treatment on treated.
†Difference between lottery winners and losers is statistically significant at the 0.05 level, two-tailed test. ††Difference between lottery winners and losers is statistically significant at the 0.01 level, two-tailed test. *Difference between lottery winners and losers is statistically significant at the 0.05 level after adjusting for multiple hypothesis testing within outcome domains,
two-tailed test. **Difference between lottery winners and losers is statistically significant at the 0.01 level after adjusting for multiple hypothesis testing within outcome domains,
two-tailed test.

43
the multiple hypothesis tests we conducted on achievement, although the impact of charter school admission on Year 2 reading scores was significant before adjusting for multiple hypothesis tests. The estimated impacts of charter school admission on state assessments ranged from -0.04 standard deviation for Year 1 reading scores to -0.07 standard deviation for Year 2 reading scores, with an impact on mathematics achievement for both years of -0.06 (Table IV.1).63 The estimated effects of attending a charter school on student achievement ranged from -0.06 standard deviation for Year 1 reading scores to -0.09 standard deviation for Year 1 mathematics scores. Effects of this magnitude are equal to approximately one-quarter of a year less instruction for students in charter schools than what they would have received had they not been admitted.64 These estimated impacts were not sensitive to the specific analytic approach we used.65
• The study charter schools had different effects on lower- versus higher-income students.
We examined the possibility that admission to study charter schools, while not having statistically significant impacts overall, had an effect on student achievement for particular subgroups of students.66 We found that, among the higher-income group (those not certified for free or reduced-price meals), charter school admission had a negative and statistically significant effect on Year 1 mathematics scores and Year 2 reading and mathematics scores. (Year 2 data are shown in Figure IV.1; Year 1 data can be found in Appendix Table F.7) Among the lower-income group, charter school admission had a positive and significant impact on Year 2 mathematics scores. Moreover, the difference in impacts between the higher- and lower-income groups was statistically significant for all outcomes except Year 1 reading scores. The findings suggest that the study charter schools had positive effects in mathematics for more economically disadvantaged students and negative effects in both reading and mathematics for more economically advantaged students.
63 As described in Chapter II, the estimated impact of admission to a study charter school is the intent-to-treat
(ITT) impact estimate. 64 This is based on estimates from Hill et al. (2007) of the average annual gain in test scores in standard deviation
units across grade levels. Based on a sample of seven nationally normed tests, the authors show that the average annual test score gain is 0.26 standard deviation in reading in grades 5 through 8 and 0.31 standard deviation in mathematics.
65 Appendix F presents ITT estimates under a variety of model specifications (discussed in Chapter II), including alternative approaches for averaging impacts across sites (Table F.1), the exclusion of model covariates (Table F.2), alternative rules for dropping or retaining sites (Table F.3), alternative approaches to account for possible bias due to missing outcome data (Table F.4), alternative assumptions about clustering of error terms (Table F.5), and alternative definitions of treatment status (Table F.6). Under each alternative specification, the estimated impacts of charter school admission on state reading and mathematics assessment scores were comparable in magnitude to the main impact estimates and were not statistically significant after adjusting for multiple hypothesis testing. In Table F.4, we present upper and lower bounds on the impacts, taking into account possible bias due to sample attrition; lower-bound estimates range from -0.15 to -0.21 standard deviation and are all statistically significant after adjusting for multiple hypothesis testing while upper-bound estimates range from 0.04 to 0.10 and are statistically significant only for Year 1 reading scores.
66 All subgroup results presented in the report present ITT impact estimates. See Appendix F for full results for all five sets of subgroup ITT analyses.
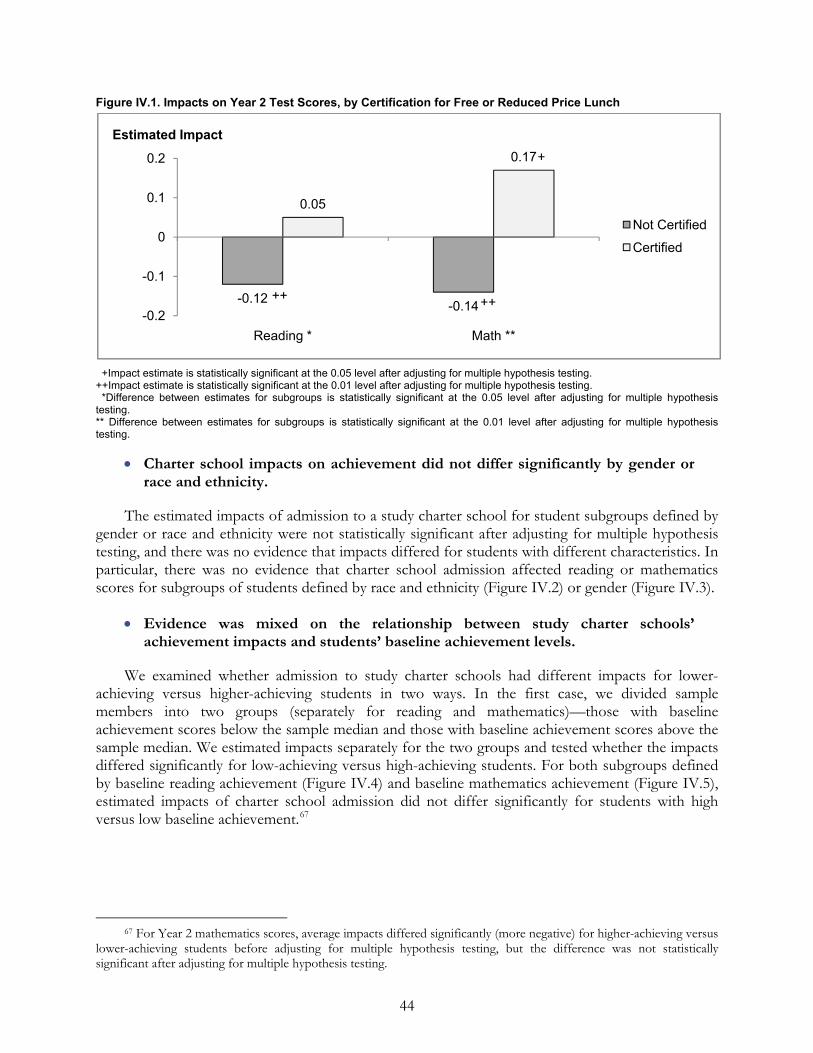
Figure IV.1. Impacts on Year 2 Test Scores, by Certification for Free or Reduced Price Lunch
-0.12 -0.14
0.05
0.17
-0.2
-0.1
0
0.1
0.2
Reading * Math **
Estimated Impact
Not Certified
Certified
++
+
++
+Impact estimate is statistically significant at the 0.05 level after adjusting for multiple hypothesis testing. ++Impact estimate is statistically significant at the 0.01 level after adjusting for multiple hypothesis testing. *Difference between estimates for subgroups is statistically significant at the 0.05 level after adjusting for multiple hypothesis testing. ** Difference between estimates for subgroups is statistically significant at the 0.01 level after adjusting for multiple hypothesis testing.
• Charter school impacts on achievement did not differ significantly by gender or race and ethnicity.
The estimated impacts of admission to a study charter school for student subgroups defined by gender or race and ethnicity were not statistically significant after adjusting for multiple hypothesis testing, and there was no evidence that impacts differed for students with different characteristics. In particular, there was no evidence that charter school admission affected reading or mathematics scores for subgroups of students defined by race and ethnicity (Figure IV.2) or gender (Figure IV.3).
• Evidence was mixed on the relationship between study charter schools’ achievement impacts and students’ baseline achievement levels.
We examined whether admission to study charter schools had different impacts for lower-achieving versus higher-achieving students in two ways. In the first case, we divided sample members into two groups (separately for reading and mathematics)—those with baseline achievement scores below the sample median and those with baseline achievement scores above the sample median. We estimated impacts separately for the two groups and tested whether the impacts differed significantly for low-achieving versus high-achieving students. For both subgroups defined by baseline reading achievement (Figure IV.4) and baseline mathematics achievement (Figure IV.5), estimated impacts of charter school admission did not differ significantly for students with high versus low baseline achievement.67
44
67 For Year 2 mathematics scores, average impacts differed significantly (more negative) for higher-achieving versus
lower-achieving students before adjusting for multiple hypothesis testing, but the difference was not statistically significant after adjusting for multiple hypothesis testing.

Figure IV.2. Impacts on Year 2 Test Scores, by Race
-0.07 -0.09-0.08-0.03
-0.2
-0.1
0
0.1
0.2
Reading Math
Estimated Impact
White, Non-Hispanic
Nonwhite and/or Hispanic
+Impact estimate is statistically significant at the 0.05 level after adjusting for multiple hypothesis testing. ++Impact estimate is statistically significant at the 0.01 level after adjusting for multiple hypothesis testing. *Difference between estimates for subgroups is statistically significant at the 0.05 level after adjusting for multiple hypothesis testing. **Difference between estimates for subgroups is statistically significant at the 0.01 level after adjusting for multiple hypothesis testing.
Figure IV.3. Impacts on Year 2 Test Scores, by Gender
-0.08 -0.09
0.03 0.02
-0.2
-0.1
0
0.1
0.2
Reading Math
Estimated Impact
Female
Male
+Impact estimate is statistically significant at the 0.05 level after adjusting for multiple hypothesis testing. ++Impact estimate is statistically significant at the 0.01 level after adjusting for multiple hypothesis testing. *Difference between estimates for subgroups is statistically significant at the 0.05 level after adjusting for multiple hypothesis testing. **Difference between estimates for subgroups is statistically significant at the 0.01 level after adjusting for multiple hypothesis testing.
45

Figure IV.4. Impacts on Year 2 Test Scores, by Baseline Reading Achievement
-0.02
0.05
-0.13 -0.11
-0.2
-0.1
0
0.1
0.2
Reading Math
Estimated Impact
Below Median
Above Median
+
+Impact estimate is statistically significant at the 0.05 level after adjusting for multiple hypothesis testing. ++Impact estimate is statistically significant at the 0.01 level after adjusting for multiple hypothesis testing. *Difference between estimates for subgroups is statistically significant at the 0.05 level after adjusting for multiple hypothesis testing. **Difference between estimates for subgroups is statistically significant at the 0.01 level after adjusting for multiple hypothesis testing.
Figure IV.5. Impacts on Year 2 Test Scores, by Baseline Math Achievement
0.01
0.08
-0.10 -0.10
-0.2
-0.1
0
0.1
0.2
Reading Math
Estimated Impact
Below Median
Above Median
+Impact estimate is statistically significant at the 0.05 level after adjusting for multiple hypothesis testing. ++Impact estimate is statistically significant at the 0.01 level after adjusting for multiple hypothesis testing. *Difference between estimates for subgroups is statistically significant at the 0.05 level after adjusting for multiple hypothesis testing. **Difference between estimates for subgroups is statistically significant at the 0.01 level after adjusting for multiple hypothesis testing.
In the second case, we included in our main impact model a continuous measure of students’ baseline achievement level (their average scores on the state reading and mathematics tests in the year they applied to the charter school) interacted with the treatment status variable indicating whether students were lottery winners or lottery losers. This approach allowed us to take advantage of the full range of variability in students’ baseline achievement and is similar to the approach used by Angrist et al. (2010) to examine the same relationship in a recent lottery-based charter school study. We found that the impact of winning a lottery on Year 2 achievement in both reading and mathematics was significantly related to students’ baseline achievement. In particular, the negative
46

47
interaction suggested that impacts were more negative for students who were higher-achieving when they applied to a study charter school. The estimated interaction between baseline achievement and charter school impacts on Year 2 reading scores was -0.131 (p-value = 0.001). This coefficient indicates that, for each 1 standard deviation increase in a student’s mean baseline reading and mathematics test scores, the estimated impact of admission to a study charter school on Year 2 reading z-scores declined by 0.131. The estimated interaction between baseline achievement and study charter school impacts on Year 2 mathematics scores was -0.225 (p-value<0.001).
B. Other Measures of Performance and Effort in School
The study charter schools had no statistically significant impact on other measures of students’ academic performance (Tables IV.2 and IV.3) or effort in school (Table IV.4) once we adjusted for multiple hypothesis testing within each domain. Lottery winners and losers were comparable in the percentage meeting various state proficiency levels, attendance, tardiness, end-of-year promotion, homework completion, and parent perceptions of how hard students worked in school (unadjusted p-values ranged from 0.029 to 0.972). 68
C. Student Well-Being
We examined several measures of student well-being, including whether a student planned to attend college, whether parents expected their child to attend college, and indexes reflecting involvement in extracurricular activities, parent reports of the degree to which their child is well adjusted, and parent concerns about their child. (Appendix C discusses the items included in these and other indexes.) Admission to a study charter school affected just one of these outcomes—the index of parent reports on the degree to which their child was well adjusted (Table IV.5).69 On average, parents of lottery winners offered admission to study charter schools were more likely to report better-adjusted children than were parents of lottery losers—the average value of the index was 3.43 for parents of lottery winners compared to 3.35 for parents of lottery losers.70 The results suggest that, on average, parents in both groups agreed or strongly agreed with the statements in the index but that parents of lottery winners were, on average, more likely to agree strongly than were parents of lottery losers.
68 Although lottery winners are compared to lottery losers within a state as discussed in Chapter II, the reader
should use caution when interpreting results based on proficiency measures given variation in state standards for proficiency.
69 This index, which ranged from 1 to 4, was derived from parents’ responses (ranging from “strongly disagree” to “strongly agree”) to six statements about their child—that he or she “gets along well with others,” “likes school,” “works hard at school,” “is self-confident,” “is creative,” and “is happy.” Higher values indicated that parents believed that their child was happier and better adjusted.
70 Mean values of these and other outcomes for lottery losers are not regression-adjusted; each mean value for lottery winners is computed as the unadjusted mean for lottery losers plus the regression-adjusted impact estimate.

48
Table IV.2. Impacts on State Proficiency Levels
Outcome
Impact of Admission Offer (ITT) Impact of Attendance (TOT)
Mean, Lottery
Winners
Mean, Lottery Losers
Difference (Impact
Estimate) Effect Size p-value
Adjusted Impact
Estimate Effect Size p-value
Reading Achievement—Year 1 Proportion at “advanced” level or higher 0.22 0.24 -0.02 -0.06 0.241 -0.03 -0.02 0.286 Proportion at “proficient” level or higher 0.71 0.72 0.00 -0.06 0.813 -0.02 0.05 0.565 Proportion at “partially proficient” level or higher 0.92 0.92 0.00 0.01 0.736 -0.01 -0.11 0.721
Reading Achievement—Year 2 Proportion at “advanced” level or higher 0.21 0.24 -0.03 -0.19 0.105 -0.05 -0.27 0.107 Proportion at “proficient” level or higher 0.73 0.71 0.01 0.05 0.497 0.02 0.04 0.649 Proportion at “partially proficient” level or higher 0.92 0.93 -0.01 -0.03 0.549 0.00 0.07 0.836
Math Achievement—Year 1 Proportion at “advanced” level or higher 0.23 0.27 -0.04 -0.07 0.041† -0.05 -0.11 0.093 Proportion at “proficient” level or higher 0.59 0.61 -0.01 -0.05 0.450 -0.03 -0.04 0.395 Proportion at “partially proficient” level or higher 0.84 0.84 0.00 -0.15 0.972 0.01 -0.19 0.850
Math Achievement—Year 2 Proportion at “advanced” level or higher 0.21 0.23 -0.02 0.03 0.204 -0.04 0.01 0.244 Proportion at “proficient” level or higher 0.60 0.60 0.00 -0.04 0.861 -0.01 -0.02 0.705 Proportion at “partially proficient” level or higher 0.89 0.87 0.02 0.08 0.240 0.03 0.06 0.295
Number of Students 1,330 820 2,150 2,141
Number of Sites 29 29 Note: Means, impact estimates, and effect sizes are estimated at the site-level and averaged across sites. Means for lottery losers are not regression
adjusted; means for lottery winners are computed as the unadjusted mean for lottery losers plus the regression-adjusted impact estimate. Effect sizes for binary outcomes are expressed as log odds ratios, which describe the extent to which winning the admissions lottery increases or decreases the likelihood of giving the higher response. The Benjamini-Hochberg procedure was used to adjust for multiple hypothesis testing within this domain. Sample sizes vary for individual outcomes.
ITT = Intent to treat. TOT = Treatment on treated.
†Difference between lottery winners and losers is statistically significant at the 0.05 level, two-tailed test. ††Difference between lottery winners and losers is statistically significant at the 0.01 level, two-tailed test. *Difference between lottery winners and losers is statistically significant at the 0.05 level after adjusting for multiple hypothesis testing within outcome domains,
two-tailed test. **Difference between lottery winners and losers is statistically significant at the 0.01 level after adjusting for multiple hypothesis testing within outcome domains,
two-tailed test.

49
Table IV.3. Impacts on Other Measures of Academic Performance
Outcome
Impact of Admission Offer (ITT) Impact of Attendance (TOT)
Mean, Lottery Winners
Mean, Lottery Losers
Difference (Impact
Estimate) Effect Size p-value
Adjusted Impact
Estimate Effect Size p-value
Number of days absent (means) Year 1 6.19 6.56 -0.37 -0.02 0.301 0.16 0.03 0.817 Year 2 6.99 6.76 0.22 0.11 0.576 0.83 0.24 0.253
Late to school 5 or more days (proportion) 0.19 0.14 0.05 0.13 0.032† 0.09 0.37 0.016†
Promoted to next grade (proportion) Year 1 0.99 0.99 0.00 0.83 0.930 0.00 -0.48 0.886 Year 2 0.99 0.99 -0.01 0.31 0.159 -0.01 0.60 0.068
Number of Students 1,198 770 1,968 1,961
Number of Sites 28 28 Note: Means, impact estimates, and effect sizes are estimated at the site-level and averaged across sites. Means for lottery losers are not regression
adjusted; means for lottery winners are computed as the unadjusted mean for lottery losers plus the regression-adjusted impact estimate. Effect sizes for continuous outcomes are in standard deviation units and for binary outcomes are expressed as log odds ratios, which describe the extent to which winning the admissions lottery increases or decreases the likelihood of giving the higher response. The Benjamini-Hochberg procedure was used to adjust for multiple hypothesis testing within this domain. Except where noted, outcomes were measured during the first follow-up year. Sample sizes vary for individual outcomes.
ITT = Intent to treat. TOT = Treatment on treated.
†Difference between lottery winners and losers is statistically significant at the 0.05 level, two-tailed test. ††Difference between lottery winners and losers is statistically significant at the 0.01 level, two-tailed test. *Difference between lottery winners and losers is statistically significant at the 0.05 level after adjusting for multiple hypothesis testing within outcome domains,
two-tailed test. **Difference between lottery winners and losers is statistically significant at the 0.01 level after adjusting for multiple hypothesis testing within outcome domains,
two-tailed test.

50
Table IV.4. Impacts on Student Effort in School
Outcome (proportions)
Impact of Admission Offer (ITT) Impact of Attendance (TOT)
Mean, Lottery
Winners
Mean, Lottery Losers
Difference (Impact
Estimate) Effect Size p-value
Adjusted Impact
Estimate Effect Size p-value
Student reports completing homework mostly/always 0.91 0.86 0.04 0.34 0.029† 0.07 0.04 0.034†
Student reports completing homework always 0.57 0.57 0.00 -0.01 0.898 -0.01 -0.09 0.851
Parent says student works hard 0.92 0.91 0.01 0.17 0.555 0.01 -0.01 0.712
Number of Students 1,187 738 1,925 1,922
Number of Sites 29 29 Note: Means, impact estimates, and effect sizes are estimated at the site-level and averaged across sites. The mean for lottery losers is not regression
adjusted; Means for lottery losers are not regression adjusted; means for lottery winners are computed as the unadjusted mean for lottery losers plus the regression-adjusted impact estimate. Effect sizes for continuous outcomes are in standard deviation units and for binary outcomes are expressed as log odds ratios, which describe the extent to which winning the admissions lottery increases or decreases the likelihood of giving the higher response. The Benjamini-Hochberg procedure was used to adjust for multiple hypothesis testing within this domain. Outcomes were measured in the first follow-up year. Sample sizes vary for individual outcomes.
ITT = Intent to treat. TOT = Treatment on treated.
†Difference between lottery winners and losers is statistically significant at the 0.05 level, two-tailed test. ††Difference between lottery winners and losers is statistically significant at the 0.01 level, two-tailed test. *Difference between lottery winners and losers is statistically significant at the 0.05 level after adjusting for multiple hypothesis testing within outcome domains,
two-tailed test. **Difference between lottery winners and losers is statistically significant at the 0.01 level after adjusting for multiple hypothesis testing within outcome domains,
two-tailed test.

51
Table IV.5. Impacts on Other Measures of Student Well-Being
Outcome
Impact of Admission Offer (ITT) Impact of Attendance (TOT)
Mean, Lottery Winners
Mean, Lottery Losers
Difference (Impact
Estimate) Effect Size p-value
Adjusted Impact
Estimate Effect Size p-value
Student expects to attend college (proportion) 0.89 0.87 0.02 0.01 0.276 0.04 0.19 0.299
Parent expects student to attend college (proportion) 0.93 0.92 0.01 0.06 0.645 0.01 -0.25 0.721
Extracurricular activity index (mean)a 2.75 2.54 0.21 0.15 0.085 0.19 0.16 0.409
Parent reported index of how well-adjusted student is (mean)b 3.42 3.34 0.08 0.22 0.001††** 0.13 0.34 0.003††*
Parent concerns about student index (mean)c 2.11 2.13 -0.02 0.05 0.183 -0.03 0.11 0.361
Number of Students 1,189 740 1,929 1,925
Number of Sites 29 29
Note: Means, impact estimates, and effect sizes are estimated at the site-level and averaged across sites. Means for lottery losers are not regression adjusted; means for lottery winners are computed as the unadjusted mean for lottery losers plus the regression-adjusted impact estimate. Effect sizes for continuous outcomes are in standard deviation units and for binary outcomes are expressed as log odds ratios, which describe the extent to which winning the admissions lottery increases or decreases the likelihood of giving the higher response. The Benjamini-Hochberg procedure was used to adjust for multiple hypothesis testing within this domain. Outcomes were measured during the first follow-up year. Sample sizes vary for individual outcomes.
aThe extracurricular activity index is based on multiple binary indicators from the student survey. It takes on values between 0 and 12, inclusive, and represents the number of different extracurricular activities the student reported participating in at school. See Appendix C for details. bThe parent reported index of how well-adjusted the student is comes from multiple items on the parent survey. It takes on values between 1 and 4, inclusive, with higher values representing greater well-being. These items include measures of how well the child gets along with others, works hard, is creative, and is happy. See Appendix C for details. cThe parent concerns about student index comes from multiple items on the parent survey. It takes on values between 1 and 3, inclusive, with higher values representing greater parent concerns. These items include measures of the child’s problems with getting into trouble; smoking, drinking alcohol, or using drugs; friends; academic achievement; and safety. See Appendix C for details.
ITT = Intent to treat. TOT = Treatment on treated.
†Difference between lottery winners and losers is statistically significant at the 0.05 level, two-tailed test. ††Difference between lottery winners and losers is statistically significant at the 0.01 level, two-tailed test. *Difference between lottery winners and losers is statistically significant at the 0.05 level after adjusting for multiple hypothesis testing within outcome domains, two-tailed
test. **Difference between lottery winners and losers is statistically significant at the 0.01 level after adjusting for multiple hypothesis testing within outcome domains, two-tailed
test.

52
D. Student Behavior and School Disciplinary Action
We examined the impact of study charter schools on several measures of school disciplinary action and student behavior (Tables IV.6 and IV.7). For example, we obtained school records data on whether a student had been suspended during the school year. Given that episodes of less serious misbehavior may have involved a request for the student to leave a class, we asked students about the frequency of such events. Finally, two items on the parent survey measured parents’ knowledge of student misbehavior in school.71 Several additional student survey items measured students’ behavior out of school; the items are summarized with indices of student-reported good and bad behavior outside school.72
Study charter schools had no impact on student behavior or school disciplinary action either within or outside school. None of the estimated impacts of admission to a study charter school on suspensions and other measures of in-school behavior was statistically significant; unadjusted p-values of the impacts of admission offers ranged from 0.106 to 0.895 (Table IV.6). Similarly, lottery winners and lottery losers had statistically equivalent out-of-school behavior, according to the student-reported indices of good and bad behavior outside school (Table IV.7).
71 All of these measures could be proxies for either student behavior or school policy, so impacts on these
outcomes should be interpreted with caution. 72 The student-reported good behavior index ranged from 1 to 3 and was based on students’ responses to
questions about how often they engaged in certain positive behaviors, including helping other students with school work, helping teachers, doing volunteer work, reading for fun, and going to the library. The student-reported bad behavior index ranged from 1 to 3 and was based on students’ responses to questions about how often they engaged in certain negative behaviors, including arguing with their parents or others, fighting, getting into trouble, or using drugs or alcohol. Higher values of each index indicated that the student engaged in these (positive or negative) behaviors more frequently.
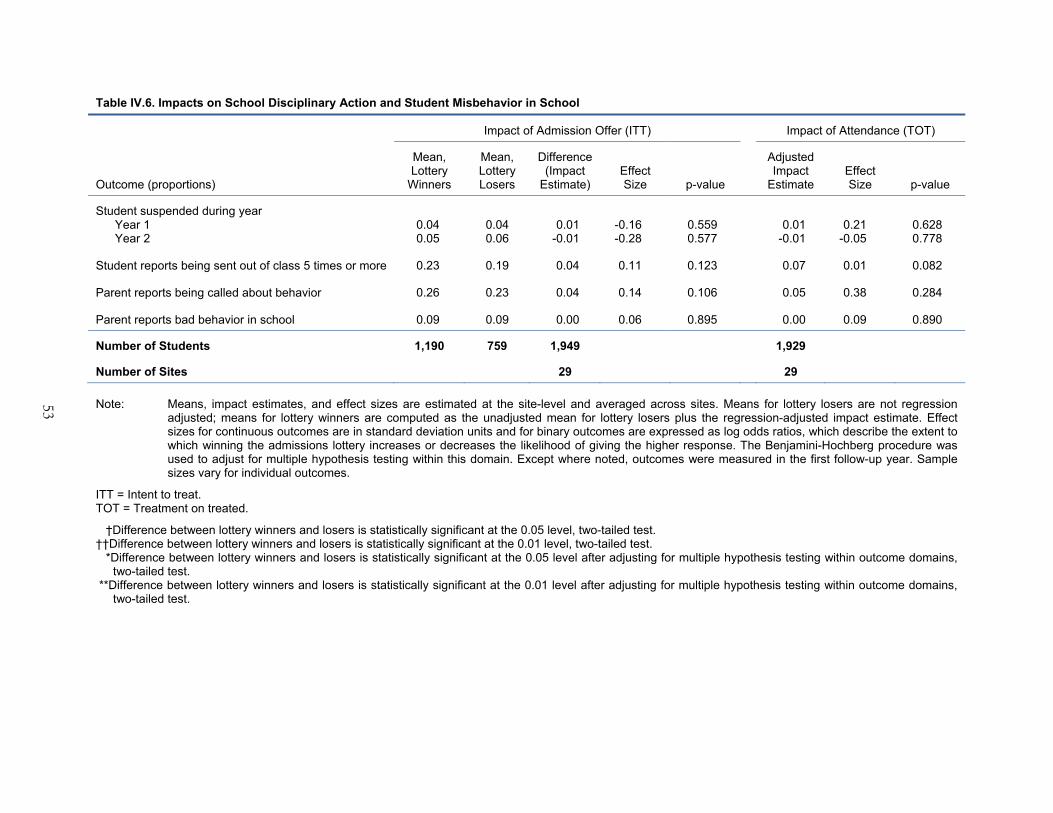
53
Table IV.6. Impacts on School Disciplinary Action and Student Misbehavior in School
Outcome (proportions)
Impact of Admission Offer (ITT) Impact of Attendance (TOT)
Mean, Lottery
Winners
Mean, Lottery Losers
Difference (Impact
Estimate) Effect Size p-value
Adjusted Impact
Estimate Effect Size p-value
Student suspended during year Year 1 0.04 0.04 0.01 -0.16 0.559 0.01 0.21 0.628 Year 2 0.05 0.06 -0.01 -0.28 0.577 -0.01 -0.05 0.778
Student reports being sent out of class 5 times or more 0.23 0.19 0.04 0.11 0.123 0.07 0.01 0.082
Parent reports being called about behavior 0.26 0.23 0.04 0.14 0.106 0.05 0.38 0.284
Parent reports bad behavior in school 0.09 0.09 0.00 0.06 0.895 0.00 0.09 0.890
Number of Students 1,190 759 1,949 1,929
Number of Sites 29 29 Note: Means, impact estimates, and effect sizes are estimated at the site-level and averaged across sites. Means for lottery losers are not regression
adjusted; means for lottery winners are computed as the unadjusted mean for lottery losers plus the regression-adjusted impact estimate. Effect sizes for continuous outcomes are in standard deviation units and for binary outcomes are expressed as log odds ratios, which describe the extent to which winning the admissions lottery increases or decreases the likelihood of giving the higher response. The Benjamini-Hochberg procedure was used to adjust for multiple hypothesis testing within this domain. Except where noted, outcomes were measured in the first follow-up year. Sample sizes vary for individual outcomes.
ITT = Intent to treat. TOT = Treatment on treated.
†Difference between lottery winners and losers is statistically significant at the 0.05 level, two-tailed test. ††Difference between lottery winners and losers is statistically significant at the 0.01 level, two-tailed test. *Difference between lottery winners and losers is statistically significant at the 0.05 level after adjusting for multiple hypothesis testing within outcome domains,
two-tailed test. **Difference between lottery winners and losers is statistically significant at the 0.01 level after adjusting for multiple hypothesis testing within outcome domains,
two-tailed test.

54
Table IV.7. Impacts on Student Behavior Outside of School
Outcome
Impact of Admission Offer (ITT) Impact of Attendance (TOT)
Mean, Lottery
Winners
Mean, Lottery Losers
Difference (Impact
Estimate) Effect Size p-value
Adjusted Impact
Estimate Effect Size p-value
Student reported good behavior index (mean)a 2.27 2.27 0.00 0.01 0.894 0.01 0.03 0.888
Student reported bad behavior index (mean)b 1.18 1.18 0.00 0.03 0.684 -0.01 0.02 0.688
Number of Students 1,190 740 1,930 1,926
Number of Sites 29 29 Note: Means, impact estimates, and effect sizes are estimated at the site-level and averaged across sites. Means for lottery losers are not regression
adjusted; means for lottery winners are computed as the unadjusted mean for lottery losers plus the regression-adjusted impact estimate. Effect sizes for continuous outcomes are in standard deviation units. The Benjamini-Hochberg procedure was used to adjust for multiple hypothesis testing within this domain. Outcomes were measured in the first follow-up year. Sample sizes vary for individual outcomes.
aThe student reported good behavior index is an index based on multiple items from the student survey. It takes on values between 1 and 3, inclusive, with higher values representing more positive behavior. These items include measures of the extent to which students help other students, teachers, and work in their community, as well as whether they read for fun and go to the library. See Appendix C for details. bThe student reported bad behavior index is an index based on multiple items from the parent survey. It takes on values between 1 and 4, inclusive, with higher values representing more negative behavior. These items include measures of whether the student argues, fights, gets into trouble, and uses alcohol and/or drugs. See Appendix C for details.
ITT = Intent to treat. TOT = Treatment on treated.
†Difference between lottery winners and losers is statistically significant at the 0.05 level, two-tailed test. ††Difference between lottery winners and losers is statistically significant at the 0.01 level, two-tailed test. *Difference between lottery winners and losers is statistically significant at the 0.05 level after adjusting for multiple hypothesis testing within outcome domains,
two-tailed test. **Difference between lottery winners and losers is statistically significant at the 0.01 level after adjusting for multiple hypothesis testing within outcome domains,
two-tailed test.

55
E. Satisfaction with and Perceptions of School
Admission to study charter schools positively affected student and parent satisfaction with school. Across all measures of both student and parent satisfaction, charter school impacts were positive and statistically significant after adjusting for multiple hypothesis testing within this domain (Table IV.8). Specifically, admission to a study charter school increased by 12 percentage points the likelihood that a student reported that he or she “like(d) school a lot.” It also improved students’ views of their teachers, according to an index reflecting such views (3.41 for lottery winners versus 3.33 for lottery losers).73 Lottery winners on average gave their schools a higher “grade” than lottery losers (3.42 compared with 3.36—or a high versus low B+) across several dimensions, including classes, the principal, and various school facilities. Lottery winners also expressed more positive feelings toward their schools than did lottery losers, according to an index reflecting such feelings (3.43 compared with 3.30).74
Similarly, admission to a charter school increased by 33 percentage points the likelihood that a student’s parent rated the student’s school as excellent and by 10 percentage points the likelihood that the parent strongly agreed with the statement that the student liked school. Relative to parents of lottery losers, parents of lottery winners were more satisfied with their child’s school, according to an index of parent satisfaction (3.40 versus 3.11), and perceived fewer problems in their child’s school, according to an index of perceived problems (1.28 versus 1.47).75, 76
Evidence suggests that study charter schools influenced students’ and parents’ perceptions of key aspects of the school environment (Table IV.9). Parents of lottery winners reported more frequent calls from the school (0.71) than did parents of lottery losers (0.54), according to an index
73 The student-reported index of teachers ranged from 1 to 4 and was based on student responses (ranging from
“strongly disagree” to “strongly agree”) to six statements about their teachers, including whether teachers were available for help or cared about the students. The average index value of 3.41 for lottery winners suggests that they were somewhat more likely to agree strongly with these statements than were lottery losers, who had an average index value of 3.33.
74 The index of students’ feelings about school ranged from 1 to 4 and was based on student responses (ranging from “strongly disagree” to “strongly agree”) to four statements about school, including whether they were treated fairly or were happy to be at school. The average index value of 3.43 for lottery winners suggests that they were somewhat more likely to agree strongly with these statements than were lottery losers, who had an average index value of 3.30.
75 The parent satisfaction index ranged from 1 to 4 and was based on parent responses (ranging from “very dissatisfied” to “very satisfied”) to questions about 18 aspects of their child’s school, including class size and the quality of instruction. The mean value of 3.40 for parents of lottery winners suggests that they were more likely to report that they were very satisfied with their child’s school than were parents of lottery losers, for whom the mean value of the index was 3.11. The index of parents’ perceptions of problems in their child’s school ranged from 1 to 3 and was based on parent responses (ranging from “not a problem” to “a big problem”) to questions about specific problems in their child’s school, including fighting, bullying, and racial conflict. The mean value of 1.28 for parents of lottery winners suggests that they were more likely to report that these issues were not a problem than were parents of lottery losers, for whom the mean value of the index was 1.47.
76 Some earlier research suggests that parent satisfaction with charter schools may fade over time (Buckley and Schneider 2006). In our study, parent satisfaction measures were collected from a survey administered only once, in the spring of the study’s first follow-up year.

56
Table IV.8. Impacts on Student and Parent Satisfaction with School
Impact of Admission Offer (ITT)
Outcome
Impact of Attendance (TOT)
Mean, Lottery Winners
Mean, Lottery Losers
Difference (Impact
Estimate) Effect Size p-value
Adjusted Impact
Estimate Effect Size p-value
Student’s Satisfaction with School
Student likes school a lot (proportion) 0.75 0.62 0.12 0.52 <0.001 ††** 0.17 0.69 <0.001 ††** Student-reported index of teachers (mean)a 3.42 3.33 0.08 0.22 0.001 ††** 0.10 0.26 0.036 †* Grade student gives to the school (mean)b 3.43 3.37 0.06 0.07 0.041 †* 0.08 0.08 0.114 Index of student’s feelings about school (mean)c 3.45 3.31 0.13 0.29 <0.001 ††** 0.19 0.41 <0.001 ††**
Parent’s Satisfaction with School Parent rates school as excellent (proportion) 0.70 0.37 0.33 0.94 <0.001 ††** 0.48 1.58 <0.001 ††** Parent strongly agrees student likes school (proportion) 0.49 0.39 0.10 0.27 <0.001 ††** 0.16 0.46 0.002 ††** Index of parent’s satisfaction with school (mean)d 3.40 3.11 0.28 0.71 <0.001 ††** 0.43 1.09 <0.001 ††** Index of parent’s perceptions of problems in school (mean)e 1.28 1.46 -0.18 -0.35 <0.001 ††** -0.30 -0.55 <0.001 ††**
Number of Students 1,188 742 1,930 1,926
Number of Sites 29 29 Note: Means, impact estimates, and effect sizes are estimated at the site-level and averaged across sites. Means for lottery losers are not regression adjusted; means for
lottery winners are computed as the unadjusted mean for lottery losers plus the regression-adjusted impact estimate. Effect sizes for continuous outcomes are in standard deviation units and for binary outcomes are expressed as log odds ratios, which describe the extent to which winning the admissions lottery increases or decreases the likelihood of giving the higher response. The Benjamini-Hochberg procedure was used to adjust for multiple hypothesis testing within this domain. Outcomes were measured during the first follow-up year. Sample sizes vary for individual outcomes.
aThe student-reported index of teachers is based on multiple items from the student survey. It takes on values between 1 and 4, inclusive, with higher values representing a higher opinion of the teachers. See Appendix C for details. bThe grade the student gives the school is based on multiple items from the student survey. It takes on values between 0 and 4, inclusive, with higher values representing a better grade. See Appendix C for details. cThe index of student’s feelings about school is based on multiple items from the student survey. It takes on values between 1 and 4, inclusive, with higher values representing more positive feelings. See Appendix C for details. dThe index of parent’s satisfaction with school is based on multiple items from the parent survey. It takes on values between 1 and 4, inclusive, with higher values representing greater satisfaction. See Appendix C for details. eThe index of parent’s perceptions of problems in school is based on multiple items from the parent survey. It takes on values between 1 and 3, inclusive, with higher values representing greater problems. See Appendix C for details.
ITT = Intent to treat. TOT = Treatment on treated.
†Difference between lottery winners and losers is statistically significant at the 0.05 level, two-tailed test. ††Difference between lottery winners and losers is statistically significant at the 0.01 level, two-tailed test. *Difference between lottery winners and losers is statistically significant at the 0.05 level after adjusting for multiple hypothesis testing within outcome domains, two-tailed test. **Difference between lottery winners and losers is statistically significant at the 0.01 level after adjusting for multiple hypothesis testing within outcome domains, two-tailed test.
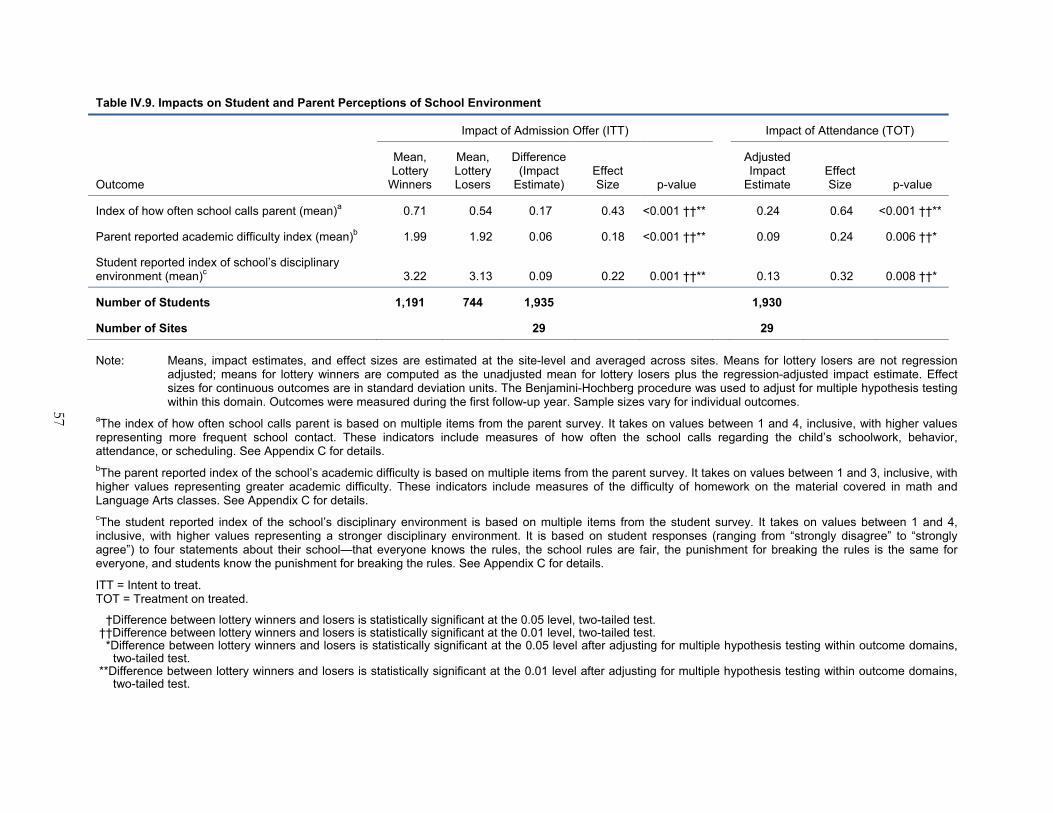
57
Table IV.9. Impacts on Student and Parent Perceptions of School Environment
Outcome
Impact of Admission Offer (ITT) Impact of Attendance (TOT)
Mean, Lottery
Winners
Mean, Lottery Losers
Difference (Impact
Estimate) Effect Size p-value
Adjusted Impact
Estimate Effect Size p-value
Index of how often school calls parent (mean)a 0.71 0.54 0.17 0.43 <0.001 ††** 0.24 0.64 <0.001 ††**
Parent reported academic difficulty index (mean)b 1.99 1.92 0.06 0.18 <0.001 ††** 0.09 0.24 0.006 ††*
Student reported index of school’s disciplinary environment (mean)c 3.22 3.13 0.09 0.22 0.001 ††** 0.13 0.32 0.008 ††*
Number of Students 1,191 744 1,935 1,930
Number of Sites 29 29 Note: Means, impact estimates, and effect sizes are estimated at the site-level and averaged across sites. Means for lottery losers are not regression
adjusted; means for lottery winners are computed as the unadjusted mean for lottery losers plus the regression-adjusted impact estimate. Effect sizes for continuous outcomes are in standard deviation units. The Benjamini-Hochberg procedure was used to adjust for multiple hypothesis testing within this domain. Outcomes were measured during the first follow-up year. Sample sizes vary for individual outcomes.
aThe index of how often school calls parent is based on multiple items from the parent survey. It takes on values between 1 and 4, inclusive, with higher values representing more frequent school contact. These indicators include measures of how often the school calls regarding the child’s schoolwork, behavior, attendance, or scheduling. See Appendix C for details. bThe parent reported index of the school’s academic difficulty is based on multiple items from the parent survey. It takes on values between 1 and 3, inclusive, with higher values representing greater academic difficulty. These indicators include measures of the difficulty of homework on the material covered in math and Language Arts classes. See Appendix C for details. cThe student reported index of the school’s disciplinary environment is based on multiple items from the student survey. It takes on values between 1 and 4, inclusive, with higher values representing a stronger disciplinary environment. It is based on student responses (ranging from “strongly disagree” to “strongly agree”) to four statements about their school—that everyone knows the rules, the school rules are fair, the punishment for breaking the rules is the same for everyone, and students know the punishment for breaking the rules. See Appendix C for details.
ITT = Intent to treat. TOT = Treatment on treated.
†Difference between lottery winners and losers is statistically significant at the 0.05 level, two-tailed test. ††Difference between lottery winners and losers is statistically significant at the 0.01 level, two-tailed test. *Difference between lottery winners and losers is statistically significant at the 0.05 level after adjusting for multiple hypothesis testing within outcome domains,
two-tailed test. **Difference between lottery winners and losers is statistically significant at the 0.01 level after adjusting for multiple hypothesis testing within outcome domains,
two-tailed test.

58
measuring frequency of calls about various topics.77 Parents of lottery winners were more likely to perceive their child’s school as appropriately academically difficult than did parents of lottery losers, according to indexes of these perceptions.78 Finally, charter schools had a significant positive effect on the extent to which students perceived that their school had a strict disciplinary environment (3.23 versus 3.14), according to an index measuring such perceptions.79
F. Parent Involvement
Charter schools had both positive and negative effects on parents’ involvement in their child’s education. Lottery winners and lottery losers had statistically similar mean values on an index measuring active parent involvement in their children’s education (2.79 versus 2.78; Table IV.10).80 Parents of lottery winners offered admission to study charter schools were significantly more likely than parents of lottery losers to volunteer or to attend activities at their child’s school, according to an index measuring parents’ presence in the child’s school (1.89 for lottery winners versus 1.78 for lottery losers).81 However, parents of lottery winners were significantly less likely than parents of lottery losers to be a member of the parent-teacher association (PTA) or similar organization at their child’s school (33 versus 39 percent).
77 The index measuring the frequency of school calls to the parent ranged from 0 to 4 and was based on parent
responses (ranging from “not at all” to “more than 10 times”) to questions about how frequently the school called about various topics related to the student, including schoolwork or behavioral problems. The mean value of 0.71 for parents of lottery winners suggests that the schools were somewhat more likely to call 1 to 3 times than not at all as compared to the mean value of 0.54 for parents of lottery losers.
78 The parent-reported index of the school’s academic difficulty ranged from 1 to 3 and was based on parent responses (ranging from “too easy” to “too difficult”) to questions about the difficulty of the student’s homework or the material covered in mathematics and language arts classes. Higher values indicate greater perceived difficulty. The mean values of the indexes indicate that lottery winners’ parents were more likely than lottery losers’ parents to say that the level of difficulty was about right rather than too easy.
79 The index measuring the school’s disciplinary environment ranged from 1 to 4 and was based on student responses (ranging from “strongly disagree” to “strongly agree”) to four statements about school—that everyone knew the rules, that the rules were fair, that the punishment for breaking the rules was fairly applied, and that students knew the punishment for breaking the rules. Higher values indicate that students were more likely to agree with these statements. The mean value of 3.23 for lottery winners indicates that they were slightly more likely to agree strongly with these statements than were lottery losers, for whom the mean value was 3.14.
80 The index measuring parent involvement in the student’s education ranged from 1 to 4 and was based on parent responses (ranging from “seldom or never” to “almost every day”) to questions about how frequently parents talked with their child about school or helped with homework or reading or mathematics. Higher values indicate that parents engaged in these activities more frequently.
81 The index measuring parents’ presence in the student’s school ranged from 1 to 4 and was based on parent responses (ranging from “seldom or never” to “almost every day”) to questions about how frequently parents attended school activities or volunteered at their child’s school. Higher values indicate that parents engaged in these activities more frequently. The mean value of 1.89 for lottery winners indicates that their parents were more likely to report attending school activities or volunteering at the school once or twice a month or more than were the parents of lottery losers, for whom the mean value was 1.78.

59
Table IV.10. Impacts on Parental Involvement in Student's Education
Outcome
Impact of Admission Offer (ITT) Impact of Attendance (TOT)
Mean, Lottery
Winners
Mean, Lottery Losers
Difference (Impact
Estimate) Effect Size p-value
Adjusted Impact
Estimate Effect Size p-value
Parent involvement in student’s education index (mean)a 2.80 2.79 0.01 0.00 0.741 0.01 -0.01 0.840
Parent presence in student’s school index (mean)b 1.86 1.75 0.11 0.22 0.001 ††** 0.16 0.31 0.009 ††*
Parent is a member of school’s PTA (proportion) 0.33 0.39 -0.06 -0.19 0.010 ††* -0.09 -0.21 0.041 †
Number of Students 1,190 742 1,932 1,928
Number of Sites 29 29
Note: Means, impact estimates, and effect sizes are estimated at the site-level and averaged across sites. Means for lottery losers are not regression
adjusted; means for lottery winners are computed as the unadjusted mean for lottery losers plus the regression-adjusted impact estimate. Effect sizes for continuous outcomes are in standard deviation units and for binary outcomes are expressed as log odds ratios, which describe the extent to which winning the admissions lottery increases or decreases the likelihood of giving the higher response. The Benjamini-Hochberg procedure was used to adjust for multiple hypothesis testing within this domain. Outcomes were measured during the first follow-up year. Sample sizes vary for individual outcomes.
aThe parent involvement in student’s education index is based on multiple items from the parent and student surveys. It takes on values between 1 and 4, inclusive, with higher values representing greater parental involvement. These items include measures of how often the parent talks with the child about school and helps the child with their school work or school activities. See Appendix C for details. bThe parent‘s presence in student’s school index is based on two items from the parent survey. It takes on values between 1 and 4, inclusive, with higher values representing greater parental involvement. These items include measures of the extent to which the parent attends school activities and volunteers at the school. See Appendix C for details.
ITT = Intent to treat. TOT = Treatment on treated. PTA = Parent-teacher association.
†Difference between lottery winners and losers is statistically significant at the 0.05 level, two-tailed test. ††Difference between lottery winners and losers is statistically significant at the 0.01 level, two-tailed test. *Difference between lottery winners and losers is statistically significant at the 0.05 level after adjusting for multiple hypothesis testing within outcome domains,
two-tailed test. **Difference between lottery winners and losers is statistically significant at the 0.01 level after adjusting for multiple hypothesis testing within outcome domains,
two-tailed test.

This page is intentionally left blank.

61
V. EXPLORING THE RELATIONSHIP BETWEEN CHARTER SCHOOL CHARACTERISTICS AND IMPACTS
While study charter schools did not, on average, significantly raise or lower students’ achievement scores according to estimates presented in Chapter IV, individual schools or subsets of schools may have affected student achievement (either positively or negatively). In other words, certain types of study charter schools operating in certain types of environments may have been more successful than others. In this chapter, we explore whether characteristics of study charter schools or the environments in which they operate were related to their impacts on students.
The effectiveness of a given charter school may be influenced by a range of factors, including the three groups of characteristics introduced in Chapter II: (1) measures of the policy environment in which the school operates, (2) dimensions of the charter school’s operations relative to those of other schools in the area, and (3) characteristics of the charter school’s student population. In Table V.1, we provide a list of these factors and how they were measured, along with some descriptive statistics. In measuring the relationship between these factors and schools’ impacts on achievement, we focus students’ reading and mathematics test scores two years after they applied to be admitted to a study charter school, since those reflect the cumulative experiences of students.82
As detailed in Chapter II, we used three approaches to examine the link between study charter school characteristics and achievement impacts:
1. Simple bivariate associations between individual factors and impacts. In the main impact model, we looked at the relationship between each factor and achievement impacts by estimating the bivariate interaction between the factor and treatment status (whether a student was a lottery winner or a lottery loser). In Appendix Table G.2, we list the full set of estimates.
2. Associations between individual factors and impacts while controlling for other factors. We estimated two versions of a multivariate model in which the relationships between the charter school impacts and several charter school characteristics were examined simultaneously. This allowed us to examine whether the simple bivariate association between a given characteristic and charter school impacts persisted once we accounted for other characteristics. With so many characteristics possibly related to impacts—many highly correlated with one another—we included in the multivariate analysis only a subset of these factors, some of which we combined.83 The two versions
82 Although we focus primarily on the year 2 test scores in the text, the appendix tables show estimates covering relationships between the factors and impacts on test scores over both years of the follow-up period. We also examined whether these factors were associated with charter school impacts on a summary measure of student and parent satisfaction with school. The summary measure combined all eight student and parent satisfaction outcomes examined in the impact analysis. See Appendix C for details on its construction and Appendix Table G.4 for estimates of the relationship between charter school characteristics and impacts on student/parent satisfaction.
83 We excluded the following: (1) factors that did not have a statistically significantly bivariate association with impacts on at least one of the year 2 test score outcomes and (2) factors highly correlated with other factors that we decided to include in the model. Several student characteristics were highly correlated with one another—the proportion of study charter school students who were white, the proportion eligible for free or reduced-price meals, baseline reading scores, and baseline mathematics scores all had bivariate correlations with one another that exceeded 0.75 in absolute
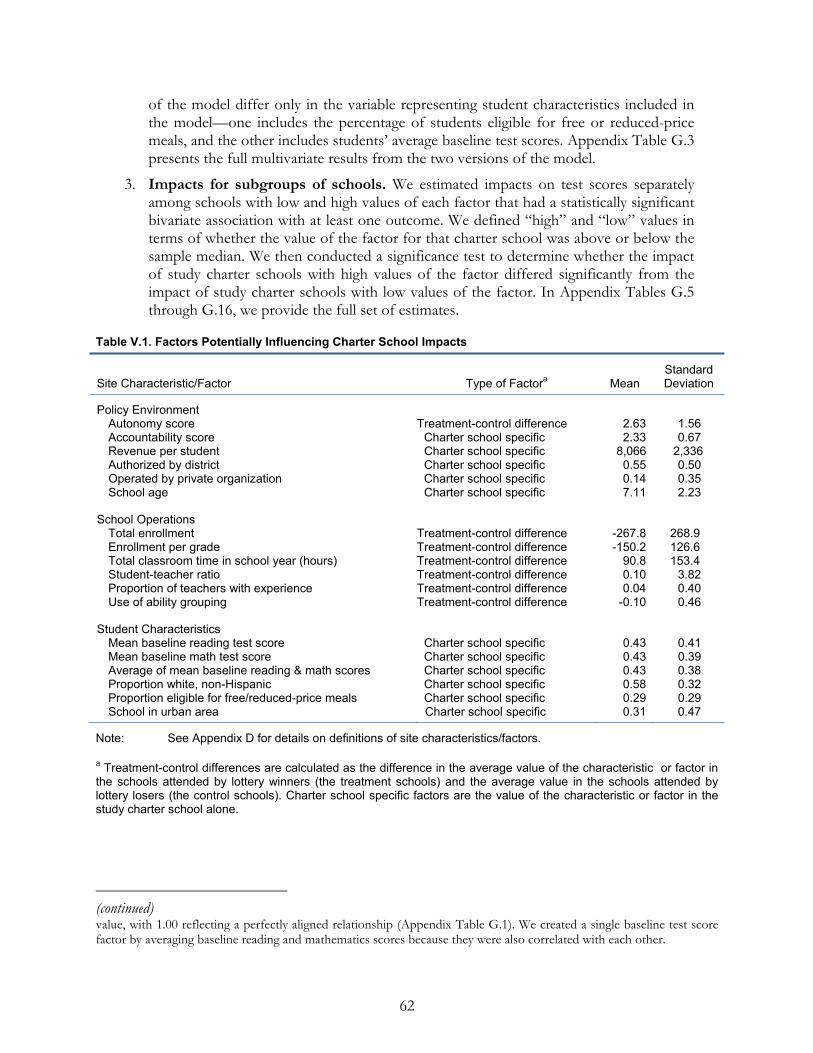
62
of the model differ only in the variable representing student characteristics included in the model—one includes the percentage of students eligible for free or reduced-price meals, and the other includes students’ average baseline test scores. Appendix Table G.3 presents the full multivariate results from the two versions of the model.
3. Impacts for subgroups of schools. We estimated impacts on test scores separately among schools with low and high values of each factor that had a statistically significant bivariate association with at least one outcome. We defined “high” and “low” values in terms of whether the value of the factor for that charter school was above or below the sample median. We then conducted a significance test to determine whether the impact of study charter schools with high values of the factor differed significantly from the impact of study charter schools with low values of the factor. In Appendix Tables G.5 through G.16, we provide the full set of estimates.
Table V.1. Factors Potentially Influencing Charter School Impacts
Site Characteristic/Factor Type of Factora Mean Standard Deviation
Policy Environment Autonomy score Treatment-control difference 2.63 1.56 Accountability score Charter school specific 2.33 0.67 Revenue per student Charter school specific 8,066 2,336 Authorized by district Charter school specific 0.55 0.50 Operated by private organization Charter school specific 0.14 0.35 School age Charter school specific 7.11 2.23
School Operations Total enrollment Treatment-control difference -267.8 268.9 Enrollment per grade Treatment-control difference -150.2 126.6 Total classroom time in school year (hours) Treatment-control difference 90.8 153.4 Student-teacher ratio Treatment-control difference 0.10 3.82 Proportion of teachers with experience Treatment-control difference 0.04 0.40 Use of ability grouping Treatment-control difference -0.10 0.46
Student Characteristics Mean baseline reading test score Charter school specific 0.43 0.41 Mean baseline math test score Charter school specific 0.43 0.39 Average of mean baseline reading & math scores Charter school specific 0.43 0.38 Proportion white, non-Hispanic Charter school specific 0.58 0.32 Proportion eligible for free/reduced-price meals Charter school specific 0.29 0.29 School in urban area Charter school specific 0.31 0.47
Note: See Appendix D for details on definitions of site characteristics/factors.
a Treatment-control differences are calculated as the difference in the average value of the characteristic or factor in the schools attended by lottery winners (the treatment schools) and the average value in the schools attended by lottery losers (the control schools). Charter school specific factors are the value of the characteristic or factor in the study charter school alone.
(continued) value, with 1.00 reflecting a perfectly aligned relationship (Appendix Table G.1). We created a single baseline test score factor by averaging baseline reading and mathematics scores because they were also correlated with each other.

63
Each of the three methods has strengths and limitations.84 We place the greatest confidence in findings that are consistent across all three analyses (strong support for the hypothesis of a relationship), including the multivariate analysis. We have less confidence in findings demonstrated by only one or two of the analyses, particularly if the multivariate analysis does not show a significant relationship (weak support for the hypothesis). Thus, only when a particular characteristic is significantly related to impacts both before and after accounting for other charter school characteristics do we conclude that we have strong evidence for the relationship. Regardless of the consistency of the findings, our investigation is exploratory in that none of the methods allows us to draw firm conclusions about what makes some charter schools more successful than others in improving student achievement. Other factors we have not examined but that are associated in some way with factors we have examined may explain the relationships identified in the analyses. Similarly, given that we are estimating impacts for multiple outcomes and subgroups without formally adjusting for multiple hypothesis testing (because of the exploratory nature of the analysis), we may find some statistically significant relationships that are the result of chance. Therefore, the results of our analysis can suggest several hypotheses for further, more rigorous testing but cannot provide conclusive answers to questions about the reasons for particular charter schools’ effectiveness.
A. Do Charter School Impacts Vary?
If all study charter schools had similar impacts on important outcomes, analyses of the relationship between school characteristics and impacts would not be fruitful. So we first examined whether there was meaningful variation in study charter schools’ impacts on student achievement.
In Figure V.1, we present the distribution of estimated impacts on Year 2 reading and mathematics scores across study charter school sites, arranged by magnitude of impact. The figure shows substantial variation in the impacts. Impacts on Year 2 reading z-scores ranged from -0.43 to +0.33, with a standard deviation of 0.24. Four estimated impacts were statistically significant and negative, with the remainder not significantly different from zero. Impacts on Year 2 mathematics z-scores ranged from -0.78 to +0.65, with a standard deviation of 0.36. Ten of the site-level estimated impacts were statistically significant, including seven negative and three positive impacts, with the remainder not significant. While we would expect some variation in impact estimates across sites due to chance—the estimates are based on randomly determined student samples of lottery winners and losers in each site—the observed variation is much larger than would be expected because of chance alone. A statistical test confirms that study charter schools’ impacts do vary significantly across sites.85
84 For example, the simple bivariate correlations allow us to investigate each factor individually. With many factors
inter-related, however, we cannot tell from the simple correlations which factors are most likely to drive the results. The multiple-factor, multivariate analysis helps narrow down the candidates, but, with impact estimates for fewer than 30 sites, we cannot include a large number of site-level factors in the multivariate analysis, and important factors explaining study charter school impacts may be omitted. In addition, high correlations between some factors may prevent our models from yielding valid results for individual factors. Finally, impacts for study charter schools with a given characteristic provide unbiased estimates of impacts for particular subgroups of schools. As with the simple bivariate and multivariate correlations, however, differences between impacts for one subgroup of schools versus another may be spurious.
85 A Q-test conducted to test for the homogeneity of impacts (Lipsey and Wilson 2001) strongly rejected the null hypothesis that study charter school impact is constant across sites (p-value<0.001 for both Year 2 test score outcomes).
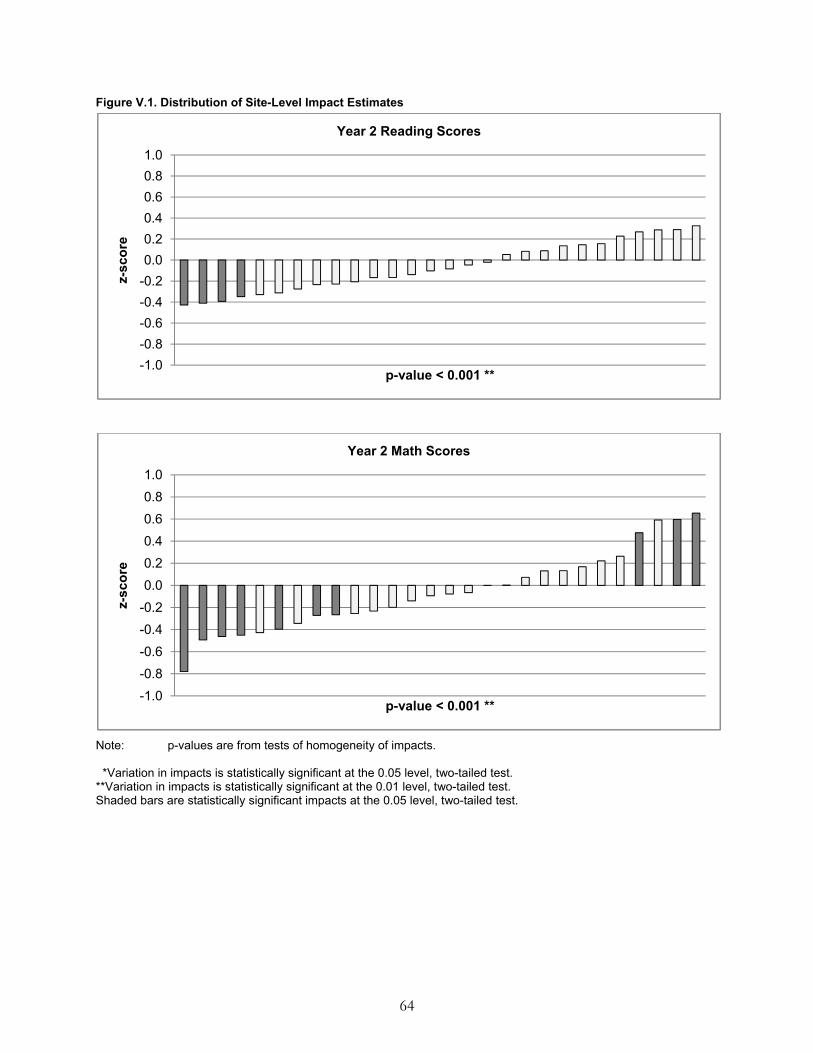
Figure V.1. Distribution of Site-Level Impact Estimates
-1.0-0.8-0.6-0.4-0.20.00.20.40.60.81.0
z-sc
ore
p-value < 0.001 **
Year 2 Reading Scores
-1.0-0.8-0.6-0.4-0.20.00.20.40.60.81.0
z-sc
ore
p-value < 0.001 **
Year 2 Math Scores
Note: p-values are from tests of homogeneity of impacts. *Variation in impacts is statistically significant at the 0.05 level, two-tailed test. **Variation in impacts is statistically significant at the 0.01 level, two-tailed test. Shaded bars are statistically significant impacts at the 0.05 level, two-tailed test.
64

65
B. What Charter School Policies and Practices Are Related to Impacts?
In Table V.2, we summarize the results of the three analyses examining relationships between the characteristics of study charter schools and school impacts on Year 2 reading and mathematics achievement. The table indicates whether the estimated relationship was positive and significant (Positive), negative and significant (Negative), or not statistically significant (NS) and highlights cases in which all three analyses show evidence of a significant relationship between the characteristic and impacts. As described above, we included a characteristic in the subgroup analysis and multivariate analysis only if it had a statistically significant relationship with impacts on either Year 2 reading or mathematics scores.
The three analyses provided strong evidence that variation across study charter schools in achievement impacts in mathematics was associated with four school characteristics—total enrollment, use of ability grouping, average baseline reading and math scores, and percent of students eligible for free or reduced price meals. We found no strong evidence of a significant relationship between school characteristics and impacts on reading achievement. However, we found weak evidence of a relationship between several other school characteristics and charter school impacts—these characteristics were significantly related to study charter school impacts (on Year 2 reading and/or mathematics scores) in one or two of the analyses but not in all three.
• The policy factors of interest did not appear to be associated with impacts on student test scores, with the possible exception of revenue per student.
We found little evidence that the policy environment in which study charter schools operated was related to the schools’ impacts on achievement. We observed no statistically significant relationship between impacts on Year 2 reading or mathematics scores and our indexes of autonomy or accountability, type of authorizer, whether the charter school was operated by a private organization, or the school’s age (for example, p-values for bivariate associations ranged from 0.115 to 0.838; see Appendix Table G.2).
In the case of study charter schools’ financial resources, we find weak evidence of a relationship with charter school impacts on mathematics achievement. As indicated in Table V.2, there was a positive and statistically significant association when revenues were examined without accounting for other charter school characteristics (coefficient of 0.040 and p-value = 0.034), suggesting that study schools with higher revenue per student had more positive (or less negative) effects on mathematics scores in Year 2. The bivariate association of revenue per student and Year 2 impacts on reading was also positive but smaller (coefficient of 0.028, with a p-value of 0.056, just above the threshold for statistical significance). In addition, differences in impacts for subgroups of study charter schools with high versus low per student revenues were statistically significant for mathematics but not reading achievement (Figure V.2). However, this relationship did not persist in the multivariate models, once we controlled for characteristics of charter schools and their students, indicating that factors other than revenue per student were likely driving the differences in impacts among study charter schools. As another reason for caution, revenue per student was based on a

66
Table V.2. Summary of Estimated Relationships Between Site Characteristics and Charter School Impacts Based on Bivariate Associations, Multivariate Regressions, and Subgroup Analysis
Statistical Significant of Relationship Between Characteristic and Charter School Impact
Year 2 Reading Score Year 2 Math Score
Site Characteristic/Factor
Bivariate Association
Multivariate Regressiona
Subgroup Analysisb
Bivariate Association
Multivariate Regressiona
Subgroup Analysisb
Policy Environment
Autonomy score NS NS Accountability score NS NS Revenue per student
NS NS NS Positive NS Positive
Authorized by district NS NS Operated by private organization NS NS School age
NS NS
School Operations
Total enrollment Negative NS NS Negative Negativec Negative Enrollment per grade NS NS Total hours in school year
Positive NS NS Positive NS NS
Student teacher ratio Positive Positive NS NS NS NS Proportion of teachers with experience NS NS Use of ability grouping NS NS NS Positive Positive Positive
Student and School Characteristics
Average mean baseline reading/math score Negative NS Negative Negative Negative Negative % white, non-Hispanic Negative n/a NS Negative n/a NS % eligible for free/reduced-price meals Positive NS NS Positive Positive Positive School in urban area NS NS NS Positive NS Positive
Note: The full results of each of these analyses are presented in Appendix G. See Table G.2 for the bivariate analysis, Table G.3 for the multivariate regression results, and Tables G.5 through G.16 from the subgroup analysis results. a The multivariate regression included only those site characteristics for which there was a statistically significant bivariate association with impacts on either Year 2 reading scores or Year 2 math scores. Site characteristics for which there is no entry in the above table were not included in the analysis. Because of the high degree of correlation between mean baseline test scores, the % white, non-Hispanic, and the % eligible for free/reduced-price meals, we did not include each of these three characteristics in the same multivariate regression. We focused on the mean baseline test score and % eligible for free/reduced-price meals because of their greater policy relevance, and estimated separate multivariate regression for each. b The subgroup analysis was conducted only for those site characteristics for which there was a statistically significant bivariate association with impacts on either Year 2 reading scores or Year 2 math scores. Site characteristics for which there is no entry were not included in the analysis. c The coefficient on enrollment in the multivariate regression analysis was negative and statistically significant in the model that included the average mean baseline reading/math score and was negative but not statistically significant in the model that included the % eligible for free/reduced-price meals.
n/a: Not applicable: We did not include % white, non-Hispanic in the multivariate analysis despite the fact that it was significant in the bivariate analysis because of its high correlation with both the % eligible for free/reduced-price meals and average baseline reading and math scores.

measure reported by the principals of charter schools, and thus subject to some error, and we were unable to obtain a comparable measure for traditional public schools.86
• Total enrollment in study charter schools was negatively related to impacts on achievement.
We examined how study charter schools’ impacts varied by school size, measured as the difference in student enrollment between the charter schools and the control schools. In all but two sites, lottery winners (most of whom attended study charter schools) attended schools with lower average enrollment than the schools attended by lottery losers. Sites with lower-than-average enrollment (low enrollment sites) were those with study charter school enrollment considerably lower than enrollment at control schools, while higher-than-average enrollment (high enrollment) sites were those with similar charter and control school enrollments.
At low-enrollment sites, mean enrollment at the schools attended by lottery winners was less than half of that at schools attended by lottery losers—355 versus 826 students (Figure V.3), a difference that was statistically significant. At high enrollment sites, by contrast, mean enrollment at schools attended by lottery winners was not significantly lower than that at schools attended by lottery losers—519 versus 610 students.
Figure V.2. Impacts on Year 2 Test Scores, by Charter School Revenues
-0.01
0.07
-0.09†-0.12†
-0.2
-0.1
0
0.1
0.2
Reading Math#
High Revenues
Low Revenues
Estimated Impact
†Impact estimate is statistically significant at the 0.05 level. ††Impact estimate is statistically significant at the 0.01 level. #Difference between estimates in two sets of sites is statistically significant at the 0.05 level. ##Difference between estimates in two sets of sites is statistically significant at the 0.01 level.
67
86 Traditional public schools do not receive all resources in cash; many services are provided through in-kind
allocations from the district. Asking non-charter principals to report revenues would likely yield inaccurate revenue estimates. Charter schools may or may not receive in-kind allocations from districts or other entities.
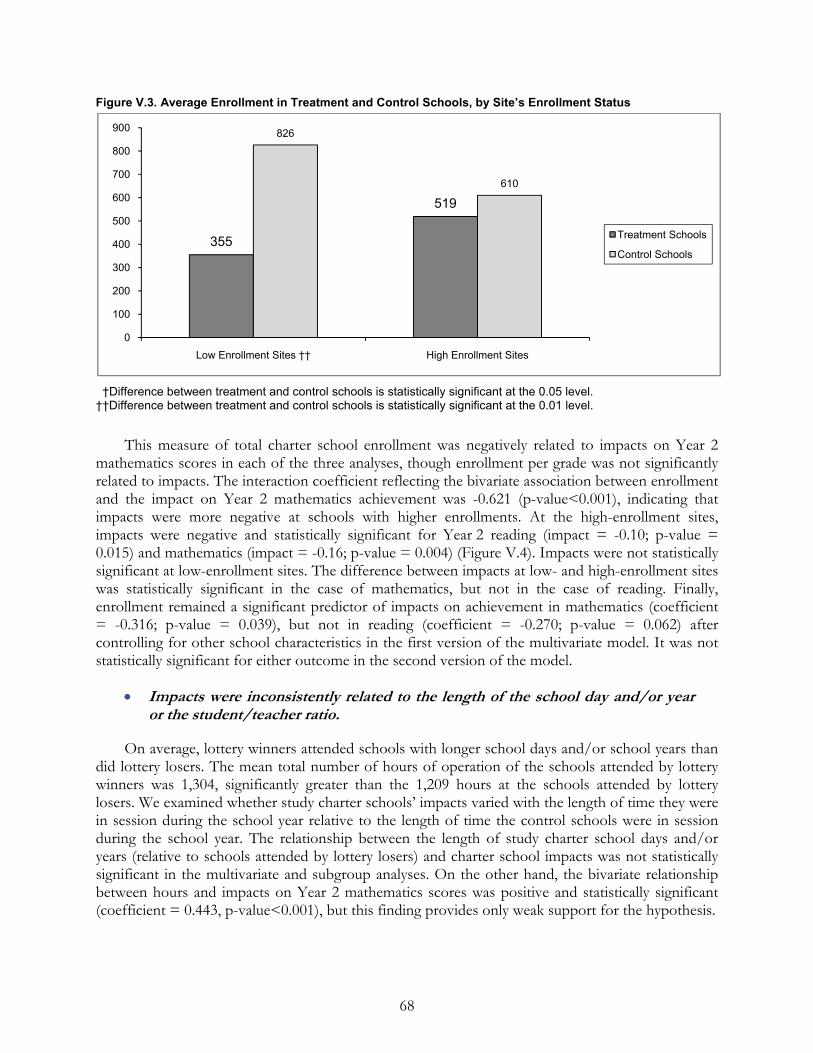
Figure V.3. Average Enrollment in Treatment and Control Schools, by Site’s Enrollment Status
355
519
826
610
0
100
200
300
400
500
600
700
800
900
Low Enrollment Sites †† High Enrollment Sites
Treatment Schools
Control Schools
†Difference between treatment and control schools is statistically significant at the 0.05 level. ††Difference between treatment and control schools is statistically significant at the 0.01 level.
This measure of total charter school enrollment was negatively related to impacts on Year 2 mathematics scores in each of the three analyses, though enrollment per grade was not significantly related to impacts. The interaction coefficient reflecting the bivariate association between enrollment and the impact on Year 2 mathematics achievement was -0.621 (p-value<0.001), indicating that impacts were more negative at schools with higher enrollments. At the high-enrollment sites, impacts were negative and statistically significant for Year 2 reading (impact = -0.10; p-value = 0.015) and mathematics (impact = -0.16; p-value = 0.004) (Figure V.4). Impacts were not statistically significant at low-enrollment sites. The difference between impacts at low- and high-enrollment sites was statistically significant in the case of mathematics, but not in the case of reading. Finally, enrollment remained a significant predictor of impacts on achievement in mathematics (coefficient = -0.316; p-value = 0.039), but not in reading (coefficient = -0.270; p-value = 0.062) after controlling for other school characteristics in the first version of the multivariate model. It was not statistically significant for either outcome in the second version of the model.
• Impacts were inconsistently related to the length of the school day and/or year or the student/teacher ratio.
On average, lottery winners attended schools with longer school days and/or school years than did lottery losers. The mean total number of hours of operation of the schools attended by lottery winners was 1,304, significantly greater than the 1,209 hours at the schools attended by lottery losers. We examined whether study charter schools’ impacts varied with the length of time they were in session during the school year relative to the length of time the control schools were in session during the school year. The relationship between the length of study charter school days and/or years (relative to schools attended by lottery losers) and charter school impacts was not statistically significant in the multivariate and subgroup analyses. On the other hand, the bivariate relationship between hours and impacts on Year 2 mathematics scores was positive and statistically significant (coefficient = 0.443, p-value<0.001), but this finding provides only weak support for the hypothesis.
68

Figure V.4. Impacts on Year 2 Test Scores, by School Enrollment
-0.10†
-0.16††
-0.01
0.09
-0.2
-0.1
0
0.1
0.2
Reading Math##
High Enrollment Sites
Low Enrollment Sites
Estimated Impact
†Impact estimate is statistically significant at the 0.05 level. ††Impact estimate is statistically significant at the 0.01 level. #Difference between estimates in two sets of sites is statistically significant at the 0.05 level. ##Difference between estimates in two sets of sites is statistically significant at the 0.01 level.
The evidence that the student/teacher ratio was related to study charter school achievement impacts was somewhat stronger. The student/teacher ratio was positively and significantly related to impacts on Year 2 reading scores based on both the bivariate and multivariate analyses. However, estimated impacts for study charter schools with low values of the student/teacher ratio did not differ significantly from estimated impacts for those with high values of the student/teacher ratio. None of the three analyses yielded a statistically significant relationship between the student/teacher ratio and impacts on Year 2 mathematics scores.
• Study charter schools’ impacts were not related to a measure of the level of teacher experience.
The proportion of study charter school teachers with substantial experience, relative to teachers in schools attended by lottery losers, was not related to impacts on Year 2 reading or mathematics scores. There was no significant relationship in any of the three analyses (Table V.2).
• Impacts on mathematics (but not reading) were positively related to study charter schools’ use of ability grouping.
In all three analyses, a study charter school’s use of ability grouping, relative to control schools, was positively and significantly related to impacts on Year 2 mathematics scores. This suggests that relatively greater use of ability grouping by charter schools is associated with more positive impacts or, conversely, that less use of ability grouping by charter schools relative to control schools is associated with more negative impacts. We found the latter to be the case in study schools. In study charter schools more likely to use ability grouping, impacts were not statistically significant (Figure V.5). In those less likely to use ability grouping, impacts were negative and significant—the impact for reading was -0.08 (p-value = 0.031), and the impact for mathematics was -0.13 (p-value = 0.022). In the case of mathematics, the difference between the two groups of sites was also statistically significant (p-value of difference = 0.028). We did not find a significant relationship between use of ability grouping and reading achievement impacts in any of the three analyses.
69

Figure V.5. Impacts on Year 2 Test Scores, by Use of Ability Grouping
-0.03
0.05
-0.08†
-0.13†
-0.2
-0.1
0.0
0.1
0.2
Reading Math##
More Use of Ability Grouping
Less Use of Ability Grouping
Estimated Impact
†Impact estimate is statistically significant at the 0.05 level. ††Impact estimate is statistically significant at the 0.01 level. #Difference between estimates in two sets of sites is statistically significant at the 0.05 level. ##Difference between estimates in two sets of sites is statistically significant at the 0.01 level. C. How Are the Characteristics of Study Charter Schools’ Student Populations
Related to Impacts?
In addition to charter schools’ policy environment and operations, we examined how the characteristics of study charter schools’ student populations were related to impacts on achievement. In other words, we examined whether charter schools serving certain types of students tended to be more (or less) successful than charter schools serving other types of students. The characteristics of the students in study charter schools turned out to be highly associated with schools’ impacts.
• Impacts on mathematics achievement were positively related to the proportion of study charter schools’ students who were economically disadvantaged.
Study charter schools had significantly less negative/more positive impacts on students’ Year 2 mathematics achievement if they served a greater proportion of economically disadvantaged students. In all three analyses, the percentage eligible for free or reduced-price meals in a study charter school was positively and significantly related to impacts on mathematics scores. In study charter schools that served more economically disadvantaged students (that is, schools in which the percentage eligible for free or reduced-price meals was above the sample median), the estimated impact on Year 2 mathematics scores was positive and significant (impact = 0.18; p-value = 0.002) (Figure V.6); there was no significant impact on Year 2 reading scores. Study charter schools serving fewer disadvantaged students, by contrast, had negative and significant impacts on both reading (impact = -0.11; p-value = 0.010) and mathematics (impact = -0.24; p-value<0.001).87
70
87 Difference in impacts between sites serving more versus fewer disadvantaged students was statistically significant in the case of mathematics (p-value<0.001), but not in the case of reading (p-value = 0.079). Further, the relationship between the percentage eligible for free or reduced-price meals and impacts on test scores in the multivariate analysis (that is, when other site-level factors were accounted for) was statistically significant in the case of mathematics, but not

Figure V.6. Impacts on Year 2 Test Scores, by Percentage Eligible for Free or Reduced-Price Meals in Site
0.00
0.18++
-0.11†
-0.24††-0.3-0.2-0.10.00.10.20.3
Reading Math##
Sites Serving More Economically Disadvantaged Students
Sites Serving Fewer Economically Disadvantaged Students
Estimated Impact
†Impact estimate is statistically significant at the 0.05 level. ††Impact estimate is statistically significant at the 0.01 level. #Difference between estimates in two sets of sites is statistically significant at the 0.05 level. ##Difference between estimates in two sets of sites is statistically significant at the 0.01 level.
Differences in the proportion of disadvantaged students across these two groups of schools were substantial. In study charter schools classified as serving a more advantaged student population, few (9 percent) students were eligible for free or reduced-price meals (Figure V.7). In study charter schools serving disadvantaged students, well over half (55 percent) of students were eligible for free or reduced-price meals.
Figure V.7. Mean Percentage Eligible for Free or Reduced-Price School Meals at Sites Serving More Versus Fewer Disadvantaged Students
0.55
0.09
0.0
0.1
0.2
0.3
0.4
0.5
0.6
Sites Serving More Disadvantaged Students
Sites Serving Fewer Disadvantaged Students
71
(continued) in the case or reading. Thus, the evidence of a relationship between level of economic disadvantage of the student population and impacts on achievement was stronger in the case of mathematics than in the case of reading.
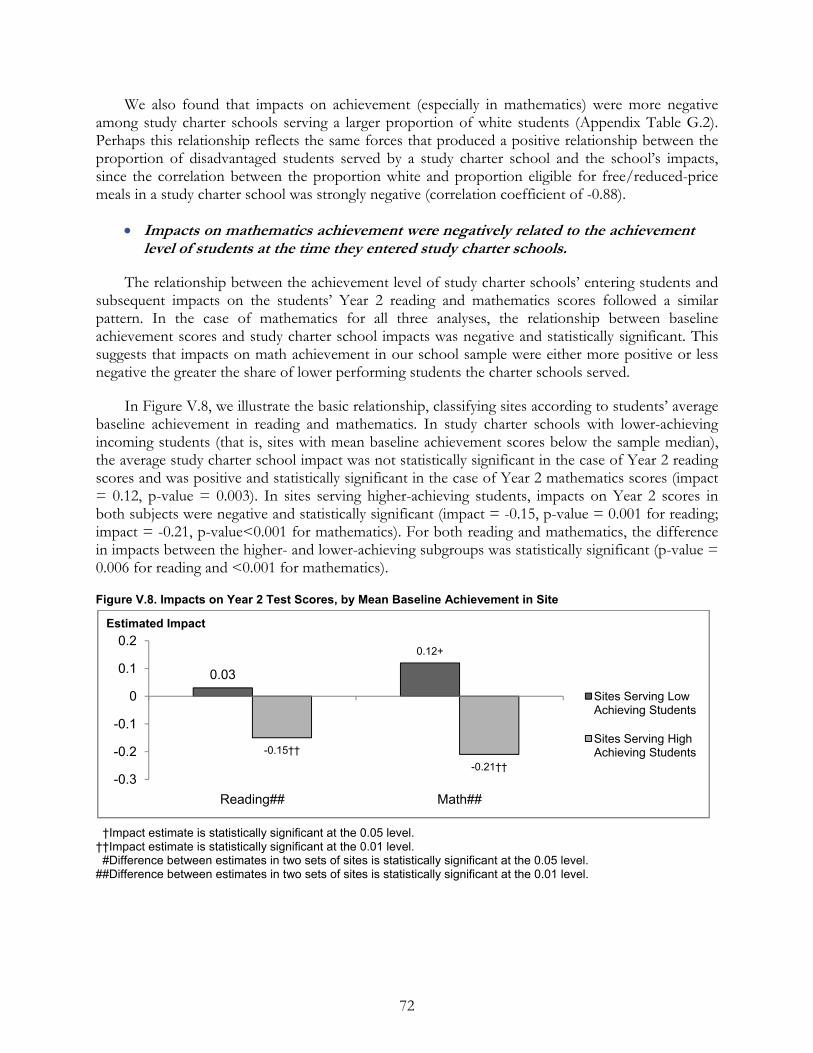
We also found that impacts on achievement (especially in mathematics) were more negative among study charter schools serving a larger proportion of white students (Appendix Table G.2). Perhaps this relationship reflects the same forces that produced a positive relationship between the proportion of disadvantaged students served by a study charter school and the school’s impacts, since the correlation between the proportion white and proportion eligible for free/reduced-price meals in a study charter school was strongly negative (correlation coefficient of -0.88).
• Impacts on mathematics achievement were negatively related to the achievement level of students at the time they entered study charter schools.
The relationship between the achievement level of study charter schools’ entering students and subsequent impacts on the students’ Year 2 reading and mathematics scores followed a similar pattern. In the case of mathematics for all three analyses, the relationship between baseline achievement scores and study charter school impacts was negative and statistically significant. This suggests that impacts on math achievement in our school sample were either more positive or less negative the greater the share of lower performing students the charter schools served.
In Figure V.8, we illustrate the basic relationship, classifying sites according to students’ average baseline achievement in reading and mathematics. In study charter schools with lower-achieving incoming students (that is, sites with mean baseline achievement scores below the sample median), the average study charter school impact was not statistically significant in the case of Year 2 reading scores and was positive and statistically significant in the case of Year 2 mathematics scores (impact = 0.12, p-value = 0.003). In sites serving higher-achieving students, impacts on Year 2 scores in both subjects were negative and statistically significant (impact = -0.15, p-value = 0.001 for reading; impact = -0.21, p-value<0.001 for mathematics). For both reading and mathematics, the difference in impacts between the higher- and lower-achieving subgroups was statistically significant (p-value = 0.006 for reading and <0.001 for mathematics).
Figure V.8. Impacts on Year 2 Test Scores, by Mean Baseline Achievement in Site
72
0.03
0.12+
-0.15††-0.21††
-0.3
-0.2
-0.1
0
0.1
0.2
Reading## Math##
Sites Serving Low Achieving Students
Sites Serving High Achieving Students
Estimated Impact
†Impact estimate is statistically significant at the 0.05 level. ††Impact estimate is statistically significant at the 0.01 level. #Difference between estimates in two sets of sites is statistically significant at the 0.05 level. ##Difference between estimates in two sets of sites is statistically significant at the 0.01 level.

• Impacts on achievement were less negative/more positive for study charter schools in large urban areas, but other school characteristics could explain the relationship.
While urbanicity is not a student characteristic, we examined whether impacts differed for study charter schools located in large urban areas versus outside such areas. We included urbanicity in our analysis because previous lottery-based charter school studies have focused largely on charter schools in large urban areas (Chapter VI).
We found a positive and significant bivariate relationship between urbanicity and study charter schools’ impacts on Year 2 mathematics scores, as most easily seen in the subgroup analysis (Figure V.9). The estimated impact of study charter schools in large urban areas on Year 2 mathematics scores was positive and statistically significant (impact = 0.16; p-value = 0.033) while the impact of those outside large urban areas was negative and statistically significant (impact = -0.14; p-value = 0.003). The difference in impacts between the urban and nonurban subgroups was also statistically significant (p-value = 0.001). The bivariate relationship between urbanicity and study charter school impacts on Year 2 reading scores was not statistically significant.
However, it does not appear that a study charter school’s urban location drives the above pattern of impacts. When we control for student characteristics, school operations, and revenue per student, the relationship between urbanicity and impacts on Year 2 mathematics scores was no longer statistically significant. Instead, some aspect of urban charter schools or their students may explain why study charter schools in large urban areas had less negative/more positive impacts than other study charter schools.
Figure V.9. Impacts on Year 2 Test Scores, by Urbanicity
73
-0.02
0.16†
-0.08†-0.14††
-0.3
-0.2
-0.1
0
0.1
0.2
Reading Math##
Sites in Large Urban Areas
Sites Outside of Large Urban Areas
Estimated Impact
†Impact estimate is statistically significant at the 0.05 level. ††Impact estimate is statistically significant at the 0.01 level. #Difference between estimates in two sets of sites is statistically significant at the 0.05 level. ##Difference between estimates in two sets of sites is statistically significant at the 0.01 level.

74
D. Exploratory Investigation of Why Certain Study Charter Schools Had More Positive or Negative Impacts
The design of this study did not allow us to definitively address the issue of why urban charter schools, schools serving more disadvantaged students, and schools serving lower-achieving students in our study had more positive or less negative impacts on students’ math scores than non-urban charter schools, those serving more advantaged students, and those serving higher-achieving students. In a very exploratory set of analyses, we investigated several hypotheses that might explain the relationship using data available from the study.
• Are there differential peer effects for students who were economically or educationally advantaged versus disadvantaged?
• Do charter schools serving different populations of students enact different types of policies that have different effects on students?
• Do differences in the counterfactual condition—the schools that lottery losers have the opportunity to attend—explain differences in charter school impacts?
None of the exploratory analyses provided strong support for these hypotheses. See Appendix G for more detail.

75
VI. CONTRIBUTION OF STUDY FINDINGS TO THE RESEARCH LITERATURE ON CHARTER SCHOOL ACHIEVEMENT IMPACTS
The current evaluation is one of a growing number of studies examining the impacts of charter schools on student achievement (see, for example, several recent literature reviews such as Gill et al. 2007; Betts and Tang 2008; Bifulco and Bulkley 2008; National Alliance for Public Charter Schools 2009). These studies used different analytic approaches, studied charter schools in different states, and arrived at different findings. In this chapter, we describe the recent research literature and place the methods and findings from our evaluation into the context of other studies.
A. What Do We Know from Other Studies?
Over the last decade, the studies on charter school impacts have used a variety of methodological approaches. The strongest designs, according to a recently published report from a panel convened to study charter school research, have been characterized by two main methods for assessing effects:88
1. Student fixed-effects or value-added approach (non-experimental). This method identifies students who attended both traditional public schools and charter schools over the span of several years. It compares growth in students’ test scores in the years in which they attended traditional public schools with growth in the years in which they attended charter schools. Any change in achievement trajectory between the years the students were in a traditional public school versus the years they were in a charter school is attributed to attendance at the charter school.
2. Lottery-based approach (experimental). This method relies on admission lotteries in charter schools that are oversubscribed—that is, schools that have more applicants than available seats and thus must hold a lottery to determine who is admitted. It compares the outcomes of lottery winners and lottery losers. Given that the lottery produces statistically similar groups of winners and losers before entry into the school, differences in outcomes can be reliably attributed to a charter school impact.
One advantage of non-experimental studies is that they are not limited by whether and where lotteries are held and therefore may be used to examine more representative sets of charter schools within broader geographic areas. However, despite the use of sophisticated statistical models, studies using non-experimental methods may not successfully eliminate what researchers call selection bias. Students and families who choose (“select”) to attend charter schools may differ—in ways often unobserved and unmeasured (such as motivation or persistence)—from students and families who could have applied to a charter school(s) but did not do so. Selection bias raises questions about whether differences in the outcomes of students in charter schools versus traditional public schools reflect only the impact of the charter schools or some combination of that impact and pre-existing differences in the students themselves.89
88 For more information on the rigorous methods for examining charter school impacts, see report from the Charter School Achievement Consensus Panel (2006) (sponsored by the National Charter School Research Project).
89 See Hoxby, Murarka, and Kang (2009) for a critique of the non-experimental, fixed-effects/value-added approach for estimating charter school impacts. In addition, Ballou et al. (2008) presented evidence that non-

76
In contrast, in well-implemented experimental (lottery-based) studies, selection bias is not a concern. Researchers compare outcomes for two groups that were statistically similar (in both observed and unobserved ways) when they applied to a charter school, and random chance rather than self-selection determined whether they did or did not enroll in the charter school. Experimental studies, however, may be conducted only where admission lotteries are held and researchers are able to obtain valid lottery results that they can use with confidence. Lottery and waiting list procedures in charter schools are often complex, and schools do not always document the rules governing every admission decision. Thus, some researchers have raised concerns about lottery-based studies that rely solely on the lottery documentation provided by schools, without study teams independently observing and documenting the lotteries (McEwan and Olsen 2010). In addition, because of their reliance on lotteries, many experimental studies have been limited to small geographic areas, such as a set of charter schools in a single urban district. They are therefore not representative of charter schools in general or of those in other settings.
Because both experimental and non-experimental approaches have strengths and limitations, some researchers have called for viewing the effects of charter schools across the totality of the evidence instead of basing policy judgments on any single study (Charter School Achievement Consensus Panel 2006). To further that approach, we have assembled information on studies of charter school impacts that used either of the two methods described above, with reports published in the past decade (Table VI.1).90 We identified studies using one of the methods by examining those reviewed in recent literature reviews (National Charter School Achievement Consensus Panel 2006; Gill et al. 2007; Betts and Tang 2008; Bifulco and Bulkley 2008; National Alliance for Public Charter Schools 2009).91 Overall, the conclusions of these reviews is that charter schools have varying effects on student achievement.92
(continued) experimental charter school impact estimates can vary dramatically depending on the details of the non-experimental methodology employed.
90 The methodological approach used by the CREDO (2009) evaluation did not follow the same fixed-effects approach used by the other non-experimental studies. Instead, CREDO (2009) used a matching procedure to compare the year-to-year growth in test scores among a sample of charter school students (who may have never attended a traditional public school) with the growth in test scores among a comparison sample of students in traditional public schools. We included CREDO in our discussion for two reasons; first, it covers a larger and broader set of charter schools than any other study, and, second, the What Works Clearinghouse (WWC) recently rated the study as “consistent with WWC evidence standards with reservations,” the highest rating possible for a study based on a non-experimental design. See Hoxby (2009) for a critique.
91 The review of the studies in this chapter was not based on a full, systematic review of the literature, which was beyond the scope of the evaluation. In addition, in several instances, research cited in one or more of the literature reviews involved several studies that presented the results of the same or very similar analysis of the same or very similar data. When several versions of the same basic analysis were conducted, we cite only one of the studies here.
92 Bifulco and Bulkley (2008) examined 8 studies that used individual-level longitudinal data to measure charter school impacts in five states. They found that charter elementary schools had mixed effects—sometimes positive, sometimes negative—on both reading and mathematics test scores. For grades 4 through 8, however, they concluded that charter schools had negative effects in both reading and mathematics. Betts and Tang (2008) found evidence that “charter schools appear quite frequently to outperform traditional public schools” in reading at the elementary school level and in mathematics at the middle school level. They found that charter high schools often underperform traditional public schools in reading and mathematics. Gill et al. (2007) focused on 14 studies that used longitudinal data. Across all the studies, the effects of charter schools in their first year seemed to be the most negative; the longer a charter school operated, the more likely it was to affect student performance positively.

77
When we examine individual studies included in the reviews and separate them by methodology, we find a more nuanced picture. Evidence from the non-experimental studies of charter schools’ impacts on student achievement is, indeed, mixed. Five of 13 studies found negative and significant effects of charter schools on student achievement. Of the remainder, 3 found positive and significant effects, 1 found no significant effects, and 4 had mixed results (2 found positive and significant impacts in mathematics and negative and significant impacts in reading, 1 found positive and significant impacts at the elementary school level but no significant impacts at the middle school level, and the last found negative and significant impacts in two locales and no significant impacts in five locales). Each of the 6 lottery-based (experimental) studies was based on charter school(s) in or near a single large city, and 5 of the 6 found positive and significant effects on student achievement after two years.
B. Are This Study’s Findings Consistent with Previous Research?
The Evaluation of Charter School Impacts adds to the growing body of evidence on an important topic. Although the literature on charter school impacts covers a broad range of charter schools and methodological strategies, our study was designed to address the gaps in the existing research. It used an experimental methodology, but—unlike previous experimental studies—it included charter schools in multiple states and in suburban, rural, and urban areas. While we relied on lotteries conducted by the schools, we observed each lottery to ensure its validity; we frequently monitored lottery and waiting list results and took into account the various ways students entered and exited the lotteries. Finally, most previous studies of charter school impacts focused almost entirely on impacts on test scores and provided little evidence on impacts on other student outcomes.93 In this study, we estimated charter school impacts on survey-based measures of students’ behavior and students’ and parents’ attitudes toward school. To our knowledge, none of the previous charter school impact studies analyzed outcome data from a student or parent survey.
Despite these differences, the study does use one of the common methodologies and addresses the most common issues of interest to policymakers and practitioners.94 We can therefore examine the extent to which findings from the current study are consistent with evidence from earlier studies (Table VI.1) with respect to four questions related to charter school impacts:
1. What is the average impact of charter schools on student achievement?
2. How much do charter schools vary in their achievement impacts?
3. For which students are charter schools most effective?
4. What charter school policies and practices are most closely associated with their impacts?
93 Exceptions include Zimmer et al. (2009), who examined impacts on high school graduation and college entry,
and Imberman (forthcoming), who estimated charter school impacts for a single (anonymous) school district and examined not only test scores but also attendance, retention in grade, and disciplinary measures. Dobbie and Fryer (2009) also estimated impacts on attendance.
94 Our study presents both estimates of the impact of admission to a charter school (the “intent to treat or ITT estimates) and estimates of the impact of attending a charter school (the “treatment on treated” or TOT estimates). Three of the six other lottery-based studies present both ITT and TOT estimates, although they focus nearly entirely on the TOT estimates (Abdulkadiroglu et al 2009; Dobbie and Fryer 2009; Angrist et al. 2010). The other lottery-based studies and all of the non-experimental studies present only TOT impact estimates.

78
It is important to note that, because different studies used different methodologies to examine the impacts of different samples of charter schools, the estimated impacts in the studies are not necessarily likely to be identical. Nevertheless, the current state of knowledge about charter school impacts may be summarized through the pattern of results from earlier, well-executed studies.
1. Average Impacts
In our study, the average charter school impact was negative but not statistically significant (Table IV.1). This finding is consistent with the other studies in the following ways:
• Studies that covered a wide span of states and/or districts, like ours, also found nonpositive average impacts. Zimmer et al. (2009) found that impacts on achievement were negative and statistically significant in 2 states and not significant in 5 states. CREDO (2009) examined charter schools in 14 states and found average impacts to be negative and significant, but small in magnitude (-0.01 standard deviation in reading and -0.03 in mathematics). Eight other non-experimental studies included charter schools in a single state and covered 7 unique states in total. Authors estimated negative average charter school impacts in 4 states and positive and significant impacts in 3 states (with one study finding positive and significant impacts at the elementary school level but insignificant impacts at the middle school level).95
• The experimental studies found that charter schools serving large populations of disadvantaged and racial/ethnic minority group students had positive impacts. At first glance, our findings appear to be at odds with findings from previous lottery-based studies, which demonstrated positive and significant average impacts of attending a charter school on reading and mathematics test scores in five of six studies. However, previous lottery-based studies focused on large urban areas with large disadvantaged and racial/ethnic minority populations while our sample included a much broader mix of students.96 When we examined only sites in which the proportion of students eligible for free or reduced-price meals was above the sample median, the estimated charter school impact on mathematics achievement was positive and statistically significant (Figure V.6). Similarly, the impact on mathematics achievement was positive at the charter school sites in large urban areas (Figure V.9). In both cases, impacts on reading achievement were not statistically significant in the sites that most resembled the charter schools included in earlier lottery-based studies.
2. Variation in Charter School Impacts
An important finding from our study is that charter schools varied in their impacts on students’ reading and mathematics achievement. In reading, for example, estimated impacts of being admitted
95 Two of the non-experimental studies included charter schools in Texas, with one finding negative charter school
impacts and the other finding impacts that were not statistically significant. 96 For example, Abdulkadiroglu et al. (2009) studied charter middle schools in Boston at which 70 percent of
students were black, 18 percent Hispanic, and 73 percent eligible for free or reduced-price lunch. Hoxby et al. (2009) studied New York City charter schools at which 64 percent of students were black, 27 percent Hispanic, and over 90 percent eligible for free or reduced-price lunch. Our study, by contrast, included urban and non-urban charter schools serving largely non-disadvantaged and non-minority populations—overall, 16 percent of students in our sample were black, 26 percent Hispanic, and 44 percent eligible for free or reduced-price lunch.

79
to a study charter school were greater than zero for 11 charter school sites and less than zero for the remaining 17 sites; 4 of the 28 site-level impacts were statistically significant (see Figure V.1). In terms of the size of the effects, the range of estimated impacts on z-scores was -0.43 to +0.33 standard deviations in reading and -0.78 to +0.65 standard deviations in mathematics. This variation in impacts across study charter schools was not merely random variation but was instead statistically significant. The finding is consistent with patterns of impact estimates from previous studies, though few of the studies explicitly examined variation in impacts.
Three of the previous studies listed in Table VI.1 presented estimates of the distribution of charter school impacts.97 Among the charter schools in 14 states and the District of Columbia, CREDO (2009) found that 17 percent had positive impacts on test scores, 37 percent had negative impacts, and the remainder had impacts that were not statistically significant. Among oversubscribed charter schools in New York City, Hoxby et al. (2009) showed estimates ranging from negative impacts to positive impacts of greater than 0.20 standard deviations. Zimmer et al. (2009) found that, in 5 of the 7 jurisdictions they examined, the estimated variability of impacts was significantly greater among charter schools than among traditional public schools.98
3. Charter School Impacts on Subgroups of Students
In the current study, we found that study charter schools had significantly different impacts for students from different socioeconomic backgrounds. Impacts were significantly more negative for students from higher-income families who were not eligible for free or reduced-price meals (Figure IV.1). We also observed a pattern of more negative impacts for higher-achieving students—those who entered charter schools with test scores in the upper half of the study sample distribution.99 Charter schools were not estimated to have significantly different impacts for students who differed by gender (Figure IV.3) or whether or not they were white/non–Hispanic (Figure IV.2).
Only a few previous charter school studies systematically examined charter school impacts for student subgroups:
• Two earlier studies examined subgroup impacts by income level. Like ours, CREDO found that charter school impacts were more positive for lower-income students (CREDO 2009). Hanushek et al. (2007) found no significant relationship between student income and charter school impacts.
97 While other previous studies did not directly present quantitative estimates of variation in impacts across
schools, Hanushek et al. (2007) and Bifulco and Ladd (2006) both provided evidence on the distribution of impacts. In addition, the pattern of average impacts across studies that cover different samples of charter schools in different states is consistent with substantial school-level variation in impacts. In particular, average impacts were positive in two states, negative in another set of states, and statistically insignificant in other states.
98 They estimated the standard deviation of school-level achievement impacts separately in the charter school sector and traditional public school sector within each of the 7 states/districts included in their analysis.
99 This estimate was statistically significant in the case of baseline reading and mathematics scores before adjusting for multiple hypothesis testing, but not after this adjustment (Appendix F). However, the interaction between a continuous measure of baseline achievement and the treatment status variable indicating whether students were admitted to a study charter school was statistically significant. This was the statistical test used to determine whether impacts differed for lower- versus higher-achieving students in Angrist et al. (2010).

80
• Four studies examined whether impacts varied by students’ earlier achievement levels. While CREDO (2009) found no relationship between earlier achievement and impacts, Booker et al. (2007) and Angrist et al. (2010) found a pattern of more positive (or less negative) impacts for students who had lower achievement levels when they entered charter schools. Hanushek et al. (2007) found the opposite—impacts were significantly more negative for lower-achieving students.
• Six studies examined charter school impacts for racial/ethnic subgroups. Four of the studies found no relationship between a student’s race/ethnicity and the impact of attending a charter school on his/her test scores (Hanushek et al. 2007; Zimmer et al. 2009; Hoxby et al. 2009; Angrist et al. 2010). In contrast to these studies and our study, the other two studies found that impacts were more positive among white students than among black or Hispanic students (Witte et al. 2007; CREDO 2009).
• The only study that provided subgroup impact estimates by gender found no evidence of a relationship between gender and impacts (Hoxby et al. 2009).
4. Policies and Practices Associated with Charter School Impacts
In this study, we examined the relationship between charter school characteristics and their impacts on student achievement.100 Characteristics included measures of the policy environment in which the schools operated and aspects of school operations. The purpose of the analysis was to examine whether we could identify specific policies and practices under which charter schools appeared to be more (or less) successful in raising student achievement. We found no evidence that policies such as the type of authorizer, level of accountability, or extent to which schools were autonomous in setting school policies were associated with impacts on reading and mathematics achievement. There was weak evidence of a positive relationship between a school’s revenues per student and impacts.101 We also found weak evidence of relationships between charter schools’ hours of operation and impacts, as well as between their student-teacher ratio and impacts.102 Aspects of charter school operations that—when measured relative to nearby public schools—showed solid evidence of an association with more positive (or less negative) impacts included:
• Smaller student enrollment
• Use of ability grouping
100 See Chapter V and Appendix G for the results. In Appendix Tables G.2 and G.3, we show the estimated
associations between various charter school characteristics and their impacts. In Figures V.2 through V.9, we show estimated impacts for subgroups of charter school sites with different characteristics.
101 We found a positive and significant association between a charter school’s revenues and impacts on year 2 mathematics scores. We defined this evidence as weak, however, because this association was no longer statistically significant when we controlled for other charter school characteristics, such as the characteristics of the students at these schools.
102 There was a positive and significant correlation between hours of operation and impacts on year 2 mathematics scores, and a positive and significant association between the student-teacher ratio and impacts on year 2 reading scores. In each case, however, this significant relationship was not robust—the relationship was no longer significant when we examined it using a different analytic approach.

81
Evidence from previous studies on the relationships between charter school characteristics and impacts is rare. Among the studies listed in Table VI.1, just two examined relationships between charter school characteristics and impacts that could be directly compared with the estimates from our study:
• Hoxby et al. (2009) found that impacts were more positive among schools with longer hours of operation. We found that hours of operation had a significant bivariate correlation with impacts but that the correlation was not statistically significant once we controlled for other school characteristics.
• Imberman (forthcoming) found that impacts were more positive in charter schools with smaller enrollments. On the other hand, Imberman (forthcoming) found no relationship between expenditures per student (closely related to revenues) and impacts.
Given the variation in impacts across charter schools, it would be useful to know more about what factors are related to schools’ success in boosting student achievement. The exploratory analysis in this study provides preliminary evidence that may suggest hypotheses for more rigorous evaluation in the future. For instance, it would be useful to investigate more rigorously whether charter schools that are smaller and that have greater revenues, longer hours of operation, and various other features truly are more effective than other charter schools. This study, along with the pattern of impact estimates from previous charter school studies, also strongly suggested that oversubscribed charter schools serving economically disadvantaged or low-achieving students are more successful in boosting mathematics test scores than charter schools serving students who are not low-achieving or economically disadvantaged. Studies focused on better understanding the reasons for this relationship would also provide useful information for policymakers and educators seeking to improve student achievement through the expansion and adaptation of charter schools.

Table VI.1. Summary of Charter School Impacts on Achievement from Selected Research Studies
82
Study Location
Number of Charter Schools
Average Impactb
Variation in Impact Across
Schools
Does Impact Differ by School
Maturity?
Does Impact Differ by Student’s
Duration in Charter School?
Do Impacts Differ by Student
Subgroups?
Do Impacts Differ by School Characteristics, Policies, and Practices?
Non-Experimental Studies
Zimmer et al. 2009a 7 states and districts
231 None/ negative
Negative impact in 2 locales, no impact in 5 locales; charters have greater variation in impacts than traditional public schools
Pattern of impacts improving over time
N/A No pattern of differential subgroup impacts by race/ethnicity
N/A
CREDO 2009 14 states and DC
2,403 Negative 37% negative; 17% positive; 46% zero impacts
N/A Negative in Year 1; positive/zero in Year 2; positive in Year 3
More positive impacts for lower-income students
More negative impacts for black/Hispanic students
Prior achievement not related to impacts
Impacts more positive for: • Elementary or middle
schools (as opposed to HS or multi-level)
• Schools in state with no charter school caps
• Schools in states that do not allow multiple entities to authorize charter schools
Abdulkadiroglu et al. 2009 Boston 28 Positive N/A N/A N/A N/A No difference on impacts in math for MS versus HS
Impacts on English/ Language Arts larger in HS
Imberman (forthcoming) Anonymous large urban district
More than 20
Positive in math; negative in reading
More negative impacts on reading in larger schools
More positive impacts for conversion charter schools
Impacts not influenced by per pupil expenditures
Ballou et al. 2008 Idaho 28 Positive for elementary schools; none for middle schools
N/A N/A N/A N/A N/A

83
Average Impactb
Variation in Impact Across
Schools
Does Impact Differ by School
Maturity?
Does Impact Differ by Student’s
Duration in Charter School?
Do Impacts Differ by Student
Subgroups?
Do Impacts Differ by School Characteristics, Policies, and Practices? Study Location
Number of Charter Schools
Hanushek et al. 2007 Texas 248 Negative N/A Negative impacts in Years 1 & 2; no impacts in later years
N/A No pattern of differential impacts by income or race/ethnicity
More negative impacts for lower-achieving students
N/A
Booker et al. 2007 Texas 179 None N/A Zero or negative impacts in Years 1 & 2; positive impacts in later years
Negative in Year 1; becoming positive over time
Pattern of more positive (or less negative) effects for lower-performing students
N/A
Witte et. al 2007 Wisconsin 130 Positive N/A N/A N/A More positive impacts for white students than for black or Hispanic students
Most positive impacts for students in grades 5-8
Bifulco and Ladd 2006 North Carolina
79 Negative Substantial variation, but most schools have negative impacts
Effects remain negative over time
Negative in Year 1, no additional impacts in later years
N/A N/A
Sass 2006 Florida 190 Negative N/A Negative in Years 1 & 2; positive by Year 5
N/A Less negative impacts in math for ES students; less negative impacts in reading for HS students
N/A

84
Average Impactb
Variation in Impact Across
Schools
Does Impact Differ by School
Maturity?
Does Impact Differ by Student’s
Duration in Charter School?
Do Impacts Differ by Student
Subgroups?
Do Impacts Differ by School Characteristics, Policies, and Practices? Study Location
Number of Charter Schools
Betts et al. 2006 San Diego 21 Negative in math at elementary school level; positive in math and negative in reading at middle school level
N/A Effects most negative in first year
N/A N/A No difference in impacts at elementary school level between startup and conversion charter schools
Zimmer et al. 2003 California 550 Pattern of negative effects
N/A No relationship between school maturity and impacts
N/A N/A More positive impacts for conversion charter schools
Solmon et. al 2001 Arizona Not reported Positive N/A N/A Negative in Year 1, positive over time
N/A N/A
Lottery-Based Studies
Angrist et al. 2010 Lynn, MA 1 (over-subscribed)
Positive N/A Impacts somewhat more positive in Years 3-5 than in Year 2
N/A More positive impacts for LEP students than non-LEP students and for students with lower baseline scores
No evidence of differential impacts by race/ethnicity
N/A
Abdulkadiroglu et al. 2009 Boston 8 (over-subscribed)
Positive N/A N/A N/A N/A More positive for middle schools (MS) than high schools (HS)
Dobbie and Fryer 2009 New York City
1 (over-subscribed)
Positive N/A N/A Increasingly positive over time
N/A N/A

85
Average Impactb
Variation in Impact Across
Schools
Does Impact Differ by School
Maturity?
Does Impact Differ by Student’s
Duration in Charter School?
Do Impacts Differ by Student
Subgroups?
Do Impacts Differ by School Characteristics, Policies, and Practices? Study Location
Number of Charter Schools
Hoxby et al. 2009 New York City
42 (over-subscribed)
Positive Substantial variation: 14% of students attend school with negative impact in math; remainder positive, with 10% positive and large
No Increasingly positive over time
No evidence of differential impacts by race/ethnicity or gender;
More positive impacts for students in higher grades
More positive for schools with: • longer school year • small rewards/penalties
disciplinary system • teacher pay based on
performance • mission statement
emphasizing academic performance
Hoxby and Rockoff 2005 Chicago 3 (over-subscribed)
Positive N/A N/A N/A N/A N/A
McClure et al. 2005 San Diego 1 (over-subscribed)
None N/A No N/A N/A N/A
The Evaluation of Charter School Impacts 2010
15 states 36 (over-subscribed)
None Substantial variation: impacts on reading z-scores ranged from -0.43 to -0.33; impacts on math z-scores ranged from -0.78 to 0.65
No significant variation in impacts by school age (no brand new schools included)
Impacts not significant in either students first year or second year
No significant differences in impacts by race/ethnicity or gender;
More positive or less negative impacts for lower-income students
Less negative impacts for students with lower baseline achievement scores
More positive or less negative for schools with: • lower enrollment • use of ability grouping • larger proportion of lower-
income students • larger proportion of lower-
achieving students
aZimmer et al. (2009) did not actually estimate an overall average impact, but instead estimated average impacts among charter schools in each of the 7 states separately. We present the estimated impacts for nonprimary charter schools, based on the authors’ concerns about the validity of the estimates for elementary schools. b”None” indicates that the study found no statistically significant impacts of attending a charter school on student achievement. “Negative” indicates that the study found impacts that were negative and statistically significant. “Positive” indicates that the study found impacts that were positive and statistically significant.
N/A = No evidence was available.
Table VI.1 (continued)

This page is intentionally left blank.

87
REFERENCES
Abdulkadiroglu, Atila, Josh Angrist, Sarah Cohodes, Susan Dynarski, Jon Fullerton, Thomas Kane, and Parag Pathak. “Informing the Debate: Comparing Boston’s Charter, Pilot and Traditional Schools.” Boston: Boston Foundation, January 2009.
Angrist, Joshua D., Susan M. Dynarski, Thomas J. Kane, Parag A. Pathak, and Christopher R. Walters. “Who Benefits from KIPP” NBER Working Paper Series No. 15740. Cambridge, MA: National Bureau of Economic Research, February 2010.
Angrist, Joshua D., Guido W. Imbens, and Donald R. Rubin. “Identification of Causal Effects Using Instrumental Variables.” Journal of the American Statistical Association, vol. 91, 1996, pp. 444-472.
Ballou, Dale, Bettie Teasley, and Tim Zeidner. “Charter Schools in Idaho.” In M. Berends, M.G. Springer, and H.J. Walberg (eds.), Charter School Outcomes. New York: Lawrence Erlbaum Associates, 2008.
Bandeira de Mello, V., Blankenship, C., and McLaughlin, D.H. (2009). Mapping State Proficiency Standards Onto NAEP Scales: 2005-2007 (NCES 2010-456). National Center for Education Statistics, Institute of Education Sciences, U.S. Department of Education: Washington, DC, October 2009.
Benjamini, Yoav, and Yosef Hochberg. “Controlling the False Discovery Rate: A Practical and Powerful Approach to Multiple Testing.” Journal of the Royal Statistical Society Series B (Methodological), vol. 51, no. 7, 1995, pp. 289-300.
Betts, Julian R., Lorien A. Rice, Andrew C. Zau, Y. Emily Tang, and Cory R. Koedel. “Does School Choice Work? Effects on Student Integration and Achievement.” San Francisco: Public Policy Institute of California, August 2006.
Betts, Julian R., and Y. Emily Tang. “Value-Added and Experimental Studies of the Effect of Charter Schools on Student Achievement.” Seattle: Center on Reinventing Public Education, December 2008.
Bifulco, Robert, and Katrina Bulkley. “Charter Schools.” In H.F. Ladd and E.B. Fiske (eds.), Handbook of Research in Education Finance and Policy. New York: Routledge, 2008.
Bifulco, Robert, and Helen F. Ladd. “The Impact of Charter Schools on Student Achievement: Evidence from North Carolina.” Education Finance and Policy, vol. 1, no. 1, 2006, pp. 50-90.
Booker, Toby Kevin, Scott Gilpatric, Timothy Gronberg, and Dennis Jansen. “The Impact of Charter School Attendance on Student Performance.” Journal of Public Economics, vol. 91, nos. 5-6, June 2007, pp. 849-876.
Center for Education Reform. “Just the FAQs–Charter Schools.” Available at [http://www.edreform.com/published_pdf/Just_the_FAQs_Charter_Schools.pdf]. Accessed March 2010.

88
Center for Education Reform. “K-12 Facts.” Available at [http://www.edreform.com/Fast_Facts/K12_Facts/]. Accessed November 2009.
Center for Research on Education Outcomes (CREDO). “Multiple Choice: Charter School Performance in 16 States.” Stanford, CA: Stanford University, June 2009.
Charter School Achievement Consensus Panel. “Key Issues in Studying Charter Schools and Achievement: A Review and Suggestions for National Guidelines.” NCSRP White Paper Series, No. 2. Seattle: Center on Reinventing Public Education, University of Washington, May 2006.
Crocker, Linda, and James Algina. “Introduction to Classical and Modern Test Theory.” New York: Harcourt Brace Jovanovich College Publishers, 1986.
Dobbie, Will, and Roland G. Fryer, Jr. “Are High-Quality Schools Enough to Close the Achievement Gap? Evidence from a Bold Social Experiment in Harlem.” Unpublished paper. Cambridge, MA: Harvard University, April 2009.
Gill, Brian, P., Mike Timpane, Karen E. Ross, Dominic J. Brewer, and Kevin Booker. “Rhetoric versus Reality: What We Know and What We Need to Know about Vouchers and Charter Schools.” Santa Monica, CA: RAND Corporation, 2007.
Hanushek, Eric A. “Efficient Estimators for Regressing Regression Coefficients.” American Statistician, vol. 28, no. 2, 1974, pp. 66-67.
Hanushek, Eric A., John F. Kain, Steven G. Rivkin, and Gregory F. Branch. “Charter School Quality and Parental Decision Making with School Choice. Journal of Public Economics, vol. 91, 2007, pp. 823-848.
Hill, Carolyn J., Howard S. Bloom, Alison Rebeck Black, and Mark W. Lipsey. “Empirical Benchmarks for Interpreting Effect Sizes in Research.” MDRC Working Paper on Research Methodology. New York: MDRC, 2007.
Hoxby, Caroline M. “A Serious Statistical Mistake in the CREDO Study of Charter Schools.” Available at [http://www.nber.org/~schools/charterschoolseval]. Accessed September 24, 2009.
Hoxby, Caroline M., Sonali Murarka, and Jenny Kang. “How New York City’s Charter Schools Affect Student Achievement: August 2009 Report.” Second report in series. Cambridge, MA: New York City Charter Schools Evaluation Project, September 2009.
Hoxby, Caroline M., and Jonah E. Rockoff. “Findings from the City of Big Shoulders.” Education Next, vol. 5, no. 4, 2005, pp. 52-58.
Imberman, Scott. “Achievement and Behavior in Charter Schools: Drawing a More Complete Picture.” The Review of Economics and Statistics, forthcoming.
Lacireno-Paquet, Natalie, Thomas T. Holyoke, Michele Moser, and Jeffrey R. Henig. “Creaming versus Cropping: Charter School Enrollment Practices in Response to Market Incentives.” Educational Evaluation and Policy Analysis, vol. 24, no. 2, summer 2002, pp. 145-158.

89
Lake, Robin J. (ed.). Hope, Fears, and Reality: A Balanced Look at American Charter Schools in 2008. Seattle: National Charter School Research Project, Center on Reinventing Public Education, University of Washington, December 2008.
Lee, David S. “Training, Wages, and Sample Selection: Estimating Sharp Bounds on Treatment Effects.” NBER Working Paper #11721, Cambridge, MA: National Bureau of Economic Research, 2005.
Lipsey, Mark W., and David B. Wilson. Practical Meta-Analysis. Thousand Oaks, CA: Sage Publications, 2001.
May, Henry, Irma Perez-Johnson, Joshua Haimson, Samina Sattar, and Phil Gleason. “Using State Tests in Education Experiments: A Discussion of the Issues.” Final report. Princeton, NJ: Mathematica Policy Research, November 2009.
McClure, Larry, Betsy Strick, Rachel Jacob-Almeida, and Christopher Reicher. “The Preuss School at UCSD: School Characteristics and Students’ Achievement.” La Jolla, CA: The Center for Research on Educational Equity, Assessment and Teaching Excellence, University of California, San Diego, November 2005.
McEwan, Patrick, and Robert Olsen. “Admissions Lotteries in Charter Schools.” In Taking Measure of Charter Schools: Better Assessments, Better Policymaking, Better Schools, Lanham, MD: Rowman, Littlefield Publishing Group, May 2010.
National Alliance for Public Charter Schools. Charter School Achievement: What We Know (5th Edition). Washington, DC: National Alliance for Public Charter Schools, April 15, 2009.
National Alliance for Public Charter Schools. “Caps on Charter Schools.” Available at [http://www.publiccharters.org/Caps+on+Charter+Schools]. Accessed March 2010.
National Alliance for Public Charter Schools. “State Policy At-a-Glance.” Available at [http://www.publiccharters.org/node/15/]. Accessed March 2010.
Nunnally, Jum. Psychometric Theory. New York: McGraw-Hill, 1978.
Sass, Tim R. “Charter Schools and Student Achievement in Florida.” Education Finance and Policy, vol. 1, no. 1, winter 2006, pp. 91-122.
Schochet, Peter Z. “Guidelines for Multiple Testing in Impact Evaluations of Educational Interventions: Final Report.” Princeton, NJ: Mathematica Policy Research, 2008.
Solmon, Lewis, Kern Paark, and David Garcia. “Does Charter School Attendance Improve Test Scores? The Arizona Results.” Phoenix: Goldwater Institute, 2001.
US Charter Schools. “State by State #’s.” Available at [http://www.uscharterschools.org/cs/sp/query/q/1595?x-order=year+desc,state+desc]. Accessed March 2010.
U.S. Department of Education. What Works Clearinghouse Procedures and Standards Handbook Version 2. Washington, DC: U.S. Department of Education, 2008.

90
Witte, John F., David L. Weimer, Arnold Shober, and Paul Schlomer. “The Performance of Charter Schools in Wisconsin.” Journal of Policy Analysis and Management, vol. 26, no. 3, 2007, pp. 557-573.
Zimmer, Ron, Richard Buddin, Derrick Chau, Glenn Daley, Brian Gill, Cassandra Guarino, Laura Hamilton, Cathy Krop, Dan McCaffrey, Melinda Sandler, and Dominic Brewer. “Charter School Operations and Performance: Evidence from California.” Santa Monica, CA: RAND Corporation, 2003.
Zimmer, Ron, Brian Gill, and Kevin Booker. Charter Schools in Eight States: Effects on Achievement, Attainment, Integration, and Competition. Santa Monica, CA: RAND Corporation, 2009.
Zorn, Christopher. “A Solution to Separation in Binary Response Models.” Political Analysis, vol. 13, spring 2005, pp. 157-170.

APPENDIX A
SELECTING THE CHARTER SCHOOL AND STUDENT SAMPLES

This page is intentionally left blank.

A-3
In Appendix A, we describe in detail the identification and recruitment of study charter schools, the selection and random assignment of the student sample through charter school lotteries, and data collection for the school and student samples. In Section A of the appendix, we outline how we identified potentially eligible schools, confirmed their eligibility and recruited them into the study, and maintained contact with the schools to ensure that they remained eligible. In Section B, we describe how, at each participating school, we identified students who entered the school’s admission lottery, obtained consent from the students’ parents, and then tracked the students through the lottery and entire admission process in order to classify them as members of either the treatment group (admitted to the school; lottery winners) or the control group (denied admission; lottery losers). We also provide information on response rates for various data sources for sample members.
A. Selection of Charter Schools
To be eligible for the study, a charter school had to demonstrate that it had an entry grade between 4 and 7 (that is, a charter middle school), had been operating for at least two years at the time of recruitment, served a general population of students, and was oversubscribed. Overall, we selected schools for the study from any state with eligible charter schools. In the first year of recruitment, however, we limited the recruitment process to a subset of 12 states with large numbers of charter middle schools. In the second year, we recruited and selected charter middle schools from all states. The process for selecting schools for inclusion in the study involved four steps: (1) identification; (2) screening; (3) recruiting; and (4) follow-up. In Figure A.1, we summarize the flow of charter schools through the selection process. We conclude Section A with a discussion of the analysis of statistical power that guided our plans for recruiting charter schools (and, ultimately, a student sample) into the study.
1. Identification of Potentially Eligible Schools
The first step in the school selection process was to identify the population of charter schools from which eligible schools could be drawn. We used information from each state’s department of education to develop a comprehensive list of charter schools. To restrict the lists, we collected data, when available, on the first two eligibility criteria (grades offered and years in operation). We then used additional secondary data sources (including the Common Core of Data from the National Center for Education Statistics) to identify any schools that we might have overlooked, thereby finalizing the list of schools to be screened for verification of eligibility on all three dimensions (grades offered, years in operation, and oversubscription).
Overall, we identified 492 potentially eligible charter schools—that is, charter middle schools in operation for at least two years (Table A.1).103 The set of schools included 336 charter schools identified as potentially eligible in the first year of school recruiting in the original 12 study states. From these schools, we selected schools that would provide the cohort 1 sample. In Year 2, we
103 Among our initial list of potentially eligible schools, we later discovered a subset of ineligible schools and
excluded them from the study. These schools either were not charter middle schools (for example, they may have served elementary school grades as well as middle school grades) or had closed between the time we initially identified them and the beginning of the study period. In addition, the initial set of schools included another subset of schools that served only a highly specialized target population, such as students with severe behavioral problems or learning disabilities. We also excluded this subset of schools from the set of charter middle schools potentially eligible for the study.

identified an additional 156 charter middle schools that either opened in 2004–2005 in the 12 states or were located in any of the remaining states.
Figure A.1. Flow of Charter Schools Through Selection Process
Yes (n=77)
Yes (n=167)
ALL CHARTER SCHOOLS
NoYes
Ineligible (Not a charter middle school)Entry grade between 4 and 7?
At least 2 years old?
Initial screen indicates potentialfor oversubscription?
Ineligible(Not enough experience)
Recruiting effort confirms eligibility?
Willing to participate?
Ineligible(Not oversubscribed)
PARTICIPATING SCHOOLS
Refusal
Yes (n=492)
Yes (n=130)
Yes (n=36)
No
No
No
No
NoMaintain eligibility through admissions period?
2. Screening of Potentially Eligible Schools
Once we identified the population of potentially eligible schools, we screened the schools to determine the likelihood of oversubscription for the next school year (based on degree of oversubscription for the current year). In the absence of a reliable secondary source of information on a school’s level of oversubscription, we contacted each school to see if it met the oversubscription eligibility criterion. If a school reported any oversubscription at the entry grade in the previous year or had reason to suspect oversubscription in the upcoming year, we targeted the school for recruitment in order to be as inclusive as possible.
A-4

A-5
Over the two years of school recruiting, we completed the initial screen in 486 out of 492 potential cases (99 percent), with some schools screened twice—once for each year of recruiting.104 Among screened schools, we deemed 34 percent initially eligible.
Table A.1. Number of Potentially Eligible Charter Schools, by Census Sub-regions
Number of Schools
Sub-region Total
New England 30
Middle Atlantic 35
East North Central 63
West North Central 21
South Atlantic 79
East and West South Central 67
Mountain 77
Pacific 120
Total 492
3. Recruiting
Participation in the evaluation was not mandatory for schools; as a result, the selection of schools for the study depended on identifying those that were not only eligible but also willing to participate. Once we developed the list of initially eligible schools, one of the study team’s recruiters contacted each school to verify its eligibility and seek its participation in the evaluation. Recruiters made every effort to encourage schools to take part in the study and succeeded in persuading well over half of all eligible schools (77 out of 130) to express an intent to participate.
Recruitment of initially eligible charter schools continued until a school could be classified into one of three interim outcome categories: ineligible, agreeing to participate, or refusing to participate. We classified a school as ineligible if, through more detailed discussions with the principal, we concluded that the school was not sufficiently oversubscribed for the study’s purposes. We classified a school as agreeing to participate if we confirmed its eligibility and the school made an oral commitment to participate. We classified a school as refusing to participate if it did not fall into one of the first two categories (that is, it was not deemed ineligible and did not agree to participate). Schools could be classified as refusals in several ways. Some schools that avoided most or all of the recruiter’s attempts to contact them were classified as passive refusals. Other schools actively declined to participate for various reasons. Finally, a few schools were classified as refusals even though they were willing in principle to participate—some of these schools were oversubscribed but did not use an admission lottery and could not or would not implement one; others were recruited after reaching some or all of their relevant admission milestones and were unwilling or unable to alter their admission procedures to accommodate the study.
104 Two of the unscreened schools were located in or near New Orleans and were intentionally not screened in the
aftermath of Hurricane Katrina (2005); the others were consistently unresponsive.

A-6
Among the 167 initially eligible schools targeted for recruiting after the screening process, the recruiter determined that 37 (22 percent) were ineligible, 53 (32 percent) refused to participate, and 77 (46 percent) agreed to participate. Stated another way, 77 of 130 eligible schools (59 percent) agreed to participate.
4. Follow-Up
Because the recruiting process still relied on estimates of oversubscription, we could not make a final determination of a school’s eligibility until we confirmed oversubscription (that is, the school had made all of its admission offers for the school year of interest). Final determination required follow-up with the school at a minimum of three time points: (1) before the lottery was scheduled to take place so as to confirm that the school had more applicants than open slots and thus would conduct a lottery; (2) at the time of the lottery so as to ensure that random assignment was conducted fairly; and (3) after the lottery so as to determine how many additional offers of admission were made to students on the school’s waiting list (and to calculate how many lottery participants remained on the waiting list at the start of the school year, thus representing the study’s control group).
Several schools became ineligible for the study during either the pre-lottery or post-lottery period in Year 1. We dropped several schools from the study before the lottery when, despite their estimates, the schools received an insufficient number of applications before the admission deadline, thus eliminating the need for a lottery. We dropped additional schools after the lottery but before the start of the next school year when those schools were forced to make post-lottery offers of admission to students on the waiting list to fill slots that opened when lottery winners declined admission offers. As a result, an insufficient number of original lottery participants remained on the waiting list to form a control group. Of the 77 schools that initially agreed to participate in the study following the two-year recruiting process, 36 remained in the study throughout the admission process.
5. Statistical Power and Selection of a School Sample
To assess appropriate sample sizes of students and schools during the evaluation’s design phase, we adopted a precision standard based on impact results in other evaluations. In particular, we set at 0.15 the target minimum detectable effect (MDE) size for the impact of study charter schools on student test scores. The MDE is the smallest true effect size that would have a high probability (80 percent) of being found statistically significant with a given sample and study design.
The target MDE determined our initial strategy for selecting (1) charter schools for the study and (2) students applying to those schools as the study sample. The strategy involved efforts to recruit 50 charter schools in order to generate outcome data for 24 lottery winners and 24 lottery losers at the schools of interest. The sample sizes led to an initial planned MDE of 0.14, which met the target MDE of 0.15. (Appendix D discusses the assumptions underlying calculation of the study’s MDEs, along with the full set of study MDEs.)
As described, the flow of applicants to the schools hampered our ability to achieve the target student samples at each school. Moreover, once students had applied to the schools, they were grouped into categories of lottery winners and lottery losers based on the number of seats to be filled by each school. We ended up with samples of schools and students that differed from our original plan, although both samples were still consistent with the original plan in terms of statistical power. In particular, the MDE based on our actual sample sizes and other features of the design was

also 0.14 and accounted for the fact that our tests of statistical significance adjust for multiple-hypothesis testing.
The study’s MDE implies that that the study design would reliably detect as statistically significant true impacts as low as 0.14 in effect size units. However, the MDE would not be able to detect reliably true impacts of a smaller size. We also calculated MDEs for subgroup impact estimates. For example, the MDE for estimated impacts among students with baseline mathematics test scores below the sample median is 0.20 (Appendix D). If the study found that estimated impacts were not statistically significant for a subgroup, we could not determine with certainty whether the finding implied that charter schools had no impact on student outcomes for the subgroup or only a modest impact (less than 0.20 effect size units).
B. Selection, Randomization, and Data Collection for the Student Sample
The admission processes and lotteries conducted by the study schools determined selection of the student sample as well as random assignment of the sample into treatment and control groups. In Figure A.2, we present the flow of students through the schools’ admission process and into the study sample and the treatment and control groups, along with students’ flow into the analysis sample—the set of students for whom we obtained data.
Figure A.2. Student Sample Selection Process
Yes (n=2904; 56%)
Apply to charter school n=6356
Yes (n=1002; 16%)
No (n=1160; 71%)
No (n=1641; 57%)
No (n=2280; 44%)
No (n=5354; 84%)
Out of sample(admitted to
school)
Yes (n=481;29%)
Yes (n=1263; 43%)
Exempt from lottery?
Give consent?
Participate in lottery: Win a slot?
Out of sample(but participate in
lottery & have chance of
being admitted)
Offered admission
Placed on wait list
High enough on wait list to be offered admission anyway?
Treatment Group/Lottery Winners(n=1744; 60%)
Control Group/Lottery Losers(n=1160; 40%)
Respondent Sample in
Baseline Year
Admin. Records
(n=1293;92%)
Respondent Sample in
Baseline Year
Admin. Records
(n=837; 90%)
Respondent Sample in Year 1
Parent Survey(n=1191; 85%)Student Survey(n=1134; 81%)
Admin. Records(n=1334; 95%)
Respondent Sample in Year 1
Parent Survey(n=744; 80%)
Student Survey(n=682; 73%)
Admin. Records(n=826; 89%)
Respondent Sample in Year 2
Admin. Records(n=1172; 90%)
Respondent Sample in Year 2
Admin. Records(n=748; 84%)
Analysis Sample: Have Valid Administrative Recordsa (n=1400; 80%)
Analysis Sample: Have Valid Administrative Recordsa
(n=930; 80%)
A-7

A-8
We identified students eligible for the sample on the basis of their application to one of the study charter schools in a grade in which the school conducted an admission lottery. However, the sample included only students who actually participated in the admission lotteries at the schools. It excluded students exempted from the lottery by the school and automatically admitted (such as siblings of current students). In addition, given that the study’s data collection plan required informed consent from students’ parents, the sample included only students for whom we obtained a signed consent form. Thus, the study’s full sample consists of students who applied to the study schools in either 2005 or 2006, who participated in the admission lottery, and whose parents gave consent for study participation.105 Below, we describe in greater detail the components of the sample selection process.
1. Charter School Application Procedures
For each of the charter middle schools in the study, applicants to the school’s entry grade—usually the school’s lowest grade—were potentially eligible for the study sample. Typically, the sample did not include applicants to higher middle school grades because such applicants were too few in number or were competing for a limited number of slots at the school (the school’s continuing students received priority in determining who would attend the school in the higher grades). In one case, however, we included in the sample applicants to two grades at the school because the school had an unusually large number of open slots in the non-entry grade and a large number of applicants.
Most study schools placed few or no restrictions on who could apply for admission. The most common restriction involved residential location. Some schools accepted applications only from students who lived within district boundaries or some other geographic boundaries; others accepted applicants from outside their residential area but admitted such students only after offering admission to within-area applicants.
The timing of schools’ application periods depended on the timing of their lotteries; study charter schools accepted applications for a period that ended on or shortly before the lottery date. Lotteries typically took place in February or March; though a few took place substantially later (Table A.2). The beginning of the application period also varied across study schools. Some schools accepted applications only during a defined enrollment period that ranged from a week to several months. Others accepted applications at any time before the application deadline.
Study charter middle schools exempted a substantial proportion of students from the lottery (and admitted them automatically). All schools in the study exempted siblings of current students (Table A.3).106 Other types of exemptions—for children of school staff or siblings of alumni, for example—were less common. Overall, however, a sizable proportion of students admitted to schools’ entry grades did not have to participate in an admission lottery. Of all of the seats filled by study schools, 31.7 percent went to students exempt from the lottery. The study sample excluded students exempt from a school’s lottery.
105 As described in Chapter II, our main analysis sample for estimating impacts also included the restriction that we
obtained baseline school records data on student test scores. However, the overall study sample includes both students with and without baseline records.
106 Technically, some of the study charter schools included siblings in their lottery but gave them preference in admissions over non-sibling applicants. Given that these schools admitted many more students than they had sibling applicants at the entry grade, they effectively provided a lottery exemption for sibling applicants.

A-9
Table A.2. Schedule of Lottery Dates at Study Charter Schools
Charter Schools
Month Number Percentage
January 3 7
February 13 32
March 20 48
April or later 5 12 Note: Five schools are included are included twice in the counts for the table because they contributed
sample members in both cohort 1 and cohort 2.
Table A.3. Exemptions from Study Schools’ Admissions Lotteries
Charter Schools
Number of Schools Percentage
Possible Reasons for Exemptions Siblings of current student 41 100 Children of school staff 5 12 Children of board members 4 10 Additional exemptions 4 10
Number of Students School Accepted (Through the Lottery or Lottery Exemptions)
1-40 7 17 41-80 22 54 81-120 5 12 121-150 3 7 151 + 4 10 (Mean number) (80.2)
Number of Students Exempted from Lottery 1-20 23 56 21-40 13 32 41 + 5 12 (Mean number) (26.7)
Percentage of Admitted Students Exempted from Lottery 1-20 12 29 21-40 17 41 41-60 9 22 61-80 3 7 81-100 0 0 (Mean percentage) (31.7)
Notes: Five schools are included are included twice in the counts for the table because they contributed
sample members in both cohort 1 and cohort 2. Percentages may not equal 100 due to rounding.
2. The Collection of Study Consent Forms
For students who participated in the admission lotteries at study schools, we attempted to obtain a signed consent form from a parent or guardian. To preserve the integrity of the random assignment design, we worked to obtain parent consent before the school lottery. In this way, we could be certain that the outcome of the lottery did not influence parents’ decision about whether to grant consent.

A-10
In selected cases during cohort 1, we continued to collect consent forms after the lottery, albeit with caution. If parents knew the outcome of the admission lottery at the time we sought consent, their decision to grant consent could have been influenced by the lottery outcome. For example, the parents of lottery winners could have been more likely than the parents of lottery losers to consent to their child’s participation in a study on charter schools.
We pursued a strategy of collecting consent forms after the lottery only if we were confident that we could satisfy two conditions: (1) obtain consent from a large proportion (over 80 percent) of lottery participants and (2) obtain consent from approximately equal proportions of lottery winners and losers. We set these conditions to minimize the likelihood of creating baseline differences between lottery winners and losers in the sample of students with consent. If we did not meet either condition, we dropped from our sample those students whose parents provided consent in the post-lottery period.
In Table A.4, we show the six sites where we attempted to obtain post-lottery consent. At the last four sites, we achieved consent rates of over 80 percent among both lottery winners and losers. We included in our analysis sample members at the four sites for whom we obtained consent either before or after the lottery.107 At the first two sites, we achieved a high consent rate among lottery winners but not among lottery losers and thus excluded from our sample students at these two sites for whom we obtained consent during the post-lottery period.
Overall, we obtained consent from 54 percent of lottery participants in cohort 1, including 55 percent of students ultimately offered admission (categorized as treatment students) and 52 percent of students never offered admission (categorized as control students) (Table A.5). The consent rate was higher at cohort 2 schools—70 percent among both lottery winners and losers. Overall, for the average study charter school lottery, the consent rate was 62 percent among lottery winners and 61 percent among lottery losers.108
107 The consent rate across the four sites was 89 percent for lottery winners and 87 percent for lottery losers.
Among sample members granting consent at the four sites, just under half did so after the lottery. To assess whether the inclusion of sample members granting post-lottery consent introduced any bias into the design, we compared the baseline characteristics—including baseline test scores—of consenting lottery winners to consenting lottery losers. At each site, the baseline characteristics for consenting lottery winners and losers were similar, with few statistically significant differences between the two groups across 90 characteristics—approximately what we would expect to observe by chance.
108 To determine this consent rate, we calculated the percentage of lottery participants for whom we obtained consent in each of the study’s 41 lotteries. The percentage differs somewhat from the percentage of all lottery participants in the study for whom we obtained consent (Figure A.2) because the consent rate in study charter school lotteries with a large number of participants tended to be lower than the consent rate in lotteries with few participants.

A-11
Table A.4. Pre-Lottery and Post-Lottery Consent Collections at Selected Study Charter Schools
Charter School Site
Number of Lottery Participants % of
Consents Collected
Post-Lottery
Consent Rate
Post-Lotterya Overall
Treatment(Lottery
Winners)
Control (Lottery Losers) Total
Treatment(Lottery
Winners)
Control (Lottery Losers)
Treatment(Lottery
Winners)
Control (Lottery Losers) Total
Site 1b 18 17 35 42% 73% 20% 83% 53% 69% Site 2b 72 14 86 20% 33% 14% 78% 57% 74% Site 3c 165 59 224 30% 72% 86% 90% 95% 91% Site 4c 47 91 138 63% 71% 75% 83% 82% 83% Site 5c 24 12 36 35% 73% 60% 88% 83% 86% Site 6c 116 25 141 58% 89% 80% 93% 88% 92%
Total (Sites 1-6) 447 215 662 41% 69% 56% 86% 76% 83%
Total (Sites 3-6) 357 184 541 47% 76% 75% 89% 87% 88% aThe post-lottery consent rate is defined as the number of students providing consent after the lottery as a percentage of the sample of students who did not provide consent prior to the lottery. bIndicates the schools for which we do not include sample members whose consents were obtained after the lottery. cIndicates the schools for which we include sample members whose consents were obtained after the lottery.
Table A.5. Overall Consent Collection
Number of Charter Schools
Number of Lottery Participants Average Consent Rate
Cohort
Treatment (Lottery
Winners)
Control (Lottery Losers) Total
Treatment (Lottery
Winners)
Control (Lottery Losers) Total
1 20 1,545 1,449 2,994 55% 52% 54%
2 21 1,501 1,074 2,575 70% 70% 70%
Total 41 3,046 2,526 5,572 62% 61% 62% Note: The unit of analysis for the table is the charter school’s lottery. Thus, the five schools that are included
in both cohort 1 and cohort 2, contribute to the totals in both years.
Given that we were unable to obtain consent for all applicants (and some applicants were exempt from the admissions lotteries, as described earlier), the sample of lottery participants for whom we obtained consent is not representative of all students who applied to study charter schools. For example, the consent status of a particular student was sometimes linked to parental deliberation, with the student’s parents considering whether to complete the consent form and agree to their child’s participation in the study. In other cases, we were not able to obtain consent for a group of students because of when and how students submitted their applications. Some schools accepted applications from students long before they agreed to participate in the study and before the school or study team even started distributing and collecting consent forms. At such schools, the parents of early applicants would be less likely than the parents of later applicants to have provided consent. In other cases, the process of obtaining consent may have simply required time; therefore, students who applied late in the application period would have been less likely to provide consent.

A-12
3. Charter School Lotteries and Waiting List Admissions
Aside from those students automatically admitted to study schools through exemptions, lotteries determined applicants’ chances of admission. Charter schools typically conducted their own lotteries. To ensure that the lotteries were consistent with the principles of random assignment, study team members observed study school lotteries to monitor and document the process109 (Table A.6).
Table A.6. Characteristics of Study Charter School Lotteries
Charter Schools
Number Percentage
Observed by Study Team Member 39 95
Public/Private Status Public 34 81 Private 7 19
Method of Conducting Lottery Mechanical 38 93 Computerized 3 7
Stratification 3 7
Sibling Rules Siblings and nonsiblings treated the samea 10 24 Siblings treated as single entry in lottery 3 7 Siblings each admitted if any win lottery 28 68
Total 41 100 aThis category includes lotteries in which no siblings applied and the school did not have a specific policy for handling sibling applicants.
Percentages may not equal 100 due to rounding.
While few study schools conducted stratified lotteries, a majority had special rules for dealing with siblings applying together to a school. Most such schools wished either to admit or not admit siblings together rather than admit only one. A total of 10 study schools either treated sibling applicants no differently than nonsibling applicants or lacked policies for dealing with sibling applicants (and had no sibling applicants). In 3 schools, sibling applicants entered the lottery as a single unit and were either selected or not selected as a lottery winner. More commonly, however, a school entered each sibling individually into the lottery and then offered admission to all related siblings if any one won the lottery. This approach kept siblings together and meant that siblings had a higher probability of admission than nonsiblings. As described in Appendix B, we used sample weights to account for different admission probabilities.
109 Two study schools held lotteries that were not observed by a study team member. In these cases, unforeseen
circumstances led the schools to conduct the lottery before the previously announced lottery date such that the observers were unable to visit the school to observe the lottery. In each case, we interviewed the staff who conducted the lottery to determine the methods used and whether any lottery procedures may have violated random assignment procedures. We concluded that the methods used by the schools were consistent with study principles.
A-13
Following the lottery, study charter schools admitted additional students from the waiting list as spaces became available. If some lottery winners declined the initial admission offer or did not appear on the first day of school, for example, the school offered admission to students at the top of the waiting list. Schools with formal procedures for students’ acceptance or rejection of admission offers made most of their subsequent admission offers before the start of the school year. Schools with informal processes often continued making offers a month or two into the school year. By that point, nearly all lottery participants who eventually received an offer of admission had received their offer.110
In Figure A.2, we present the results of study schools’ lotteries and waiting list admissions for sample members. We also show the flow of students for whom we obtained outcome data and were therefore included in the impact analysis. Overall, the study sample included 2,904 lottery participants of whom 43 percent were initial lottery winners and 57 percent were initial lottery losers. Following the lottery, schools made additional admission offers to 481 students from the waiting list. Thus, an ultimate 1,744 “lottery winners” received an admission offer and formed the treatment group. The remaining 1,160 students were “lottery losers” without an admission offer at any time; they formed the control group. In Table A.7, we demonstrate that while students offered admission from the waiting list were less likely to attend the study charter school than initial lottery winners in the analytic sample, a majority did enroll.
4. Definition of Treatment and Control Groups
As suggested in Figure A.2, the definition of treatment and control groups is straightforward. Students offered admission to study schools on the basis of lottery results—through either the lottery or a post-lottery admission offer—are members of the treatment group. Students who participated in the lotteries but never received an admission offer to a study charter school make up the control group. Given that the resulting distinction between the treatment and control groups was based on randomly ordered lottery lists, we expect no systematic differences between students in the two groups other than that those in the treatment group received an offer to attend a study charter school.111
In practice, two factors complicated the definition of treatment and control groups: (1) late offers and (2) dual applicants. Late offers were admission offers made to sample members on the waiting list in the second half of the 2005–2006 school year. Late offers were rare; the student population in most study charter schools was relatively stable after the first few weeks of the school year, and some school rules prohibited the admission of additional students after a pre-determined date early in the school year. Some schools (8 of the 36 participating schools), however, experienced student turnover during the middle of the year and thus admitted a few (1 to 4) additional students from their waiting lists in January or February of the school year.
110 In principle, charter schools could continue to offer admission to students on the waiting list as additional slots
opened during the entire school year. In practice, study charter schools admitted few students from their waiting lists after the first few months of the school year.
111 The study team carefully monitored the admission offers made by study charter schools to ensure that the offers followed the randomly ordered lottery/waiting lists.

A-14
Table A.7. Type of School Attended in Years 1 and 2, by Treatment Status and Timing of Admissions Offers
Lottery Winners
School Type (proportions) Lottery Losers All
Admitted at Lottery
Admitted Post-Lottery, Pre-
SY Admitted Post-SY
Year 1
Study charter school 0.06 0.79 0.82 0.76 0.62 Other charter school 0.09 0.03 0.03 0.02 0.04 Traditional public school 0.78 0.15 0.13 0.17 0.29 Private school 0.03 0.02 0.01 0.05a 0.05a Home school 0.02 0.00 0.00 0.00 0.00 Unknown 0.02 0.01 0.01 NRa NRa
Year 2
Study charter school 0.12 0.70 0.73 0.67 0.56 Other charter school 0.08 0.06 0.06 0.06 0.06 Traditional public school 0.68 0.19 0.17 0.18 0.32 Private school 0.03 0.02 0.01 0.04 0.03 Home school 0.02 0.00 0.00 0.00 0.00 Unknown 0.07 0.03 0.03 0.05 0.03
Sample Size 930 1,400 1,012 204 136
a The private school and unknown categories have been collapsed to prevent risk of disclosure. NR: Not Reported
We classified any admission offers made to sample members in the second half of the first follow-up school year as “late offers” and, for two reasons, included late entrants in the control group rather than in the treatment group. First, students who received late offers did not have access to the full treatment of a study charter school for the 2005–2006 school year. Many of the students who attended study charter schools after receiving a late offer had been attending the schools for only a month or two when the state assessments—a primary source of outcome data for the study.—were administered in the first follow-up year. Similarly, many of the same students had attended a study charter school for a short time when they and their parents were asked to complete, respectively, the student survey and the parent survey.
Second, the process used by study charter schools to make late offers appeared to be less formal than that used for making initial offers. Given that schools were attempting to fill slots that opened in the middle of the school year, they tried to enroll students as quickly as possible and often experienced difficulty in finding students willing to switch schools mid-year. As a result, schools often had to reach far down their waiting lists to find a student willing to attend the school. It is not clear whether schools gave students above a particular student on the waiting list a legitimate opportunity to attend the school. For example, a school might have called each student on the waiting list until it located a student who answered the telephone and voiced interest in the school.
In addition to the late offers, sample members in the control group—that is, students whose lottery result suggested no offer of admission to a study charter school—could have been admitted despite the lottery result. Overall, 6 percent of control group students—70 students—were admitted to a study charter school.
Dual applicants are defined as sample members who participated in the lottery of more than one study charter school. These students had an opportunity to receive an offer of admission to each

A-15
school to which they applied; as a result, their overall probability of attending a study charter school was higher than if they had applied to a single school. In our primary analysis, we treated the study charter schools with dual applicants as a single site. In particular, we combined two schools’ shared applicants into a single sample and defined any student offered admission at either school as a treatment group member. The control group at such sites included only students who did not receive an admission offer from either school. Sample weights accounted for dual applicants’ higher probability of admission at the site versus students who applied to only one of the two schools. Among study charter schools, 5 pairs shared dual applicants, with each pair of such schools treated as a single site.112 Overall, the study included 32 charter school sites and 218 dual applicants at 5 sites.
5. Data Collection
In Table A.8, we present two sets of response rates for the study. One set was based on the full study sample of 2,904 students. As described in Chapter II, however, our primary analysis sample was a subset of the full study sample and included only students for whom we had valid baseline test scores from the state assessment and who were in a site used in the primary impact analysis.113 The last three columns of Table A.8 present response rates for this analysis sample of 2,330 students.
In the analysis sample, the percentage of cases with valid test score data is just over 90 percent in Year 1 and just under 90 percent in Year 2. The percentage of cases with valid test scores is 5 to 7 percentage points higher among lottery winners than among lottery losers. For example, we have valid Year 2 mathematics scores for 90 percent of lottery winners and 84 percent of lottery losers. Similarly, the response rate on the parent survey and the student survey is somewhat higher among lottery winners than among lottery losers—85 versus 80 percent for the parent survey and 81 versus 73 percent for the student survey. The percentage of students in the sample who attended a school in which the principal completed a principal survey was 86 percent overall, including 92 percent among lottery winners and 77 percent among lottery losers.
112 In one case, two schools shared dual applicants in cohort 2, but only one of the schools also participated in the
study in cohort 1. In this case, the cohort 1 school was treated as one study charter school site while the cohort 2 sample at the same school and the school with which it shared dual applicants were treated as a separate site.
113 The primary impact analysis excluded sites if they had valid outcome data (1) for fewer than 5 lottery winners or lottery losers in the site; (2) for less than 50 percent of sample members in the site; or (3) for a proportion of lottery winners exceeding the proportion for lottery losers by more than 30 percentage points (or vice versa). For most outcomes, 3 of the 32 sites were excluded for one of these reasons. The definition of the analysis sample for Table A.7 excluded sample members from the same 3 sites (among those without valid baseline test score data).

A-16
Table A.8. Response Rates
Response Rate: Percentage of Sample Members
with Complete Data from This Source
Full Study Sample Analysis Samplec
Treatment Group
(Lottery Winners)
Control Group
(Lottery Losers) Total
Treatment Group
(Lottery Winners)
Control Group
(Lottery Losers) Total
Baseline Survey 92 89 91 92 90 91
Administrative Records Baseline Math Scores 82 81 81 100 100 100 Baseline Reading Scores 81 80 81 99 99 99 Year 1 Math Scores 88 77 84 94 89 92 Year 1Reading Scores 90 77 85 95 89 93 Year 2 Math Scores 87 74 82 90 84 88 Year 2Reading Scores 87 74 82 91 84 88
Parent Survey 85 79 82 85 80 83
Student Survey 80 72 77 81 73 78
Principal Survey—Study Schoolsa 92 77 86 92 77 86
Principal Survey—Nonstudy Charter Schools -- -- 70 -- -- --
Authorizer Survey -- -- 80 -- -- --
State Survey -- -- 80 -- -- --
Sample Size: Number of Students 1,744 1,160 2,904 1,400 930 2,330
Sample Size: Number of Nonstudy Charter Schools -- -- 457 -- -- 457
Sample Size: Number of Authorizers -- -- 25 -- -- 22
Sample Size: Number of States -- -- 15 -- -- 13 aStudy schools are those attended by students in the sample. The principal survey response rate for study schools is the percentage of students attending schools with a valid principal survey. bNonstudy schools are charter middle schools not participating in the study. The principal survey response rate for nonstudy schools is defined as the percentage of principals at nonstudy charter schools who completed a principal survey. cFor the student sample, the analysis sample consists of all students for whom we obtained baseline achievement scores. In addition, the analysis sample drops students from sites in which at least one of the following criteria was not met for a given set of outcomes: (1) at least five lottery winners and five lottery losers have valid data for key outcomes in that set; (2) there is a valid outcome measure for at least 50 percent of sample member in the site; and (3) the difference in the percentage of lottery winners and losers with valid outcome measures is no greater than 30 percentage points. The distinction between the full sample and analysis sample is not relevant for the nonstudy principal survey, authorizer survey, and state survey.

APPENDIX B
CALCULATION OF SAMPLE WEIGHTS

This page is intentionally left blank.

B-3
In Appendix B, we describe the calculation of individual-level sample weights for the study. We designed the weights to be applied to the basic impact model described in Chapter II and Appendix D. The weights account for the fact that different sample members have different likelihoods of winning the lottery and being selected into the treatment (and control) groups.
Although the process of calculating sample weights for the most basic charter school lottery was simple, several issues nonetheless complicated the calculations, including:
• Consent process. The study charter schools did not include all students who participated in the school lottery. Rather, the sample included only students whose parents gave consent for them to participate in the study; we had little information on the students whose parents did not give consent. Therefore, the calculations used to determine the sample weights (in particular, the calculation of the probability of admission) were based on only those lottery participants for whom we had consent rather than on all lottery participants.
• Siblings. When siblings applied to a participating charter school together, some schools automatically offered admission to a student if his or her sibling received a winning lottery draw. In effect, siblings applying together had a higher probability of being offered admission than non-siblings. Other schools used different procedures for dealing with sibling applicants.
• Stratification. A few participating charter schools held admission lotteries that were stratified by a student characteristic other than grade. Essentially, schools held separate lotteries for applicants with different characteristics, with a pre-determined number of lottery winners among each group of students. In these stratified lotteries, students with different characteristics may have had different probabilities of being offered admission.
• Dual applicants. Students sometimes applied to more than one participating charter school. If they applied to two charter schools, we accounted for the possibility that they could receive an admission offer to one of the study schools even if they lost the lottery at the other school. In effect, students who applied to two charter schools had a greater chance of being offered admission to a study school than those who applied to just one charter school.
In the remainder of this appendix, we describe the details of the calculation of sample weights. We first present the simple case, which involves no consent process (or a 100 percent consent rate), no stratification, no siblings, and no dual applicants. We then discuss the implications of each complicating factor.
A. The Simple Case
In the simple case, a charter school held a single, simple lottery to determine who would receive an offer of admission. All applicants to the school entered the lottery and had an equal chance of selection for admission. Schools gave no preference to applicants with siblings who also applied or for any other reason. No applicants also applied to another charter school in the study.
In the simple case, the sample weight for a given student was based on the probability that he or she ended up in the experimental group (that is, the treatment or control group) to which he or she was actually assigned. We used this probability to calculate each student’s base weight. Specifically, we set the base weights for treatment group members to the inverse probability of winning the

lottery and being selected into the treatment group. We set the base weights for control group members to the inverse probability of losing the lottery and being selected into the control group. To determine a student’s final sample weight, we multiplied the base weight by a normalization factor.
1. Base Weight
In the simple case, the probability of being selected into the treatment group was equal to the number of lottery participants offered admission to the charter school ( ) divided by the total number of lottery participants (N). The probability of selection into the control group was equal to 1 minus the probability of selection into the treatment group. If
TN
ip is defined as the probability of student i being selected into the treatment group, then the base weight for each treatment group member was:
(1) = =T Ti i
i
1 NBW , where pp N
The base weight for control group members was:
(2) Ci
i
1BW =1-p
2. Normalization Factor
We then needed to normalize the base weight to account for the fact that the sample at a site represents the set of all consenting lottery participants at that site. We set the normalization factor such that the weights of each experimental group sum to one-half of the total sample size within the site.114 Thus, the sum of all students’ weights within a site equaled the overall sample size in that site, with the sum of weights among treatments equal to the sum of weights among controls. The weight based on this normalization factor is called WT1. The normalization factor is defined as:
(3) ∑ ∑ ∑ ∑C CT T
T CT C
sum sumN NN N
T T C Csum i sum i
i=1 i=1 i=1 i=1i i
C T
0.5*N 0.5*NNF = & NF = , andW W
1 1 W = BW = & W = BW = p 1
where N =N-N . -p
Thus, formulas for the sample weights of the two groups are expressed as:
114 Defining the normalization factor in this way was appropriate because we generated separate impact estimates
for each site. If we were estimating a single impact estimate across all sites, the normalization factor would have to account for relative sample sizes and probabilities of admission across sites.
B-4

(4)
⎛ ⎞⎛ ⎞⎜ ⎟⎜ ⎟⎛ ⎞ ⎛ ⎞ ⎜ ⎟⎜ ⎟⎜ ⎟ ⎜ ⎟⎜ ⎟⎜ ⎟⎝ ⎠ ⎝ ⎠
⎜ ⎟ ⎜ ⎟⎝ ⎠ ⎝ ⎠∑ ∑
T C
T Ci iN N
i i
i ii=1 i=1
1 0.5*N 1 0.5*NW = * & W = *p 1-p1 1
p (1-p )
In the simple case, given that ip = p for all students, equation (4) simplifies to:
(5) ⎛ ⎞⎛ ⎞
⎛ ⎞ ⎛ ⎞ ⎜ ⎟⎜ ⎟⎜ ⎟ ⎜ ⎟ ⎜ ⎟⎜ ⎟⎝ ⎠ ⎝ ⎠⎜ ⎟ ⎜ ⎟
⎝ ⎠ ⎝ ⎠
T Ci i
T CT C
1 0.5*N 0.5*N 1 0.5*N 0.5*NW = * = & W = * =N Np N 1-pp (1-p)
N
If the treatment and control group are the same size in a site in the simple case (that is, p = 0.5), then the sample weight equals 1 for both treatment and control group members.
B. Complicating Factors
Among students who participated in the lottery, the true probability of their receiving an offer of admission to a charter school depended on the total number of lottery participants, the total number of students offered admission, and the various complicating factors described below.
1. The Consent Process
For each school in the study, we have full information on the number of lottery participants and which students were offered admission. Ideally, we would compute the probability of selection into the treatment group as the total number admitted divided by the total number of applicants. However, we do not have full information on the various complicating factors for students who did not receive parent consent. For example, among those with parent consent, we know with certainty which students are siblings who applied together, but among those without parent consent we do not know with certainty which students were siblings who applied together. Therefore, in determining sample weights, we based the calculation of students’ admission probabilities only on those students with parent consent.
This process resulted in the calculation of admission probabilities for individual students that may have differed slightly from the students’ actual admission probabilities. However, in the vast majority of cases, the process of obtaining parent consent concluded before the lottery.115 Thus, a student’s consent status was independent of his or her treatment status—in other words, whether or not we had parent consent for a student was not related to the student’s probability of receiving an offer of admission to a study charter school. Therefore, the resulting difference between the
115 The only exceptions to the rule of obtaining parent consent before the lottery occurred in cases in which both
our consent rate at the time of the lottery was fairly low and we were confident that we would succeed in (1) obtaining consent from a high proportion of all charter school applicants and (2) obtaining consent from a nearly equal proportion of treatment and control students. Among the study’s 36 charter schools, we collected consent during the post-lottery period from only 4 schools, for which, we obtained consent from between 85 and 90 percent of both treatment and control students.
B-5

B-6
probability of admission calculated with the process described above and the students’ true admission probabilities should be random.116
In the case of a simple lottery, for example, let us assume 100 lottery participants and 50 lottery winners with an offer of admission. We can further assume that, before the lottery, we obtained consent from 80 participants and that, by chance, 42 of them were lottery winners. In this case, the probability of admission for purposes of the study would be (42/80 = 0.525) rather than (50/100 = 0.50). In other words, the probability of an offer of admission would be slightly higher among students with consent than among all lottery participants at the school. Given the large number of charter schools in our study and our efforts to obtain consent before the lottery, it is likely that the probability of another school in the study offering admission would be slightly lower among students with consent than among all lottery participants. In other words, the overall probability of admission across all sites should be about the same among students with consent and all lottery participants.117
2. Sibling Preferences
In their lotteries, charter schools typically used one of three alternative approaches for dealing with siblings who apply together to the schools. The first is to treat sibling applicants no differently than any other (nonsibling) applicant to the school. The second approach is to treat the siblings as a single unit in the lottery. For example, if the school conducts the lottery by pulling students’ names (written on pieces of paper) from a hat, then both siblings’ names would be written on a single piece of paper, whereas each nonsibling would have his or her name written individually on a piece of paper. In this situation, the siblings would both be offered or denied admission to the school. In either of the first two cases, each sibling has exactly the same likelihood of admission to the school as each nonsibling.
The third approach is to enter each sibling into the lottery separately, just as with nonsiblings, but to offer admission to both siblings if either wins. For example, if student 1A receives a winning lottery draw but sibling 1B does not, then both 1A and 1B receive an offer of admission. If a school gives a sibling preference in this manner, siblings have a higher probability than nonsiblings of receiving an admission offer.
In sites with sibling preference rules, the basic approach to calculating sample weight was the same as in the simple case above. The difference, however, lay in the calculation of the probability of admission. No longer could we simply use the number of students offered admission divided by the number of lottery participants. The exact probabilities of admission differed for siblings and nonsiblings and depended on the number of sets of siblings who participated in the lottery as well as on the number of students in each sibling set.
Consider the case of one set of twins applying to a charter school with a sibling preference rule.118 Among the N lottery participants is one set of siblings (1A and 1B). The probability that
116 By contrast, if we attempted to calculate admission probabilities based on all lottery participants without full
information on which students were siblings, the resulting admission probabilities would have differed from the true admission probabilities in ways that could be related to student characteristics.
117 In our study schools, the probability of receiving an offer of admission was roughly 40 percent among both students with parent consent and all lottery participants.
118 For purposes of this explanation, we assume that each set of siblings contains only two students.

each sibling will receive an offer of admission to the school is equal to the probability that either wins the lottery.119 In particular:
(6){ } { }{ } { } { }
{ } { }
=
+ −
⎛ ⎞ ⎛ ⎞+ −⎜ ⎟ ⎜ ⎟⎝ ⎠ ⎝ ⎠
Pr Admission Pr 1A or 1B gets winning draw
=Pr 1A wins Pr 1B wins Pr Both win
= Pr 1A wins * Pr 1B wins | 1A wins
sib
T TN NN N
Thus,
(7) { } −⎛ ⎞ ⎛ ⎞⎛−⎜ ⎟ ⎜ ⎟⎜⎞⎟−⎝ ⎠ ⎝ ⎠⎝
1 Pr Admission = 2*1
sib T T TN N NN N N ⎠
For nonsiblings, the probability of receiving an offer of admission to the school is expressed as:
(8) { } { } { }
{ } {
non-siblingPr Admission = Pr Adm | no siblings admitted * Pr no siblings admitted +
Pr Adm | 1 set of siblings admitted * Pr 1 set of siblings admitted}
(9) ( ) ( )⎛ ⎞ ⎛ ⎞⎜ ⎟ ⎜ ⎟⎝ ⎠ ⎝ ⎠
non-sibling sibling siblingT TN N -2p = * 1-p + * pN-2 N-2
When the lottery participants at a school include two sets of siblings, the situation is more complicated because the probability that one set of siblings is admitted depends on what happens to the other set. Suppose, for example, that a school has 100 applicants, including 2 sets of siblings, and offers admission to 50 students. Assume that the first set of siblings receives either good (less than 50) or poor lottery draws (over 50). In this case, the second set of siblings is offered admission if either member of the pair gets a draw of 50 or below. However, if the first set of siblings gets one good draw and one poor draw, then only draws 1 to 49 will be winning draws for the second set of siblings. If one member of the second set of siblings draws 50 (and the other above 50), then neither will receive an admission offer because the school will have already offered admission to 50 students—those with lottery draws 1 through 49 plus the sibling with the poor draw.
This scenario can be represented with 1A and 1B representing the lottery draws of the first set of siblings and 2A and 2B representing the lottery draws of the second set of siblings as follows:
(10) { }
{ }
sib=Pr (1A<= 50 or 1B<=50) & [(2A<=50 & 2B<=50) or (2A>50 & 2B>50)]
+ Pr (1A<= 49 or 1B<=49) & [(2A<=50 & 2B>50) or (2A>50 & 2B<=50)]
p
B-7
119 An issue arises if a sibling is selected to receive the last admission offer to the school and the student’s brother
or sister had not yet received an offer. In this situation, a school with a sibling preference rule could either admit both students or admit only the sibling with the winning lottery draw and place the other student at the top of the waiting list. We observed schools that would have followed each of these procedures if they had faced such a situation. However, we never observed a case in which a sibling received the last offer of admission; therefore, none of the schools in the study had to implement such procedures. For purposes of calculating sample weights, we assume that, if a sibling were to receive a school’s last admission offer, his or her brother or sister would receive an admission offer.

In general terms, equation (10) may be written as:
(11)
−− −⎡ ⎤⎡ ⎤ ⎛ ⎞ ⎛ ⎞⎛ ⎞ ⎛ ⎞ ⎛ ⎞ ⎛ ⎞ ⎛ ⎞= − +⎜ ⎟ ⎜ ⎟ ⎜ ⎟ ⎜ ⎟ ⎜ ⎟ ⎜ ⎟ ⎜ ⎟⎢ ⎥⎢ ⎥− −⎝ ⎠ ⎝ ⎠ ⎝ ⎠ ⎝ ⎠ ⎝ ⎠ ⎝ ⎠ ⎝ ⎠⎣ ⎦ −⎣ ⎦− − − ⎡ ⎤⎡ ⎤ ⎛ ⎞⎛ ⎞ ⎛ ⎞ ⎛ ⎞ ⎛ ⎞−⎜ ⎟ ⎜ ⎟ ⎜ ⎟ ⎜ ⎟ ⎜ ⎟⎢ ⎥⎢ ⎥− −⎝ ⎠ ⎝ ⎠ ⎝ ⎠ ⎝ ⎠ ⎝ ⎠⎣ ⎦ ⎣ ⎦
11 12 * * * * *1 1
1 1 2 + 2 * * * 2 * *1 1
sibling C CT T T T T
CT T T T
N NN N N N NpN N N N N N N
NN N N NN N N N N
1
For nonsiblings in cases with two sets of sibling applicants, the probability of receiving an offer of admission is:
(12) { } { }
{ } {{ }
− = Pr Adm | no siblings admitted * Pr no sibl
}ings admitted +
Pr Adm | 1 set of siblings admitted * Pr 1 set siblings +
Pr Adm | 2 sets of siblings *
non siblingp
{ }Pr 2 sets of siblings
The calculation of this probability is analogous to the case of one set of siblings (equation 9).
Most of the study schools in our sample had no more than two sets of siblings. In cases with more than two sets of siblings, the calculation of probabilities of admission must account for additional contingencies and thus are much more complex. Therefore, in cases with more than two sets of siblings, we made a simplifying assumption in our calculation of the probability of admission for siblings; we estimated the expected number of siblings that would be offered admission to the school despite a losing lottery draw. We then assumed that only those students with lottery draws within the top * spots had a winning draw, where * was equal to the total number of students offered admission minus the expected number of siblings “pulled in” to the school despite a losing draw.
TN TN
For example, suppose we assumed there were three sets of siblings rather than two sets of siblings in the case described above. For any given set of siblings, the probability that one sibling would be pulled in to the school despite a losing lottery draw was:
(13) ⎛ ⎞⎛ ⎞ ⎛ ⎞ ⎛ ⎞= =⎜ ⎟ ⎜ ⎟ ⎜ ⎟⎜ ⎟−⎝ ⎠ ⎝ ⎠ ⎝ ⎠⎝ ⎠T
Pr{sibling pulled in} = Pr{1 sibling gets losing draw and 1 gets winning draw}N 50 50 = 2* * 2 * * 0.505N 1 100 99
CNN
Given the three sets of siblings, the expected number of siblings pulled into the school is 3*(0.505) = 1.515. For a given set of siblings, the expected number of the other two sets of siblings pulled into the school is 2*(0.505) = 1.010. Thus, for nonsiblings, rather than for students who receive an admission offer with the top 50 lottery draws, only those with the top 48.485 lottery draws receive an offer of admission. The probability of admission for nonsiblings would be 48.485/98.485 = 0.492.120 In the case of siblings, both will be admitted if either gets a lottery draw of 48.990 or below. With have two chances of such a draw, their admission probability would be 2*(48.990/98.990) - (48.990/98.990)*(47.990/97.990) = 0.747.
120 The denominator does not include the siblings for whom we have assumed admission.
B-8

3. Stratification
In stratified lotteries, schools determine the number of spots to be filled by students with particular characteristics and then hold separate lotteries for students with those characteristics. For example, a school with 75 male applicants and 85 female applicants may wish to ensure that its incoming class of 100 has equal numbers of males and females and therefore may conduct a lottery stratified by gender. In effect, the school conducts separate lotteries for males and females and selects 50 winners in each lottery.
Assigning sample weights to sample members at schools that use stratified lottery procedures is analogous to assigning sample weights at schools that use simple lottery procedures. Initially, we would calculate the probabilities of admission and base weights separately by gender (or according to the definition of the separate strata) and then calculate single normalization factors for all treatment group students and for all control group students.
In our example, the calculation of sample weights for control group students would proceed as follows:
Males: ip = (50/75) = 0.667
TiBW = 1 / 0.667 = 1.500
ciBW = 1 / 0.333 = 3.000
Females: ip = (50/85) = 0.588
TiBW = 1 / 0.588 = 1.700
CiBW = 1 / 0.412 = 2.429
Normalization factor: TsumW = 50*(1.500) + 50*(1.700) = 160
CsumW = 25*(3.000) + 35*(2.429) = 160
= 0.5*160 / 160 = 0.5 TNF
= 0.5*160 / 160 = 0.5 CNF
Sample weights: | Male = (1.500)*(0.5) = 0.750 T
iW
| Female = (1.700)*(0.5) = 0.850 TiW
| Male = (3.000)*(0.5) = 1.500 CiW
| Female = (2.429)*(0.5) = 1.214 CiW
Because the treatment group has an equal number of males and females but the control group has more females than males, the weights equalize the proportion of males (and females) in the sample by making the weighted proportions of males in both the treatment and control groups equal to the proportion of males in the applicant pool as a whole (and similarly for the proportion female).
B-9
In particular, the weighted proportion of the treatment group that is male is 46.875 percent, as is the weighted proportion of males in the control group (and in the applicant pool).
Two schools in the study used a stratified process for selecting students who would initially be offered admission to the school and then used a nonstratified process for placing students on the waiting list in random order. Given that some of the waiting list students received an offer of admission to the school before the beginning of the school year, the process represented a combination stratified/nonstratified lottery. In this case, the approach to calculating sample weights was similar to the case of the purely stratified lottery. The primary difference was that the calculation of the probability of receiving an admission offer was more complicated. In particular, the probability had to be split into (1) the probability of initially winning the lottery within a given stratum and (2) the probability of losing the initial lottery but then being pulled in from the nonstratified waiting list.
4. Dual Applicants
In several cases, sample members entered the lotteries of more than one study charter school. We refer to these sample members as dual applicants. Some dual applicants applied to one study school as well as to a second school that initially agreed to participate in the study but then offered admission to all students on its waiting list and thus was dropped from the study. In other words, we eliminated from our sample all students who participated in both schools’ lotteries; the students had a 100 percent chance of receiving an admission offer to a charter school that was initially in the study. The dropped students included students who also applied to the first charter school (the school that remained in the study because it did not go through its waiting list).121
In a few cases, sets of schools that shared dual applicants remained in the study. In these cases, we treated the schools sharing dual applicants as a single site in our analysis and considered them a single unit of analysis in the calculation of sample weights. In particular, we combined the two schools’ applicants into a single sample and defined as a treatment group member any student offered admission at either school. The control group included only those students who “lost the lottery” at both schools and did not receive an admission offer from either.
The calculation of sample weights is again based on the simple case, as shown for the case of treatment students:
(14)
⎛ ⎞⎜ ⎟⎛ ⎞⎜ ⎟⎜ ⎟⎜ ⎟⎝ ⎠⎜ ⎟⎝ ⎠∑
T
T T Ti i N
ii
i=1
1 0.5*NW =BW *NF = *p 1/p
where ip = Pr{student i is offered admission to school A or school B} = Pr{A or B}
Aside from pooling the sample across the two sites, the key piece of the formula affected by the presence of dual applicants is the probability of membership in the treatment group—that is, the probability of receiving an admission offer to either school. Given that the lotteries of the two
121 The number of dual applicants dropped from the sample for this reason was small.
B-10
B-11
schools are independent, we can use the following relationship to calculate a dual applicant’s probability of admission:
(15) Pr{A or B} = Pr{A} + Pr{B} – Pr{A and B} = Pr{A} + Pr{B} – Pr{A}Pr{B}
For students who applied to only one school, two of the terms on the right hand side of equation (10) will be 0 and disappear. Dual applicants, however, will have a higher probability of treatment group membership in that they may win the lottery at either school A or school B.
5. Other Issues
Aside from siblings, stratification, and dual applicants, other issues may arise in charter school lotteries that affect the calculation of sample weights. At one school, for example, two students were inadvertently entered twice in the lottery and thus had a higher probability of selection into the sample than students entered once. The treatment of such a case is similar to (though not exactly the same as) the treatment of siblings. The calculation of sample weights must then reflect the probability of an admission offer to the school for each control group student.

APPENDIX C
OUTCOME MEASURES FOR THE IMPACT ANALYSIS

This page is intentionally left blank.

C-3
In Appendix C, we describe the outcome measures for the analysis of study charter school impacts and, in Table C.1, the full set of outcomes and their sources. In Table C.2, we array the means, standard deviations, and sample sizes for all outcomes as well as the reliability coefficients for index variables.122 Below, we provide further detail on the construction of each outcome variable.
A. Student Achievement
The primary goal of the impact analysis was to assess the effect of study charter schools on student achievement. To measure student achievement, we relied on student test scores from state assessments in the first and second years following the charter school admission lotteries. With sample members spread across 15 states, each of which administered a different assessment, we had to convert test scores to a comparable scale for the analysis. Accordingly, we converted all scores to z-scores, defined as a student’s raw score on the state assessment minus the mean score on the test among all students in the same state, grade, and year who took the test, divided by the standard deviation of the scores for that same group. The z-scores reflect students’ scores on the state assessment relative to the typical student in the same state and grade.
B. State Proficiency Levels
In addition to estimating impacts on average student achievement as measured by z-scores, we estimated impacts on the percentage of students at each site who met various state-defined standards (“advanced,” “proficient,” “partially proficient,” or “unsatisfactory”) in reading and mathematics.123 In some cases, state proficiency levels corresponded directly with the study proficiency categories. In other cases, the levels needed to be recoded to fit the categories. In the third column of Table C.3, we display the correspondence of proficiency levels in each of 38 states and the District of Columbia with an eligible charter middle school during the study period to the four study proficiency categories of the proficiency outcome variables used in the impact analysis.
As shown in Table C.3, some states (Georgia, Delaware, and Texas in the 2004–2005 school year) used only three proficiency levels. For these states, we linked the levels to the most closely related level from our list. Therefore, in these states, the category that was not mapped to a state proficiency level contained no students.
As a sensitivity check of our definition of proficiency levels and to create a parsimonious set of categories for use as covariates in the impact models, we defined alternative three-level versions of
122 We measured the internal consistency reliability of index variables by using Cronbach’s alpha (Crocker and
Algina 1986). Scales with alpha values above 0.70 are generally considered to have a satisfactory level of reliability (Nunnally 1978). We dropped from the analysis five index variables with Cronbach’s alpha coefficients lower than 0.45 because their reliability was well below the 0.70 threshold. The variables included indexes measuring student victimization, parent-reported good behavior, parent-reported bad behavior, number of sources of help outside class for struggling students, and student-reported academic difficulty. Estimates based on index variables with alpha values between 0.45 and 0.70 should be examined with caution.
123 As noted in chapter II, an increase in the percentage meeting a particular standard may not represent the same gain in achievement across states, as standards vary from state to state. Nonetheless, this measure is policy relevant and can provide a sense of how well students are meeting standards defined by their own state. Thus, while proficiency is not our primary measure of student achievement, it represents a measure of achievement that is familiar to practitioners. For a comprehensive analysis of this issue, see Bandeira de Mello et al. (2009)

C-4
the proficiency variables (“high,” “medium,” and “low”). In the final column of Table C.3, we display the correspondence of proficiency levels in each state in the study to the three proficiency categories used in the alternative versions of the proficiency variables.
C. Other Measures of Academic Performance
Other measures of academic performance in the analysis included number of days absent in the first and second follow-up years, whether the student was late to school five or more days, and whether the student was promoted to the next grade at the end of the first and second follow-up years. We collected information on absences and promotions from school records. We constructed the variable on whether the student was late to school five or more days on the basis of the number of days late to school as reported in the student survey.
In order to ease the interpretation of the results, we did not use transformations for potentially-skewed measures (such as absences) in our main estimates. However, for the six outcomes with a skewness measure where the absolute value is greater than 1 (listed below), we used visual tests (histograms and box plots) to confirm they were non-normally distributed. We then used the “ladder” command in Stata to select the appropriate transformation for each of the six outcomes based on the resulting chi-square value. Replacing the original versions of these outcomes with the transformed versions did not affect any of our conclusions (our results were robust to potential skewness).
Outcome Skewness
Number days absent in Year 1 4.1
Number of days absent in Year 2 2.1
Index of parent concerns about student 3.5
Student-reported bad behavior index 1.2
Grade student gives to school -1.3
Parent-reported index of school problems 1.7
D. Student Effort in School
Measures of student effort in school included a binary variable indicating that the student reported completing homework “mostly” or “always,” a binary variable indicating that the student reported completing homework “always,” and a binary variable indicating that the student’s parent agreed or strongly agreed with the statement that the student worked hard at school.

C-5
Table C.1. Outcome Measures for the Charter School Impact Evaluation
Domain Outcome Measure Variable Type Source
Student Achievement Year 1 state reading assessment z-scores Continuous School records Year 2 state reading assessment z-scores Continuous School records Year 1 state math assessment z-scores Continuous School records Year 2 state math assessment z-scores Continuous School records
State Proficiency Levels Year 1 Reading Whether scored at “advanced” level or higher Binary School records Whether scored at “proficient” level or higher Binary School records Whether scored at “partially proficient” level or higher Binary
Year 2 Reading School records Whether scored at “advanced” level or higher Binary School records Whether scored at “proficient” level or higher Binary School records Whether scored at “partially proficient” level or higher Binary School records
Year 1 Math Whether scored at “advanced” level or higher Binary School records Whether scored at “proficient” level or higher Binary School records Whether scored at “partially proficient” level or higher Binary
Year 2 Math School records Whether scored at “advanced” level or higher Binary School records Whether scored at “proficient” level or higher Binary School records Whether scored at “partially proficient” level or higher Binary School records
Other Measures of Academic Performance Number of days absent in Year 1 Continuousa School records Number of days absent in Year 2 Continuousa School records Late to school 5 or more days Binarya Student survey e Promotion to next grade in Year 1 Binary School records Promotion to next grade in Year 2 Binary School records
Student Effort in School Whether student reports completing homework “mostly” or ”always” Binary Student survey Whether student reports completing homework “always” Binary Student survey Whether parent reports that student works hard Binary Parent surveyb
Other Measures of Student Well-Being Whether student expects to attend college Binary Student survey Whether parent expects student to attend college Binary Parent surveyc Count of extracurricular activities Sum of binaries Student survey e Parent report of how well-adjusted student is Continuous [1-4] Parent surveyb Index of parent concerns about student Continuous [1-3]a Parent surveyb
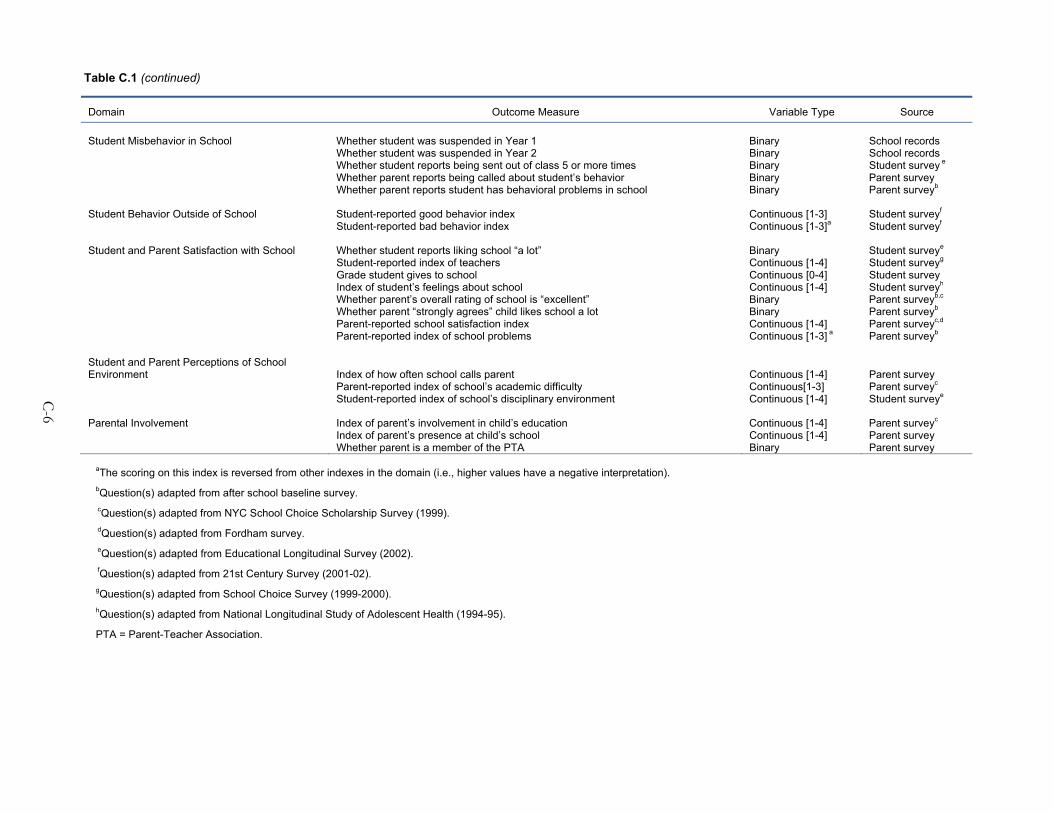
Table C.1 (continued)
C-6
Source Domain Outcome Measure Variable Type
Student Misbehavior in School Whether student was suspended in Year 1 Binary School records Whether student was suspended in Year 2 Binary School records Whether student reports being sent out of class 5 or more times Binary Student survey e Whether parent reports being called about student’s behavior Binary Parent survey Whether parent reports student has behavioral problems in school Binary Parent surveyb
Student Behavior Outside of School Student-reported good behavior index Continuous [1-3] Student surveyf Student-reported bad behavior index Continuous [1-3]a Student surveyf
Student and Parent Satisfaction with School Whether student reports liking school “a lot” Binary Student surveye Student-reported index of teachers Continuous [1-4] Student surveyg Grade student gives to school Continuous [0-4] Student survey Index of student’s feelings about school Continuous [1-4] Student surveyh Whether parent’s overall rating of school is “excellent” Binary Parent surveyb,c Whether parent “strongly agrees” child likes school a lot Binary Parent surveyb Parent-reported school satisfaction index Continuous [1-4] Parent surveyc,d Parent-reported index of school problems Continuous [1-3] a Parent surveyb
Student and Parent Perceptions of School Environment Index of how often school calls parent Continuous [1-4] Parent survey Parent-reported index of school’s academic difficulty Continuous[1-3] Parent surveyc Student-reported index of school’s disciplinary environment Continuous [1-4] Student surveye
Parental Involvement Index of parent’s involvement in child’s education Continuous [1-4] Parent surveyc Index of parent’s presence at child’s school Continuous [1-4] Parent survey Whether parent is a member of the PTA Binary Parent survey
aThe scoring on this index is reversed from other indexes in the domain (i.e., higher values have a negative interpretation). bQuestion(s) adapted from after school baseline survey. cQuestion(s) adapted from NYC School Choice Scholarship Survey (1999). dQuestion(s) adapted from Fordham survey. eQuestion(s) adapted from Educational Longitudinal Survey (2002). fQuestion(s) adapted from 21st Century Survey (2001-02). gQuestion(s) adapted from School Choice Survey (1999-2000). hQuestion(s) adapted from National Longitudinal Study of Adolescent Health (1994-95).
PTA = Parent-Teacher Association.
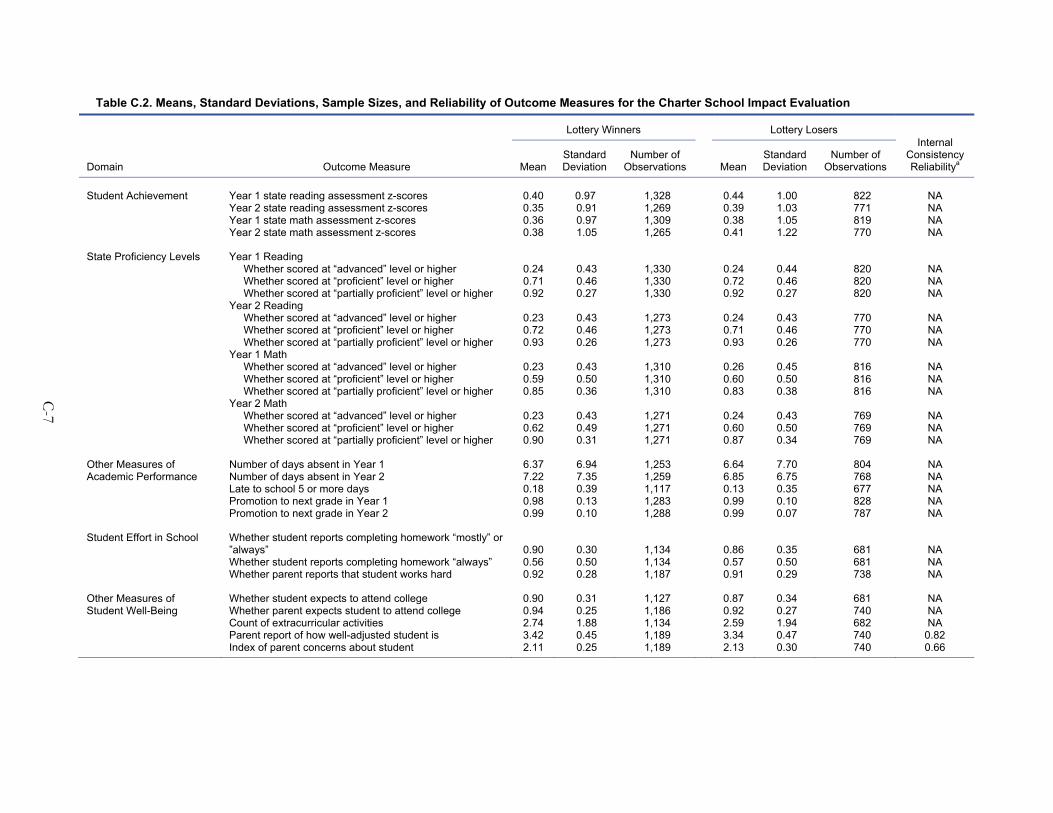
C-7
Table C.2. Means, Standard Deviations, Sample Sizes, and Reliability of Outcome Measures for the Charter School Impact Evaluation
Lottery Winners Lottery Losers Internal
Consistency Reliabilitya Domain Outcome Measure Mean
Standard Deviation
Number of Observations Mean
Standard Deviation
Number of Observations
Student Achievement Year 1 state reading assessment z-scores 0.40 0.97 1,328 0.44 1.00 822 NA Year 2 state reading assessment z-scores 0.35 0.91 1,269 0.39 1.03 771 NA Year 1 state math assessment z-scores 0.36 0.97 1,309 0.38 1.05 819 NA Year 2 state math assessment z-scores 0.38 1.05 1,265 0.41 1.22 770 NA
State Proficiency Levels Year 1 Reading Whether scored at “advanced” level or higher 0.24 0.43 1,330 0.24 0.44 820 NA Whether scored at “proficient” level or higher 0.71 0.46 1,330 0.72 0.46 820 NA Whether scored at “partially proficient” level or higher 0.92 0.27 1,330 0.92 0.27 820 NA
Year 2 Reading Whether scored at “advanced” level or higher 0.23 0.43 1,273 0.24 0.43 770 NA Whether scored at “proficient” level or higher 0.72 0.46 1,273 0.71 0.46 770 NA Whether scored at “partially proficient” level or higher 0.93 0.26 1,273 0.93 0.26 770 NA
Year 1 Math Whether scored at “advanced” level or higher 0.23 0.43 1,310 0.26 0.45 816 NA Whether scored at “proficient” level or higher 0.59 0.50 1,310 0.60 0.50 816 NA Whether scored at “partially proficient” level or higher 0.85 0.36 1,310 0.83 0.38 816 NA
Year 2 Math Whether scored at “advanced” level or higher 0.23 0.43 1,271 0.24 0.43 769 NA Whether scored at “proficient” level or higher 0.62 0.49 1,271 0.60 0.50 769 NA Whether scored at “partially proficient” level or higher 0.90 0.31 1,271 0.87 0.34 769 NA
Other Measures of Academic Performance
Number of days absent in Year 1 6.37 6.94 1,253 6.64 7.70 804 NA Number of days absent in Year 2 7.22 7.35 1,259 6.85 6.75 768 NA Late to school 5 or more days 0.18 0.39 1,117 0.13 0.35 677 NA Promotion to next grade in Year 1 0.98 0.13 1,283 0.99 0.10 828 NA Promotion to next grade in Year 2 0.99 0.10 1,288 0.99 0.07 787 NA
Student Effort in School Whether student reports completing homework “mostly” or ”always” 0.90 0.30 1,134 0.86 0.35 681 NA Whether student reports completing homework “always” 0.56 0.50 1,134 0.57 0.50 681 NA Whether parent reports that student works hard 0.92 0.28 1,187 0.91 0.29 738 NA
Other Measures of Student Well-Being
Whether student expects to attend college 0.90 0.31 1,127 0.87 0.34 681 NA Whether parent expects student to attend college 0.94 0.25 1,186 0.92 0.27 740 NA Count of extracurricular activities 2.74 1.88 1,134 2.59 1.94 682 NA Parent report of how well-adjusted student is 3.42 0.45 1,189 3.34 0.47 740 0.82 Index of parent concerns about student 2.11 0.25 1,189 2.13 0.30 740 0.66

C-8
Lottery Losers Internal
Consistency Reliabilitya
Lottery Winners
Domain Outcome Measure Standard Deviation
Number of Observations Mean
Standard Deviation
Number of Observations Mean
Student Misbehavior in School
Whether student was suspended in Year 1 0.04 0.20 1,253 0.04 0.19 804 NA Whether student was suspended in Year 2 0.05 0.22 1,261 0.06 0.24 776 NA Whether student reports being sent out of class 5 or more times 0.22 0.42 1,131 0.19 0.40 682 NA Whether parent reports being called about student’s behavior 0.26 0.45 1,190 0.23 0.43 739 NA Whether parent reports student has behavioral problems in school 0.09 0.24 1,189 0.09 0.22 739 NA
Student Behavior Outside of School
Student-reported good behavior index 2.26 0.39 1,134 2.27 0.38 682 0.58 Student-reported bad behavior index 1.17 0.15 1,134 1.18 0.16 682 0.49
Student and Parent Satisfaction with School
Whether student reports liking school “a lot” 0.75 0.44 1,134 0.62 0.49 682 NA Student-reported index of teachers 3.42 0.41 1,134 3.33 0.42 682 0.78 Grade student gives to school 3.41 0.46 1,134 3.37 0.52 682 0.81 Index of student’s feelings about school 3.44 0.47 1,134 3.32 0.49 682 0.86 Whether parent’s overall rating of school is “excellent” 0.71 0.46 1,168 0.37 0.49 735 NA Whether parent “strongly agrees” child likes school a lot 0.50 0.51 1,188 0.39 0.50 740 NA Parent-reported school satisfaction index 3.40 0.41 1,186 3.11 0.45 742 0.93 Parent-reported index of school problems 1.28 0.46 1,169 1.46 0.56 729 0.94
Student and Parent Perceptions of School Environment
Index of how often school calls parent 0.71 0.56 1,191 0.54 0.46 740 0.48 Parent-reported index of school’s academic difficulty 1.99 0.27 1,190 1.92 0.37 744 0.61 Student-reported index of school’s disciplinary environment 3.22 0.44 1,134 3.13 0.45 681 0.65
Parental Involvement Index of parent’s involvement in child’s education 2.80 0.55 1,190 2.79 0.59 742 0.63 Index of parent’s presence at child’s school 1.86 0.59 1,188 1.75 0.64 740 0.58
Whether parent is a member of the PTA 0.32 0.48 1,185 0.39 0.50 739 NA Note: Sample includes students in main analysis sample (students with non-missing baseline test score data in the sites included in the main impact analyses). Means and
standard deviations are estimated at the site-level and averaged across sites, giving equal weight to each site. Estimates are weighted to account for differential probabilities of assignment to the treatment and control groups in each site.
aReliability was estimated by Cronbach's alpha coefficient.
NA = Not applicable. PTA = Parent-Teacher Association.
Table C.2 (continued)
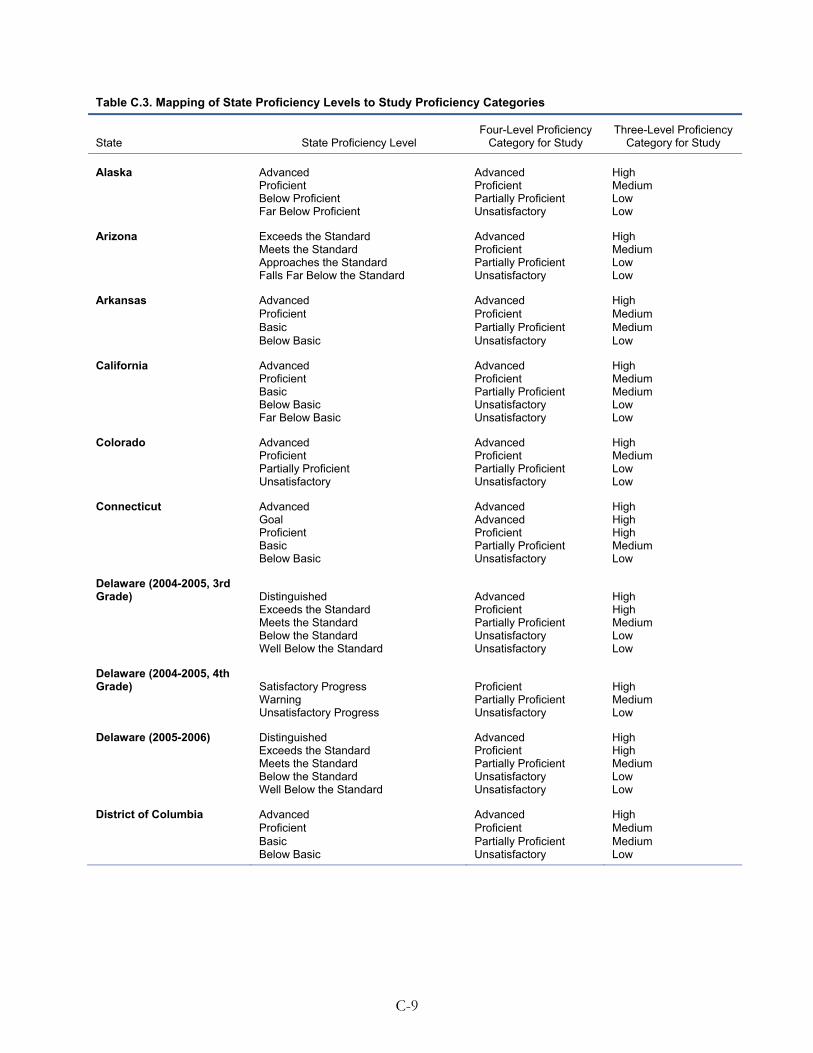
C-9
Table C.3. Mapping of State Proficiency Levels to Study Proficiency Categories
State State Proficiency Level Four-Level Proficiency
Category for Study Three-Level Proficiency
Category for Study
Alaska Advanced Advanced High Proficient Proficient Medium Below Proficient Partially Proficient Low Far Below Proficient Unsatisfactory Low
Arizona Exceeds the Standard Advanced High Meets the Standard Proficient Medium Approaches the Standard Partially Proficient Low Falls Far Below the Standard Unsatisfactory Low
Arkansas Advanced Advanced High Proficient Proficient Medium Basic Partially Proficient Medium Below Basic Unsatisfactory Low
California Advanced Advanced High Proficient Proficient Medium Basic Partially Proficient Medium Below Basic Unsatisfactory Low Far Below Basic Unsatisfactory Low
Colorado Advanced Advanced High Proficient Proficient Medium Partially Proficient Partially Proficient Low Unsatisfactory Unsatisfactory Low
Connecticut Advanced Advanced High Goal Advanced High Proficient Proficient High Basic Partially Proficient Medium Below Basic Unsatisfactory Low
Delaware (2004-2005, 3rd Grade) Distinguished Advanced High Exceeds the Standard Proficient High Meets the Standard Partially Proficient Medium Below the Standard Unsatisfactory Low Well Below the Standard Unsatisfactory Low
Delaware (2004-2005, 4th Grade) Satisfactory Progress Proficient High Warning Partially Proficient Medium Unsatisfactory Progress Unsatisfactory Low
Delaware (2005-2006) Distinguished Advanced High Exceeds the Standard Proficient High Meets the Standard Partially Proficient Medium Below the Standard Unsatisfactory Low Well Below the Standard Unsatisfactory Low
District of Columbia Advanced Advanced High Proficient Proficient Medium Basic Partially Proficient Medium Below Basic Unsatisfactory Low

Table C.3 (continued)
C-10
Three-Level Proficiency Category for Study
Four-Level Proficiency Category for Study State State Proficiency Level
Florida Answers most questions correctly, including most challenging questions Advanced High
Answers some questions correctly, some success with most challenging questions Proficient Medium
Answers many questions correctly, less successful with most challenging questions Partially Proficient Medium
Limited success with test content Unsatisfactory Low Little success with test content Unsatisfactory Low
Georgia Advanced Advanced High Proficient Proficient Medium Did Not Meet Unsatisfactory Low
Hawaii Exceeds the Standard Advanced High Meets the Standard Proficient Medium Approaches the Standard Partially Proficient Low Well Below the Standard Unsatisfactory Low
Idaho Advanced Advanced High Proficient Proficient Medium Basic Partially Proficient Medium Below Basic Unsatisfactory Low
Illinois Exceeds Standards Advanced High Meets Standards Proficient Medium Below Standards Partially Proficient Low Academic Warning Unsatisfactory Low
Indiana Pass Plus Advanced High Above the Standard Proficient Medium Below the Standard Unsatisfactory Low Undetermined
Kansas Exemplary Advanced High Advanced Advanced High Proficient Proficient Medium Basic Partially Proficient Low Unsatisfactory Unsatisfactory Low
Kentucky Master Advanced High Proficient Proficient Medium Apprentice Partially Proficient Medium Novice Unsatisfactory Low
Louisiana Advanced Advanced High Mastery Advanced High Basic Proficient Medium Approaching Basic Partially Proficient Low Unsatisfactory Unsatisfactory Low
Maryland Advanced Advanced High Proficient Proficient Medium Basic Unsatisfactory Low

Table C.3 (continued)
C-11
Three-Level Proficiency Category for Study
Four-Level Proficiency Category for Study State State Proficiency Level
Massachusetts Advanced (Grades 4–8) Advanced High Above Proficient (Grade 3 only) Advanced High Proficient Proficient Medium Needs improvement Partially Proficient Low Warning (failing—grades 3–8) Unsatisfactory Low Incomplete Advanced alternate assessment Advanced High Proficient alternate assessment Proficient Medium
Needs improvement on alternate assessment Partially Proficient Low
Warning alternate assessment Unsatisfactory Low Absent Medically Documented Absence
Michigan Exceeds the Standard Advanced High Meets the Standard Proficient Medium Basic Partially Proficient Low Apprentice Unsatisfactory Low
Minnesota (MCA-I) Superior performance beyond grade level Advanced High
Working above grade level Proficient High Solid grade level skills Partially Proficient Medium Partial knowledge and skills Partially Proficient Low Gaps in knowledge and skills Unsatisfactory Low
Minnesota (MCA-II) Exceeds the standards Advanced High Meets the standards Proficient Medium Partially meets the standards Partially Proficient Low Does not meet the standards Unsatisfactory Low
Mississippi Advanced Advanced High Proficient Proficient Medium Basic Partially Proficient Medium Minimal Unsatisfactory Low
Missouri Advanced Advanced High Proficient Proficient Medium Basic Partially Proficient Medium Below Basic Unsatisfactory Low
Nevada Exceeds the standards Advanced High Meets the standards Proficient Medium Approaches the standards Partially Proficient Low Emergent/Developing Unsatisfactory Low
New Hampshire Proficient with Distinction Advanced High Proficient Proficient Medium Partially Proficient Partially Proficient Medium Substantially Below Proficiency Unsatisfactory Low
New Jersey Advanced Proficient Advanced High Proficient Proficient Medium Partially Proficient Unsatisfactory Low
New Mexico Advanced Advanced High Proficient Proficient Medium Nearing Proficiency Partially Proficient Low Beginning Step Unsatisfactory Low
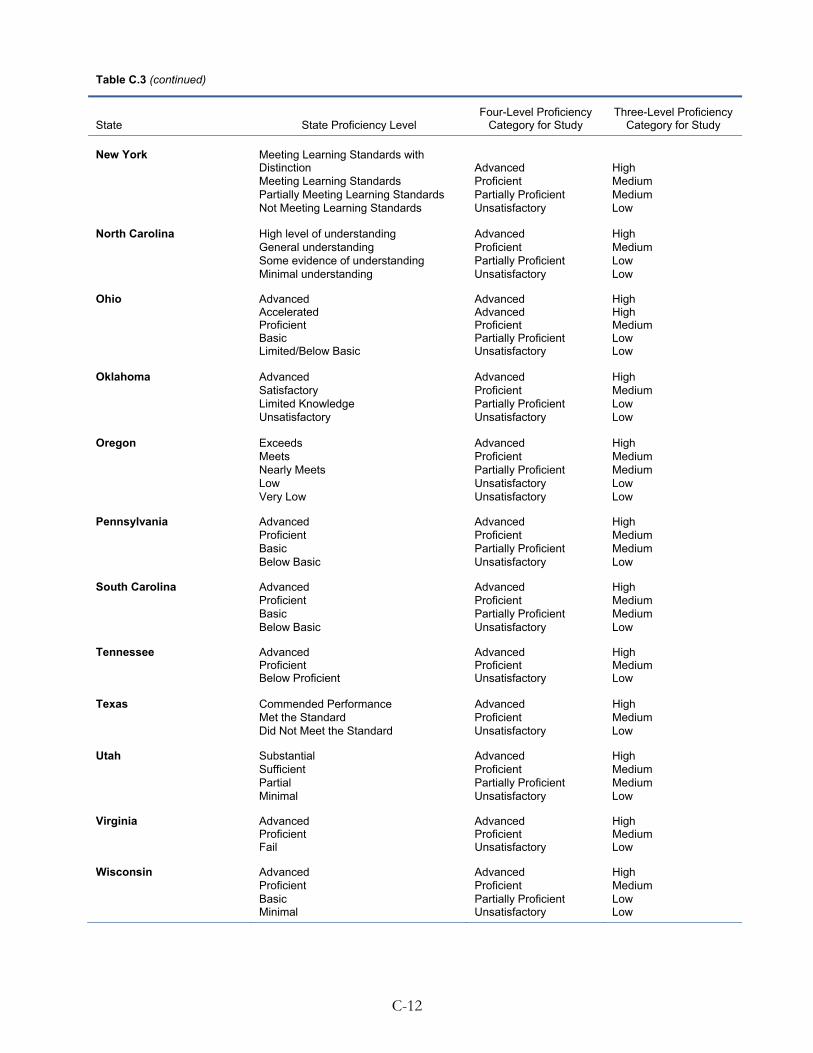
Table C.3 (continued)
C-12
Three-Level Proficiency Category for Study
Four-Level Proficiency Category for Study State State Proficiency Level
New York Meeting Learning Standards with Distinction Advanced High
Meeting Learning Standards Proficient Medium Partially Meeting Learning Standards Partially Proficient Medium Not Meeting Learning Standards Unsatisfactory Low
North Carolina High level of understanding Advanced High General understanding Proficient Medium Some evidence of understanding Partially Proficient Low Minimal understanding Unsatisfactory Low
Ohio Advanced Advanced High Accelerated Advanced High Proficient Proficient Medium Basic Partially Proficient Low Limited/Below Basic Unsatisfactory Low
Oklahoma Advanced Advanced High Satisfactory Proficient Medium Limited Knowledge Partially Proficient Low Unsatisfactory Unsatisfactory Low
Oregon Exceeds Advanced High Meets Proficient Medium Nearly Meets Partially Proficient Medium Low Unsatisfactory Low Very Low Unsatisfactory Low
Pennsylvania Advanced Advanced High Proficient Proficient Medium Basic Partially Proficient Medium Below Basic Unsatisfactory Low
South Carolina Advanced Advanced High Proficient Proficient Medium Basic Partially Proficient Medium Below Basic Unsatisfactory Low
Tennessee Advanced Advanced High Proficient Proficient Medium Below Proficient Unsatisfactory Low
Texas Commended Performance Advanced High Met the Standard Proficient Medium Did Not Meet the Standard Unsatisfactory Low
Utah Substantial Advanced High Sufficient Proficient Medium Partial Partially Proficient Medium Minimal Unsatisfactory Low
Virginia Advanced Advanced High Proficient Proficient Medium Fail Unsatisfactory Low
Wisconsin Advanced Advanced High Proficient Proficient Medium Basic Partially Proficient Low Minimal Unsatisfactory Low

C-13
E. Other Measures of Student Well-Being
Other measures of student well-being included a binary variable indicating that the student reported that he or she expected to attend college and a binary variable indicating that the parent expected the student to attend college. In addition, well-being measures included count variables and indexes measuring extracurricular activity participation, parent reports of the degree to which the student is well adjusted, and parent concerns about the student.
1. Parent Reports of the Degree to Which the Student Is Well Adjusted
We constructed the measure by calculating the mean of nonmissing values of the following six variables from the parent survey after their codes had been reversed (4 = “strongly agree” and 1 = “strongly disagree”):
E1. For each of the following statements, please tell me whether you “strongly agree,” “agree,” “disagree,” or “strongly disagree.”
SELECT ONLY ONE ON EACH LINE
STRONGLY
AGREE AGREE DISAGREE STRONGLY DISAGREE
DON’T KNOW REFUSED
a. (He/She) gets along with others
1 2 3 4 d R
b. (He/She) likes school
1 2 3 4 d R
c. (He/She) works hard at school
1 2 3 4 d R
d. (He/She) is self-confident
1 2 3 4 d R
e. (He/She) is creative 1 2 3 4 d R
f. (He/She) is happy 1 2 3 4 d R
2. Student Participation in Extracurricular Activities
We constructed this count measure by calculating the sum of nonmissing values from the following 12 questions in the student survey:
C1. Please tell me whether you participate in any of the following activities at school, outside of your normal classes? If your school does not offer any of the following activities, just say “not available.” First, do you participate in . . .

C-14
SELECT ONLY ONE ON EACH LINE
YES NO
NOT AVAILABLE
DON’T KNOW REFUSED
a. Student government 1 0 n/a D R
b. Band, orchestra, chorus or choir 1 0 n/a D r
c. School plays or musicals 1 0 n/a D r
d. The National Junior Honor Society or other academic honor society
1 0 n/a D r
e. Organized sports or exercise 1 0 n/a D r
f. A school yearbook, newspaper or magazine 1 0 n/a D r
g. Community service activities 1 0 n/a D r
h. A computer club 1 0 n/a D r
i. Other academic clubs, such as a math club or foreign language club
1 0 n/a D r
ib. Other types of clubs, for example, an arts or crafts club, drama club, or games club
1 0 n/a D r
j. Tutoring 1 0 n/a D r
k. Any other activities at school which I have not already mentioned
1 0 n/a D R
3. Parent Concerns About Student
We constructed this measure by calculating the mean of nonmissing values of the following five variables from the parent survey after their codes had been reversed (3 = “big problem” and 1= “not a problem”):124
E2. For each of the following statements, please tell me if it is “a big problem,” “a small problem,” or “not a problem” with (STUDENT NAME) in or out of school.
124 The Cronbach’s alpha value of 0.66 for the index is below the standard reliability threshold of 0.70, suggesting
that the results based on this index should be interpreted with caution. However, impacts on all five individual items are consistent in sign and significance level with impacts on the index itself.

C-15
SELECT ONLY ONE ON EACH LINE
BIG
PROBLEM SMALL
PROBLEM NOT A
PROBLEM DON’T KNOW REFUSED
a. Getting into trouble 1 2 3 d R
b. Smoking, drinking alcohol or using drugs
1 2 3 d R
c. The friends (he/she) has chosen 1 2 3 d R
d. (His/Her) academic achievement 1 2 3 d R
e. (His/Her) safety 1 2 3 d R
F. Student Misbehavior in School
Measures of student misbehavior in school included binary variables indicating whether the student was suspended in the first or second follow-up years (based on information from school records data), whether the student reported that he or she was asked to leave a class five or more times due to misbehavior, whether the parent reported calls received about the student’s misbehavior in school, and whether the parent reported that the student had behavior problems in school.
G. Student Behavior Outside School
Measures of student behavior outside school included two indexes—a student-reported good behavior index and a student-reported bad behavior index.
1. Student-Reported Good Behavior
We constructed this measure by calculating the mean of nonmissing values of the following five questions in the student survey:125
D3. Please tell me whether you do each of the following things “often,” “sometimes,” or “never.” First . . .
125 The Cronbach’s alpha value of 0.58 for the index is below the standard reliability threshold of 0.70, suggesting
that the results based on this index should be interpreted with caution. However, impacts on all five individual items are consistent in sign and significance level with impacts on the index itself.

C-16
SELECT ONLY ONE ON EACH LINE
OFTEN SOMETIMES NEVER
DON’T KNOW REFUSED
a. Help another student with school work 1 2 3 d r
b. Help your parents or guardians with chores
1 2 3 d r
c. Help people in your local community, for example, help a neighbor, or do volunteer work
1 2 3 d r
d. Read for fun 1 2 3 d r
e. Go to the library 1 2 3 d r
2. Student-Reported Bad Behavior
We constructed this measure by calculating the mean of nonmissing values of the following 10 questions in the student survey:126
D2. Now please could you tell me whether you do each of the following things “often,” “sometimes,” or “never.” First . . .
SELECT ONLY ONE ON EACH LINE
OFTEN SOMETIMES NEVER
DON’T KNOW REFUSED
a. Argue with your parents or guardians 1 2 3 d r
b. Lie to your parents or guardians 1 2 3 d r
c. Give a teacher a hard time 1 2 3 d r
d. Break something on purpose 1 2 3 d r
e. Punch or hit someone in anger 1 2 3 d r
f. Take something from a store without paying for it
1 2 3 d r
g. Drink alcohol 1 2 3 d r
h. Smoke cigarettes 1 2 3 d r
i. Use marijuana or other drugs 1 2 3 d R
j. Get arrested or held by police 1 2 3 d R
H. Students’ and Parents’ Satisfaction with School
Measures of students’ and parents’ satisfaction with school included a binary variable indicating that the student reported liking school a lot, a student-reported index reflecting the views of teachers, an index reflecting the grade that students gave their schools, an index reflecting the student’s feelings about his or her school, a binary variable indicating that parents rated a student’s
126 The Cronbach’s alpha value of 0.49 for the index is below the standard reliability threshold of 0.70, suggesting
that the results based on this index should be interpreted with caution. However, impacts on 9 of 10 individual items are consistent in sign and significance level with impacts on the index itself.

C-17
school as excellent, a binary variable indicating that parents strongly agreed with the statement that their child liked school a lot, and indexes reflecting parents’ satisfaction with a student’s school and parents’ perceptions of problems in the school. In addition, we constructed a composite measure that combined all eight student and parent satisfaction measures.
1. Students’ Opinion of Teachers
We constructed this measure by calculating the mean of nonmissing values of the following six variables from the student survey after their codes had been reversed (4 = “strongly agree” and 1 = “strongly disagree”):
A2. These next statements are about your teachers (this/last year) at school. Again please tell me whether you “strongly agree,” “agree,” “disagree,” or “strongly disagree.” First . . .
SELECT ONLY ONE ON EACH LINE
STRONGLY AGREE AGREE DISAGREE
STRONGLY DISAGREE
DON’T KNOW REFUSED
a. They are available for help
1 2 3 4 d r
b. They listen to what I have to say
1 2 3 4 d r
c. They give corrections and suggestions for improvement
1 2 3 4 d r
d. They care about students 1 2 3 4 d r
e. They encourage me to think about my future
1 2 3 4 d r
f. Their classes are challenging
1 2 3 4 d r
2. Grade Student Gives to School
We constructed this measure by calculating the mean of nonmissing values of the following 11 variables from the student survey after their codes had been reversed and reduced by 1 (4 = “A” and 0 = “E or F”):
A6. Please give each of the following things at your school a grade between “A” and “F,” where “A” means “excellent,” “B” means “good,” “C” means “okay or average,” “D” means “poor or not very good,” and “E or F” means you would “fail it.” If it is not something available at your school, just say “not available.” First . . .

C-18
SELECT ONLY ONE ON EACH LINE
A B C D E OR F NOT AVAILABLE
DON’T KNOW REFUSED
a. The school building and rooms 1 2 3 4 5 d r
b. The gymnasium, sports fields and equipment for physical education
1 2 3 4 5 n/a d r
c. The library at school 1 2 3 4 5 n/a d r
d. Technology at your school, for example, computers
1 2 3 4 5 n/a d r
e. Activities at school, outside of your normal classes. For example, before school, at lunchtime or after school
1 2 3 4 5 n/a d r
f. The sports program at school 1 2 3 4 5 n/a d r
g. The arts program at school 1 2 3 4 5 n/a d r
h. The music program at school 1 2 3 4 5 n/a d r
i. School lunches 1 2 3 4 5 n/a d r
j. Your Math class 1 2 3 4 5 d r
k. Your Language Arts class 1 2 3 4 5 d r
PROBE: This may be called humanities.
l. The principal 1 2 3 4 5 d r
3. Parents’ Satisfaction with School
We constructed this measure by calculating the mean of nonmissing values of the following 18 variables from the parent survey after their codes had been reversed (4 = “very satisfied” and 1 = “very dissatisfied”):
D2. For each of the following features of the school (he/she) (currently attends/attended last year), please tell me whether you (are/were) “very satisfied,” “satisfied,” “dissatisfied,” or “very dissatisfied.”

C-19
SELECT ONE ON EACH LINE
VERY SATISFIED SATISFIED DISSATISFIED
VERY DISSATISFIED
DON’T KNOW REFUSED
NOT APPLICABLE
a. The location of the school 1 2 3 4 d r
b. The class sizes 1 2 3 4 d r
c. School safety 1 2 3 4 d r
d. The size of the school 1 2 3 4 d r
e. School facilities 1 2 3 4 d r
f. Technology at the school 1 2 3 4 d r n
i. The quality of the school’s English or Language Arts instruction.
PROBE: This may also be called Humanities.
1 2 3 4 d r
j. The quality of the school’s Math instruction 1 2 3 4 d r
k. The curriculum, in other words, what the school teaches 1 2 3 4 d r
l. The amount this child is learning at this school 1 2 3 4 d r
m. Teaching methods and philosophy used at the school 1 2 3 4 d r
n. The level of attention given to students by teachers 1 2 3 4 d r
o. The level of discipline at the school 1 2 3 4 d r
p. The school’s ‘mission’ or aims 1 2 3 4 d r
q. Your level of communication with teachers and the principal 1 2 3 4 d r
r. How much the school involves parents 1 2 3 4 d r
s. The stability and future prospects of this school 1 2 3 4 d r
t. The make-up of the student body, for example, the gender, racial, ethnic and economic mix of the students 1 2 3 4 d r
4. Parents’ Perceptions of Problems in School
We constructed this measure by calculating the mean of nonmissing values of the following nine variables from the parent survey after their codes had been reversed (3 = “a big problem” and 1 = “not a problem”):

C-20
D1. For each of the following issues, please tell me if you feel it is “a big problem,” “a small problem,” or “not a problem.” If you don’t know about a certain issue, just let me know.
SELECT ONE ON EACH LINE
A BIG PROBLEM
A SMALL PROBLEM
NOT A PROBLEM
DON’T KNOW REFUSED
a. Students destroying property 1 2 3 d r
b. Students being late for school 1 2 3 d r
c. Students missing classes 1 2 3 d r
d. Fighting 1 2 3 d r
e. Bullying 1 2 3 d r
f. Cheating 1 2 3 d r
g. Racial conflict 1 2 3 d r
h. Guns or other weapons at school 1 2 3 d r
i. Drugs or alcohol at school 1 2 3 d r
5. Composite Measure of Students’ and Parents’ Satisfaction
We constructed the composite measure of students’ and parents’ satisfaction by calculating the mean of all eight student and parent satisfaction measures, each rescaled to range from 1 to 5. In addition to the rescaling, the parent-reported index of school problems was reverse-coded so that higher values indicated a more positive outcome, thereby ensuring consistency with the other seven measures.
I. Students’ and Parents’ Perceptions of School Environment
Measures of students’ and parents’ perceptions of the school environment included indexes reflecting how often the school calls the parent, parent reports of the school’s academic difficulty, and student reports of the school’s academic environment.
1. How Often School Calls Parent
We constructed this measure by calculating the mean of nonmissing values of the following five questions from the parent survey;127
C6. For each of the following, please tell me if it happened “not at all,” “1 to 3 times,” “4 to 6 times,” “7 to 10 times,” or “more than 10 times” (this/last) school year. How many times (has/did) (STUDENT NAME’S) school contact(ed) you, either by mail or telephone, regarding (his/her) . . .
127 The Cronbach’s alpha value of 0.48 for the index is below the standard reliability threshold of 0.70, suggesting
that the results based on this index should be interpreted with caution. However, impacts on all five individual items are consistent in sign, and impacts on two of the five items are consistent in significance level, with impacts on the index itself.

SELECT ONE ON EACH LINE
NOT AT
ALL 1 TO 3 TIMES
4 TO 6 TIMES
7 TO 10 TIMES
MORE THAN 10 TIMES
DON’T KNOW REFUSED
a. Schoolwork? 0 1 2 3 4 d r
b. Behavioral problems? 0 1 2 3 4 d r
c. Attendance problems? 0 1 2 3 4 D r
d. Classes or schedule for the current or upcoming school year?
0 1 2 3 4 D r
e. Placement in special courses or programs at school?
0 1 2 3 4 D r
2. Parents’ Report of School’s Academic Difficulty
We constructed this measure by calculating the mean of nonmissing values of the following three variables from the parent survey after their codes had been reversed (3 = “too difficult” and 1 = “too easy”):128
B4. Do you think the homework (is/was) . . .
SELECT ONLY ONE
Too difficult, .................................................................1
About right, or ..............................................................2
Too easy? .......................................................................3
DON’T KNOW ..........................................................d
REFUSED ....................................................................r
B5b. Do you think the material covered in (his/her) Math class is . . .
SELECT ONLY ONE
Too difficult, .................................................................1
About right, or ..............................................................2 GO TO B6
Too easy? .......................................................................3 GO TO B5d
DON’T KNOW ..........................................................d GO TO B6 REFUSED ....................................................................r
128 The Cronbach’s alpha value of 0.61 for the index is below the standard reliability threshold of 0.70, suggesting
that the results based on this index should be interpreted with caution. However, impacts on all three individual items are consistent in sign, and impacts on two of the three items are consistent in significance level, with impacts on the index itself.
C-21

B6b. Do you think the material covered in (his/her) Language Arts class is . . .
PROBE: This may also be called Humanities.
SELECT ONLY ONE
Too difficult, .................................................................... 1
About right, or ................................................................. 2 GO TO B7
Too easy? .......................................................................... 3 GO TO B6d
DON’T KNOW ............................................................. d GO TO B7
REFUSED ....................................................................... r
3. Students’ Perception of School’s Disciplinary Environment
We constructed this measure by calculating the mean of nonmissing values of the following four variables from the student survey after their codes had been reversed (4 = “strongly agree” and 1 = “strongly disagree”):129
129 The Cronbach’s alpha value of 0.65 for the index is below the standard reliability threshold of 0.70, suggesting
that the results based on this index should be interpreted with caution. However, impacts on all four individual items are consistent in sign, and impacts on three of the four items are consistent in significance level, with impacts on the index itself.
C-22

C-23
A1. For each of the following statements about the rules (this/last year) at your school, please tell me whether you “strongly agree,” “agree,” “disagree,” or “strongly disagree.” First . . .
SELECT ONLY ONE ON EACH LINE
STRONGLY AGREE AGREE DISAGREE
STRONGLY DISAGREE
DON’T KNOW REFUSED
a. Everyone knows what the school rules are
1 2 3 4 d r
b. The school rules are fair 1 2 3 4 d r
c. The punishment for breaking school rules is the same no matter who you are
1 2 3 4 d r
d. If a school rule is broken, students know what the punishment will be
1 2 3 4 d r
J. Parent Involvement
1. Parent-Reported Involvement in Child’s Education
We constructed this measure by calculating the mean of nonmissing values of the following five questions in the parent survey:130
C1. In a typical month during the school year, how often (do/did) you or another family member talk with this child about (his/her) experiences in school? Would you say . . .
Seldom or never, ..........................................................1
Once or twice a month, ..............................................2
Once or twice a week, or ............................................3
Almost everyday? .........................................................4
DON’T KNOW ..........................................................d
REFUSED ....................................................................r
130 The Cronbach’s alpha value of 0.63 for the index is below the standard reliability threshold of 0.70, suggesting
that the results based on this index should be interpreted with caution.

C2a. In a typical month during the school year, how often (do/did) you or another family member help this child with (his/her) homework? Would you say . . .
Seldom or never, ..........................................................1
Once or twice a month, ..............................................2
Once or twice a week, or ............................................3
Almost everyday? .........................................................4 GO TO C3
DON’T KNOW ..........................................................d
REFUSED ....................................................................r
C3. In a typical month during the school year, how many times (do/did) you, or another adult family member . . .
SELECT ONE ON EACH LINE
SELDOM OR
NEVER
ONCE OR TWICE A MONTH
ONCE OR TWICE A
WEEK ALMOST
EVERY DAY DON’T KNOW REFUSED
a. Check over (his/her) homework or check to see that it was done?
1 2 3 4 D r
c. Help this child with reading or math that was not part of (his/her) homework?
1 2 3 4 D r
d. Contact the Principal, teacher or other staff member at (his/her) school regarding (his/her) academic performance?
1 2 3 4 d r
2. Parents’ Presence at Child’s School
We constructed this measure by calculating the mean of nonmissing values of the following two questions in the parent survey:131
C3. In a typical month during the school year, how many times (do/did) you or another adult family member . . .
C-24
131 The Cronbach’s alpha value of 0.58 for the index is below the standard reliability threshold of 0.70, suggesting
that the results based on this index should be interpreted with caution. However, impacts on both individual items are consistent in sign and significance level with impacts on the index itself.

C-25
SELECT ONE ON EACH LINE
SELDOM OR
NEVER
ONCE OR TWICE A MONTH
ONCE OR TWICE A
WEEK ALMOST
EVERY DAY DON’T KNOW REFUSED
b. Attend school activities? 1 2 3 4 D r
e. Volunteer at (his/her) school?
1 2 3 4 D r

APPENDIX D
ANALYTIC METHODS

This page is intentionally left blank.

D-3
In Appendix D, we provide additional detail on the analytic methods used for the evaluation as described briefly in Chapter II. In Section A, we discuss the estimation of study charter school impacts; in Section B, we discuss our non-experimental analysis of the factors associated with study charter school impacts.
A. Analysis of Charter School Impacts
Below, we provide details on the estimation of charter school impacts, including (1) statistical adjustment for multiple hypothesis testing, (2) statistical power for the analysis, (3) estimation of the impact of charter school admission, (4) estimation of the impact of charter school attendance, (5) impact estimation for sample subgroups, and (6) sensitivity tests of the main impact results.
1. Statistical Adjustment for Multiple Hypothesis Testing
Estimating impacts on more than one outcome or for multiple sample subgroups increases the likelihood of finding spurious, statistically significant impact estimates if standard statistical tests are applied to each outcome or subgroup without adjusting for the fact that multiple hypothesis tests are being conducted. Accordingly, the National Center for Education Evaluation’s (NCEE) guidelines (Schochet 2008) recommend that researchers first divide all outcomes into domains based on the underlying concepts measured. The guidelines then recommend that researchers specify which of the domains or sample subgroups will be included in “confirmatory” analyses for rigorous testing of the study’s central hypotheses and which will be included in less rigorous “exploratory” analyses for examining relationships in the data and identifying hypotheses for future analysis.132 The guidelines state that statistical adjustments for multiple testing must be made both within and across domains in the confirmatory analysis; however, such adjustments are not required for the exploratory analyses.
In following the guidelines, we divided study outcome measures into 10 domains (Appendix Table C.1). Given that the evaluation’s primary goal is to estimate the impact of study charter schools on student achievement, we defined student achievement as the sole domain in the study’s confirmatory analysis. We considered impacts on all other outcome domains, as well as impact estimates for population subgroups, as the domains of the exploratory analysis.
We used the Benjamini-Hochberg (1995) procedure to adjust for multiple hypothesis testing within each outcome domain for both the confirmatory and exploratory analyses (although not required by the NCEE guidelines for the exploratory analysis). For the confirmatory analysis, if at least one impact in the student achievement domain remained positive and statistically significant and no impacts were negative and statistically significant after applying the Benjamini-Hochberg procedure, we concluded that the charter schools had a positive impact in that domain.
For the subgroup analyses, we adjusted for multiple hypothesis testing within each subgroup by using the Benjamini-Hochberg procedure. For example, within the male subgroup, we adjusted for the fact that we were estimating impacts on four main test score outcomes (reading and mathematics
132 As stated in NCEE guidelines, “[T]he goal of exploratory analysis is to identify hypotheses that could be subject
to more rigorous future examination, but cannot be examined in the present study because they were not identified ahead of time or statistical power was deemed to be insufficient. Results from post hoc analyses are not automatically invalid, but, irrespective of plausibility or statistical significance, they should be regarded as preliminary and unreliable unless they can be rigorously tested and replicated in future studies” (Schochet 2008).

D-4
assessment scores in the first and second years following the admission lotteries). We also adjusted for multiple hypothesis testing within the estimated differences in impacts across subgroups within a set. For example, when we estimated the difference in impacts between males and females, we accounted for the fact that we were estimating the differences for four main test score outcomes. However, given that the subgroup analyses are exploratory, we did not adjust for multiple hypothesis testing across all subgroups examined—that is, we did not adjust for the fact that, by examining impacts on four outcomes across 10 subgroups, we were conducting 40 hypothesis tests.133
2. Statistical Power for the Impact Analysis
During the study’s design phase, we conducted power calculations to determine minimal detectable effects in order to assess the adequacy of the study sample and design for detecting charter school impacts of a reasonable magnitude. The MDE is the smallest true impact that would have a high probability (or statistical power) of being found statistically significant with a given study sample and design. With student achievement comprising the sole set of outcomes for the confirmatory analysis, we focused on MDEs for the main test score outcome measures. We present MDEs based on the original power analysis conducted with projected design parameters such as the number of schools and students included in the sample and design features such as the explanatory power of the control variables included in the estimation model. We also revised the calculations to present MDEs for the realized values of these design parameters. The updated (but not the original) power calculations also account for the fact that our primary significance tests include statistical adjustments for multiple hypothesis testing.
Both sets of power calculations reflect our use of a two-tailed t-test and a 5 percent critical value to assess statistical significance of the impact estimates. Calculations are based on an 80 percent level of statistical power. In each case, we assume fixed site effects, reflecting the fact that the study charter schools were purposively selected and the study’s estimates are representative of only the participating charter schools.
We present two design scenarios from the original power analysis; one assumed a sample of 25 study charter schools and a total sample of 1,200 students with valid outcome data; the other assumed a sample of 50 study charter schools and a total sample of 2,400 students with valid outcome data. In both cases, we assumed an equal split in the student sample between the control group of lottery losers and the treatment group of lottery winners. In addition, we assumed an average participation rate (the percentage of students admitted to a study charter school who chose to attend) of 80 percent, an average crossover rate (the percentage of students denied admission to a study charter school via lottery who still attended the school) of 0 percent, an R2 value from the impact model of 0.50, and no adjustment for multiple hypothesis testing.
For the realized design parameters of the study’s final evaluation, we averaged parameter values for students with nonmissing data for the four main student achievement outcomes. The parameters
133 We considered the analysis of factors related to impacts (discussed in Section B) even more exploratory than the
estimation of impacts on secondary outcomes or the subgroup impact analysis. The reason was that the factors related to impacts focused on the simple relationships between study charter school site characteristics and impact estimates. The correlations could have been caused by unobserved factors not accounted for in our analysis. Given the highly exploratory nature of the analysis, we did not adjust for multiple-hypothesis testing in the analysis of factors related to impacts.
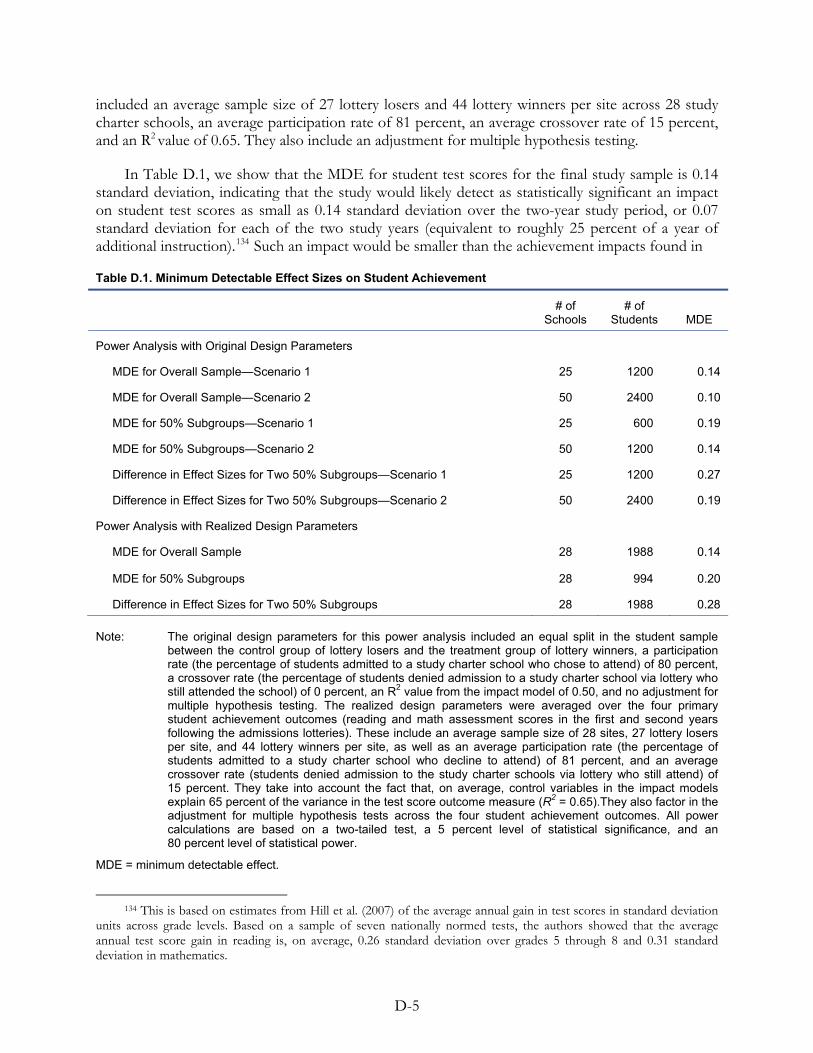
D-5
included an average sample size of 27 lottery losers and 44 lottery winners per site across 28 study charter schools, an average participation rate of 81 percent, an average crossover rate of 15 percent, and an R2 value of 0.65. They also include an adjustment for multiple hypothesis testing.
In Table D.1, we show that the MDE for student test scores for the final study sample is 0.14 standard deviation, indicating that the study would likely detect as statistically significant an impact on student test scores as small as 0.14 standard deviation over the two-year study period, or 0.07 standard deviation for each of the two study years (equivalent to roughly 25 percent of a year of additional instruction).134 Such an impact would be smaller than the achievement impacts found in
Table D.1. Minimum Detectable Effect Sizes on Student Achievement
# of
Schools # of
Students MDE
Power Analysis with Original Design Parameters
MDE for Overall Sample—Scenario 1 25 1200 0.14
MDE for Overall Sample—Scenario 2 50 2400 0.10
MDE for 50% Subgroups—Scenario 1 25 600 0.19
MDE for 50% Subgroups—Scenario 2 50 1200 0.14
Difference in Effect Sizes for Two 50% Subgroups—Scenario 1 25 1200 0.27
Difference in Effect Sizes for Two 50% Subgroups—Scenario 2 50 2400 0.19
Power Analysis with Realized Design Parameters
MDE for Overall Sample 28 1988 0.14
MDE for 50% Subgroups 28 994 0.20
Difference in Effect Sizes for Two 50% Subgroups 28 1988 0.28 Note: The original design parameters for this power analysis included an equal split in the student sample
between the control group of lottery losers and the treatment group of lottery winners, a participation rate (the percentage of students admitted to a study charter school who chose to attend) of 80 percent, a crossover rate (the percentage of students denied admission to a study charter school via lottery who still attended the school) of 0 percent, an R2 value from the impact model of 0.50, and no adjustment for multiple hypothesis testing. The realized design parameters were averaged over the four primary student achievement outcomes (reading and math assessment scores in the first and second years following the admissions lotteries). These include an average sample size of 28 sites, 27 lottery losers per site, and 44 lottery winners per site, as well as an average participation rate (the percentage of students admitted to a study charter school who decline to attend) of 81 percent, and an average crossover rate (students denied admission to the study charter schools via lottery who still attend) of 15 percent. They take into account the fact that, on average, control variables in the impact models explain 65 percent of the variance in the test score outcome measure (R2 = 0.65).They also factor in the adjustment for multiple hypothesis tests across the four student achievement outcomes. All power calculations are based on a two-tailed test, a 5 percent level of statistical significance, and an 80 percent level of statistical power.
MDE = minimum detectable effect.
134 This is based on estimates from Hill et al. (2007) of the average annual gain in test scores in standard deviation
units across grade levels. Based on a sample of seven nationally normed tests, the authors showed that the average annual test score gain in reading is, on average, 0.26 standard deviation over grades 5 through 8 and 0.31 standard deviation in mathematics.

two recent lottery-based studies (Abdulkadiroglu et al. 2009; Dobbie and Fryer 2009) and is similar to the original MDE calculation for the design scenario that included 25 charter schools.
The MDE for a subgroup of 50 percent of the student or school sample is 0.20 standard deviation over the two-year study period and applies to the subgroup estimates for four key subgroup analyses—race, gender, baseline mathematics achievement scores, and baseline reading achievement scores (each of which consists of approximately 50 percent of the study sample. The other student subgroup of interest is students’ eligibility for free or reduced-price meals. These students make up just over one-third of the overall study sample, and the MDE for a 33 percent subgroup based on the realized study parameters is 0.24. Finally, we conducted statistical tests involving the differences between the estimated impact for one subgroup and the estimated impact for a second subgroup (for example, the difference between the estimated impacts for males and females). The minimum detectable difference in impacts for two 50 percent subgroups is 0.28 standard deviation.135
3. Estimating the Impact of Charter School Admission
To generate intent-to-treat (ITT) estimates of the impact of study charter school admission on various outcomes, we first estimated the impacts in each study site and then averaged them to obtain an overall impact estimate, as described below.
a. Estimating Site-Level Impacts
To estimate site-level ITT impacts, we used a regression model that compared the mean outcomes of lottery winners to those of lottery losers, allowing the impact estimates to vary for each site. The basic form of the model is:
(1) ij j ij j ij ijy X Tα β δ ε= + + + ,
where is the outcome of interest for student i in site j; ijy jα is a site-specific intercept; ijX is a vector of characteristics of student i in site j; is a binary variable for treatment status, indicating whether student i won the admission lottery in site j;
ijT
ijε is a random error term that reflects the influence of unobserved factors on the outcome; and β and jδ are parameters or vectors of parameters to be estimated. As the estimated coefficient on treatment status in site j, jδ , represents the impact of admission to a charter school in site j. The model implicitly assumes that the control variables influence the key outcomes in the same way across all study sites. We weighted observations in the regression model to account for unequal selection probabilities (Appendix B).136 The estimated standard errors from the model account for these sample weights.
135 As noted, all of the calculations based on realized design parameters take into account the adjustment for multiple hypothesis tests in the student achievement domain. Without such adjustment, MDEs are 0.12 for the full sample and 0.16 for a 50 percent subgroup, and the minimum detectable difference between two 50 percent subgroups is 0.23 standard deviation.
136 The use of sample weights ensures that the overall composition of the treatment group aggregated across sites (in terms of baseline characteristics) is the same as that of the control group regardless of the number of students in each group who participated in a given lottery. For example, in a lottery with few winners and many losers, the winners would
D-6

D-7
In Table D.2, we list the full set of control variables included in the model, along with their mean values for lottery winners and lottery losers. We imputed the missing values of control variables as the mean value by site and sample cohort for continuous variables and as the modal value by site and sample cohort for binary and categorical variables. As shown in the table, the model also included binary variables indicating whether each covariate was imputed for a given observation. To assess the sensitivity of our results to the inclusion of covariates, we estimated an alternative model with no covariates, described below.
We assumed fixed site effects (rather than clustering at the site level) reflective of the study charter schools’ purposive selection and the study’s estimates as representative of only the participating charter schools. In view of purposive sample selection, results do not generalize beyond the study charter schools. Nonetheless, to assess the sensitivity of our assumptions about the clustering of standard errors, we estimated alternative models that clustered at the school level and at the site level, described below (section D.6e).137
For all outcomes, both continuous and binary, we estimated ordinary least squares (OLS) regression models; in the case of binary outcomes, the model is termed a linear probability model. (Probit or logit models are often recommended for modeling binary outcomes. However, for estimating the relationship between a binary outcome variable and a single binary variable such as a treatment status indicator, the probit or logit and linear probability models generally yield identical results. In an experimental analysis, the goal is to estimate the relationship between the outcome variable and treatment status. The inclusion of baseline covariates increases precision but is unlikely to affect the estimated impact for the simple reason that treatment status is randomly determined and therefore unlikely to correlate with baseline covariates.) In some cases, probit or logit models produced estimates that were unstable or failed to converge, leading to our preference for the linear probability model over probit or logit models.138 To correct for the fact that variance of the error term is not constant in the linear probability model; we estimated heteroskedasticity-robust standard errors.
(continued) receive relatively large sample weights, and the lottery losers would receive relatively small weights. The reverse would be the case in a lottery with many winners and few losers.
137 Clustering at the teacher level was not possible because students generally attended middle schools and were taught by different teachers for each subject. Furthermore, information on teachers was unavailable.
138 In cases in which all lottery winners and/or all lottery losers have the same value of the outcome measure after controlling for other explanatory variables, logit or probit models produce unstable estimates, referred to as the “separation” problem (Zorn 2005). It occurs frequently in this evaluation because several key binary outcome measures have mean values close to 0 or 1 and some sites have relatively small samples of lottery winners and/or lottery losers.

D-8
Table D.2. Covariates Included in Impact Analysis Models
Lottery Winners Lottery Losers Number of
Observationsa
Mean Standard Deviation Mean
Standard Deviation
Difference in Means
p-Value of Difference
Lottery Winners
Lottery Losers
Reading Achievement Baseline reading score (z-score units) 0.42 0.97 0.43 0.94 -0.01 0.796 1,381 924 Baseline reading proficiency—“high” 0.29 0.46 0.28 0.46 0.01 0.682 1,378 917 Baseline reading proficiency—“medium” or “high” 0.83 0.38 0.84 0.38 -0.01 0.592 1,378 917 Pre-baseline reading score (z-score units) 0.47 1.01 0.38 1.01 0.09 0.175 720 417 Pre-baseline reading proficiency—“high” 0.33 0.48 0.29 0.47 0.04 0.081 1,054 639 Pre-baseline reading proficiency—“medium” or “high” 0.83 0.41 0.82 0.41 0.02 0.493 1,054 639
Math Achievement Baseline math score (z-score units) 0.45 0.99 0.45 1.03 0.00 0.997 1,397 927 Baseline math proficiency—“high” 0.33 0.48 0.32 0.47 0.01 0.556 1,395 921 Baseline math proficiency—“medium” or “high” 0.78 0.42 0.76 0.43 0.01 0.467 1,395 921 Pre-baseline math score (z-score units) 0.47 1.02 0.32 1.08 0.15 0.03† 725 417 Pre-baseline math proficiency—“high” 0.31 0.47 0.29 0.47 0.02 0.419 1,044 607 Pre-baseline math proficiency—“medium” or “high” 0.81 0.40 0.75 0.43 0.06 0.011† 1,044 607
Disciplinary Measures Number of days absent in baseline school year 6.07 6.20 5.62 6.20 0.46 0.123 1,329 895 Student suspended in baseline school year 0.04 0.19 0.03 0.17 0.01 0.539 1,329 895
Demographic Characteristics Whiteb 0.81 0.40 0.79 0.41 0.02 0.408 1,295 838 Blackb 0.13 0.34 0.12 0.33 0.00 0.762 1,295 838 Other raceb 0.10 0.31 0.11 0.32 -0.01 0.461 1,295 838 Hispanicb 0.27 0.45 0.28 0.46 -0.02 0.373 1,332 863 Male 0.46 0.51 0.48 0.51 -0.01 0.59 1,400 930 Age at start of school year 11.53 0.77 11.52 0.75 0.01 0.552 1,400 930 Young for grade 0.01 0.07 0.01 0.09 0.00 0.473 1,400 930 Old for grade 0.09 0.29 0.09 0.29 0.00 0.975 1,400 930 IEP status 0.18 0.39 0.16 0.38 0.02 0.56 1,104 789 Limited English Proficiency/ELL 0.10 0.31 0.08 0.28 0.02 0.095 1,334 894
Family Characteristics Income to poverty ratio 0 to 100 percentc 0.13 0.34 0.12 0.33 0.01 0.475 1,230 789 Income to poverty ratio 100 to 200 percent 0.21 0.41 0.19 0.40 0.02 0.362 1,230 789 Income to poverty ratio 200 to 300 percent 0.18 0.39 0.16 0.37 0.02 0.319 1,230 789 Income to poverty ratio >300 percent 0.49 0.51 0.54 0.51 -0.05 0.033† 1,230 789 Two parent family 0.78 0.42 0.79 0.42 -0.01 0.704 1,293 837 Not two-parent family, but more than one adult 0.05 0.22 0.04 0.19 0.01 0.26 1,293 837 English main language spoken at home 0.89 0.32 0.90 0.31 -0.01 0.577 1,293 837 Mother's education: high school or lessc 0.23 0.43 0.24 0.43 -0.01 0.755 1,331 867 Mother's education: some college 0.35 0.49 0.35 0.49 0.00 0.867 1,331 867 Mother's education: college 0.42 0.50 0.42 0.50 0.00 0.924 1,331 867 Born in U.S. 0.92 0.27 0.92 0.27 0.00 0.895 1,185 738 Family received TANF or food stamps in past 12 months 0.05 0.22 0.05 0.23 0.00 0.961 1,291 836 Free or reduced price lunch-eligible 0.34 0.48 0.35 0.48 0.00 0.844 1,292 878 One child in householdc 0.23 0.43 0.22 0.42 0.00 0.888 1,321 863 Two children in household 0.47 0.51 0.45 0.51 0.02 0.463 1,321 863 Three or more children in household 0.30 0.47 0.33 0.48 -0.02 0.354 1,321 863
School Enrollment Enrolled in charter school at baseline 0.05 0.21 0.06 0.24 -0.01 0.267 1,400 930 Enrolled in private school at baseline 0.00 0.07 0.01 0.09 0.00 0.254 1,398 929 Enrolled in public school at baseline 0.94 0.24 0.93 0.26 0.01 0.352 1,398 929 Changed schools midyear in baseline school 0.01 0.10 0.01 0.12 0.00 0.526 1,344 898
School Applications Applied to other charter school at baseline 0.20 0.41 0.19 0.40 0.00 0.857 1,257 802 Applied to private school at baseline 0.07 0.26 0.09 0.29 -0.02 0.182 1,148 739 Applied to other public school at baseline 0.19 0.40 0.21 0.42 -0.02 0.261 1,148 739

Table D.2 (continued)
Lottery Losers Number of
Observationsa Lottery Winners
D-9
Mean Standard Deviation
Standard Mean Deviation
Difference in Means
p-Value of Difference
Lottery Winners
Lottery Losers
Other Information About Sample Baseline information form collected before lottery 0.43 0.50 0.45 0.51 -0.02 0.296 1,288 834 Student in cohort 2 0.48 0.51 0.48 0.51 0.00 0.81 1,400 930
Imputation Indicators Baseline reading score 0.01 0.10 0.01 0.08 0.00 0.262 1,400 930 Baseline math score 0.00 0.04 0.00 0.05 0.00 0.527 1,400 930 Baseline reading proficiency 0.02 0.12 0.01 0.11 0.00 0.552 1,400 930 Baseline math proficiency 0.01 0.09 0.01 0.09 0.00 0.841 1,400 930 Pre-baseline reading score 0.47 0.51 0.48 0.51 -0.01 0.625 1,400 930 Pre-baseline math score 0.47 0.51 0.48 0.51 -0.01 0.548 1,400 930 Pre-baseline reading proficiency 0.31 0.47 0.30 0.47 0.00 0.805 1,400 930 Pre-baseline math proficiency 0.34 0.48 0.33 0.48 0.00 0.968 1,400 930 Number of days absent in baseline school year 0.05 0.22 0.04 0.20 0.01 0.416 1,400 930 Student suspended in baseline school year 0.05 0.22 0.04 0.20 0.01 0.416 1,400 930 Race 0.07 0.26 0.08 0.28 -0.01 0.401 1,400 930 Ethnicity 0.05 0.22 0.05 0.23 -0.01 0.583 1,400 930 Gender 0.00 0.06 0.00 0.05 0.00 0.84 1,400 930 IEP status 0.19 0.40 0.19 0.40 0.00 0.876 1,400 930 Limited English Proficiency/ELL 0.04 0.21 0.03 0.18 0.01 0.227 1,400 930 Family structure (two-parent, two-adult, single-parent) 0.07 0.27 0.08 0.27 0.00 0.695 1,400 930 Mother's education 0.05 0.23 0.05 0.22 0.00 0.809 1,400 930 Born in U.S. 0.14 0.35 0.20 0.40 -0.06 0.002†† 1,400 930 Family received TANF or food stamps in past 12 months 0.07 0.27 0.08 0.28 -0.01 0.693 1,400 930 Free or reduced price lunch-eligible 0.06 0.24 0.06 0.25 0.00 0.936 1,400 930 Number of children in household 0.06 0.24 0.06 0.23 0.00 0.873 1,400 930 Type of school attended at baseline 0.00 0.03 0.00 0.04 0.00 0.602 1,400 930 Changed schools midyear in baseline school 0.04 0.19 0.04 0.20 0.00 0.872 1,400 930 Applied to other charter school at baseline 0.11 0.31 0.11 0.32 -0.01 0.616 1,400 930 Applied to private school at baseline 0.17 0.38 0.19 0.40 -0.02 0.302 1,400 930 Applied to other public school at baseline 0.16 0.36 0.17 0.37 -0.01 0.59 1,400 930 Baseline information form collected before lottery 0.08 0.27 0.08 0.28 0.00 0.89 1,400 930
Note: Sample includes students in main analysis sample (students with nonmissing baseline test score data in the 29 sites included in the main impact analyses).
a Number of observations excludes imputed values. b Race and ethnicity categories are not mutually exclusive. c Omitted category in regression models.
†Difference between lottery winners and losers significantly different from zero at 0.05 level, two-tailed test. ††Difference between lottery winners and losers significantly different from zero at 0.01 level, two-tailed test.
For each site-level impact estimate, we also computed the associated effect size, which reflects the magnitude of the impact relative to the extent to which the outcome varies among students in the sample. For continuous outcome variables, we calculated the effects size by dividing the impact estimate by the standard deviation of the outcome measure among lottery losers at that site. For binary outcome variables, we computed the effect size as the Cox index (the log odds ratio divided by 1.65), as described in the What Works Clearinghouse Procedures and Standards Handbook Version 2.0 (U.S. Department of Education 2008).
b. Averaging Impacts Across Sites
To obtain an overall estimate of the average impact of the study charter schools on the outcome of interest, we averaged the site-specific impact estimates δ̂ over the J sites included in the estimation, taking an equally weighted average as follows:

(2) 11
ˆ ˆJj jJδ δ== ∑
By equally weighting the estimated impacts from each site, we allowed each impact to have an equal influence on the overall impact estimate, thereby providing unbiased estimates of the impact of the average study charter school. However, we also tested the sensitivity of our results to our approach for calculating the average impact by according more weight to more precisely estimated site-level impacts, as described below.
To ensure some degree of reliability of the site-level impact estimates, we limited the sites in our main models to those with at least five lottery winners and five lottery losers, a response rate greater than 50 percent, and a difference in response rates between lottery winners and losers of fewer than 30 percentage points.139 While the implications of these rules varied with the outcome of interest and the model to be estimated, the minimum sample size requirement in the main test score analysis led us to drop 4 of the original 32 sites, the minimum response rate requirement did not require us to drop any additional sites, and the requirement for the maximum difference in response rates between lottery winners and losers caused us to drop an additional site from the analysis of Year 2 test scores. To limit further the possibility of bias attributable to high rates of missing data or large differences in rates of missing data across lottery winners and losers, we restricted the main sample to students with valid baseline test score data (and were therefore more likely to have nonmissing follow-up test scores regardless of whether students were admitted to a study charter school) (Chapter II). For the test score outcomes, the main analysis sample consisted of 2,150 students from 29 of the 32 study sites in Year 1 and 1,920 students from 28 of the 32 sites in Year 2. As described below, we also assessed the sensitivity of our results to these restrictions.
The result of these analytic decisions was an analysis sample with valid data on test score outcomes for large proportions of both lottery winners and losers. Whereas the difference between lottery winners and losers in the proportion of the overall study sample with valid follow-up test scores was 11 to 13 percentage points, the difference in the proportion of the analysis sample with valid follow-up test scores was 5 to 7 percentage points (Appendix Table A.8).
4. Estimating the Impact of Charter School Attendance
To investigate the impact of study charter schools on students who attended the schools, we estimated treatment-on-treated (TOT) impacts. To generate the estimates, we used treatment status as an instrumental variable for charter school attendance, following the approach described by Angrist et al. (1996). Specifically, we estimated a two-stage least squares model. The first stage was a regression of a binary variable indicating whether the student attended a study charter school on treatment status and of all other covariates included in model (1); we used the coefficients from the regression to calculate each student’s predicted charter school attendance.140 The second stage was a regression of the outcome variable of interest on predicted charter school attendance and of all other covariates included in model (1). The estimated coefficient on predicted charter school
139 For subgroup analyses, we relaxed the sample size restriction to allow site subgroups with at least three lottery
winners and three lottery losers. 140 For this analysis, a student was classified as attending a charter school if he or she attended either a study
charter school or a charter school not included in the study. The results therefore represent the impact of attending either a study charter school or one of the nearby non-study charter schools attended by any of the lottery winners or lottery losers.
D-10
attendance from the second-stage model provided the estimate of the effect of charter school attendance on the outcome variable. Standard errors from the model account for estimation error in both the first and second stages of the model; thus, p-values for TOT estimates are slightly higher than those for ITT estimates.
Use of treatment status as an instrumental variable for charter school attendance can, under two key assumptions, provide unbiased estimates of the effect of charter schools on students who attend the schools:141
1. Admission to a charter school is highly predictive of whether a student attends a charter school.
2. Admission to a charter school is correlated with the outcome variable only through the effects of charter school attendance.
The data support the first assumption; in Figure II.3, we show that 81 percent of lottery winners attended a charter school (78 percent a study charter school and 3 percent a nonstudy charter school) while only 15 percent of lottery losers attended a charter school (6 percent a study charter school and 9 percent a nonstudy charter school). The second assumption, which cannot be directly confirmed in the data, implies that winning the admission lottery had no impact on lottery winners who opted not to attend a charter school and that losing the admission lottery had no impact on lottery losers who still attended a charter school; that is, study charter schools were equally as effective for lottery losers who attended them as for lottery winners who attended them.142
Following the same approach used in the ITT impact estimation, we estimated the instrumental variables TOT impact in each site and then averaged the estimates over all sites to produce an overall TOT impact estimate. We also estimated effect sizes for the TOT impact estimates, following the procedures described for the ITT estimates.
5. Estimating Impacts for Population Subgroups
In addition to estimating overall effects of study charter school admission for the full study sample, we estimated the impact of study charter school admission for several population subgroups (Chapter II). To estimate these impacts, we used the following regression model:
(3) ij j ij j ij j J IJ IJy a X B T y S T Sδ ζ ε′ ′ ′ ′ ′= + + + + + ′ ,
where S is an indicator for whether the student is in subgroup S, and all other parameters are as defined as in equation (1). The estimated coefficient on treatment status jδ , provides an estimate of the impact of study charter school admission for students not in subgroup S in site j, and the estimated coefficient on treatment status interacted with subgroup Jζ ′ represents the difference in
141 Technically, the TOT estimate generalizes only to the set of students who comply with their treatment assignment; that is, they attend a study charter school if admitted via the lottery and do not attend a study charter school if not admitted via the lottery.
142 This latter implication could be violated if, for instance, a lottery loser who opted to attend a study charter school attended a non-study charter school that was less (or more) effective than the study charter school or if a lottery loser enrolled in the study charter school later in the school year than the lottery winners and thus received less exposure to the study charter school “treatment.”
D-11

impacts between students in subgroup S and students not in subgroup S in site j. Summing jδ ′ , and
Jζ ′ thus provides an estimate of the impact for students in subgroup S in site j. We then averaged the impact estimates for each subgroup across all sites to obtain an overall impact estimate for that subgroup (following the same approach used to average impact estimates for the full sample in equation (2)).
We present impact estimates and significance tests for individual subgroups and test the significance of the difference in impacts across subgroups (for instance, male versus female).
6. Assessing the Sensitivity of the Main Impact Estimates
To assess the sensitivity of our main estimates to a given analytic approach, we used several approaches to estimating impacts, including an alternative approach to averaging site-level impact estimates, exclusion of covariates, alternative rules for dropping or retaining sites, alternative approaches to accounting for missing outcome test score data, clustering of standard errors, and alternative definitions of treatment status.
a. Approach to Averaging Site-Level Impact Estimates
To obtain our main impact estimates, we computed an equally weighted average of the site-level impact estimates (equation (2)). To test the sensitivity of our results to this approach, we estimated impacts by using a two-stage GLS procedure described by Hanushek (1974). This approach assigns more weight to more precisely estimated site-level impacts, such as sites with larger samples. The GLS approach may be statistically more efficient (lower sampling variance) than the equally weighted average. The results of this sensitivity test are presented in Appendix Table F.1.
b. Covariates
Our main impact model adjusted for baseline covariates to increase the precision of the estimates. To assess the sensitivity of our results to the specification, we estimated an alternative model that did not include any covariates other than site fixed effects and site-treatment status interactions. The results of the test are presented in Appendix Table F.2.
c. Rules for Dropping or Retaining Sites
Our main impact estimates excluded sites with fewer than 5 lottery winners or losers, an overall response rate lower than 50 percent, or a difference in response rates between lottery winners and losers greater than 30 percentage points. To assess the sensitivity of our results to these conditions, we estimated models that (1) retained the main response rate requirements but excluded sites with fewer than 10 lottery winners or losers, (2) retained the main sample size requirement of at least 5 students per group but dropped the response rate requirements, and (3) included all sites with any valid data. The results of these tests are presented in Appendix Table F.3.
d. Approach to Accounting for Missing Outcome Data
In general, random assignment ensures that the coefficient jδ ′ from equation (1) is an unbiased estimate of the impact of an offer of admission to the study charter school(s) in site j on outcome
However, one of the primary outcomes of interest for the study was student test scores, which were missing for many sample members, particularly those who attended private schools. Most
ijy
D-12

states did not require private schools to administer the same test administered by the study charter and traditional public schools. Lottery losers were more likely to attend a private school than lottery winners as a consequence of their failure to win admission to the study charter school(s) to which they applied,143 and private school attendance may have been correlated with student achievement. These differential rates of missing data between lottery winners and losers could have biased the impact estimates if not addressed.
As described in Chapter II, to minimize the possibility of bias attributable to differential rates of missing test score outcome data between lottery winners and losers, we limited the sample to students with valid baseline test score data. Such students were more likely to have nonmissing follow-up test scores regardless of admission to a study charter school.
As one alternative to accounting for missing outcome data, we estimated impacts by using data from all sample members, regardless of whether they had valid baseline test scores, and adjusted for differential rates of missing outcome data by using nonresponse weights.144 To make the sample for which we have data as comparable as possible to the full study sample, we calculated nonresponse weights based on information about differences between the baseline characteristics of students with and without key outcome data. Intuitively speaking, the nonresponse weights assigned more weight to those cases in the analysis with valid outcome data that “looked like” cases with missing outcome data based on the available characteristics for both sets of students (those with and without valid outcome data).
In addition, to assess the possible effects of bias attributable to differential rates of missing data under the most extreme circumstances, we estimated bounds on the impact estimates by following an approach proposed by Lee (2005). This approach identified the excess proportion of lottery losers with missing data relative to lottery winners. Then, given that the two most extreme possible situations for determining the impact estimate were that all the (unobserved) lottery losers with missing data were either in the upper or lower tail of the test score distribution, the approach established bounds on the impact estimate based on the two extremes. “Trimming” the upper tail of the test score distribution among lottery winners provided a lower bound on the impact estimate; trimming the lower tail provided an upper bound.
In our case, to determine the lower bound of the impact on test scores, we dropped from each site’s lottery winners the top jP percent of students based on their test score results, where jP is determined so that the proportion of lottery winners with nonmissing test score data in site j equals the proportion of lottery losers with nonmissing test score data. To determine the upper bound on the impact estimate, we dropped from each site’s lottery winners the bottom jP percent of students based on test score results, before estimating the impact. While this approach provides reliable bounds on the impact estimates, the bounds may be too broad to yield useful information about the effect of study charter schools (for instance, the bounds may span 0).
The results of these sensitivity tests are presented in Appendix Table F.4.
143 In follow-up Year 1, 12 percent of lottery losers attended a private school versus 2 percent of lottery winners. In
Year 2, the comparable percentages were 11 and 2 percent. 144 In particular, we adjusted our basic sampling weights, which account for students’ likelihood of being lottery
winners, so that the overall non-response weights also accounted for differences between the characteristics of sample members for whom we have outcome data versus those for whom we do not have outcome data.
D-13

e. Clustering of Standard Errors
Our main models assumed fixed site effects rather than clustering of standard errors at the site level. To assess the sensitivity of our assumption, we estimated alternative models that clustered at the school and site levels. The results of these sensitivity tests are presented in Appendix Table F.5.
f. Definition of Treatment Status
As discussed in Appendix A, we classified students as lottery winners (the treatment group) if they were offered admission to a study charter school(s) on the basis of lottery results—through either the lottery or a post-lottery admission offer. Students who participated in the lotteries but never received an admission offer to a study charter school make up the control group. However, for two main reasons, we assigned to the control group—rather than to the treatment group--students who were offered admission in the second half of the first follow-up year. First, students who received late offers did not have access to the full treatment at the study charter school; second, the process used by study charter schools to make late offers appeared to be much more informal than the process used for making earlier offers, and it was not clear whether students all had a legitimate opportunity to attend the study charter school. The late offers were rare; student populations in most study charter schools were relatively stable after the first few weeks of the school year, and some schools’ rules prohibited the admission of additional students after a pre-determined date early in the school year. Some schools (8 of the 36 participating schools), however, experienced student turnover during the middle of the year and thus admitted a few (1 to 4) additional students from their wait lists in January or February of the school year.
To assess the sensitivity of our results to the definition of treatment status, we estimated impacts by using two alternative definitions—one that dropped all students who received an admission offer after the start of the school year and a second that dropped all students who received an admission offer after the lottery. The results of these sensitivity tests are presented in Appendix Table F.6.
B. Analysis of Factors Associated with Charter School Impacts
Below, we provide additional details on our analysis of factors associated with charter school impacts, including (1) an analysis of variation in impacts across sites, (2) a description of factors included in the analysis, and (3) a description of the analysis we conducted to determine whether the factors were related to study charter school impacts.
1. Analysis of Variation in Impacts Across Sites
As a first step in conducting an analysis of factors associated with site-level impacts, we determined whether there was in fact any true variation in the impacts or if any observed variation was attributable to sampling error, in which case an analysis of factors associated with impacts would not be fruitful. We therefore conducted the following Q test of the homogeneity of impacts:
(4) 2 2ˆ( ) ~ (j jQ xϖ δ δ= ∑ − −1),J
where ,jϖ is the inverse variance of ˆ ,jδ ˆ
j jj
j
ϖ δδ
ϖ= ∑ is the average value of ˆ
jδ , weighted by the
inverse variance; and J is the number of sites (Lipsey and Wilson 2001). If the statistic exceeded the
D-14

D-15
relevant critical value from the chi-square distribution, we rejected the null hypothesis of homogeneity of impacts and proceeded with the analysis of factors associated with the impacts.
2. Definitions of Factors Potentially Related to Impacts
We examined factors designed to capture characteristics of the study charter schools that might reasonably be expected to be related to the schools’ impacts on key outcomes. These estimated impacts might be influenced by the study charter school itself, with some characteristic making the school particularly effective or ineffective. Alternatively, the estimated impacts might be influenced by the characteristics of the nearby traditional public schools against which we compared the study charter school. For example, two identical study charter schools might have different estimated impacts if one was located in a traditional public school district with highly functioning and effective schools and the other was located in a district with many dysfunctional and ineffective traditional public schools. Thus, where possible, we defined the factors to be examined in relative terms to account for the relevant feature of the study charter school and that same feature among the traditional public schools (and other schools) against which the study charter school competed. In some cases, the relevant feature was not defined for traditional public schools, or we lacked sufficient data to measure the feature. In such cases, we defined the factor based solely on the value of the relevant characteristic in the study charter school.
As described in Chapter II, we defined a set of factors designed to represent features of a study charter school’s policy environment, another set of factors designed to capture features of the school’s operations, and a final set of factors designed to capture characteristics of the school’s student population. Below, we detail the definitions of these factors.
a. Factors Representing Features of Schools’ Policy Environment
• Autonomy score. The autonomy factor measured the extent to which a school exercised control over its operations. It was a relative measure in that the factor was defined as the difference between an autonomy scale among the schools that lottery winners attended (primarily the study charter school) and the same autonomy scale among the schools that lottery losers attended (mostly traditional public schools). We based the autonomy scale on seven binary variables that indicated whether a school’s principal reported that the school set its own policies regarding the following aspects of operations:
1. Budgetary expenses
2. Teacher/staff salaries
3. Teacher tenure
4. Curriculum
5. Length of the school day
6. Student discipline
7. Admissions
We defined the resulting autonomy scale for each school attended by either lottery winner or losers. Possible values of the scale for a given school ranged from 0—indicating that the school reported no autonomy over any of the seven aspects of

D-16
operations—to 7—indicating that the school reported autonomy over all seven aspects of operations.145
Once we created the autonomy scale for each school attended by a sample member, we calculated a weighted average value of the scale among all lottery winners in a given site, with the weight based on the number of lottery winners who attended that particular school. Thus, the mean of the autonomy scale for lottery winners primarily reflected the level of autonomy reported by study charter schools themselves in that most lottery winners attended these study charter schools. We calculated the mean of the autonomy scale for lottery losers in an analogous fashion.
Finally, we calculated the overall autonomy factor in a given site as the difference in the mean autonomy school in schools attended by lottery winners versus schools attended by lottery losers. This autonomy factor could take values between -7 and +7. Positive values indicated a greater degree of autonomy in the study charter schools (and other schools attended by lottery winners) than in the mostly traditional public schools attended by lottery losers. Negative values indicated a lower level of autonomy in the study charter schools than in the schools attended by lottery losers.
• Accountability score. The accountability score measured the extent, along several dimensions, to which a study charter school was held accountable for its performance. It was based on conditions at the study charter school alone and was not a relative measure. The factor relied on information regarding the extent to which the school must report to its authorizer on various aspects of performance.
In particular, we set the factor equal to the sum of a set of four variables indicating the extent to which the school was held accountable on a given dimension:
1. A binary variable indicating whether the school’s charter specified any academic requirements more stringent than the adequate yearly progress (AYP) goals under the state No Child Left Behind (NCLB) accountability system
2. The number of nonacademic criteria required to be reported at least annually to the school’s authorizer (student admission data, student demographic data, promotion rates, number of dropouts and transfers, student discipline information, financial reports, current budgets, budget projections for future years, evidence of adequacy and safety of school facilities, and evidence of teacher credentialing) rescaled to a value between 0 and 1
3. A binary variable indicating whether any of the above information is required to be reported more than once a year
4. Authorizer actions--an index equal to the sum of a set of three binary variables (rescaled to a value between 0 and 1) that indicated whether the authorizer:
a. Conducted more than one scheduled visit to the school annually
b. Conducted at least one unscheduled visit to the school annually
c. Conducted more than one financial audit annually
145 If more than half of these indicators were missing for a particular school, the scale value for the school was set
to missing. If some but fewer than half were missing indicators, the sum of the non-missing indicators was scaled up to represent the 0-to-7 scale.

D-17
The accountability factor took on possible values between 0 and 4. A value of 0 indicated that the school was not held accountable to its authorizer in any of the above areas. A value of 4 indicated that the school was held to a high level of accountability with its authorizer. We created separate versions of the index–school-reported and authorizer-reported–by using responses from the principal and authorizer surveys, respectively. The final accountability score is the simple mean of the two values from the two versions of the index, thereby reflecting the degree of accountability from both school and authorizer perspectives.
• Revenue per student. On the principal survey, we collected information on financial resources available to charter schools but did not collect similar information for traditional public schools. We did not believe that the principals of the latter schools would be able to report such information accurately, given that district staff typically handle financial matters. Thus, we based the revenue factor on revenues at the study charter school alone146 and summed the total reported revenues to the study charter school from public and private sources, as reported by the school’s principal. To calculate revenues per student, we then divided such overall revenues by the number of students enrolled in the school.
• District authorizer. The district authorizer factor was a binary indicator of whether the study charter school was authorized by a school district as opposed to a state agency or some other entity such as a college or university.
• Operated by private organization. The private organization factor was a binary indicator of whether the study charter school was operated by a private organization, such as a charter management organization.
• School age. The school age factor was a measure of the number of years the study charter school had been operating as a charter school.
b. Factors Representing Features of Study Charter School Operations
• Total enrollment. The total enrollment factor was a relative measure of the total student enrollment in the schools attended by lottery winners (primarily the study charter schools) compared to the enrollment in schools attended by lottery losers. We calculated the total enrollment factor as the difference between mean enrollment in schools attended by lottery winners and mean enrollment in schools attended by lottery losers.
• Enrollment per grade. The enrollment-by-grade factor was a relative measure of the enrollment per grade in the schools attended by lottery winners (primarily the study charter schools) compared to enrollment per grade in schools attended by lottery losers. We first calculated enrollment per grade in each school by dividing total enrollment by the number of grades the school served. We then calculated the difference between mean enrollment per grade in schools attended by lottery winners and mean enrollment per grade in schools attended by lottery losers.
146 In sites with two study charter schools with dual applicants, we set the factor equal to a simple average of the
variable measuring revenues at the two schools. We used this approach in sites with dual applicants for each factor based on a characteristic of the study charter schools alone.

D-18
• Total classroom time in school year. The classroom time factor was a relative measure of the total length of the school day/year. We first calculated school-year length by multiplying the number of hours in the typical school day by the number of school days in the school year at each school attended by a sample member. We then calculated the mean number of hours in the school year at schools attended by lottery winners and subtracted from that total the mean number of hours in the school year at schools attended by lottery losers.
• Student/teacher ratio. The student/teacher ratio factor was a relative measure of average class size. For each school attended by a sample member, we calculated the student/teacher ratio by dividing the total number of students enrolled in the school by the total number of full-time equivalent instructional staff assigned to the school. We then calculated the mean student/teacher ratio at schools attended by lottery winners and subtracted from that ratio the mean student/teacher ratio at schools attended by lottery losers.
• Proportion of teachers with experience. The teacher experience factor was a relative measure. For each school attended by a sample member, an item on the principal survey indicated whether more than two-thirds of teachers at the school had at least five years of teaching experience (defined as an “experienced” teacher). We calculated the percentage of lottery winners attending a school at which more than two-thirds of teachers were experienced and subtracted from that figure the percentage of lottery losers attending a school at which more than two-thirds of teachers were experienced.
• Use of ability grouping. The ability grouping factor was a relative measure of the extent to which schools used ability grouping. We first calculated the percentage of lottery winners attending a school that used ability grouping in either some or all mathematics and/or English courses. To calculate the value of the factor, we then subtracted the percentage of all lottery losers attending a school with ability grouping in either some or all mathematics and/or English courses.
c. Factors Representing Characteristics of the Study Charter School’s Student Population
• Mean baseline reading test score. The reading test score factor was a measure of the incoming achievement level of students at the study charter school. We calculated it as the mean baseline reading test score of all sample members at the site (that is, all students in the sample who applied to attend that school). Higher values of the factor indicated that the school served higher-achieving incoming students.
• Mean baseline mathematics test score. The mathematics test score factor was a measure of the incoming achievement level of students at the study charter school. We calculated it as the mean baseline mathematics test score of all sample members at the site (that is, all students in the sample who applied to attend that school).147 Higher values of the factor indicated that the school served higher-achieving incoming students.
147 For this factor and the mean reading baseline test score factor, we also calculated analogous factors based on
mean baseline test scores among lottery winners at that site alone. The results were nearly identical to the results using the factors described above (not presented in this report).
• Proportion white, non–Hispanic. This demographic factor was based on the study charter school alone and was a measure of the proportion of all students at the school who were white, non–Hispanic.
• Proportion eligible for free/reduced-price meals. The school meal factor was based on the study charter school alone and was a measure of the proportion of all students at the school whose family circumstances qualified them for free or reduced-price meals.
• Urban. The urban factor measured the setting of the charter school. It was a binary factor representing whether or not the charter school was located in a large urban area.
3. Analysis of Factors Potentially Related to Impacts
To examine the relationship between factors representing the characteristics of study charter schools and the impacts of the schools, we used an approach similar to the approach used earlier to estimate impacts for student subgroups. In particular, we used the following regression model:
(5) , 1 2 3 *ij j ij ij ij j ijy a X b b T b T F e= + + + +
where F is the value of the site-level factor, and all other parameters are as defined as in equation (1).148 The estimated impact of charter school admission for students in a given site (site j) is represented by ( 2 3 ),jb b F+ and represents our estimate of the relationship between the site-level factor and the estimated impact. Thus, if is positive, the charter school impact is more positive for students in sites with more positive values of the factor.
3b
3b
Initially, we examined separately the relationship between impacts and each site-level factor. In other words, we estimated a separate version of equation (5) for each factor we examined. If the interaction term ( ) was statistically significant, we concluded that there was a significant bivariate relationship between the value of the factor and the study charter school’s impact. However, given that each factor was likely to correlate with other features of the sites, we used equation (5) to examine the multivariate relationships between site-level factors and study charter school impacts, thereby attempting to hold constant several key characteristics that might have influenced study charter schools’ impacts. Equation (5) permitted us to interact treatment status with each factor within a single model. We limited the number of factors in the multivariate analysis to a subset of the original set of factors because of the limited number of degrees of freedom for the analysis, with impact estimates for only 28 or 29 sites. In addition, some factors were highly correlated with one another such that their inclusion in the same model would have led to multicollinearity.
3b
The final part of the analysis of factors related to impacts involved estimating charter school impacts for subsets of sites with particular values of a given factor. For example, while the above analysis might tell us that the proportion of disadvantaged students served in a charter school was positively related to the school’s impacts, it would not tell us if sites in which schools served at least
148 One distinction between this model and the main impact model (and the student subgroup model) is the assumption that the coefficient on treatment status does not vary by site. In other words, the treatment effect was assumed constant across sites except for the variation in impacts arising from different sites’ different values of the factor. In practice, the distinction made no difference in our impact estimate. We adjusted the sample weights for the analysis by weighting data from each site equally in estimating this treatment effect, just as we weighted sites equally in estimating an overall impact estimate in the main impact model.
D-19
D-20
some minimum proportion of disadvantaged students had positive (and significant) impacts. To address that question, we first re-defined each continuous factor as a binary variable. For continuous variables, if the value of the factor in a given site was above the median, we set the binary version of that factor to 1 (or “high”); if the value of the factor was below the median, we set the binary version of that factor to 0 (or “low”).149 We then estimated equation (5) with jF defined as the binary version of the factor and ( ) representing the estimated impact of study charter schools with high values of the factor while ( ) represented the estimated impact of charter schools with low values of the factor. We examined impacts for these subsets of sites with high versus low values of the factors when the initial bivariate relationship between the continuous version of the factor and the school’s impact was statistically significant.
2b b+
2b3
149 An exception was for the binary variable for percentage black. The median of the variable was less than 3
percent, which seemed too low as a cutoff for classifying a site with a high or low percentage of black students. Instead, we distinguished between whether or not 10 percent or more of students were black.

APPENDIX E
SUPPLEMENTAL MATERIALS FOR CHAPTER III

This page is intentionally left blank.

E-3
In Appendix E, we provide additional detail on the methods and variables used in the analysis of school and student characteristics in Chapter III. In Section A, we describe the sources of school-level data and, in section B, our approach when data from those sources were missing. In Section C, we present definitions of school-level characteristics used in the analysis. In Section D, we provide a set of tables that show the full set of school characteristics we examined in comparing study and nonstudy charter middle schools and the schools attended by lottery winners and lottery losers. We also include tables showing lottery winners’ and losers’ baseline characteristics.
A. Data Sources
The data used to conduct the analyses noted above were collected from a variety of sources, including a survey of principals conducted specifically for the study; the Common Core of Data (CCD) and Private School Universe Survey (PSS) data produced by the National Center for Education Statistics; the School Data Direct web site (maintained by the State Education Data Center of the Council of Chief State School Officers); and school-specific report cards located on state department of education web sites.
Principal Survey. The largest share of the data comes from the responses to our survey of principals (described in Chapter II). We surveyed two groups of respondents—the principals of schools attended by sample members during the first follow-up year (including both public and private schools) and the principals of other charter middle schools not included in the study.
Common Core of Data. The National Center for Education Statistics annually collects descriptive data on the universe of public elementary and secondary schools in the United States. We used the Public Elementary/Secondary School Universe Survey Data from the CCD for two primary purposes. First, when possible, we used data from the 2006–2007 version of the CCD to fill in for missing data from the survey administered to public school principals150 for data items common to the two surveys, including enrollment, student race/ethnicity, student FRPL status, school Title I status, and student/teacher ratio. In addition, the CCD provided our measurement of urbanicity. Second, we relied on the CCD as the source of the data for our analysis of nonresponse to the principal survey (Section B).
Private School Universe Survey. The National Center for Education Statistics collects descriptive data on the universe of private schools in the United States. Similar to our approach with the CCD, we used data from the 2005–2006 version of the PSS to fill in for missing data from the survey administered to private schools151 for data items common to the two surveys, including enrollment, student race/ethnicity, and student/teacher ratio and data on urbanicity.
School Performance Data. We measured data on school performance by using the percentage of students at a school who reached each of four proficiency levels (by grade) on the state assessment.152 In particular, we measured the proportion of students at a given grade level in a given
150 We used the 2006–2007 school year for the analyses because it covered the same period as the majority of the responses to the principal survey (administered in fall 2007 and covering the 2006–2007 school year).
151 The PSS is administered once every two years and was not available for the 2006–2007 school year. 152 For the majority of states, the four proficiency categories follow: advanced, proficient, partially proficient (or
basic), and below basic. However, some states use either three or five proficiency categories. In states with only three proficiency levels, schools had values of zero for the missing proficiency group. In states with five proficiency levels, two

E-4
school whose score on the state assessment put them (1) at or above the basic (partially proficiency) level, (2) at or above the proficient level, and (3) at or above the advanced level. This measure of the academic performance of a school’s students is consistent with one of the student-level measures of academic performance we use in estimating impacts. At the school level, the information on the percentages of schools meeting the different proficiency levels came primarily from the data housed on the School Data Direct web site.153 For the comparison of study versus nonstudy charter schools, we collected these data for the 2006–2007 school year; for the comparison of schools attended by lottery winners and losers, we used data from the school for students’ first follow-up year (2005–2006 for cohort 1 and 2006–2007 for cohort 2). When data were missing, we filled in values by hand, using school-specific report cards maintained on state department of education web sites.
B. Nonresponse Adjustment
The availability of data on school characteristics varies for the different sources of data as well as for the different samples of schools examined. Below, we describe the prevalence of missing data in the comparisons of study versus nonstudy charter middle schools and for the comparisons of schools attended by lottery winners versus lottery losers.
1. Study Versus Nonstudy Charter Schools
In Table E.1, we provide the response rates for the study charter schools and other charter middle schools not participating in the study. The set of “nonstudy charter middle schools” includes any charter school with an entry point between grades 4 and 7 that did not participate in the study, except for those in which the entire school was designed specifically for students who had been suspended or expelled or referred for behavior or adjustment problems.154 The response rate on the principal survey was higher for study charter schools than for nonstudy schools, with nearly all study charter school principals (35 of 36, or 97 percent) completing the survey compared with 71 percent of nonstudy charter middle school principals. We also had more complete data on test scores for study schools, though the difference was much smaller; we had test score data for 90 percent of nonstudy schools. For variables in both the survey and the CCD, we had complete information for all schools.
(continued) levels were combined to form one category as appropriate (Appendix C). Given variation across states in the proficiency level categories, we focus primarily on the proportion of students meeting at least the proficient level, which is defined and reported at the school level for all states.
153 See http://www.schooldatadirect.org. 154 These schools were excluded from the non-study charter school population because the study was designed to
examine charter schools serving a more general student population. We could typically not identify these schools until they had already completed a principal survey. We found that 7.5 percent of non-study schools that did complete a principal survey reported that they were specifically designed for this subset of students; therefore, we excluded them from the sample of non-study schools. We also assumed that 7.5 percent of non-study schools that did not complete a principal survey were specifically designed for students with behavior issues.

E-5
Table E.1. Percentage of Schools with Valid Data on School Characteristics
Response Rate/Percentage with Valid Data (%)
Study Nonstudy Total
Percentage of Schools with Completed principal survey >90 71 73 Data from either principal survey or CCD 100 100 100 Valid test score data 100 90 90
Total Number of Schools 36 424 460
Given the differential response rate on the principal survey between study schools and nonstudy schools, we used variables from the CCD to create school-level weights to adjust for nonresponse. In particular, the weights ensure that the sample of schools with valid data match the full sample of schools in terms of enrollment, racial/ethnic distribution, eligibility for free or reduced-price meals, Title I eligibility, and student/teacher ratio, along with other characteristics correlated with these observed characteristics.
2. Schools Attended by Lottery Winners Versus Lottery Losers
In Table E.2, we show the proportion of lottery winners and lottery losers with valid data on the characteristics of the schools they attended during the first follow-up year. Data from principal surveys were available for a substantially higher proportion of lottery winners than lottery losers (92 versus 77 percent).155 We expected such a difference because, while most lottery winners attended study charter schools that had already agreed to participate in various aspects of the study (including the principal survey), lottery losers typically attended traditional public schools that had no connection with the study and, in most cases, were not aware of the study before receiving the request to participate in the principal survey (Table E.3). However, the difference between the proportions of lottery winners versus lottery losers in schools with valid data was much smaller when we included data from the CCD; over 90 percent of both groups had data on the characteristics measured in both the principal survey and CCD or PSS. Test score data were available for a larger proportion of the schools attended by lottery winners than by lottery losers, though we had school test score data for 88 percent of the total analysis sample.
C. Definitions of School Characteristics
As described in Chapter III, we constructed the majority of the variables used in the school-level comparisons from responses to the survey of principals of charter middle schools and principals of all schools attended by members of the student sample. The variables are defined below.
155 Sample members may be missing principal survey data because (1) a principal refused or failed to respond to
our request to complete the survey or (2) the student was either home-schooled or attended a school that we could not identify. About 5 percent of lottery losers and 1 percent of lottery winners fell into one of the latter two categories.

E-6
Table E.2. Percentage of Students in Analytic Sample with Valid Data on School Characteristics
Response Rate/Percentage with Valid Data (%)
Lottery Winners Lottery Losers Total
Percentage of Students Attending Schools with Completed principal survey 92 77 86 Data from either principal survey, CCD, or PSS 98 92 95 Valid test score data 96 76 88
Total Number of Schools 1,400 930 2,330
Table E.3. Type of School Attended During Baseline and Follow-up Period, by Treatment Status
Baseline Year Year 1 Year 2
School Type (proportions)
Lottery Winners
Lottery Losers
Lottery Winners
Lottery Losers
Lottery Winners
Lottery Losers
Study charter school 0.00 0.00 0.79 0.06 0.70 0.12
Other charter school 0.05 0.06 0.03 0.09 0.06 0.08
Traditional public school 0.94 0.93 0.15 0.78 0.19 0.68
Private school 0.00 0.01 0.02 0.03 0.02 0.03
Home school 0.01 0.00 0.00 0.02 0.00 0.02
Unknown 0.00 0.00 0.01 0.02 0.03 0.07
Sample Size 1,400 930 1,400 930 1,400 930 †Significantly different from zero at the .05 level, two-tailed test. ††Significantly different from zero at the .01 level, two-tailed test. 1. Enrollment and Related Variables
We generated enrollment variables by using direct responses to the principal survey and the CCD and/or PSS, when available, when enrollment was missing in the survey. We calculated enrollment per grade as total enrollment divided by the number of grades spanned by the school; we calculated the student/teacher ratio as total enrollment divided by the number of full-time equivalent teachers (based on information drawn from the principal survey).
2. School Uniforms Required
A binary variable from the principal survey indicated whether a given school required its students to wear a uniform.
3. Time in School
Variables depicting time in school—the number of hours in the typical school day and number of days in the school year—were generated directly from responses to the principal survey.

E-7
4. Facilities
A series of binary variables indicated whether a school had or offered a spectrum of facilities outside the classroom. The variables were based on items in the principal survey.
5. Academic Programming
A series of binary variables indicated whether a school employs a given set of methods for organizing classes, including whether a school grouped some or all of its English and/or mathematics classes by ability level and used other approaches for organizing classes.
We created a separate binary variable to indicate whether the primary textbook used by a school in its grade 7 mathematics class(es) would be classified as using a “reform” approach. Generally, reform mathematics promotes “discovery learning” and conceptual understanding by using examples, whereas traditional mathematics emphasizes algorithms, facts, and practice.156 Mathematics curricula developed with the support of the National Science Foundation clearly represent a reform orientation. Four such reform programs at the middle school level are the Connected Mathematics Project, Mathematics in Context, MathScape, and MathThematics.157 These programs are published and distributed by commercial publishers, with the most popular programs associated with the largest publishers (for example, Connected Mathematics by Pearson/Prentice Hall). With somewhat less certainty, other texts may be identified as reform by the publisher’s explicit classification (for example, Glencoe’s IMPACT Mathematics), by key phrases in the description of the product (for example, Sadlier-Oxford reports that Fundamentals of Algebra is “correlated to the NCTM [National Council of Teachers of Mathematics] focal points”), or by the organization of text (for example, Pearson’s AGS Mathematics includes geometry in its table of contents). While these texts are not as strongly oriented to reform mathematics as those supported by the NSF, we classified them as reform textbooks. Overall, we used the above guidelines to categorize and classify the fixed and open-ended responses to the principal survey question about mathematics texts.
Finally, a series of binary variables indicated whether a school offered instructional or supplemental programming for specific groups of students, including programs for gifted/talented, foreign language immersion, music and/or art, and students with limited English proficiency.
6. Staff
A series of variables regarding principal and staff experience and characteristics were taken directly from the corresponding principal survey responses.
156 This classification is derived from NCTM’s Curriculum and Evaluation Standards for School Mathematics released in
1989 and revised and titled Principles and Standards for School Mathematics in 2000. The report is available for purchase online or may be accessed through NCTM membership at http://standards.nctm.org/.
157 See K-12 Mathematics Curriculum Center (2005) at http://www2.edc.org/mcc/PDF/CurricSum8.pdf.

E-8
7. Students
To help characterize the students attending a given school, we asked principals to report the number of students in a series of categories such as race/ethnicity and eligibility for free or reduced-price meals. We then calculated percentages by using as the denominator the total enrollment reported by the school.
8. Autonomy Index
Appendix D defines the autonomy index on a scale from 0 (low) to 7 (high).
9. Charter School–Specific Characteristics
We took a series of variables regarding characteristics specific to charter schools directly from the corresponding survey responses to questions on the principal survey asked of charter schools only. Example variables include age of the school and type of organization that authorized the school. Charter school characteristics included average expenditures per student, which were defined as total expenditures from both public and private sources, as well as an accountability index on a scale from 0 to 4, as defined in Appendix D.
D. Supplemental Tables
The supplemental tables for Chapter III included in this appendix consist of the full set of characteristics for the comparisons of both study and nonstudy charter schools (Tables E.4 through E.8), the full set of characteristics for comparisons of schools attended by lottery winners and lottery losers (Tables E.9 through E.13), and comparison of the baseline characteristics of lottery winners and lottery losers among the “full” sample and among students in our analysis sample who also have valid Year 2 test score data (Tables E.14 through E.15).
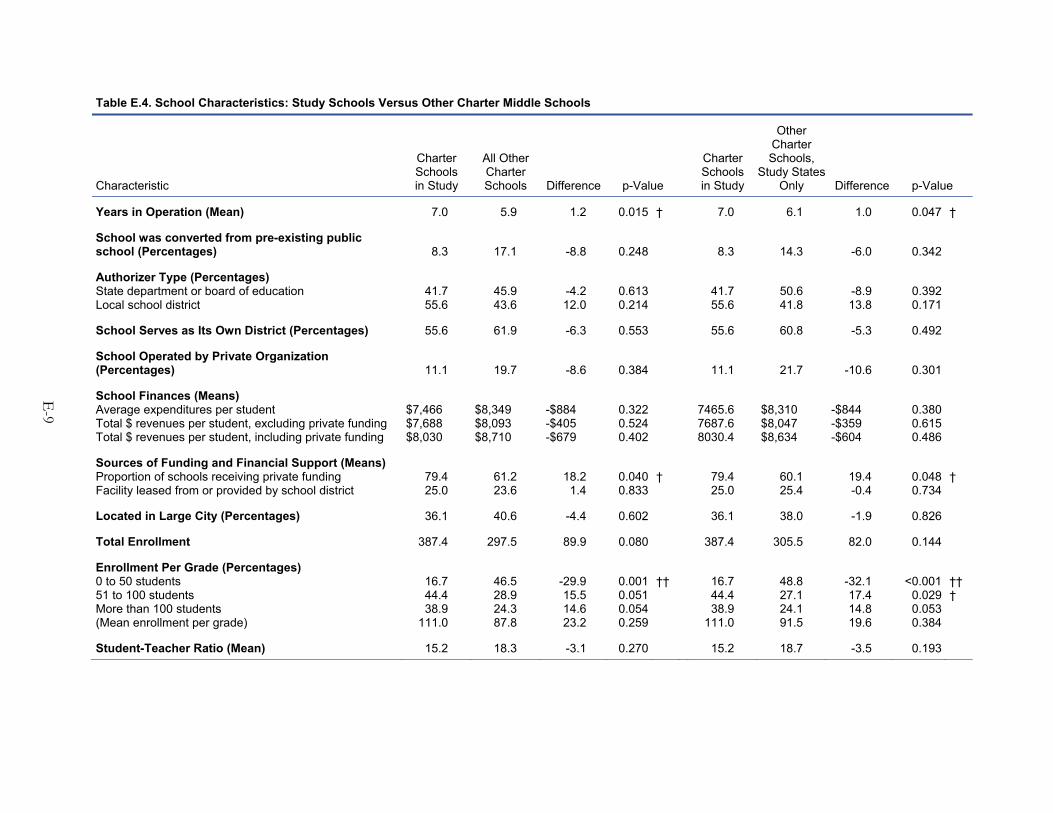
E-9
Table E.4. School Characteristics: Study Schools Versus Other Charter Middle Schools
Characteristic
Charter Schools in Study
All Other Charter Schools Difference p-Value
Charter Schools in Study
Other Charter Schools,
Study States Only Difference p-Value
Years in Operation (Mean) 7.0 5.9 1.2 0.015 † 7.0 6.1 1.0 0.047 †
School was converted from pre-existing public school (Percentages) 8.3 17.1 -8.8 0.248 8.3 14.3 -6.0 0.342
Authorizer Type (Percentages) State department or board of education 41.7 45.9 -4.2 0.613 41.7 50.6 -8.9 0.392 Local school district 55.6 43.6 12.0 0.214 55.6 41.8 13.8 0.171
School Serves as Its Own District (Percentages) 55.6 61.9 -6.3 0.553 55.6 60.8 -5.3 0.492
School Operated by Private Organization (Percentages) 11.1 19.7 -8.6 0.384 11.1 21.7 -10.6 0.301
School Finances (Means) Average expenditures per student $7,466 $8,349 -$884 0.322 7465.6 $8,310 -$844 0.380 Total $ revenues per student, excluding private funding $7,688 $8,093 -$405 0.524 7687.6 $8,047 -$359 0.615 Total $ revenues per student, including private funding $8,030 $8,710 -$679 0.402 8030.4 $8,634 -$604 0.486
Sources of Funding and Financial Support (Means) Proportion of schools receiving private funding 79.4 61.2 18.2 0.040 † 79.4 60.1 19.4 0.048 † Facility leased from or provided by school district 25.0 23.6 1.4 0.833 25.0 25.4 -0.4 0.734
Located in Large City (Percentages) 36.1 40.6 -4.4 0.602 36.1 38.0 -1.9 0.826
Total Enrollment 387.4 297.5 89.9 0.080 387.4 305.5 82.0 0.144
Enrollment Per Grade (Percentages) 0 to 50 students 16.7 46.5 -29.9 0.001 †† 16.7 48.8 -32.1 <0.001 †† 51 to 100 students 44.4 28.9 15.5 0.051 44.4 27.1 17.4 0.029 † More than 100 students 38.9 24.3 14.6 0.054 38.9 24.1 14.8 0.053 (Mean enrollment per grade) 111.0 87.8 23.2 0.259 111.0 91.5 19.6 0.384
Student-Teacher Ratio (Mean) 15.2 18.3 -3.1 0.270 15.2 18.7 -3.5 0.193

Table E.4 (continued)
E-10
Characteristic
Charter Schools in Study
All Other Charter Schools Difference p-Value
Charter Schools in Study
Other Charter Schools,
Study States Only Difference p-Value
Student Requirements (Percentages) School has admission requirements 77.8 78.6 -0.8 0.880 77.8 77.0 0.7 0.972 School uniforms required 41.7 52.5 -10.8 0.383 41.7 51.2 -9.6 0.547
Time in School (Means) Mean length of school day in hours 7.3 7.0 0.3 0.117 7.3 7.0 0.4 0.093 Mean length of school year in days 182.4 181.4 1.0 0.968 182.4 181.5 0.9 0.987
Communication with Parents (Mean) School provides weekly/daily notes on child’s progress 75.0 66.1 8.9 0.338 75.0 68.4 6.6 0.442
Facilities (Percentages) Computer lab -- -- -- -- -- -- -- -- Library 58.3 61.7 -3.4 0.688 58.3 62.9 -4.6 0.676 Gym 52.8 48.8 4.0 0.713 52.8 45.1 7.7 0.532 Cafeteria 55.6 68.4 -12.8 0.071 55.6 68.1 -12.5 0.097 Child counselor’s office 83.3 70.2 13.1 0.080 83.3 67.4 16.0 0.058 Nurse’s office 69.4 48.7 20.8 0.039 † 69.4 48.4 21.0 0.028 † Lunches prepared at school 47.2 46.1 1.1 0.861 47.2 46.4 0.8 0.867
Sample Size—Characteristics Based on Principal Survey or CCD 36 434 36 338
Sample Size—Characteristics Based on Principal Survey Alone 35 299 35 239 -- Values not reported due to risk of disclosure based on cell size. †Difference is statistically significant at the 0.05 level, two-tailed test. ††Difference is statistically significant at the 0.01 level, two-tailed test.

E-11
Table E.5. Academic Programming: Study Schools Versus Other Charter Middle Schools
Characteristic
Charter Schools in Study
All Other Charter Schools Difference p-value
Charter Schools in Study
Other Charter Schools,
Study States Only Difference p-value
School Focus (Percentages) Regular elementary or secondary 66.7 55.2 11.5 0.150 66.7 56.2 10.5 0.151 Special program emphasis 33.4 21.2 12.2 0.243 33.4 21.5 12.0 0.265 Alternative 0.0 23.2 -23.2 0.000 †† 0.0 22.0 -22.0 0.000 ††
Student Grouping for Instruction (Percentages) Some/all math classes grouped by ability level 33.3 36.7 -3.4 0.745 33.3 35.9 -2.6 0.820 Some/all English language arts classes grouped by ability level 33.3 28.6 4.8 0.697 33.3 28.1 5.2 0.655
Methods for Organizing Classes (Percentages) By grade level 63.9 41.0 22.9 0.008 †† 63.9 37.8 26.1 0.004 †† Student groups remain with same teacher across grades 40.0 40.5 -0.5 0.864 40.0 39.7 0.3 0.829 Interdisciplinary teaching 77.8 59.9 17.9 0.043 † 77.8 59.8 18.0 0.046 † Paired/team teaching 51.4 40.5 10.9 0.406 51.4 39.9 11.5 0.363
Available Programs (Percentages) Traditional grades/academic discipline based departments 83.3 83.4 -0.1 0.611 83.3 82.4 1.0 0.557 Talented/gifted/other program for advanced learners 72.2 67.7 4.5 0.552 72.2 70.4 1.9 0.695 Foreign language immersion programs 41.7 53.4 -11.8 0.262 41.7 59.2 -17.5 0.111 Tutors 83.3 82.0 1.4 0.846 83.3 82.4 0.9 0.908 Music program 91.7 59.4 32.2 <0.001 †† 91.7 61.5 30.2 <0.001 †† Art program -- -- -- -- †† -- -- -- -- † Physical education 91.7 87.7 3.9 0.437 91.7 86.7 5.0 0.381 After-school/before-school program 82.9 74.8 8.1 0.284 82.9 73.4 9.4 0.240 Instruction specifically designed for LEP students 52.8 40.4 12.4 0.190 52.8 33.5 19.3 0.064
Schoolwide Title I Program (Percentages) 27.8 42.5 -14.7 0.076 27.8 40.5 -12.7 0.132
Approach of Math Textbook Used in 7th Grade (Percentages) Traditional or conventional approach (emphasis on algorithms, facts, practice) 39.1 51.8 -12.6 0.191 39.1 52.4 -13.2 0.211 Reform approach (emphasis on discovery learning, conceptual understanding) 34.8 17.4 17.4 0.029 † 34.8 14.6 20.2 0.016 † Hybrid approach 26.1 30.9 -4.8 0.684 26.1 33.0 -6.9 0.552

E-12
Difference p-value
Charter Schools in Study
Other Charter Schools,
Study States Only Difference p-value Characteristic
Charter Schools in Study
All Other Charter Schools
Number of Required Books in 7th Grade (Mean) Advanced ELA classes 10.1 8.5 1.7 0.320 10.1 8.2 2.0 0.248 Regular ELA classes 8.9 7.4 1.5 0.397 8.9 7.3 1.5 0.352 Remedial ELA classes 8.2 7.4 0.8 0.477 8.2 7.1 1.1 0.417
Sample Size—Characteristics Based on Principal Survey Alone 35 299 35 239 -- Values not reported due to risk of disclosure based on cell size. †Difference is statistically significant at the 0.05 level, two-tailed test. ††Difference is statistically significant at the 0.01 level, two-tailed test.
Table E.5 (continued)

E-13
Table E.6. Characteristics of Leadership and Staff: Study Schools Versus Other Charter Schools
Characteristic
Charter Schools in Study
All Other Charter Schools Difference p-value
Charter Schools in Study
Other Charter Schools,
Study States Only Difference p-value
Principal Characteristics
Experience (Means) Number of years at any school 6.1 5.7 0.5 0.562 6.1 6.1 0.1 0.865 Number of years at current school 3.4 3.4 0.0 0.900 3.4 3.4 0.0 0.953
Education (Percentages) Principal holds less than a master’s degree 8.3 20.6 -12.3 0.109 8.3 20.5 -12.2 0.103 Principal holds a master’s degree 52.8 52.1 0.6 0.946 52.8 52.0 0.8 0.931 Principal holds an Ed. Specialist degree 25.0 14.7 10.3 0.117 25.0 13.9 11.1 0.125 Principal holds a Ph.D. 13.9 12.3 1.6 0.776 13.9 13.3 0.6 0.915
Teacher Characteristics
Experience Fraction of school’s teachers with more than 5 years experience (percentages)
Less than one-third -- -- -- -- †† -- -- -- -- †† One-third to two-thirds 47.1 39.9 7.1 0.573 47.1 37.8 9.3 0.409 More than two-thirds 50.0 34.0 16.0 0.060 50.0 36.2 13.8 0.112
Compensation (Means) Mid-point of salary range (in dollars) 48,168 44,280 3,888 0.022 † 48,168 44,419 3,748 0.026 †
Qualifications (Means) Percentage of teachers with full state certification 76.9 78.4 -1.5 0.924 76.9 77.9 -1.0 0.994 Percentage of teachers classified as highly qualified 88.0 86.8 1.2 0.652 88.0 86.4 1.6 0.658
Sample Size—Characteristics Based on Principal Survey Alone 35 299 35 239 -- Values not reported due to risk of disclosure based on cell size. †Difference is statistically significant at the 0.05 level, two-tailed test. ††Difference is statistically significant at the 0.01 level, two-tailed test.

E-14
Table E.7. Student Characteristics and Outcomes: Study Schools Versus Other Charter Middle Schools
Characteristic/Outcome
Charter Schools in Study
Other Charter Schools,All States Difference p-value
Charter Schools in Study
Other Charter Schools,
Study States Only Difference p-value
Students’ Race/Ethnicity (Means) Percentage Hispanic 26.1 25.0 1.1 0.825 26.1 28.8 -2.7 0.591 Percentage white 53.4 38.2 15.3 0.012 † 53.4 40.2 13.2 0.031 † Percentage black 15.8 29.1 -13.3 0.024 † 15.8 23.7 -7.9 0.131 Percentage other race 4.6 7.4 -2.7 0.355 4.6 7.0 -2.4 0.389
Student Behavior (Means) Average daily attendance rate 95.2 91.7 3.5 0.067 95.2 91.5 3.7 0.065 Percentage of enrolled students suspended out-of-school 3.1 9.4 -6.3 0.031 † 3.1 8.9 -5.8 0.043 †
Student Needs (Means) Percentage of students receiving free or reduced-price lunches 38.5 53.9 -15.4 0.006 †† 38.5 53.1 -14.6 0.009 †† Percentage of students with learning disability and/or IEP 11.8 12.0 -0.2 0.705 11.8 11.6 0.2 0.843 Percentage of students classified as LEP 3.0 9.1 -6.1 0.069 3.0 10.8 -7.8 0.041 †
Student Performance on State Assessments
Proficiency Rate—Percentage of Students Meeting Proficiency Level on State Assessment (Means) Math
Grade 6 65.5 51.7 13.8 0.005 †† 66.4 50.1 15.4 0.002 †† Grade 7 66.0 50.5 15.5 0.001 †† 66.7 49.7 16.3 0.001 †† Grade 8 67.1 46.4 20.6 <0.001 †† 67.9 44.4 22.6 <0.001 ††
English/Language art Grade 6 68.4 56.5 11.9 0.020 † 69.0 57.1 11.2 0.027 † Grade 7 75.8 56.7 19.1 <0.001 †† 76.2 57.6 18.2 <0.001 †† Grade 8 73.3 56.6 16.7 <0.001 †† 74.1 55.1 18.2 <0.001 ††

Table E.7 (continued)
E-15
Difference p-value
Charter Schools in Study
Other Charter Schools,
Study States Only Difference p-value
Other Charter Schools,All States
Charter Schools in Study Characteristic/Outcome
Proficiency Rate Relative to State Average (Means)—Difference Between School and State Proficiency Rates Math
Grade 6 15.8 -1.5 17.3 <0.001 †† 15.9 -3.2 19.0 <0.001 †† Grade 7 18.0 -2.5 20.5 <0.001 †† 17.9 -4.1 22.1 <0.001 †† Grade 8 19.1 -3.2 22.3 <0.001 †† 19.2 -6.3 25.3 <0.001 ††
English/Language art Grade 6 13.3 -1.1 14.4 0.001 †† 13.2 -2.3 15.6 <0.001 †† Grade 7 18.3 -1.6 19.9 <0.001 †† 18.0 -2.4 20.7 <0.001 †† Grade 8 16.6 0.6 16.0 <0.001 †† 16.7 -2.4 19.0 <0.001 ††
Sample Size—Characteristics Based on Principal Survey or CCD 36 434 36 338
Sample Size—Characteristics Based on Principal Survey Alone 35 299 35 239
Sample Size—School Test Scores 35 380 35 301 †Difference is statistically significant at the 0.05 level, two-tailed test. ††Difference is statistically significant at the 0.01 level, two-tailed test.

E-16
Table E.8. Autonomy and Accountability: Study Schools Versus Other Charter Middle Schools
Characteristic
Charter Schools in Study
All Other Charter Schools Difference p-value
Charter Schools in Study
Other Charter Schools,
Study States Only Difference p-value
School Sets Its Own Policies Regarding (Percentages): Budgetary expenses 83.3 86.8 -3.5 0.599 83.3 86.3 -3.0 0.621 Teacher/staff salaries 68.6 79.3 -10.7 0.174 68.6 80.0 -11.5 0.130 Teacher tenure 48.6 61.3 -12.8 0.141 48.6 63.4 -14.8 0.075 Curriculum 80.0 77.1 2.9 0.780 80.0 75.3 4.7 0.640 Length of school day 58.3 70.7 -12.3 0.151 58.3 68.6 -10.3 0.183 Student discipline 72.2 81.6 -9.3 0.181 72.2 80.2 -8.0 0.248 Student admissions 51.4 63.5 -12.1 0.118 51.4 64.7 -13.3 0.105
Measures of Staffing Autonomy (Percentages) School dismissed any teacher during previous year for performance issues 40.0 39.0 1.0 0.688 40.0 37.9 2.1 0.731 School has collective bargaining agreement 19.4 16.2 3.2 0.962 19.4 16.0 3.4 0.961 Certification requirements
Full state certification in field being taught 45.7 49.3 -3.6 0.939 45.7 48.0 -2.2 0.952 At least temporary/emergency certification 47.1 56.1 -9.0 0.419 47.1 56.9 -9.8 0.392
Measures of Charter School Accountability Beyond NCLB Requirements (Percentages) School held accountable for student attendance 25.0 13.9 11.1 0.189 25.0 13.0 12.0 0.156 School held accountable for dropout and transfer Rate 11.1 8.7 2.4 0.523 11.1 6.6 4.5 0.336 School held accountable for math/reading state test scores 33.3 16.8 16.6 0.062 33.3 16.0 17.3 0.052 School held accountable for other standardized test scores 16.7 13.2 3.5 0.969 16.7 12.4 4.3 0.922
Requirements Imposed by Authorizer Annual report to authorizer (percentage) >90.0 92.7 NR a 0.706 >90.0 92.1 NR a 0.733 Standardized test results for AYP (percentage) 91.7 94.3 -2.7 0.414 91.7 94.0 -2.3 0.497 Authorizer requires more frequent reports on (percentages):
Student admissions 19.4 32.4 -12.9 0.152 19.4 30.8 -11.4 0.174 Student mobility (dropouts and transfers) 19.4 17.2 2.3 0.723 19.4 19.4 0.0 0.906 Student demographics 33.3 28.2 5.1 0.464 33.3 29.0 4.3 0.515 Finances 34.3 43.6 -9.3 0.312 34.3 42.6 -8.3 0.313 Adequacy/Safety of facilities 14.3 20.4 -6.1 0.361 14.3 19.7 -5.5 0.399

E-17
Difference p-value
Charter Schools in Study
Other Charter Schools,
Study States Only Difference p-value Characteristic
Charter Schools in Study
All Other Charter Schools
Number of authorizer visits per year (mean) 1.2 2.5 -1.4 0.201 1.2 2.6 -1.4 0.214 School has received written notification about authorizer concerns (percentage) 16.7 18.9 -2.2 0.839 16.7 17.6 -0.9 0.891 School has been required to develop/follow improvement plan (percentage) <10.0 20.3 NR a 0.011 † <10.0 18.0 NR a 0.022 †
Sample Size—Characteristics Based on Principal Survey Alone 35 299 35 239 †Difference is statistically significant at the 0.05 level, two-tailed test. ††Difference is statistically significant at the 0.01 level, two-tailed test. a Difference is not reported (NR) to mitigate risk of disclosure from small cell sizes.
Table E.8 (continued)
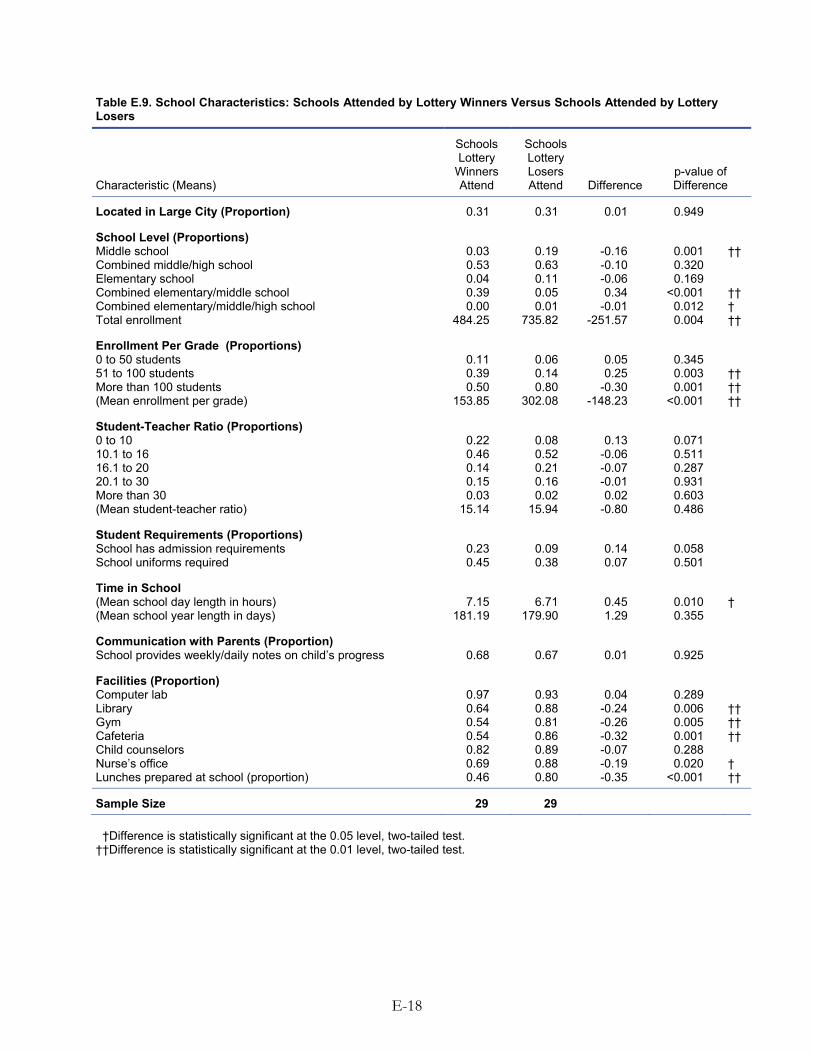
E-18
Table E.9. School Characteristics: Schools Attended by Lottery Winners Versus Schools Attended by Lottery Losers
Characteristic (Means)
Schools Lottery
Winners Attend
Schools Lottery Losers Attend Difference
p-value of Difference
Located in Large City (Proportion) 0.31 0.31 0.01 0.949
School Level (Proportions) Middle school 0.03 0.19 -0.16 0.001 †† Combined middle/high school 0.53 0.63 -0.10 0.320 Elementary school 0.04 0.11 -0.06 0.169 Combined elementary/middle school 0.39 0.05 0.34 <0.001 †† Combined elementary/middle/high school 0.00 0.01 -0.01 0.012 † Total enrollment 484.25 735.82 -251.57 0.004 ††
Enrollment Per Grade (Proportions) 0 to 50 students 0.11 0.06 0.05 0.345 51 to 100 students 0.39 0.14 0.25 0.003 †† More than 100 students 0.50 0.80 -0.30 0.001 †† (Mean enrollment per grade) 153.85 302.08 -148.23 <0.001 ††
Student-Teacher Ratio (Proportions) 0 to 10 0.22 0.08 0.13 0.071 10.1 to 16 0.46 0.52 -0.06 0.511 16.1 to 20 0.14 0.21 -0.07 0.287 20.1 to 30 0.15 0.16 -0.01 0.931 More than 30 0.03 0.02 0.02 0.603 (Mean student-teacher ratio) 15.14 15.94 -0.80 0.486
Student Requirements (Proportions) School has admission requirements 0.23 0.09 0.14 0.058 School uniforms required 0.45 0.38 0.07 0.501
Time in School (Mean school day length in hours) 7.15 6.71 0.45 0.010 † (Mean school year length in days) 181.19 179.90 1.29 0.355
Communication with Parents (Proportion) School provides weekly/daily notes on child’s progress 0.68 0.67 0.01 0.925
Facilities (Proportion) Computer lab 0.97 0.93 0.04 0.289 Library 0.64 0.88 -0.24 0.006 †† Gym 0.54 0.81 -0.26 0.005 †† Cafeteria 0.54 0.86 -0.32 0.001 †† Child counselors 0.82 0.89 -0.07 0.288 Nurse’s office 0.69 0.88 -0.19 0.020 † Lunches prepared at school (proportion) 0.46 0.80 -0.35 <0.001 ††
Sample Size 29 29 †Difference is statistically significant at the 0.05 level, two-tailed test. ††Difference is statistically significant at the 0.01 level, two-tailed test.

E-19
Table E.10. Academic Programming: Schools Attended by Lottery Winners Versus Schools Attended by Lottery Losers
Mean Characteristic
Schools Lottery
Winners Attend
Schools Lottery Losers Attend Difference
p-value of Difference
School Focus (Proportions) Regular elementary or secondary 0.70 0.85 -0.15 0.046 † Special program emphasis 0.26 0.10 0.16 0.027 † Alternative 0.04 0.05 -0.01 0.849
Student Grouping for Instruction (Proportions) Some/all math classes grouped by ability level 0.39 0.56 -0.17 0.063 Some/all English language arts classes grouped by ability level 0.36 0.46 -0.09 0.317
Methods for Organizing Classes (Proportions) In houses 0.60 0.62 -0.02 0.832 Student groups remain with same teacher across grades 0.38 0.23 0.15 0.083 Interdisciplinary teaching 0.72 0.60 0.12 0.127 Paired/team teaching 0.45 0.57 -0.11 0.254
Available Programs (Proportions) Talented/gifted/other program for advanced learners 0.73 0.92 -0.19 0.019 † Foreign language immersion programs 0.50 0.77 -0.27 0.001 †† Tutors 0.77 0.63 0.14 0.080 Music program 0.93 0.95 -0.02 0.621 Art program 0.92 0.85 0.07 0.212 Physical education 0.93 0.97 -0.05 0.271 After-school/before-school program 0.78 0.81 -0.04 0.666 Instruction specifically designed for LEP students 0.54 0.83 -0.29 0.001 ††
Schoolwide Title I Program (Proportion) 0.26 0.34 -0.08 0.418
Approach of Math Textbook Used in 7th Grade (Proportions) Traditional or conventional approach 0.37 0.44 -0.08 0.456 Reform approach 0.35 0.27 0.08 0.437 Hybrid approach 0.28 0.29 -0.01 0.953
Number of Required Books in 7th Grade Advanced ELA classes 8.69 10.08 -1.39 0.562 Regular ELA classes 7.91 7.63 0.28 0.897 Remedial ELA classes 7.68 7.17 0.51 0.809
Sample Size 29 29 †Difference is statistically significant at the 0.05 level, two-tailed test. ††Difference is statistically significant at the 0.01 level, two-tailed test.

E-20
Table E.11. Characteristics of Leadership and Staff: Schools Attended by Lottery Winners Versus Schools Attended by Lottery Losers
Mean Characteristic
Schools Lottery
Winners Attend
Schools Lottery Losers Attend Difference
p-value of Difference
Principal Characteristics
Experience Mean number of years at any school 6.32 5.83 0.48 0.689 Mean number of years at current school 3.21 3.10 0.10 0.818
Education (Proportions) Principal holds less than a master’s degree 0.08 0.04 0.04 0.345 Principal holds a master’s degree 0.52 0.52 0.00 0.974 Principal holds a Ed. Specialist degree 0.31 0.32 -0.01 0.924 Principal holds a Ph.D. 0.10 0.12 -0.03 0.603
Teacher Characteristics
Experience Fraction of school’s teachers with more than 5 years experience (proportions)
Less than one-third 0.04 0.08 -0.05 0.160 One-third to two-thirds 0.46 0.48 -0.03 0.772 More than two-thirds 0.51 0.43 0.07 0.413
Compensation Mid-point of salary range (in dollars) $48,353 $48,993 -$641 0.713
Qualifications (Proportions) Teachers with full state certification 0.79 0.90 -0.12 0.004 †† Teachers classified as highly qualified 0.90 0.94 -0.04 0.201
Sample Size 29 29 †Difference is statistically significant at the 0.05 level, two-tailed test. ††Difference is statistically significant at the 0.01 level, two-tailed test.

E-21
Table E.12. Student Characteristics and Performance: Schools Attended by Lottery Winners Versus Schools Attended by Lottery Losers
Mean Characteristic
Schools Lottery
Winners Attend
Schools Lottery Losers Attend Difference
p-value of Difference
Students’ Race/Ethnicity (Proportions) Hispanic 0.26 0.32 -0.05 0.450 White 0.56 0.46 0.10 0.191 Black 0.12 0.16 -0.03 0.451 Other race 0.05 0.06 -0.01 0.409
Student Behavior Average daily attendance rate 94.98 94.73 0.26 0.647 Proportion of enrolled students suspended out-of-school 0.03 0.06 -0.02 0.033 †
Student Needs (Proportions) Students receiving free or reduced-price lunches 0.33 0.45 -0.12 0.055 Students with learning disability and/or IEP 0.12 0.14 -0.02 0.274 Students classified as LEP 0.04 0.11 -0.06 0.005 ††
Students Meeting Proficiency on State Assessments
Proficiency Rate—Percentage of Students Meeting Proficiency Level on State Assessment Math
Grade 6 60.6 49.6 11.0 0.049 † Grade 7 61.1 48.8 12.3 0.039 † Grade 8 61.6 49.3 12.3 0.038 †
English/ Language art Grade 6 65.8 56.4 9.5 0.118 Grade 7 71.2 58.9 12.3 0.031 † Grade 8 69.4 58.4 11.0 0.111
Proficiency Rate Relative to State Average—Difference Between School and State Proficiency Rates Math
Grade 6 13.4 2.5 10.9 0.001 †† Grade 7 15.2 2.8 12.4 0.001 †† Grade 8 14.1 1.8 12.3 0.003 ††
English/ Language art Grade 6 13.2 3.0 10.2 0.013 † Grade 7 17.9 5.5 12.5 0.006 †† Grade 8 17.0 5.7 11.3 0.004 ††
Sample Size 29 29 †Difference is statistically significant at the 0.05 level, two-tailed test. ††Difference is statistically significant at the 0.01 level, two-tailed test.

E-22
Table E.13. Autonomy: Schools Attended by Lottery Winners Versus Schools Attended by Lottery Losers
Mean Characteristic
Schools Lottery
Winners Attend
Schools Lottery Losers Attend Difference
p-value of Difference
Budgetary Autonomy (Proportions) School sets its own policies regarding:
Budgetary expenses 0.75 0.45 0.30 <0.001 †† Teacher/staff salaries 0.58 0.12 0.46 <0.001 †† Professional development 0.40 0.38 0.02 0.864
Staffing Autonomy (Proportions) School sets its own policies regarding:
Teacher tenure 0.45 0.08 0.37 <0.001 †† Staff hiring/firing 0.85 0.53 0.32 <0.001 ††
Barriers to dismissing teachers District personnel policies 0.27 0.43 -0.16 0.049 † Length of time/amount of documentation for termination
process 0.33 0.60 -0.27 0.001 †† Teacher tenure 0.31 0.52 -0.21 0.013 † Teacher associations/unions 0.15 0.49 -0.33 <0.001 ††
School dismissed any teacher during previous year for performance issues 0.37 0.28 0.09 0.312 School has collective bargaining agreement 0.22 0.70 -0.48 <0.001 ††
Certification Requirements (Proportions) Full state certification in field being taught 0.49 0.63 -0.15 0.098 At least temporary/emergency certification 0.51 0.70 -0.20 0.035 †
Curricular Autonomy (Proportions) School sets its own policies regarding:
Student assessment 0.64 0.26 0.38 <0.001 †† Curriculum 0.70 0.22 0.48 <0.001 ††
Other Measures of Autonomy (Proportions) School sets its own policies regarding:
Length of school year 0.46 0.14 0.32 <0.001 †† Length of school day 0.30 0.07 0.23 0.004 †† Student discipline 0.65 0.25 0.40 <0.001 †† Student admissions 0.42 0.13 0.29 0.001 ††
Sample Size 29 29 †Difference is statistically significant at the 0.05 level, two-tailed test. ††Difference is statistically significant at the 0.01 level, two-tailed test.
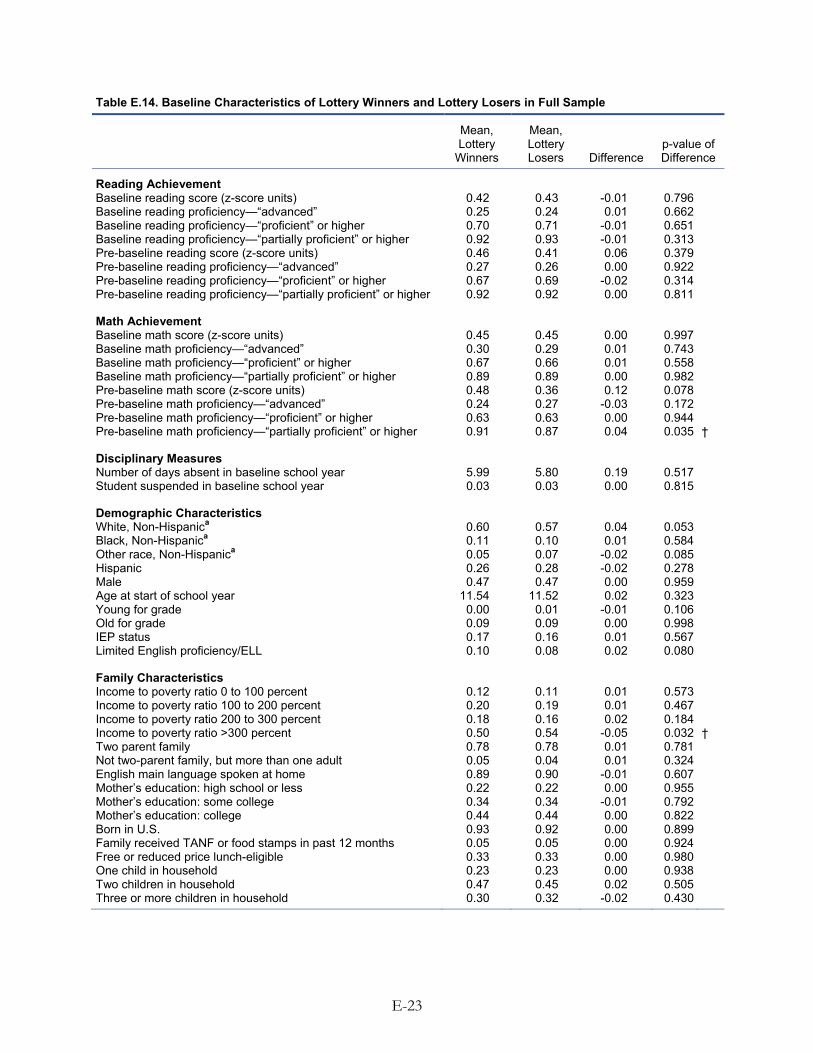
E-23
Table E.14. Baseline Characteristics of Lottery Winners and Lottery Losers in Full Sample
Mean, Lottery
Winners
Mean, Lottery Losers Difference
p-value of Difference
Reading Achievement Baseline reading score (z-score units) 0.42 0.43 -0.01 0.796 Baseline reading proficiency—“advanced” 0.25 0.24 0.01 0.662 Baseline reading proficiency—“proficient” or higher 0.70 0.71 -0.01 0.651 Baseline reading proficiency—“partially proficient” or higher 0.92 0.93 -0.01 0.313 Pre-baseline reading score (z-score units) 0.46 0.41 0.06 0.379 Pre-baseline reading proficiency—“advanced” 0.27 0.26 0.00 0.922 Pre-baseline reading proficiency—“proficient” or higher 0.67 0.69 -0.02 0.314 Pre-baseline reading proficiency—“partially proficient” or higher 0.92 0.92 0.00 0.811
Math Achievement Baseline math score (z-score units) 0.45 0.45 0.00 0.997 Baseline math proficiency—“advanced” 0.30 0.29 0.01 0.743 Baseline math proficiency—“proficient” or higher 0.67 0.66 0.01 0.558 Baseline math proficiency—“partially proficient” or higher 0.89 0.89 0.00 0.982 Pre-baseline math score (z-score units) 0.48 0.36 0.12 0.078 Pre-baseline math proficiency—“advanced” 0.24 0.27 -0.03 0.172 Pre-baseline math proficiency—“proficient” or higher 0.63 0.63 0.00 0.944 Pre-baseline math proficiency—“partially proficient” or higher 0.91 0.87 0.04 0.035 †
Disciplinary Measures Number of days absent in baseline school year 5.99 5.80 0.19 0.517 Student suspended in baseline school year 0.03 0.03 0.00 0.815
Demographic Characteristics White, Non-Hispanica 0.60 0.57 0.04 0.053 Black, Non-Hispanica 0.11 0.10 0.01 0.584 Other race, Non-Hispanica 0.05 0.07 -0.02 0.085 Hispanic 0.26 0.28 -0.02 0.278 Male 0.47 0.47 0.00 0.959 Age at start of school year 11.54 11.52 0.02 0.323 Young for grade 0.00 0.01 -0.01 0.106 Old for grade 0.09 0.09 0.00 0.998 IEP status 0.17 0.16 0.01 0.567 Limited English proficiency/ELL 0.10 0.08 0.02 0.080
Family Characteristics Income to poverty ratio 0 to 100 percent 0.12 0.11 0.01 0.573 Income to poverty ratio 100 to 200 percent 0.20 0.19 0.01 0.467 Income to poverty ratio 200 to 300 percent 0.18 0.16 0.02 0.184 Income to poverty ratio >300 percent 0.50 0.54 -0.05 0.032 † Two parent family 0.78 0.78 0.01 0.781 Not two-parent family, but more than one adult 0.05 0.04 0.01 0.324 English main language spoken at home 0.89 0.90 -0.01 0.607 Mother’s education: high school or less 0.22 0.22 0.00 0.955 Mother’s education: some college 0.34 0.34 -0.01 0.792 Mother’s education: college 0.44 0.44 0.00 0.822 Born in U.S. 0.93 0.92 0.00 0.899 Family received TANF or food stamps in past 12 months 0.05 0.05 0.00 0.924 Free or reduced price lunch-eligible 0.33 0.33 0.00 0.980 One child in household 0.23 0.23 0.00 0.938 Two children in household 0.47 0.45 0.02 0.505 Three or more children in household 0.30 0.32 -0.02 0.430

Table E.14 (continued)
E-24
Difference p-value of Difference
Mean, Lottery
Winners
Mean, Lottery Losers
School Enrollment Enrolled in charter school at baseline 0.04 0.06 -0.02 0.129 Enrolled in private school at baseline 0.08 0.10 -0.02 0.115 Enrolled in public school at baseline 0.86 0.83 0.03 0.080 Home schooled at baseline 0.02 0.01 0.01 0.145 Baseline school type unknown 0.01 0.01 0.00 0.859 Changed schools midyear in baseline school 0.01 0.01 0.00 0.690
Number of Studentsb 1,698 1,144
Number of Sites 29 29 Note: Sample includes students in full analysis sample (whether or not they have baseline test score data) in
the sites included in the main impact analyses. aRace categories are mutually exclusive. bSample size differs for some of the individual baseline characteristics due to differential rates of missing data for different characteristics.
†Difference between lottery winners and losers significantly different from zero at 0.05 level, two-tailed test. ††Difference between lottery winners and losers significantly different from zero at 0.01 level, two-tailed test.

E-25
Table E.15. Baseline Characteristics of Lottery Winners and Losers Included in Analysis of Year 2 Test Score Data
Mean, Lottery
Winners
Mean, Lottery Losers Difference
p-value of Difference
Reading Achievement Baseline reading score (z-score units) 0.40 0.38 0.02 0.598 Baseline reading proficiency—“advanced” 0.25 0.22 0.03 0.153 Baseline reading proficiency—“proficient” or higher 0.70 0.70 0.00 0.997 Baseline reading proficiency—“partially proficient” or higher 0.92 0.93 -0.01 0.442 Pre-baseline reading score (z-score units) 0.43 0.36 0.08 0.270 Pre-baseline reading proficiency—“advanced” 0.27 0.23 0.04 0.079 Pre-baseline reading proficiency—“proficient” or higher 0.70 0.67 0.03 0.294 Pre-baseline reading proficiency—“partially proficient” or higher 0.92 0.92 0.00 0.969
Math Achievement Baseline math score (z-score units) 0.41 0.39 0.02 0.645 Baseline math proficiency—“advanced” 0.29 0.28 0.01 0.615 Baseline math proficiency—“proficient” or higher 0.66 0.65 0.01 0.700 Baseline math proficiency—“partially proficient” or higher 0.89 0.89 0.00 0.856 Pre-baseline math score (z-score units) 0.43 0.32 0.11 0.132 Pre-baseline math proficiency—“advanced” 0.24 0.22 0.02 0.372 Pre-baseline math proficiency—“proficient” or higher 0.66 0.60 0.05 0.074 Pre-baseline math proficiency—“partially proficient” or higher 0.90 0.85 0.04 0.070
Disciplinary Measures Number of days absent in baseline school year 6.03 5.26 0.77 0.018 † Student suspended in baseline school year 0.04 0.03 0.00 0.895
Demographic Characteristics White, Non-Hispanica 0.58 0.54 0.04 0.067 Black, Non-Hispanica 0.12 0.11 0.01 0.754 Other race, Non-Hispanica 0.05 0.07 -0.02 0.180 Hispanic 0.28 0.30 -0.02 0.370 Male 0.46 0.48 -0.01 0.654 Age at start of school year 11.58 11.56 0.02 0.490 Young for grade 0.00 0.01 0.00 0.439 Old for grade 0.10 0.09 0.00 0.803 IEP status 0.19 0.15 0.03 0.177 Limited English proficiency/ELL 0.11 0.08 0.03 0.070
Family Characteristics Income to poverty ratio 0 to 100 percent 0.12 0.13 -0.01 0.705 Income to poverty ratio 100 to 200 percent 0.22 0.21 0.01 0.548 Income to poverty ratio 200 to 300 percent 0.19 0.15 0.04 0.077 Income to poverty ratio >300 percent 0.47 0.51 -0.04 0.079 Two parent family 0.78 0.78 0.00 0.902 Not two-parent family, but more than one adult 0.05 0.03 0.01 0.247 English main language spoken at home 0.89 0.90 0.00 0.915 Mother’s education: high school or less 0.23 0.26 -0.03 0.241 Mother’s education: some college 0.37 0.36 0.01 0.744 Mother’s education: college 0.41 0.39 0.02 0.490 Born in U.S. 0.93 0.92 0.00 0.850 Family received TANF or food stamps in past 12 months 0.05 0.05 0.00 0.710 Free or reduced price lunch-eligible 0.36 0.37 -0.02 0.481 One child in household 0.22 0.24 -0.01 0.605 Two children in household 0.47 0.44 0.03 0.283 Three or more children in household 0.30 0.32 -0.02 0.490
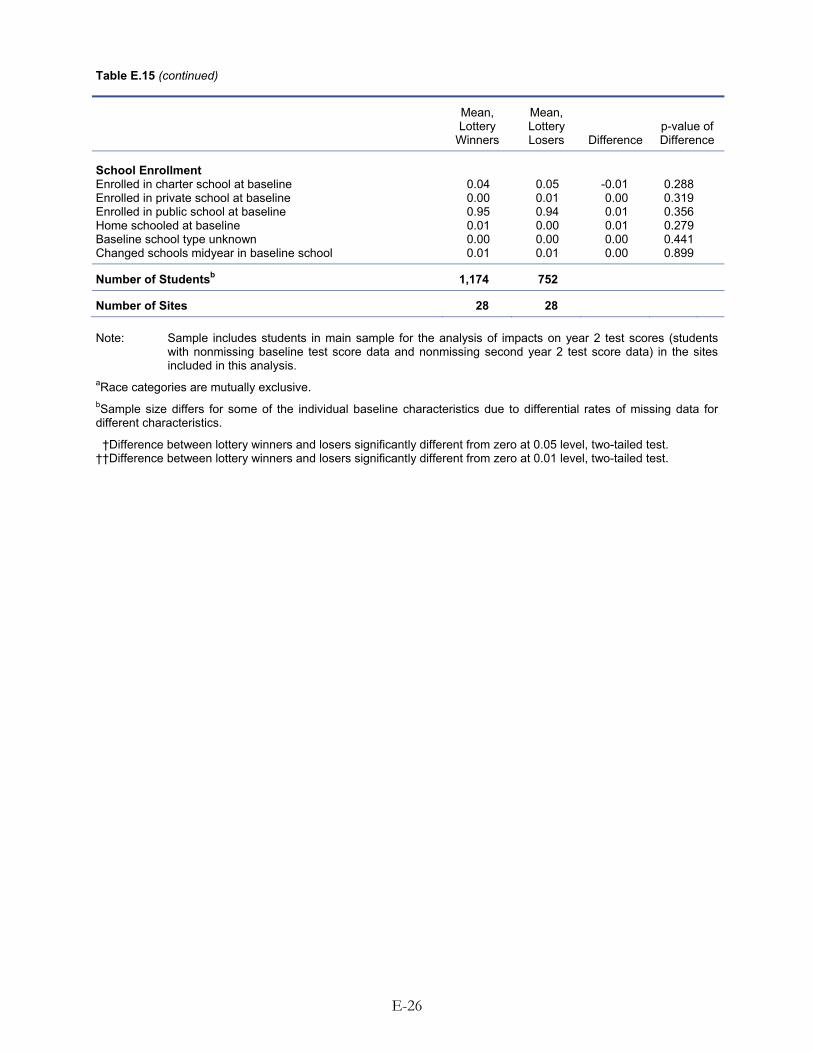
E-26
Difference p-value of Difference
Table E.15 (continued)
Mean, Lottery
Winners
Mean, Lottery Losers
School Enrollment Enrolled in charter school at baseline 0.04 0.05 -0.01 0.288 Enrolled in private school at baseline 0.00 0.01 0.00 0.319 Enrolled in public school at baseline 0.95 0.94 0.01 0.356 Home schooled at baseline 0.01 0.00 0.01 0.279 Baseline school type unknown 0.00 0.00 0.00 0.441 Changed schools midyear in baseline school 0.01 0.01 0.00 0.899
Number of Studentsb 1,174 752
Number of Sites 28 28 Note: Sample includes students in main sample for the analysis of impacts on year 2 test scores (students
with nonmissing baseline test score data and nonmissing second year 2 test score data) in the sites included in this analysis.
aRace categories are mutually exclusive. bSample size differs for some of the individual baseline characteristics due to differential rates of missing data for different characteristics.
†Difference between lottery winners and losers significantly different from zero at 0.05 level, two-tailed test. ††Difference between lottery winners and losers significantly different from zero at 0.01 level, two-tailed test.

APPENDIX F
SUPPLEMENTAL TABLES FOR CHAPTER IV

This page is intentionally left blank.

In Appendix F, we provide supplementary tables for the analysis of study charter school impacts on student achievement, including sensitivity tests of the main results presented in Chapter IV and impact estimates for student subgroups.
A. Sensitivity Tests
1. Approach to Averaging Site-Level Impact Estimates
As discussed in Appendix D, we computed an equally weighted average of the site-level impact estimates to obtain our main estimates. To test the sensitivity of our results to our approach, we estimated impacts by using a two-stage generalized least squares (GLS) procedure described by Hanushek (1974). The approach accords more weight to more precisely estimated site-level impacts, such as sites with larger samples. The GLS approach may be statistically more efficient (lower sampling variance) than the equally weighted average. As shown in Appendix Table F.1, results are similar to the main impact estimates in that the substantive finding does not change: no impacts are statistically significant after adjusting for multiple comparisons.
2. Covariates
Our main impact model adjusted for baseline covariates to increase the precision of our estimates. To assess the sensitivity of our results to the model specification, we estimated an alternative model that did not include any covariates other than site fixed effects and site-treatment status interactions. The results of the test are presented in Appendix Table F.2. Again, the substantive finding does not change in that no impacts are statistically significant after adjusting for multiple comparisons, although the magnitude of the impact on mathematics scores decreased by half.
3. Rules for Dropping or Retaining Sites
Our main impact estimates excluded sites with fewer than 5 lottery winners or losers, an overall response rate lower than 50 percent, or a difference in response rates between lottery winners and losers greater than 30 percentage points. To assess the sensitivity of our results to these conditions, we also estimated models that (1) retained the main response rate requirements but excluded sites with fewer than 10 lottery winners or losers, (2) retained the main sample size requirement of at least 5 students per group but dropped the response rate requirements, and (3) included all sites with any valid data. We present the results of the sensitivity tests in Appendix Table F.3. Impacts are not statistically significant after adjusting for multiple comparisons in any of these alternative specifications.
4. Approach to Accounting for Missing Outcome Data
In general, random assignment ensures that the coefficient δ̂ from equation (1) is an unbiased estimate of the impact of an offer of admission to the study charter school(s) in site j on the outcome . However, one of the primary outcomes of interest for the study was student test scores, which were missing for many sample members, particularly those who attended private schools; most states did not require private schools to administer the same test as that administered by the charter and traditional public schools. Lottery losers were more likely to attend a private
ijy
F-3

school than lottery winners because they were denied admission to the study charter school to which they applied.158 Moreover, private school attendance may have been correlated with student achievement. These differential rates of missing data between lottery winners and losers could have biased the impact estimates if not addressed.
As described in Chapter II, to minimize the possibility of bias attributable to differential rates of missing test score outcome data between lottery winners and losers, we limited the sample to students with valid baseline test score data. These students were more likely to have nonmissing follow-up test scores regardless of whether they were admitted to a study charter school.
As one alternative to this approach, we estimated impacts by using data from all sample members regardless of whether they had valid baseline test scores and adjusted for differential rates of missing outcome data by using nonresponse weights.159 The nonresponse weights incorporated information about differences between the baseline characteristics of students with and without key outcome data to construct weights that make the sample for which we have data as comparable as possible to the full study sample. Intuitively speaking, the nonresponse weights gave more weight in the analysis to those cases with valid outcome data that “look like” the cases with missing outcome data based on characteristics available for both sets of students (those with and those without valid outcome data).
In addition, to assess the possible effects of bias attributable to differential rates of missing data under the most extreme circumstances, we estimated bounds on the impact estimates, following an approach proposed by Lee (2005). The approach identified the excess proportion of lottery losers with missing data relative to lottery winners. Then, given that the two most extreme possible situations for determining the impact estimate were that all the (unobserved) lottery losers with missing data were in either the upper tail of the test score distribution or the lower tail, the approach established bounds on the impact estimate based on the two extremes. “Trimming” the upper tail of the test score distribution among lottery winners provided a lower bound on the impact estimate; trimming the lower tail provided an upper bound.
In our case, to determine the lower bound of the impact on test scores, we dropped from the lottery winners at each site the top jP percent of students based on their test score results, where jP is determined so that the proportion of lottery winners with nonmissing test score data in site j equals the proportion of lottery losers with nonmissing test score data. To determine the upper bound on the impact estimate, we dropped from the lottery winners at each site the bottom jP percent of students based on test score results before estimating the impact. While this approach provides reliable bounds on the impact estimates, the bounds may be too broad to yield useful information about the effect of charter schools (for instance, the bounds may span zero).
158 In follow-up Year 1, 12 percent of lottery losers attended a private school versus 2 percent of lottery winners. In
Year 2, the comparable percentages were 11 and 2 percent. 159 In particular, we adjusted our basic sampling weights, which account for students’ likelihood of being lottery
winners, so that the overall nonresponse weights also account for differences between the characteristics of sample members for whom we have outcome data versus those for whom we do not have outcome data.
F-4

F-5
The results of these sensitivity tests are presented in Appendix Table F.4.
5. Clustering of Standard Errors
Our main models assumed fixed site effects rather than the clustering of standard errors at the site level. To assess the sensitivity of our assumption, we estimated alternative models that clustered at the school and site levels. The results of these sensitivity tests are presented in Appendix Table F.5; no impacts are statistically significant.
6. Definition of Treatment Status
As discussed in Appendix A, we classified students as lottery winners (the treatment group) if they were offered admission to study charter schools on the basis of lottery results—through either the lottery or a post-lottery admission offer. Students who participated in the lotteries but never received an admission offer to a study charter school made up the control group. However, we placed students offered admission in the second half of the first follow-up school year in the control group rather than in the treatment group. To assess the sensitivity of our results to the definition of treatment status, we estimated impacts by using two alternative definitions—one that dropped all students who received an admission offer after the start of the school year and a second that dropped all students who received an admission offer after the admission lottery. The results of the sensitivity tests are presented in Appendix Table F.6; impacts are not statistically significant after adjusting for multiple comparisons.
B. Charter School Impacts on Student Achievement for Student Subgroups
1. Certification for Free or Reduced-Price Lunch
We estimated impacts separately for students who were and were not eligible for free or reduced-price lunch (FRPL). The results of the subgroup analysis are presented in Appendix Table F.7. For students not eligible for FRPL, impacts are negative in reading in Year 2 and in mathematics in Years 1 and 2. Conversely, students eligible for FRPL had positive impacts in mathematics in Year 2 on the order of 0.17 standard deviation. The differences in impacts between the subgroups are statistically significant after adjusting for multiple comparisons in reading in Year 2 and in mathematics in Years 1 and 2.
2. Race
We estimated impacts separately for students who identified as white, non–Hispanic and those who identified as Hispanic and/or nonwhite. The results of this subgroup analysis are presented in Appendix Table F.8. Impacts are not statistically significant for either subgroup after adjusting for multiple comparisons; differences between subgroups are not statistically significant.
3. Gender
We estimated impacts separately for male and female students. The results of this subgroup analysis are presented in Appendix Table F.9. Impacts are not statistically significant for either group, nor are the differences between subgroups statistically significant.

F-6
4. Baseline Reading Achievement
We estimated impacts separately for students above and below the median test score in a given site in reading at baseline. The results of this subgroup analysis are presented in Appendix Table F.10. For students scoring above the median at baseline, impacts in reading were negative in Year 2. No other impacts are statistically significant after adjusting for multiple comparisons; the differences between subgroups are not statistically significant for either subject in either year.
5. Baseline Mathematics Achievement
We estimated impacts separately for students above and below the median test score in a given site in mathematics at baseline. The results of this subgroup analysis are presented in Appendix Table F.11. Impacts are not statistically significant for either group; the differences between subgroups are not statistically significant after adjusting for multiple comparisons.

F-7
Table F.1. Impacts on Student Achievement Sensitivity of Impact Estimates to Method of Aggregating Site-Level Impacts
Outcome
Primary Impact Model Alternative Model
(Equal Weight for Each Site) (GLS Weight)
ITT Impact Estimate p-value ITT Impact Estimate p-value
Reading Achievement
Year 1 -0.04 0.214 -0.04 0.329 Year 2 -0.07 0.032† -0.07 0.114
Math Achievement Year 1 -0.06 0.061 -0.06 0.092 Year 2 -0.06 0.136 -0.06 0.380
Number of Students 2,150 2,150
Number of Sites 29 29 Note: The Benjamini-Hochberg procedure was used to adjust for multiple comparisons within this domain. Sample sizes vary for individual outcomes.
GLS = Generalized least squares. ITT = Intent to treat.
†Difference between lottery winners and losers is statistically significant at the 0.05 level, two-tailed test. ††Difference between lottery winners and losers is statistically significant at the 0.01 level, two-tailed test. *Difference between lottery winners and losers is statistically significant at the 0.05 level after adjusting for multiple comparisons within outcome domains, two-
tailed test. **Difference between lottery winners and losers is statistically significant at the 0.01 level after adjusting for multiple comparisons within outcome domains, two-
tailed test.

F-8
Table F.2. Impacts on Student Achievement Sensitivity of Impact Estimates to Adjustment for Covariates
Primary Impact Model Alternative Model
(Adjustment for Covariates) (No Adjustment for Covariates)
Outcome ITT Impact Estimate p-value ITT Impact Estimate p-value
Reading Achievement
Year 1 -0.04 0.214 -0.04 0.426 Year 2 -0.07 0.032† -0.05 0.327
Math Achievement Year 1 -0.06 0.061 -0.03 0.585 Year 2 -0.06 0.136 -0.03 0.570
Number of Students 2,150 2,150
Number of Sites 29 29 Note: The Benjamini-Hochberg procedure was used to adjust for multiple comparisons within this domain. Sample sizes vary for individual outcomes.
GLS = Generalized least squares. ITT = Intent to treat.
†Difference between lottery winners and losers is statistically significant at the 0.05 level, two-tailed test. ††Difference between lottery winners and losers is statistically significant at the 0.01 level, two-tailed test. *Difference between lottery winners and losers is statistically significant at the 0.05 level after adjusting for multiple comparisons within outcome domains, two-
tailed test. **Difference between lottery winners and losers is statistically significant at the 0.01 level after adjusting for multiple comparisons within outcome domains, two-
tailed test.

F-9
Table F.3. Impacts on Student Achievement Sensitivity of Impact Estimates to Rules for Dropping or Retaining Sites
Primary Impact Model Alternative Model 1 Alternative Model 2 Alternative Model 3
Require Larger Samples
in Each Site Drop Response Rate
Requirements Keep All Sites with
Valid Data
ITT Impact Estimate p-value
ITT Impact Estimate p-value
ITT Impact Estimate p-value
ITT Impact Estimate p-value
Reading Achievement
Year 1 -0.04 0.214 -0.02 0.501 -0.04 0.214 -0.05 0.098 Year 2 -0.07 0.032† -0.05 0.088 -0.06 0.048† -0.08 0.032†
Math Achievement Year 1 -0.06 0.061 -0.06 0.064 -0.05 0.056 -0.07 0.025† Year 2 -0.06 0.136 -0.06 0.134 -0.06 0.130 -0.08 0.049†
Number of Students 2,150 2,072 2,150 2,179
Number of Sites 29 26 29 31 Note: The Benjamini-Hochberg procedure was used to adjust for multiple comparisons within this domain. Sample sizes vary for individual outcomes.
ITT = Intent to treat.
†Difference between lottery winners and losers is statistically significant at the 0.05 level, two-tailed test. ††Difference between lottery winners and losers is statistically significant at the 0.01 level, two-tailed test. *Difference between lottery winners and losers is statistically significant at the 0.05 level after adjusting for multiple comparisons within outcome domains, two-
tailed test. **Difference between lottery winners and losers is statistically significant at the 0.01 level after adjusting for multiple comparisons within outcome domains, two-
tailed test.

F-10
Table F.4. Impacts on Student Achievement Sensitivity of Impact Estimates to Approach for Accounting for Missing Data
Primary Impact Model Alternative Model 1 Alternative Model 2
Full Sample with Nonresponse
Weights Bound Potential Impact Estimates
ITT Impact Estimate p-value
ITT Impact Estimate p-value
ITT Estimate Lower Bound p-value
ITT Estimate Upper Bound p-value
Reading Achievement
Year 1 -0.04 0.214 -0.05 0.145 -0.15 <0.001††** 0.10 0.001††** Year 2 -0.07 0.032† -0.07 0.033† -0.19 <0.001††** 0.04 0.198
Math Achievement Year 1 -0.06 0.061 -0.07 0.025† -0.16 <0.001††** 0.05 0.086 Year 2 -0.06 0.136 -0.03 0.520 -0.21 <0.001††** 0.07 0.055
Number of Students 2,150 2,069 2,176 2,181
Number of Sites 29 27 29 29 Note: The Benjamini-Hochberg procedure was used to adjust for multiple comparisons within this domain. Sample sizes vary for individual outcomes.
ITT = Intent to treat.
†Difference between lottery winners and losers is statistically significant at the 0.05 level, two-tailed test. ††Difference between lottery winners and losers is statistically significant at the 0.01 level, two-tailed test. *Difference between lottery winners and losers is statistically significant at the 0.05 level after adjusting for multiple comparisons within outcome domains, two-tailed test. **Difference between lottery winners and losers is statistically significant at the 0.01 level after adjusting for multiple comparisons within outcome domains, two-tailed test.

F-11
Table F.5. Impacts on Student Achievement Sensitivity of Impact Estimates to Clustering of Standard Errors
Outcome
Primary Impact Model Alternative Model 1 Alternative Model 2
(No Clustering) (Clustering by School) (Clustering by Site)
ITT Impact Estimate p-value
ITT Impact Estimate p-value
ITT Impact Estimate p-value
Reading Achievement
Year 1 -0.04 0.214 -0.05 0.197 -0.05 0.318 Year 2 -0.07 0.032† -0.07 0.047 -0.07 0.127
Math Achievement Year 1 -0.06 0.061 -0.06 0.087 -0.06 0.163 Year 2 -0.06 0.136 -0.06 0.238 -0.06 0.376
Number of Studentsa 2,150 2,133 2,150
Number of Sites 29 29 29 Note: The Benjamini-Hochberg procedure was used to adjust for multiple comparisons within this domain. Sample sizes vary for individual outcomes. As
described in Appendix D, the primary impact model includes site fixed effects and separate treatment status indicators for each site in order to produce impact estimates for each site, which are then averaged to produce the overall impact estimate. The inclusion of site fixed effects precluded clustering of standard errors by site. To allow clustering by school or by site in the alternative models, we instead estimated models with a single treatment status indicator and rescaled the sample weights to give equal weight to each site. While in theory clustering of standard errors should not affect the point estimates, point estimates may differ slightly between these two models due to rounding error arising from the alternative modeling approach.
ITT = Intent to treat. a Sample sizes are smaller in the model with clustering by school because students with missing information on specific school attended were dropped from the analysis.
†Difference between lottery winners and losers is statistically significant at the 0.05 level, two-tailed test. ††Difference between lottery winners and losers is statistically significant at the 0.01 level, two-tailed test. *Difference between lottery winners and losers is statistically significant at the 0.05 level after adjusting for multiple comparisons within outcome domains, two-
tailed test. **Difference between lottery winners and losers is statistically significant at the 0.01 level after adjusting for multiple comparisons within outcome domains, two-
tailed test.

F-12
Table F.6. Impacts on Student Achievement Sensitivity to Definition of Treatment Status
Primary Impact Model Alternative Model 1 Alternative Model 2
Include All Students Who Received Admissions Offer in Treatment Group
Drop Students Who Received Offer After Start of School Year
Drop Students Who Received Offer After Admissions Lottery
ITT Impact Estimate p-value
ITT Impact Estimate p-value
ITT Impact Estimate p-value
Reading Achievement
Year 1 -0.04 0.214 -0.05 0.169 -0.03 0.350 Year 2 -0.07 0.032† -0.06 0.060 -0.08 0.014†
Math Achievement Year 1 -0.06 0.061 -0.07 0.033† -0.07 0.039† Year 2 -0.06 0.136 -0.05 0.194 -0.08 0.081
Number of Students 2,150 1,945 1,736
Number of Sites 29 28 27 Note: The Benjamini-Hochberg procedure was used to adjust for multiple comparisons within this domain. Sample sizes vary for individual outcomes.
ITT = Intent to treat.
†Difference between lottery winners and losers is statistically significant at the 0.05 level, two-tailed test. ††Difference between lottery winners and losers is statistically significant at the 0.01 level, two-tailed test. *Difference between lottery winners and losers is statistically significant at the 0.05 level after adjusting for multiple comparisons within outcome domains, two-
tailed test. **Difference between lottery winners and losers is statistically significant at the 0.01 level after adjusting for multiple comparisons within outcome domains, two-
tailed test.
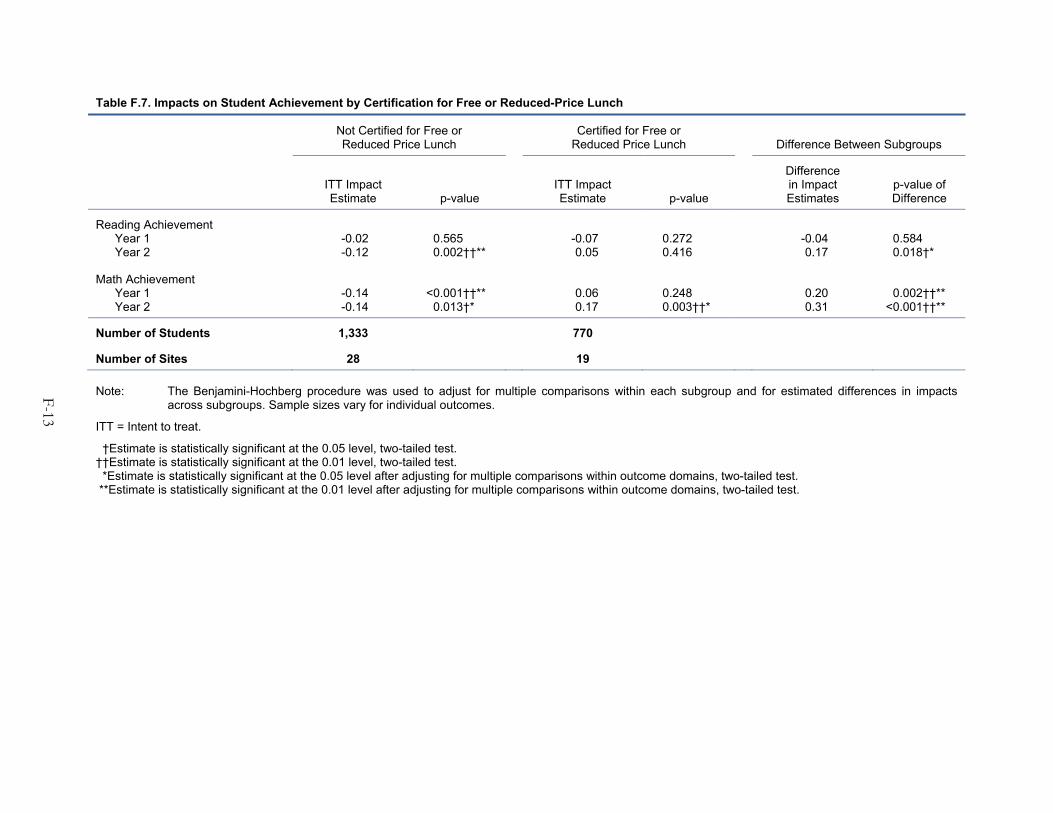
F-13
Table F.7. Impacts on Student Achievement by Certification for Free or Reduced-Price Lunch
Not Certified for Free or Reduced Price Lunch
Certified for Free or Reduced Price Lunch Difference Between Subgroups
ITT Impact Estimate p-value
ITT Impact Estimate p-value
Difference in Impact Estimates
p-value of Difference
Reading Achievement Year 1 -0.02 0.565 -0.07 0.272 -0.04 0.584 Year 2 -0.12 0.002††** 0.05 0.416 0.17 0.018†*
Math Achievement Year 1 -0.14 <0.001††** 0.06 0.248 0.20 0.002††** Year 2 -0.14 0.013†* 0.17 0.003††* 0.31 <0.001††**
Number of Students 1,333 770
Number of Sites 28 19 Note: The Benjamini-Hochberg procedure was used to adjust for multiple comparisons within each subgroup and for estimated differences in impacts
across subgroups. Sample sizes vary for individual outcomes.
ITT = Intent to treat.
†Estimate is statistically significant at the 0.05 level, two-tailed test. ††Estimate is statistically significant at the 0.01 level, two-tailed test. *Estimate is statistically significant at the 0.05 level after adjusting for multiple comparisons within outcome domains, two-tailed test. **Estimate is statistically significant at the 0.01 level after adjusting for multiple comparisons within outcome domains, two-tailed test.

F-14
Table F.8. Impacts on Student Achievement by Race
White, non-Hispanic Nonwhite and/or Hispanic Difference Between Subgroups
ITT Impact Estimate p-value
ITT Impact Estimate p-value
Difference in Impact Estimates
p-value of Difference
Reading Achievement Year 1 0.02 0.672 -0.03 0.632 -0.05 0.525 Year 2 -0.07 0.150 -0.08 0.220 -0.02 0.837
Math Achievement Year 1 -0.09 0.033† 0.01 0.890 0.09 0.171 Year 2 -0.09 0.147 -0.03 0.706 0.05 0.608
Number of Students 1,106 994
Number of Sites 23 22 Note: The Benjamini-Hochberg procedure was used to adjust for multiple comparisons within each subgroup and for estimated differences in impacts
across subgroups. Sample sizes vary for individual outcomes.
ITT = Intent to treat.
†Estimate is statistically significant at the 0.05 level, two-tailed test. ††Estimate is statistically significant at the 0.01 level, two-tailed test. *Estimate is statistically significant at the 0.05 level after adjusting for multiple comparisons within outcome domains, two-tailed test. **Estimate is statistically significant at the 0.01 level after adjusting for multiple comparisons within outcome domains, two-tailed test.

F-15
Table F.9. Impacts on Student Achievement by Gender
Female Male Difference Between Subgroups
ITT Impact Estimate p-value
ITT Impact Estimate p-value
Difference in Impact Estimates
p-value of Difference
Reading Achievement Year 1 0.01 0.808 -0.02 0.642 -0.03 0.614 Year 2 -0.08 0.055 0.03 0.548 0.11 0.086
Math Achievement Year 1 -0.04 0.285 -0.03 0.480 0.01 0.841 Year 2 -0.09 0.066 0.02 0.760 0.11 0.151
Number of Students 1,098 1,003
Number of Sites 28 27 Note: The Benjamini-Hochberg procedure was used to adjust for multiple comparisons within each subgroup and for estimated differences in impacts
across subgroups. Sample sizes vary for individual outcomes.
ITT = Intent to treat.
†Estimate is statistically significant at the 0.05 level, two-tailed test. ††Estimate is statistically significant at the 0.01 level, two-tailed test. *Estimate is statistically significant at the 0.05 level after adjusting for multiple comparisons within outcome domains, two-tailed test. **Estimate is statistically significant at the 0.01 level after adjusting for multiple comparisons within outcome domains, two-tailed test.

F-16
Table F.10. Impacts on Student Achievement by Baseline Reading Achievement
Baseline Reading Achievement
Below Median Baseline Reading Achievement
Above Median Difference Between Subgroups
ITT Impact Estimate p-value
ITT Impact Estimate p-value
Difference in Impact Estimates
p-value of Difference
Reading Achievement Year 1 -0.08 0.089 -0.04 0.434 0.04 0.536 Year 2 -0.02 0.655 -0.13 0.007††* -0.11 0.117
Math Achievement Year 1 -0.03 0.482 -0.03 0.539 0.00 0.983 Year 2 0.05 0.337 -0.11 0.057 -0.16 0.036†
Number of Students 1,077 1,019
Number of Sites 26 26 Note: The Benjamini-Hochberg procedure was used to adjust for multiple comparisons within each subgroup and for estimated differences in impacts
across subgroups. Sample sizes vary for individual outcomes.
ITT = Intent to treat.
†Estimate is statistically significant at the 0.05 level, two-tailed test. ††Estimate is statistically significant at the 0.01 level, two-tailed test. *Estimate is statistically significant at the 0.05 level after adjusting for multiple comparisons within outcome domains, two-tailed test. **Estimate is statistically significant at the 0.01 level after adjusting for multiple comparisons within outcome domains, two-tailed test.

F-17
Table F.11. Impacts on Student Achievement by Baseline Math Achievement
Baseline Math Achievement
Below Median Baseline Math Achievement
Above Median Difference Between
Subgroups
ITT Impact Estimate p-value
ITT Impact Estimate p-value
Difference in Impact Estimates
p-value of Difference
Reading Achievement Year 1 -0.01 0.874 -0.08 0.075 -0.07 0.253 Year 2 0.01 0.747 -0.10 0.026† -0.12 0.064
Math Achievement Year 1 -0.05 0.252 -0.03 0.478 0.02 0.778 Year 2 0.08 0.124 -0.10 0.063 -0.18 0.016†
Number of Students 983 1,068
Number of Sites 26 27 Note: The Benjamini-Hochberg procedure was used to adjust for multiple comparisons within each subgroup and for estimated differences in impacts
across subgroups. Sample sizes vary for individual outcomes.
ITT = Intent to treat.
†Estimate is statistically significant at the 0.05 level, two-tailed test. ††Estimate is statistically significant at the 0.01 level, two-tailed test. *Estimate is statistically significant at the 0.05 level after adjusting for multiple comparisons within outcome domains, two-tailed test. **Estimate is statistically significant at the 0.01 level after adjusting for multiple comparisons within outcome domains, two-tailed test.

APPENDIX G
SUPPLEMENTAL TABLES FOR CHAPTER V

This page is intentionally left blank.

G-3
In Appendix G, we provide supplementary tables for the analysis exploring the relationship between various factors reflecting charter school characteristics and charter school impacts, including the associations between factors and impacts (Section A) as well as estimated impacts on achievement by subgroups based on factors (Section B). We also present the results of an exploratory analysis examining possible hypotheses of why study charter schools in large urban areas serving more disadvantaged and lower achieving students had more positive/less negative impacts than those outside of large urban areas serving fewer disadvantaged students as well as students with higher baseline achievement levels (Section C).
A. Associations Between Factors and Impacts
1. Correlation Matrix
In Appendix Table G.1, we present the correlation matrix of all of the factors/charter school characteristics we examined. The correlation coefficient, which ranges in value from -1 to 1, provides a measure of the extent to which as one factor increases, the other also tends to increase.
2. Associations Between Factors and Charter School Impacts on Achievement
We discuss our approach to measuring the association between charter school factors and impacts in chapters II and V. In Appendix Table G.2, we present the estimated coefficients from interactions between each factor and treatment status in the impact models for the four achievement outcomes. The coefficients reflect the bivariate association between the factor and impacts on Year 1 and Year 2 reading and mathematics scores. Across 18 factors, 1 is statistically significantly associated with impacts on reading scores in Year 1, and 8 in Year 2; 5 are associated with impacts on mathematics scores in Year 1 and 10 in Year 2.
In Appendix Table G.3, we present the estimated coefficients from interactions between treatment status and each factor included in our multivariate analysis (to determine whether the simple bivariate association between a given characteristic and charter school impacts would persist once we accounted for other characteristics). The two versions of the model differ only in the variable representing student characteristics included in the model—in the first we include the percentage of the study charter school’s students eligible for free or reduced-price meals, in the second we include students’ average baseline test scores. Several factors are statistically significantly associated with at least one impact using this approach, including the factors related do student characteristics.
3. Associations Between Factors and Charter School Impacts on Satisfaction
We also modeled the associations between charter school factors and impacts on our student/parent satisfaction composite. In Appendix Table G.4, we present the estimated coefficients from interactions between each factor and treatment status in the impact model for that outcome. Three factors are statistically significantly related to satisfaction: both total enrollment and enrollment per grade are negatively associated with impacts, as is whether the school is located in an urban area.

G-4
B. Charter School Impacts on Student Achievement for Factor-Based Subgroups
In Appendix Tables G.5 through G.16 we show the estimated impacts for subgroups defined by factors/charter school characteristics that had significant bivariate associations with at least one achievement outcome
1. Level of Autonomy
We estimated impacts separately for sites with high and low levels of autonomy. The results of the subgroup analysis are presented in Appendix Table G.5. For sites with less autonomy, impacts are negative in mathematics in Year 1 (the difference in impacts between the subgroups on that outcome is also statistically significant after adjusting for multiple comparisons).
2. Revenue
We estimated impacts separately for sites with high and low levels of revenue. The results of the subgroup analysis are presented in Appendix Table G.6. For sites with less per-student revenue, impacts are negative in both reading and mathematics in both years (the differences in impacts between the subgroups are also statistically significant after adjusting for multiple comparisons in mathematics).
3. Enrollment
We estimated impacts separately for sites with high and low total student enrollment. The results of the subgroup analysis are presented in Appendix Table G.7. For sites with more students, impacts are negative in reading in Year 2 and mathematics in both years. The difference in impacts between the subgroups is also statistically significant after adjusting for multiple comparisons in mathematics in Year 2.
4. Hours of Operation
We estimated impacts separately for sites with more and less time in school (length of the school day and year). The results of the subgroup analysis are presented in Appendix Table G.8. For sites with a relatively shorter school day/year, impacts are negative in mathematics in Year 2. No differences in impacts between the subgroups are statistically significant after adjusting for multiple comparisons.
5. Student/Teacher Ratio
We estimated impacts separately for sites with higher and lower student/teacher ratios. The results of the subgroup analysis are presented in Appendix Table G.9. For sites with lower student/teacher ratios impacts are negative in reading in Year 2; conversely, impacts are also negative in mathematics in Year 1 for sites with higher student/teacher ratios. No differences in impacts between the subgroups are statistically significant after adjusting for multiple comparisons.
6. Use of Ability Grouping
We estimated impacts separately for sites with more and less use of ability grouping. The results of the subgroup analysis are presented in Appendix Table G.10. For sites with less ability grouping, impacts are negative in reading in Year 2 and mathematics in both years. The difference in impacts

G-5
between the subgroups is also statistically significant after adjusting for multiple comparisons in mathematics in Year 2.
7. Concentration of Students Eligible for Free/Reduced Price Lunches
We estimated impacts separately for sites with relatively high and low proportions of students eligible for FRPL. The results of the subgroup analysis are presented in Appendix Table G.11. For sites with a lower concentration of students eligible for FRPL, impacts are negative in reading in Year 2 and mathematics in both years. In sites with a higher concentration of such students, impacts are positive in mathematics in year 2. The difference in impacts between the subgroups is also statistically significant after adjusting for multiple comparisons in mathematics in both years.
8. Average Student Baseline Achievement
We estimated impacts separately for sites whose average student baseline achievement was above and below the median. The results of the subgroup analysis based on baseline reading performance are presented in Appendix Table G.12. For sites serving students with average baseline achievement below the median in reading, impacts are positive in mathematics in Year 2. In sites serving students with average baseline achievement above the median in reading, impacts are negative in reading in year 2 and in mathematics in both years. The difference in impacts between the subgroups is also statistically significant after adjusting for multiple comparisons in both reading and mathematics in Year 2.
The results of the subgroup analysis based on baseline mathematics performance are presented in Appendix Table G.13. For sites serving students with average baseline achievement below the median in mathematics, impacts are positive in mathematics in Year 2. In sites serving students with average baseline achievement above the median in mathematics, impacts are negative in reading and mathematics in year 2. The difference in impacts between the subgroups is also statistically significant after adjusting for multiple comparisons in both reading and mathematics in Year 2.
The results of the subgroup analysis based on the average of reading mad mathematics performance at baseline are presented in Appendix Table G.14. For sites serving students with average baseline achievement below the median in both subjects combined, impacts are positive in mathematics in Year 2. In sites serving students with average baseline achievement above the median in both subjects combined, impacts are negative in reading in year 2 and in mathematics in both years. The difference in impacts between the subgroups is also statistically significant after adjusting for multiple comparisons in both reading and mathematics in Year 2.
9. Concentration of Students Identifying as White, non-Hispanic
We estimated impacts separately for sites with relatively high and low proportions of students who identified as white, non-Hispanic. The results of the subgroup analysis are presented in Appendix Table G.15. For sites with a lower concentration of students identifying as white, non-Hispanic, impacts are negative in reading in both years. No differences in impacts between the subgroups are statistically significant after adjusting for multiple comparisons.

G-6
10. Urbanicity
We estimated impacts separately for sites located in urban areas and those not located in urban areas. The results of the subgroup analysis are presented in Appendix Table G.16. For sites located in urban areas, impacts are positive in mathematics in Year 2. In sites not located in urban areas, impacts are negative in reading in year 2 and in mathematics in both years. The difference in impacts between the subgroups is also statistically significant after adjusting for multiple comparisons in mathematics in both years.
C. Hypotheses for the Estimated Relationships Between Charter Schools’ Student Characteristics and Impacts on Student Achievement
The design of this study did not allow us to definitively address the issue of why urban charter schools serving more disadvantaged and lower-achieving students in our study had more positive or less negative impacts on students’ math scores than charter schools serving more advantaged and higher-achieving students. In a very exploratory set of analyses, we investigated several hypotheses that might explain the relationship using data available from the study.
• Do peer effects explain the more positive impacts of charter schools serving disadvantaged students?
In other words, are disadvantaged and low-achieving students experiencing greater, potentially beneficial changes in their peer groups when they move to a charter school? We had no direct measure of characteristics like motivation or ability among the peers of lottery winners and lottery losers. As described in Chapter III, we did measure the proportion scoring at the proficient level or higher among all students in schools attended by lottery winners versus those attended by lottery losers.160 However, this difference does not merely reflect differences in the underlying characteristics of peers, in the case of the lottery winners it also captures whatever impacts the charter school has on student achievement, and we cannot disentangle the two potential effects.
Instead, we created a proxy measure of peer group achievement for the lottery winners using the proficiency rate of the lottery losers. Because of random assignment, lottery losers would have attended a study charter school with other students like themselves if they had been admitted through the lottery. Thus, the proficiency rate for the group of lottery losers in each site can be viewed as the expected ability level of charter school students’ peers in that site, but one that is unaffected by the impact of being in a charter school. To measure the actual achievement of lottery losers’ peers, we used the overall proficiency rate in the schools and grades the lottery losers attended. The difference in the achievement level of lottery winners’ and lottery losers’ peers in each site represents the average change in a student’s peer group upon being admitted to a charter school in that site.
To explore whether peer effects could explain the pattern of more positive impacts in the more disadvantaged sites, we used this proxy measures of peer achievement to examine whether students admitted to charter schools in these sites experienced a more positive change in their peer groups,
160 In reading, for example, 75 percent of 7th graders in schools attended by lottery winners achieved proficiency
compared with 51 percent of 7th graders in schools attended by lottery losers. In charter school sites serving larger proportions of disadvantaged students, this differential was 61 versus 45 percent, a somewhat larger differential than in sites serving fewer disadvantaged students (61 versus 52 percent).

relative to lottery winners in less disadvantaged sites. In more disadvantaged sites, the peers of lottery winners had an average proficiency rate of 60 percent—6 percentage points higher than the peers of lottery losers; however, this difference was not statistically significant (p-value = 0.093). In less disadvantaged sites, the peers of lottery winners had an average proficiency rate of 72 percent—11 percentage points higher than the peers of lottery losers; this difference was also not statistically significant (p-value = 0.063) (Figure G.1). Thus, contrary to what we would expect if positive changes in peer achievement explained the fact that impacts were more positive in more disadvantaged sites, the 11 percentage point change in peer achievement in the less disadvantaged sites was greater than the 6 percentage point change in the more disadvantaged sites, although this difference was also not statistically significant (p-value = 0.166).
The fact that the change in peer group achievement did not differ significantly between more and less disadvantaged sites may suggest that changes in peer achievement do not explain the fact that charter school impacts are greater in sites serving more disadvantaged students. However, by measuring peer effects using all students at their schools, we may not be capturing the true peer group for sample members. For example, for schools that use ability grouping, higher achieving students may be separated from lower achieving students through most of the day.
Figure G.1. Percentage of Peers Meeting State Proficiency Standards at Sites Serving More Versus Fewer Disadvantaged Students
60
72
5461
0
20
40
60
80
100
Sites Serving More Disadvantaged
Students
Sites Serving Fewer Disadvantaged
Students
Treatment SchoolsControl Schools
• Do schools set up to serve disadvantaged and/or lower-achieving students tend to enact policies that are especially effective in boosting impacts?
There is one piece of evidence consistent with this hypothesis, at least among the charter schools participating in this study. Participating charter schools that served disadvantaged students were, on average smaller and had longer hours than schools serving advantaged students, and both
G-7

G-8
characteristics were associated with more positive impacts.161 Thus, the relationship between the extent to which students were disadvantaged and impacts was not quite as strong in the multivariate model as in the bivariate model, suggesting that some of the bivariate relationship between the proportion disadvantaged and charter school impacts was explained by these organizational factors.162 Even in the multivariate model, however, the relationship between the proportion disadvantaged and charter school impacts remained statistically significant. Thus, unless there are other effective or ineffective charter school policies or practices for which our analysis did not account, policies/practices alone cannot account for the difference in impacts between schools serving more disadvantaged/lower-achieving students and those serving more advantaged/higher-achieving students.
• Can the difference in achievement impacts between charter schools serving different student populations be explained by differences in the schools available to lottery losers?
The schools attended by lottery losers in the sample (typically traditional public schools) represent the counterfactual for this evaluation—the set of schools available to students if the charter school were not an option. However, there is not a single counterfactual—the quality of the schools available to lottery losers may have varied considerably across the different sites in the study.163 Is it possible that these differences explain the pattern of impacts we observed across different groups of participating charter schools? Is it possible, for example, that the set of disadvantaged/lower-achieving students who lost the lotteries at their charter schools had to then attend very poor quality traditional public schools?
Unfortunately, we have no way to directly measure the quality of the schools attended by lottery losers. Measures such as baseline test scores in those schools do not allow us to disentangle characteristics of the student population served with the quality of the school—a school serving very disadvantaged students may have low baseline scores even if it is highly effective for that population.164 Thus, while differences in the quality of available traditional public schools could have played a key role in determining charter school effectiveness across the more and less advantaged sites in the study, we cannot confirm or reject this hypothesis with the available evidence.
161 The bivariate correlation coefficient between the proportion of students eligible for free and reduced-price
meals and our measure of the hours in the school year was -0.59; the correlation coefficient between the proportion eligible for free and reduced-price school meals and total enrollment was -0.27.
162 For example, the association between the proportion eligible for free or reduced-price school meals and impacts on year 2 math scores was 0.665 (p-value = 0.000) in the bivariate case and 0.494 (p-value = 0.026) in the multivariate case. The association between baseline test scores and impacts on math and reading test scores followed a similar pattern.
163 In sites with below-average proportions of economically disadvantaged students, for example, schools attended by lottery losers had an average proficiency rate 6 percentage points above the state proficiency rate in math and 9 percentage points above the state rate in reading. In sites with above-average proportions of economically disadvantaged students, by contrast, schools attended by lottery losers had an average proficiency rate 3 percentage points below the state proficiency rate in both math and reading.
164 We did examine impacts on parent and student satisfaction with aspects of their school (including the quality of the school’s teachers) separately for more and less disadvantaged students, as defined by eligibility for free or reduced price lunch, in the sample. Overall, impacts on these outcomes did not significantly vary across the two groups. However, there is no guarantee that parent or student satisfaction is associated with school effectiveness.

G-9
Table G.1. Correlation of Factors Included in Analysis of Factors Associated with Charter School Impacts
Factor
Autonomy score
Accountability score
Revenue per student
Authorized by district
Operated by C
MO
School age
Total enrollment
Enrollment per grade
Hours in school year
Student teacher ratio
Proportion of teachers w
ith experience
Prevalence of ability grouping
Mean baseline reading
test score
Mean baseline m
ath test score
Average of mean baseline
test scores
Proportion white,
non-Hispanic
Proportion eligible for free/reduced-price m
eals
School in urban area
Autonomy score 1.00 Accountability score 0.23 1.00 Revenue per student 0.21 0.36 1.00 Authorized by district -0.04 -0.50 -0.41 1.00 Operated by private organization -0.37 0.28 -0.19 0.12 1.00 School age 0.04 0.13 0.32 -0.43 -0.29 1.00 Total enrollment 0.11 0.18 0.06 -0.19 0.05 0.28 1.00 Enrollment per grade 0.21 0.33 0.27 -0.28 -0.26 0.18 0.49 1.00 Total classroom time in school year (hours) 0.03 0.19 0.45 -0.08 -0.13 0.27 0.11 0.31 1.00 Student teacher ratio -0.12 -0.48 -0.16 0.34 0.15 -0.19 0.10 -0.04 0.06 1.00 Proportion of teachers with experience 0.11 -0.14 0.12 0.03 -0.24 -0.22 -0.35 -0.11 -0.42 -0.27 1.00 Use of ability grouping 0.01 0.12 0.16 -0.11 -0.19 -0.03 -0.12 0.41 0.35 -0.13 -0.10 1.00 Mean baseline reading test score -0.01 -0.11 -0.41 -0.09 -0.33 0.08 0.13 0.07 -0.49 0.03 0.05 -0.05 1.00 Mean baseline math test score -0.02 -0.03 -0.32 -0.14 -0.16 0.04 0.18 0.12 -0.58 0.03 0.23 -0.12 0.88 1.00 Average of mean baseline test scores -0.01 -0.08 -0.38 -0.12 -0.26 0.07 0.15 0.09 -0.55 0.03 0.17 -0.09 0.97 0.97 1.00 Proportion white, non-Hispanic 0.23 0.06 -0.06 -0.35 -0.43 0.20 0.03 0.00 -0.57 -0.36 0.35 0.07 0.65 0.62 0.66 1.00 Proportion eligible for free/reduced-price meals -0.15 -0.02 0.12 0.33 0.36 -0.19 -0.27 -0.09 0.59 0.24 -0.22 0.02 -0.78 -0.76 -0.79 -0.88 1.00 School in urban area 0.18 0.16 0.12 0.02 -0.07 -0.10 0.22 -0.08 -0.38 0.10 0.45 -0.38 0.27 0.40 0.34 0.39 -0.39 1.00

G-10
Table G.2. Bivariate Association Between Factors and Charter School Impacts
Association of Factor with Impact on:
Year 1 Reading
Score Year 2 Reading
Score Year 1 Math Score Year 2 Math Score
Site Characteristic/Factor Coeff. p-value Coeff. p-value Coeff. p-value Coeff. p-value
Policy Environment Autonomy score 0.002 0.927 0.010 0.626 0.038 0.055 -0.033 0.203 Accountability score 0.100 0.038† 0.047 0.329 0.064 0.141 0.027 0.611 Revenue per student 0.012 0.402 0.028 0.056 0.019 0.178 0.040 0.034† Authorized by district -0.007 0.920 0.013 0.838 -0.008 0.899 0.132 0.115 Operated by private organization -0.060 0.456 0.056 0.528 -0.082 0.302 0.141 0.192 School age -0.026 0.054 -0.020 0.172 -0.014 0.283 -0.018 0.265
School Operations Total enrollment -0.084 0.502 -0.340 0.003†† -0.281 0.015† -0.621 <0.001†† Enrollment per grade 0.042 0.869 0.085 0.740 0.195 0.421 0.006 0.987 Total classroom time in school year (hours) -0.006 0.974 0.522 0.005†† 0.362 0.054 0.917 <0.001†† Student teacher ratio -0.002 0.804 0.019 0.027† -0.015 0.036† -0.001 0.951 Proportion of teachers with experience 0.066 0.473 -0.015 0.846 0.118 0.129 -0.032 0.760 Use of ability grouping -0.003 0.966 0.131 0.074 0.187 0.003†† 0.443 <0.001††
Student and School Characteristics Mean baseline reading test score -0.064 0.492 -0.215 0.008†† -0.141 0.084 -0.562 <0.001†† Mean baseline math test score -0.106 0.304 -0.266 0.002†† -0.073 0.370 -0.611 <0.001†† Average of mean baseline reading and math test
scores -0.090 0.373 -0.257 0.003†† -0.117 0.168 -0.629 <0.001†† Proportion white, non-Hispanic 0.072 0.488 -0.196 0.046† -0.122 0.193 -0.469 <0.001†† Proportion eligible for free/reduced-price school
meals -0.025 0.819 0.292 0.007†† 0.210 0.042† 0.665 <0.001†† School in urban area -0.015 0.825 0.071 0.286 0.181 0.006†† 0.305 0.001††
Note: The factors revenue per student, total enrollment, enrollment per grade, and total classroom time in school year have been divided by 1,000.
†Coefficient is statistically different from 0 at the 0.05 level, two-tailed test. ††Coefficient is statistically different from 0 at the 0.01 level, two-tailed test.

G-11
Table G.3. Association Between Factors and Charter School Impacts, Multivariate Regressions
Association of Factors with Impact on:
Year 1
Reading Score Year 2
Reading Score Year 1
Math Score Year 2
Math Score
Site Characteristic/Factor Coeff. p-value Coeff. p-value Coeff. p-value Coeff. p-value
Model 1 Revenue per student 0.011 0.516 0.019 0.297 0.006 0.689 0.004 0.850 Total enrollment -0.165 0.235 -0.270 0.062 -0.405 0.001†† -0.316 0.039†† Total classroom time in school year (hours) 0.324 0.353 0.382 0.280 0.306 0.346 -0.173 0.647 Student teacher ratio -0.010 0.335 0.020 0.033† -0.015 0.075 0.005 0.648 Use of ability grouping -0.148 0.073 0.085 0.330 0.129 0.098 0.373 <0.001†† Average of mean baseline reading and math
test scores 0.099 0.474 -0.023 0.860 0.021 0.868 -0.534 0.003†† School in urban area 0.024 0.789 -0.008 0.921 0.070 0.364 0.120 0.207
Model 2 Revenue per student 0.008 0.680 0.019 0.303 0.007 0.679 0.026 0.222 Total enrollment -0.165 0.303 -0.294 0.077 -0.360 0.012† -0.261 0.133 Total classroom time in school year (hours) 0.308 0.436 0.455 0.265 0.172 0.647 -0.245 0.575 Student teacher ratio -0.009 0.404 0.020 0.027† -0.016 0.063 -0.002 0.829 Use of ability grouping -0.149 0.079 0.077 0.396 0.142 0.075 0.393 <0.001†† Proportion eligible for free/reduced-price school
meals -0.069 0.706 -0.037 0.841 0.082 0.650 0.494 0.026† School in urban area 0.021 0.820 -0.005 0.956 0.065 0.408 0.133 0.172
Note: The factors total enrollment, enrollment per grade, and total classroom time in school year have been divided by 1,000.
†Coefficient is statistically different from 0 at the 0.05 level, two-tailed test. ††Coefficient is statistically different from 0 at the 0.01 level, two-tailed test.
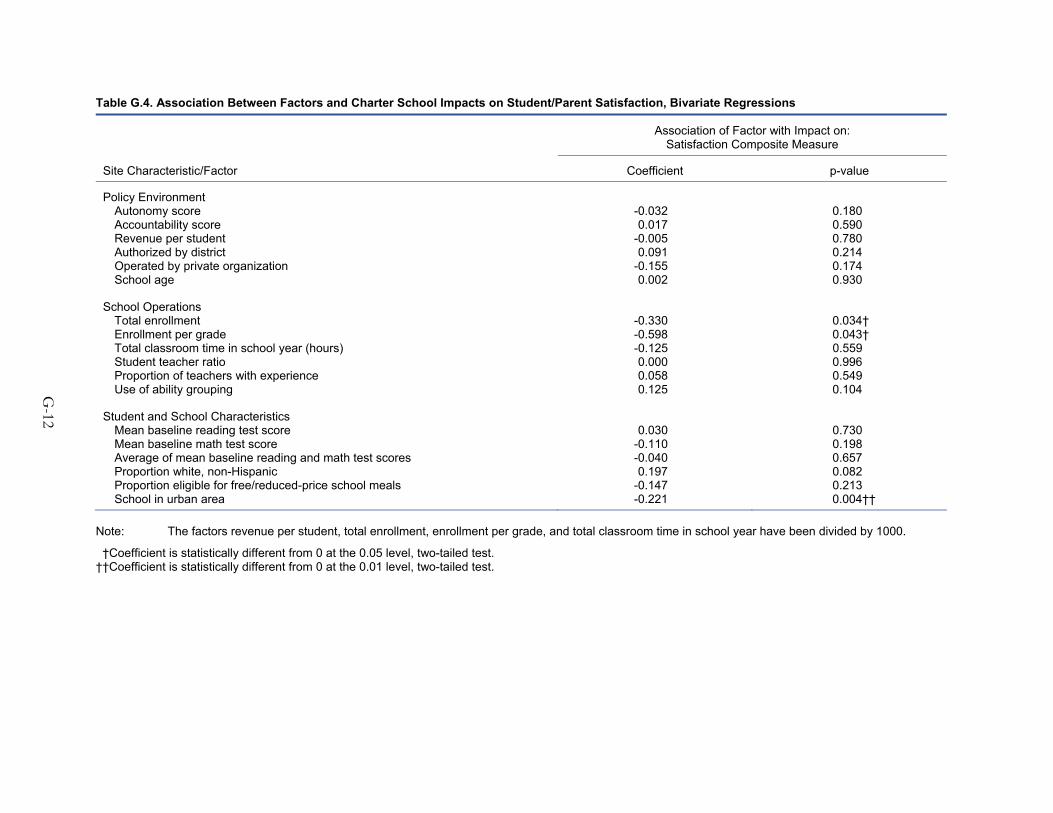
G-12
Table G.4. Association Between Factors and Charter School Impacts on Student/Parent Satisfaction, Bivariate Regressions
Association of Factor with Impact on: Satisfaction Composite Measure
Site Characteristic/Factor Coefficient p-value
Policy Environment Autonomy score -0.032 0.180 Accountability score 0.017 0.590 Revenue per student -0.005 0.780 Authorized by district 0.091 0.214 Operated by private organization -0.155 0.174 School age 0.002 0.930
School Operations Total enrollment -0.330 0.034† Enrollment per grade -0.598 0.043† Total classroom time in school year (hours) -0.125 0.559 Student teacher ratio 0.000 0.996 Proportion of teachers with experience 0.058 0.549 Use of ability grouping 0.125 0.104
Student and School Characteristics Mean baseline reading test score 0.030 0.730 Mean baseline math test score -0.110 0.198 Average of mean baseline reading and math test scores -0.040 0.657 Proportion white, non-Hispanic 0.197 0.082 Proportion eligible for free/reduced-price school meals -0.147 0.213 School in urban area -0.221 0.004††
Note: The factors revenue per student, total enrollment, enrollment per grade, and total classroom time in school year have been divided by 1000.
†Coefficient is statistically different from 0 at the 0.05 level, two-tailed test. ††Coefficient is statistically different from 0 at the 0.01 level, two-tailed test.
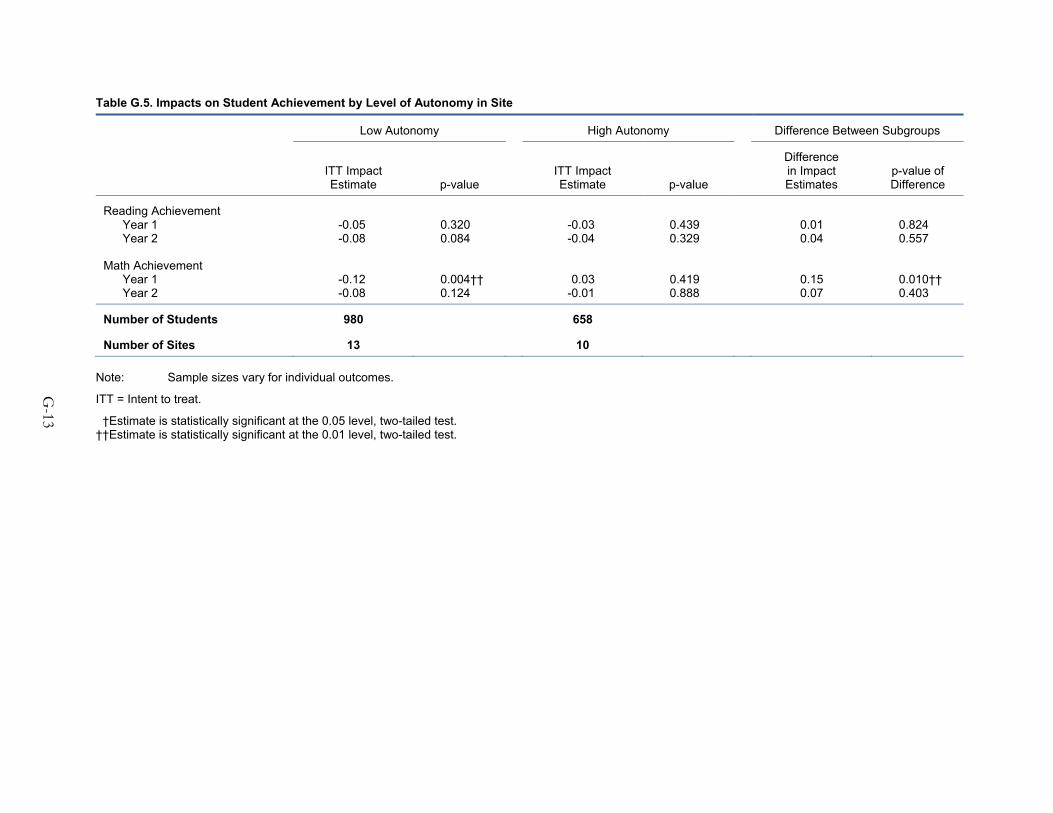
G-13
Table G.5. Impacts on Student Achievement by Level of Autonomy in Site
Low Autonomy High Autonomy Difference Between Subgroups
ITT Impact Estimate p-value
ITT Impact Estimate p-value
Difference in Impact Estimates
p-value of Difference
Reading Achievement Year 1 -0.05 0.320 -0.03 0.439 0.01 0.824 Year 2 -0.08 0.084 -0.04 0.329 0.04 0.557
Math Achievement Year 1 -0.12 0.004†† 0.03 0.419 0.15 0.010†† Year 2 -0.08 0.124 -0.01 0.888 0.07 0.403
Number of Students 980 658
Number of Sites 13 10 Note: Sample sizes vary for individual outcomes.
ITT = Intent to treat.
†Estimate is statistically significant at the 0.05 level, two-tailed test. ††Estimate is statistically significant at the 0.01 level, two-tailed test.

G-14
Table G.6. Impacts on Student Achievement by Revenue in Site
Low Revenue High Revenue Difference Between Subgroups
ITT Impact Estimate p-value
ITT Impact Estimate p-value
Difference in Impact Estimates
p-value of Difference
Reading Achievement Year 1 -0.09 0.038† -0.02 0.682 0.07 0.376 Year 2 -0.09 0.045† -0.01 0.888 0.08 0.224
Math Achievement Year 1 -0.09 0.041† 0.08 0.127 0.17 0.013† Year 2 -0.12 0.021† 0.07 0.350 0.19 0.036†
Number of Students 980 658
Number of Sites 13 10 Note: Sample sizes vary for individual outcomes.
ITT = Intent to treat.
†Estimate is statistically significant at the 0.05 level, two-tailed test. ††Estimate is statistically significant at the 0.01 level, two-tailed test.

G-15
Table G.7. Impacts on Student Achievement by Total Enrollment in Site
Low Enrollment High Enrollment Difference Between Subgroups
ITT Impact Estimate p-value
ITT Impact Estimate p-value
Difference in Impact Estimates
p-value of Difference
Reading Achievement Year 1 -0.04 0.479 -0.06 0.175 -0.02 0.731 Year 2 -0.01 0.831 -0.10 0.015† -0.10 0.118
Math Achievement Year 1 0.00 0.989 -0.09 0.023† -0.09 0.114 Year 2 0.09 0.088 -0.16 0.004†† -0.25 0.001††
Number of Students 942 1,078
Number of Sites 13 15 Note: Sample sizes vary for individual outcomes.
ITT = Intent to treat.
†Estimate is statistically significant at the 0.05 level, two-tailed test. ††Estimate is statistically significant at the 0.01 level, two-tailed test.

G-16
Table G.8. Impacts on Student Achievement by Hours of Operation of Site
Short School Day/Year Long School Day/Year Difference Between Subgroups
ITT Impact Estimate p-value
ITT Impact Estimate p-value
Difference in Impact Estimates
p-value of Difference
Reading Achievement Year 1 0.00 0.928 -0.08 0.083 -0.08 0.241 Year 2 -0.08 0.056 -0.04 0.391 0.04 0.467
Math Achievement Year 1 -0.05 0.161 -0.04 0.354 0.01 0.821 Year 2 -0.10 0.037† 0.01 0.874 0.11 0.162
Number of Students 1,286 864
Number of Sites 15 14 Note: Sample sizes vary for individual outcomes.
ITT = Intent to treat.
†Estimate is statistically significant at the 0.05 level, two-tailed test. ††Estimate is statistically significant at the 0.01 level, two-tailed test.

G-17
Table G.9. Impacts on Student Achievement by Student-Teacher Ratio in Site
Low Student-Teacher Ratio High Student-Teacher Ratio Difference Between Subgroups
ITT Impact Estimate p-value
ITT Impact Estimate p-value
Difference in Impact Estimates
p-value of Difference
Reading Achievement Year 1 -0.04 0.388 -0.04 0.362 0.00 0.950 Year 2 -0.11 0.009†† -0.01 0.836 0.10 0.095
Math Achievement Year 1 0.00 0.992 -0.10 0.018† -0.10 0.099 Year 2 -0.03 0.576 -0.06 0.287 -0.03 0.700
Number of Students 1,089 1,061
Number of Sites 14 15 Note: Sample sizes vary for individual outcomes.
ITT = Intent to treat.
†Estimate is statistically significant at the 0.05 level, two-tailed test. ††Estimate is statistically significant at the 0.01 level, two-tailed test.

G-18
Table G.10. Impacts on Student Achievement by Ability Grouping in Site
Less Use of Ability Grouping More Use of Ability Grouping Difference Between Subgroups
ITT Impact Estimate p-value
ITT Impact Estimate p-value
Difference in Impact Estimates
p-value of Difference
Reading Achievement Year 1 -0.05 0.284 -0.04 0.475 0.01 0.881 Year 2 -0.08 0.031† -0.03 0.524 0.05 0.401
Math Achievement Year 1 -0.09 0.024† 0.00 0.927 0.09 0.138 Year 2 -0.13 0.022† 0.05 0.380 0.18 0.028†
Number of Students 1,209 941
Number of Sites 15 14 Note: Sample sizes vary for individual outcomes.
ITT = Intent to treat.
†Estimate is statistically significant at the 0.05 level, two-tailed test. ††Estimate is statistically significant at the 0.01 level, two-tailed test.
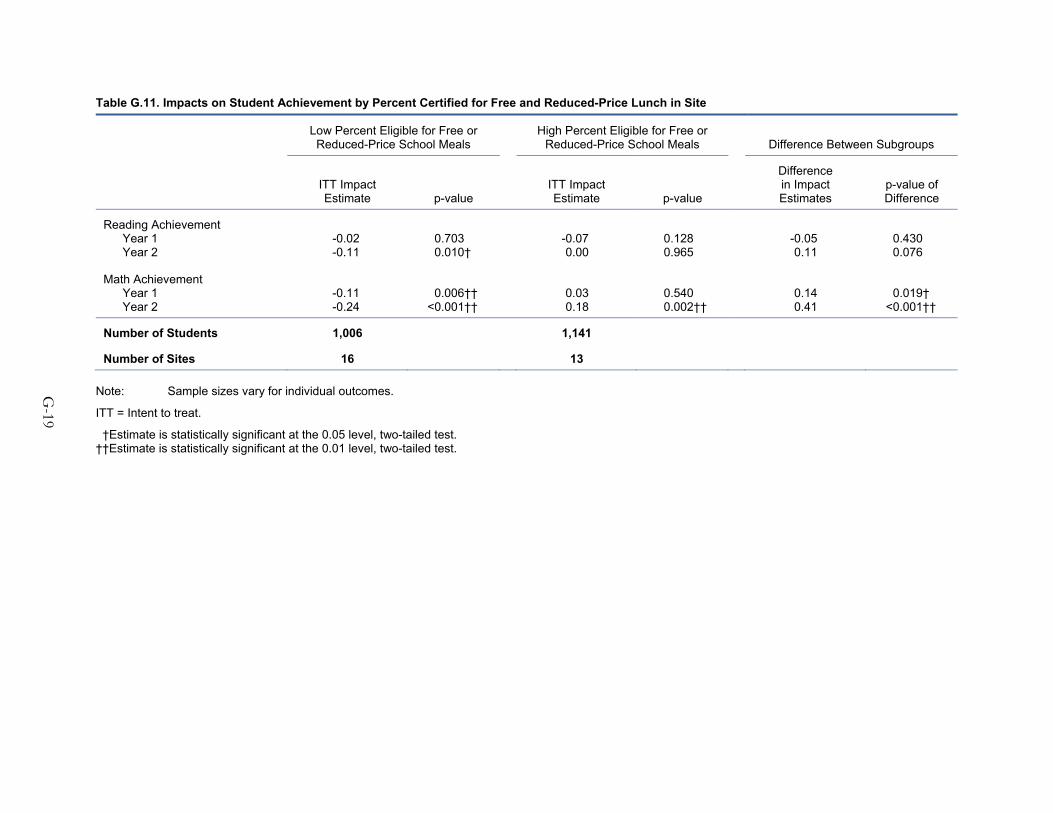
G-19
Table G.11. Impacts on Student Achievement by Percent Certified for Free and Reduced-Price Lunch in Site
Low Percent Eligible for Free or Reduced-Price School Meals
High Percent Eligible for Free or Reduced-Price School Meals Difference Between Subgroups
ITT Impact Estimate p-value
ITT Impact Estimate p-value
Difference in Impact Estimates
p-value of Difference
Reading Achievement Year 1 -0.02 0.703 -0.07 0.128 -0.05 0.430 Year 2 -0.11 0.010† 0.00 0.965 0.11 0.076
Math Achievement Year 1 -0.11 0.006†† 0.03 0.540 0.14 0.019† Year 2 -0.24 <0.001†† 0.18 0.002†† 0.41 <0.001††
Number of Students 1,006 1,141
Number of Sites 16 13 Note: Sample sizes vary for individual outcomes.
ITT = Intent to treat.
†Estimate is statistically significant at the 0.05 level, two-tailed test. ††Estimate is statistically significant at the 0.01 level, two-tailed test.

G-20
Table G.12. Impacts on Student Achievement by Average Baseline Reading Achievement in Site
Average Baseline Reading Achievement in Site
Below Median
Average Baseline Reading Achievement in Site
Above Median Difference Between Subgroups
ITT Impact Estimate p-value
ITT Impact Estimate p-value
Difference in Impact Estimates
p-value of Difference
Reading Achievement Year 1 0.00 0.917 -0.08 0.114 -0.07 0.302 Year 2 0.03 0.544 -0.15 0.001†† -0.17 0.006††
Math Achievement Year 1 0.01 0.890 -0.09 0.019† -0.10 0.090 Year 2 0.12 0.033† -0.21 <0.001†† -0.33 <0.001††
Number of Students 1,093 1,057
Number of Sites 14 15 Note: Sample sizes vary for individual outcomes.
ITT = Intent to treat.
†Estimate is statistically significant at the 0.05 level, two-tailed test. ††Estimate is statistically significant at the 0.01 level, two-tailed test.

G-21
Table G.13. Impacts on Student Achievement by Average Baseline Math Achievement in Site
Average Baseline Reading Achievement in Site
Below Median
Average Baseline Reading Achievement in Site
Above Median Difference Between Subgroups
ITT Impact Estimate p-value
ITT Impact Estimate p-value
Difference in Impact Estimates
p-value of Difference
Reading Achievement Year 1 0.01 0.827 -0.09 0.058 -0.10 0.136 Year 2 0.08 0.051 -0.20 <0.001†† -0.29 <0.001††
Math Achievement Year 1 -0.03 0.548 -0.07 0.090 -0.04 0.456 Year 2 0.16 0.006†† -0.25 <0.001†† -0.40 <0.001††
Number of Students 1,004 1,146
Number of Sites 14 15 Note: Sample sizes vary for individual outcomes.
ITT = Intent to treat.
†Estimate is statistically significant at the 0.05 level, two-tailed test. ††Estimate is statistically significant at the 0.01 level, two-tailed test.

G-22
Table G.14. Impacts on Student Achievement by Average Baseline Reading and Math Achievement in Site
Average Baseline Math Achievement in Site
Below Median
Average Baseline Math Achievement in Site
Above Median Difference Between Subgroups
ITT Impact Estimate p-value
ITT Impact Estimate p-value
Difference in Impact Estimates
p-value of Difference
Reading Achievement Year 1 0.00 0.917 -0.08 0.114 -0.07 0.302 Year 2 0.03 0.544 -0.15 0.001†† -0.17 0.006††
Math Achievement Year 1 0.01 0.890 -0.09 0.019† -0.10 0.090 Year 2 0.12 0.033† -0.21 <0.001†† -0.33 <0.001††
Number of Students 1,004 1,146
Number of Sites 14 15 Note: Sample sizes vary for individual outcomes.
ITT = Intent to treat.
†Estimate is statistically significant at the 0.05 level, two-tailed test. ††Estimate is statistically significant at the 0.01 level, two-tailed test.
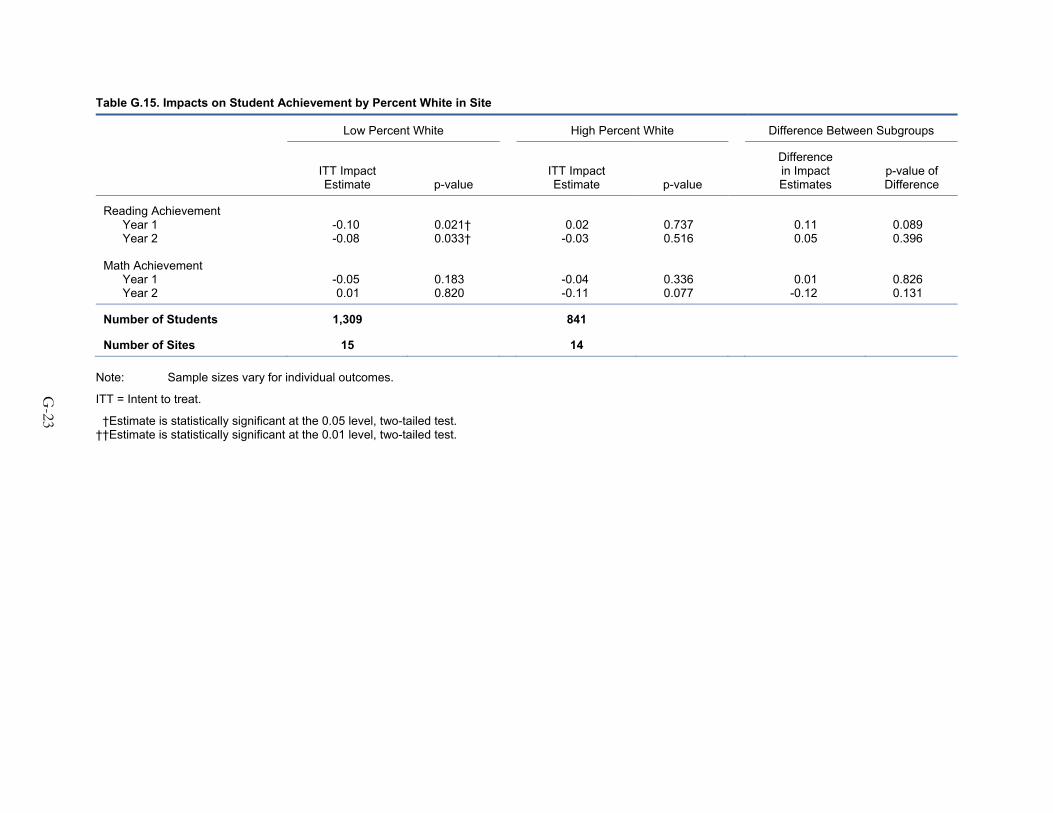
G-23
Table G.15. Impacts on Student Achievement by Percent White in Site
Low Percent White High Percent White Difference Between Subgroups
ITT Impact Estimate p-value
ITT Impact Estimate p-value
Difference in Impact Estimates
p-value of Difference
Reading Achievement Year 1 -0.10 0.021† 0.02 0.737 0.11 0.089 Year 2 -0.08 0.033† -0.03 0.516 0.05 0.396
Math Achievement Year 1 -0.05 0.183 -0.04 0.336 0.01 0.826 Year 2 0.01 0.820 -0.11 0.077 -0.12 0.131
Number of Students 1,309 841
Number of Sites 15 14 Note: Sample sizes vary for individual outcomes.
ITT = Intent to treat.
†Estimate is statistically significant at the 0.05 level, two-tailed test. ††Estimate is statistically significant at the 0.01 level, two-tailed test.

G-24
Table G.16. Impacts on Student Achievement by Site Urbanicity
Not Urban Urban Difference Between Subgroups
ITT Impact Estimate p-value
ITT Impact Estimate p-value
Difference in Impact Estimates
p-value of Difference
Reading Achievement Year 1 -0.04 0.340 -0.04 0.393 0.00 0.944 Year 2 -0.08 0.041† -0.02 0.709 0.06 0.366
Math Achievement Year 1 -0.10 0.004†† 0.06 0.265 0.16 0.015† Year 2 -0.14 0.003†† 0.16 0.033† 0.30 0.001††
Number of Students 1,472 678
Number of Sites 20 9 Note: Sample sizes vary for individual outcomes.
ITT = Intent to treat.
†Estimate is statistically significant at the 0.05 level, two-tailed test. ††Estimate is statistically significant at the 0.01 level, two-tailed test.