Embed Size (px)
Citation preview
1
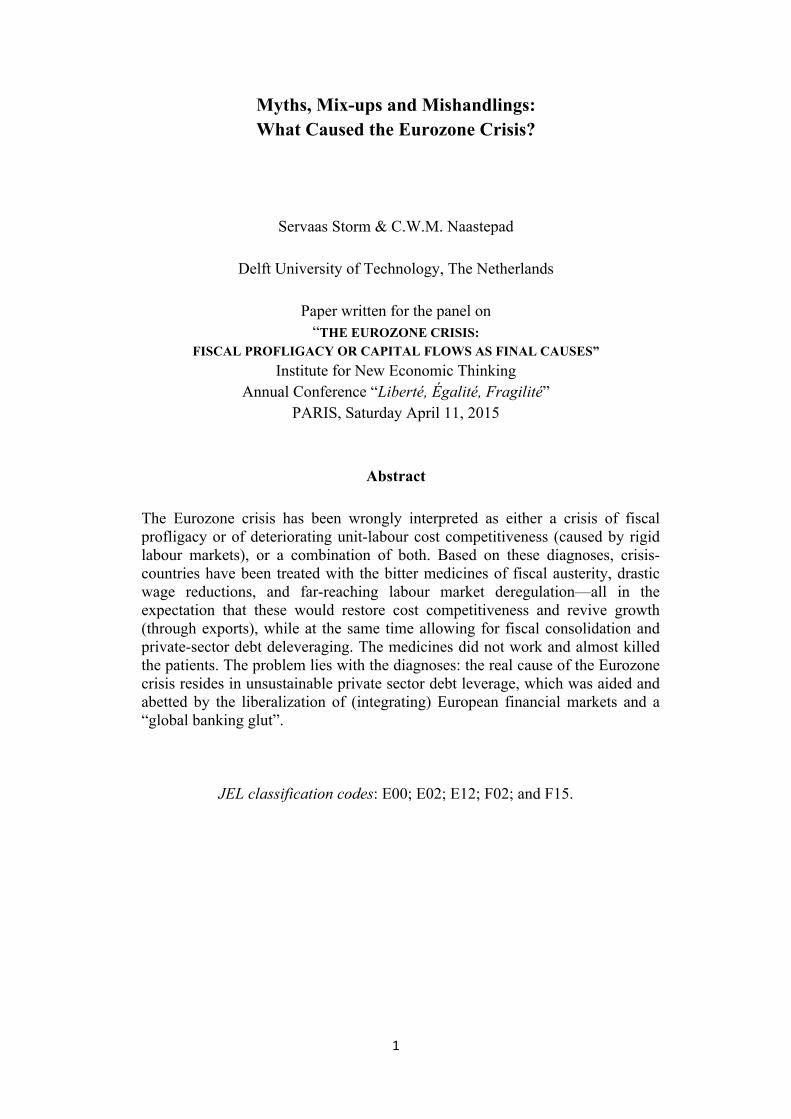
Myths, Mix-ups and Mishandlings: What Caused the Eurozone Crisis?
Servaas Storm & C.W.M. Naastepad
Delft University of Technology, The Netherlands
Paper written for the panel on “THE EUROZONE CRISIS:
FISCAL PROFLIGACY OR CAPITAL FLOWS AS FINAL CAUSES” Institute for New Economic Thinking
Annual Conference “Liberté, Égalité, Fragilité” PARIS, Saturday April 11, 2015
Abstract
The Eurozone crisis has been wrongly interpreted as either a crisis of fiscal profligacy or of deteriorating unit-labour cost competitiveness (caused by rigid labour markets), or a combination of both. Based on these diagnoses, crisis-countries have been treated with the bitter medicines of fiscal austerity, drastic wage reductions, and far-reaching labour market deregulation—all in the expectation that these would restore cost competitiveness and revive growth (through exports), while at the same time allowing for fiscal consolidation and private-sector debt deleveraging. The medicines did not work and almost killed the patients. The problem lies with the diagnoses: the real cause of the Eurozone crisis resides in unsustainable private sector debt leverage, which was aided and abetted by the liberalization of (integrating) European financial markets and a “global banking glut”.
JEL classification codes: E00; E02; E12; F02; and F15.
2
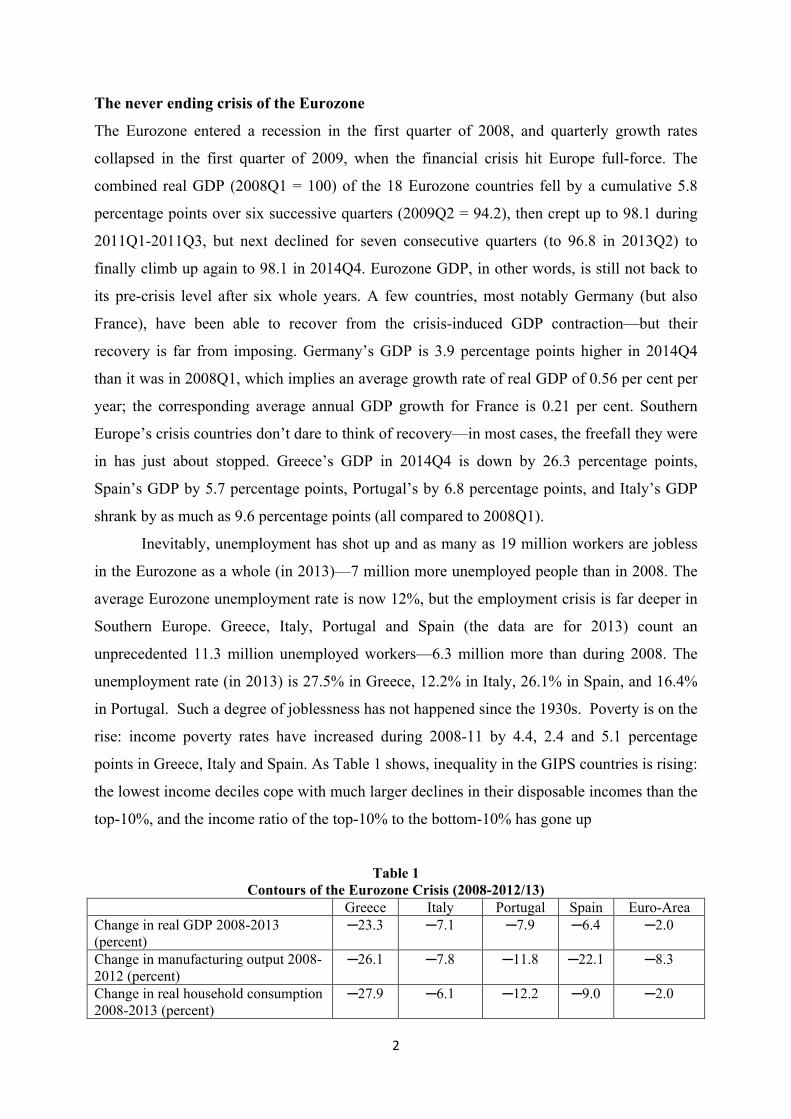
The never ending crisis of the Eurozone
The Eurozone entered a recession in the first quarter of 2008, and quarterly growth rates
collapsed in the first quarter of 2009, when the financial crisis hit Europe full-force. The
combined real GDP (2008Q1 = 100) of the 18 Eurozone countries fell by a cumulative 5.8
percentage points over six successive quarters (2009Q2 = 94.2), then crept up to 98.1 during
2011Q1-2011Q3, but next declined for seven consecutive quarters (to 96.8 in 2013Q2) to
finally climb up again to 98.1 in 2014Q4. Eurozone GDP, in other words, is still not back to
its pre-crisis level after six whole years. A few countries, most notably Germany (but also
France), have been able to recover from the crisis-induced GDP contraction—but their
recovery is far from imposing. Germany’s GDP is 3.9 percentage points higher in 2014Q4
than it was in 2008Q1, which implies an average growth rate of real GDP of 0.56 per cent per
year; the corresponding average annual GDP growth for France is 0.21 per cent. Southern
Europe’s crisis countries don’t dare to think of recovery—in most cases, the freefall they were
in has just about stopped. Greece’s GDP in 2014Q4 is down by 26.3 percentage points,
Spain’s GDP by 5.7 percentage points, Portugal’s by 6.8 percentage points, and Italy’s GDP
shrank by as much as 9.6 percentage points (all compared to 2008Q1).
Inevitably, unemployment has shot up and as many as 19 million workers are jobless
in the Eurozone as a whole (in 2013)—7 million more unemployed people than in 2008. The
average Eurozone unemployment rate is now 12%, but the employment crisis is far deeper in
Southern Europe. Greece, Italy, Portugal and Spain (the data are for 2013) count an
unprecedented 11.3 million unemployed workers—6.3 million more than during 2008. The
unemployment rate (in 2013) is 27.5% in Greece, 12.2% in Italy, 26.1% in Spain, and 16.4%
in Portugal. Such a degree of joblessness has not happened since the 1930s. Poverty is on the
rise: income poverty rates have increased during 2008-11 by 4.4, 2.4 and 5.1 percentage
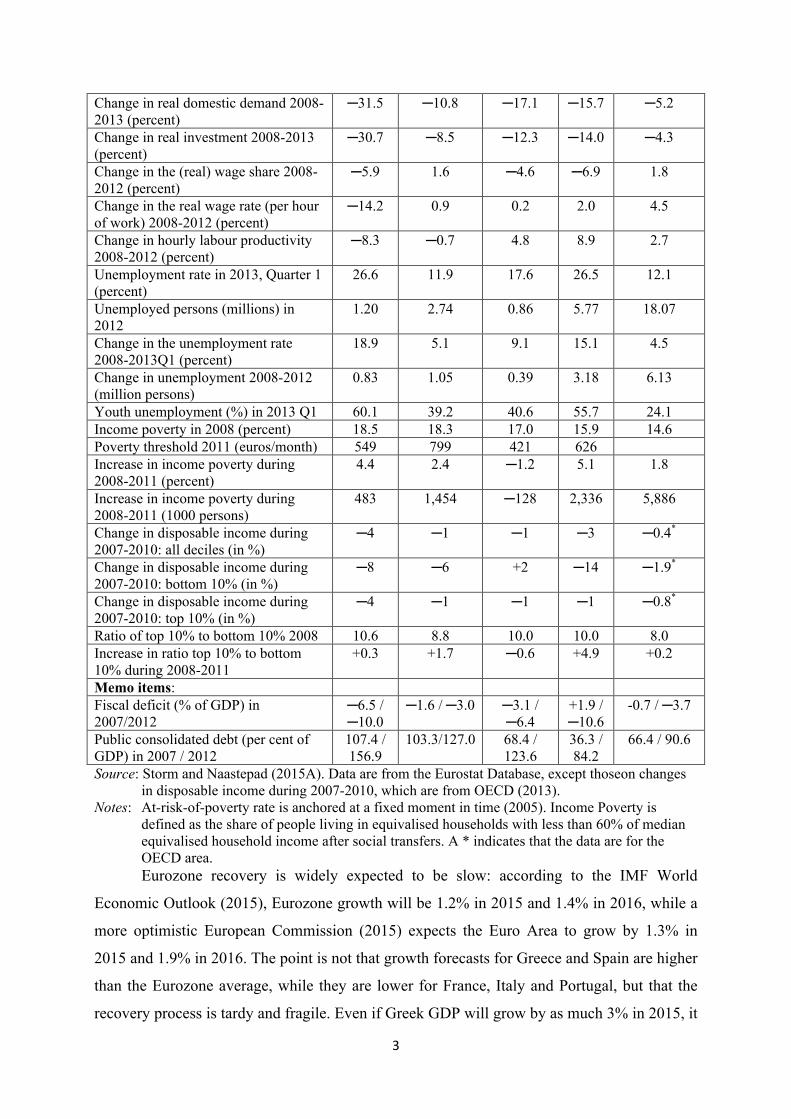
points in Greece, Italy and Spain. As Table 1 shows, inequality in the GIPS countries is rising:
the lowest income deciles cope with much larger declines in their disposable incomes than the
top-10%, and the income ratio of the top-10% to the bottom-10% has gone up
Table 1 Contours of the Eurozone Crisis (2008-2012/13)
Greece Italy Portugal Spain Euro-Area Change in real GDP 2008-2013 (percent)
─23.3 ─7.1 ─7.9 ─6.4 ─2.0
Change in manufacturing output 2008-2012 (percent)
─26.1 ─7.8 ─11.8 ─22.1 ─8.3
Change in real household consumption 2008-2013 (percent)
─27.9 ─6.1 ─12.2 ─9.0 ─2.0
3
Change in real domestic demand 2008-2013 (percent)
─31.5 ─10.8 ─17.1 ─15.7 ─5.2
Change in real investment 2008-2013 (percent)
─30.7 ─8.5 ─12.3 ─14.0 ─4.3
Change in the (real) wage share 2008-2012 (percent)
─5.9 1.6 ─4.6 ─6.9 1.8
Change in the real wage rate (per hour of work) 2008-2012 (percent)
─14.2 0.9 0.2 2.0 4.5
Change in hourly labour productivity 2008-2012 (percent)
─8.3 ─0.7 4.8 8.9 2.7
Unemployment rate in 2013, Quarter 1 (percent)
26.6 11.9 17.6 26.5 12.1
Unemployed persons (millions) in 2012
1.20 2.74 0.86 5.77 18.07
Change in the unemployment rate 2008-2013Q1 (percent)
18.9 5.1 9.1 15.1 4.5
Change in unemployment 2008-2012 (million persons)
0.83 1.05 0.39 3.18 6.13
Youth unemployment (%) in 2013 Q1 60.1 39.2 40.6 55.7 24.1 Income poverty in 2008 (percent) 18.5 18.3 17.0 15.9 14.6 Poverty threshold 2011 (euros/month) 549 799 421 626 Increase in income poverty during 2008-2011 (percent)
4.4 2.4 ─1.2 5.1 1.8
Increase in income poverty during 2008-2011 (1000 persons)
483 1,454 ─128 2,336 5,886
Change in disposable income during 2007-2010: all deciles (in %)
─4 ─1 ─1 ─3 ─0.4*
Change in disposable income during 2007-2010: bottom 10% (in %)
─8 ─6 +2 ─14 ─1.9*
Change in disposable income during 2007-2010: top 10% (in %)
─4 ─1 ─1 ─1 ─0.8*
Ratio of top 10% to bottom 10% 2008 10.6 8.8 10.0 10.0 8.0 Increase in ratio top 10% to bottom 10% during 2008-2011
+0.3 +1.7 ─0.6 +4.9 +0.2
Memo items: Fiscal deficit (% of GDP) in 2007/2012
─6.5 / ─10.0
─1.6 / ─3.0 ─3.1 / ─6.4
+1.9 / ─10.6
-0.7 / ─3.7
Public consolidated debt (per cent of GDP) in 2007 / 2012
107.4 / 156.9
103.3/127.0 68.4 / 123.6
36.3 / 84.2
66.4 / 90.6
Source: Storm and Naastepad (2015A). Data are from the Eurostat Database, except thoseon changes in disposable income during 2007-2010, which are from OECD (2013).
Notes: At-risk-of-poverty rate is anchored at a fixed moment in time (2005). Income Poverty is defined as the share of people living in equivalised households with less than 60% of median equivalised household income after social transfers. A * indicates that the data are for the OECD area.
Eurozone recovery is widely expected to be slow: according to the IMF World
Economic Outlook (2015), Eurozone growth will be 1.2% in 2015 and 1.4% in 2016, while a
more optimistic European Commission (2015) expects the Euro Area to grow by 1.3% in
2015 and 1.9% in 2016. The point is not that growth forecasts for Greece and Spain are higher
than the Eurozone average, while they are lower for France, Italy and Portugal, but that the
recovery process is tardy and fragile. Even if Greek GDP will grow by as much 3% in 2015, it
4
is starting from a base-level which is 26.3% lower than it was in 2008, and in the happy
circumstances that this 3%-growth will continue, it will take until 2026 before Greece’s GDP
is back at its pre-crisis level: 18 lost years. For Italy, Portugal and Spain, it will also take
many years for their GDP to make up the loss caused by the crisis. But it is not clear what
would drive such growth: the fiscal policy stance is contractionary, households and firms
(almost everywhere) suffer from hefty debt overhangs, and external demand remains weak
(mostly because each member country is cutting spending and wages). In line with this,
forecasts of unemployment show that joblessness remains rampant—the expected
unemployment rate for 2016 is divined to be 22% of the labour force in Greece, 20.7% in
Spain and 12.6% in Italy and Portugal (European Commission 2015). Those who believe the
Eurozone’s trials are now past must assume either an extraordinary (deus-ex-machina)
acceleration of the recovery process or a willingness of those trapped in deep recessions to
soldier on, year after year. Neither scenario seems at all plausible.
We argue in this paper that this never ending crisis of the Eurozone is in no small
measure caused by a mishandling of the crisis, which in turn is based on wrong diagnoses
concerning its causes. We distinguish two dominant narratives—“myths”, in our opinion—
about the Eurozone crisis, the first one emphasizing fiscal profligacy as the ultimate cause of
the crisis, the other focused on (labour cost) competitiveness. In the first narrative the crisis is
seen as a sovereign debt crisis, in the second, it is viewed as a competitiveness crisis. Both
narratives heavily dominate Eurozone policy discussions. But, as Tolstoy (1882) wrote in A
Confession, “wrong does not cease to be wrong, because the majority share in it”—and this
holds true in this case as well: both diagnoses are inaccurate and wrong, and these diagnostic
errors lead to the wrong treatment in terms of policy prescriptions. The economic—and social
as well as political—costs of this mishandling are huge, and—sadly—largely avoidable. It is
no understatement if we say that the patient is barely surviving the therapy. A better therapy
requires improved diagnosis, and to this task, the remainder of this paper is devoted.
Myth #1: The Eurozone crisis is due to fiscal profligacy and is a sovereign debt crisis
right from the start.
This first myth holds that the Eurozone crisis was driven by fiscal indiscipline, even
profligacy in Southern Europe—where national debts supposedly had soared already before
the crisis. This view is very widespread, and it underlies the continued emphasis by European
policymakers in Brussels and Frankfurt on fiscal austerity. “It is an indisputable fact”, Mr.
5
Wolfgang Schäuble (2011), Germany's influential Finance Minister, wrote in the Financial
Times that “excessive state spending has led to unsustainable levels of debt and deficits that
now threaten our economic welfare.” Mr. Jean-Claude Trichet (2010), former President of the
ECB, agrees: “I want to be candid with you today. The roots of the sovereign debt tensions we
face today lie in the neglect of the rules for fiscal discipline that the founding fathers of
Economic and Monetary Union laid out in the Maastricht Treaty.” Mr. Christian Noyer
(2012), Governor of the Bank of France, is repeating the party line, stating: the “main origin
of the crisis lies in the lack of fiscal discipline on the part of most Member States. […] [These
Member States] ran up deficits and debts, including during times of growth. As a result in
2008, when the crisis started, these countries had no more fiscal room and their public
finances deteriorated substantially.” Professor Hans Werner Sinn (2010) concurs, writing that
the “lesson to be learned from the crisis is that a currency union needs ironclad budget
discipline to avert a boom-and-bust cycle in the first place.”
If fiscal overspending is the problem and the Eurozone crisis is indeed a sovereign
debt crisis, as this argument goes, fiscal austerity must be the solution, with public thrift
serving to revive investor confidence. For one, significant belt-tightening is only “normal”
after years of fiscal profligacy and rising public debts—peripheral states simply cannot
continue overspending now at the expense of the future. For another, financial markets will
punish countries not doing enough to slash their deficits by making it even more expensive for
these cash-strapped countries to borrow. Hence, the leaders of the Eurozone’s core countries
have been demanding draconian budget cuts as the price of rescue loans to Greece, Portugal,
Spain and Italy. The ECB has been cheering this on and pushing it further. Of course, it is
understood that “the necessary comprehensive fiscal adjustment is weighing on near-term
economic growth”, as Mr. Mario Draghi explained (at an ECB press conference on May 3,
2012), but “its successful implementation will contribute to the sustainability of public
finances and thereby to the lowering of sovereign risk premia. In an environment of enhanced
confidence in fiscal balances, private sector activity should also be fostered, supporting
private investment and medium-term growth.” Mr. Draghi’s optimism is founded upon the
doctrine of “expansionary fiscal austerity”, which insists that governments should slash
spending even in the face of high unemployment, because the fiscal consolidation (if credible)
raises households’ expected future disposable income and consumption, and increases
investors’ confidence and hence investment (Alesina and Ardagna 2010). In line with this
doctrine, Reinhart and Rogoff’s (2010) claimed that economic growth drops off sharply, when
6
debt exceeds 90 percent of GDP.1 The “austerity is good + debt is bad” doctrine received
wholehearted enthusiasm in policy circles in Brussels, Frankfurt, Berlin and Washington, also
because it held up hope that the crisis-countries could actually help themselves without much
further support of or adjustment in Europe’s North. Belief in it became so strong that
Europe’s Stability and Growth Pact was reformed so as to prevent any fiscal faux pas by
Eurozone states in future.2 Fiscal austerity has been enshrined in national law—in a move
bypassing national parliaments—in exactly the “ironclad” way advocated by Professor Sinn.
Mix-up #1: The claim proved too good to be true.
The difficulty with the “fiscal profligacy” argument is that the data don’t support it. As
Eurostat data collected in Table 2 show, in the 8 years prior to the crisis (2000-2007),
government debt (per cent of GDP) in the Eurozone declined, on average, by 6 percentage
points—which already contradicts the claim of fiscal irresponsibility. Sovereign debt of Italy
declined by 7 percentage points during 2000-07, in Ireland by 8 percentage points, and in
Spain by as much as 24 percentage points. It is true that the public debt of Greece increased
by 4 percentage points during those years, but to call this “profligate”, “reckless” or
“excessive”, makes little sense; it would mean the German and French states have been
profligate as well, as their debts increased by as much as 5 percentage points during 2000-07.
Portugal is the only crisis-country where sovereign debt rose considerably before the crisis—
by 13 percentage points from 62.2% of GDP in 2000 to 75.5% in 2007. But it is hard to call
Portugal’s public debt in 2007 “excessive” or “irresponsible” if one compares it with public
debts of Germany (65.7%), France (73%) or Belgium (88%) in the same year. Bond markets
were not at all apprehensive about sovereign default risks as member-country-specific risk
premiums came down to very low levels and interest rate spreads remained stable and very
low until the onset of the crisis (Chen et al. 2012). The spread of the Greek bond rate over the
German one, for instance, remained as low as 30 bps even at the end of 2007. As far as
financial markets were concerned, all countries using Euros could borrow at the same interest
1 Reinhart and Rogoff’s claim has been discredited by Herndon, Ash and Pollin (2013)
who pointed out a spreadsheet error as well as their questionable statistical procedure. 2 The expanded treaty is called the Treaty on Stability, Coordination and Governance in
the Economic and Monetary Union and it requires its parties to introduce a national requirement to have a balanced structural budget (a structural budget deficit < 0.5 per cent of GDP). The European Commission is given the right to automatically impose penalties in case of breaches of either the deficit or the debt rules.
7
rate. There is therefore no basis to claim that national debts had soared already well before the
crisis—the fact is that sovereign debts rose sharply only after the crisis, once governments felt
forced to bail out collapsing insolvent banks and once GDP started to contract. As a result,
public debt in the Eurozone increased by a full 33 percentage points of GDP during 2008-
2012—and by 78 %-points in Ireland, 44 %-points in Greece, 48 %-points in Portugal, and 45
percentage points in Spain. We don’t need the help of Granger-causality testing to conclude
that it’s the socialization of private debts, especially the debts of banks going belly up, which
turned the Eurozone crisis into a sovereign debt crisis ex post facto.
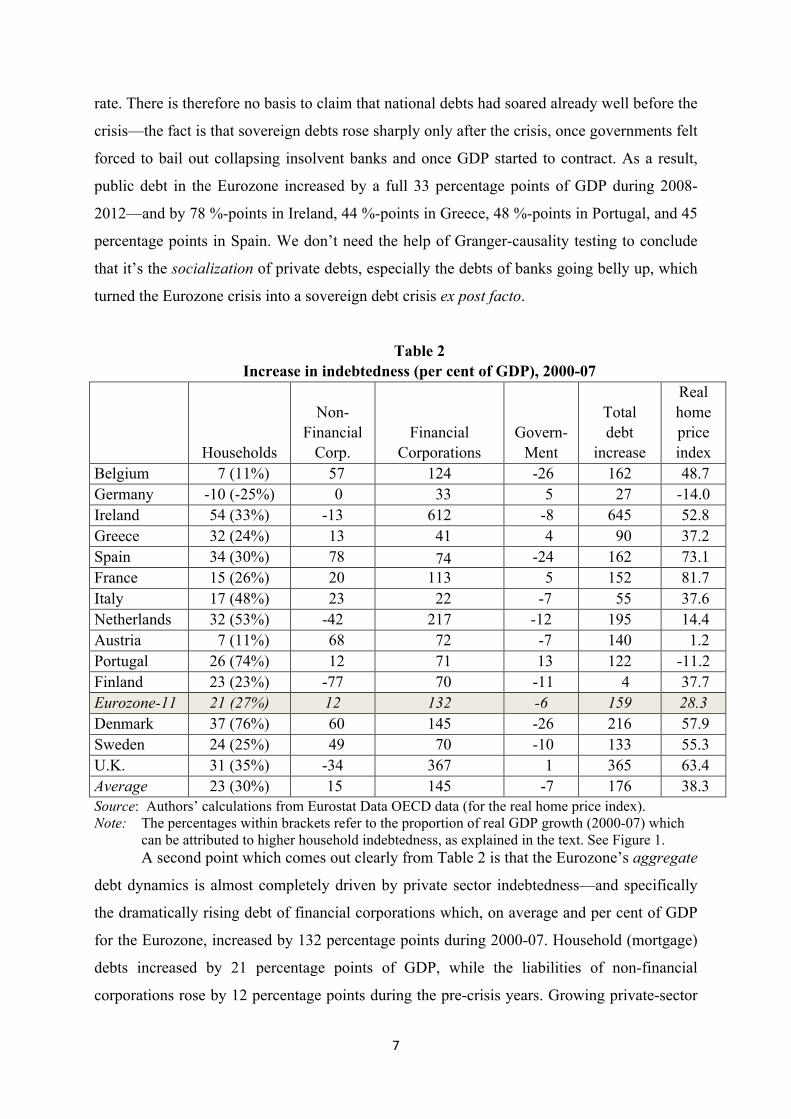
Table 2 Increase in indebtedness (per cent of GDP), 2000-07
Households
Non-Financial
Corp. Financial
Corporations Govern-
Ment
Total debt
increase
Real home price index
Belgium 7 (11%) 57 124 -26 162 48.7 Germany -10 (-25%) 0 33 5 27 -14.0 Ireland 54 (33%) -13 612 -8 645 52.8 Greece 32 (24%) 13 41 4 90 37.2 Spain 34 (30%) 78 74 -24 162 73.1 France 15 (26%) 20 113 5 152 81.7 Italy 17 (48%) 23 22 -7 55 37.6 Netherlands 32 (53%) -42 217 -12 195 14.4 Austria 7 (11%) 68 72 -7 140 1.2 Portugal 26 (74%) 12 71 13 122 -11.2 Finland 23 (23%) -77 70 -11 4 37.7 Eurozone-11 21 (27%) 12 132 -6 159 28.3 Denmark 37 (76%) 60 145 -26 216 57.9 Sweden 24 (25%) 49 70 -10 133 55.3 U.K. 31 (35%) -34 367 1 365 63.4 Average 23 (30%) 15 145 -7 176 38.3 Source: Authors’ calculations from Eurostat Data OECD data (for the real home price index). Note: The percentages within brackets refer to the proportion of real GDP growth (2000-07) which
can be attributed to higher household indebtedness, as explained in the text. See Figure 1. A second point which comes out clearly from Table 2 is that the Eurozone’s aggregate
debt dynamics is almost completely driven by private sector indebtedness—and specifically
the dramatically rising debt of financial corporations which, on average and per cent of GDP
for the Eurozone, increased by 132 percentage points during 2000-07. Household (mortgage)
debts increased by 21 percentage points of GDP, while the liabilities of non-financial
corporations rose by 12 percentage points during the pre-crisis years. Growing private-sector
8
debts dwarf the changes in sovereign debts—particularly so in the crisis countries. In Greece,
household indebtedness rose by 32 percentage points, corporate indebtedness by 13
percentage points, and financial sector indebtedness by 41 percentage points—trivializing the
4-percentage point increase in public debt. Spain experienced a massive increase in the debts
of non-financial corporations (of 78 percentage points during 2000-07), of banks (of 74
percentage points) as well as households (of 34 percentage points)—all participants in Spain’s
massive property bubble—in a period when sovereign indebtedness was sharply reduced.
Undeniably, the Eurozone crisis was triggered by a gigantic unsustainable increase in
indebtedness—but why would one single out trifling increases in sovereign debts as the main
factor, while neglecting the significant growth in private indebtedness? We may justly ask,
with Matthew verse 7:3: “And why beholdest thou the mote that is in thy brother's eye, but
considerest not the beam that is in thine own eye?”
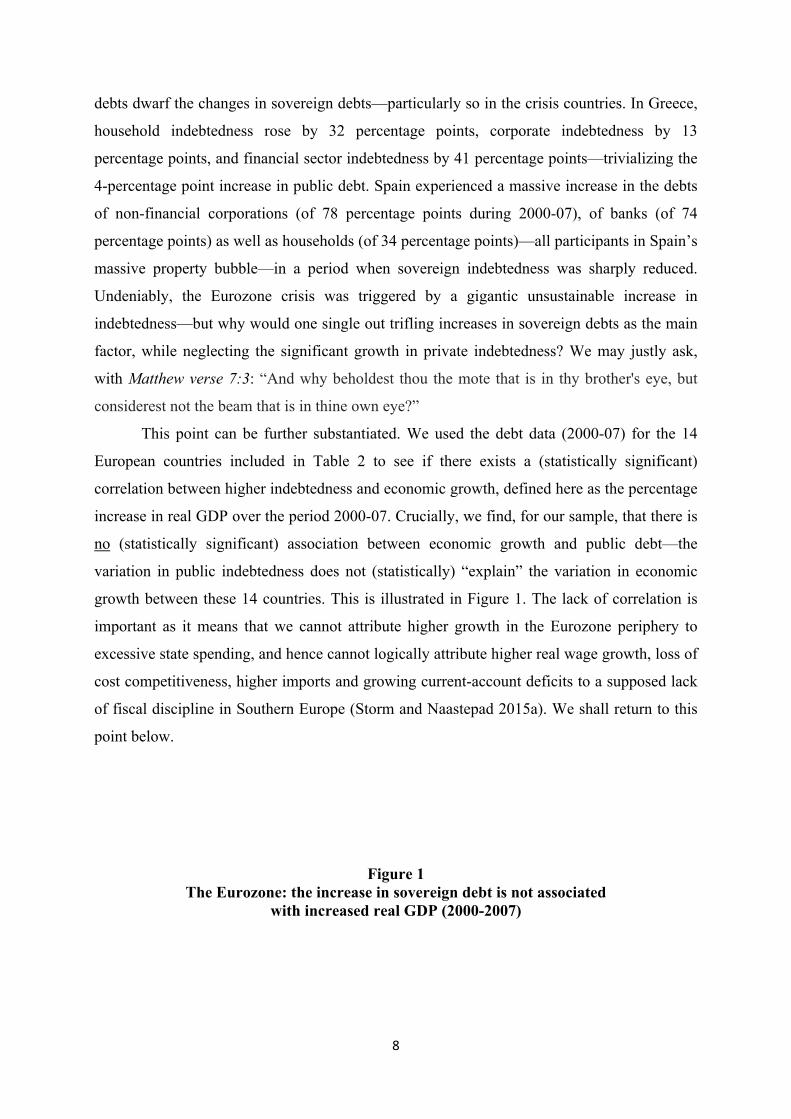
This point can be further substantiated. We used the debt data (2000-07) for the 14
European countries included in Table 2 to see if there exists a (statistically significant)
correlation between higher indebtedness and economic growth, defined here as the percentage
increase in real GDP over the period 2000-07. Crucially, we find, for our sample, that there is
no (statistically significant) association between economic growth and public debt—the
variation in public indebtedness does not (statistically) “explain” the variation in economic
growth between these 14 countries. This is illustrated in Figure 1. The lack of correlation is
important as it means that we cannot attribute higher growth in the Eurozone periphery to
excessive state spending, and hence cannot logically attribute higher real wage growth, loss of
cost competitiveness, higher imports and growing current-account deficits to a supposed lack
of fiscal discipline in Southern Europe (Storm and Naastepad 2015a). We shall return to this
point below.
Figure 1 The Eurozone: the increase in sovereign debt is not associated
with increased real GDP (2000-2007)
9
Source: Authors calculations using Eurostat Data. Note: ∆ real GDP = the percentage increase in real GDP (2000-07); ∆ government debt = the
increase in government debt as a percentage of GDP (during 2000-07). The (dashed) line represents the fitted OLS curve, showing that there is no statistically significant (at 10% or less) association between ∆ government debt and ∆ GDP.
Likewise, we find no (statistically significant) correlation between economic growth
and (higher) indebtedness of non-financial corporations, and between growth and the
exploding indebtedness of financial corporations. The latter finding deserves emphasis: it is
basically suggesting that the piling-up of debts by the financial sector did not trickle down in
more rapid Eurozone growth. Eurozone banks took on € 13 trillion of additional debt during
2000-2007 with nothing to show for it. If true, one may ask: what has been the use of all the
debts of these highly-leveraged financial corporations? Although in theory financial firms are
supposed to also hold assets of comparable value, the scale of financial sector liabilities looks
alarming—especially relative to bank equity and because the maturity of these liabilities is
typically much shorter than the maturity of the corresponding assets. An un-coordinated
deleveraging of the financial sector carries high risks of collapsing asset prices, fire sales of
securities, and a credit crunch—as did actually happen in 2007/2008.
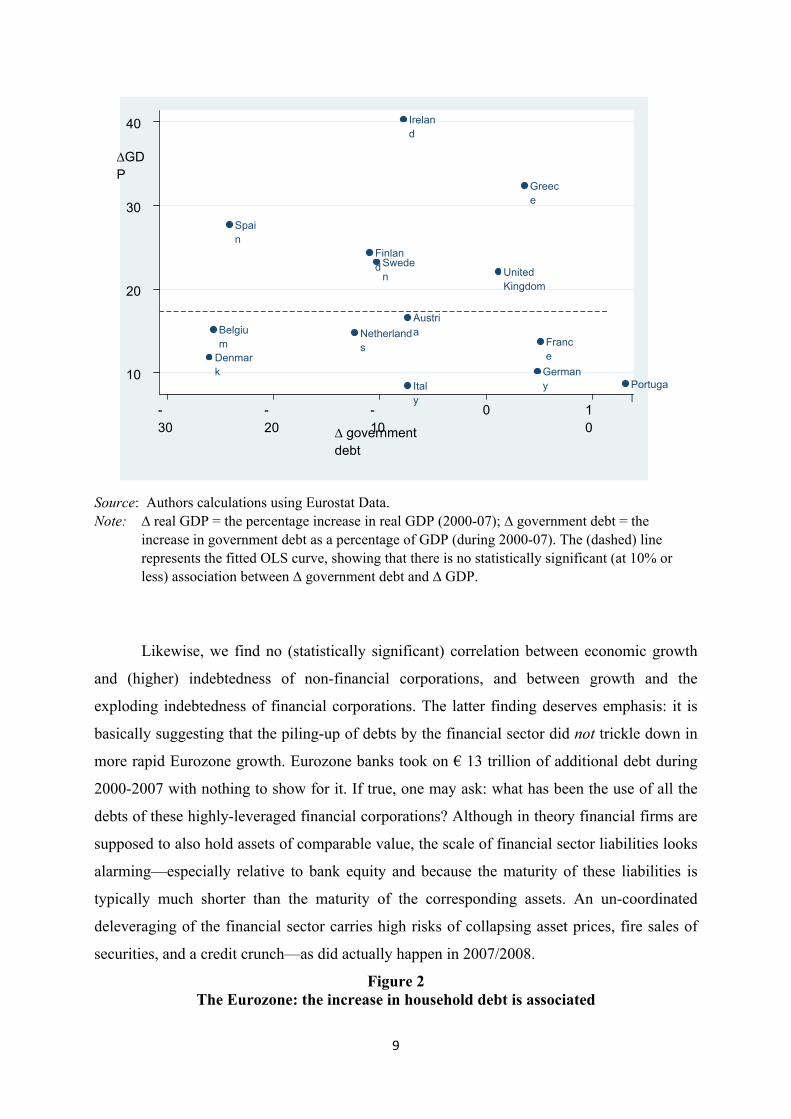
Figure 2 The Eurozone: the increase in household debt is associated
Belgium
Denmark German
y
Ireland
Greece
Spain
France
Italy
Netherlands
Austria
Portugal
Finland Swede
n United Kingdom
10
20
30
40
-30
-20
-10
0 10 ∆ government
debt
∆GDP
10
with an increase in real GDP (2000-
2007) Source: Authors’ OLS regression estimations based on Eurostat Data. Note: The regression line is based on the following OLS regression:
∆ real GDP = 12.47*** + 0.25* ∆ Hh Debt + 14.53** Ireland-dummy (7.22) (2.02) (2.54) = 0.52; F = 8.9**; n = 14. ∆ real GDP = the percentage increase in real GDP (2000-07); ∆ Hh Debt = the increase in household debt as a percentage of GDP (during 2000-07). The equation was estimated for 11 Eurozone countries (Austria, Belgium, Finland, France, Germany, Greece, Ireland, Italy, the Netherlands, Portugal, Spain) plus Denmark, Sweden and the U.K. Robust t-values are reported in parentheses. ***, **, * indicate statistical significance at the 1%, 5% and 10% level, respectively. Without the dummy for Ireland, the regression result is: ∆ real GDP = 10.30 + 0.38 ∆ Hh Debt (3.96)*** (2.99)** = 0.41; F = 9.0**; n = 14.
Turning to household debts, we do find a statistically significant positive association
between real GDP growth and household debts in the run-up to the crisis, as shown in Figure
2. According to the regression result, a one point increase in household debt (per cent of
GDP) is associated with an increase in real GDP of 0.25 percentage points. (This regression
result does not depend on the inclusion of Ireland, which is an outlier. The result does not
change when we exclude anyone country from the sample.) The increased household debt fed
Belgium
Denmark German
y
Ireland
Greece
Spain
France
Italy
Netherlands
Austria
Portugal
Finland Swede
n United Kingdom
10
20
30
40
-20
0 20
40
60 ∆Hh
Debt
∆GDP
11
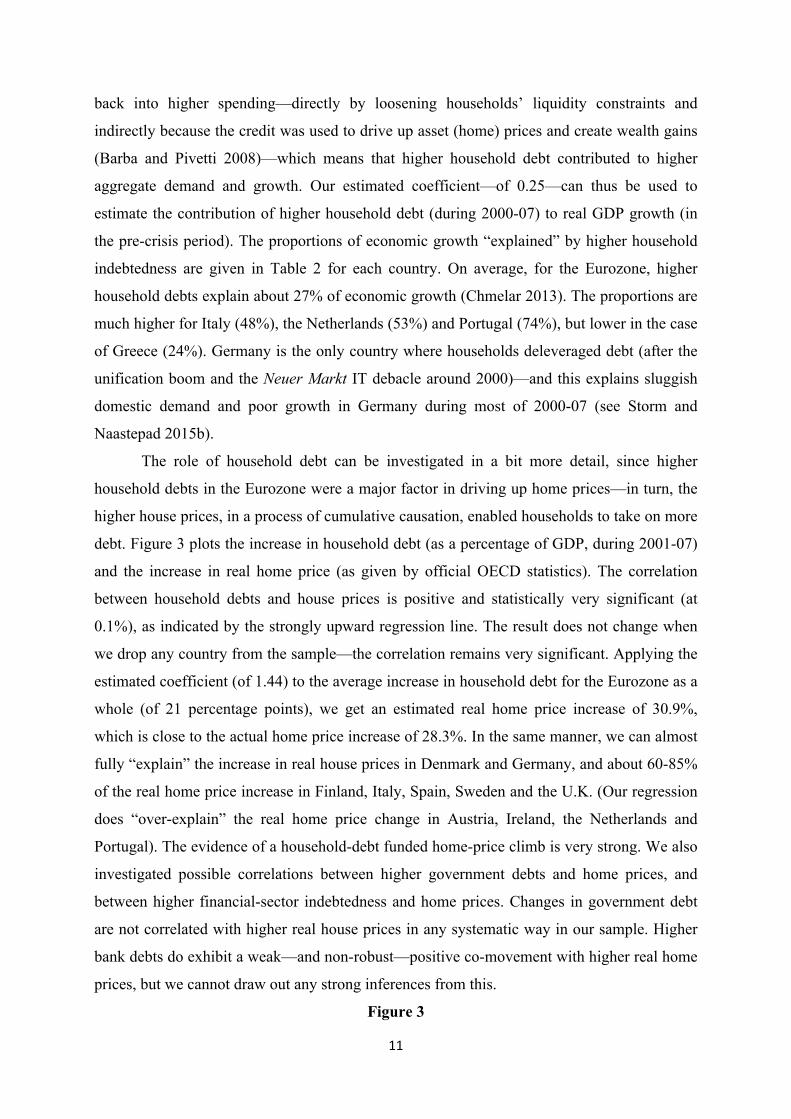
back into higher spending—directly by loosening households’ liquidity constraints and
indirectly because the credit was used to drive up asset (home) prices and create wealth gains
(Barba and Pivetti 2008)—which means that higher household debt contributed to higher
aggregate demand and growth. Our estimated coefficient—of 0.25—can thus be used to
estimate the contribution of higher household debt (during 2000-07) to real GDP growth (in
the pre-crisis period). The proportions of economic growth “explained” by higher household
indebtedness are given in Table 2 for each country. On average, for the Eurozone, higher
household debts explain about 27% of economic growth (Chmelar 2013). The proportions are
much higher for Italy (48%), the Netherlands (53%) and Portugal (74%), but lower in the case
of Greece (24%). Germany is the only country where households deleveraged debt (after the
unification boom and the Neuer Markt IT debacle around 2000)—and this explains sluggish
domestic demand and poor growth in Germany during most of 2000-07 (see Storm and
Naastepad 2015b).
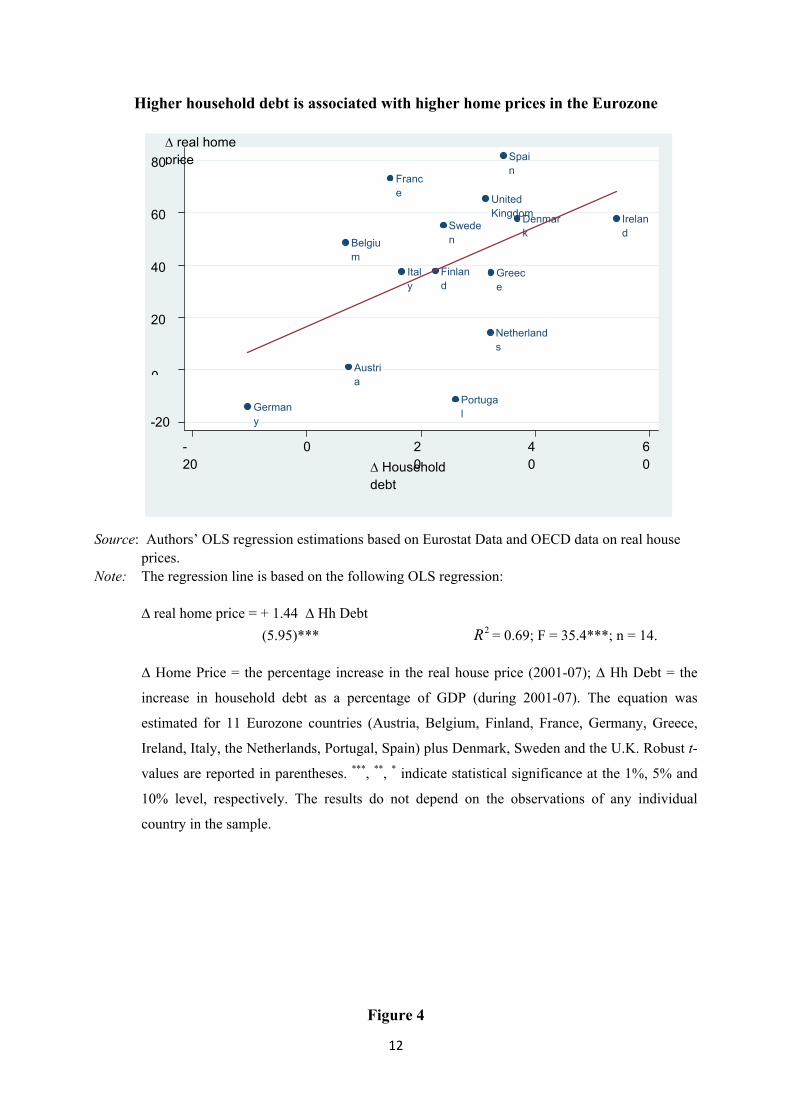
The role of household debt can be investigated in a bit more detail, since higher
household debts in the Eurozone were a major factor in driving up home prices—in turn, the
higher house prices, in a process of cumulative causation, enabled households to take on more
debt. Figure 3 plots the increase in household debt (as a percentage of GDP, during 2001-07)
and the increase in real home price (as given by official OECD statistics). The correlation
between household debts and house prices is positive and statistically very significant (at
0.1%), as indicated by the strongly upward regression line. The result does not change when
we drop any country from the sample—the correlation remains very significant. Applying the
estimated coefficient (of 1.44) to the average increase in household debt for the Eurozone as a
whole (of 21 percentage points), we get an estimated real home price increase of 30.9%,
which is close to the actual home price increase of 28.3%. In the same manner, we can almost
fully “explain” the increase in real house prices in Denmark and Germany, and about 60-85%
of the real home price increase in Finland, Italy, Spain, Sweden and the U.K. (Our regression
does “over-explain” the real home price change in Austria, Ireland, the Netherlands and
Portugal). The evidence of a household-debt funded home-price climb is very strong. We also
investigated possible correlations between higher government debts and home prices, and
between higher financial-sector indebtedness and home prices. Changes in government debt
are not correlated with higher real house prices in any systematic way in our sample. Higher
bank debts do exhibit a weak—and non-robust—positive co-movement with higher real home
prices, but we cannot draw out any strong inferences from this.
Figure 3
12
Higher household debt is associated with higher home prices in the Eurozone
Source: Authors’ OLS regression estimations based on Eurostat Data and OECD data on real house
prices. Note: The regression line is based on the following OLS regression:
∆ real home price = + 1.44 ∆ Hh Debt (5.95)*** = 0.69; F = 35.4***; n = 14. ∆ Home Price = the percentage increase in the real house price (2001-07); ∆ Hh Debt = the
increase in household debt as a percentage of GDP (during 2001-07). The equation was
estimated for 11 Eurozone countries (Austria, Belgium, Finland, France, Germany, Greece,
Ireland, Italy, the Netherlands, Portugal, Spain) plus Denmark, Sweden and the U.K. Robust t-
values are reported in parentheses. ***, **, * indicate statistical significance at the 1%, 5% and
10% level, respectively. The results do not depend on the observations of any individual
country in the sample.
Figure 4
Belgium
Denmark
Germany
Ireland
Greece
Spain
France
Italy
Netherlands
Austria
Portugal
Finland
Sweden
United Kingdom
-20
0
20
40
60
80
-20
0 20
40
60 ∆ Household
debt
∆ real home price
13
Higher home prices are correlated with higher GDP growth in the Eurozone
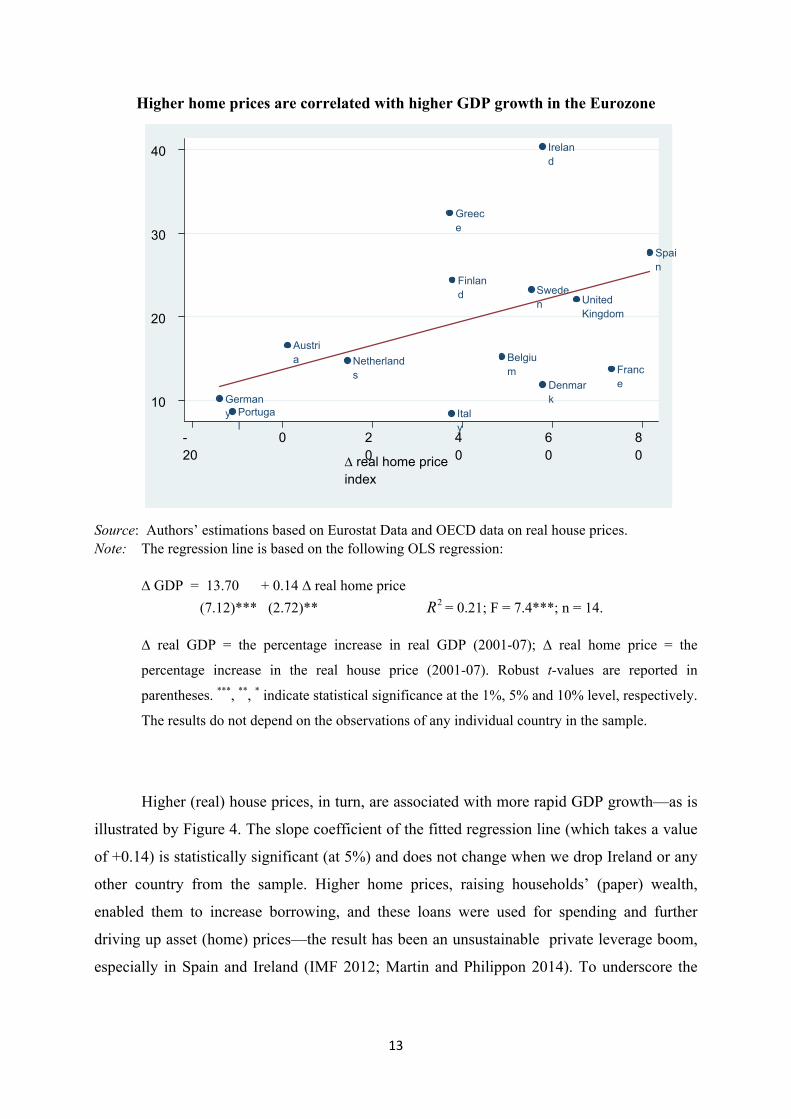
Source: Authors’ estimations based on Eurostat Data and OECD data on real house prices. Note: The regression line is based on the following OLS regression:
∆ GDP = 13.70 + 0.14 ∆ real home price (7.12)*** (2.72)** = 0.21; F = 7.4***; n = 14. ∆ real GDP = the percentage increase in real GDP (2001-07); ∆ real home price = the
percentage increase in the real house price (2001-07). Robust t-values are reported in
parentheses. ***, **, * indicate statistical significance at the 1%, 5% and 10% level, respectively.
The results do not depend on the observations of any individual country in the sample.
Higher (real) house prices, in turn, are associated with more rapid GDP growth—as is
illustrated by Figure 4. The slope coefficient of the fitted regression line (which takes a value
of +0.14) is statistically significant (at 5%) and does not change when we drop Ireland or any
other country from the sample. Higher home prices, raising households’ (paper) wealth,
enabled them to increase borrowing, and these loans were used for spending and further
driving up asset (home) prices—the result has been an unsustainable private leverage boom,
especially in Spain and Ireland (IMF 2012; Martin and Philippon 2014). To underscore the
Belgium
Denmark German
y
Ireland
Greece
Spain
France
Italy
Netherlands
Austria
Portugal
Finland Swede
n United Kingdom
10
20
30
40
-20
0 20
40
60
80 ∆ real home price
index
14
consistency of our various findings (so far), we combine the estimated coefficients of Tables 3
and 4 to obtain the derived impact on real GDP growth of higher household debt as follows:
+1% ∆ household debt ˟ 1.44 = +1.44% ∆ home price ˟ 0.14 = +0.21% ∆ real GDP
A 1-percentage point rise in household indebtedness led to an increase in the real home price
by 1.44 percentage points, which in turn is associated with a rise in real GDP of 0.21
percentage points—which is close our direct estimate 0.25%-points in Figure 2. Clearly,
Figures 2, 3 and 4 paint a consistent picture: the Eurozone was blighted by private debt—not
public debt.
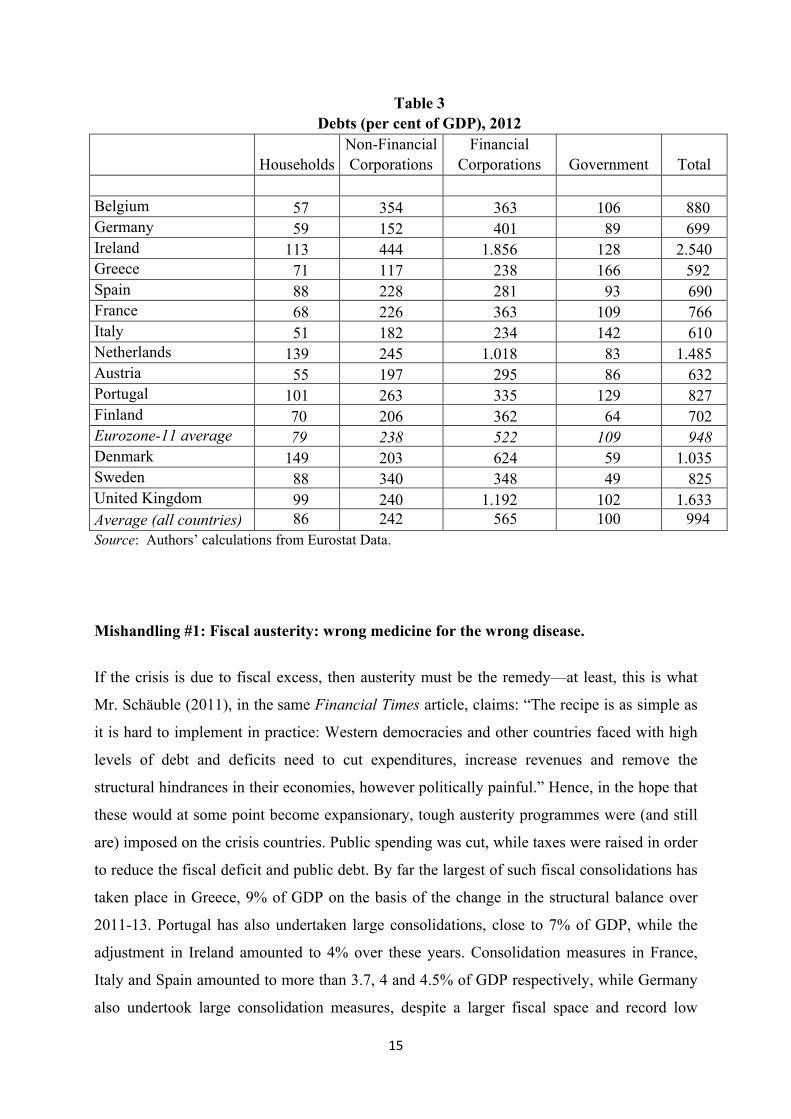
The Germany-inspired focus on sovereign debt is badly misplaced. Eurozone
households, corporations and banks have all been taking on debts on an unprecedented scale
(see Table 3). For the Eurozone as a whole household debt in 2012 was equal to 79% of GDP,
ranging from 131% in the Netherlands to 51% in crisis-struck Italy. Corporate debt in 2012
stood at 212% of Eurozone GDP—being comparatively low in Greece (117%) and Italy
(182%), but higher elsewhere (e.g. Belgium and Ireland). Banks’ indebtedness in 2012 stood
at 522%—with Ireland and the Netherlands, where bank liabilities as a percentage of GDP
were 1856% and 1018% respectively, representing cases of hyper-financialization. Excessive
bank indebtedness is typical not just of the Irish and the Dutch, however, but also of Germany
and France, where the ratio of bank debt to GDP in 2012 was 401% and 363%, which is
considerably higher than bank debt (as a percentage of GDP) on average for Greece, Italy,
Portugal and Spain which equaled 272%. Faced with the need to strengthen and repair balance
sheets, all sectors are now—post crisis—deleveraging, which reduces economic activity and
is causing a full-fledged balance-sheet recession, impossible to resolve by reducing sovereign
debts. The real issue is how governments can help to clean up the Augean stables of
households, corporations and particularly banks. Not surprisingly, in light of the massive
private-sector debt build-up, recent research, as by BIS-economists Cecchetti, Mohanty and
Zampoli (2011), finds that high corporate and household debt acts as a drag on growth, and
recent research for the Euro Area by the IMF-economists Bornhorst and Ruiz-Arranz (2013)
concludes that high private debt is more detrimental to growth than high public debt. Their
regressions identify a stronger and more statistically significant association between private
sector debt and growth than between government debt and growth; and show that excessive
sovereign debt reduces growth only when household and corporate sectors are heavily
indebted as well.
15
Table 3 Debts (per cent of GDP), 2012
Households Non-Financial Corporations
Financial Corporations Government Total
Belgium 57 354 363 106 880 Germany 59 152 401 89 699 Ireland 113 444 1.856 128 2.540 Greece 71 117 238 166 592 Spain 88 228 281 93 690 France 68 226 363 109 766 Italy 51 182 234 142 610 Netherlands 139 245 1.018 83 1.485 Austria 55 197 295 86 632 Portugal 101 263 335 129 827 Finland 70 206 362 64 702 Eurozone-11 average 79 238 522 109 948 Denmark 149 203 624 59 1.035 Sweden 88 340 348 49 825 United Kingdom 99 240 1.192 102 1.633 Average (all countries) 86 242 565 100 994 Source: Authors’ calculations from Eurostat Data.
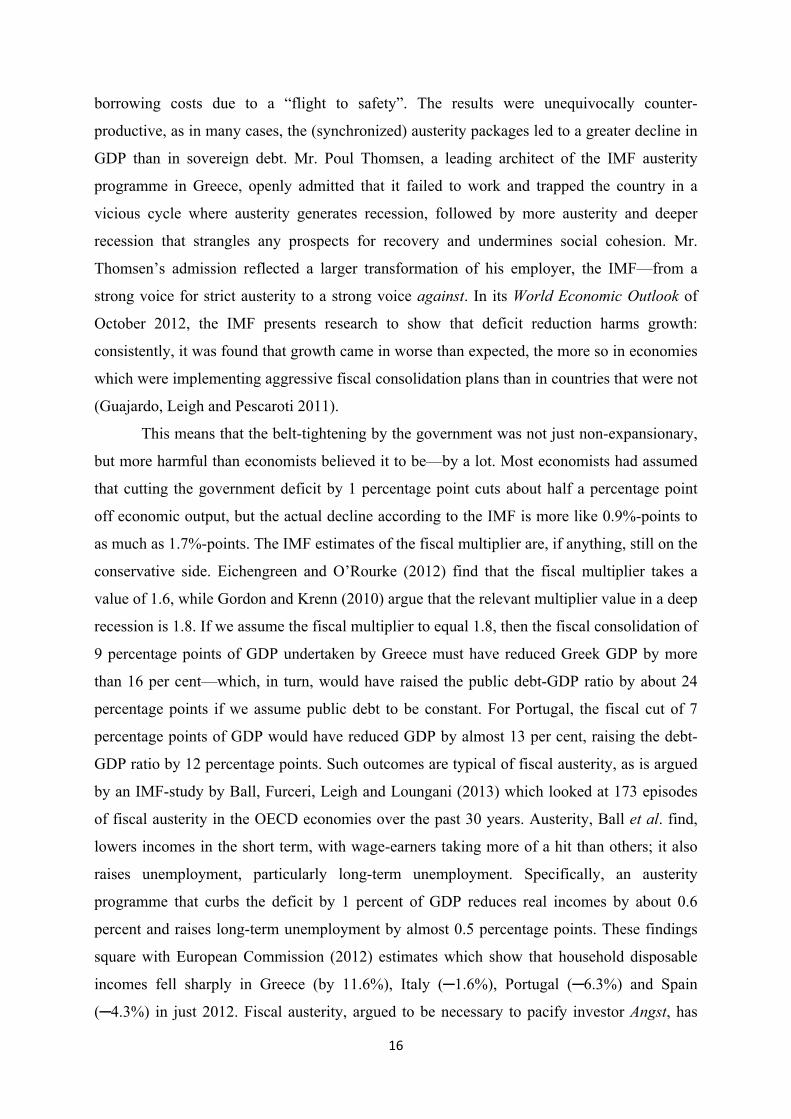
Mishandling #1: Fiscal austerity: wrong medicine for the wrong disease.
If the crisis is due to fiscal excess, then austerity must be the remedy—at least, this is what
Mr. Schäuble (2011), in the same Financial Times article, claims: “The recipe is as simple as
it is hard to implement in practice: Western democracies and other countries faced with high
levels of debt and deficits need to cut expenditures, increase revenues and remove the
structural hindrances in their economies, however politically painful.” Hence, in the hope that
these would at some point become expansionary, tough austerity programmes were (and still
are) imposed on the crisis countries. Public spending was cut, while taxes were raised in order
to reduce the fiscal deficit and public debt. By far the largest of such fiscal consolidations has
taken place in Greece, 9% of GDP on the basis of the change in the structural balance over
2011-13. Portugal has also undertaken large consolidations, close to 7% of GDP, while the
adjustment in Ireland amounted to 4% over these years. Consolidation measures in France,
Italy and Spain amounted to more than 3.7, 4 and 4.5% of GDP respectively, while Germany
also undertook large consolidation measures, despite a larger fiscal space and record low
16
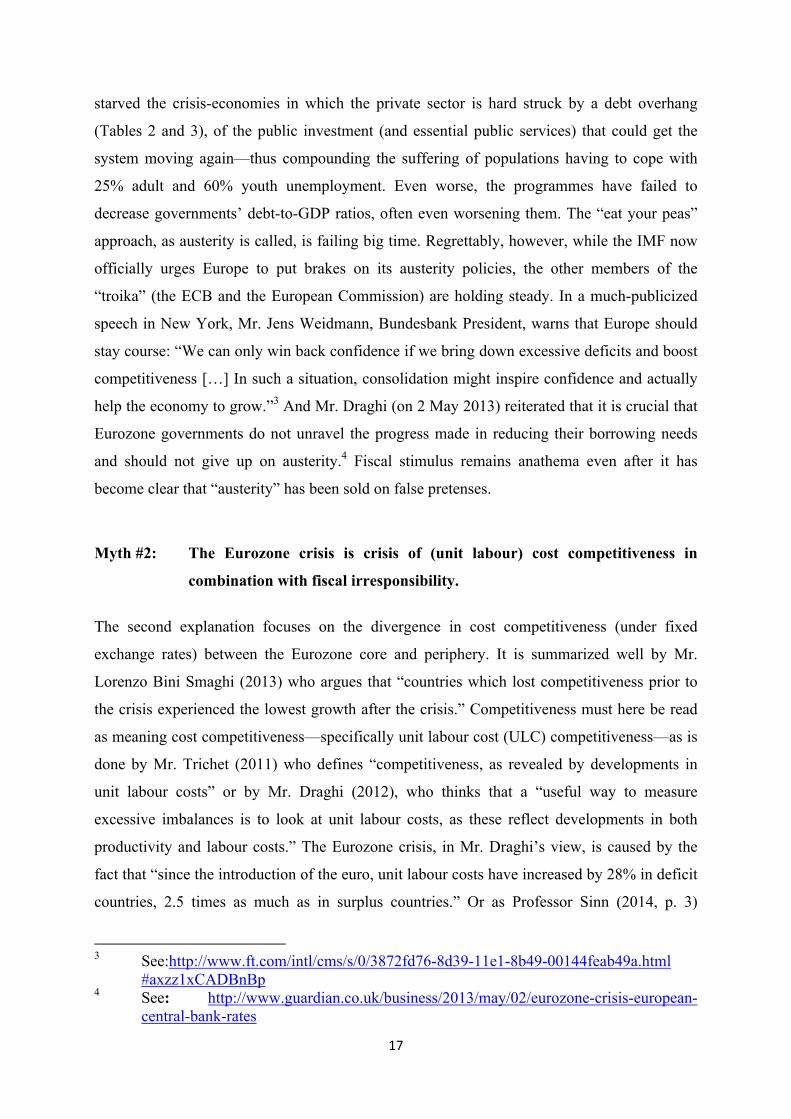
borrowing costs due to a “flight to safety”. The results were unequivocally counter-
productive, as in many cases, the (synchronized) austerity packages led to a greater decline in
GDP than in sovereign debt. Mr. Poul Thomsen, a leading architect of the IMF austerity
programme in Greece, openly admitted that it failed to work and trapped the country in a
vicious cycle where austerity generates recession, followed by more austerity and deeper
recession that strangles any prospects for recovery and undermines social cohesion. Mr.
Thomsen’s admission reflected a larger transformation of his employer, the IMF—from a
strong voice for strict austerity to a strong voice against. In its World Economic Outlook of
October 2012, the IMF presents research to show that deficit reduction harms growth:
consistently, it was found that growth came in worse than expected, the more so in economies
which were implementing aggressive fiscal consolidation plans than in countries that were not
(Guajardo, Leigh and Pescaroti 2011).
This means that the belt-tightening by the government was not just non-expansionary,
but more harmful than economists believed it to be—by a lot. Most economists had assumed
that cutting the government deficit by 1 percentage point cuts about half a percentage point
off economic output, but the actual decline according to the IMF is more like 0.9%-points to
as much as 1.7%-points. The IMF estimates of the fiscal multiplier are, if anything, still on the
conservative side. Eichengreen and O’Rourke (2012) find that the fiscal multiplier takes a
value of 1.6, while Gordon and Krenn (2010) argue that the relevant multiplier value in a deep
recession is 1.8. If we assume the fiscal multiplier to equal 1.8, then the fiscal consolidation of
9 percentage points of GDP undertaken by Greece must have reduced Greek GDP by more
than 16 per cent—which, in turn, would have raised the public debt-GDP ratio by about 24
percentage points if we assume public debt to be constant. For Portugal, the fiscal cut of 7
percentage points of GDP would have reduced GDP by almost 13 per cent, raising the debt-
GDP ratio by 12 percentage points. Such outcomes are typical of fiscal austerity, as is argued
by an IMF-study by Ball, Furceri, Leigh and Loungani (2013) which looked at 173 episodes
of fiscal austerity in the OECD economies over the past 30 years. Austerity, Ball et al. find,
lowers incomes in the short term, with wage-earners taking more of a hit than others; it also
raises unemployment, particularly long-term unemployment. Specifically, an austerity
programme that curbs the deficit by 1 percent of GDP reduces real incomes by about 0.6
percent and raises long-term unemployment by almost 0.5 percentage points. These findings
square with European Commission (2012) estimates which show that household disposable
incomes fell sharply in Greece (by 11.6%), Italy (─1.6%), Portugal (─6.3%) and Spain
(─4.3%) in just 2012. Fiscal austerity, argued to be necessary to pacify investor Angst, has
17
starved the crisis-economies in which the private sector is hard struck by a debt overhang
(Tables 2 and 3), of the public investment (and essential public services) that could get the
system moving again—thus compounding the suffering of populations having to cope with
25% adult and 60% youth unemployment. Even worse, the programmes have failed to
decrease governments’ debt-to-GDP ratios, often even worsening them. The “eat your peas”
approach, as austerity is called, is failing big time. Regrettably, however, while the IMF now
officially urges Europe to put brakes on its austerity policies, the other members of the
“troika” (the ECB and the European Commission) are holding steady. In a much-publicized
speech in New York, Mr. Jens Weidmann, Bundesbank President, warns that Europe should
stay course: “We can only win back confidence if we bring down excessive deficits and boost
competitiveness […] In such a situation, consolidation might inspire confidence and actually
help the economy to grow.”3 And Mr. Draghi (on 2 May 2013) reiterated that it is crucial that
Eurozone governments do not unravel the progress made in reducing their borrowing needs
and should not give up on austerity.4 Fiscal stimulus remains anathema even after it has
become clear that “austerity” has been sold on false pretenses.
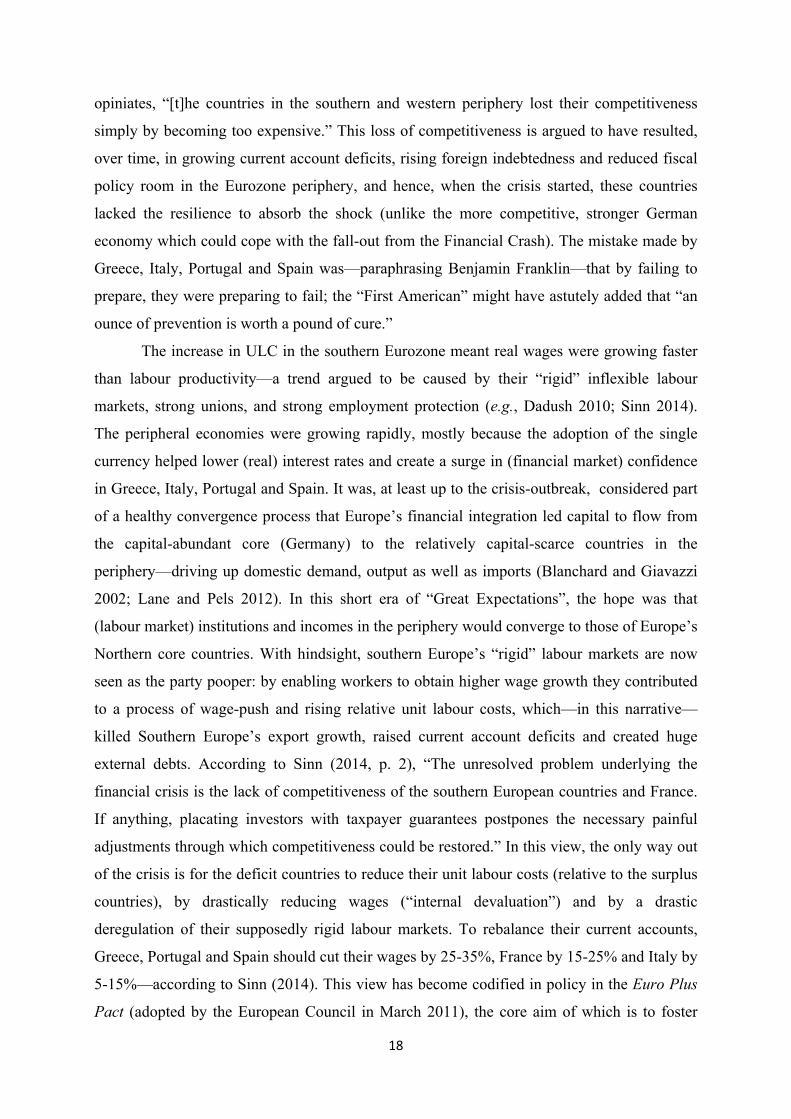
Myth #2: The Eurozone crisis is crisis of (unit labour) cost competitiveness in
combination with fiscal irresponsibility.
The second explanation focuses on the divergence in cost competitiveness (under fixed
exchange rates) between the Eurozone core and periphery. It is summarized well by Mr.
Lorenzo Bini Smaghi (2013) who argues that “countries which lost competitiveness prior to
the crisis experienced the lowest growth after the crisis.” Competitiveness must here be read
as meaning cost competitiveness—specifically unit labour cost (ULC) competitiveness—as is
done by Mr. Trichet (2011) who defines “competitiveness, as revealed by developments in
unit labour costs” or by Mr. Draghi (2012), who thinks that a “useful way to measure
excessive imbalances is to look at unit labour costs, as these reflect developments in both
productivity and labour costs.” The Eurozone crisis, in Mr. Draghi’s view, is caused by the
fact that “since the introduction of the euro, unit labour costs have increased by 28% in deficit
countries, 2.5 times as much as in surplus countries.” Or as Professor Sinn (2014, p. 3)
3 See:http://www.ft.com/intl/cms/s/0/3872fd76-8d39-11e1-8b49-00144feab49a.html
#axzz1xCADBnBp 4 See: http://www.guardian.co.uk/business/2013/may/02/eurozone-crisis-european-
central-bank-rates
18
opiniates, “[t]he countries in the southern and western periphery lost their competitiveness
simply by becoming too expensive.” This loss of competitiveness is argued to have resulted,
over time, in growing current account deficits, rising foreign indebtedness and reduced fiscal
policy room in the Eurozone periphery, and hence, when the crisis started, these countries
lacked the resilience to absorb the shock (unlike the more competitive, stronger German
economy which could cope with the fall-out from the Financial Crash). The mistake made by
Greece, Italy, Portugal and Spain was—paraphrasing Benjamin Franklin—that by failing to
prepare, they were preparing to fail; the “First American” might have astutely added that “an
ounce of prevention is worth a pound of cure.”
The increase in ULC in the southern Eurozone meant real wages were growing faster
than labour productivity—a trend argued to be caused by their “rigid” inflexible labour
markets, strong unions, and strong employment protection (e.g., Dadush 2010; Sinn 2014).
The peripheral economies were growing rapidly, mostly because the adoption of the single
currency helped lower (real) interest rates and create a surge in (financial market) confidence
in Greece, Italy, Portugal and Spain. It was, at least up to the crisis-outbreak, considered part
of a healthy convergence process that Europe’s financial integration led capital to flow from
the capital-abundant core (Germany) to the relatively capital-scarce countries in the
periphery—driving up domestic demand, output as well as imports (Blanchard and Giavazzi
2002; Lane and Pels 2012). In this short era of “Great Expectations”, the hope was that
(labour market) institutions and incomes in the periphery would converge to those of Europe’s
Northern core countries. With hindsight, southern Europe’s “rigid” labour markets are now
seen as the party pooper: by enabling workers to obtain higher wage growth they contributed
to a process of wage-push and rising relative unit labour costs, which—in this narrative—
killed Southern Europe’s export growth, raised current account deficits and created huge
external debts. According to Sinn (2014, p. 2), “The unresolved problem underlying the
financial crisis is the lack of competitiveness of the southern European countries and France.
If anything, placating investors with taxpayer guarantees postpones the necessary painful
adjustments through which competitiveness could be restored.” In this view, the only way out
of the crisis is for the deficit countries to reduce their unit labour costs (relative to the surplus
countries), by drastically reducing wages (“internal devaluation”) and by a drastic
deregulation of their supposedly rigid labour markets. To rebalance their current accounts,
Greece, Portugal and Spain should cut their wages by 25-35%, France by 15-25% and Italy by
5-15%—according to Sinn (2014). This view has become codified in policy in the Euro Plus
Pact (adopted by the European Council in March 2011), the core aim of which is to foster
19
Eurozone (unit labour cost) competitiveness and net exports via labour market deregulation
and welfare state reform, in conjunction (of course!) with fiscal austerity (Gros 2011;
Gabrisch and Staehr 2014). The latest statement by the Informal European Council (February
2015) is just repeating these points (more on this below).
Mix-up #2: Unit labour costs are far less important to a nation’s competitiveness than
is generally believed.
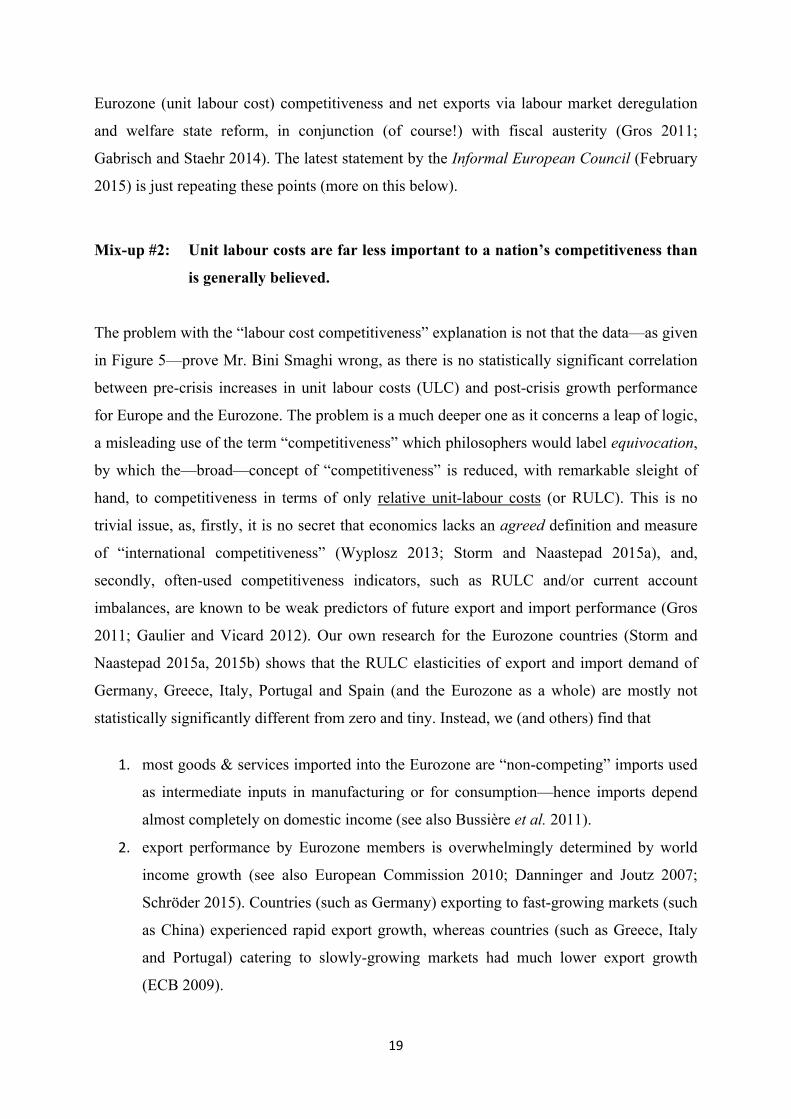
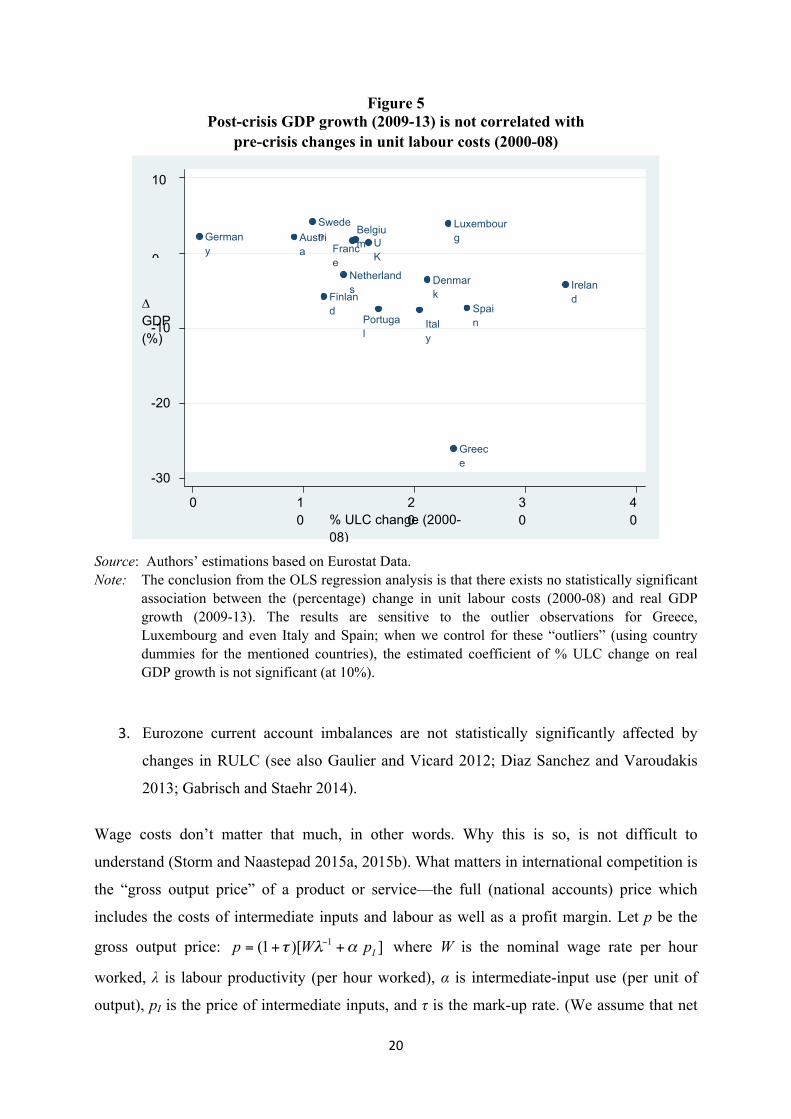
The problem with the “labour cost competitiveness” explanation is not that the data—as given
in Figure 5—prove Mr. Bini Smaghi wrong, as there is no statistically significant correlation
between pre-crisis increases in unit labour costs (ULC) and post-crisis growth performance
for Europe and the Eurozone. The problem is a much deeper one as it concerns a leap of logic,
a misleading use of the term “competitiveness” which philosophers would label equivocation,
by which the—broad—concept of “competitiveness” is reduced, with remarkable sleight of
hand, to competitiveness in terms of only relative unit-labour costs (or RULC). This is no
trivial issue, as, firstly, it is no secret that economics lacks an agreed definition and measure
of “international competitiveness” (Wyplosz 2013; Storm and Naastepad 2015a), and,
secondly, often-used competitiveness indicators, such as RULC and/or current account
imbalances, are known to be weak predictors of future export and import performance (Gros
2011; Gaulier and Vicard 2012). Our own research for the Eurozone countries (Storm and
Naastepad 2015a, 2015b) shows that the RULC elasticities of export and import demand of
Germany, Greece, Italy, Portugal and Spain (and the Eurozone as a whole) are mostly not
statistically significantly different from zero and tiny. Instead, we (and others) find that
1. most goods & services imported into the Eurozone are “non-competing” imports used
as intermediate inputs in manufacturing or for consumption—hence imports depend
almost completely on domestic income (see also Bussière et al. 2011).
2. export performance by Eurozone members is overwhelmingly determined by world
income growth (see also European Commission 2010; Danninger and Joutz 2007;
Schröder 2015). Countries (such as Germany) exporting to fast-growing markets (such
as China) experienced rapid export growth, whereas countries (such as Greece, Italy
and Portugal) catering to slowly-growing markets had much lower export growth
(ECB 2009).
20
Figure 5 Post-crisis GDP growth (2009-13) is not correlated with
pre-crisis changes in unit labour costs (2000-08)
Source: Authors’ estimations based on Eurostat Data. Note: The conclusion from the OLS regression analysis is that there exists no statistically significant
association between the (percentage) change in unit labour costs (2000-08) and real GDP growth (2009-13). The results are sensitive to the outlier observations for Greece, Luxembourg and even Italy and Spain; when we control for these “outliers” (using country dummies for the mentioned countries), the estimated coefficient of % ULC change on real GDP growth is not significant (at 10%).
3. Eurozone current account imbalances are not statistically significantly affected by
changes in RULC (see also Gaulier and Vicard 2012; Diaz Sanchez and Varoudakis
2013; Gabrisch and Staehr 2014).
Wage costs don’t matter that much, in other words. Why this is so, is not difficult to
understand (Storm and Naastepad 2015a, 2015b). What matters in international competition is
the “gross output price” of a product or service—the full (national accounts) price which
includes the costs of intermediate inputs and labour as well as a profit margin. Let p be the
gross output price: where W is the nominal wage rate per hour
worked, λ is labour productivity (per hour worked), α is intermediate-input use (per unit of
output), pI is the price of intermediate inputs, and τ is the mark-up rate. (We assume that net
Belgium German
y
Ireland
Greece
Spain
France
Italy
Luxembourg
Netherlands
Austria
Portugal
Finland
Denmark
Sweden U
K
-30
-20
-10
0
10
∆ GDP (%)
0 10
20
30
40 % ULC change (2000-
08)
21
indirect taxes are included in intermediate costs). Unit labour cost (ULC) are equal to .
Using this definition and assuming that τ is constant (which means all cost increases are
passed on into p), the elasticity of p with respect to ULC is:
(1)
where ξ (= ULC/p) the share of wage cost in gross output price. Let
be the (relative) price elasticity of export demand, then using (1),
we can define the elasticity of export demand with respect to ULC as follows:
(2)
What (2) shows is that the elasticity of exports with respect to (relative) ULC is the product of
the (relative) price elasticity of export demand and the elasticity of output price with respect
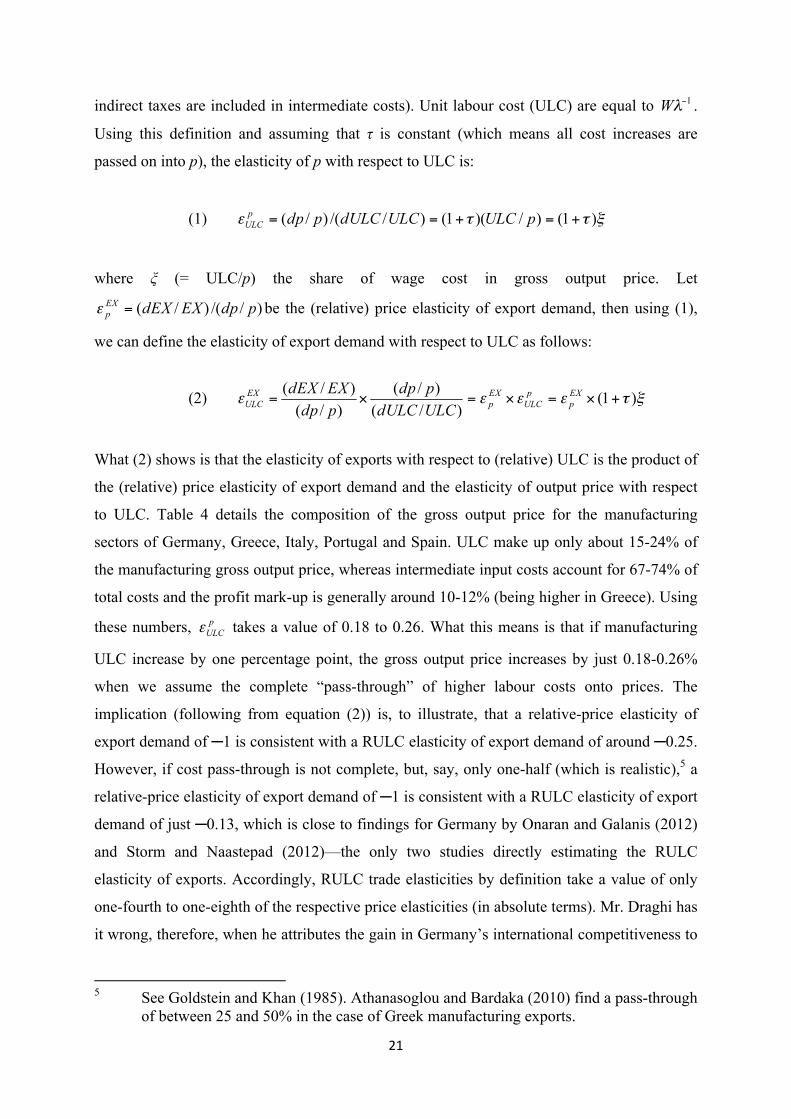
to ULC. Table 4 details the composition of the gross output price for the manufacturing
sectors of Germany, Greece, Italy, Portugal and Spain. ULC make up only about 15-24% of
the manufacturing gross output price, whereas intermediate input costs account for 67-74% of
total costs and the profit mark-up is generally around 10-12% (being higher in Greece). Using
these numbers, takes a value of 0.18 to 0.26. What this means is that if manufacturing
ULC increase by one percentage point, the gross output price increases by just 0.18-0.26%
when we assume the complete “pass-through” of higher labour costs onto prices. The
implication (following from equation (2)) is, to illustrate, that a relative-price elasticity of
export demand of ─1 is consistent with a RULC elasticity of export demand of around ─0.25.
However, if cost pass-through is not complete, but, say, only one-half (which is realistic),5 a
relative-price elasticity of export demand of ─1 is consistent with a RULC elasticity of export
demand of just ─0.13, which is close to findings for Germany by Onaran and Galanis (2012)
and Storm and Naastepad (2012)—the only two studies directly estimating the RULC
elasticity of exports. Accordingly, RULC trade elasticities by definition take a value of only
one-fourth to one-eighth of the respective price elasticities (in absolute terms). Mr. Draghi has
it wrong, therefore, when he attributes the gain in Germany’s international competitiveness to
5 See Goldstein and Khan (1985). Athanasoglou and Bardaka (2010) find a pass-through
of between 25 and 50% in the case of Greek manufacturing exports.
22
the decline in its RULC and the loss in Southern Europe’s competitiveness to the growth in its
RULC. Changes in exports, imports and current account balances cannot be explained in a
statistically significant or economically meaningful manner by changes in RULC (see:
Gabrisch and Staehr 2014; Diaz Sanchez and Varoudakis 2013; Storm and Naastepad 2015a;
Schröder 2015).
Table 4
Unit Labour Costs and Gross Output Prices (mid-2000’s)
Germany Greece Italy Portugal Spain
1. intermediate input costs per unit of output 0.67 0.68 0.74 0.73 0.73
2. unit labour costs: ULC 0.24 0.15 0.16 0.17 0.16
3. total unit variable cost: vc = 1 + 2 0.91 0.83 0.90 0.90 0.89
4. mark-up rate: � 0.10 0.21 0.11 0.11 0.12
5. gross output price: (1+ �)∗ vc 1.00 1.00 1.00 1.00 1.00
6. implied “pass-through” elasticity of a one-percentage point decline in ULC 0.26 0.18 0.18 0.19 0.18
Source: Storm and Naastepad (2015a, 2015b). Calculated using the OECD STAN Database
input-output tables. Notes: Gross output price is the average for the manufacturing sectors (C15T16 – C36T37).
The gross output price p is defined as: , where α is intermediate-input cost (per unit of output), W is the nominal wage rate, λ is labour productivity, and τ is the mark-up rate. ULC. Net indirect taxes have been included in intermediate input costs. The implied “pass-through” elasticity measures the decline in the gross output price (in percentage points) caused by a one-percentage point decline in ULC. The estimates in row (6) indicate that if manufacturing ULC are reduced by 10%, output prices will fall by less than 1.8%-2.6%.
However, all this does not mean that “competitiveness” is unimportant. It is non-price
or technological competitiveness which matters—not price or cost competitiveness. Joseph
Alois Schumpeter (1943, p. 84) summarized the key point vividly:
“Economists are at long last emerging from the stage in which price competition was all they saw. ( ... ) But in capitalist reality, as distinguished from its textbook picture, it is not that kind of competition which counts, but the competition from the new commodity, the new technology, the new source of supply, the new type of organization ( ... ) —competition which commands a decisive cost or quality advantage and which strikes not at the margins of the profits and the outputs of the existing firms but at their foundations and their very lives.”
23
What matters for international competitiveness are technological (non-price) competitiveness
and (high-tech) productive capabilities. That is the reason why, for instance, the Global
Competitiveness Report 2014-2015 defines competitiveness as “the set of institutions, policies
and factors that determine the level of productivity of a country.” This is brought out in
studies by the ECB (2005, 2010), Abaton et al. (2010), Felipe and Kumar (2011), Mazzucato
and Perez (2014) and Storm and Naastepad (2015a, 2015b). The Mediterranean export
structure (in terms of its complexity) is similar to that of China. This is where the real
problem of the peripheral countries lies: their lack of competitiveness vis-à-vis Germany is
not caused by the fact that their RULC are too high, their problem is that they are locked-in
into lower and middle levels of technology. There are, in other words, few Mediterranean
names that can rival BMW, Bosch, Mercedes, SAP, or Siemens. Reducing wages and
lowering RULC is never going to solve that problem.
Mishandling #2: Cutting wages (internal devaluation) and deregulating labour markets undermines a country’s competitiveness and stall export growth; combined with fiscal austerity this policy cocktail is lethal.
In Myth #2, peripheral Europe’s crisis is interpreted as an existential struggle for survival—
which resulted from an inability to absorb the external shock (caused by the Financial Crash).
The Southern European economies are, in this view, not “fit”, not competitive enough—
unlike “successful” Germany which is held up as a role model of competitive strength,
flexibility and resilience. We have argued elsewhere in detail why this view of Germany’s
recovery from the crisis is inaccurate and misleading (Storm and Naastepad 2015b) and we
will not repeat the arguments here. Our focus here is on the mistreatment of the Eurozone
periphery which, in line with Myth #2, is pressed to re-establish cost competitiveness. This
view is nowhere expressed better than in the recent (12 February 2015) high-level policy
statement by the Informal European Council, which includes the 12th President of the
European Commission, Mr. Jean-Claude Juncker; the President of the European Council, Mr.
Donald Tusk; the President of the Eurogroup & President of the Board of Governors of the
European Stability Mechanism (ESM), Mr. Jeroen Dijsselbloem, and Mr. Draghi of the ECB.
Their analytical note has as its title: “Preparing for Next Steps on Better Economic
Governance in the Euro Area”. According to Juncker-Tusk-Dijsselbloem-Draghi (henceforth:
JTDD), deep down the Eurozone crisis is a crisis of competitiveness, caused by structural
24
weaknesses and rigidities, especially in labour markets, which led to rising ULC in a number
of Euro Area countries:
“….thereby reducing their competitiveness and leading to a negative balance of payments vis-à-vis other euro area countries which had kept labour unit cost stable or even lowered them. This brought about higher unemployment rates during the crisis (see Chart 4). In addition, the relatively favourable financing conditions in the first years of the euro led to a misallocation of sources of financing towards less productive forms of investment, such as real estate, and to a greater risk-taking and indebtedness of many private and public actors. When the crisis hit the euro area and markets reappraised the risk and growth potential of individual countries, the loss of competitiveness became visible and led to outflows of sources of finance strongly needed for investment, thereby further intensifying the impact of the crisis in these countries.”
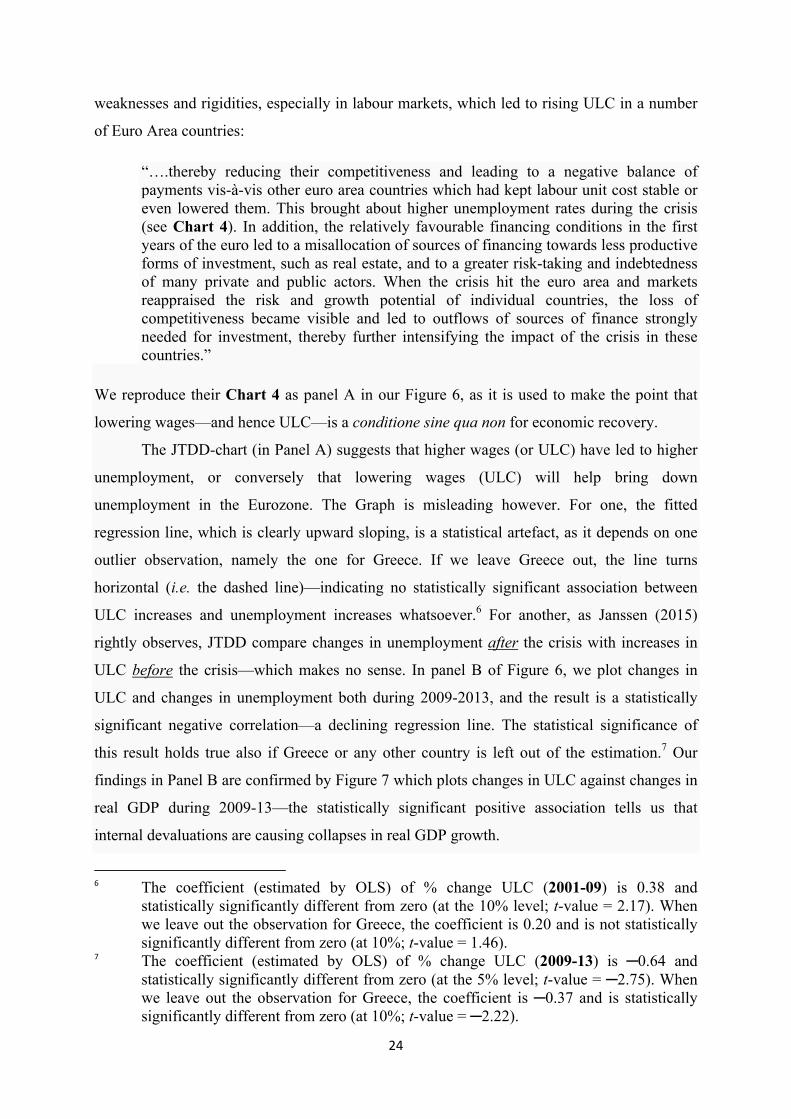
We reproduce their Chart 4 as panel A in our Figure 6, as it is used to make the point that
lowering wages—and hence ULC—is a conditione sine qua non for economic recovery.
The JTDD-chart (in Panel A) suggests that higher wages (or ULC) have led to higher
unemployment, or conversely that lowering wages (ULC) will help bring down
unemployment in the Eurozone. The Graph is misleading however. For one, the fitted
regression line, which is clearly upward sloping, is a statistical artefact, as it depends on one
outlier observation, namely the one for Greece. If we leave Greece out, the line turns
horizontal (i.e. the dashed line)—indicating no statistically significant association between
ULC increases and unemployment increases whatsoever.6 For another, as Janssen (2015)
rightly observes, JTDD compare changes in unemployment after the crisis with increases in
ULC before the crisis—which makes no sense. In panel B of Figure 6, we plot changes in
ULC and changes in unemployment both during 2009-2013, and the result is a statistically
significant negative correlation—a declining regression line. The statistical significance of
this result holds true also if Greece or any other country is left out of the estimation.7 Our
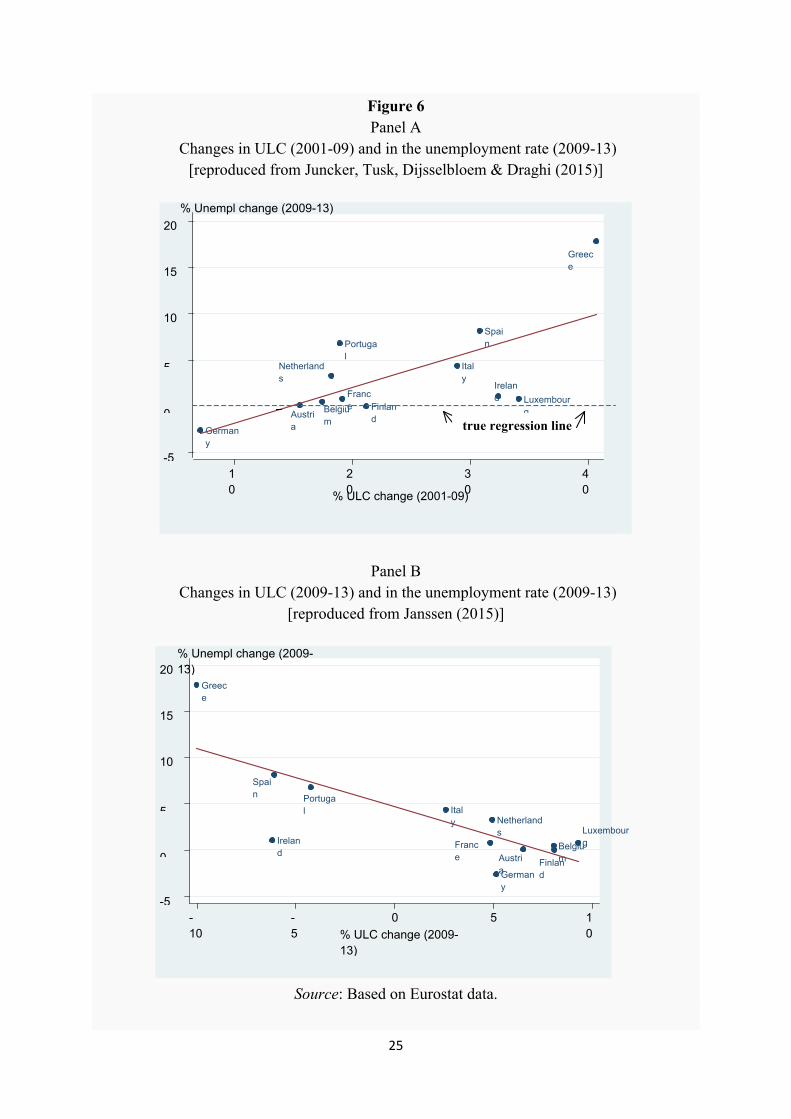
findings in Panel B are confirmed by Figure 7 which plots changes in ULC against changes in
real GDP during 2009-13—the statistically significant positive association tells us that
internal devaluations are causing collapses in real GDP growth.
6 The coefficient (estimated by OLS) of % change ULC (2001-09) is 0.38 and
statistically significantly different from zero (at the 10% level; t-value = 2.17). When we leave out the observation for Greece, the coefficient is 0.20 and is not statistically significantly different from zero (at 10%; t-value = 1.46).
7 The coefficient (estimated by OLS) of % change ULC (2009-13) is ─0.64 and statistically significantly different from zero (at the 5% level; t-value = ─2.75). When we leave out the observation for Greece, the coefficient is ─0.37 and is statistically significantly different from zero (at 10%; t-value = ─2.22).
25
Figure 6 Panel A
Changes in ULC (2001-09) and in the unemployment rate (2009-13) [reproduced from Juncker, Tusk, Dijsselbloem & Draghi (2015)]
Panel B Changes in ULC (2009-13) and in the unemployment rate (2009-13)
[reproduced from Janssen (2015)]
Source: Based on Eurostat data.
Belgium
Germany
Ireland
Greece
Spain
France
Italy
Luxembourg
Netherlands
Austria
Portugal
Finland
-5
0
5
10
15
20
10
20
30
40 % ULC change (2001-09)
% Unempl change (2009-13)
Belgium
Germany
Ireland
Greece
Spain
France
Italy
Luxembourg
Netherlands
Austria
Portugal
Finland
-5
0
5
10
15
20
-10
-5
0 5 10 % ULC change (2009-
13)
% Unempl change (2009-13)
true regression line
26
Figure 7 Post-crisis Eurozone (2009-2013):
internal devaluations are killing economic growth
Source: Authors’ estimations based on Eurostat Data and OECD data on real house prices. Note: The regression line is based on the following OLS regression:
∆ GDP = ─3.10 + 0.51 ∆ ULC ─ 17.78 Dummy for Greece (-3.04)*** (3.34)*** (-8.73)*** = 0.80; n = 15. ∆ real GDP = the percentage increase in real GDP (2009-13); ∆ ULC = the percentage
increase in average unit labour costs (2009-13). Robust t-values are reported in parentheses. ***, **, * indicate statistical significance at the 1%, 5% and 10% level, respectively. The results
do not depend on the observations of any individual country in the sample. The regression
result for just the 12 Eurozone countries is very similar: ∆ GDP = ─3.69 + 0.53 ∆ ULC ─ 17.05 Dummy for Greece (-3.65)*** (3.16)** (-8.69)*** = 0.84; n = 12.
Belgium
Germany
Ireland
Greece
Spain
France
Italy
Luxembourg
Netherlands
Austria
Portugal
Finland
Denmark
Sweden
UK
-30
-20
-10
0
10
-10
-5
0 5 10 % ULC change (2009-
13)
GDP growth (2009-13)
27
Panel B of Figure 6 and Figure 7 show the bleak reality: sharply declining wages in
Greece, Ireland, Portugal and Spain, leading to steep declines in aggregate demand and
output, and corresponding increases in unemployment (see Storm and Naastepad 2015a). It is
the exact opposite of what Messrs. Juncker, Tusk, Dijsselbloem and Draghi are claiming—for
some reason we are reminded of the old saying, attributed to Mark Twain, that “figures don’t
lie, but liars figure.”
The main plank of the Informal European Council’s recovery strategy is to ingrain
wage restraint into the fabric of the Eurozone by means of what are euphemistically called
“modernizing structural reforms” in the cash-strapped economies, but what in practice are the
deregulation of labour markets and the downsizing of welfare states—all as the price to pay
for ECB rescue loans. Such “modernizing reforms” are supposed to create a more competitive
and flexible system for firms by removing regulatory barriers and institutional “rigidities” by
curbing union wage-bargaining power, reducing workers’ sense of entitlement to job security
and welfare, and increasing labour mobility. What is, paradoxically perhaps, not understood is
that, as Robert Solow (1998) once remarked, every one of these regulations was intended to
promote a desirable social purpose—often as a “second-best” response to a “market failure”
(Agell 1999, 2002). For example, working time regulations and minimum wages must be seen
as responses to coordination failures among employers (Lee and McCann 2011) and
employment protection legislation is helping to share employment and income risks between
workers and firms (Agell 1999). In the absence of such regulations, the resulting levels of
labour inputs and labour productivity are suboptimal (Pissarides 2010). Moreover, in more
flexible labour markets, firms will invest less in workers’ firm-specific human capital and this
hurts productivity as well (Lee and McCann 2011; Kleinknecht et al. 2013). Labour market
deregulation may affect productivity through its impact on worker motivation and effort, as it
erodes social capital and trust in the labour relation (Storm and Naastepad 2012). Likewise,
lower wages and more flexible labour slow down the process of capital deepening, enable
inefficient firms to stay in the market and discourage structural change. Finally, lower wage
and demand growth reduce the pace at which older vintages of capital stock are being
scrapped and new equipment, embodying the latest more productive technologies, is being
installed. Taken together, lower wage growth gets reflected in lower labour productivity
growth and weaker export performance (for reviews of the evidence, see Storm and
Naastepad 2012; Kleinknecht, Naastepad, Storm & Vergeer 2013). Space prevents us from
going into greater detail, but our main point is that it is impossible to see how Europe thinks it
can reduce the large gaps in labour productivity and technological capabilities between the
28
Eurozone core and periphery by cutting wages and breaking down “productivist” social
overhead structures (Storm and Naastepad 2015c).
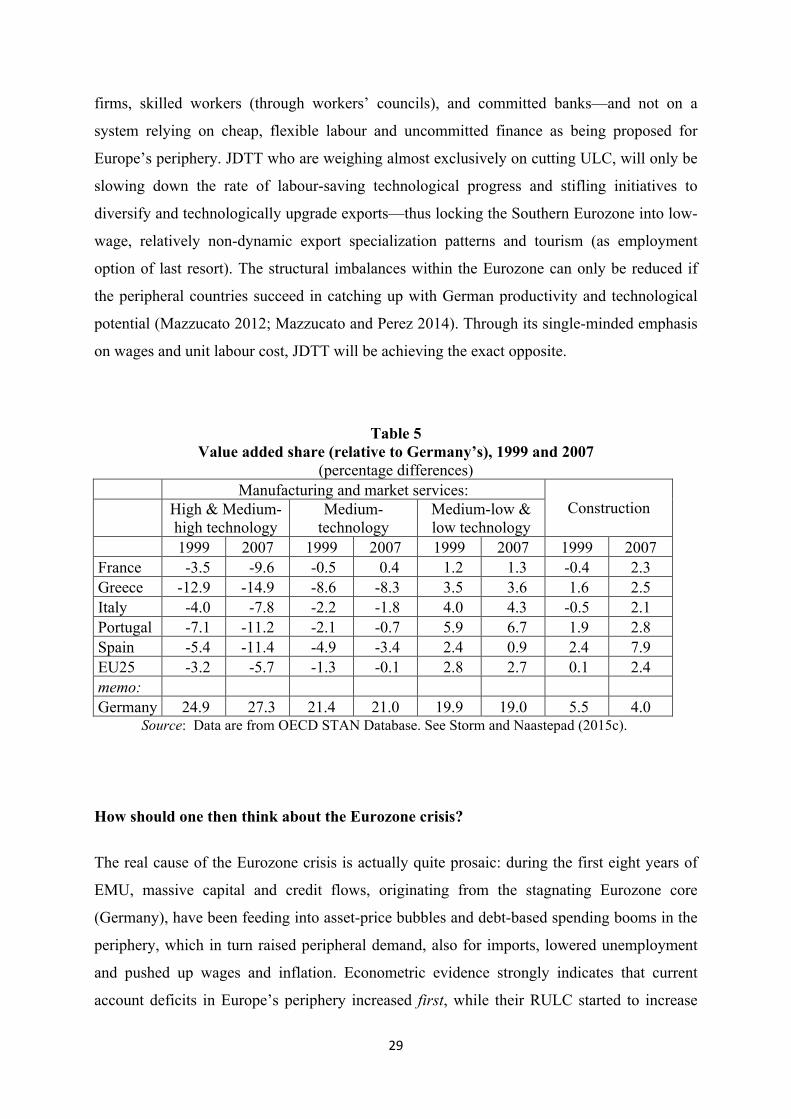
This brings us to the real problem of the Eurozone: the widening differentials in labour
productivity and technological capabilities between members of the Eurozone. Productive
asymmetries have increased within the Eurozone after monetary union. In the pre-crisis years,
Germany managed to strengthen its production structure, but the Eurozone periphery lost
ground—both their manufacturing activities and export bases became relatively more narrow
and technologically stagnant. This has been widely documented (Janger et al. 2011;
Simonazzi, Ginzburg and Nocella 2013; Botta 2014)—and we use Table 5 to illustrate this
structural divergence. Table 5 shows how Eurozone manufacturing production structures
changed during 1999 and 2007—relative to Germany’s productive base which became more
high- & medium-tech intensive (see Storm and Naastepad 2015b for an analysis of the
German case). The value added share of high- & medium-tech manufacturing in Germany
was already the highest in the Eurozone in 1999 (being equal to 24.9%) and it increased by
2.4 percentage points during 1999-2007. While most EU countries failed to keep up with
Germany’s pace of technological upgrading (meaning there was relative divergence), the
value added share of high- & medium-tech manufacturing did register an absolute decline in
France (by 3.7 percentage points), Italy (by 1.4 percentage points), Portugal (by 1.7
percentage points) and Spain (by 3.6 percentage points)—which implies absolute divergence.
At the same time, the value-added share of low-tech manufacturing in Germany was about 2.8
percentage points lower than the EU average in 1999; it was also far lower than that of
Greece, Italy, and Portugal—and the difference grew wider between 1999 and 2007. The
share of the low-tech sector in GDP was 3.6 percentage points higher in Greece than in
Germany in 2007, 4.3 percentage points higher in Italy, and 6.7 percentage points higher in
Portugal. These numbers point to divergence, big time—and this conclusion is reinforced
when we include the construction sector. While the value-added share of (non-traded)
construction came down in Germany from 5.5% in 1999 to 4% in 2007, it increased in France
(from 5.1% to 6.3%), Italy (from 5% to 6.2%) and especially Spain (from 7.9% to 12% of
GDP). Using a variety of structural indicators for the period 1999-2007, ranging from capital
intensity, skill intensity and innovation intensity of sectoral output, Janger et al. (2011) obtain
a consistent pattern of Germany leaping further ahead and the periphery falling behind ever
more. We must note here that Germany’s manufacturing (export) strength, as we argue
elsewhere (Storm and Naastepad 2015b), is based on a highly co-ordinated and regulated
“model” based on close links and effective “checks & balances” between (often high-tech)
29
firms, skilled workers (through workers’ councils), and committed banks—and not on a
system relying on cheap, flexible labour and uncommitted finance as being proposed for
Europe’s periphery. JDTT who are weighing almost exclusively on cutting ULC, will only be
slowing down the rate of labour-saving technological progress and stifling initiatives to
diversify and technologically upgrade exports—thus locking the Southern Eurozone into low-
wage, relatively non-dynamic export specialization patterns and tourism (as employment
option of last resort). The structural imbalances within the Eurozone can only be reduced if
the peripheral countries succeed in catching up with German productivity and technological
potential (Mazzucato 2012; Mazzucato and Perez 2014). Through its single-minded emphasis
on wages and unit labour cost, JDTT will be achieving the exact opposite.
Table 5 Value added share (relative to Germany’s), 1999 and 2007
(percentage differences) Manufacturing and market services:
High & Medium-high technology
Medium-technology
Medium-low & low technology
Construction
1999 2007 1999 2007 1999 2007 1999 2007 France -3.5 -9.6 -0.5 0.4 1.2 1.3 -0.4 2.3 Greece -12.9 -14.9 -8.6 -8.3 3.5 3.6 1.6 2.5 Italy -4.0 -7.8 -2.2 -1.8 4.0 4.3 -0.5 2.1 Portugal -7.1 -11.2 -2.1 -0.7 5.9 6.7 1.9 2.8 Spain -5.4 -11.4 -4.9 -3.4 2.4 0.9 2.4 7.9 EU25 -3.2 -5.7 -1.3 -0.1 2.8 2.7 0.1 2.4 memo: Germany 24.9 27.3 21.4 21.0 19.9 19.0 5.5 4.0
Source: Data are from OECD STAN Database. See Storm and Naastepad (2015c).
How should one then think about the Eurozone crisis?
The real cause of the Eurozone crisis is actually quite prosaic: during the first eight years of
EMU, massive capital and credit flows, originating from the stagnating Eurozone core
(Germany), have been feeding into asset-price bubbles and debt-based spending booms in the
periphery, which in turn raised peripheral demand, also for imports, lowered unemployment
and pushed up wages and inflation. Econometric evidence strongly indicates that current
account deficits in Europe’s periphery increased first, while their RULC started to increase
30
only later (Gabrisch and Staehr 2014; Gaulier & Vicard 2012). Hence, Eurozone imbalances
arose as a result of strong domestic demand growth in the periphery, spurred by a domestic
credit boom made possible by European financial integration which removed the obstacles
discouraging the flow of private debt from the core to the periphery (Chen et al. 2012; Lane
and McQuade 2013; Diaz Sanchez and Varoudakis 2013). Cross-border financial flows
increased far more than cross-border trade in goods and services, especially during 2003-2007
when there was a striking increase in debt (not equity) flows from Eurozone core banks to the
periphery (Waysand, Ross and de Guzman 2010; Lane and McQuade 2013). Hence,
unsustainable current account imbalances, in our explanation, were driven by changes in the
capital account—as higher debt-financed domestic demand spilled over into higher imports.
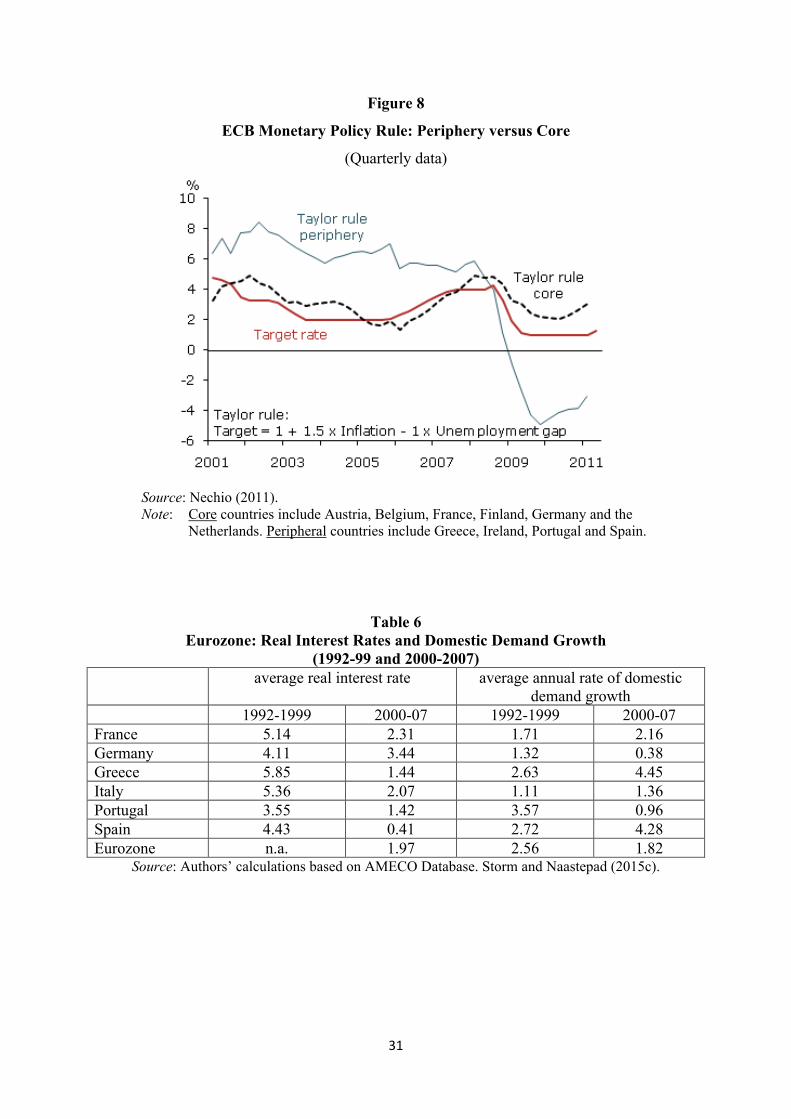
The prime factor underlying the credit boom in the periphery were the unusually low
long-term interest rates prevailing in the early 2000s (Lane 2012). The ECB decided to lower
the interest rate in response to the low inflation and the absence of any inflation threat (given
the lackluster growth and high long-term unemployment) in the Eurozone core—and
specifically in Germany. Evidence for this appears in Figure 8, which compares policy rates,
which were mechanically derived from the Taylor rule for the Eurozone core countries , on
the one hand, and, for the periphery on the other hand, with the actual target interest rates set
by the ECB (during 2001-2011). It can be seen that the actual ECB interest rate closely
tracked the interest rate derived from the Taylor rule for the core—which means macro
conditions in the core carried the greatest weight in ECB policy decisions. It is also clear that
during 2001-08, the ECB “one-size-fits-all” target rate lay well below the level recommended
by the Taylor rule for the peripheral countries—which indicates that interest rate policy was
out of sync with economic conditions in Southern Europe.8
8 We do not support the Taylor rule nor want to suggest here that ECB monetary policy
should have been more restrictive.
31
Figure 8
ECB Monetary Policy Rule: Periphery versus Core
(Quarterly data)
Source: Nechio (2011). Note: Core countries include Austria, Belgium, France, Finland, Germany and the
Netherlands. Peripheral countries include Greece, Ireland, Portugal and Spain.
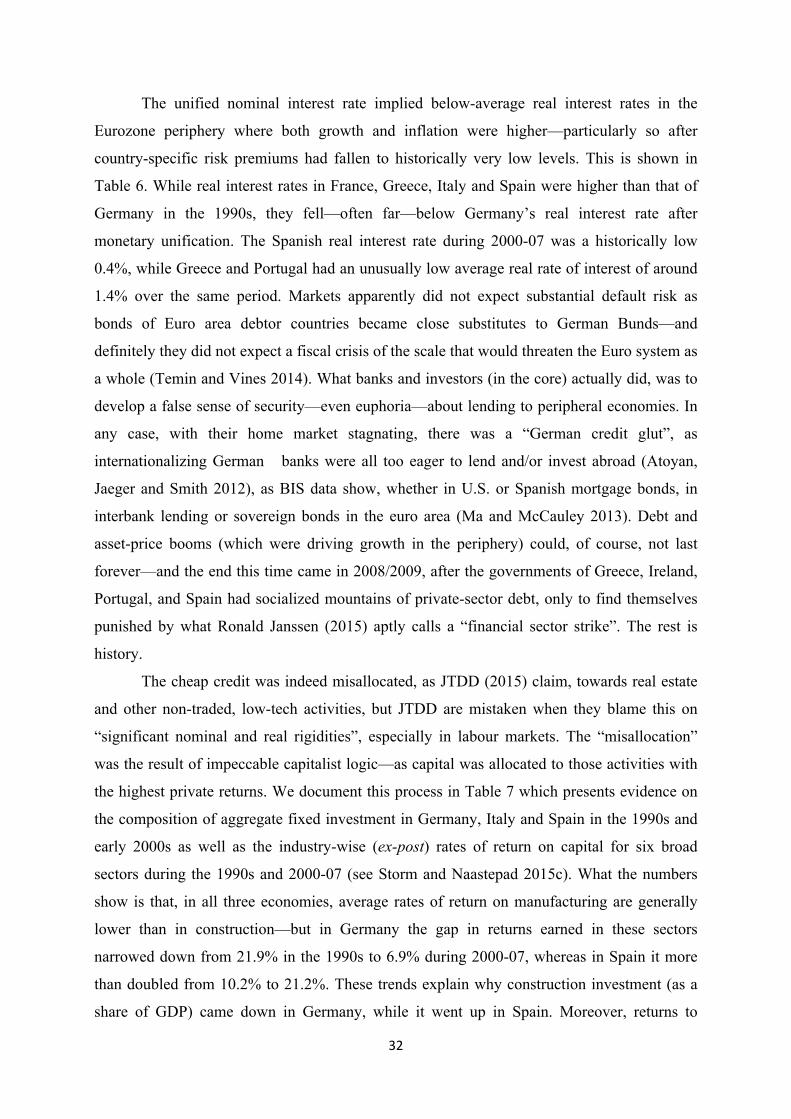
Table 6 Eurozone: Real Interest Rates and Domestic Demand Growth
(1992-99 and 2000-2007) average real interest rate average annual rate of domestic
demand growth 1992-1999 2000-07 1992-1999 2000-07
France 5.14 2.31 1.71 2.16 Germany 4.11 3.44 1.32 0.38 Greece 5.85 1.44 2.63 4.45 Italy 5.36 2.07 1.11 1.36 Portugal 3.55 1.42 3.57 0.96 Spain 4.43 0.41 2.72 4.28 Eurozone n.a. 1.97 2.56 1.82
Source: Authors’ calculations based on AMECO Database. Storm and Naastepad (2015c).
32
The unified nominal interest rate implied below-average real interest rates in the
Eurozone periphery where both growth and inflation were higher—particularly so after
country-specific risk premiums had fallen to historically very low levels. This is shown in
Table 6. While real interest rates in France, Greece, Italy and Spain were higher than that of
Germany in the 1990s, they fell—often far—below Germany’s real interest rate after
monetary unification. The Spanish real interest rate during 2000-07 was a historically low
0.4%, while Greece and Portugal had an unusually low average real rate of interest of around
1.4% over the same period. Markets apparently did not expect substantial default risk as
bonds of Euro area debtor countries became close substitutes to German Bunds—and
definitely they did not expect a fiscal crisis of the scale that would threaten the Euro system as
a whole (Temin and Vines 2014). What banks and investors (in the core) actually did, was to
develop a false sense of security—even euphoria—about lending to peripheral economies. In
any case, with their home market stagnating, there was a “German credit glut”, as
internationalizing German banks were all too eager to lend and/or invest abroad (Atoyan,
Jaeger and Smith 2012), as BIS data show, whether in U.S. or Spanish mortgage bonds, in
interbank lending or sovereign bonds in the euro area (Ma and McCauley 2013). Debt and
asset-price booms (which were driving growth in the periphery) could, of course, not last
forever—and the end this time came in 2008/2009, after the governments of Greece, Ireland,
Portugal, and Spain had socialized mountains of private-sector debt, only to find themselves
punished by what Ronald Janssen (2015) aptly calls a “financial sector strike”. The rest is
history.
The cheap credit was indeed misallocated, as JTDD (2015) claim, towards real estate
and other non-traded, low-tech activities, but JTDD are mistaken when they blame this on
“significant nominal and real rigidities”, especially in labour markets. The “misallocation”
was the result of impeccable capitalist logic—as capital was allocated to those activities with
the highest private returns. We document this process in Table 7 which presents evidence on
the composition of aggregate fixed investment in Germany, Italy and Spain in the 1990s and
early 2000s as well as the industry-wise (ex-post) rates of return on capital for six broad
sectors during the 1990s and 2000-07 (see Storm and Naastepad 2015c). What the numbers
show is that, in all three economies, average rates of return on manufacturing are generally
lower than in construction—but in Germany the gap in returns earned in these sectors
narrowed down from 21.9% in the 1990s to 6.9% during 2000-07, whereas in Spain it more
than doubled from 10.2% to 21.2%. These trends explain why construction investment (as a
share of GDP) came down in Germany, while it went up in Spain. Moreover, returns to
33
investment were generally low in (stagnating) Germany across all activities, and this
constituted a major push factor driving private capital flows to southern Europe, where returns
were much higher.9 Spain’s construction and tourism sectors offered by far the highest returns
on capital in the Eurozone—hence it is little wonder that German and French banks were
lining up to offer credit to Spanish project developers and tourism businesses. This was a
profoundly disturbing trend, because these investment did amount to nothing whatsoever
when it came to building up productive capacity and technological capabilities. This way,
these massive capital flows within the monetary union reinforced existing structural
differences in productive capabilities and export specialization between Europe’s core and
periphery, as has been extensively documented (Janger et al. 2011; Simonazzi, Ginzburg and
Nocella 2013; Botta 2014; Storm and Naastepad 2015c). The Eurozone periphery lost
ground—both their manufacturing activities and export bases became relatively more narrow
and technologically stagnant. This is Europe’s real competitiveness problem. And now that
debtor-countries are forced to deregulate and cut wages, they get trapped in low-wage low-
productivity activities with an export specialization that overlaps with even-more-low-wage
China.10
Monetary and financial integration has thus been driving European economies and
nations apart—and propelled by these centrifugal forces, the old debate about a political (and
fiscal) union, which has been kept on the back burner ever since the Maastricht Treaty of
1992, is back. Many observers see it as perhaps the only way to hold the Eurozone together.
But in our opinion, as long as European integration remains (financial) market-led, even a
fiscal union will be too weak a mechanism to counter the structural centrifugal forces which
are entrenching a two-tier Europe with two classes of members, as both Ulrich Beck (2013)
and George Soros (2014) fear, with the “second-class” members structurally dependent upon
transfers from the “first-class” members. The centre cannot hold.
9 Atoyan, Jaeger and Smith (2012) conclude that push factors (low returns in the core),
rather than pull factors (high returns in the destination countries) drove most of the capital flows coming from the Eurozone core.
10 Indeed, ECB economists Benkovskis et al. (2013) find that competitive pressure from China is strongest and growing for the Southern periphery, Ireland and Central, Eastern and Southeastern European EU members. German firms, on the other hand, do not get pushed out of their export markets by Chinese newcomers.
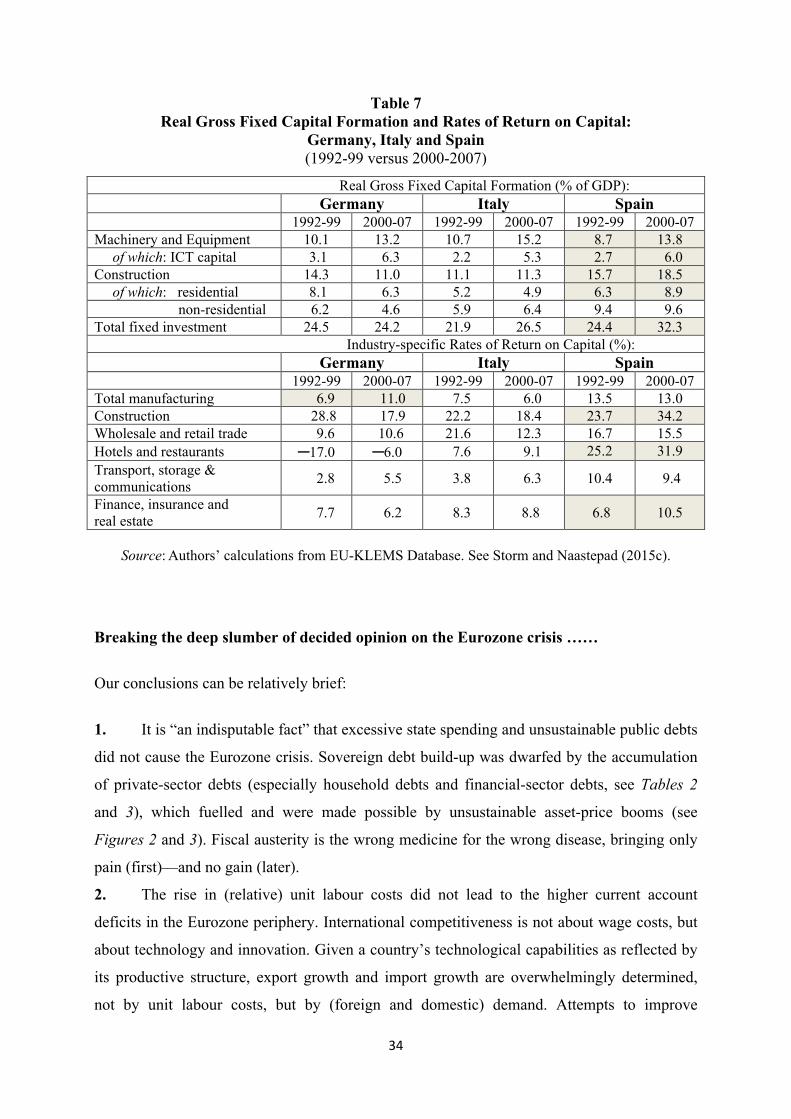
34
Table 7 Real Gross Fixed Capital Formation and Rates of Return on Capital:
Germany, Italy and Spain (1992-99 versus 2000-2007)
Real Gross Fixed Capital Formation (% of GDP): Germany Italy Spain 1992-99 2000-07 1992-99 2000-07 1992-99 2000-07 Machinery and Equipment 10.1 13.2 10.7 15.2 8.7 13.8 of which: ICT capital 3.1 6.3 2.2 5.3 2.7 6.0 Construction 14.3 11.0 11.1 11.3 15.7 18.5 of which: residential 8.1 6.3 5.2 4.9 6.3 8.9 non-residential 6.2 4.6 5.9 6.4 9.4 9.6 Total fixed investment 24.5 24.2 21.9 26.5 24.4 32.3 Industry-specific Rates of Return on Capital (%): Germany Italy Spain 1992-99 2000-07 1992-99 2000-07 1992-99 2000-07 Total manufacturing 6.9 11.0 7.5 6.0 13.5 13.0 Construction 28.8 17.9 22.2 18.4 23.7 34.2 Wholesale and retail trade 9.6 10.6 21.6 12.3 16.7 15.5 Hotels and restaurants ─17.0 ─6.0 7.6 9.1 25.2 31.9 Transport, storage & communications 2.8 5.5 3.8 6.3 10.4 9.4
Finance, insurance and real estate 7.7 6.2 8.3 8.8 6.8 10.5
Source: Authors’ calculations from EU-KLEMS Database. See Storm and Naastepad (2015c).
Breaking the deep slumber of decided opinion on the Eurozone crisis ……
Our conclusions can be relatively brief:
1. It is “an indisputable fact” that excessive state spending and unsustainable public debts
did not cause the Eurozone crisis. Sovereign debt build-up was dwarfed by the accumulation
of private-sector debts (especially household debts and financial-sector debts, see Tables 2
and 3), which fuelled and were made possible by unsustainable asset-price booms (see
Figures 2 and 3). Fiscal austerity is the wrong medicine for the wrong disease, bringing only
pain (first)—and no gain (later).
2. The rise in (relative) unit labour costs did not lead to the higher current account
deficits in the Eurozone periphery. International competitiveness is not about wage costs, but
about technology and innovation. Given a country’s technological capabilities as reflected by
its productive structure, export growth and import growth are overwhelmingly determined,
not by unit labour costs, but by (foreign and domestic) demand. Attempts to improve
35
“competitiveness” by wage cuts and labour market deregulation can only backfire (see Figure
6, panel B)—no country has managed to climb up the technological ladder (upgrading exports
and strengthening non-price competitiveness) based on low wages and footloose, fractured
and flexible workers. Messrs. Juncker, Tusk, Dijsselbloem and Draghi (JTDD) are not just
barking up the wrong tree, but their Next Steps constitute a sure-fire recipe for further
divergence, not convergence within the zone (again, see Figure 6, panel B).
3. The only sensible way to think about the Eurozone crisis is in terms of a private-sector
debt crisis, aided and abetted by the liberalization of (integrating) European financial markets
and a “global banking glut”. With this understanding, we can start thinking about more
effective, efficient and just ways to bring about economic recovery in the Eurozone. Without
doubt, such a recovery package must include a coordinated demand stimulus, a directing of
credit towards productive investments and “smart” innovation (also through a “socialization
of investments” à la Keynes), a bailing out of cash-strapped and insolvent governments (by
the ECB), and “mission-oriented” industrial policies to restructure and upgrade peripheral
manufacturing (Mazzucato and Perez 2014). This requires, at the EU level, coordination of
economic decision-making, or what Beck (2013) calls a “new social contract for Europe”—
not the beggar-thy-neighbour competition propagated by JTDD or the “eat your peas”
solution of Mr. Schäuble.
4. Needless to say, none of these proposals is being seriously entertained by Eurozone
leadership, as the Informal European Council, as long as it dwells in Mill’s “deep slumber of
a decided opinion.” (On Liberty, p. 95). This unwillingness to tackle the true causes of the
crisis is not without risk, since the strains of on-going divergence within the zone cannot be
endured endlessly politically.
References Abdon, A., M. Bacate, J. Felipe and U. Kumar. 2010. Product complexity and economic
development. Working Paper No. 616. Levy Economics Institute of Bard College. Agell, J. 1999. On the benefits from rigid labour markets: norms, market failures, and social
insurance. The Economic Journal 109: F143-F164. Agell, J. 2002. On the determinants of labour market institutions: rent seeking vs. social
insurance. German Economic Review 3 (2): 107-135. Alesina, A. and S. Ardagna. 2010. Large changes in fiscal policy: taxes versus spending. In
J.R. Brown (ed.), Tax Policy and the Economy, vol. 24. Cambridge, Mass.: National Bureau of Economic Research.
Athanasoglou, P.P. and I.C. Bardaka. 2010. New trade theory, non-price competitiveness and export performance. Economic Modelling 27 (2): 217-228.
36
Atoyan, R., A. Jaeger and D. Smith. 2012. The pre-crisis capital flow surge to emerging Europe: did countercyclical fiscal policy make a difference? IMF Working Paper WP/12/222. Washington, DC: International Monetary Fund.
Ball, L., D. Furceri, D. Leigh and P. Loungani. 2013. The Distributional Effects of Fiscal Consolidation. IMF Working Paper WP/13/151. Available at: http://www.imf.org/external/pubs/ft/wp/2013/wp13151.pdf
Barba, A. and M. Pivetti. 2009. Rising household debt: its causes and macroeconomic implications-a long-period analysis. Cambridge Journal of Economics 33 (1): 113-137. doi: 10.1093/cje/ben030
Beck, U. 2013. German Europe. Cambridge/Oxford: Polity Press. Bini Smaghi, L. 2013. Austerity and stupidity. VoxEU.org, 6 November. Blanchard, O. and F. Giavazzi. 2002. Current account deficits in the Euro Area: the end of the
Feldstein-Horioka puzzle? Brookings Papers on Economic Activity 2002 (2): 147-186. Bussière, M., G. Callegari, F. Ghironi, G. Sestieri and N. Yamano. 2011. Estimating trade
elasticities: demand composition and the trade collapse of 2008-09. Mimeo. Bornhorst, F. and M. Ruiz-Arranz. 2013. Indebtedness and deleveraging in the euro area.
2013 Article IV Consultation on euro area policies: Selected Issues Paper, Chapter 3, IMF Country Report 13/232.
Botta, A. 2014. Structural asymmetries at the roots of the Eurozone crisis: What’s new for industrial policy in the EU. Levy Economics Institute of Bard College Working Paper No. 794.
Bussière, M., G. Callegari, F. Ghironi, G. Sestieri and N. Yamano. 2011. Estimating trade elasticities: demand composition and the trade collapse of 2008-09. Mimeo.
Cecchetti, S.G., M. S. Mohanty and F. Zampolli. 2011. The real effects of debt. BIS Working Paper No. 352. Basel: BIS.
Chen, R., G.M. Milesi-Ferretti and T. Tressel. 2012. External imbalances in the Euro Area. IMF Working Paper WP/12/236. Washington, DC: IMF.
Chmelar, A. 2013. Household Debt and the European Crisis. Available at: file:///C:/Users/sstorm/Downloads/Household%20Debt%20and%20the%20European%20Crisis.pdf
Dadush, U. and contributors. 2010. Paradigm Lost. The Euro in Crisis. Washington, DC: The Carnegie Endowment for International Peace.
Danninger, S. and F. Joutz. 2007. What explains Germany’s rebounding export market share?, IMF Working Paper WP/07/24. Washington, DC: IMF.
Diaz Sanchez, J.L. and A. Varoudakis. 2013. Growth and competitiveness as factors of Eurozone external imbalances. Policy Research Working Paper 6732. Washington, DC: World Bank.
Draghi, M. 2012. “Competitiveness of the Eurozone and within the Eurozone”, Speech at the colloquium “Les défis de la compétitivité”, Paris, 13 March.
ECB. 2005. Competitiveness and the export performance of the Euro Area. Occasional Paper Series No. 30. Frankfurt am Main: European Central Bank.
ECB. 2012. Competitiveness and external imbalances within the Euro Area. Occasional Paper Series No. 139. Frankfurt am Main: European Central Bank.
Eichengreen, B. and K.H. O’Rourke. 2012. Gauging the multiplier: lessons from history. VoxEU.org.
European Commission. 2009. The Evolution of EU and Its Member States’ Competitiveness in International Trade. Final Report CEPII-CIREM ATLASS consortium. Brussels: EC.
37
European Commission. 2009. Competitiveness developments within the euro area. Quarterly Report on the Euro Area 8 (1). Brussels: European Commission, Directorate-General for Economic and Financial Affairs.
European Commission. 2010. The Impact of the Global Crisis on Competitiveness and Current Account Divergences in the Euro Area. Quarterly Report on the Euro Area. Special Issue. Brussels: European Commission, Directorate-General for Economic and Financial Affairs.
European Commission. 2012. The distributional effects of fiscal consolidation in nine EU countries. Research Note 01/2012. Brussels: European Commission, Directorate-General for Employment, Social Affairs and Inclusion.
European Commission. 2012. Social Europe. EU Employment and Social Situation. Quarterly Review. March. Brussels: EC.
European Commission. 2015. European Economic Forecasts Winter 2015. Available at: http://ec.europa.eu/economy_finance/publications/european_economy/2015/pdf/ee1_en.pdf
Fagerberg, J. 1988. International Competitiveness. The Economic Journal, 98 (391): 355-374 Felipe, J. and U. Kumar. 2011. Unit labor costs in the Eurzone: The competitiveness debate
again. Working Paper No. 651. Levy Economics Institute of Bard College. Gabrisch, H. and K. Staehr. 2014. The Euro Plus Pact: cost competitiveness and external
capital flows in the EU countries. Working Paper Series No. 1650. Frankfurt: European Central Bank.
Gaulier, G. and V. Vicard. 2012. Current account imbalances in the euro area: competitiveness or demand shock? Banque de France Quarterly Selection of Articles No. 27. Paris: Banque de France.
Goldstein, M. and M.S. Khan. 1985. Income and price effects in foreign trade. In R.W. Jones and P.B. Kenen (Eds.), Handbook of International Economics, Volume 2, Chapter 20, pp. 1041-1105. Amsterdam: North-Holland.
Gordon, R.J. and R. Krenn (2010). The End of the Great Depression 1939-41: Policy Contributions and Fiscal Multipliers. NBER Working Paper 16380, September 2010.
Gros, D. 2011. Competitiveness Pact: Flawed economics. CEPS Commentaries, Centre for European Policy Studies, 18 March.
Guajardo, J., D. Leigh and A. Pescatori. 2011. Expansionary austerity: New international evidence. IMF Working Paper WP/11/158. Washington, DC: IMF. Available at: http://www.imf.org/external/pubs/ft/wp/2011/wp11158.pdf
Herndon, T., M. Ash and R. Pollin. 2013. Does High Public Debt Consistently Stifle Economic Growth? A Critique of Reinhart and Rogoff, Working Paper Political Economy Research Institute, University of Massachusetts at Amherst.
IMF. 2012a. Dealing with household debt. Chapter 3 in World Economic Outlook. Growth Resuming, Dangers Remain. April. Washington, DC: IMF.
IMF. 2012b. World Economic Outlook. Coping With High Debt and Sluggish Growth. October. Washington, DC: IMF.
IMF. 2015. World Economic Outlook Update. Available at: https://www.imf.org/external/pubs/ft/weo/2015/update/01/pdf/0115.pdf
Informal European Council. 2015. Preparing for the Next Steps on Better Economic Governance in the Euro Area. Analytical Note written by J.-C. Juncker, D. Tusk, J. Dijsselbloem and M. Draghi. Brussels: European Commission.
Janger, J., W. Hölzl, S. Kaniovski, J. Kutsam, M. Peneder, A. Reinstaller, S. Sieber, I. Stadler, and F. Unterlass. 2011. Structural Change and the Competitiveness of EU Member States - Final Report. On-line available at: http://ec.europa.eu/enterprise/policies/ industrial-competitiveness/documents/files/structural_change_en.pdf
38
Janssen, R. 2015. European economic governance and flawed analysis. Social Europe. Available at: http://www.socialeurope.eu/author/ronald-janssen/
Kleinknecht, A., C.W.M., Naastepad, S. Storm and R. Vergeer. 2013. Labour market rigidities can be useful. Chapter 8, pp. 175-191, in S. Fadda & P. Tridico (Eds.), Financial Crisis, Labour Markets and Institutions. London: Routledge.
Lane, P.R. 2012. The European sovereign debt crisis. Journal of Economic Perspectives 26 (3): 49-68.
Lane, P.R. 2013. Capital flows in the Euro Area. European Economy. Economic Papers 497. Brussels: Directorate-General for Economic and Financial Affairs.
Lane, P.R. and P. McQuade. 2012. Domestic credit growth and international capital. Mimeo. Lane, P.R. and B. Pels. 2012. Current account imbalances in Europe. IIIS Discussion Paper
No. 397. Trinity College Dublin. Lee, S. and D. McCann. Eds. 2011. Regulating for decent Work. New Directions in Labour
Market Regulation. London: Palgrave. Ma, G. and R.N. McCauley. 2013. Global and euro imbalances: China and Germany. BIS
Working Papers No. 424. Basel: Bank for International Settlements. Martin, P. and T. Philippon. 2014. Inspecting the mechanism: leverage and the Great
Recession in the Eurozone. NBER Working Paper No. 20572. Cambridge, MA: NBER.
Mazzucato, M. 2013. The Entrepreneurial State – Debunking Public vs. Private Sector Myths. London: Anthem Press.
Mazzucato, M. and C. Perez. 2014. Innovation as growth policy: the challenge for Europe. SPRU Working Paper Series SWPS 2014-13. University of Sussex: SPRU.
Nechio, F. 2011. Monetary policy when one size does not fit all. FRBSF Economic Letter 2011-18. San Franciso: Federal Reserve Bank of San Francisco.
Noyer, C. 2012. Remaining challenges facing the euro area. Available at: http://www.bis.org/review/r121010b.pdf
Onaran, Ö. and G. Galanis. 2012. Is aggregate demand wage-led or profit-led. National and global effects. Conditions of Work and Employment Series No. 40. Geneva: International Labour Office.
Pissarides, C. 2010. Why do firms offer “employment protection”? Economica 77 (301): 131-159.
Reinhart, C.M. and K.S. Rogoff. 2009. This Time is Different: Eight Centuries of Financial Folly. Princeton, NJ: Princeton University Press.
Reinhart, C.M. and K.S. Rogoff. 2010. Growth in a Time of Debt. American Economic Review: Papers & Proceedings 100 (May 2010): 573–578.
Schäuble, W. 2011. Why austerity is the only cure for the Eurozone. Financial Times, September 5. Available online at http://www.ft.com/intl/cms/s/0/97b826e2-d7ab-11e0- a06b-00144feabdc0.html#axzz355KUI33Z
Schröder, E. 2015. Eurozone imbalances: measuring the contribution of expenditure switching and expenditure volumes 1990-2013. Mimeo, New School University.
Schumpeter, J.A. 1943. Capitalism, Socialism and Democracy. London: Unwin. Simonazzi, A., A. Ginzburg and G. Nocella. 2013. Economic relations between Germany and
southern Europe. Cambridge Journal of Economics. Sinn, H.W. 2010. Reining in Europe’s Debtor Nations. Project Syndicate, April. Sinn, H.W. 2012. Wir sitzen in der Falle. Frankfurter Allgemeine Zeitung, 18 February. Sinn, H.W. 2014. Austerity, growth and inflation: remarks on the Eurozone’s unresolved
competitiveness problem. The World Economy 37 (1): 1-13. Solow, R.M. 1998. What is labour-market flexibility? What is it good for?, Proceedings of the
British Academy, 97: 189-211.
39
Soros, G. 2014. George Soros warns British EU exit would trigger foreign company exodus. The Guardian, March 12.
Storm, S. and C.W.M. Naastepad. 2009. Labour market regulation and labour productivity growth: evidence for 20 OECD countries 1984-2004. Industrial Relations 48 (4): 629-654.
Storm, S. and C.W.M. Naastepad. 2012. Macroeconomics Beyond the NAIRU. Cambridge, Mass.: Harvard University Press.
Storm, S. and C.W.M. Naastepad. 2015a. Europe’s Hunger Games: income distribution, cost competitiveness and crisis. Cambridge Journal of Economics, forthcoming. http://cje.oxfordjournals.org/content/early/2014/09/15/cje.beu037.full.pdf+html
Storm, S. and C.W.M. Naastepad. 2015b. Germany’s recovery from crisis: The real lessons. Structural Change and Economic Dynamics, forthcoming. http://www.sciencedirect.com/science/article/pii/S0954349X15000028
Storm, S. and C.W.M. Naastepad. 2015c. NAIRU economics and the Eurozone crisis. International Review of Applied Economics (under review).
Temin, P. and D. Vines. 2013. The Leaderless Economy. Why the World Economy System Fell Apart and How to Fix It. Princeton: Princeton University Press.
Trichet, J.-C. 2010. http://www.ecb.europa.eu/press/key/date/2010/html/sp101203.en.html Trichet, J.-C. 2011. Competitiveness and the smooth functioning of EMU. Lecture at the
University of Liège, 23 February. Veld, J. in ‘t. 2013. Fiscal consolidations and spillovers in the Euro area periphery and core.
Brussels: European Commission. Available at: http://ec.europa.eu/economy_finance/publications/economic_paper/2013/pdf/ecp506_en.pdf
Waysand, C., K. Ross and J. de Guzman. 2010. European financial linkages: a new look at imbalances. IMF Working Paper WP/10/295. Washington, DC: International Monetary Fund.
Wyplosz, C. 2013. The Eurozone crisis and the competitiveness legend. Asian Economic Papers 12 (3): 63-81.