Embed Size (px)
Citation preview

WP/14/113
The EU Services Directive: Gains from Further Liberalization
Emilio Fernández Corugedo and Esther Pérez Ruiz
© 2014 International Monetary Fund WP/14/113
IMF Working Paper
European Department
The EU Services Directive: Gains from Further Liberalization
Prepared by Emilio Fernández Corugedo and Esther Pérez Ruiz
Authorized for distribution by Edward Gardner
July 2014
Abstract
The EU Services Directive was adopted in 2006 to foster competition in services across Europe. However, progress in liberalizing services has fallen short of expectations due to the article 15 of the Directive, which allows countries to maintain pre-existing restrictions if judged necessary to protect the public interest. Through input output analysis, this paper finds important multiplier effects of greater efficiency services to the rest of the economy. A renewed impulse to the liberalization process could be given by enhancing the advocacy role of national competition authorities in interpreting the notion of public interest underpinning existing regulations.
This Working Paper should not be reported as representing the views of the IMF. The views expressed in this Working Paper are those of the author(s) and do not necessarily represent those of the IMF or IMF policy. Working Papers describe research in progress by the author(s) and are published to elicit comments and to further debate.
JEL Classification Numbers: E32, E62, E61, H20, H5, H60, E1
Keywords: Services sectors, Services Directive, Input-output economics, Growth theory, Competition authorities
Author’s contact information: [email protected]; [email protected]

2
Contents
I. INTRODUCTION ............................................................................................................................. 3 II. THE ECONOMIC SIGNIFICANCE OF SERVICES ............................................................................ 4
A. Economic Significance and Structural Performance ..................................................... 4 B. Services as Inputs to Other Sectors ................................................................................. 6
III. SECTOR-SPECIFIC REGULATION AND THE ROLE OF THE SERVICES DIRECTIVE ..................... 8 IV. MULTIPLIER EFFECTS FROM INTERMEDIATE GOODS: A SINGLE GOOD ECONOMY............. 12 V. MULTIPLIER EFFECTS FROM MORE EFFICIENT SERVICES: A MULTI-SECTOR ECONOMY ... 15
A. Model Description ................................................................................................................ 15 B. Calibration ............................................................................................................................ 18 C. Results ................................................................................................................................... 18
VI. POLICY IMPLICATIONS ............................................................................................................ 20 VII. CONCLUSIONS ........................................................................................................................ 22 VIII. REFERENCES ........................................................................................................................ 23

3
“As a nation, we derive vast benefits from competition. These cannot be taken for granted.” Timothy J. Muris, chair of the US Federal Trade Commission 2001-04
I. INTRODUCTION1
Services are the driving force of the European economy. They account for over two-thirds of the EU GDP and create 9 out of 10 jobs in the economy. Although well-functioning services are key for growth, they are not yet delivering their full potential. Services represent only around one-fifth of total intra-EU trade and services productivity growth has been slow relative to manufacturing. This is partly due to the low intensity of competition, which remains inhibited by unjustified barriers. Free competition is the best guarantor of economic efficiency and consumer welfare. It delivers lower prices, encourages greater innovation, and generates faster responses by businesses to changing consumer needs. While governments enact regulations to pursue a wide range of interests, the arguments for exceptional treatment provide little basis for displacing competition to the favor of controls on pricing, entry, or other aspects of rivalry. A large literature documents how sector-specific regulation often has harmed consumers by imposing needless controls on free competition. Against this backdrop, the EU Services Directive was adopted in 2006 as a horizontal tool to foster competition in services across Europe. But, its implementation has so far proved challenging and half-hearted: challenging because the Directive’s scope is broad, covering as much as 65 percent of service activities (or 45 percent of EU GDP);2 and half-hearted because the Directive per se does not require countries to abolish restrictions to competition. Rather, it gives governments considerably leeway to maintain pre-existing restrictions if judged necessary to protect the public interest. With little involvement of independent third parties in the liberalization process, there currently remains a great deal of competition-restraining practices in place. Pro-competitive reforms of the type pursued under the EU Services Directive may impact the economy through both domestic and international channels, notably by improving productivity in the affected sectors, and by encouraging foreign direct investment and cross-border services provision. Previous studies are mostly of an empirical nature and/or
1 We thank Atalay Enghin, Edward Gardner, Charles I. Jones, and André Sapir for helpful comments and views. Niko A. Hobdari and Marialena Athanasopoulou provided the inputs featuring in Box 2 and Aleksander Rutkowski provided the data underlying Figure 3 in this paper. We are grateful to John MacCoy and Derek Mason for excellent research assistance. 2 The services outside the scope of the Directive are financial and insurance, network industries, transport, and health and government services. All of them with the exception of health and government services benefit from EU specific regulatory frameworks.
4
concentrate on the international transmission channels (for a review, see Monteagudo and others, 2012). This paper focuses on the domestic channel, thus the productivity gains from greater competition in services. Specifically, we use input-output growth economics à la Jones (Jones, 2011) to illustrate the multiplier effect of productivity-enhancing reforms in services to the rest of the economy. Given their important role as intermediate goods, more competition in services would spur efficiency gains throughout the economy. The paper focuses on gains from liberalization for France, a country where structural reforms have the potential to raise output significantly. Nonetheless, developments in the other three major euro area economies (Germany, Italy, and Spain) are discussed in various places for the sake of comparison and completeness. One possible way to give new impetus to the liberalization process would be to review the Directive by enhancing the mandate and advocacy role of national competition authorities. As independent third parties, competition authorities have a key role in interpreting the principles of non-discrimination, necessity, and proportionality underlying the notion of public interest at the source of existing regulations. The rest of the paper is structured as follows. Section II documents the economic significance of services with a focus on the four largest euro area economies. Section III discusses the role of the Directive in reviewing sector-specific regulation in services. Section IV describes the multiplier effects from greater productivity in intermediate goods by means of a single good, input-output economy. Section V uses a multi-sector model calibrated for France to simulate the scope for multiplier effects from higher efficiency in services. Section VI discusses policy implications. Section VII concludes.
II. THE ECONOMIC SIGNIFICANCE OF SERVICES
A. Economic Significance and Structural Performance
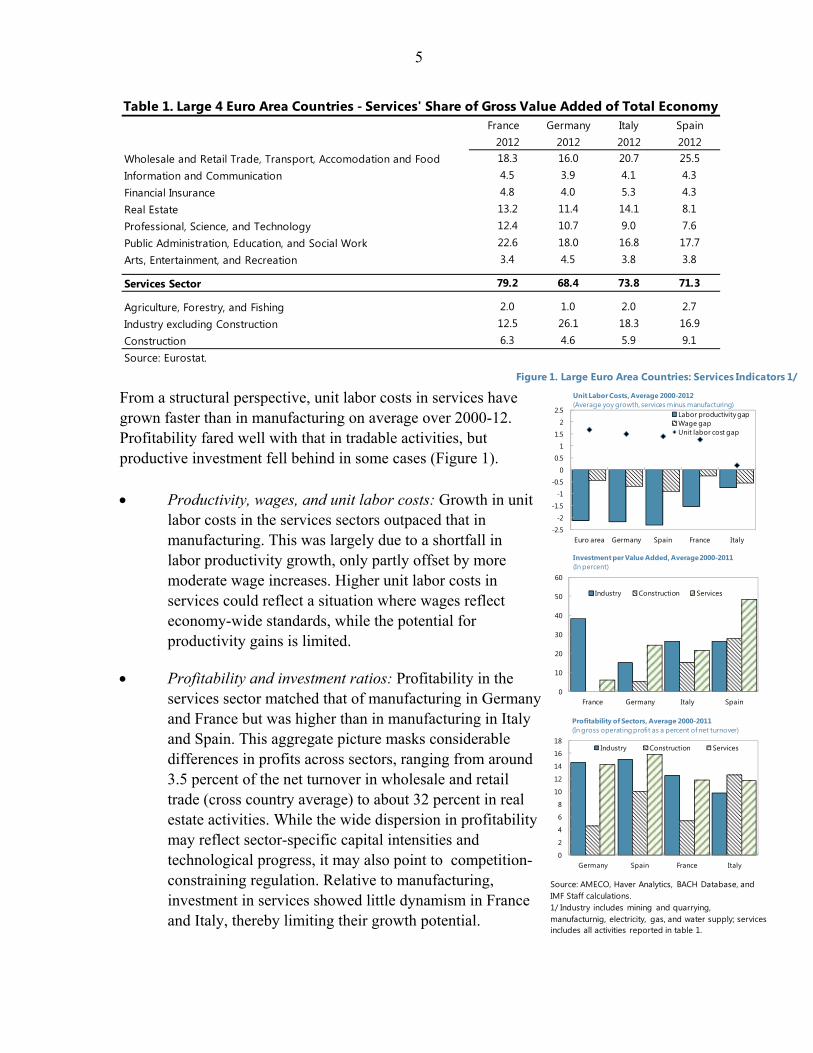
Services are the driving force of the largest euro area economies. In 2012, the share of services in value added ranged from around 68 percent in Germany to slightly higher than 79 percent in France. Within services, specialization is concentrated on trade and transport, public administration and social services, and real estate and business activities.
5
Figure 1. Large Euro Area Countries: Services Indicators 1/
Source: AMECO, Haver Analytics, BACH Database, and IMF Staff calculations.1/ Industry includes mining and quarrying, manufacturnig, electricity, gas, and water supply; services includes all activities reported in table 1.
-2.5
-2
-1.5
-1
-0.5
0
0.5
1
1.5
2
2.5
Euro area Germany Spain France Italy
Labor productivity gapWage gapUnit labor cost gap
Unit Labor Costs, Average 2000-2012(Average yoy growth, services minus manufacturing)
0
10
20
30
40
50
60
France Germany Italy Spain
Industry Construction Services
Investment per Value Added, Average 2000-2011(In percent)
0
2
4
6
8
10
12
14
16
18
Germany Spain France Italy
Industry Construction Services
Profitability of Sectors, Average 2000-2011(In gross operating profit as a percent of net turnover)
From a structural perspective, unit labor costs in services have grown faster than in manufacturing on average over 2000-12. Profitability fared well with that in tradable activities, but productive investment fell behind in some cases (Figure 1). Productivity, wages, and unit labor costs: Growth in unit
labor costs in the services sectors outpaced that in manufacturing. This was largely due to a shortfall in labor productivity growth, only partly offset by more moderate wage increases. Higher unit labor costs in services could reflect a situation where wages reflect economy-wide standards, while the potential for productivity gains is limited.
Profitability and investment ratios: Profitability in the services sector matched that of manufacturing in Germany and France but was higher than in manufacturing in Italy and Spain. This aggregate picture masks considerable differences in profits across sectors, ranging from around 3.5 percent of the net turnover in wholesale and retail trade (cross country average) to about 32 percent in real estate activities. While the wide dispersion in profitability may reflect sector-specific capital intensities and technological progress, it may also point to competition-constraining regulation. Relative to manufacturing, investment in services showed little dynamism in France and Italy, thereby limiting their growth potential.
2012 2012 2012 2012Wholesale and Retail Trade, Transport, Accomodation and Food 18.3 16.0 20.7 25.5Information and Communication 4.5 3.9 4.1 4.3Financial Insurance 4.8 4.0 5.3 4.3Real Estate 13.2 11.4 14.1 8.1Professional, Science, and Technology 12.4 10.7 9.0 7.6Public Administration, Education, and Social Work 22.6 18.0 16.8 17.7Arts, Entertainment, and Recreation 3.4 4.5 3.8 3.8
Services Sector 79.2 68.4 73.8 71.3
Agriculture, Forestry, and Fishing 2.0 1.0 2.0 2.7Industry excluding Construction 12.5 26.1 18.3 16.9Construction 6.3 4.6 5.9 9.1Source: Eurostat.
Table 1. Large 4 Euro Area Countries - Services' Share of Gross Value Added of Total EconomySpainItalyGermanyFrance
6
B. Services as Inputs to Other Sectors
Economic sectors differ in terms of their incidence on economic activity. Input-output analysis allows for a classification of sectors according to the type of linkages they create with other branches via intermediate consumption. Sectors inducing strong backward linkages tend to spur economic activity through higher demand for inputs from other sectors. By contrast, productivity improvements in branches whose production serves as inputs to other branches (forward linkages) play an important role in stimulating (internal and external) demand through their moderating impact on other sectors’ costs. Formally, let B be the input-output matrix of intermediate goods shares, and I the identity matrix. The so-called Leontief inverse is defined as:
≡ 1 The typical element lij of this matrix measures sector j’s intermediate consumption from sector i per unit of j output. This takes into account both the first round and indirect effects (or sector i’s requirements from all other sectors induced by a unit increase in sector j) at work in the economy. In this context, branch i-induced forward and backward linkages are respectively measured as
∑ 2 ∑ 3
where denotes i-induced forward linkages or output rises in sector i due to a unit increase in final demand of all other sectors, and denotes j-induced backward linkages or output
rises in all sectors due to a unit increase in j’s final demand.
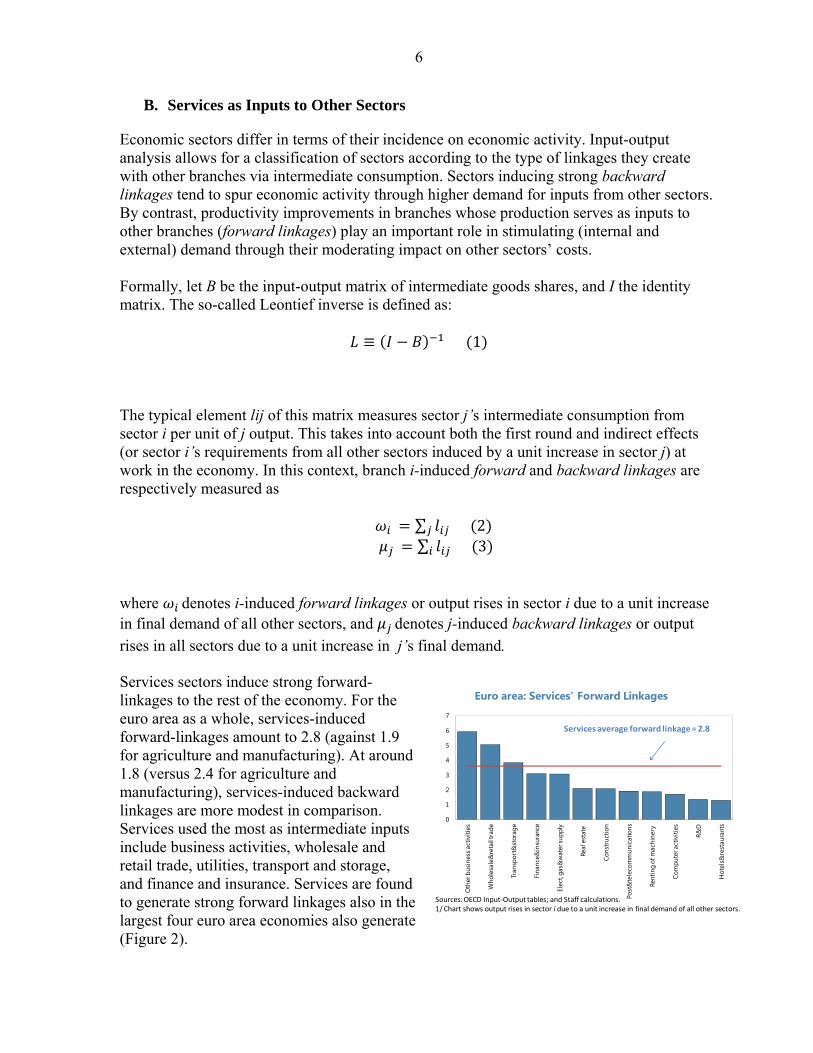
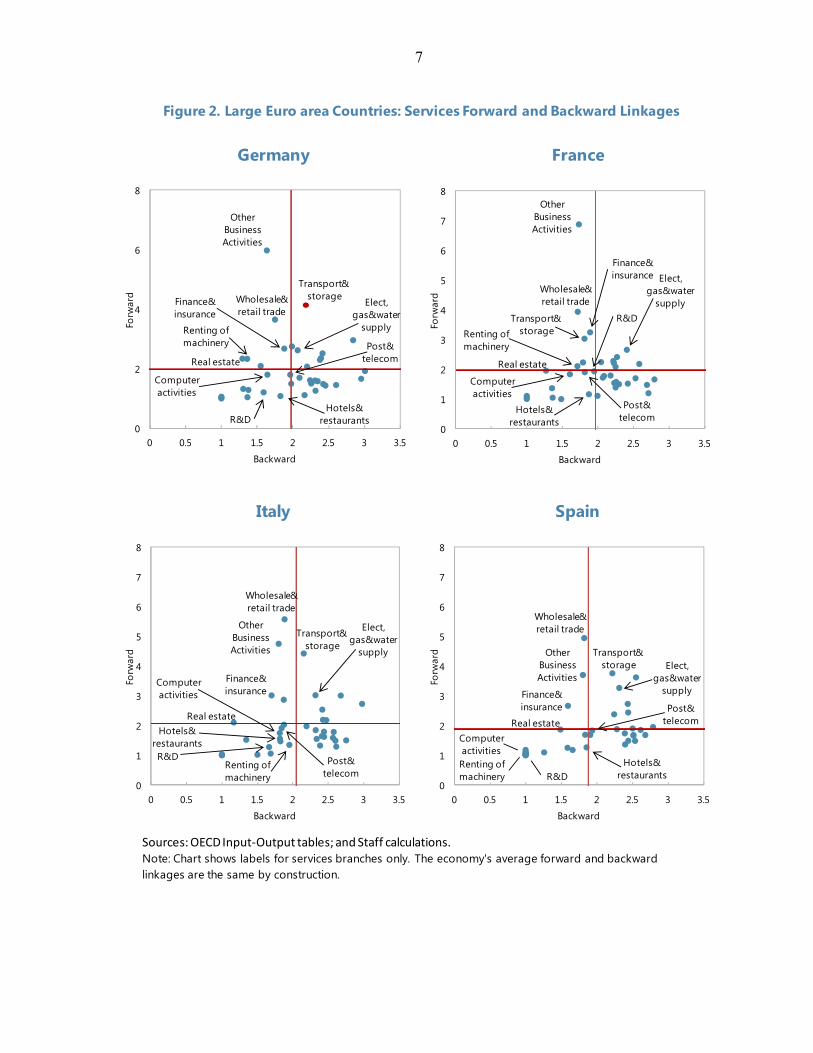
Services sectors induce strong forward-linkages to the rest of the economy. For the euro area as a whole, services-induced forward-linkages amount to 2.8 (against 1.9 for agriculture and manufacturing). At around 1.8 (versus 2.4 for agriculture and manufacturing), services-induced backward linkages are more modest in comparison. Services used the most as intermediate inputs include business activities, wholesale and retail trade, utilities, transport and storage, and finance and insurance. Services are found to generate strong forward linkages also in the largest four euro area economies also generate (Figure 2).
0
1
2
3
4
5
6
7
Oth
er b
usin
ess a
ctiv
ities
Who
lesa
le&
reta
il tra
de
Tran
spor
t&st
orag
e
Fina
nce&
insu
ranc
e
Elec
t, ga
s&w
ater
supp
ly
Real
est
ate
Cons
truc
tion
Post
&te
leco
mm
unic
atio
ns
Rent
ing
of m
achi
nery
Com
pute
r act
iviti
es
R&D
Hot
els&
rest
aura
nts
Euro area: Services' Forward Linkages
Sources: OECD Input‐Output tables; and Staff calculations.1/ Chart shows output rises in sector i due to a unit increase in final demand of all other sectors.
Services average forward linkage = 2.8
7
Figure 2. Large Euro area Countries: Services Forward and Backward Linkages
Sources: OECD Input‐Output tables; and Staff calculations.Note: Chart shows labels for services branches only. The economy's average forward and backward linkages are the same by construction.
Elect, gas&water
supply
Wholesale&retail trade
Hotels& restaurants
Transport&storage
Post& telecom
Finance& insurance
Real estate
Renting of machinery
Computer activities
R&D
Other Business Activities
0
2
4
6
8
0 0.5 1 1.5 2 2.5 3 3.5
Forw
ard
Backward
Germany
Elect, gas&water
supplyWholesale&retail trade
Hotels& restaurants
Transport&storage
Post& telecom
Finance& insurance
Real estate
Renting of machinery
Computer activities
R&D
Other Business Activities
0
1
2
3
4
5
6
7
8
0 0.5 1 1.5 2 2.5 3 3.5Fo
rwar
d
Backward
France
Elect, gas&water
supply
Wholesale&retail trade
Hotels& restaurants
Transport&storage
Post& telecom
Finance& insurance
Real estate
Renting of machinery
Computer activities
R&D
Other Business Activities
0
1
2
3
4
5
6
7
8
0 0.5 1 1.5 2 2.5 3 3.5
Forw
ard
Backward
Italy
Elect, gas&water
supply
Wholesale&retail trade
Hotels& restaurants
Transport&storage
Post& telecom
Finance& insurance
Real estate
Renting of machinery
Computer activities
R&D
Other Business Activities
0
1
2
3
4
5
6
7
8
0 0.5 1 1.5 2 2.5 3 3.5
Forw
ard
Backward
Spain

8
III. SECTOR-SPECIFIC REGULATION AND THE ROLE OF THE SERVICES DIRECTIVE
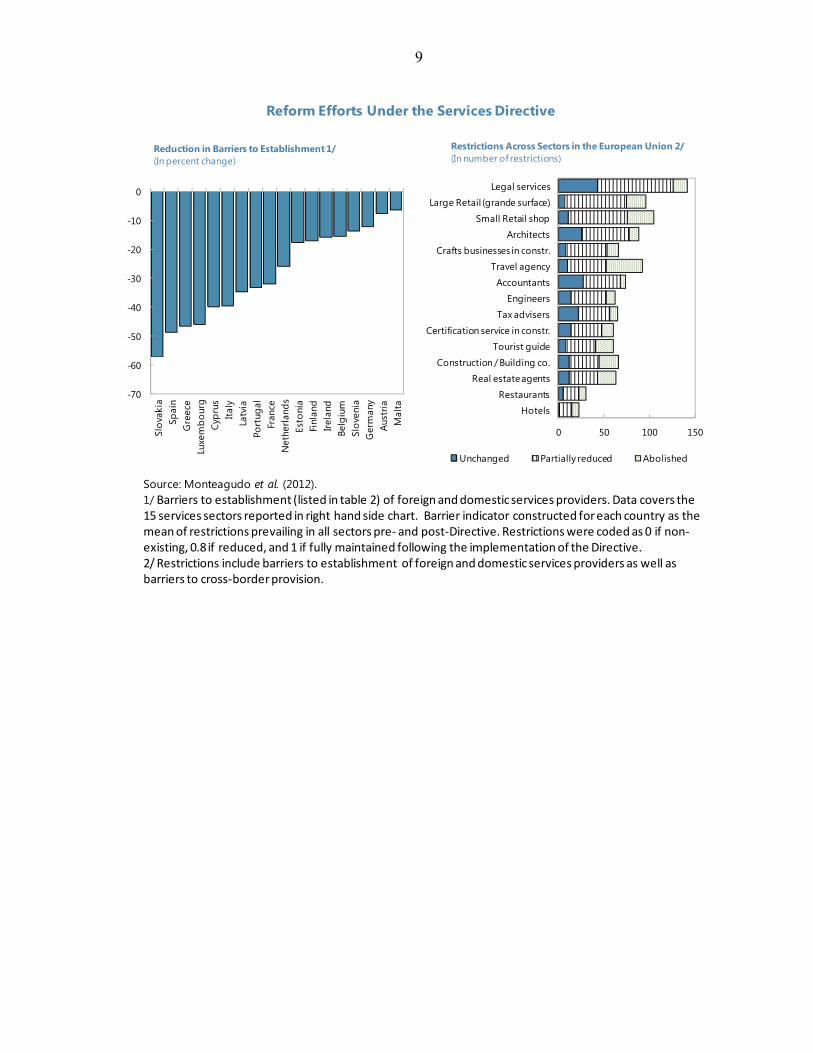
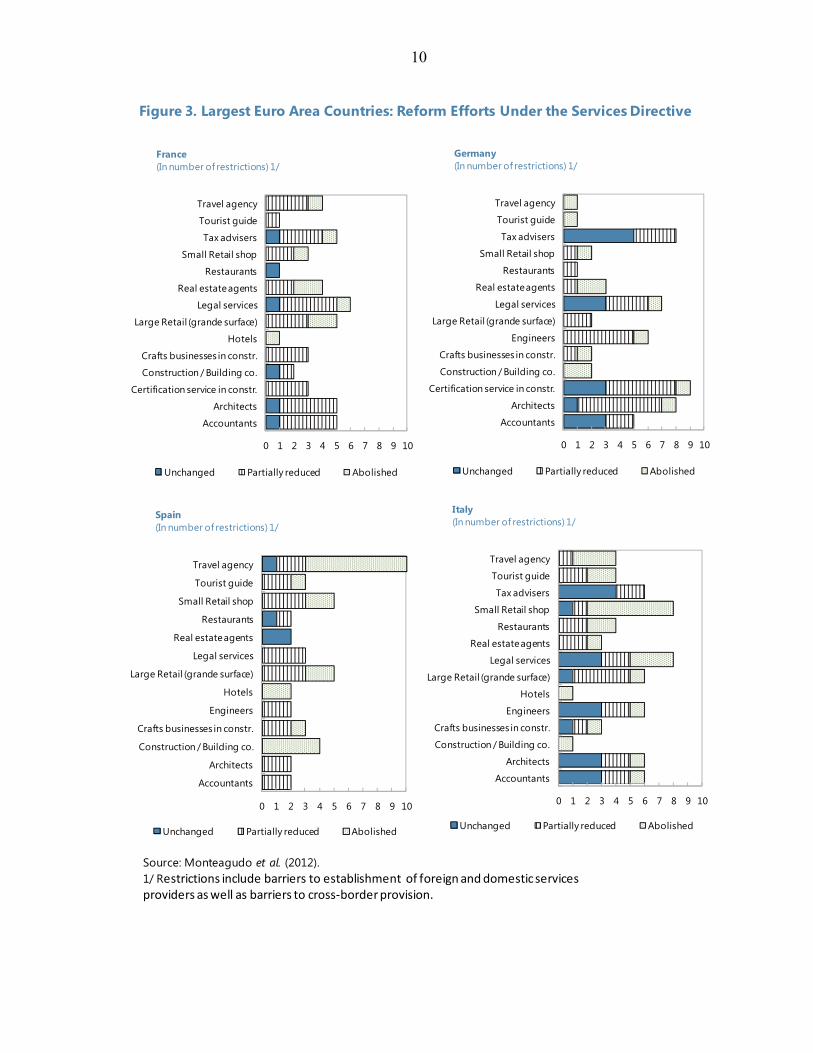
Regulations are often advocated to address market failures, including monopolistic behavior, inadequate provision of public goods, asymmetric information, or negative externalities. However, in addressing these perceived failures, regulations may actually restrict competition, particularly in the services sectors. Around 800 different activities are regarded as regulated professions in one or more EU countries, thus reserved for providers with specific qualifications. Regulations hit SMEs (95 percent of all services providers in the EU) particularly hard. Against this backdrop, the Services Directive was adopted in 2006 as a horizontal tool to remove unjustified regulatory barriers in services sectors (Table 2). The implementation period spanned 2006—09 and required countries to review the regulatory framework for services. Much focus was placed on retail trade, tax advisers, legal services, accountants, architects, tourist guides, restaurants, real estate agents, engineers, certification for construction activities, crafts in construction, construction companies, and hotels. A peer review exercise was set out to engage countries, encourage transparency, and promote good regulatory practices (Box 1). The amount of notifications differed significantly across euro area countries. EU countries as a whole notified close to 35,000 regulatory restrictions to competition. Among euro area countries, Germany, the Netherlands, Spain, and Austria were found to have the most restrictions, while Cyprus, Malta, Luxembourg and Finland documented relatively few. Besides regulatory preferences, competitive-restraining practices reflected the political fabric of the country (higher in federal countries with various layers of government) as well as legislative techniques (higher where sector-specific regulations prevailed over umbrella laws). Countries generally acknowledged considerable fragmentation of the Single Market due to cumbersome regulation. The actual reduction in regulatory barriers widely varied across countries, ranging from below 10 percent in Austria and Malta to more than 50 percent in Spain and Slovakia. This largely reflected different starting positions. By sectors, restrictions were removed the most in tourism activities, hotels and restaurants, construction and real estate agents.
9
Reform Efforts Under the Services Directive
Source: Monteagudo et al. (2012).1/ Barriers to establishment (listed in table 2) of foreign and domestic services providers. Data covers the 15 services sectors reported in right hand side chart. Barrier indicator constructed for each country as the mean of restrictions prevailing in all sectors pre‐ and post‐Directive. Restrictions were coded as 0 if non‐existing, 0.8 if reduced, and 1 if fully maintained following the implementation of the Directive.2/ Restrictions include barriers to establishment of foreign and domestic services providers as well as barriers to cross‐border provision.
-70
-60
-50
-40
-30
-20
-10
0
Slov
akia
Spai
nG
reec
eLu
xem
bour
gCy
prus
Italy
Latv
iaPo
rtug
alFr
ance
Net
herla
nds
Esto
nia
Finl
and
Irela
ndBe
lgiu
mSl
oven
iaG
erm
any
Aust
riaM
alta
Reduction in Barriers to Establishment 1/ (In percent change)
0 50 100 150
Hotels
Restaurants
Real estate agents
Construction / Building co.
Tourist guide
Certification service in constr.
Tax advisers
Engineers
Accountants
Travel agency
Crafts businesses in constr.
Architects
Small Retail shop
Large Retail (grande surface)
Legal services
Unchanged Partially reduced Abolished
Restrictions Across Sectors in the European Union 2/ (In number of restrictions)
10
Figure 3. Largest Euro Area Countries: Reform Efforts Under the Services Directive
Source: Monteagudo et al. (2012).1/ Restrictions include barriers to establishment of foreign and domestic services providers as well as barriers to cross‐border provision.
0 1 2 3 4 5 6 7 8 9 10
Accountants
Architects
Certification service in constr.
Construction / Building co.
Crafts businesses in constr.
Engineers
Large Retail (grande surface)
Legal services
Real estate agents
Restaurants
Small Retail shop
Tax advisers
Tourist guide
Travel agency
Unchanged Partially reduced Abolished
Germany(In number of restrictions) 1/
0 1 2 3 4 5 6 7 8 9 10
Accountants
Architects
Construction / Building co.
Crafts businesses in constr.
Engineers
Hotels
Large Retail (grande surface)
Legal services
Real estate agents
Restaurants
Small Retail shop
Tourist guide
Travel agency
Unchanged Partially reduced Abolished
Spain(In number of restrictions) 1/
0 1 2 3 4 5 6 7 8 9 10
Accountants
Architects
Certification service in constr.
Construction / Building co.
Crafts businesses in constr.
Hotels
Large Retail (grande surface)
Legal services
Real estate agents
Restaurants
Small Retail shop
Tax advisers
Tourist guide
Travel agency
Unchanged Partially reduced Abolished
France(In number of restrictions) 1/
0 1 2 3 4 5 6 7 8 9 10
Accountants
Architects
Construction / Building co.
Crafts businesses in constr.
Engineers
Hotels
Large Retail (grande surface)
Legal services
Real estate agents
Restaurants
Small Retail shop
Tax advisers
Tourist guide
Travel agency
Unchanged Partially reduced Abolished
Italy(In number of restrictions) 1/
11
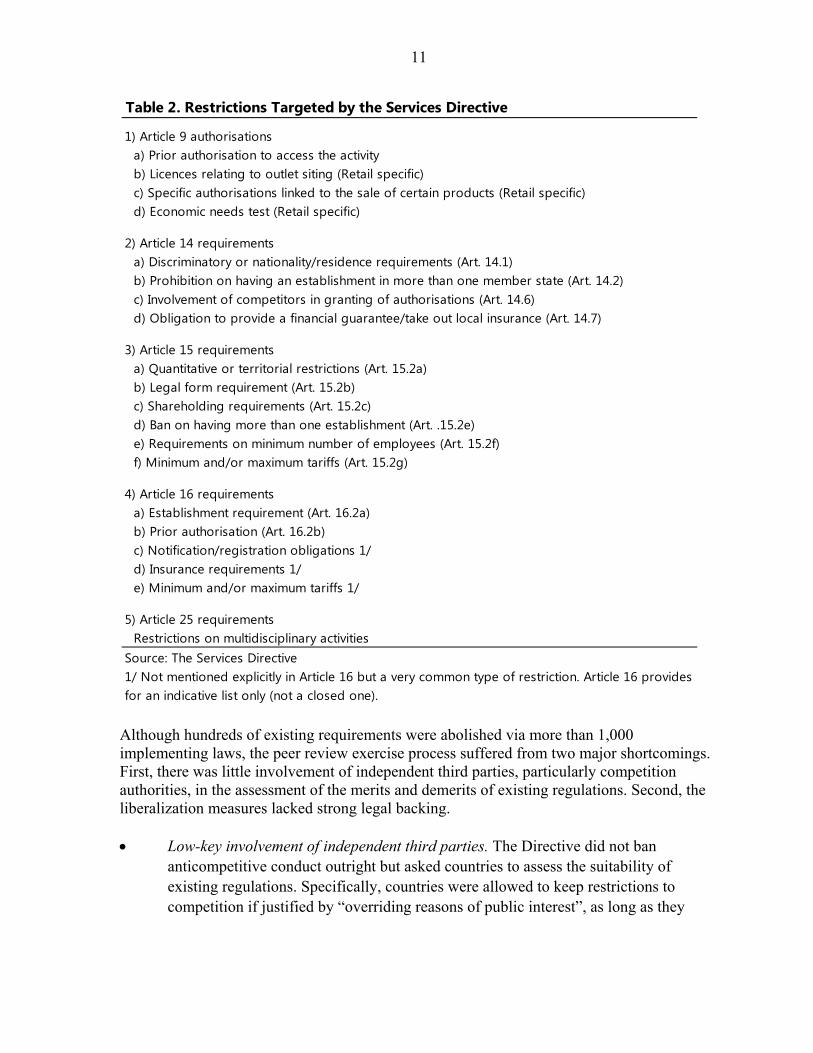
Although hundreds of existing requirements were abolished via more than 1,000 implementing laws, the peer review exercise process suffered from two major shortcomings. First, there was little involvement of independent third parties, particularly competition authorities, in the assessment of the merits and demerits of existing regulations. Second, the liberalization measures lacked strong legal backing. Low-key involvement of independent third parties. The Directive did not ban
anticompetitive conduct outright but asked countries to assess the suitability of existing regulations. Specifically, countries were allowed to keep restrictions to competition if justified by “overriding reasons of public interest”, as long as they
Table 2. Restrictions Targeted by the Services Directive
1) Article 9 authorisationsa) Prior authorisation to access the activity b) Licences relating to outlet siting (Retail specific)c) Specific authorisations linked to the sale of certain products (Retail specific)d) Economic needs test (Retail specific)
2) Article 14 requirementsa) Discriminatory or nationality/residence requirements (Art. 14.1) b) Prohibition on having an establishment in more than one member state (Art. 14.2) c) Involvement of competitors in granting of authorisations (Art. 14.6) d) Obligation to provide a financial guarantee/take out local insurance (Art. 14.7)
3) Article 15 requirementsa) Quantitative or territorial restrictions (Art. 15.2a) b) Legal form requirement (Art. 15.2b) c) Shareholding requirements (Art. 15.2c) d) Ban on having more than one establishment (Art. .15.2e) e) Requirements on minimum number of employees (Art. 15.2f) f) Minimum and/or maximum tariffs (Art. 15.2g)
4) Article 16 requirementsa) Establishment requirement (Art. 16.2a)b) Prior authorisation (Art. 16.2b) c) Notification/registration obligations 1/d) Insurance requirements 1/e) Minimum and/or maximum tariffs 1/
5) Article 25 requirementsRestrictions on multidisciplinary activities
Source: The Services Directive1/ Not mentioned explicitly in Article 16 but a very common type of restriction. Article 16 provides for an indicative list only (not a closed one).

12
were non-discriminatory, necessary, proportional (Art. 15).3 In practice, the interpretation of these principles has given national administrations considerable latitude in strictly to implement the Directive. Meanwhile, national competition authorities, ignored by the legal provisions of the Directive, played only marginal role in the liberalization process.
The limitations of umbrella laws. To transpose the Directive, countries often relied on umbrella laws, which proved nevertheless weak liberalization tools given the principle lex specialis derogat legi generalis. This doctrine (prevalent in many European countries heirs of the Roman law tradition) holds that, where two laws rule the same matter, the law whose scope is more specific (lex specialis) overrides the law whose scope is more general (lex generalis). As such, omnibus laws need to be coupled with a significant number of sector-specific amendments to ensure full compliance of national law with the Directive. Thus the full potential of the Directive can only be realized through cumbersome, sector-specific legislative changes.
Box 1. The Mutual Evaluation Exercise under the Services Directive
The implementation of the Services Directive spanned over 2006-09. During this period, governments were tasked with identifying the restrictions prevailing in their legislation and assessing their merits and demerits. Countries were required to only keep those restrictions for which total benefits exceed total costs, and abolish/amend the remaining ones as needed. To this end, countries would work in clusters of 5 members each and held plenary meetings with all other countries. The composition of clusters reflected languages, proximity, and trade. The five clusters were as follows: Austria, the Czech Republic, Hungary, Slovakia and Slovenia; Belgium, France, Liechtenstein, Luxembourg, and the Netherlands; Bulgaria, Italy, Malta, Portugal, and Spain; Cyprus, Greece, Ireland, Romania, and the UK; Denmark, Germany, Iceland, Norway and Poland; and Estonia, Finland, Latvia, Lithuania, and Sweden.
IV. MULTIPLIER EFFECTS FROM INTERMEDIATE GOODS: A SINGLE GOOD ECONOMY
A reduction in regulatory barriers in services can be expected to generate productivity gains in those sectors, which will be transmitted and amplified to the rest of the economy given services’ strong forward linkages. To illustrate this point, we think of services as intermediate goods and cast the multiplier role of such goods into input output economics. Standard neoclassical growth theory typically ignores the fact that goods can be used for intermediate consumption alongside final demand purposes. This has the implication that the
3 “Non-discrimination” means that regulations cannot discriminate according to nationality; “necessity” means that regulations must be justified by the public interest; and “ proportionality” means that regulations must not go beyond what is strictly needed to preserve welfare .
13
model generates a small multiplier to changes in productivity4. In contrast, when the neoclassical Cobb-Douglas production function is augmented with intermediate goods, the model presents a productivity amplification dimension (Jones, 2011). To see this, suppose that gross output Qt is produced using capital Kt, labor Lt, and intermediate goods Xt:
5 Gross output can be used for final demand purposes or carried over to the next period at a constant fraction and used as an intermediate good:
6 such that GDP is gross output net of spending on intermediate goods:
≡ 1 7
The steady state GDP level is given by
8 where
≡ ̅ 1 ̅ 9 Assuming as in the Solow model that a constant fraction of GDP is invested:
1 1 ̅ 1 (10)
The steady state level of GDP per worker ≡ ⁄ (apparent labor productivity) is
∗ ≡ ̅ 1 ̅ ̅ 11
A key implication of (11) is that productivity gains get multiplied by a larger amount than in the neoclassical growth model. In the standard neoclassical model with no intermediate goods (σ = 0), a one-percent increase in productivity increases output by more than one percent because it raises output, which leads to more capital, which leads to more output, and
so on, the overall multiplier being 1 . In the intermediate-goods-augmented
4 Two related implications are that the neoclassical model needs a broad definition of capital to account for the observed differences in income per capita across countries and that the convergence to the steady state is rapid (See Jones, 2011, for a comparison of the pure and intermediate-goods-augmented neoclassical models along these two dimensions).
14
neoclassical model (σ ≠ 0), higher output also leads to more intermediate goods, which raises
output (and capital), and so on, the overall multiplier being .
The addition of intermediate goods can have large effects. Assuming conventional values (for advanced economies) the labor share of value added and the intermediate goods share of gross output, 1 3⁄ and 1 2⁄ , the multiplier in the standard neoclassical model is
3 2⁄ , thus a doubling of ̅raises output by a factor of 2 ⁄ 2.8. The multiplier in
the neoclassical model augmented with intermediate goods is ∗ 2 3, thus a
doubling of ̅ raises output by a factor of 2 8. Although the multiplier derived so far applies to a single sector economy, Jones (2011b) shows that it is typically a very good approximation to the true input-output multiplier. In an N-sector economy with each sector using capital, labor, domestic and intermediate goods to produce gross output, the TFP multipliers can be shown to be:
1 12
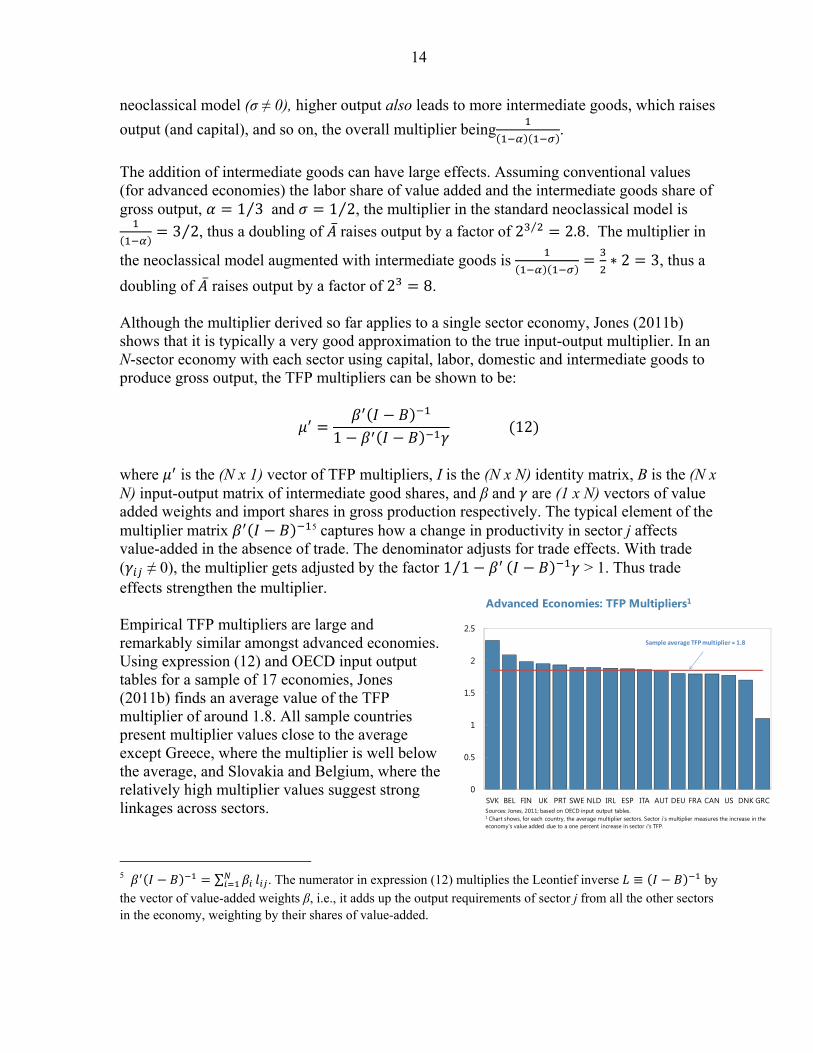
where is the (N x 1) vector of TFP multipliers, I is the (N x N) identity matrix, B is the (N x N) input-output matrix of intermediate good shares, and β and are (1 x N) vectors of value added weights and import shares in gross production respectively. The typical element of the multiplier matrix 5 captures how a change in productivity in sector j affects value-added in the absence of trade. The denominator adjusts for trade effects. With trade ( ≠ 0), the multiplier gets adjusted by the factor 1 1⁄ > 1. Thus trade effects strengthen the multiplier. Empirical TFP multipliers are large and remarkably similar amongst advanced economies. Using expression (12) and OECD input output tables for a sample of 17 economies, Jones (2011b) finds an average value of the TFP multiplier of around 1.8. All sample countries present multiplier values close to the average except Greece, where the multiplier is well below the average, and Slovakia and Belgium, where the relatively high multiplier values suggest strong linkages across sectors.
5 ∑ . The numerator in expression (12) multiplies the Leontief inverse ≡ by the vector of value-added weights β, i.e., it adds up the output requirements of sector j from all the other sectors in the economy, weighting by their shares of value-added.
0
0.5
1
1.5
2
2.5
SVK BEL FIN UK PRT SWE NLD IRL ESP ITA AUT DEU FRA CAN US DNK GRC
Advanced Economies: TFP Multipliers1
Sources: Jones, 2011; based on OECD input output tables.1 Chart shows, for each country, the average multiplier sectors. Sector i's multiplier measures the increase in the economy's value added due to a one percent increase in sector i's TFP.
Sample average TFP multiplier = 1.8
15
V. MULTIPLIER EFFECTS FROM MORE EFFICIENT SERVICES:
A MULTI-SECTOR ECONOMY
This section conducts simulations to show the scope for output gains from higher efficiency in services. After describing the model at the heart of simulations, we detail its calibration and quantify the multiplier effects from greater productivity in services. Unlike Jones’ stylized model, the simulation tool put forward here portrays a multi-sector economy. This and other differences discussed below explain why our model produces slightly different multipliers than reported by Jones (2011).
A. Model Description
The model used in this paper is a multi-sector version of the Long and Plosser (1983) model. The use of a multi-sector real business cycle (RBC) model is motivated by the need to consider the effects of sector-specific productivity shocks on output and employment and to investigate the role that sector linkages6 play in propagating those shocks. Multi-sector RBC models have been the subject of recent interest in the academic literature with a number of authors (e.g. Horvath (2000), Kim and Kim (2006), Foerster et al. (2011), Gabaix (2011), Jones (2011a, 20011b), Atalay (2014)) demonstrating that sector-specific shocks can be an integral part of business cycle fluctuations, contradicting earlier wisdom (e.g. Lucas, 1981) that this type of disturbances tend to wash away when aggregated as, by the law of large numbers, positive variations in some sectors tend to be offset by negative variations elsewhere.7 The reason behind this result is that linkages have amplification effects on output: productivity improvements (distortions) in, e.g., the transportation and storage sector will likely lead to productivity improvements in sectors that use that input (e.g. wholesale and distribution), which in turn will have an impact on other sectors in the economy that use those inputs. Such amplification effects relate to the well known Leontief inverse (see equation (1) above), which in itself is dependent on the share of intermediate inputs used in the production of output and the degree of substitutability/connectivity of inputs in production. Specifically, the multiplier effect increases with the share of intermediate inputs in production (this relates to the capital accumulation multiplier)8 but decreases in the substitutability of inputs (the
6 In the sense that each industry can employ the material and capital goods produced by other sectors. 7 Bouakez et al. (2011), Jones (2011a, 20011b), and Gopinath and Neiman (2013) show that, relative to one-sector models, the propagation mechanism of aggregate shocks (monetary policy, productivity, and exchange rates) is greater in models with sector linkages. 8 This point is eloquently made in Jones (2011) and Gabaix (2011), but was originally made by Hulten (1978) and relates to the capital accumulation multiplier.

16
more difficult it is to substitute from intermediate inputs, the larger the effects that sector specific shocks will have on output).9 Just as a chain is only as strong as its weakest link, problems in specific sectors along a production chain can sharply reduce output under complementarity. Turning to the model, it is assumed that the economy comprises N=8 different sectors with production being indexed by j=1,…,N. Each sector produces Qj goods using sector-specific capital Kj, sector-specific labor Lj, and a composite of materials from the other sectors Xj (which is the source of sector linkages in the model). The technology available to each sector is assumed to be Cobb-Douglas
(13)
where Aj=Aj is a productivity index for sector j, comprising of an aggregate-wide shock (A) and a sector-specific shock (j). These indices are modeled as autoregressive processes with a high degree of persistence. Each composite “material” good is given by the following functional form
∏ (14)
The presence of the material components is at the heart of the interconnectedness in the model and key for amplifying the effects of technology shocks. More specifically, the key parameters that generate the amplification effect in the model are (the share of material
inputs in production) and which determines the strength of linkages/connectivity in the
economy. As shown in equation (11) above, the larger the share of intermediates in production ( inequation 13 ) the larger the amplification effect stemming from sectoral
shocks. But sectoral shares, , also matter as these determine the strength of the
interconnectedness/feedback effects, as is clear from the Leontief inverse, equation (1) above. The model is completed by specifying household preferences and the relevant economy constraints. To keep the model as simple as possible, household preferences take the following type
9 This point was made by Horvath (2000) and, more recently, by Atalay (2014) who shows that substitutability across inputs is crucial for the importance of sector specific-shocks.

17
∑ ∑ (15)
where preferences take the form of Hansen’s (1985) indivisible labor model10 and hence where Lj denotes employment in each sector j. The parameter j is calibrated to match the employment share in sector j in the model economy. Finally, the resource constraint for each sector is given by
∑ ∑ (16)
where Iji are investment goods that are combined to form the capital stock as follows:
1 ∏ , ∑ 1 (17)
An important consideration for computing the multipliers associated with sector-specific and aggregate productivity shocks relates to the definition of aggregate gross valued output. The definition proceeds as follows. First we define gross value added in each of the 8 sectors as
(18) Next we aggregate across sectors. In Jones (2011) aggregation is done simply by a simple weighting scheme (a Cobb-Douglas type production function of each sector’s value added). To aggregate value added we consider the following formula:
∆ ln ∑ ∆ ln (19)
where ≡ ⁄ is sector j’s share of nominal value added (from the Input Output table). In order to compute the effect of a shock on the level of gross value added, the effects of the shock are cumulated. In the case of employment we assume the following aggregation scheme:
∑ (20)
10 As shown by Kim and Kim (2006), these preferences help multi-sector models produce employment co-movement across sectors, a stylized fact of business cycle fluctuations. They also generate sizable intertemporal substitution effects, making labor more responsive to shocks.
18
B. Calibration
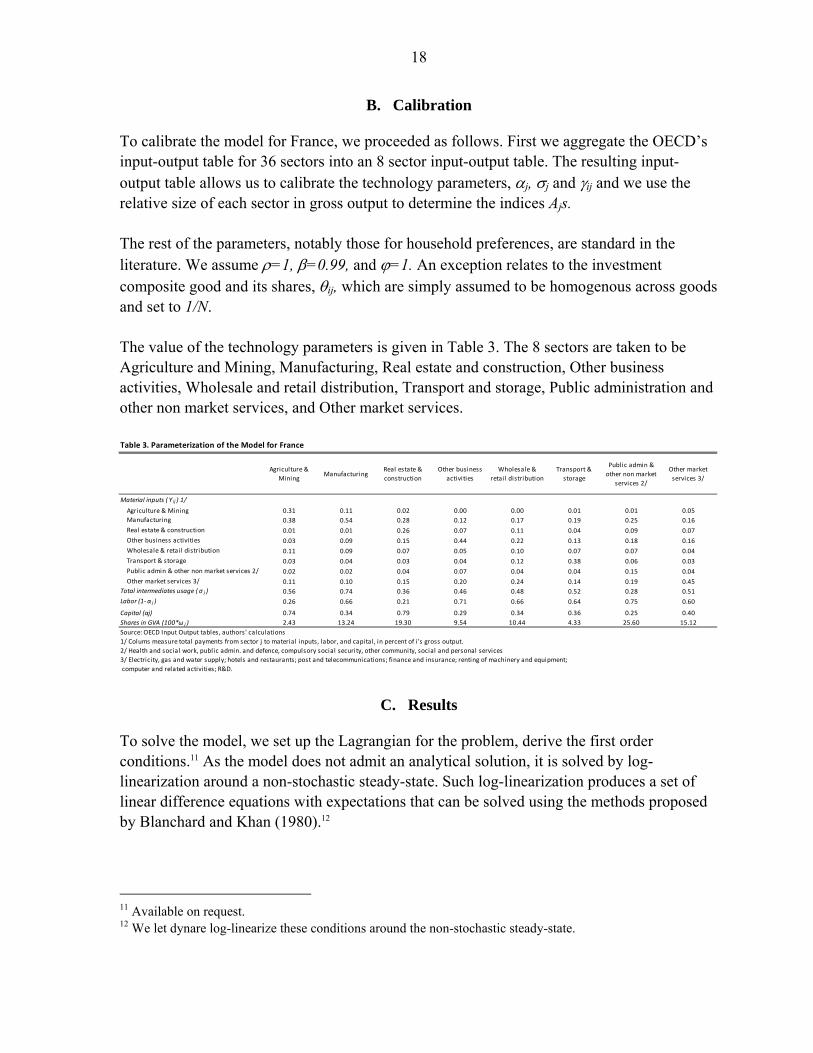
To calibrate the model for France, we proceeded as follows. First we aggregate the OECD’s input-output table for 36 sectors into an 8 sector input-output table. The resulting input-output table allows us to calibrate the technology parameters, j, j and ij and we use the relative size of each sector in gross output to determine the indices Ajs. The rest of the parameters, notably those for household preferences, are standard in the literature. We assume =1, =0.99, and =1. An exception relates to the investment composite good and its shares, ij, which are simply assumed to be homogenous across goods and set to 1/N. The value of the technology parameters is given in Table 3. The 8 sectors are taken to be Agriculture and Mining, Manufacturing, Real estate and construction, Other business activities, Wholesale and retail distribution, Transport and storage, Public administration and other non market services, and Other market services.
C. Results
To solve the model, we set up the Lagrangian for the problem, derive the first order conditions.11 As the model does not admit an analytical solution, it is solved by log-linearization around a non-stochastic steady-state. Such log-linearization produces a set of linear difference equations with expectations that can be solved using the methods proposed by Blanchard and Khan (1980).12
11 Available on request. 12 We let dynare log-linearize these conditions around the non-stochastic steady-state.
Table 3. Parameterization of the Model for France
Agriculture &
MiningManufacturing
Real estate &
construction
Other business
activities
Wholesale &
retail distribution
Transport &
storage
Public admin &
other non market
services 2/
Other market
services 3/
Material inputs ( Ƴ ij ) 1/
Agriculture & Mining 0.31 0.11 0.02 0.00 0.00 0.01 0.01 0.05
Manufacturing 0.38 0.54 0.28 0.12 0.17 0.19 0.25 0.16
Real estate & construction 0.01 0.01 0.26 0.07 0.11 0.04 0.09 0.07
Other business activities 0.03 0.09 0.15 0.44 0.22 0.13 0.18 0.16
Wholesale & retail distribution 0.11 0.09 0.07 0.05 0.10 0.07 0.07 0.04
Transport & storage 0.03 0.04 0.03 0.04 0.12 0.38 0.06 0.03
Public admin & other non market services 2/ 0.02 0.02 0.04 0.07 0.04 0.04 0.15 0.04
Other market services 3/ 0.11 0.10 0.15 0.20 0.24 0.14 0.19 0.45
Total intermediates usage ( σ j ) 0.56 0.74 0.36 0.46 0.48 0.52 0.28 0.51
Labor (1‐ α j ) 0.26 0.66 0.21 0.71 0.66 0.64 0.75 0.60
Capital (αj) 0.74 0.34 0.79 0.29 0.34 0.36 0.25 0.40
Shares in GVA (100*ω j ) 2.43 13.24 19.30 9.54 10.44 4.33 25.60 15.12
Source: OECD Input Output tables, authors' calculations
1/ Colums measure total payments from sector j to material inputs, labor, and capital, in percent of i 's gross output.
2/ Health and social work, public admin. and defence, compulsory social security, other community, social and personal services
3/ Electricity, gas and water supply; hotels and restaurants; post and telecommunications; finance and insurance; renting of machinery and equipment;
computer and related activities; R&D.
19
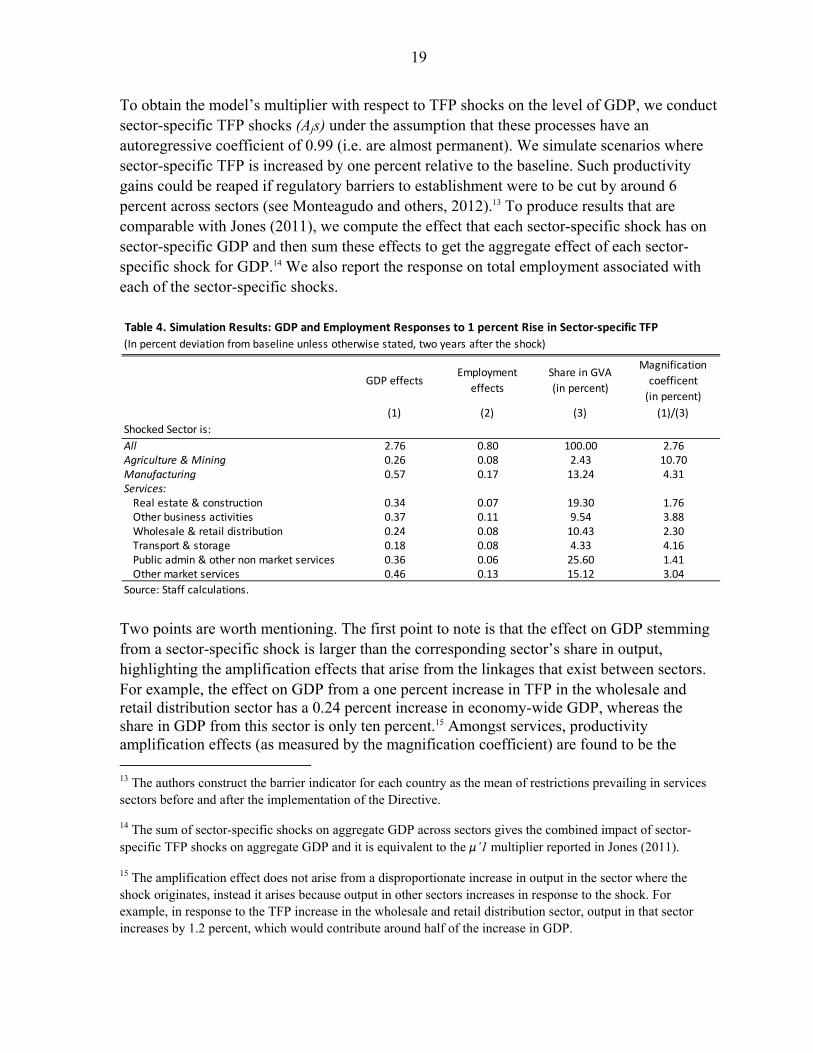
To obtain the model’s multiplier with respect to TFP shocks on the level of GDP, we conduct sector-specific TFP shocks (Ajs) under the assumption that these processes have an autoregressive coefficient of 0.99 (i.e. are almost permanent). We simulate scenarios where sector-specific TFP is increased by one percent relative to the baseline. Such productivity gains could be reaped if regulatory barriers to establishment were to be cut by around 6 percent across sectors (see Monteagudo and others, 2012).13 To produce results that are comparable with Jones (2011), we compute the effect that each sector-specific shock has on sector-specific GDP and then sum these effects to get the aggregate effect of each sector-specific shock for GDP.14 We also report the response on total employment associated with each of the sector-specific shocks.
Two points are worth mentioning. The first point to note is that the effect on GDP stemming from a sector-specific shock is larger than the corresponding sector’s share in output, highlighting the amplification effects that arise from the linkages that exist between sectors. For example, the effect on GDP from a one percent increase in TFP in the wholesale and retail distribution sector has a 0.24 percent increase in economy-wide GDP, whereas the share in GDP from this sector is only ten percent.15 Amongst services, productivity amplification effects (as measured by the magnification coefficient) are found to be the 13 The authors construct the barrier indicator for each country as the mean of restrictions prevailing in services sectors before and after the implementation of the Directive.
14 The sum of sector-specific shocks on aggregate GDP across sectors gives the combined impact of sector-specific TFP shocks on aggregate GDP and it is equivalent to the μ’1 multiplier reported in Jones (2011).
15 The amplification effect does not arise from a disproportionate increase in output in the sector where the shock originates, instead it arises because output in other sectors increases in response to the shock. For example, in response to the TFP increase in the wholesale and retail distribution sector, output in that sector increases by 1.2 percent, which would contribute around half of the increase in GDP.
Table 4. Simulation Results: GDP and Employment Responses to 1 percent Rise in Sector‐specific TFP
(In percent deviation from baseline unless otherwise stated, two years after the shock)
GDP effects Employment
effects
Share in GVA
(in percent)
Magnification
coefficent
(in percent)
(1) (2) (3) (1)/(3)
Shocked Sector is:
All 2.76 0.80 100.00 2.76Agriculture & Mining 0.26 0.08 2.43 10.70Manufacturing 0.57 0.17 13.24 4.31Services:Real estate & construction 0.34 0.07 19.30 1.76Other business activities 0.37 0.11 9.54 3.88Wholesale & retail distribution 0.24 0.08 10.43 2.30Transport & storage 0.18 0.08 4.33 4.16Public admin & other non market services 0.36 0.06 25.60 1.41Other market services 0.46 0.13 15.12 3.04
Source: Staff calculations.
20
greatest in other business activities, other market services, and transport and storage. This means that reforms that address distortions in these sectors may have relatively large effects. The main idea is that if transportation services as an essential input into production, distortions in this sector would be costly to other sectors and reduce output throughout the economy. The second observation is that the multiplier on GDP associated with all of the sector-specific shocks is sizeable (2.76). It is also greater than that reported in Jones’ paper. The reason for this larger response relates to the positive effects that sector-specific TFP shocks have on capital and labor. While in Jones’ model capital and labor are exogenous and constant, both factors increase in our model as their supply responds positively to the increase in their marginal product induced by the TFP shock.
VI. POLICY IMPLICATIONS
To spur competition and efficiency in services the implementation of the Directive could be revisited.16 To this aim, an amended Directive could possibly task independent third parties, such as competition authorities, with assessing the merits and demerits of existing regulations. Further liberalization in services would be pursued as long as social gains outweigh the perceived costs of lifting barriers to competition. As such perceptions may differ across countries, further coordination amongst national competition authorities would be desirable to avoid dissimilar competition standards. Competition authorities’ advocacy and enforcement functions could be placed at the center of the liberalization process. Advocacy role. An amended Directive would rely on competition authorities, rather
than governments, to interpret the notion of public interest and ensure that regulations conform to the principles of non-discrimination, necessity, and proportionality. This assessment would inform amendments to sector-specific regulations. The approach taken toward services liberalization in the context of the Greece program can help illustrate the role of independent authorities and sector-specific legislation (Box 2).
New regulatory acts. Forthcoming regulatory acts should favor competition unless it can be demonstrated that the benefits of the restriction outweigh the costs. The
16 The companion Professional Qualifications Directive (Directive 2005/36/EC), currently under review, aims for a smoother system of recognition of qualifications across countries, in particular by harmonizing minimum training requirements. As with the Services Directive, however, the related mutual evaluation exercise and the interpretation of the notion of public interest will continue to be the sole responsibility of governments.
21
No need for liberalization
10%Liberalized before
EFF13%
Liberalized at EFF Approval
3%
Liberalized at 1st and 2nd EFF Review
36%
Liberalized at 3rd EFF Review 10%
Liberalization started but not yet complete
23%
Remaining 5%
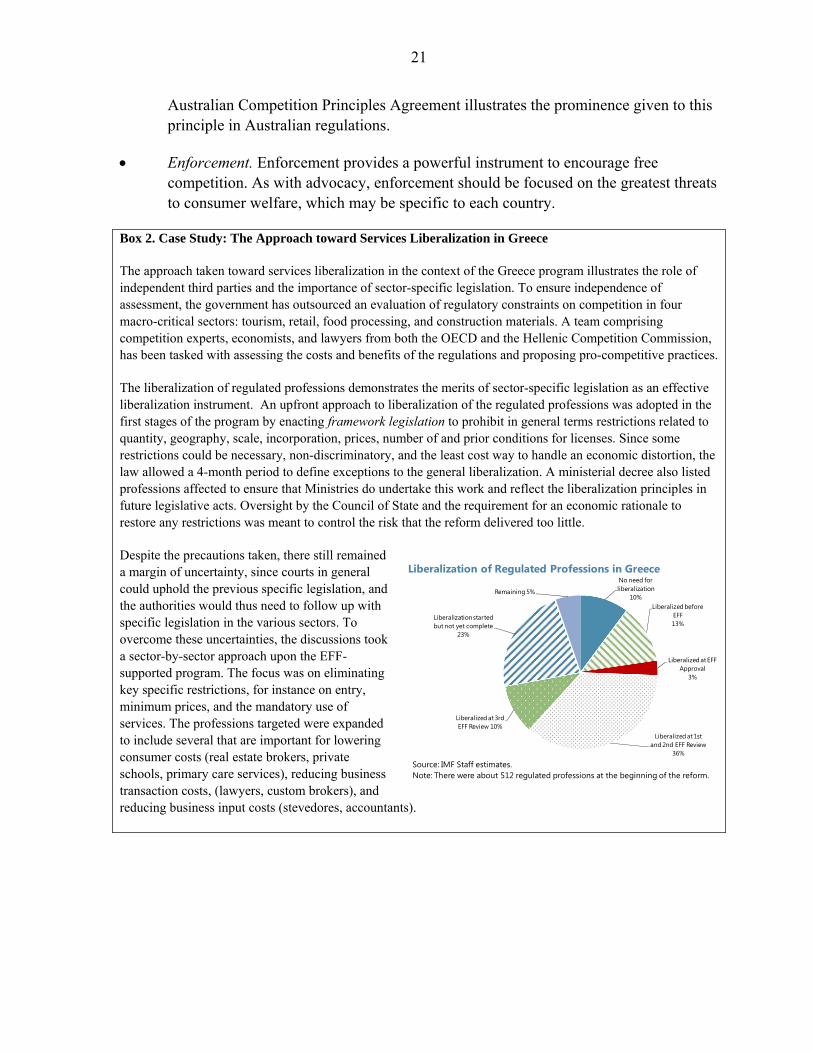
Source: IMF Staff estimates.Note: There were about 512 regulated professions at the beginning of the reform.
Liberalization of Regulated Professions in Greece
Australian Competition Principles Agreement illustrates the prominence given to this principle in Australian regulations.
Enforcement. Enforcement provides a powerful instrument to encourage free competition. As with advocacy, enforcement should be focused on the greatest threats to consumer welfare, which may be specific to each country.
Box 2. Case Study: The Approach toward Services Liberalization in Greece
The approach taken toward services liberalization in the context of the Greece program illustrates the role of independent third parties and the importance of sector-specific legislation. To ensure independence of assessment, the government has outsourced an evaluation of regulatory constraints on competition in four macro-critical sectors: tourism, retail, food processing, and construction materials. A team comprising competition experts, economists, and lawyers from both the OECD and the Hellenic Competition Commission, has been tasked with assessing the costs and benefits of the regulations and proposing pro-competitive practices.
The liberalization of regulated professions demonstrates the merits of sector-specific legislation as an effective liberalization instrument. An upfront approach to liberalization of the regulated professions was adopted in the first stages of the program by enacting framework legislation to prohibit in general terms restrictions related to quantity, geography, scale, incorporation, prices, number of and prior conditions for licenses. Since some restrictions could be necessary, non-discriminatory, and the least cost way to handle an economic distortion, the law allowed a 4-month period to define exceptions to the general liberalization. A ministerial decree also listed professions affected to ensure that Ministries do undertake this work and reflect the liberalization principles in future legislative acts. Oversight by the Council of State and the requirement for an economic rationale to restore any restrictions was meant to control the risk that the reform delivered too little.
Despite the precautions taken, there still remained a margin of uncertainty, since courts in general could uphold the previous specific legislation, and the authorities would thus need to follow up with specific legislation in the various sectors. To overcome these uncertainties, the discussions took a sector-by-sector approach upon the EFF-supported program. The focus was on eliminating key specific restrictions, for instance on entry, minimum prices, and the mandatory use of services. The professions targeted were expanded to include several that are important for lowering consumer costs (real estate brokers, private schools, primary care services), reducing business transaction costs, (lawyers, custom brokers), and reducing business input costs (stevedores, accountants).

22
The European Competition Network (ECN)17 could play a more active role in promoting a level playing field for competition in services across countries. The ECN could ensure a common understanding of the direction of competition policy at the EU level, raising awareness of how national decisions affect competition in the Single Market. To collectively promote competition, the authorities could routinely evaluate its past interventions and discuss their decisions with peers.
VII. CONCLUSIONS
Despite the adoption of the EU Services Directive in 2006 as a tool to foster competition in the service sector across the EU, progress has fallen short of expectations. Focusing on the French economy, this paper examines the possible output and employment gains that may be realized from further reform of the services sector, demonstrating that those gains may be sizeable. To do so, it takes insights from the input-output growth literature (first suggested by Hulten (1978)), and re-examined more recently by Jones (2011) and Gabaix (2011)), which takes into account linkages between sectors and the ensuing spillover effects onto GDP from productivity enhancing reforms in one sector. At the heart of the results lies an important multiplier effect that reflects spillovers across sectors: productivity improvements in, for example, transportation will likely lead to productivity improvements in sectors that use that input (e.g. wholesale and distribution, manufacturing, etc) which in turn will likely lead to productivity improvements to other sectors in the economy that use those inputs. Moreover, positive feedback loops may also be created as the productivity improvements in the non-transportation sectors will likely spillover to the transportation sector itself. Put simply, the effect on economy-wide GDP stemming from an increase in a specific sector (e.g. transportation) is larger than the corresponding sector’s share in output. In the case of France, simulations suggest that the largest gains may be found in reforms to the business activities, other market services, and transport and storage sectors. For other countries, a sizeable multiplier effect should also be at play, though the magnitude of those gains may be different reflecting differing linkages between sectors and the ensuing spillovers. This suggests that a renewed impulse to the liberalization of services across Europe should be a priority.
17 The ECN gathers representatives of the European Commission and the competition authorities in EU countries.
23
VIII. REFERENCES
Atalay, E., 2014, “How Important are Sectoral Shocks?”, Mimeograph, University of Chicago.
Blanchard, O. J. and Charles M. Kahn, 1980, “The Solution of Linear Difference Models
under Rational Expectations,” Econometrica, 1980, 48, 1305—1311. Bouakez, Hafedh, Cardia, Emanuela and Ruge-Murcia, Francisco J, 2009, “Durable Goods,
Inter-Sectoral Linkages and Monetary Policy”, Journal of Economic Dynamics and Control, 35(5): pp. 730-46.
Foerster, A.T., P.G. Sarte, and Watson, M.W., 2011, “Sectoral versus Aggregate Shocks: A
Structural Factor Analysis of Industrial Production,” Journal of Political Economy 119, 1-38.
Gabaix, X., 2011, “The Granular Origins of Aggregate Fluctuations,” Econometrica, 79, 733-
772. Gopinath, G. and B. Neiman, 2013, “Trade Adjustment and Productivity in Large Crises”,
American Economic Review, Forthcoming. Hansen, G.D., 1985, “Indivisible Labor and the Business Cycle,” Journal of Monetary
Economics, 16, November, 309—27. Horvath, M.T.K, 2000, “Sectoral Shocks and Aggregate Fluctuations,” Journal of Monetary
Economics, 45, 69-106.
Hulten, Charles R., 1978, “Growth Accounting with Intermediate Inputs”, The Review of Economic Studies, 45(3) 511-8.
Jones, Charles I., 2011, “Intermediate Goods and Weak Links in the Theory of Economic Development.” American Economic Journal: Macroeconomics, 3(2): 1-28.
Jones, Charles I, 2011a, “Intermediate Goods and Weak Links in the Theory of Economic
Development”, American Economic Journal: Macroeconomics, 3(2), pp. 1-28. Jones, Charles I, 2011b, “Misallocation, Economic Growth, and Input-Output Economics”,
NBER Working Papers No. 16742, National Bureau of Economic Research, Inc.
24
Kim, K., and Y.S. Kim, 2006, “How Important is the Intermediate Input Channel in Explaining Sectoral Employment Comovement over the Business Cycle?”, Review of Economic Dynamics, 9(4): 659 – 682.
Long, J. B. and Plosser, C. I., 1983, “Real Business Cycles,” Journal of Political Economy
91, pp. 39-69. Lucas, R.E., 1981, “Understanding Business Cycles”. In Studies in Business Cycle Theory.
MIT Press, Cambridge. Monteagudo, J., A. Rutkowski, and D. Lorenzani, 2012, “The economic impact of the SD: A
first assessment following implementation,” European Economy, Economic Papers, 456, June 2012.