Embed Size (px)
Citation preview

2 21
T H E E U BLUE ECONOMYREP RT

2 21
T H E E U BLUE ECONOMYREP RT

© European Union, 2021The reuse policy of European Commission documents is regulated by Decision 2011/833/EU (OJ L 330, 14.12.2011, p. 39).Project number: 2021.2608Title: The EU Blue Economy Report 2021.
Print ISBN 978-92-76-37886-0 ISSN 2599-6576 doi:10.2771/5187 KL-AR-21-001-EN-C
PDF ISBN 978-92-76-37879-2 ISSN 2599-6584 doi:10.2771/8217 KL-AR-21-001-EN-N
Disclaimer:This document was prepared by the Directorate-General Maritime Affairs and Fisheries jointly with the Joint Research Centre. Views expressed in unofficial documents do not necessarily represent the views of the European Commission and the European Commission cannot be held responsible for any use of the information contained herein. The 2021 EU Blue Economy Report supersedes all prior editions of the report.
I
2021
The EU Blue Economy Report 2021
This Report was drafted by the European Commission Directorate General for Maritime Affairs and Fisheries, and the Joint Research Centre. It was prepared by unit MARE A4: Economic Analysis, Markets and Impact Assessment and units JRC C7: Knowledge for the Energy Union and JRC D2: Water and Marine Resources in collaboration with other Commission services.
Comments can be sent to:
Directorate-General for Maritime Affairs and FisheriesUnit A4: Economic Analysis, Markets and Impact AssessmentEuropean Commission1049 Bruxelles / BrusselBelgique / Belgiëor by email to: [email protected]
Project Coordination (in alphabetical order): Jann Martinsohn and Frangiscos Nikolian
Main authors (in alphabetical order): Anna M. Addamo, Angel Calvo Santos, Natacha Carvalho, Jordi Guillén, Davide Magagna, Sarah Neehus, Ana Peralta Baptista, Simone Quatrini, Yasmin Schinasi Romeu.
Secondary authors (in alphabetical order):Gillian Ainsworth (University of Santiago de Compostela), Rita Araujo, Fulvio Ardente, Ricardo Barranco, Filipe Batista, Carla Caldeira, Helena Cavaco Viegas, Franca Contini, Danish Maritime Authority, Jacques Delsalle, Directorate General for Fisheries and Maritime Affairs - Ministry of Agriculture, Livestock, Fisheries and Food (Government of Catalonia, ES), Directorate General for Maritime Policy (DGPM) - Ministry of Sea. Portugal, Mathieu Doussineau, Philip Easthill (European Boating Industry), European Bank for Reconstruction and Development (EBRD), European Investment Bank (EIB), Luc Feyen, René Friedland, Elisa Garcia Gorriz , Maurizio Gibin, Andrzej Giza (University of Szczecin), Ales Gnamus, F. Javier González Sanz Instituto Geológico y Minero de España (IGME), Lucie Guirkinger, Georg Hanke, Stuart Daniel James (VDMA), Pieter De Jong (Wetsus), Carlo Lavalle, Simon Letout, Diego Macias Moy (Consejo Superior de Investigaciones Científicas, CSIC-ICMAN), Pietro Moretto, Dominik Paprotny (Helmholtz Centre Potsdam), Alberto Pistocchi, Pablo Pita (University of Santiago de Compostela), Jan Post (Wetsus), Paola Proietti, Serenella Sala, Esther Sanye Mengual, Joana Simoes (EarthPulse), Adolf Stips, Thomas Telsnig, Paweł Terefenko (University of Szczecin), Victoria Tornero, Javier Villar Burke, Sebastián Villasante (University of Santiago de Compostela), Michalis I. Vousdoukas.
How to cite this report: European Commission (2021). The EU Blue Economy Report. 2021. Publications Office of the European Union. Luxembourg.
FO R E WO R D
Seas and oceans cover more than 70% of Earth’s surface. They hold 97% of all water and sustain 80% of all life forms on the planet. These vast ecosystems are amongst the world’s largest carbon sinks, produce half of the oxygen we breathe and are the primary source of proteins for more than 3 billion people worldwide. They are also the fabric of a large industry.
Blue Economy traditional sectors contribute to about 1.5% of the EU-27 GDP and provide about 4.5 million direct jobs, i.e. 2.3% of EU-27 total employment. Emerging innovative Blue Economy sectors, such as ocean renewable energy, blue biotechnology, and algae production are adding new markets and creating jobs. This is without counting indirect and induced
income and employment effects.
The global health and economic crisis triggered by the COVID-19 pandemic affected severely all Blue Economy sectors for more than a year now. Coastal areas and small islands have been hit harder by travel restrictions. Addressing the combined climate, environmental, health, economic and social challenges is a daunting task, but there should be no excuse for inaction.
Long before the COVID-19 outbreak, the European Union had committed to be at the forefront of the global sustainability agenda. The EU has reaffirmed its resolve to contribute to the UN sustainable development goals, to protect biodiversity in at least 30% of its land and seas by 2030. The EU has set the ambitious target of achieving climate neutrality by 2050, and to put sustainability at the core of its Blue Economy.
These developments will unfold in the years to come, in line with the European Green Deal objectives. We will do so by transforming our Blue Economy value chains, moving away from linear business models towards circular, less resource- and waste-intensive ones. We have already introduced strict measures against marine pollution, coastal litter and plastics. We will continue our efforts to replace fossil fuels, invest in biodiversity conservation, ecosystem restoration and protection, promote nature-based solutions, and incubate marine renewable energy and innovative blue biotechnologies.
I am confident on the efforts that will be made on research, innovation, and education, as the green transition and recovery certainly cannot be achieved without skilled people. That is why literacy, competences and opportunities are so important. The €95.5 billion budget for Horizon Europe will be instrumental to the consolidation of a conducive environment in the EU that allows talent to grow and flourish, innovative firms to increase their competitiveness, and research to generate disruptive solutions that will transform the way we interact with Nature – and with oceans, seas and coasts, specifically.
This year’s edition of the Blue Economy report not only provides an update on the economic performance of both established and emerging sectors across the EU Member States, but also an overview of the impacts of BREXIT and the COVID-19 crisis on the EU Blue Economy, as the effects of these events are gradually unfolding.
This report marks an important milestone towards the establishment of the European Blue Observatory, a collaborative knowledge dissemination platform of the European Commission Joint Research Centre and Directorate-General for Maritime Affairs and Fisheries. The objective is to reduce knowledge gaps in ocean socio-economic valuation, enhance the accuracy of Blue Economy statistics and enable near real-time monitoring of decarbonisation efforts across the blue economy sectors in Europe.
I hope you will enjoy the 2021 Blue Economy report and make the most of it.
MARIYA GABRIEL, EU Commissioner for Innovation and Youth, responsible for the European Commission’s in-house science and knowledge service, the Joint Research Centre
II
THE
EU B
LUE
ECO
NO
MY
REPO
RT
The European Green Deal, our long-term strategy for sustainable growth, builds on clear ambitions such as carbon neutrality, a circular economy, zero pollution and the restoration of biodiversity. The Blue Economy will play a major role in this transformation and I dare to say that we will not meet the European Green Deal ambitions without the Blue Economy. We will need the ocean for renewable energy, for sustainable and highly nutritious food, for clean alternatives to plastics… and much more. At the same time, all Blue Economy sectors have to reduce their climate and environmental impact and contribute to the recovery of marine ecosystems.
Fostering the true green potential of the blue economy can also play an integral part in mitigating the economic setback caused by the COVID-19 crisis, leading to new growth opportunities and new jobs.
This fourth edition of the yearly Blue Economy Report provides a comprehensive overview of the sector and its achievements, which forms a solid foundation that will enable both policy-makers and stakeholders to make informed decisions. In these uncertain and challenging times, this is more relevant than ever.
This report equally supports and complements the newly published Sustainable Blue Economy communication, acting as a tool to obtain the data needed to develop the policies, actions and initiatives in it.
Building on the most recent available data for established and emerging sectors, the report not only delineates the past, the present and future potentials and opportunities of all blue economy sectors but also addresses the impacts of the COVID-19 crisis on the respective sectors as well as the effects of mitigation measures put in place.
I am convinced that whether we will meet the Green Deal goals will not just depend on us, policy makers. It will mostly depend on the private sector, on businesses, scientists and consumers. Politicians and policy makers can set the scene, provide support, and eliminate the barriers. But only together will we be successful. With that in mind, I strongly believe that we can turn adversities into opportunities and will come out of the crisis stronger than before.
I wish you an interesting reading.
VIRGINIJUS SINKEVIČIUS, EU Commissioner for Environment, Oceans and Fisheries
FO R E WO R D III
2021

IV
THE
EU B
LUE
ECO
NO
MY
REPO
RT CON T E N T S
FOREWORD II
EXECUTIVE SUMMARY VI
CHAPTER 1: INTRODUCTION 1
CHAPTER 2: GENERAL CONTEXT AND EU OVERVIEW 5
2.1. ECONOMIC CONTEXT 62.2. COVID-19 CRISIS: MAIN ECONOMIC IMPACTS 72.3. FINANCING 72.4. MARITIME SPATIAL PLANNING (MSP) 122.5. INDIRECT EMPLOYMENT AND ACTIVITY 132.6. OVERVIEW OF THE EU ESTABLISHED SECTORS 16
CHAPTER 3: THE EUROPEAN GREEN DEAL AND THE CIRCULAR ECONOMY 23
3.1. EUROPEAN GREEN DEAL: CONTEXT AND RELEVANCE 243.2. THE CIRCULAR ECONOMY 283.3. STRONGER EUROPE IN THE WORLD 32
CHAPTER 4: ESTABLISHED SECTORS 33
4.1. MARINE LIVING RESOURCES 354.2. MARINE NON-LIVING RESOURCES 414.3. MARINE RENEWABLE ENERGY (OFFSHORE WIND) 454.4. PORT ACTIVITIES 524.5. SHIPBUILDING AND REPAIR 564.6. MARITIME TRANSPORT 604.7. COASTAL TOURISM 66
CHAPTER 5: EMERGING SECTORS 77
5.1. OCEAN ENERGY 795.2. THE BLUE BIOECONOMY & BIOTECHNOLOGY 895.3. DESALINATION 945.4. MARINE MINERALS 1005.5. MARITIME DEFENCE, SECURITY AND SURVEILLANCE 1045.6. RESEARCH AND EDUCATION 1095.7. INFRASTRUCTURE 113

CHAPTER 6: ECOSYSTEM SERVICES, ECONOMY AND THE ENVIRONMENT 117
6.1. HUMAN INTERACTIONS WITH BLUE NATURAL CAPITAL 1206.2. MARINE POLLUTION 1216.3. DECARBONISATION TRENDS IN THE EU BLUE ECONOMY 1256.4. THE ENVIRONMENTAL IMPACTS OF FISHERIES PRODUCTS
FROM A LIFE CYCLE PERSPECTIVE 1296.5. QUANTIFICATION OF ECONOMIC LOSS OF COASTAL ECOSYSTEM SERVICES
FROM SEA LEVEL RISE 1326.6. IMPACTS OF COVID-19 PANDEMIC IN BLUE NATURE AREAS 1356.7. CARBON SEQUESTRATION IN EUROPEAN SEAS 138
CHAPTER 7: REGIONAL AND INTERNATIONAL ANALYSES 139
7.1. THE BLUE ECONOMY IN THE EU SEA BASINS 1407.2. BLUE ECONOMY: THE INTERNATIONAL DIMENSION 147
CHAPTER 8: CASE STUDIES 153
8.1. DENMARK'S GREEN TRANSITION AND DECARBONISATION STRATEGY: RESEARCH, DEVELOPMENT AND INNOVATION 154
8.2. ENVISIONING FLOATING OFFSHORE WIND: A MANUFACTURERS PERSPECTIVE 1568.3. INNOVATION IN PORTUGAL TO BOOST A SUSTAINABLE BLUE ECONOMY 1598.4. RECREATIONAL MARITIME FISHING IN CATALONIA 161
ANNEXES
ANNEX 1: MEMBER STATE PROFILES 3ANNEX 2: SUMMARY TABLES 33ANNEX 3: METHODOLOGICAL FRAMEWORK 67ACRONYMS 88GLOSSARY 91
V
2021
VI
THE
EU B
LUE
ECO
NO
MY
REPO
RT
In its fourth edition, the yearly EU Blue Economy Report contin-ues to analyse the scope and size of the Blue Economy in the European Union. It aims at providing support to policymakers and stakeholders in the quest for a sustainable development of the oceans, coastal resources and, most notably, to the development and implementation of polices and initiatives under the European Green Deal and in particular with the insight of the Sustainable Blue Economy communication1. Through its economic evidence, the Report takes stock of the Blue Economy, using the latest avail-able data acting hence as a supporting tool for evidenced-based policy making. It also serves as a source of inspiration to all con-cerned stakeholders.
For the purposes of the Report, the Blue Economy includes all those activities that are marine-based or marine-related. Therefore, the Report examines not only established sectors (i.e. those that traditionally contribute to the Blue Economy) but also emerging (those for which reliable data are still developing) and innovative sectors, which bring new opportunities for investment and hold large potential for the future development of coastal communities. Analyses are provided for 2009-18 period for the EU-27 as a whole and by sector and industry for each Member State.
The European Green Deal and the European Strategy for data will necessitate reliable, accurate and centralised data for their initi-atives. This Report intends to serve as a useful input to assessing the evolving contribution of oceans and coasts to the European economy. It is also intended to support the development of pol-icies that pursue the EU strategic vision for a sustainable blue economy at all levels of governance.
The fourth edition of the Report provides a new perspective on the impacts that several factors have on the Blue Economy, including global challenges like climate change, emerging sectors such as maritime security and surveillance, enabling frameworks such as Maritime Spatial Planning, and innovative solutions from research & technological development. Most importantly, this edition also analyses the impacts of the COVID-19 crisis on the various sec-tors, as well as the effects of the mitigation measures put in place, such as the EU Recovery fund.
The Blue Economy established sectors include Marine living resources, Marine non-living resources, Marine Renewable energy, Port activities, Shipbuilding and repair, Maritime transport and Coastal tourism. The analysis of these sectors is based on data collected by the European Commission from EU Member States and the European Statistical System. Fisheries and aquaculture data were collected under the EU Data Collection Framework (DCF). Analyses for all other established sectors are based on Eurostat data from Structural Business Statistics (SBS), PRODCOM, National Accounts and tourism statistics2.
1 COM (2021) 240 final.2 This year’s edition of the Blue Economy Report supersedes the 2020 Blue Economy Report; in this edition, the 2018 data are final while in the previous edition, they were
still provisional and estimated data. At time of publication, 2019 SBS data were unavailable. Additionally, last year's edition included the UK, and this current edition is for the EU-27 only.
3 COM(2020) 301 final, July 2020, https://ec.europa.eu/energy/sites/ener/files/hydrogen_strategy.pdf4 https://ec.europa.eu/energy/sites/ener/files/offshore_renewable_energy_strategy.pdf
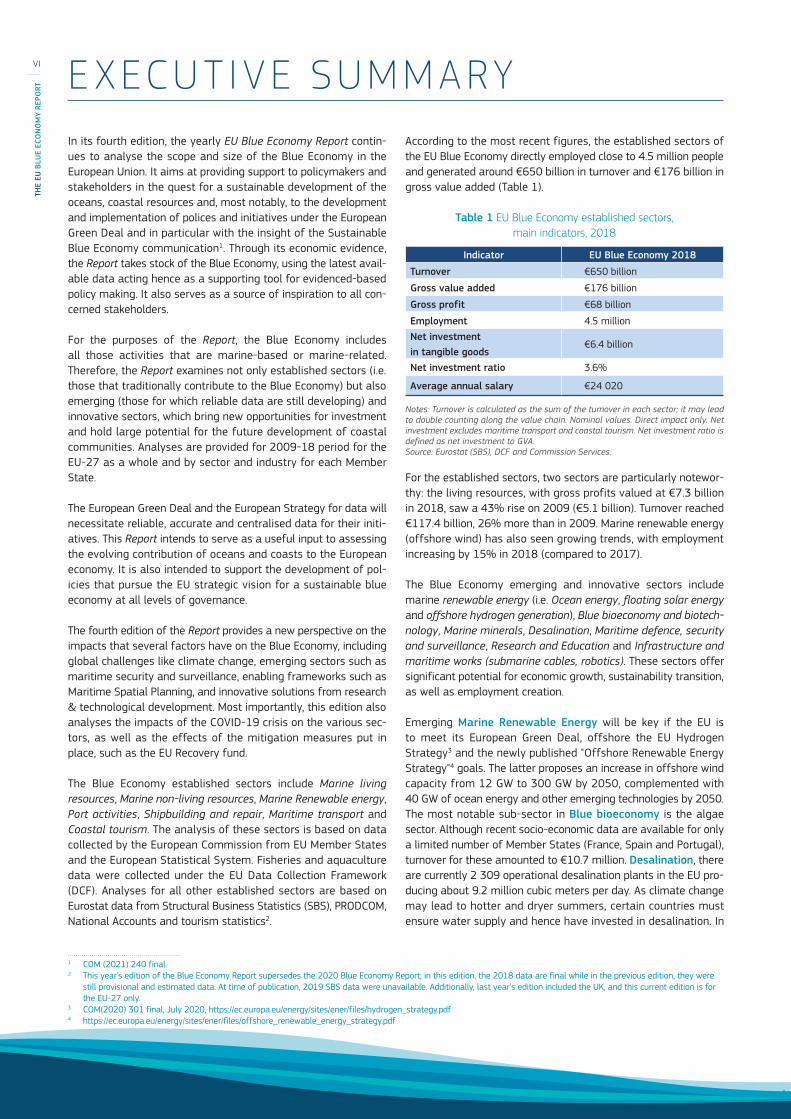
According to the most recent figures, the established sectors of the EU Blue Economy directly employed close to 4.5 million people and generated around €650 billion in turnover and €176 billion in gross value added (Table 1).
Table 1 EU Blue Economy established sectors, main indicators, 2018
Indicator EU Blue Economy 2018
Turnover €650 billion
Gross value added €176 billion
Gross profit €68 billion
Employment 4.5 millionNet investment in tangible goods
€6.4 billion
Net investment ratio 3.6%
Average annual salary €24 020
Notes: Turnover is calculated as the sum of the turnover in each sector; it may lead to double counting along the value chain. Nominal values. Direct impact only. Net investment excludes maritime transport and coastal tourism. Net investment ratio is defined as net investment to GVA.Source: Eurostat (SBS), DCF and Commission Services.
For the established sectors, two sectors are particularly notewor-thy: the living resources, with gross profits valued at €7.3 billion in 2018, saw a 43% rise on 2009 (€5.1 billion). Turnover reached €117.4 billion, 26% more than in 2009. Marine renewable energy (offshore wind) has also seen growing trends, with employment increasing by 15% in 2018 (compared to 2017).
The Blue Economy emerging and innovative sectors include marine renewable energy (i.e. Ocean energy, floating solar energy and offshore hydrogen generation), Blue bioeconomy and biotech-nology, Marine minerals, Desalination, Maritime defence, security and surveillance, Research and Education and Infrastructure and maritime works (submarine cables, robotics). These sectors offer significant potential for economic growth, sustainability transition, as well as employment creation.
Emerging Marine Renewable Energy will be key if the EU is to meet its European Green Deal, offshore the EU Hydrogen Strategy3 and the newly published "Offshore Renewable Energy Strategy"4 goals. The latter proposes an increase in offshore wind capacity from 12 GW to 300 GW by 2050, complemented with 40 GW of ocean energy and other emerging technologies by 2050. The most notable sub-sector in Blue bioeconomy is the algae sector. Although recent socio-economic data are available for only a limited number of Member States (France, Spain and Portugal), turnover for these amounted to €10.7 million. Desalination, there are currently 2 309 operational desalination plants in the EU pro-ducing about 9.2 million cubic meters per day. As climate change may lead to hotter and dryer summers, certain countries must ensure water supply and hence have invested in desalination. In
E X EC U T IV E S U M M A RY

relation to Research and Education, developing the right skills in the offshore renewable energy sector seems critical. Currently, 17-32% of companies are experiencing skills gaps, while in tech-nical occupations, 9 to 30% are experiencing skills shortages. In the future, Member States will need to provide more education and training schemes targeting the offshore renewable energy sector in line with their expected development targets, so as to attract young workers and re/upskill workers to offshore renew-able energy jobs.
As showed in chapter 6 for all Blue Economy sectors, quantifying the costs and impacts of depletion of blue natural capital and ecosystem services, as well as the benefits of their preservation, restoration and adaptation is key. Almost €500 billion worth of services are generated within a 10 km coastal zone in the EU annually. However, sea level rise leading to increased coastal ero-sion is projected to decrease this value by more than €15 billion annually. Further, the loss of 1-1.3% of land and inland waters would result in a 4.3-5.4% decline in the value of their ecosystem services, i.e. from €360 to €341–344 billion per year.
As for CO2 emissions coming from the Blue Economy sec-tors, results show that those produced by the EU fishing fleet decreased by 18% between 2009 and 2018. Moreover, and as regards impact of fish and seafood products in relation to climate change, compared to other sources of protein in the EU diet, fish showed a lower impact compared to meat (although poultry had similar impacts per mass of product to shrimp and salmon).
Preserving and increasing the natural capital of the seas and oceans is critical to ensure a continued delivery of valuable eco-system services and for the EU to achieve the UN 2030 Agenda Sustainable Development Goals (SDGs) as underlined by the European Green Deal. The EU biodiversity strategy under which the Farm to Fork strategy, as well the Decarbonisation goal includ-ing the EU offshore renewable, should enable the EU to honour its sustainability commitments.
The Blue Economy is linked to many other economic activities and its impact goes beyond the above-mentioned sectors. Success stories and more niche sectors or activities in the Blue Economy are presented in the form of case studies and boxes. These include decarbonisation and innovation in Member States, how the EU Blue Economy compares to that of China and the impact of recreational fisheries in certain areas.
The Report comprises an overview of the EU Blue Economy for each European sea basin, providing figures on employment and Gross Value Added. Finally, the Report is equipped with an Annex providing a short overview of the Blue Economy in each Member State.
VII
2021


C h A p T E R 1INTRODUC T ION

Aim of the report
The ocean is critical in ensuring that some of society's most basic needs are met. Apart from the more traditional forms of exploita-tion (e.g. fishing and aquaculture), a broader vision of the Blue Economy can offer important sources of sustainable economic development for Member States and coastal communities in particular.
A sustainable Blue Economy enables society to obtain value from the oceans and coastal regions, whilst respecting their long-term ability to regenerate and endure such activities through the implementation of sustainable practices. This implies that human activities must be managed in a way that guarantees the health of the oceans and safeguards economic productivity, so that the potential they offer can be realised and sustained over time.
The yearly EU Blue Economy Report seeks to continuously improve the measuring and monitoring of the socio-economic impacts of the Blue Economy (for the 2009-2018 period), while considering the environmental implications. With the European Green Deal5 well underway, and the insight of the Sustainable Blue Economy communication6, the need to ensure that economic growth and employment go hand in hand with protecting and restoring nature and fighting climate change is imperative. The Report should be seen as a stocktaking tool to support (with accu-rate intelligence) relevant new initiatives and policies. Notably, under the new European Green Deal, which aims at implementing the United Nation’s 2030 Agenda by putting “sustainability and the well-being of citizens at the centre of economic policy and the sustainable development at the heart of the EU’s policymak-ing and action”7. It therefore complements the recently published Sustainable Blue Economy communication.
In its fourth edition, the EU Blue Economy Report aims to continue to provide accurate and reliable data and trends for the mari-time sectors and activities, as good data is essential in order to develop and implement policies. The EU Blue Economy Report also provides a solid evidence-based, ground on which to make policy decisions that support the transition into more carbon efficient and less polluting technologies and activities.
The Report is accompanied by the Blue Economy Indicators (BEI), an IT tool that stores and disseminates additional breakdowns of the data, to guarantee transparency8. The BEI ensures that the data reported are available to all in a way that is easily accessible, and where data can be use and re-used. The data available in the BEI are based on the methodology detailed in Annex 3.
In addition to the European Green Deal, the report and particularly the Blue Economy Indicators strive for more and better data in line with the European Commission’s European Data Strategy9 to ensure that the EU is a front-runner in an ever more-digital world. The goal of the strategy is to create a policy environment to make the EU a leader in a data-driven society. Creating a single market for data will allow it to flow freely within the EU
5 Commission Communication on “The European Green Deal” COM (2019) 640 final.6 COM (2021) 240 final.7 COM (2019) 640 final, p. 3.8 The Blue Economy Indicators tool can be accessed through the online dashboard available at: https://blueindicators.ec.europa.eu/ 9 Commission Communication on “A European Strategy for Data” COM (2020) 66 Final.10 COM (2020) 66 Final p. 13.
and across sectors for the benefit of businesses, researchers and public administrations. Only with high quality data, can policy makers and citizens make adequate and informed decisions.
The report and the IT tool (BEI) mentioned above ensure that the data being reported is available to all in a way that is easily accessible and user-friendly. Moreover, the strategy itself aims at “making more high-quality public sector data available for re-use […]”10. The report, in its downloadable format, certainly attempts to meet this objective but most importantly, the BEI provides for this by not only making all data public but also allowing all users to extract and download them in a variety of forms, hence enabling them to use and re-use the data.
What does the Blue Economy include?
For the purpose of this Report, the EU’s Blue Economy encom-passes all sectoral and cross-sectoral economic activities based on or related to the oceans, seas and coasts:
• Marine-based activities: include the activities undertaken in the ocean, sea and coastal areas, such as Marine living resources (capture fisheries and aquaculture), Marine miner-als, Marine renewable energy, Desalination, Maritime trans-port and Coastal tourism.
• Marine-related activities: activities which use products and/or produce products and services from the ocean or marine-based activities like seafood processing, biotechnol-ogy, Shipbuilding and repair, Port activities, technology and equipment, digital services, etc.
In terms of geographical scope, the Report focuses on the EU ter-ritory, including when and where possible outermost regions and landlocked Member States.
The Report compiles the data on the economic activities emerging directly from the identified sectors. However, some Blue Economy sectors generate significant indirect economic effects (e.g. across the supply chain) and induced economic effects (i.e. general con-sumption and expenditure stemming from the household dispos-able income generated by Blue Economy activities). At times and where possible, these effects are incorporated into other Blue Economy sectors or are made reference to in the sector specific chapters.
Contents and structure
Following the present Introduction, Chapter 2 provides an over-view of several broad issues, such as the general economic and political context, providing a background to the Blue Economy and an overview of the sources of financing available for Blue Economy activities and projects. The chapter further includes a summary of the main features of the established sectors. It also comprises a general assessment of the impacts and responses to the COVID-19 crisis. It concludes with brief section on indirect employment and its impacts.
2
THE
EU B
LUE
ECO
NO
MY
REPO
RT

With a focus on the European Green Deal, Chapter 3 highlights the main elements of the EGD, of relevance to the Blue Economy. Further details are provided on policies and/or initiatives that fall under the realm of the EGD, such as the Farm to Fork strategy (F2F) and the EU offshore renewable energy strategy. The chapter also delves into the rationale and benefits of a circular economy and the opportunities it offers to the Blue Economy sectors, espe-cially at an EU level. Finally, this chapter briefly discusses the role of the EU in the world as regards its maritime policies.
Chapter 4 then reviews a series of traditional Blue Economy activities, the “established sectors”, looking at the main economic indicators as well as the trends, drivers and interactions with other sectors or activities, including their environmental impacts. This chapter provides an analysis at the EU level, but also emphasises the contribution made by key MSs to different sectors. The estab-lished sectors include the following:
• Marine living resources.• Marine non-living resources.• Marine renewable energy. • Ports activities.• Shipbuilding and repair.• Maritime transport.• Coastal tourism.
Chapter 5 provides an analysis of the emerging sectors, i.e. sec-tors that are either new (i.e. innovations), which may fall outside of national statistics and activities/sectors with limited data (i.e. not adequately reflected in the statistics). The chapter attempts to highlight the impact that these sectors have and their potential for further growth and expansion. The following sectors are included in this section:
• Ocean energy.• Blue bioeconomy and biotechnology.• Desalination.• Marine minerals. • Maritime Defence, security and surveillance.• Research and Education.• Infrastructure and maritime works
(submarine cables, robotics, etc.).
Following this section, Chapter 6 provides an overview of some of the main dependencies, liabilities, and impacts of the Blue Economy on the blue natural capital and ecosystems services, as well as opportunities arising from the transition to a more sus-tainable Blue Economy. It covers, among others, the environmental footprint of marine fisheries from a lifecycle perspective, marine pollution, carbon sequestration in European seas, decarbonisation trends, and an updated analysis on the economic losses of coastal ecosystems services due sea level rise. Further, it offers some insights into impacts of the COVID-19 crisis on blue nature areas.
Chapter 7 covers the regional and international dimensions, and is split into two main sections. The first section provides a disag-gregated analysis of the relative share of the Blue Economy in the EU sea basins. This section presents results for employment and GVA for all seven Blue Economy established sectors. The second section puts the EU Blue Economy results into perspective vis-à-vis other major world actors. This year, the comparison is with the
Blue Economy in China. The section also provides a brief update on the National Satellite Accounts set up by the United States (US) and the latest US Blue Economy figures.
Finally, Chapter 8 compiles a number of case studies that explore in more detail some niche sections of the Blue Economy. They specifically focus on elements relating to decarbonisation and technological innovation by explaining what some of the Member States (Denmark and Portugal) have done in this regard. It also provides a manufacturer's perspective on the potential of floating offshore wind. A final case study produced by the Catalan region in Spain, looks at the impact of recreational fishing.
A series of Annexes complete the Report offering an overview of the Blue Economy for each of the EU Member States. They Annexes also contain a series of additional tables with com-plementary detailed data on the established sectors and a pre-cise explanation of the methodological approaches used across the Report.
Note on the COVID-19 outbreak
The data used for the production of this report, covers the period from 2009 to 2018. Therefore, COVID-19 impacts on the Blue Economy sectors are not reflected in the analyses, tables and charts presented in this report. However, in order to cast some light on the effects of the COVID-19 crisis on the Blue Economy, this report comprises a section (2.2) on projected COVID-19 impacts across the whole Blue Economy and a brief description of their ongoing effects on specific Blue Economy sectors or activ-ities (Chapter 4).
Note on the treatment of the United Kingdom
As the United Kingdom is no longer a member of the European Union (since February 2020), it has not been included in the report and the analyses herein. All data refer to the EU-27, unless other-wise specified, and as such cannot be compared to prior reports, which included UK data.
3
2021

4
THE
EU B
LUE
ECO
NO
MY
REPO
RT

C h A p T E R 2GENER AL CONTE X T AND EU OVERVIEW

This chapter aims at providing context and background infor-mation to the report and the chapters to follow. Firstly, presents the general economic context. It the addresses the impact of the COVID-19 crisis, specifically across the European Blue Economy sectors. This is followed by a brief overview of blue funding addressing financing opportunities for the industry as well as foreseeable investment trends. The subsequent section focuses on Sustainable Blue Economy developments through the lens of Marine Spatial Planning. Moreover, this chapter provides exam-ples of implications of the Blue Economy with regards to indirect employment and provides an overview of the established sectors.
11 The national GDP and employment data have been extracted from Eurostat.
2.1. ECONOMIC CONTEXTThe Gross Domestic Product (GDP) of the EU-27 was estimated at €13 500 billion and employment at 193 million people in 201811. The contribution of the Blue Economy established sectors to the EU-27 economy in 2018 was 1.5% in terms of GVA and 2.3% in terms of employment (Figure 2.1).
The relative size of the EU Blue Economy in terms of GVA and employment with respect to the EU overall economy has decreased from 2009. However, it can be seen that the relative size of the EU Blue Economy, both in terms of GVA and employ-ment, decreased with the 2008 economic crisis. The crisis went through to 2012 and since then the relative size of the EU Blue Economy has increased, in particular in terms of employment.
This shows that the EU Blue Economy grows and contracts faster than the EU overall economy. This could partly be due to the importance of coastal tourism, which represents 45% of the GVA and 64% of the employment of the EU Blue economy, and which grows faster in periods of economic growth, but also shrinks faster during crises.
The outbreak of the COVID-19 pandemic in February 2020 repre-sented a major shock for the global and the EU economies, with severe socio-economic consequences. It is therefore expected that the EU Blue Economy will be more affected by the crisis than the overall EU economy; but the EU Blue Economy will grow faster when the economy eventually recovers, offering important invest-ment opportunities. However, it is expected that different sectors in the Blue Economy will be differently impacted.
Table 2.1 Assessment of the impact of the COVID-19 economic crisis on the Blue Economy
Sector Size Impact 2020 Recovery path
Established sectors
Marine living resources Medium Strong Prompt
Marine non-living resources Small Strong PromptMarine renewable energy Nascent Medium PromptPort activities Medium Strong PromptShipbuilding and repair Small Strong LaggedMaritime transport Medium Strong PromptCoastal tourism Very large Strong Very lagged
Emerging sectors
Blue bioeconomy Small Strong PromptOcean energy Nascent Small PromptDesalination Nascent Small PromptMaritime defence Small Small PromptCables Nascent Small PromptResearch and Education Nascent Small PromptMarine observation Nascent Small Prompt
Source: Commission Services.
Figure 2.1 Contribution of the Blue Economy to the overall EU economy
Source: Own elaboration from Eurostat (SBS) and DCF data.
6
THE
EU B
LUE
ECO
NO
MY
REPO
RT

2.2. COVID-19 CRISIS: MAIN ECONOMIC IMPACTS The winter 2021 Economic Forecast of the European Commission12 projected that the EU economy would contract by 6.3% in 2020 before recovering with a growth of 3.7% in 2021 and 3.9% in 2022. The economic impact of the pandemic has differed widely across the EU and the same is true of recovery prospects. This reflects the spread of the virus, the stringency of public health measures taken to contain it, the sectoral composition of national economies and the strength of national policy responses.
Job losses and the rise in unemployment have put severe strains on the livelihoods of many Europeans. Policy measures taken by Member States, together with initiatives at an EU level have helped cushion the impact of the pandemic on labour markets. In the third quarter of 2020, the unemployment rate recovered after a significant drop in the first half of the year by 0.9%, contributing to a year-on-year drop of 2.1% compared to the last quarter of 2019. After a peak in July, corresponding to an unemployment rate of 7.8%, the number of unemployed persons stabilised in December at 7.5%. The latter corresponds to a 1.2 percentage point difference with the figure for February 202013.
Table 2.1 shows the impact of the COVID-19 crisis on the different Blue Economy sectors. The assessment was done using the EU economy average contraction (i.e. -6.3% of real GDP growth) for 2020. The categories under size describe the size of the sector within the Blue Economy. The sectors that contracted by about the same percentage as the EU average were categorised as medium (impact). Those that contracted by a lower percentage were categorised as small (impact), and those that contracted by a higher percentage, as strong (impact). As regards the recovery path, those sectors expected to return to pre-COVID levels before 2022 fall under the category “prompt”. If the recovery will be achieved in 2022, they are categorised as “lagged”, and if it is achieved later as “very lagged”.
Based on the most recent data and analysis, the sectors that suf-fered most severely in 2020, were all the established sectors, with the exception of Marine renewable energy, where the impact was medium. Although the Living resources, Non-living resources, Port activities and Maritime transport sectors suffered strongly (with some activities suffering less), they are all foreseen to recover promptly. Further, Shipbuilding is expected to have a slower, more lagged recovery whereas Coastal tourism did not only see strong impacts, but is also likely to have a much lagged recovery path. Finally, most of the emerging sectors suffered small overall impacts in 2020 and are all expected to recover swiftly. More details on COVID-19 impacts per sector can be found in Chapter 4.
12 https://ec.europa.eu/info/sites/info/files/economy-finance/ip136_en_2.pdf13 https://ec.europa.eu/info/sites/info/files/economy-finance/ip136_en_2.pdf14 See “Investors and the blue economy”. Credit Suisse, January 2020:
https://www.credit-suisse.com/media/assets/microsite/docs/responsibleinvesting/spread-blue-economy-report.pdf
2.3. FINANCINGBlue Economy investment outlook
Different elements are currently affecting financing in the areas of sustainability, green and the Blue Economy. Firstly, investors need to be able to easily identify which economic activities are sustainable, including those that are ocean related. More clar-ity on this, with agreements in terms of principles, development of guidelines, taxonomies and best practices could help fill the information gap. The disclosure and reporting of investments in this area may also be vital as it displays the numerous invest-ment opportunities in the Blue Economy. Net investments in tan-gible goods were estimated at €13.9 billion in 2018, i.e. a 7.7% decrease compared to €15.1 billion in 2009, and -26.4 % com-pared to 2015 (€19 billion invested). However, recent investor surveys show that interest in sustainable Blue Economy invest-ments is high, and that the global Blue Economy is expected to expand at twice the rate of the mainstream economy by 203014. Secondly, many of the projects in the area of sustainability and Blue Economy are risky or require risk-bearing capacity from investors, as the returns on investments are long for many sec-tors. The development of a broader range of Blue Economy finan-cial instruments, with appropriate risk sharing mechanisms may contribute to the solution. It is therefore key to have the right institutional framework and financial instruments supporting the projects in this sector, including those that already enjoy higher returns on investment and growth, such as Blue biotechnology or that are resilient in times of crisis (e.g. fisheries and aquaculture). Thirdly, some fragmentation and trade-offs between different economic uses of marine areas and resources create additional risk in this sector. The good use of enabling frameworks such as Maritime Spatial Planning may contribute to reducing this risk by creating predictability, transparency and clearer rules.
The European Union has been at the forefront of efforts to build a financial system that supports sustainable growth. Sustainable finance aims at supporting economic growth, while taking due account of environmental (e.g. climate change mitigation, pollu-tion preventions), social (e.g. inequality, labour relations) and gov-ernance (e.g. transparency) considerations when making invest-ment decisions.
At the EU level, sustainable finance has a key role in delivering on the objectives of the EGD as well as in fulfilling the EU’s inter-national commitments on climate and sustainability objectives, by channelling public and private investment into the transition to a climate-neutral, environmental, resource-efficient and fair economy. The EU strategy on financing for sustainable growth aims at leading increased longer-term investments into sustain-able economic activities and projects. It also helps ensure that investments support a resilient economy and a sustainable recov-ery from the impacts of the COVID-19 pandemic. As part of the EGD, on January 2020, the European Commission presented the EGD investment plan, which is expected to mobilise at least €1 trillion of sustainable investments over the next decade (see 3.1).
7
2021
0% 5% 10% 15% 20% 25% 30% 35% 40% 45% 50%
Lack of investment-grade projects/firms at scale
Not enough internal expertise
Lack of definition
Not offerered by our asset managers
Asset owners Asset managers
It will enable a framework to facilitate public and private invest-ments needed for the transition to a climate-neutral, green, com-petitive and inclusive economy.
Reaching the current 2030 climate and energy targets alone requires additional investments of approximately €260 billion a year by 2030. The EU is contributing to this investment challenge via the European Fund for Strategic Investments (ESIF) and other initiatives. However, public sector funding alone does not suffice. The entire financial sector has a key role to play by:
• re-directing investments towards more sustainable technol-ogies and businesses;
• financing growth in a sustainable manner over the long term;• contributing to the creation of a low-carbon, climate resilient
and circular economy.
The European Commission has been developing a comprehensive policy agenda on sustainable finance since 2018, comprising the action plan on financing sustainable growth and the development of a renewed sustainable finance strategy in the framework of the EGD. It is also coordinating international efforts through its international platform on sustainable finance. In order to facilitate investment in what can be safely considered as "sustainable", the European Commission established a common classification sys-tem (“EU taxonomy”) for the identification of economic activities that make a substantive contribution to environmentally sustain-able objectives, do no significant harm to any other environmen-tal objectives, and meet minimum safeguards. The EU Taxonomy Regulation15 distinguishes six environmental objectives (climate change mitigation, climate change adaptation, sustainable use and protection of water and marine resources, transition to a circular economy, pollution prevention and control, and protec-tion and restoration of biodiversity and ecosystems). The man-datory reporting under the Taxonomy Regulation will apply from January 2022, for the climate change mitigation and adaptation objectives, and from January 2023, for the other four objectives.
15 Regulation (EU) 2020/852 of the European Parliament and of the Council of 18 June 2020 on the establishment of a framework to facilitate sustainable investment, and amending Regulation (EU) 2019/2088.
This policy is likely to drive more financial entities to increase investment in sustainability, including in Blue Economy projects, as from 2022.
The Recovery and Resilience Facility (RFF) will deploy 37% of its €672.5 billion funds to the green transition. This amount can be used, for example, to support reforms and investments in off-shore renewable energy under the ‘Power up' flagship initiative. However, funding under the RRF will need to be committed by the end of 2023. Additionally, the RRF can also support investments in port infrastructure (e.g. the provision of shore side electricity to vessels at berth) as well as grid connections and reforms needed to facilitate the deployment of offshore renewable energy and integration to energy systems (e.g. through streamlined permit-ting procedures, grids and maritime spatial planning and offshore renewable energy auctions).
Overview of current EU financing of the Blue economy
In 2020, the European Investment Fund (EIF) collaborated with the European Commission to launch the BlueInvest Fund initi-ative that will provide financing to underlying equity funds that strategically target and support the innovative Blue Economy. The BlueInvest Fund was structured under the European Fund for Strategic Investment (EFSI) Equity Product, the financial pillar of the Investment Plan for Europe, implemented by the EIF.
This initiative recognises the need for additional investment to address the challenges faced in relation to the sustainability and development of the Blue Economy and the necessary conserva-tion of oceans, coastlines and marine life. The EIF believes that Venture Capital and Private Equity funds will play a critical role in the years to come in backing sustainable technologies and innovation that will contribute to the preservation of our oceans, seas and coastlines, precious shared resources that constitute the backbone and mainstay of the Blue Economy, a strategic high value economic sector.
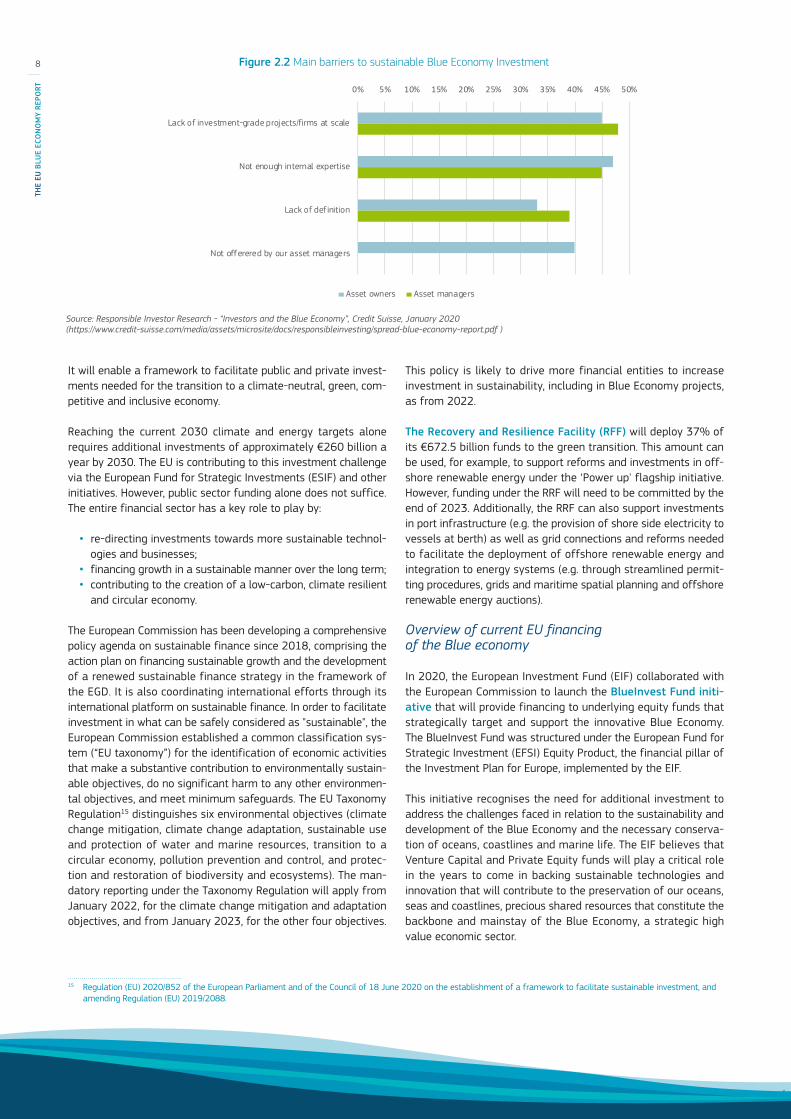
Figure 2.2 Main barriers to sustainable Blue Economy Investment
Source: Responsible Investor Research - “Investors and the Blue Economy”, Credit Suisse, January 2020 (https://www.credit-suisse.com/media/assets/microsite/docs/responsibleinvesting/spread-blue-economy-report.pdf )
8
THE
EU B
LUE
ECO
NO
MY
REPO
RT

To date, EIF successfully deployed the targets reserved for the Blue Economy ultimately surpassing the initial objective of €75 million. Four transactions amounting to €85 million (including EIF Own Resources) will be financed out of the BlueInvest pilot initi-ative, and a fifth of €15 million under InnovFin Equity16, bringing the total fund commitments approved or signed with a specific focus on the Blue Economy to almost €100 million. Based on these investments, the total expected amount of capital that will be mobilised by the funds into the Blue Economy is €300 million. With the signature of these five deals, the EIF expects to conclude the rollout of this initiative and pave the way for a scale up pro-gramme in the next Multi Financial Framework (MFF).
The EIF has deployed €45 million of the €75 million on this BlueInvest pilot initiative since its launch in 2020. Two new funds with established teams have received funding to-date, whose strategies encompass the agrifood tech industry including the Blue Economy, with an emphasis on food security, health and sustainability. These investments are set up to support start-ups developing innovative products, materials, and services that can contribute to enhance marine conservation and the sustainabil-ity of the Blue Economy. Three additional fund investments into specialised Blue Economy funds, and backed by BlueInvest and InnovFin Equity under H2020 finance, have already been approved and are expected to materialise during 2021.
To date, BlueInvest had 545 companies verifying their eligibility for the programme, 132 companies confirmed as beneficiaries and 73 companies that have already completed the programme (55% of the participants). About 75% of the companies partic-ipating in the program are either SMEs or start-ups of under 3 years, of which a quarter are in pre-commercial phase. Most of the companies are in the Blue energy sector (12%), followed by aquaculture and coastal and environment (both at 10%), and Blue biotechnology (8%) (Figure 2.3). In terms of MSs, France, the Netherlands, Ireland and Italy have the highest number of participating companies, accounting for close to 50% of the total.
16 InnovFin Equity programme is a financial product launched by the EC and the EIF in the framework of Horizon 2020. It provides equity investments and co-investments to or alongside investment funds, focusing on companies in their early stages of development, operating in innovative sectors covered by Horizon 2020 (InnovFin Equity (europa.eu).
17 All figures are unaudited and provisional.
The European Maritime and Fisheries Fund (EMFF) of the European Commission also supports the development of innova-tive services and technologies and awards grants to market- and investment-ready SMEs with innovative products, technologies and services for the Blue Economy through the BlueInvest grants. It aims to improve access to finance and investment readiness for start-ups, early-stage businesses and SMEs.
The BlueInvest platform is composed of an online community, investment readiness assistance for companies, investor engage-ment, events, an academy and a projects pipeline. Through the EMFF, the Commission funds an additional €40 million grant scheme, to help Blue Economy SMEs with developing and bring-ing new innovative and sustainable products, technologies and services to the market. In 2019, the €22.5 million BlueInvest call financed by the EMFF BlueInvest grants, saw 104 proposals sub-mitted, and 10 high-profile company projects retained for funding. In 2020, the overall budget of the BlueInvest call was €20 million.
2.3.1. THE EUROPEAN INVESTMENT BANK: SUPPORTING SUSTAINABLE BLUE ECONOMY ACTIVITIES17
The European Investment Bank Group (EIB Group) supports for sustainable Blue Economy needs to be seen in the context of its climate action ambition. As the lending arm of the European Union, the EIB is the biggest multilateral financial institution in the world and one of the largest providers of climate finance. In 2020, the EIB Group provided €24.2 billion to fight climate change, amounting to 37% of all its financing.
In 2020, the European Investment Bank Board of Directors, com-posed of representatives from the EU member states, approved the Climate Bank Roadmap (CBR). It sets out in detail how the EIB Group aims to support the objectives of the EGD and sustainable development outside the European Union.
Figure 2.3 Distribution of companies funded by BlueInvest per sector
Source: BlueInvest Readiness Assistance Finance needs
12%
10%
4%
4%
4%
4%5%
6%6%
7%
8%
7%
10%
5% Blue energyAquaculture
TransportShipbuildingOffshore oil and gas
Ocean waste managementFisheries
Marine servicesICT appl ied to maritimeOther
Blue biotechnologyKey enabling technologies
Coastal and environmental protectionCoastal and marine tourism
12%
10%
4%
4%
4%
4%5%
6%6%
7%
8%
7%
10%
5% Blue energyAquaculture
TransportShipbuildingOffshore oil and gas
Ocean waste managementFisheries
Marine servicesICT appl ied to maritimeOther
Blue biotechnologyKey enabling technologies
Coastal and environmental protectionCoastal and marine tourism
9
2021

The EIB Group offers loans, guarantees, equity investments and advisory services for a broad range of sustainable Blue Economy projects. The EIB has been financing projects in Blue Economy since its creation and has driven the expansion of emerging sec-tors. Considering the importance of and threats to the oceans, the EIB Group increased its support for activities and initiatives aimed at reducing pollution and addressing climate change, both from a mitigation and an adaptation perspective. This section outlines the EIB’s activities in selected sectors and under its flagship Blue Economy programmes.
Supporting climate action and environmental sustainability: The EIB Clean and Sustainable Ocean Programme
The EIB is stepping up its lending and advisory activities in support of oceans under the Clean and Sustainable Ocean Programme. This is the over-arching programme for the EIB’s current and future ocean-based initiatives and activities, which at present includes two main components, the Clean Oceans Initiative (COI) and the Blue Sustainable Ocean Strategy (Blue SOS). The EIB Clean and Sustainable Ocean Programme also involves strength-ening the EIB’s technical assistance and advisory services to make clean and sustainable ocean projects more attractive and scalable for economic development.
Under the COI, the EIB Group cooperates with the German Kreditanstalt für Wiederaufbau (KfW) Group, the Agence Française de Développement (AFD), the Italian Cassa Depositi e Prestiti and the Spanish Instituto de Crédito Oficial to reduce the discharge of plastics into the oceans. The founding partners of EIB, KfW and AFD are committed to providing €2 billion for COI projects in the 2018-2023 period, and had reached 65% of this target by 2020.
Blue SOS aims to improve the health of oceans, build stronger coastal environments and boost blue sustainable economic activ-ity. To achieve this, the EIB is committed to invest €2.5 billion over the period 2019-2023 to ocean projects in sustainable coastal development and protection, sustainable seafood production, green shipping and blue biotechnology.
Sustainable coastal protection: climate change creates the need for increased investments in coastal protection. Projects that protect coasts from flooding and erosion, rehabilitate degraded coasts, restore coral reefs and improve water quality are part of the Blue SOS. Under this strategy, during the last two years, the EIB has invested €260 million in support of two sustainable coastal protection projects including flood protection measures in Greece and coastal dune restoration in the Netherlands.
Sustainable seafood production: The EIB supports the sector mainly in cooperation with local banks and other institutions that offer special financing for SMEs. Over the last five years, the EIB provided financing for about €216 million in sustainable produc-tion of seafood in the EU, which includes fisheries, aquaculture and the processing and preserving of seafood.
18 EIB lending figures in the EU-27. Figures do not include some intermediated lending (e.g. through commercial banks) that is ultimately supporting offshore wind projects.
Green shipping: The EIB is a long-standing supporter of the ship-ping sector’s decarbonisation agenda, promoting investment in technologies that improve energy efficiency and reduce harm-ful emissions in the European shipping sector. Over the last five years, the Bank has invested in 11 shipping projects in the EU, lending approximately €715 million.
BOX 2.1. Marine and atmospheric climate change research, Greece Marine and atmospheric climate change research: The EIB signed a €58 million loan for a project aiming to improve the understanding of climate change, which is expected to identify mitigation and adaptation methods. The marine com-ponent will finance design and construction of a new ocean-ographic vessel by the Hellenic Centre for Marine Research. The new vessel will be able to explore both continental shal-low waters and the deep sea. Its construction is innovative. At 70 metres in length and 16 metres wide, it will carry sizeable multi-purpose laboratories and offer spacious open decks to allow for containers with mobile laboratories to be inter-changed. This will make the vessel a versatile platform, offer-ing the flexibility to conduct a wider range of scientific and other missions. The atmospheric component will support the establishment of the Panhellenic Geographical Observatory of Antikythera (PANGEA), a national research infrastructure for climate change.
Marine renewable energy projects
In 2019, the EIB approved a new energy lending policy and con-firmed its ambition to further accelerate clean energy innovation, energy efficiency and renewables. Over the last fifteen years, the offshore wind energy industry has matured significantly in the European Union. The EIB co-financed ca. one third of all offshore wind production in Europe. Since 2003, the EIB has financed 33 offshore wind and transmission projects in Belgium, Denmark, Germany, France, the Netherlands and Portugal for a total signed loan amount of more than €7.5 billion18. The Bank is also commit-ted to financing floating offshore wind and stands ready to sup-port the commercial demonstration of innovative wave and tidal technologies, which feature prominently in the EU SET Plan and the Ocean Energy Implementation plan. The sector has matured in the last years with many devices completing their offshore testing at commercial scale.
10
THE
EU B
LUE
ECO
NO
MY
REPO
RT

BOX 2.2. Floating offshore wind
Nearly 80% of the offshore wind resources are located in waters over 60 metres deep in European seas, where the cost of fixed-bottom structures is very high. Floating offshore platforms can be built and installed in most marine environ-ments. They are more environmentally friendly to sea life and have greater output due to stronger wind speeds. The devel-opment of floating offshore wind technologies will make it possible to take advantage of cost reduction techniques employed in the oil and gas sector. This, combined with the higher capacity factor achieved in deeper water locations, will lead to significant reductions in the cost of energy for floating offshore wind projects. The development of floating wind technologies enables access to offshore wind energy in markets where traditional fixed bottom is not feasible.
The EIB has granted €60 million loan to Windplus S.A. The company has built a first-of-its-kind offshore floating wind farm, using semisubmersible platforms located off the northern coast of Portugal. The facility comprises three wind turbines, mounted on floating platforms anchored to the seabed at a depth of 100 metres. The wind farm will have an installed capacity of 25MW, equivalent to the energy consumed by 60 000 homes over the course of a year. The new installation will contribute to the development, stand-ardisation and manufacturing improvement of multi-Mega-watt modular floating platforms, a key objective under the Strategic Energy Technology Plan (SET-Plan) Commission. The loan is supported by the EC through the Energy Demonstration Projects facility under InnovFin. The project will also receive funding from the EU’s NER300 programme and the Portuguese Carbon Fund.
The EIB is also supporting four demonstration projects. The projects utilise floating offshore wind technology located off the French coast and are supported by the French Agence de l'Environnement et de la Maîtrise de l'Énergie (ADEME). These projects are still at an early development stage.
BOX 2.3. Wave energy
With the upcoming Innovation Fund support, the sector can make the leap and enable the implementation of multi-Meg-awatt commercial projects. The EIB can support the deploy-ment of these technologies with technical, financial advisory and financing. It has invested up to €10 million in AW-Energy, a pioneering start-up company from Finland, which devel-oped “WaveRoller” wave energy technology. The investment supports the commercial rollout of European wave-energy technology. This is the first project supported by the InnovFin Energy Demonstration Project (EDP) programme. AW-Energy has developed a near-shore underwater device that con-verts wave energy into electrical power. In 2012, the com-pany installed three 100kW demonstration units connected to the grid near Peniche, Portugal. Its progressive approach has placed Peniche on the world map as one of the most interesting wave energy hubs, attracting many wave energy developers. AW-Energy planned to install a full-scale 350kW device in the same area of Portugal. The company has iden-tified commercial leads in six countries. The project is also financed by Tekes, the Finnish Funding Agency for Innovation. The Wave Energy Device project has the financial backing of the European Union under Horizon 2020.
2.3.2. THE EUROPEAN BANK FOR RECONSTRUCTION AND DEVELOPMENTOn 14 December 2020, the European Bank for Reconstruction and Development (EBRD) became a signatory to the Sustainable Blue Economy Finance Principles hosted by the UN's Environment Finance Initiative (UNEP FI). These are the golden standards for investing in a sustainable ocean economy and for supporting the implementation of the UN’s Sustainable Development Goal 14 (SDG 14) "Life Below Water". This is yet another milestone in the Bank’s mission to promote a sustainable blue future for the marine natural capital and to complement the ongoing work on sustainable use and protection of water and marine resources. All major sectors in which the Bank is already active have the potential to contribute to the Blue Economy: off-shore renewa-ble energy, decarbonised shipping, climate-resilient ports, marine non-living resources, circular economy and pollution prevention including plastics in manufacturing and services, and sustainable marine food production and processing.
The new EBRD Green Economy Transition (GET) approach high-lights a thematic area, focusing on natural capital and biodiversity management and protection, the development of nature-based solutions and the Blue Economy. Similar to the work on GET and climate risk, the one on Blue Economy may support the Bank’s contribution to the development of a Task Force on Nature-related Financial Risks (TNFD). This focus on biodiversity will lev-erage the Bank’s continued work with the International Maritime Organisation (IMO) on the issue of ballast water and invasive species. This partnership is being extended to marine biodiver-sity, marine litter and shipping decarbonisation under the recently launched FIN-SMART Roundtable.
11
2021

In the medium term, the above projects may provide an oppor-tunity to issue blue capital market products such as blue bonds. These have been attracting strong investor attention recently, with the World Bank supporting the Government of Seychelles trading the World’s first sovereign blue bond19 and the Nordic Investment Bank (NIB) launching a Baltic Blue Bond20. Additionally, the EBRD continues to support the private sector and to promote economic growth while preserving the natural environment. The Bank has long been promoting environmental remediation in the Baltic and Barents Seas through the Northern Dimension Environmental Partnership (NDEP). EBRD direct investments to date in these eco-nomic sectors amount to €6.7 billion (unlocking a total value of projects of over €19 billion) and are shared among Banks:
• Sustainable Infrastructure Group transactions in water and sewage systems of approximately €3.5 billion value; ports and harbour operations of circa €790 million; ship building and water transportation of approximately €1.7 billion and solid waste management about €426 million;
• ICA, Property and Tourism investments into projects in coastal areas of over €300 million in project finance and equity.
BOX 2.4. Cyprus FSRU21: supporting a green transitionThe provision of a loan of €80 million for the acquisition and construction of a Liquefied Natural Gas (LNG) Floating Storage and Regasification Unit (FSRU) and its related infra-structure in Vasilikos Bay, Cyprus.
It is expected to contribute to the Resilient and Green tran-sition impact qualities. The investment will introduce natural gas to Cyprus for the first time, hence reducing the coun-try's dependence on oil/petroleum products. The project is in line with the EBRD's GET approach and will contribute to the decarbonisation of Cyprus' electricity sector by switching electricity generation from fuel oil to natural gas, resulting in CO2 emission reductions.
Direct CO2 emissions of the Project are estimated to be between 15-20 ktCO2 eq per year, it will contribute to the reduction of CO2 emissions in power generation at a national level of over 25 ktCO2 eq p.a. post-investment by replacing the current use of heavy fuel and diesel oil, which produce high CO2 emissions.
19 https://www.worldbank.org/en/news/press-release/2018/10/29/seychelles-launches-worlds-first-sovereign-blue-bond 20 https://www.nib.int/who_we_are/news_and_media/news_press_releases/3170/nib_issues_first_nordic-baltic_blue_bond 21 https://www.ebrd.com/work-with-us/projects/psd/50634.html 22 https://helcom.fi/helcom-at-work/groups/helcom-vasab-maritime-spatial-planning-working-group/23 Directive 2014/89/EU
2.4. MARITIME SPATIAL PLANNING (MSP)A continuously developing policy area, Maritime Spatial Planning (MSP) is a process allocating areas for human activities, ensuring social, economic and environmental objectives are achieved in an efficient, safe and sustainable manner. The different uses of the marine space and resources include the installations for the production of energy, oil and gas exploration and exploitation, the extraction of raw materials, maritime shipping and fishing activi-ties, aquaculture installations, tourism, ecosystem and biodiversity conservation, and underwater cultural heritage.
This convergence of uses over the maritime space, as well as the cumulative pressures on coastal resources, requires an integrated planning and management approach. In this context, MSP is con-sidered an important tool for the sustainable development of Blue Economy activities, and for the restoration of Europe’s seas to environmental health.
MSP in the EU
The high interconnectivity of ocean spaces has driven the EU to promote cross-border cooperation for MSP among MSs to tackle common challenges. Developing a common vision for each sea basin will be the key to a sustainable Blue Economy. In the EU, such visions are being developed through the sea basin strategies (see section 7.1).
Some precedents of cross-border cooperation initiatives have already been proposed in the context of Regional Sea conven-tions and intergovernmental organisations such as the Helsinki Commission (HELCOM), the VASAB (Visions and Strategies Around the Baltic Sea), which already in 2010 established a joint MSP working group for developing coherence between MSPs of the Baltic Sea countries22. With the collaboration of Member State experts and to ensure a homogenised approach to MSP, an assessment tool is being developed to allow Member States and non-Member States to revise and monitor their MSP strategy.
The EU MSP Directive adopted in 201423, represents the first legal requirement for planning the sea space with a coordinated, inte-grated and transboundary approach, requiring Member States to elaborate plans for their jurisdictional waters. These must con-sider the following elements: stakeholder involvement, cross-bor-der cooperation, application of an ecosystem-based approach (using the best available data and sharing information), taking into account land-sea interaction, promoting the co-existence of activities and reviewing the plans at least every 10 years.
The plans map existing human activities in the corresponding marine and coastal waters and identify their most effective and sustainable future spatial development. EU Member States are required to ensure that they make use of the best available eco-nomic, social and environmental data. In order to support Member States in the implementation of the MSP Directive, the European
12
THE
EU B
LUE
ECO
NO
MY
REPO
RT
Commission set-up the EU MSP Platform in 2016. In addition, funding to support the elaboration of MSP and pilot projects is available from various sources such as the EMFF, Interregional projects and Horizon 2020. A Study on the economic impact of MSP24 indicated the potential generation of economic benefits, particularly observed in Belgium and Germany. MSP may promote economic growth by increasing production value and value added and by generating employment in the Blue Economy.
MSP at a global level
The impact of the EU is also present at a global level. There is a widely shared understanding that the global ocean governance frameworks need to be strengthened, that pressures on the ocean need to be reduced and that the world’s oceans must be used sus-tainably. International cooperation and common principles about the use of the marine environment is paramount given that 60% of the oceans lies beyond the borders of any national jurisdiction and is under shared responsibility.
MSP has a role to play in achieving the UN 2030 Agenda for Sustainable Development, in particular Sustainable Development Goal 14 (SDG 14) “Life below water”. This European Commission and UNESCO’s Intergovernmental Oceanographic Commission (IOC) adopted a Joint Roadmap to accelerate MSP processes worldwide in 201725. The roadmap signals the political commit-ment from both institutions, includes 10 actions to advance the implementation of MSP worldwide and sets out the following priorities26.
24 https://op.europa.eu/s/oU2s25 https://www.mspglobal2030.org/wp-content/uploads/2019/04/Joint_Roadmap_MSP.pdf26 https://www.mspglobal2030.org/msp-roadmap/27 Aynalem, Sintayehu & Kassegn, Berhanu & Sewnet, Tesfaye. (2016). Employment Opportunities and Challenges in Tourism and Hospitality Sectors. Journal of Tourism &
Hospitality. 05. 10.4172/2167-0269.1000257.28 Scholaert F. (2020). The blue economy: Overview and EU policy framework. European Parliamentary Research Service (EPRS), p. 22.29 Teh, L.C.L., and U.R. Sumaila. 2013. “Contribution of Marine Fisheries to Worldwide Employment.” Fish and Fisheries 14 (1): 77–88. doi:10.1111/j.1467-2979.2011.00450.x.30 Union for the Mediterranean. Towards a Sustainable Blue Economy in the Mediterranean region. 2021 Edition, p. 8.
2.5. INDIRECT EMPLOYMENT AND ACTIVITYBlue Economy development does not only create opportunities in terms of employment in respective sectors but also has impli-cations for employment in coastal regions and for the EU as a whole. Sectors such as Coastal tourism, Shipbuilding or Marine liv-ing resources create employment that is not entirely captured by the statistics and figures available for the Blue Economy sectors.
This section aims to explore the various spill-over effects and to illustrate the supply chain to providing Blue Economy-related services and resources.
The term indirect employment refers to employment that is gener-ated in businesses that supply products and services to the entire Blue Economy sectors. This section serves as a topical explora-tion of how indirect employment manifests associated with the several sub-sectors. Induced employment refers to employment that is created through the presence of workers and is driven by the spending behaviour in the respective area. All of these components combined constitute the multiplier effect; maximis-ing economic output through the interconnectivity of businesses in regions. This holds particularly true for Coastal tourism, the largest sector in the Blue Economy.
Direct employment is created in the realms of commodities (e.g. accommodation, transportation, entertainment, attractions) but also in terms of food, beverage, and retail as well as business services that specifically cater to tourists. Touristic areas fre-quently collect a tourist tax, which reinforces investments of the local governments/destination marketing organisations to increase liveability but also invest in local facilities. Moreover, not only is tourist spending on local businesses decisive in economic activity in touristic destinations, but as mentioned above, so is the spend-ing of employees who cater to tourists. This so-called induced contribution consisting of spending of direct and indirect employ-ees ranges from food and beverages to recreation, clothing and household goods but also to the housing market27.
Directly or indirectly, EU seaports support about 2.5 million jobs, of which the Blue Economy employs more than half a million people (14% of jobs in the established sectors). Ports generate employment and economic benefits, all the more if they become home to maritime clusters, typically bringing together port and logistics, shipping and maritime services, etc.28. As regards fisher-ies, it has been estimated that formal and informal (i.e. artisanal) fisheries employment amounts to 237 million FTEs globally29. In the Mediterranean alone, fisheries support approximately 200 000 direct and 500 000 indirect jobs30. This phenomenon can also be observed in other Blue Economy sectors such as Shipbuilding.
13
2021
To illustrate this, a closer look is taken at the Meyer Werft31, an inland shipyard located in North-West Germany specifically catering to the cruise tourism industry. As many other industries, the shipbuilding sector is suffering from the COVID-19 crisis – before the pandemic, the cruise sector booked an annual growth of 8%. The crisis reversed this trend with revenues in the overall cruise tourism sector dropping by 97%. Clearly, Meyer Werft is also affected by this development, deeming 2020 the company’s ‘most severe crisis since WWII’32.
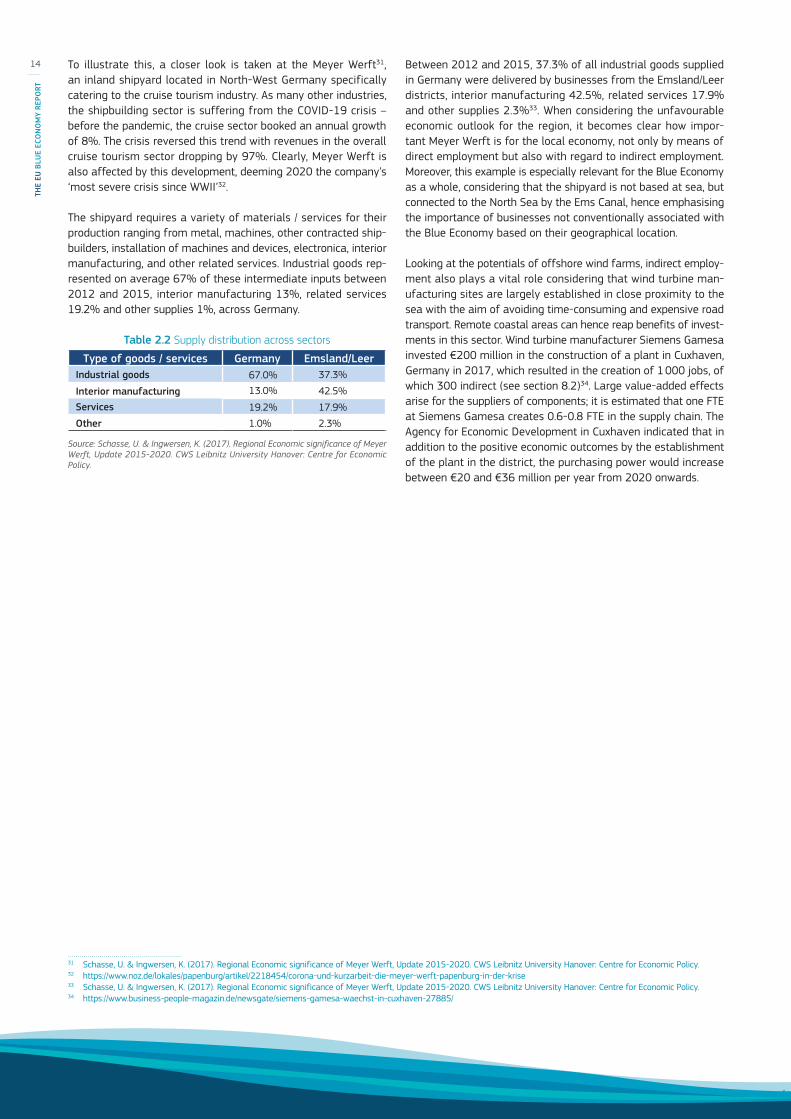
The shipyard requires a variety of materials / services for their production ranging from metal, machines, other contracted ship-builders, installation of machines and devices, electronica, interior manufacturing, and other related services. Industrial goods rep-resented on average 67% of these intermediate inputs between 2012 and 2015, interior manufacturing 13%, related services 19.2% and other supplies 1%, across Germany.
Table 2.2 Supply distribution across sectors
Type of goods / services Germany Emsland/LeerIndustrial goods 67.0% 37.3%
Interior manufacturing 13.0% 42.5%
Services 19.2% 17.9%
Other 1.0% 2.3%
Source: Schasse, U. & Ingwersen, K. (2017). Regional Economic significance of Meyer Werft, Update 2015-2020. CWS Leibnitz University Hanover: Centre for Economic Policy.
31 Schasse, U. & Ingwersen, K. (2017). Regional Economic significance of Meyer Werft, Update 2015-2020. CWS Leibnitz University Hanover: Centre for Economic Policy.32 https://www.noz.de/lokales/papenburg/artikel/2218454/corona-und-kurzarbeit-die-meyer-werft-papenburg-in-der-krise33 Schasse, U. & Ingwersen, K. (2017). Regional Economic significance of Meyer Werft, Update 2015-2020. CWS Leibnitz University Hanover: Centre for Economic Policy.34 https://www.business-people-magazin.de/newsgate/siemens-gamesa-waechst-in-cuxhaven-27885/
Between 2012 and 2015, 37.3% of all industrial goods supplied in Germany were delivered by businesses from the Emsland/Leer districts, interior manufacturing 42.5%, related services 17.9% and other supplies 2.3%33. When considering the unfavourable economic outlook for the region, it becomes clear how impor-tant Meyer Werft is for the local economy, not only by means of direct employment but also with regard to indirect employment. Moreover, this example is especially relevant for the Blue Economy as a whole, considering that the shipyard is not based at sea, but connected to the North Sea by the Ems Canal, hence emphasising the importance of businesses not conventionally associated with the Blue Economy based on their geographical location.
Looking at the potentials of offshore wind farms, indirect employ-ment also plays a vital role considering that wind turbine man-ufacturing sites are largely established in close proximity to the sea with the aim of avoiding time-consuming and expensive road transport. Remote coastal areas can hence reap benefits of invest-ments in this sector. Wind turbine manufacturer Siemens Gamesa invested €200 million in the construction of a plant in Cuxhaven, Germany in 2017, which resulted in the creation of 1 000 jobs, of which 300 indirect (see section 8.2)34. Large value-added effects arise for the suppliers of components; it is estimated that one FTE at Siemens Gamesa creates 0.6-0.8 FTE in the supply chain. The Agency for Economic Development in Cuxhaven indicated that in addition to the positive economic outcomes by the establishment of the plant in the district, the purchasing power would increase between €20 and €36 million per year from 2020 onwards.
14
THE
EU B
LUE
ECO
NO
MY
REPO
RT

BOX 2.5. Indirect employment of the Blue Economy in Estonia and Finland
A recent study has compared the job creation effects of blue economy industries in Estonia and Finland35. The Input-Output (I-O) methodology was used to assess the aggregated effects of backward and forward linkages of the blue industry on the two national economies. To calculate these effects, it used OECD IOTs data covering the period 1995–2011.
The findings of the study show that blue industry sectors play an important role in the economies of the maritime regions of the two countries, and contribute significantly to the national economic growth and employment. According to the study, “Transport and storage” is the sector in Estonia with the highest employment multiplier (ranging between 2.11 and 2.94). This means that 2–3 individuals are additionally employed in Estonia for every 100.000 euros investment in the Transport and storage sector. By contrast, “Hotels and restaurants” has the lowest multiplier (from 1.41 to 1.92). In Finland, “Coke, refined petroleum products and nuclear fuel” registered the largest employment multiplier (ranging between 7.99 and 12.99). While “Agriculture, hunting, forestry and fishing” has the lowest multiplier (from 1.37 to 1.67).
The study compares eight blue economy sectors in the two countries, distinguishing between Type 1 and Type 2 multipliers. On average, the multipliers range between 1.76 and 2.49 in Estonia, and between 2.52 and 3.95 in Finland. The results are illustrated in Figure 2.4.
What the study does not specify is the portion of these indirect jobs that can be considered “green”. According to Taylor et al. 201736, it can be assumed that most of the jobs created in the “Mining and quarrying” sector cannot be defined as such. Same applies to other fossil fuel extractive activities. More clarity on this matter will hopefully be made by the upcoming Delegated Act on the sustainable use and protection of water and marine resources under the Taxonomy Regulation37.
Furthermore, the study reveals that blue economy industries produce limited negative externalities on the overall economy, as testified by the weak backward and forward linkages. By contrast, the blue economy industries are not particularly vulnerable to shocks affecting the national economy. These findings suggest that blue industries are relatively independent within national economies having a remarkable role in socio-economic development of maritime regions, and thereby, create good preconditions for the stable development of cross-border cooperation between the maritime regions of both countries.
35 Ashyrov, G., Paas, T., & Tverdostup, M. (2018). The Input-Output Analysis of Blue Industries: Comparative Study of Estonia and Finland. University of Tartu, Working Paper.36 aylor S. et al. (2017). Eunomia. Green Jobs in the Blue Economy – A Bottom-up Approach. No 11.066100/2015/716324/SFRA/ENV.C2. Final Report to DG Environment of the
European Commission.37 https://ec.europa.eu/info/business-economy-euro/banking-and-finance/sustainable-finance/eu-taxonomy-sustainable-activities_en
1,64
1,47 1,
99
1,82 2,03
1,61
1,41
2,11
2,12 2,23
2,83
2,79
2,82
2,24
1,92
2,94
1,37
2,28
7,99
1,81
1,54 1,90
1,44 1,
86
1,67
3,59
12,99
2,86
2,47 2,
98
2,03
2,99
I I I I I I I V V VI VI I VI I I
ESTONIA Type 1
ESTONIA Type 2
FINLAND Type 1
FINLAND Type 2
Figure 2.4 Output Multipliers for the economies of Estonia and Finland, 2011.
Source: Ashyrov, G., Paas, T., & Tverdostup, M. (2018). The Input-Output Analysis of Blue Industries: Comparative Study of Estonia and Finland. University of Tartu, Working Paper. P. 16. Note: Sectors: (i) Agriculture, hunting, forestry and fishing; (ii) Mining and quarrying; (iii) Coke, refined petroleum products and nuclear fuel; (iv) Motor vehicles, trailers and semi-trailers; (v) Other transport equipment; (vi) Construction; (vii) Hotels and restaurants; (viii) Transport and storage. Source: authors calculations based on OECD I-O data 2011.
15
2021

2.6. OVERVIEW OF THE EU ESTABLISHED SECTORSIntroduction
The established sectors continue to be a major contributor to the EU Blue Economy, and it is in these sectors where more complete, accurate and comparable data are available.
The seven established sectors considered in this report are Marine living resources, Marine non-living resources, Marine renewable energy, Port activities, Shipbuilding and repair, Maritime transport and Coastal tourism. Each sector is further divided into subsectors as summarised in Table 2.3. The details of what is included in each sector and subsector are explained in Annex 3.1.
Table 2.3 The Established Blue Economy sectors and their subsectors
Sector Sub-sector
Marine living resourcesPrimary productionProcessing of fish productsDistribution of fish products
Marine non-living resourcesOil and gasOther minerals
Marine renewable energy Offshore wind energy
Port activitiesCargo and warehousingPort and water projects
Shipbuilding and repairShipbuildingEquipment and machinery
Maritime transportPassenger transportFreight transportServices for transport
Coastal tourismAccommodationTransportOther expenditure
38 Capture fisheries and aquaculture.39 For details on the compilation of data for Coastal tourism see the methodological annex.
This section provides a summary of the main economic data as well as the trends and the drivers behind these for each of the established sectors, and how they interact with each other. DCF data are used for the primary sector38 activities in the Marine living resources sector while for the rest of sectors, Eurostat Structural Business Statistics (SBS) data are used. In addition, data from the Tourism expenditure survey and from the EU Tourism Satellite Account were used for the Coastal tourism sector39.
The time series goes from 2009 to 2018. In this edition, the 2018 data is final while in the previous edition, it was still provi-sional and estimated data. Hence, the data presented here super-sede data presented in previous reports which may be different because of improvements in the methodology, revisions of the data or corrections of errors. Unfortunately, at the time of the elaboration of this report, Eurostat has not yet published the 2019 data. Other differences may stem from updates and revisions in the methodology and/or data (see Methodology section in Annex 3 for more details).
This section provides an overview of the main economic indicators of the established sectors from an aggregated EU perspective. A detailed analysis for each of the sectors is presented in Chapter 4.
Although only the direct contribution of the Blue Economy sectors is considered here, all sectors have indirect and induced effects on the rest of the economy. For example, in Shipbuilding and repair, most of the value added is from upstream and downstream activities. This means that beyond its specific contribution, it has important multiplier effects on income and jobs in many sectors of the economy.
Figure 2.5 Size of the EU Blue Economy, € billion
Source: Eurostat (SBS), DCF and Commission Services.
0
20
40
60
80
100
120
140
160
180
200
2009 2010 2011 2012 2013 2014 2015 2016 2017 2018
Milliers
GVA
0
10
20
30
40
50
60
70
80
2009 2010 2011 2012 2013 2014 2015 2016 2017 2018
Milliers
Gross operating surplus
16
THE
EU B
LUE
ECO
NO
MY
REPO
RT
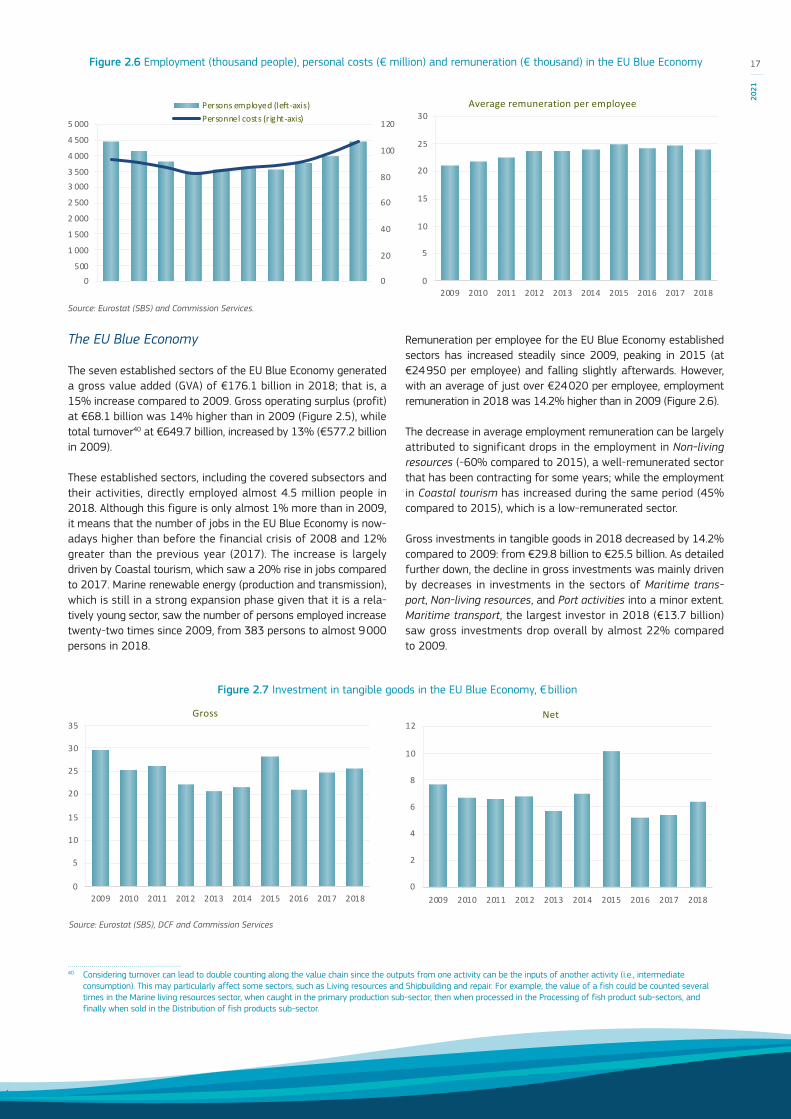
The EU Blue Economy
The seven established sectors of the EU Blue Economy generated a gross value added (GVA) of €176.1 billion in 2018; that is, a 15% increase compared to 2009. Gross operating surplus (profit) at €68.1 billion was 14% higher than in 2009 (Figure 2.5), while total turnover40 at €649.7 billion, increased by 13% (€577.2 billion in 2009).
These established sectors, including the covered subsectors and their activities, directly employed almost 4.5 million people in 2018. Although this figure is only almost 1% more than in 2009, it means that the number of jobs in the EU Blue Economy is now-adays higher than before the financial crisis of 2008 and 12% greater than the previous year (2017). The increase is largely driven by Coastal tourism, which saw a 20% rise in jobs compared to 2017. Marine renewable energy (production and transmission), which is still in a strong expansion phase given that it is a rela-tively young sector, saw the number of persons employed increase twenty-two times since 2009, from 383 persons to almost 9 000 persons in 2018.
40 Considering turnover can lead to double counting along the value chain since the outputs from one activity can be the inputs of another activity (i.e., intermediate consumption). This may particularly affect some sectors, such as Living resources and Shipbuilding and repair. For example, the value of a fish could be counted several times in the Marine living resources sector, when caught in the primary production sub-sector, then when processed in the Processing of fish product sub-sectors, and finally when sold in the Distribution of fish products sub-sector.
Remuneration per employee for the EU Blue Economy established sectors has increased steadily since 2009, peaking in 2015 (at €24 950 per employee) and falling slightly afterwards. However, with an average of just over €24 020 per employee, employment remuneration in 2018 was 14.2% higher than in 2009 (Figure 2.6).
The decrease in average employment remuneration can be largely attributed to significant drops in the employment in Non-living resources (-60% compared to 2015), a well-remunerated sector that has been contracting for some years; while the employment in Coastal tourism has increased during the same period (45% compared to 2015), which is a low-remunerated sector.
Gross investments in tangible goods in 2018 decreased by 14.2% compared to 2009: from €29.8 billion to €25.5 billion. As detailed further down, the decline in gross investments was mainly driven by decreases in investments in the sectors of Maritime trans-port, Non-living resources, and Port activities into a minor extent. Maritime transport, the largest investor in 2018 (€13.7 billion) saw gross investments drop overall by almost 22% compared to 2009.
0
20
40
60
80
100
120
0500
1 000
1 500
2 000
2 500
3 0003 500
4 000
4 500
5 000
Persons employed (left-axis)Personnel costs (right-axis)
0
5
10
15
20
25
30
2009 2010 2011 2012 2013 2014 2015 2016 2017 2018
Average remuneration per employee
Figure 2.7 Investment in tangible goods in the EU Blue Economy, € billion
Source: Eurostat (SBS), DCF and Commission Services
Figure 2.6 Employment (thousand people), personal costs (€ million) and remuneration (€ thousand) in the EU Blue Economy
Source: Eurostat (SBS) and Commission Services.
0
5
10
15
20
25
30
35
2009 2010 2011 2012 2013 2014 2015 2016 2017 2018
Gross
0
2
4
6
8
10
12
2009 2010 2011 2012 2013 2014 2015 2016 2017 2018
Net
17
2021
Shipbuilding and repair reported a positive trend with overall gross investments increasing an 8.6% compared to 2009; while gross investments in Living resources increased by 12.6%. Yet, their con-tribution to the Blue Economy investments is still small compared to sectors with decreasing investments.
Net investments in tangible goods41, estimated at €6.4 billion in 2018, also decreased (-16.9%) compared to €7.7 billion in 2009, and -37.1% compared to 2015 (€10.2 billion invested) (Figure 2.7). Despite this decrease, net investments remained positive, signalling a replacement and expansion of capital. The net invest-ment ratio (net investment to GVA) declined, ranging from 5% in 2009 to 3.6% in 2018, peaking in 2015 at 6.7%.
Main features of the EU established sectors
The EU Shipbuilding and repair industry is an innovative, dynamic and competitive sector. The EU is a major player in the global ship-building industry, with its 300 shipyards mainly specialised in the most complex and technologically advanced civilian and naval ships, platforms and other hardware for maritime applications such as cruise ships, offshore support vessels, fishing, ferries, research ves-sels, dredgers and mega-yachts. The implementation of the forth-coming global and European regulation on ballast water, and sulphur and nitrogen oxide emissions, as well as actions on climate change, offer market opportunities for the European maritime equipment suppliers and shipyards. Nevertheless, EU shipbuilding continues to face fierce international competition from countries like China and South Korea.
Maritime transport plays a key role in the EU economy and trade, accounting almost 80% of the worldwide goods transportation. It keeps many economies afloat, by playing a key role in the global supply chain. Moreover, almost 420 million passengers aboard cruises and ferries embarked and disembarked in EU ports in 2018. In 2018, the total weight of goods transported to and from the main EU ports by short sea shipping, which excludes moving cargo across oceans, was 1.8 billion tonnes.
However, the COVID-19 crisis had a severe impact in the ship-ping industry, since over the last year, it disrupted the maritime sector at an exceptional scale. Passenger and cargo sea trans-port were severely hit by drop in volumes and reduced demand. Ferry services and cruise shipping were strongly affected by bor-der closings and national lockdowns. However, container shipping managed to quickly recover by withdrawing shipping capacity and price increasing.
The Commission has been active in not only protecting the econ-omies and societies, especially because of the pandemic, but also in addressing challenges posed by the green and digital tran-sitions., in line with the objectives of the EGD and the recently adopted Sustainable and Smart Mobility Strategy (SSMS).
While shipping is the most carbon-efficient mode of transport per tonne/kilometre, it produces more than 2% of annual global greenhouse gas emissions. In this context, the Commission is pav-ing the way to decarbonisation in the maritime transport, by intro-ducing specific measures, aiming at facilitating the transition to the new sustainable era. Some of the measures worth mentioning
41 These figures exclude Maritime transport, Cargo and warehousing, Service activities incidental to water transportation and Coastal tourism due to the lack of data.
are the inclusion of the EU ETS in the maritime sector, the reduc-tion of ports pollution and the increase of the alternative fuels’ use in the shipping sector.
The main developments in Maritime transport in recent years are related to the continuous increase in ship sizes for all segments (e.g. tankers and container carriers, but also cruises), which have significantly affected Shipbuilding and repair and Port activities. The sector was particularly affected by the last global financial crisis, but had recovered to pre-crisis levels in terms of GVA and employment, since 2017.
Port activities continue to play a key role in trade, economic development and job creation. Seaports, as multi-activity trans-port and logistic nodes, play a crucial role in the development of maritime sectors. Many ports across the EU are reducing their environmental impact to port cities and coastal areas while also enabling green shipping fleets. Recently ports are developing into clean energy hubs for integrated electricity systems, hydrogen and other low-carbon fuels, and testbeds for waste reuse and the circular economy. These activities will have an important role in reaching the objectives of the EGD. The trend towards larger ships lead, to lower average transport costs; however, they also require new port infrastructure and impact competition between port authorities and port operators.
The exploitation of Europe’s seas and oceans for Marine non-liv-ing resources has increased over the last decade and is projected to continue growing. However, the offshore Oil and gas sector has been in decline for some years. This is in great part due to the Italian moratorium on offshore oil and gas exploration permits, as well as a sharp increase in fees payable on upstream concessions aiming at prioritise renewable energy developments and move towards decarbonisation. In early 2020, oil prices collapsed due to market concerns and the fall in economic activity following the COVID-19 pandemic. Although fuel prices have somewhat recov-ered, they are currently still below pre-COVID levels.
Conversely, the demand for Other minerals such as sand and gravel, used for construction purposes and for producing concrete, is likely to increase. Moreover, as coastal communities attempt to adapt to new pressures posed by climate change, dredging, beach nourishment and sand reclamation may intensify. Trade-offs with environmental protection will have to be taken into account.
The Marine Renewable energy (production and transmission) sec-tor, is growing exponentially, albeit still encountering challenges. For instance, land-based wind farms are developing faster than their maritime counterparts as they tend to have lower installation and maintenance costs. Wind energy production continues to be cheaper on land, making competition tough for developing off-shore activities, particularly in view of low energy prices. The lack of electrical connections (cables/grids) is also a substantial barrier to the development of offshore wind farms, adding to investment costs. Europe has more than 90% of the world’s total installed offshore wind capacity, and will continue to dominate the offshore wind market for years to come. Offshore wind in Europe is focused mainly on the North Sea, which has relatively shallow waters.
18
THE
EU B
LUE
ECO
NO
MY
REPO
RT

Coastal tourism plays an important role in many EU Member State economies, with a wide ranging impact on economic growth, employment and social development. In 2018, just over half of the EU’s tourist accommodation establishments were located in coastal areas. Visitors to coastal areas were generally higher in southern EU Member States. Coastal communities, mainly com-posed of SMEs and micro-enterprises, are particularly vulnerable to economic, financial and political changes. While tourism was expected to continue its growing trend after 2018, the COVID-19 pandemic has put the tourism industry under unprecedented pressure. Travel restrictions imposed by MSs and the closure of businesses (such as restaurants, hotels and shops) bookings saw a sharp decrease. Whilst the European Commission and national governments are implementing measures in an attempt to miti-gate the effects, the prolonged COVID-19 crisis has continued to severely impact the sector (see section 4.7.4).
The Marine living resources sector encompasses the harvest-ing of renewable biological resources (Primary sector), their Processing and their Distribution. Capture fisheries production has increased and may have the capacity to do so further, in part due to the improved status of fish stocks and increased fishing opportunities, together with higher average market prices and reduced operating costs. The economic performance is expected to continue to improve as fish stocks recover and capacity contin-ues to adapt. However, these benefits have not yet been achieved in the Mediterranean Sea basin where most fisheries have not yet moved towards sustainable fishing conditions. EU Aquaculture production in weight has stagnated over the last decades even if its value has increased.
EU production (from capture fisheries and aquaculture) covers about 30% of the total raw material requirements for the EU
Processing of fish products. The processing sector is therefore dependent on global fish markets. The Distribution of fish products is increasingly concentrated in the hands of a few players. Adding value can enable producers to recover part of the value of the product, which is usually generated further down the chain.
Evolution and comparison across EU established sectors
GVA data show an acceleration in the growth of all sectors from 2013 onwards except for Non-living resources (Table 2.4 and Figure 2.8). The GVA generated by Coastal tourism in 2018, the largest Blue Economy sector in the EU, increased by 20.6% com-pared to 2009. Maritime transport and Port activities, increased by 12% and 14.5%, respectively. Other sectors that contributed to growth were Living resources (+29%) and Shipbuilding and repair (+30%). On the other hand, Non-living resources dropped by 62%.
Employment is recovering since 2013. With respect to 2009, over-all 2018 figures are very similar. The highest relative expansion was observed, in Maritime transport. In Shipbuilding and repair as well as in Living resources, employment has grown with respect to the minimum observed in 2013-2014, but it has not yet recov-ered to 2009 levels. In Non-living resources, a significant declining trend is seen.
The sectors are also very different in their capital intensity. This is the case, for instance, for Coastal tourism compared to the Non-living resources. Coastal tourism is labour-intensive, and often run by small or medium-sized local or family businesses; it is widespread along the entire EU coastline. This is reflected in the sector making the greatest contribution to the EU Blue Economy in
Table 2.4 Overview of the EU Blue Economy by sector
Source: Eurostat (SBS), DCF and Commission Services.
Persons employed (thousand) 2009 2010 2011 2012 2013 2014 2015 2016 2017 2018
Living resources 555.0 553.4 534.5 535.2 519.2 517.0 520.1 528.2 526.4 538.4
Non-living resources 34.4 31.6 29.8 30.4 27.7 28.1 27.5 17.9 12.5 11.1
Ocean energy 0.4 0.6 1.0 1.1 1.3 1.9 4.4 5.7 7.8 9.0
Port activities 380.5 371.5 358.5 366.4 362.6 402.9 412.9 417.1 413.9 384.0
Shipbuilding and repair 306.8 274.7 263.4 255.5 256.6 258.8 263.9 269.1 274.5 292.0
Maritime transport 357.0 354.0 362.6 355.8 355.9 375.4 382.6 367.0 384.0 397.6
Coastal tourism 2,817.5 2,596.5 2,286.2 1,939.9 2,035.1 2,031.1 1,962.9 2,190.3 2,369.5 2,843.1
Blue economy jobs 4,451.6 4,182.3 3,836.1 3,484.2 3,558.4 3,615.3 3,574.3 3,795.4 3,988.6 4,475.1
National employment 186,949 184,252 184,161 183,251 182,423 183,866 185,765 188,480 191,126 193,183
Blue economy (% of national jobs) 2.4% 2.3% 2.1% 1.9% 2.0% 2.0% 1.9% 2.0% 2.1% 2.3%
GVA ( € million) 2009 2010 2011 2012 2013 2014 2015 2016 2017 2018
Living resources 14,756 15,242 15,807 15,876 15,431 15,872 16,851 18,128 18,344 19,100
Non-living resources 11,190 11,325 11,935 11,237 9,684 8,215 8,422 4,688 3,911 4,243
Ocean energy 41 115 179 205 325 437 798 1,103 1,432 1,495
Port activities 23,126 23,305 26,799 23,886 24,175 25,355 26,348 27,116 27,349 26,481
Shipbuilding and repair 11,263 11,814 11,747 10,910 11,060 11,606 11,250 12,385 13,515 14,654
Maritime transport 26,876 29,966 27,070 27,382 29,011 28,695 32,433 27,040 31,130 30,047
Coastal tourism 66,392 64,719 58,886 50,924 54,713 54,175 56,033 60,353 68,783 80,049 Blue economy GVA 153,643 156,487 152,424 140,421 144,398 144,354 152,135 150,813 164,463 176,067
National GVA 9,532,263 9,848,639 10,145,776 10,205,623 10,320,481 10,555,602 10,936,678 11,231,243 11,664,797 12,046,015
Blue economy (% of national GVA) 1.6% 1.6% 1.5% 1.4% 1.4% 1.4% 1.4% 1.3% 1.4% 1.5%
19
2021
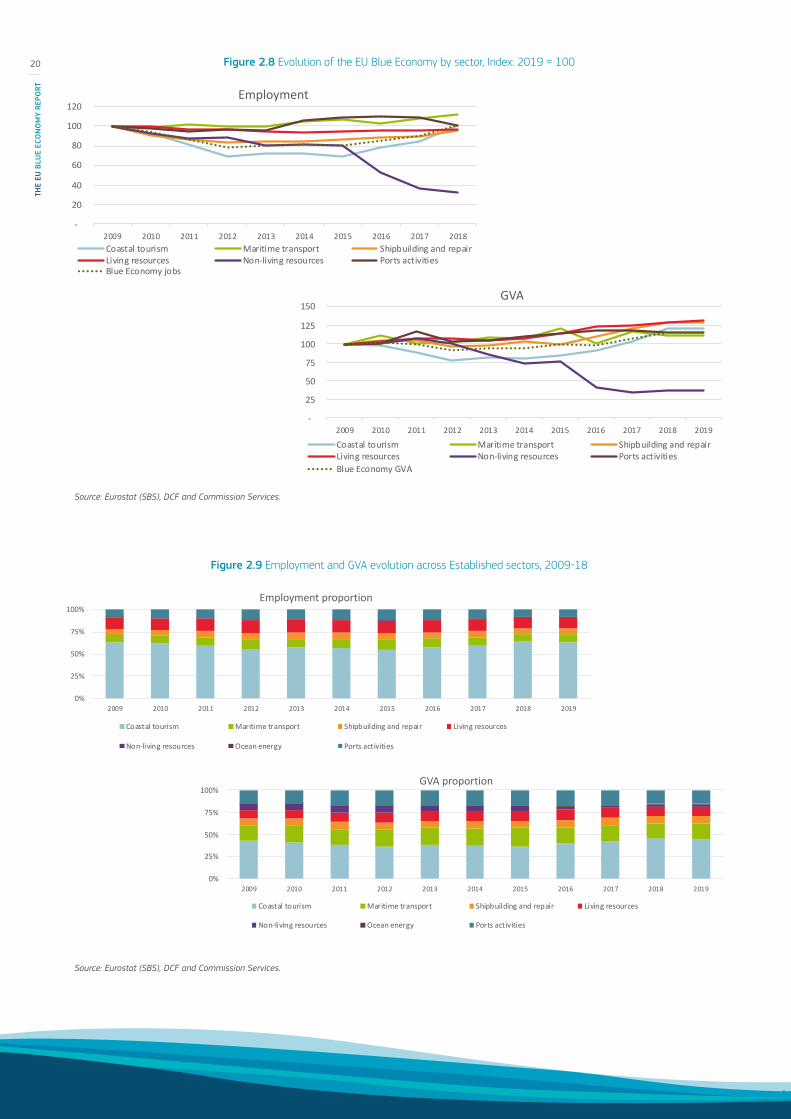
Figure 2.9 Employment and GVA evolution across Established sectors, 2009-18
Source: Eurostat (SBS), DCF and Commission Services.
Figure 2.8 Evolution of the EU Blue Economy by sector, Index: 2019 = 100
Source: Eurostat (SBS), DCF and Commission Services.
-
20
40
60
80
100
120
2009 2010 2011 2012 2013 2014 2015 2016 2017 2018
Employment
Coastal tourism Maritime transport Shipbuilding and repairLiving resources Non-living resources Ports activitiesBlue Economy jobs
-
25
50
75
100
125
150
2009 2010 2011 2012 2013 2014 2015 2016 2017 2018 2019
GVA
Coastal tourism Maritime transport Shipbuilding and repairLiving resources Non-living resources Ports activitiesBlue Economy GVA
0%
25%
50%
75%
100%
2009 2010 2011 2012 2013 2014 2015 2016 2017 2018 2019
GVA proportion
Coastal tourism Maritime transport Shipbuilding and repair Living resources
Non-living resources Ocean energy Ports activities
0%
25%
50%
75%
100%
2009 2010 2011 2012 2013 2014 2015 2016 2017 2018 2019
Employment proportion
Coastal tourism Maritime transport Shipbuilding and repair Living resources
Non-living resources Ocean energy Ports activities
20
THE
EU B
LUE
ECO
NO
MY
REPO
RT

terms of employment and gross value added (Figure 2.9) and with its share increasing over time. However, the sector’s contribution to GVA and profits are substantially lower than to employment.
Within Non-living resources, the Oil and gas subsector is a highly cap-italised industry that requires few employees per unit of output and is concentrated in a few geographical areas. The industry is generally comprised of large companies, which might have fewer direct links to local coastal communities. Consequently, this sector accounts for only a tiny fraction of employment (under 1% in 2018) but a substantial part of overall Blue Economy-related profits.
The Blue Economy established sectors across Member States
In 2018, the contribution of the established Blue Economy sec-tors to the overall EU economy was 2.3% in terms of employ-ment (down slightly from 2.4% in 2009) and 1.5% in terms of GVA (down from 1.6% in 2009). The contribution varies widely across Member States. In terms of employment, shares range
from 15% in Greece to less than 0.1% in Luxembourg and in GVA, from 8% in Croatia to less than 0.1% in Luxembourg (Figure 2.10).
In general, the Blue Economy exceeds 5% of the national GVA or employment in the insular Member States or those with archi-pelagos: Greece, Croatia, Malta, Cyprus and Portugal. Estonia is an exception with an employment share of 7%. Other Member States with relatively large Blue Economy sectors (contribution between 3% and 5% of the national GVA or employment) include Spain, Latvia, Denmark, Bulgaria and Ireland. For self-evident reasons, the Blue Economy’s contribution to the national econ-omy is very limited (below 0.4%) in landlocked Member States (Luxembourg, Austria, Czechia, Slovakia and Hungary). Other Member States with a relatively modest Blue Economy (between 0.5% and 1.0% of the national economy) include Belgium, Slovenia and Romania. Two of the four largest EU economies (Germany and France) are below the EU average, Italy is slightly above the average and only Spain is well above average (Figure 2.10).
0%
1%
2%
3%
4%
5%
6%
7%
8%
9%
HR MT CY EL EE DK PT ES LV BG NL LT IT FI SE FR BE IE DE SI PL HU RO SK CZ AT LU
2009 2018
0%
2%
4%
6%
8%
10%
12%
14%
16%
EL MT CY HR EE PT ES LV DK BG IE SE IT FI NL LT FR DE PL SI BE RO HU SK CZ AT LU
2009 2018
Figure 2.10 Relative size of the Blue Economy, percentage
Share of Blue jobs in national employment
Share of Blue GVA in the national economy
Source: Eurostat (SBS), DCF and Commission Services.
21
2021
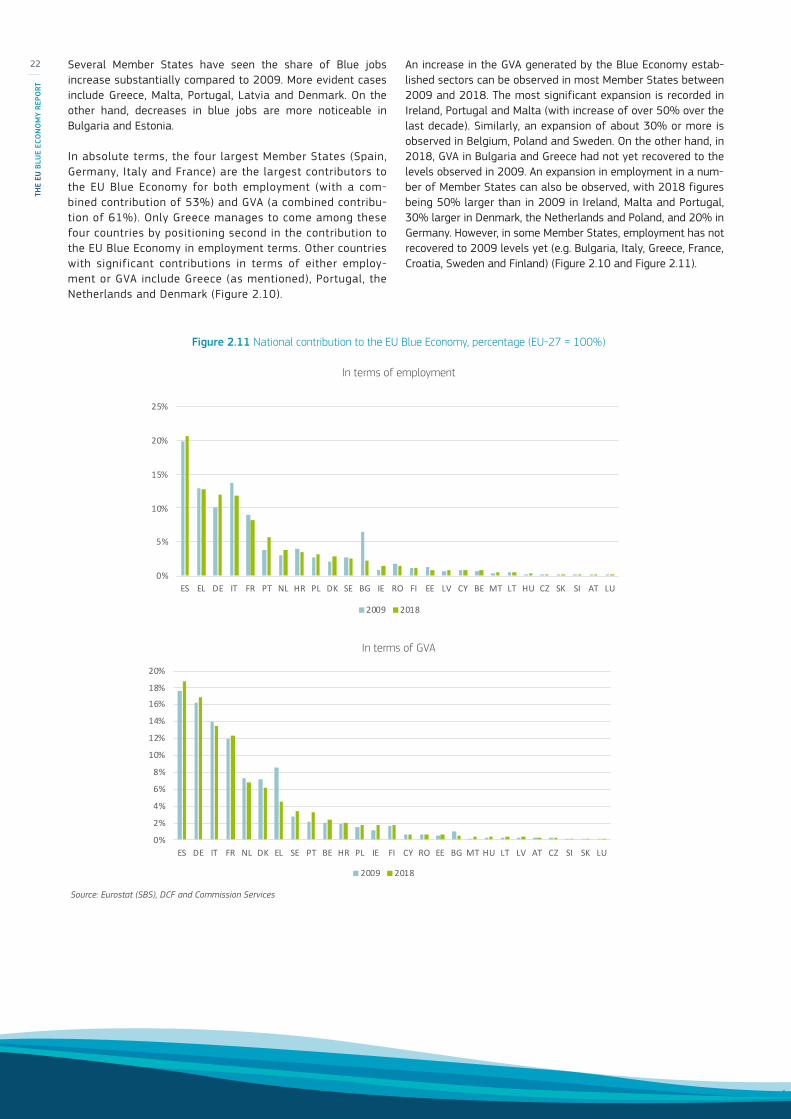
Several Member States have seen the share of Blue jobs increase substantially compared to 2009. More evident cases include Greece, Malta, Portugal, Latvia and Denmark. On the other hand, decreases in blue jobs are more noticeable in Bulgaria and Estonia.
In absolute terms, the four largest Member States (Spain, Germany, Italy and France) are the largest contributors to the EU Blue Economy for both employment (with a com-bined contribution of 53%) and GVA (a combined contribu-tion of 61%). Only Greece manages to come among these four countries by positioning second in the contribution to the EU Blue Economy in employment terms. Other countries with significant contributions in terms of either employ-ment or GVA include Greece (as mentioned), Portugal, the Netherlands and Denmark (Figure 2.10).
An increase in the GVA generated by the Blue Economy estab-lished sectors can be observed in most Member States between 2009 and 2018. The most significant expansion is recorded in Ireland, Portugal and Malta (with increase of over 50% over the last decade). Similarly, an expansion of about 30% or more is observed in Belgium, Poland and Sweden. On the other hand, in 2018, GVA in Bulgaria and Greece had not yet recovered to the levels observed in 2009. An expansion in employment in a num-ber of Member States can also be observed, with 2018 figures being 50% larger than in 2009 in Ireland, Malta and Portugal, 30% larger in Denmark, the Netherlands and Poland, and 20% in Germany. However, in some Member States, employment has not recovered to 2009 levels yet (e.g. Bulgaria, Italy, Greece, France, Croatia, Sweden and Finland) (Figure 2.10 and Figure 2.11).
Figure 2.11 National contribution to the EU Blue Economy, percentage (EU-27 = 100%)
In terms of employment
In terms of GVA
Source: Eurostat (SBS), DCF and Commission Services
0%
5%
10%
15%
20%
25%
ES EL DE IT FR PT NL HR PL DK SE BG IE RO FI EE LV CY BE MT LT HU CZ SK SI AT LU
2009 2018
0%
2%
4%
6%
8%
10%
12%
14%
16%
18%
20%
ES DE IT FR NL DK EL SE PT BE HR PL IE FI CY RO EE BG MT HU LT LV AT CZ SI SK LU
2009 2018
22
THE
EU B
LUE
ECO
NO
MY
REPO
RT

C h A p T E R 3THE EUROPE AN
GREEN DE AL AND THE C IRCUL AR ECONOMY

This chapter provides a general overview of the European Green Deal (EGD)42, the plan to make the EU’s economy sustainable, and a more detailed explanation of the policies, actions and initiatives within it, which are closely linked to the Blue Economy agenda. For, ocean pollution and degradation are amongst the greatest envi-ronmental challenges that the EGD aims to address. Additionally, a sustainable use of the oceans, aquatic and marine resources is a central part of the solution that the Deal will pursue. The EGD is the roadmap of the Blue Economy Report as reliable, accurate and comparable data are essential for the sustainable develop-ment of Blue Economy sectors and any initiatives and strategies in relation to them.
A section on the circular economy is also provided, explaining its main characteristics and how these are beneficial for the environ-ment and for society. The chapter also addresses the role of the EU in the world and how the EGD can enable and ensure that the EU remains at the forefront of a green recovery from the global environmental and health challenges, and becomes a champion of the sustainability transition, thus playing an influential role in the world.
42 COM(2019) 64043 COM(2019) 64044 https://ec.europa.eu/commission/presscorner/detail/en/qanda_20_24
3.1. EUROPEAN GREEN DEAL: CONTEXT AND RELEVANCEThe EGD is a new growth strategy that seeks to transform the EU into a fair and prosperous society, with a modern, resource-effi-cient and competitive economy where economic growth is decou-pled from resource use43. Further, the EGD is an integral part of the Commission’s strategy to implement the United Nations’ 2030 Agenda and its seventeen sustainable development goals (SDGs).
In order to become a global leader in sustainable growth and climate-neutral continent by 2050, substantial investments are needed. With the EGD Investment Plan, the EU aims to mobilise at least €1 trillion of investments over the 2021-2027 period, thanks to a combination of funding from the EU and national budgets and public and private investments. In addition, it will create an enabling framework to facilitate sustainable investment by public and private investors and will provide technical assis-tance to support public administrations and project promoters in identifying, structuring and executing sustainable projects44. Half of the overall €1 trillion budget will come from the EU long-term budget. It is expected that this will trigger national co-financing from the Member States of about €114 billion over this time-frame, and an additional €279 billion of climate and environment related investment from the public sector (e.g. EIB Group) and private sector investors. Further, the Just Transition Mechanism (JTM) will ensure that the transition towards a climate-neutral economy happens in a fair way. It provides targeted support to help mobilise at least €100 billion over the 2021-2027 period in the most affected regions, to alleviate the socio-economic impact of the transition.
Figure 3.1 The European Green Deal Investment PlanSource: Commission Services, European Green Deal Communication
24
THE
EU B
LUE
ECO
NO
MY
REPO
RT

The EGD calls for a transformation of the economic set-up and for it to happen, the Blue Economy sectors need to develop sustaina-bly. Over the past 15 years, the EU has laid a solid foundation for an integrated and cohesive maritime policy in Europe that involves its Member States, regions and numerous local stakeholders. A focus on a more resilient and sustainable economic model is needed, one that not only creates lasting jobs in a healthier envi-ronment but that also counters the COVID-19 crisis45.
All EU actions and policies will have to contribute to the EGD objectives. The challenges are complex and interlinked46. Owing to its diversity, dynamism and innovation potential, the Blue Economy can contribute significantly to the objectives of the EGD. Operating in a uniquely important environmental space, it is well placed to demonstrate that transitioning to sustainability is possible while still offering high-quality jobs and prosperity for coastal communities.
3.1.1. BIODIVERSITY STRATEGY
Investing in nature
As per the EU Biodiversity Strategy for 203047,48 conservation of marine ecosystems and the restoration of those degraded has direct economic benefits (see Chapter 6). Not only is marine biodiversity as such the prerequisite to economic activities like fisheries, biotechnology and tourism, but its conservation is also an economic opportunity49.
45 Draft Commission Communication SBE***46 COM(2019) 64047 COM(2020) 380 final- “EU Biodiversity Strategy for 2030”.48 According to the strategy, by 2030 at least 30% of the sea should be protected in the EU (i.e. an extra 19% as compared to today) and 10% should be strictly protected.
Today, less than 1% of marine areas are strictly protected in the EU. In the future, at least one third of MPA should be strictly protected.49 Barbier et al. (2018), How to pay for saving biodiversity. 50 In this regard, the full implementation of the Marine Strategy Framework Directive (2008/56/EC) and the Birds and Habitats Directives is essential. 51 COM (2021) 240 final.52 Ibid.
Reducing the impacts of human activities on the sea is there-fore the collective responsibility of all marine sectors. The appli-cation of an ecosystem-based management approach under EU legislation50 will reduce the negative impacts of fishing, mineral extraction and other human activities. By deeming biodiversity as a foundational principle of maritime economic activity, the Commission is committed to promoting nature-based solutions.
Responsible food production
One of the main determinants of both carbon emissions and bio-diversity loss is the current system for food production51. Making the system more sustainable lies at the core of the Farm to Fork strategy (F2F), which impacts various aspects of the Blue Economy.
European fisheries have made considerable efforts to bring fish stocks back to sustainable levels and to meet the Common Fisheries Policy’s (CFP) sustainability standards52. Aquaculture can be a source of sustainable food and has the potential to further become a large source of low-impact food. The sector already complies with the highest quality, safety and health standards. By improving its environmental performance, European aquaculture can solidly contribute to the EGD and the F2F.
The EGD points to the need to further boost alternative sources of protein, sustainable food and global food security, especially algae. Increasing the farming and use of algae can help eco-nomic circularity and ensure availability of bio-based products.
Figure 3.2 The European Green Deal
Source: Commission Services, European Green Deal Communication
25
2021

The production of algae in the sea can aid in removing excess carbon nitrogen and phosphorus from wastewater, thus combat-ting eutrophication53.
Market intelligence suggests that demand for low environmental impact and carbon footprint products is growing. Throughout the health crisis, it seems that consumers have been seeking local seafood and short supply chains. In this respect the continuous efforts made by fishers and fish farmers for product quality need to be recognised as improving their market position. The CFP will continue the quest for achieving sustainable fishing and aquaculture and thus strengthening the position of EU producers and farmers. In the context of the F2F initiatives on sustainable food-labelling and an EU code of conduct for responsible business and marketing in the food supply chain are included as well as an initiative to revise the current marketing standards comprising a sustainability dimension.
3.1.2. FARM TO FORK STRATEGY
The Farm to Fork Strategy is one of the key elements of the EGD. It comprehensively addresses the challenges of sustainable food systems, by recognising the inseparable links between healthy people, healthy societies and a healthy planet. The F2F is also central to the Commission’s agenda to achieve the United Nations’ Sustainable Development Goals (SDGs). F2F is also part of the EU green economic recovery agenda, by reconceiving the food system and making it more fair, healthy and environmentally-friendly.
Moreover, F2F acknowledges the important role that sustainable fisheries and aquaculture play in building sustainable food sys-tems, notably their potential as a low-carbon source of protein when compared to other sources of food and feed. In particu-lar, F2F calls for the acceleration of the shift to more sustaina-ble fish and seafood production. It also realises the potential of algae as an important source of alternative protein for food and feed, and calls for targeted support to algae production in the EU. The F2F strategy also allows for the potential use of other marine resources, such as the use of fish waste as alternative feed ingredient.
Beyond that, F2F foresees a number of targets and actions for the fisheries and aquaculture sectors. On fisheries, the F2F states that the Commission will step up efforts to bring fish stocks to sustainable levels via the CFP where implementation gaps remain (e.g. by reducing wasteful discarding), including by strengthening fisheries management in the Mediterranean Sea. The F2F strategy also refers to the proposed revision of the EU’s fisheries control system, which contributes to the fight against fraud through an enhanced traceability system, and against the Illegal, Unreported and Unregulated (IUU) fishing that remains one of the greatest threats to marine ecosystems54.
53 Ibid.54 FAO (2020). FAO. 2020. Regional Plan of Action to Prevent, Deter and Eliminate Illegal, Unreported and Unregulated (IUU) Fishing in WECAFC Member Countries (2019-
2029). Rome. https://doi.org/10.4060/ca9457t55 COM (2021) 240 final.56 COM(2020) 741 final - “An EU Offshore Renewable Energy Strategy”.57 The strategy aims to have an installed capacity of at least 60GW of offshore wind and at least GW of ocean energy by 2030, with a view to reach by 2050 300GW and
40GW of installed capacity respectively.
With respect to aquaculture, the Commission has been working on new Strategic Guidelines for the sustainable development of EU aquaculture, which will be published in May 2021. The objective of these guidelines is to provide concrete guidance to increase the sector’s sustainability, competitiveness and resilience, in line with the objectives of the EGD and the F2F Strategy. The F2F also announces two specific targets on aquaculture, notably with respect to the reduction of sales of antimicrobials and the increase in organic aquaculture.
The F2F Strategy also refers to the review of marketing stand-ards for fisheries and aquaculture products. This initiative aims at modernising and streamlining the current technical standards to correct certain shortcomings but also to better contribute to supply the market with sustainable products, as defined in the objectives of the Common Market Organisation (CMO) Regulation. The Commission is considering the feasibility of introducing a new sustainable dimension in the framework, in particular, well defined criteria and indicators to allow for the grading of a product for certain sustainability aspects.
Other more general initiatives announced in the F2F Strategy are as well of great importance for fisheries and aquaculture sectors, such as the development of a legislative framework for sustain-able food systems or a contingency plan for ensuring food supply and security in times of crisis. For the consumers of fisheries and aquaculture products, who increasingly demand more sustainable products, many other ongoing initiatives are also highly relevant. For instance, the sustainable food labelling framework, initiative on empowering consumers in the green transition, which should enable informed purchasing decisions or initiatives on substantiat-ing green claims that aim at establishing a harmonised approach for environmental information.
3.1.3. DECARBONISATION
The EU aspires to reduce greenhouse-gas emissions by at least 55% by 2030 (compared to 1990 levels) and to become car-bon neutral by 2050. The Blue Economy can contribute to the EGD's climate objective by facilitating decarbonisation through: marine renewable energy, zero-emission maritime transport and ports55.
The steady development of marine renewable energy over the last decade suggests that 20 years from now the seas and oceans could be powering most of the EU. This would include emerg-ing technologies such as floating offshore wind, wave and tidal energy system. The EGD's emissions target can only be met with the expansion of renewable energy. To speed up the development of marine renewable energy, the Commission published a new EU Offshore Renewable Energy Strategy56 in 2020, which aims at multiplying the capacity for offshore renewable energy by 30 by 205057. The European Green Deal calls for a 90% reduction in greenhouse gas emissions from all means of transport, including
26
THE
EU B
LUE
ECO
NO
MY
REPO
RT

maritime transport. Although less than other modes of trans-port, it accounts for a significant amount of global emissions. To reduce the emissions from maritime transport, the Commission is preparing concrete initiatives in line with the EGD environmental objectives and the ambitious goal of the 2030 Climate Target Plan. These initiatives include incorporating the maritime sector into the European Emission Trading System (ETS), the inclusion of maritime sector in EU Taxonomy, the Fuel EU Maritime initiative to boost the demand for sustainable alternative fuels as well as the reviews of the directives on energy taxation, alternative fuel infrastructure, and renewable energy. Decarbonising will abate not only CO2 emissions, but also air and water pollution and under-water noise.
In a progressive approach, the 2020 Communication on a Sustainable and Smart Mobility Strategy (SSMS)58 aims to bring the first zero emission vessels to market by 2030. The creation of Zero-emission ports is one of the flagship initiatives of the SSMS, promoting measures to encourage the deployment of renewable and low-carbon fuels and on-shore power supply with renewable energy and greening port services and operations.
Ports are central to the connectivity and the economy of regions and countries. As Europe’s industrial landscape changes the role of ports also evolves. More than handling container cargos, the future of ports lies in developing their key role as multi-modal hubs, as energy hubs, as circular economy hubs, as communi-cation hubs (for submarine cables), and as industrial clusters. Another element helping decarbonisation is the use of smart dig-ital solutions and autonomous systems, as they optimise traffic flows and cargo handling in and around ports.
58 COM (2021) 240 final.
BOX 3.1 The Zero-Pollution Action PlanThe EGD announced that to protect Europe’s citizens and ecosystems, the EU needs to move towards a zero pollu-tion ambition, and better prevent and remedy pollution i air, water, soil, and consumer products. To address these inter-linked challenges, in 2021 the Commission just adopted a Zero Pollution Action Plan.
This action plan also supports the post-COVID-19 recovery by promoting a more sustainable re-launch of the EU economy, creating job opportunities and reducing social inequalities, as pollution often affects the most vulnerable people most seriously. It seeks synergies with and considers actions and results of related strategies (e.g. pharmaceuticals), policies and evaluations. Marine pollution by excess of nutrients, con-taminants, litter and noise is prominent in the action plan.
Specifically, the Zero Pollution Action Plan: • Focuses on measures to strengthen implementation and
enforcement, so that public authorities, businesses and cit-izens can use EU rules on pollution more effectively.
• Considers the need to improve the existing health and environment acquis (which will be subject to separate ini-tiatives). To this end it carefully reviews the preparatory work, evaluations and/or impact assessments carried out under dedicated initiatives for pollution of the air, water and marine environment as well as from road transport and industrial emissions, waste and wastewater, and noise. The plan also considers other pollution forms such as soil pollution.
• Seeks improvements to the governance of pollution poli-cies, including at the international level and notably via a monitoring and outlook tool using existing (e.g. collected by various EU agencies or reported by Member States) and new (e.g. from EU satellite observation) data sources and models. The Action Plan also addresses the international aspects of the EU’s zero pollution ambition such as diplo-macy, trade policy and development support.
• Drives societal change, amongst others using digital solutions and contributing to a sustainable consumption agenda attentive to pollution impacts.
27
2021
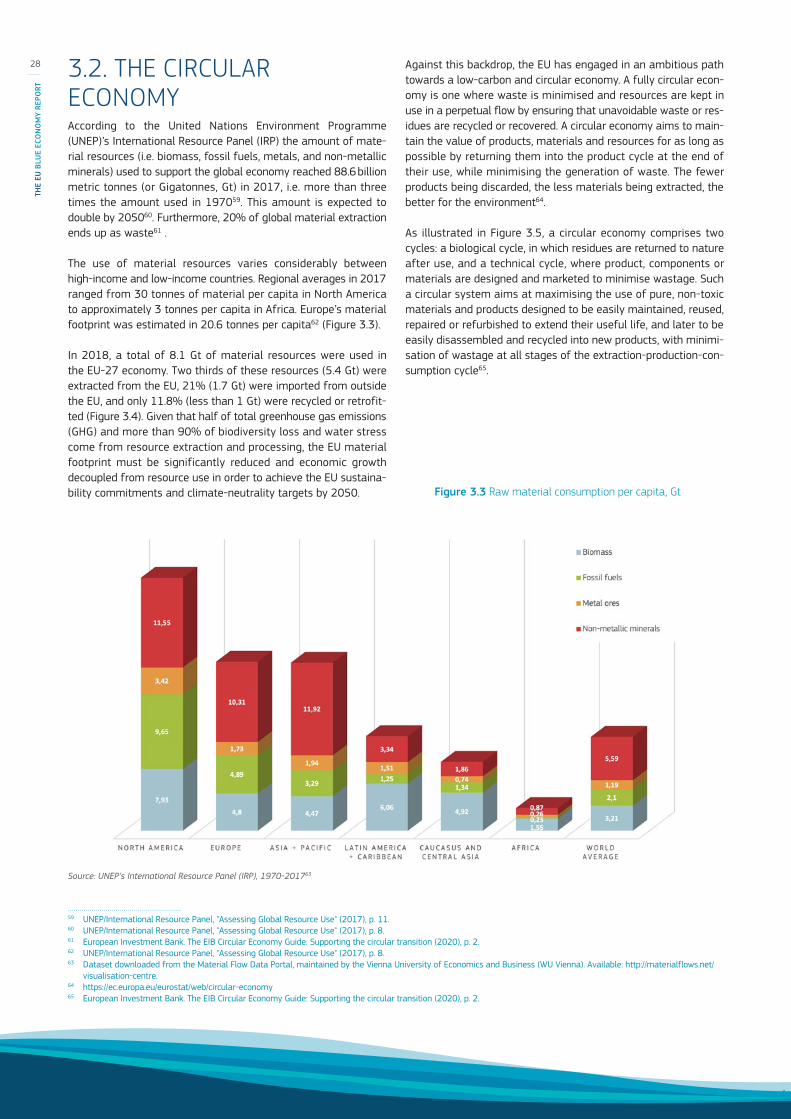
3.2. THE CIRCULAR ECONOMYAccording to the United Nations Environment Programme (UNEP)’s International Resource Panel (IRP) the amount of mate-rial resources (i.e. biomass, fossil fuels, metals, and non-metallic minerals) used to support the global economy reached 88.6 billion metric tonnes (or Gigatonnes, Gt) in 2017, i.e. more than three times the amount used in 197059. This amount is expected to double by 205060. Furthermore, 20% of global material extraction ends up as waste61 .
The use of material resources varies considerably between high-income and low-income countries. Regional averages in 2017 ranged from 30 tonnes of material per capita in North America to approximately 3 tonnes per capita in Africa. Europe’s material footprint was estimated in 20.6 tonnes per capita62 (Figure 3.3).
In 2018, a total of 8.1 Gt of material resources were used in the EU-27 economy. Two thirds of these resources (5.4 Gt) were extracted from the EU, 21% (1.7 Gt) were imported from outside the EU, and only 11.8% (less than 1 Gt) were recycled or retrofit-ted (Figure 3.4). Given that half of total greenhouse gas emissions (GHG) and more than 90% of biodiversity loss and water stress come from resource extraction and processing, the EU material footprint must be significantly reduced and economic growth decoupled from resource use in order to achieve the EU sustaina-bility commitments and climate-neutrality targets by 2050.
Source: UNEP’s International Resource Panel (IRP), 1970-201763
59 UNEP/International Resource Panel, "Assessing Global Resource Use" (2017), p. 11.60 UNEP/International Resource Panel, "Assessing Global Resource Use" (2017), p. 8.61 European Investment Bank. The EIB Circular Economy Guide: Supporting the circular transition (2020), p. 2.62 UNEP/International Resource Panel, "Assessing Global Resource Use" (2017), p. 8.63 Dataset downloaded from the Material Flow Data Portal, maintained by the Vienna University of Economics and Business (WU Vienna). Available: http://materialflows.net/
visualisation-centre.64 https://ec.europa.eu/eurostat/web/circular-economy 65 European Investment Bank. The EIB Circular Economy Guide: Supporting the circular transition (2020), p. 2.
Against this backdrop, the EU has engaged in an ambitious path towards a low-carbon and circular economy. A fully circular econ-omy is one where waste is minimised and resources are kept in use in a perpetual flow by ensuring that unavoidable waste or res-idues are recycled or recovered. A circular economy aims to main-tain the value of products, materials and resources for as long as possible by returning them into the product cycle at the end of their use, while minimising the generation of waste. The fewer products being discarded, the less materials being extracted, the better for the environment64.
As illustrated in Figure 3.5, a circular economy comprises two cycles: a biological cycle, in which residues are returned to nature after use, and a technical cycle, where product, components or materials are designed and marketed to minimise wastage. Such a circular system aims at maximising the use of pure, non-toxic materials and products designed to be easily maintained, reused, repaired or refurbished to extend their useful life, and later to be easily disassembled and recycled into new products, with minimi-sation of wastage at all stages of the extraction-production-con-sumption cycle65.
Figure 3.3 Raw material consumption per capita, Gt
28
THE
EU B
LUE
ECO
NO
MY
REPO
RT
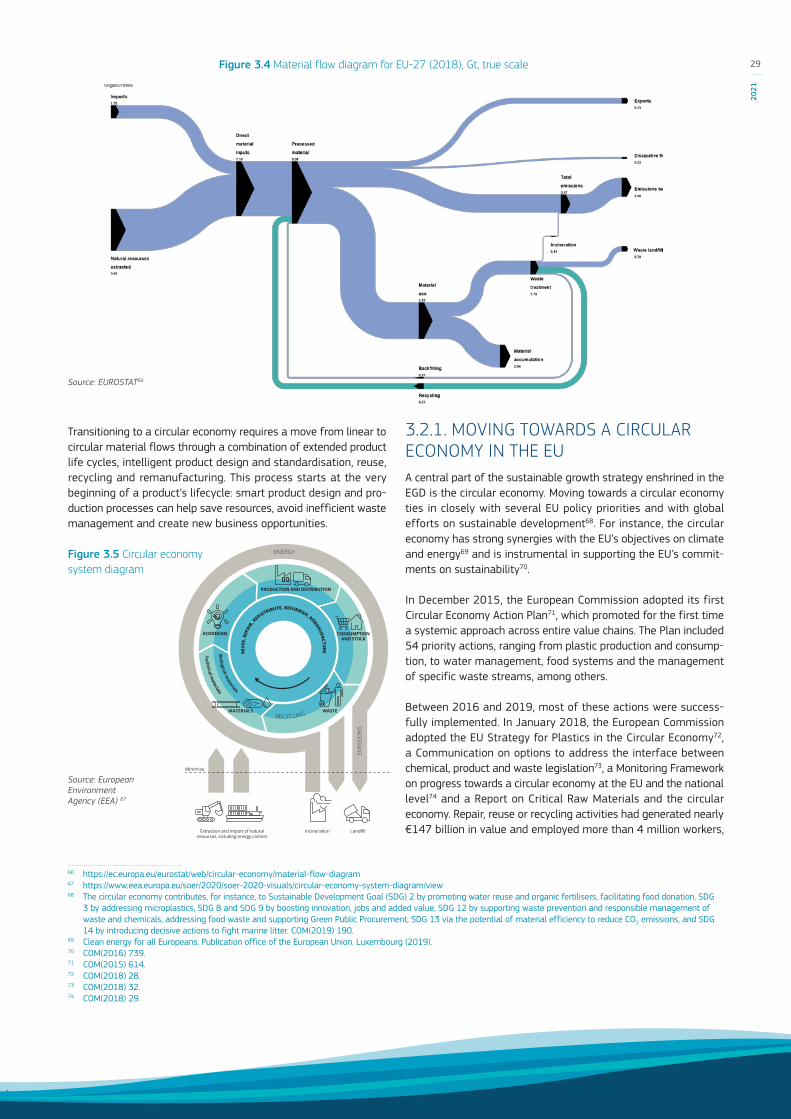
Source: EUROSTAT66
Transitioning to a circular economy requires a move from linear to circular material flows through a combination of extended product life cycles, intelligent product design and standardisation, reuse, recycling and remanufacturing. This process starts at the very beginning of a product’s lifecycle: smart product design and pro-duction processes can help save resources, avoid inefficient waste management and create new business opportunities.
Figure 3.5 Circular economy system diagram
Source: European Environment Agency (EEA) 67
66 https://ec.europa.eu/eurostat/web/circular-economy/material-flow-diagram 67 https://www.eea.europa.eu/soer/2020/soer-2020-visuals/circular-economy-system-diagram/view 68 The circular economy contributes, for instance, to Sustainable Development Goal (SDG) 2 by promoting water reuse and organic fertilisers, facilitating food donation, SDG
3 by addressing microplastics, SDG 8 and SDG 9 by boosting innovation, jobs and added value, SDG 12 by supporting waste prevention and responsible management of waste and chemicals, addressing food waste and supporting Green Public Procurement, SDG 13 via the potential of material efficiency to reduce CO2 emissions, and SDG 14 by introducing decisive actions to fight marine litter. COM(2019) 190.
69 Clean energy for all Europeans. Publication office of the European Union. Luxembourg (2019).70 COM(2016) 739.71 COM(2015) 614.72 COM(2018) 28.73 COM(2018) 32.74 COM(2018) 29.
3.2.1. MOVING TOWARDS A CIRCULAR ECONOMY IN THE EUA central part of the sustainable growth strategy enshrined in the EGD is the circular economy. Moving towards a circular economy ties in closely with several EU policy priorities and with global efforts on sustainable development68. For instance, the circular economy has strong synergies with the EU’s objectives on climate and energy69 and is instrumental in supporting the EU’s commit-ments on sustainability70.
In December 2015, the European Commission adopted its first Circular Economy Action Plan71, which promoted for the first time a systemic approach across entire value chains. The Plan included 54 priority actions, ranging from plastic production and consump-tion, to water management, food systems and the management of specific waste streams, among others.
Between 2016 and 2019, most of these actions were success-fully implemented. In January 2018, the European Commission adopted the EU Strategy for Plastics in the Circular Economy72, a Communication on options to address the interface between chemical, product and waste legislation73, a Monitoring Framework on progress towards a circular economy at the EU and the national level74 and a Report on Critical Raw Materials and the circular economy. Repair, reuse or recycling activities had generated nearly €147 billion in value and employed more than 4 million workers,
FIGURE 9.1 Circular economy system diagram
RECYCLING
REU
SE, R
EPAI
R, R
EDISTRIBUTE, REFURBISH, REMAN
UFACTURE
ENERGY
EMIS
SIO
NS
Extraction and import of natural resources, including energy carriers
Incineration
Technical materials
Biological materials
ECODESIGN
PRODUCTION AND DISTRIBUTION
CONSUMPTIONAND STOCK
WASTEMATERIALS
Minimise
Source: EEA (2016a).
Figure 3.4 Material flow diagram for EU-27 (2018), Gt, true scale 29
2021
i.e. a 6% increase compared to 201275. But outside the prior-ity sectors identified in the Plan76, several challenges remained. To address these challenges, in March 2020 the European Commission adopted a new Circular Economy Action Plan (CEAP)77. The CEAP aims to decouple economic growth from the use of resources, while ensuring that the EU's economy remains com-petitive over the long term78. It comprises 35 measures covering the entire lifecycle of products, from design and manufacturing to consumption, repair, reuse, and recycling. It introduces legislative and non-legislative measures and targets areas where action at the EU level brings added value.
The aim of the CEAP is to reduce the EU's consumption footprint and double the EU's circular material use rate in the coming dec-ade, while generating savings of €600 billion for EU businesses (equivalent to 8% of their annual turnover)79, increasing the EU's GDP by an additional 0.5% by 2030, and creating around 700 000 new jobs. Furthermore, it is estimated that circular economy ini-tiatives could reduce EU carbon emission by 43% by 2030 (i.e. 450 million tonnes)80 and 83% by 205081. As such, the circular economy is a win-win strategy for both the economy and the environment.
Specifically, the CEAP aims to (i) make sustainable products the norm in the European Union; (ii) focus on the sectors that use the most resources, where the potential for circular action is high, such as electronics and ICT, batteries and vehicles, pack-aging, plastics, textiles, construction and buildings, food, water and nutrients; (iii) ensure less waste; and (iv) empower consumers and public buyers by introducing a “right to repair” and to reliable information on issues such as the durability of products to help them make environmentally sustainable choices.
Financing the transition
The transition to a circular economy in the EU is financed through a combination of funding sources, including:
• EU programmatic funding: In the 2014-2020 budget-ary period, the EU granted almost €2 billion in funding for research and innovation projects on the circular economy (Horizon 2020). Through the Cohesion Policy at least €7.6 billion have been granted for the uptake of eco-innovative technologies among SMEs and for supporting the implemen-tation of EU waste legislation. Other EU funding programmes, such as the European Maritime and Fisheries Fund (EMFF), the European Fund for Strategic Investments (EFSI), the LIFE Programme or COSME have also funded circular economy projects.
75 COM(2019) 190.76 Plastics, food waste, critical raw materials, construction and demolition and biomass and bio-based products.77 COM(2020) 98.78 European Investment Bank. The EIB Circular Economy Guide: Supporting the circular transition (2020), p. 7.79 European Commission Memo. Questions and answers on the Commission Communication "Towards a Circular Economy" and the Waste Targets Review (2014), p. 2.80 https://ec.europa.eu/info/sites/info/files/circular-economy-factsheet-general_en.pdf 81 Ellen MacArthur Foundation, & McKinsey Center for Business and Environment. Growth within: a circular economy vision for a competitive Europe. Ellen MacArthur
Foundation (2015), p. 14.82 https://ec.europa.eu/eu-external-investment-plan/home_en 83 European Investment Bank. The EIB Circular Economy Guide: Supporting the circular transition (2020), p. 1.84 COM(2018) 97. 85 https://ec.europa.eu/info/consultations/finance-2020-sustainable-finance-strategy_en 86 UN Water and UNESCO (2019), Leaving no one behind. The United Nations World Water Development Report 2019.87 European Environmental Agency. State of nature in the EU: Results from reporting under the nature directives 2013-2018. EEA Report No 10/2020.
• EU External Investment Plan (EIP): adopted in 2017, the EIP prioritises its support to sectors such as: sustainable energy, energy efficiency, sustainable cities and agriculture. The Plan focuses on countries neighbouring the EU and the whole African continent. The EU has allocated €5.1 billion in the form of financial guarantees and blended capital (grants) to share the risk and mobilise investment from the private sector and development banks. The Plan is expected to gen-erate more than €50 billion of public and private investment for development82.
• European Investment Bank (EIB): building on its track record of lending to projects focusing on recycling and the recovery of waste and by-products in various sectors, the EIB aims to increase lending to innovative circular economy projects aimed at systematically designing out waste, extending the life of assets and closing material loops. The EIB also offers circular economy advisory services, and is active in network-ing, sharing of best practices, connecting stakeholders and facilitating access to finance for circular economy projects83.
• Sustainable finance: The European Commission’s 2018 Action Plan on Financing Sustainable Growth84 has led to several initiatives to better mainstream sustainability con-siderations in financial markets. The European Green Deal Investment Plan has further reiterated the importance of crowding in private finance to meet the investment needs of moving towards greener and more sustainable societies. As a result, a renewed sustainable finance strategy is being estab-lished in consultation with stakeholders to shift the focus of financial and non-financial companies to sustainability and long-term development85.
3.2.2. OPPORTUNITIES FOR THE BLUE ECONOMY SECTORSThe transition to a circular economy generates new business opportunities for all Blue Economy sectors. It helps establish more sustainable maritime business practices, reduce waste, create jobs, and gain competitive advantages for Europe. A circular econ-omy approach also allows for the reduction of negative impacts on the seas and oceans caused by unsustainable activities on land.
A recent report by the United Nations (UN) indicates that by 2030, the world may face a 40% gap in water supply versus demand86. At the same time, water availability is crucial for food security, since agriculture is responsible for 70% percent of fresh-water withdrawals globally. Unsustainable farming practices are responsible for land degradation, soil erosion, and for nitrogen, phosphorus and potassium leaching in runoff87. 80% of waste-water flows back into the environment without being treated or
30
THE
EU B
LUE
ECO
NO
MY
REPO
RT

reused88. This may have irreversible consequences for aquatic habitats (e.g. biodiversity loss). Climate change will exacerbate these problems, as it will change precipitation patterns89. Pursuing sustainable water management will not only benefit marine sec-tors, but also contribute to other key EU internal policy goals as outlined in the EU Foreign Affairs Council conclusions on Water Diplomacy90. Moreover, desalination can help restore the water cycle as detailed in section 5.3.5.
Applying the circular economy “cradle to cradle” principles in the water sector is an important way of addressing the problems outlined above91. Water savings in all sectors in the EU (i.e. sav-ings from reduced water abstraction, reduced water heating and reduced wastewater volumes needing treatment) could lead to between 2 and 4% reduction of total primary energy consumption in the EU-2792. Mercury is released into the environment during oil and gas extraction, entering wastewater and solid waste streams. These emissions are considered to be major sources of mercury contamination in oceans and seas93. Overall, climate change impacts associated with the extraction and processing of oil and gas are in a similar range to those of coal94.
In the EU, around 29.1 million tonnes of plastic waste are gen-erated every year and only 32.5% of such waste is collected for recycling. Worldwide, between 8 and 13 million tonnes of plas-tic enter the oceans each year. The economic activities directly affected by marine plastic litter and micro-plastics include ship-ping, fishing, aquaculture, tourism and recreation. The costs associated have been estimated by UNEP95 to be of at least €6.6 billion per year globally96. Building on the 2018 plastics strategy96, the CEAP focuses on increasing recycled plastic content in areas such as packaging, construction materials and vehicles. It also addresses challenges related to microplastics, bio-based plastics and biodegradable plastics. It will restrict the intentional adding of microplastics, reduce unintentional release, and increase the capture of microplastics in wastewater, thus reducing plastic pol-lution and helping to keep plastics out of rivers, oceans, marine ecosystems, and food chains.
In the EU, an estimated 20% of fishing gear is lost at sea, accounting for nearly a third of marine litter in European seas. As a result of the transposition of the Single-Use Plastics (SUP) Directive97 and the Port Reception Facilities (PRF) Directive98, business opportunities are expected to arise for the collection of marine litter as well as from new investments in port facilities to receive the waste, separate collection, store and treat it. Similarly, it is expected that investments in activities such as marine litter
88 https://www.unwater.org/water-facts/quality-and-wastewater 89 SWD(2020) 100, p. 13.90 Council of the European Union (2018). 13991/18.91 SWD(2020) 100, p. 14.92 Mehlhart, G., Bakas, I., Herczeg, M., & Hay, D. Study on the Energy Saving Potential of Increasing Resource Efficiency-Final Report. Luxembourg: Publications Office of the
European Union (2016), p. 58.93 SWD(2020) 100, p. 9.94 IRP (2019), Global Resource Outlook 2019, pp. 83-84 and Fig. 3.19.95 UNEP and GRID-Arendal, 2016. Marine Litter Vital Graphics. United Nations Environment Programme and GRID-Arendal. Nairobi and Arendal96 SWD(2020) 100, p. 20.97 Directive (EU) 2019/904 of the European Parliament and of the Council of 5 June 2019 on the reduction of the impact of certain plastic products on the environment.98 Directive (EU) 2019/883 of the European Parliament and of the Council of 17 April 2019 on port reception facilities for the delivery of waste from ships.99 https://ec.europa.eu/fisheries/press/circular-economy-abandoned-fishing-nets-sustainable-clothing_en 100 COM(2020) 98, Annex, p. 1.101 https://ec.europa.eu/environment/international_issues/circular_economy_global_en.htm 102 https://ec.europa.eu/maritimeaffairs/policy/ocean-governance_en
collection by fishermen, more circular fish packaging and more circular fishing gear, will increase, alongside EMFF-supported demonstration projects99.
Lastly, the CEAP also puts forward a series of actions to minimise EU exports of waste and to tackle illegal shipments. In this con-nection, by 2022 the European Commission will review the rules on proper treatment of waste oils100.
With the launch of the Global Alliance on Circular Economy and Resource Efficiency (GACERE) in February 2021101, as foreseen in the CEAP, the EU aims to give global impetus to initiatives related to the circular economy transition. In addition to the EU, eleven countries have already joined the Alliance (namely Canada, Chile, Colombia, Japan, Kenya, New Zealand, Nigeria, Norway, Peru, Rwanda and South Africa). With the overall objective to spur inno-vation and make the transition more equitable by creating green jobs and lowering environmental impacts, the Alliance is expected to facilitate multilateral dialogue on the management of natural resources, potentially accelerating the advancement of the inter-national ocean governance agenda102.
31
2021

3.3. STRONGER EUROPE IN THE WORLDThe EU aims to transform its economy and society to put them on a more sustainable path, in harmony with the planet. To achieve this vision, it can build on the capacities of its Member States, and its collective strength as a global leader on climate and envi-ronmental measures, consumer protection, and workers’ rights. Delivering additional reductions in greenhouse gas emissions is a global challenge. The EU strives to be at the forefront of coordi-nating international efforts towards building a coherent financial system that supports the sustainability transition. To this end, it established the EU Platform on Sustainable Finance, and partic-ipates in the International Platform on Sustainable Finance. This effort is instrumental to put Europe firmly on a new path of sus-tainable and inclusive growth103.
The environmental ambitions of the EGD cannot be achieved by Europe acting alone. The drivers of climate change and biodiver-sity loss are global and so should the solutions be. The EU will use its influence, expertise and financial resources to mobilise its neighbours and partners to join it on the sustainability tran-sition. The EU will also continue to lead international efforts and build strong alliances with likeminded partners, such as the Global Alliance on Circular Economy and Resource Efficiency (GACERE)104 and it will strive to leverage the opportunities offered by to the UN Decade of Ocean Science for Sustainable Development, as well as to the UN Decade on Ecosystem Restoration, which are of immediate relevance to Blue Economy sectors. This adds to the other existing instances of international ocean governance through which EGD objectives will be pursued. It also recognises the need to maintain its security of supply and competitiveness even when and where others are unwilling or unable to act105.
103 COM(2019) 640.104 https://ec.europa.eu/environment/news/eu-launches-global-alliance-circular-economy-and-resource-efficiency-2021-02-22_en105 COM(2019) 640.
32
THE
EU B
LUE
ECO
NO
MY
REPO
RT
C h A p T E R 4ESTABL ISHED
SEC TORS

The established sectors continue to be a major contributor to the EU Blue Economy, and it is in these sectors where more complete, accurate and comparable data are available.
The seven established sectors considered in this report are Marine living resources, Marine non-living resources, Marine renewable energy, Port activities, Shipbuilding and repair, Maritime transport and Coastal tourism. Each sector is further divided into subsectors as summarised in Table 4.1. The details of what is included in each sector and subsector are explained in Annex 3.
This chapter provides a detailed overview of the main economic data as well as the trends and the drivers behind each of the established sectors. DCF data are used for the primary sector106 activities in the Marine living resources sector while for the rest of sectors, Eurostat Structural Business Statistics (SBS) data are used. In addition, data from Tourism expenditure survey and from the EU Tourism Satellite Account were used for Coastal tourism107.
The socio-economic indicators covered in this section include: persons employed, average remuneration per employee, turno-ver, GVA (value added at factor cost), gross profit (gross operating surplus) and net investments in tangible goods (purchases minus sales). Turnover is included as a reference and should be inter-preted with caution due to a double counting problem down the value chain, i.e. values of the same commodity are counted more than once (intermediate consumption)108. The double counting issue is solved by using the value-added approach. On the other hand, the activities selected to estimate the Blue Economy sectors may be incomplete owing to the difficulty of identifying all the economic activities throughout the value chain and assessing their maritime shares; for this reason, turnover, GVA and the other indi-cators could be underestimated. All values are nominal, i.e., they have not been adjusted for inflation. Hence, changes in nominal value reflect at least in part the effect of inflation.
Only the direct contribution of the Blue Economy established sec-tors is considered. However, all sectors have indirect and induced effects. This means that, beyond their specific contribution, each sector has important multiplier effects on income and jobs in other sectors of the economy (see 2.5).
The time series goes from 2009 to 2018. In this edition, 2018 data are final while in the previous edition they were still pro-visional and estimated. Hence, the data presented here super-sede data presented in previous reports, which may be different because of improvements in the methodology, revisions of the data or corrections of errors. Unfortunately, at the time of the elaboration of this report, Eurostat had not yet published 2019 data. Other differences may stem from updates and revisions in the methodology and/or data (see Methodology section in Annex 3 for details).
For each sector, a general background is provided, followed by the main socio-economic results for 2018 and recent trends, i.e. an explanation of some of the drivers behind the trends and
106 Capture fisheries and aquaculture.107 For details on the compilation of data for Coastal tourism, see the methodological annex.108 Considering turnover can lead to double counting along the value chain since the outputs from one activity can be the inputs of another activity (i.e., intermediate
consumption). This may particularly affect some sectors, such as Living resources and Shipbuilding and repair. For example, the value of a fish could be counted several times in the Marine living resources sector, when caught in the primary production sub-sector, then when processed in the Processing of fish product sub-sectors, and finally when sold in the Distribution of fish products sub-sector.
interactions with other sectors and the environment. This basic analysis is complemented by one or more specific topics aimed at providing a more in-depth view on the sector or sub-sectors.
Table 4.1 The established Blue Economy sectors and sub-sectors
Sector Sub-sector
Marine living resourcesPrimary productionProcessing of fish productsDistribution of fish products
Marine non-living resourcesOil and gasOther minerals
Marine renewable energy Offshore wind energy
Port activitiesCargo and warehousingPort and water projects
Shipbuilding and repairShipbuildingEquipment and machinery
Maritime transportPassenger transportFreight transportServices for transport
Coastal tourismAccommodationTransportOther expenditure
Source: Own elaboration
34
THE
EU B
LUE
ECO
NO
MY
REPO
RT

4.1. MARINE LIVING RESOURCES
4.1.1. BACKGROUND
The Marine living resources sector encompasses the harvesting of renewable biological resources (primary sector), their conversion into food, feed, bio-based products and bioenergy (processing) and their distribution along the supply chain.
The EU is the sixth largest producer of fishery and aquaculture products (behind China, Indonesia, India, Vietnam and Peru), cov-ering around 3% of global production. However, overall production has been rather stable in the last decades. The EU has about 59 000 active vessels landing about 4.5 million tonnes of seafood worth €6.7 billion, while the aquaculture sector reached a produc-tion of 1.2 million tonnes worth €4.1 billion in 2018.
The processing and distribution of seafood products are heavily dependent on the supply of raw materials from the primary sec-tor. High consumption and increased demand for seafood prod-ucts and stagnation in the primary sector make these activities increasingly dependent on imports from third countries. In fact, the EU is the largest importer of seafood in the world. Its self-suf-ficiency in meeting a growing demand for seafood products from its own waters is around 30%; i.e., EU citizens consumed more than three times as much as they produced. EU citizens on aver-age consume around 24 kg of seafood and spend around €100 on seafood per year109. The main products consumed are tuna (mostly canned), cod, salmon, Alaska pollock, shrimps, mussel and herring.
Despite this general stagnation on the production side, the eco-nomic performance of the sector has been increasing overtime. Partly thanks to the overall improvement on the stocks in the North-East Atlantic and low fuel prices for the primary sector; together with the consumers’ high demand and willingness to pay for high-quality seafood products for the processing and distribu-tion sectors.
However, the COVID-19 outbreak with the restrictive measures adopted in March and April 2020 in the EU has had significant economic impacts on the people employed in the marine living-re-sources sector. Economic results in 2020 and 2021 are signif-icantly driven by the combined effects of a decline in demand and a supply chain disruption resulting from the COVID-19 health crisis.
In addition to COVID-19, the economic results for 2021 - and beyond - of the EU marine living resources sector are going to be significantly affected by BREXIT. In particular for capture fisheries that catch a non-negligible part of their landings in UK waters.
109 FAO. 2020. Fishery and Aquaculture Statistics. Food balance sheets of fish and fishery products 1961-2017 (FishstatJ). In: FAO Fisheries Division [online]. Rome. Updated 2020. www.fao.org/fishery/statistics/software/fishstatj/en.
110 The retail sale in non-specialised stores (e.g. supermarkets and hypermarkets) is not included as it is currently not possible to identify the volume of seafood with respect the rest of products sold in those stores. See the methodological annex for additional information.
For the purpose of this report, Marine living resources comprises three subsectors that are further broken-down into the following activities:
• Primary sector: Capture fisheries (small-scale coastal, large-scale and industrial fleets) and Aquaculture (marine, fresh-water and shellfish);
• Processing of fish products: Processing and preservation of fish, crustaceans and molluscs; Prepared meals and dishes, Manufacture of oils and fats and Other food products;
• Distribution of fish products: Retail sale of fish, crustaceans and molluscs in specialised stores110 and Wholesale of other food, including fish, crustaceans and molluscs.
In broader terms, these activities form an integral part of the EU Blue bioeconomy, which includes any economic activity associ-ated with the use of renewable aquatic biological biomass, e.g. food additives, animal feeds, pharmaceuticals, cosmetics, energy, etc. Due to limited data availability and its inception nature, the biotechnology and bioenergy industries are discussed in Emerging sectors (see Section 5.1).
Overall, the contribution of Marine living resources to the EU Blue Economy in 2018 was 12% of the jobs, 11% of the GVA and 11% of the profits. Overall, the economic performance of the sector has improved from 2009.
4.1.2. MAIN RESULTS
Size of the EU Marine living resources in 2018 and recent trends
Overall, the performance of the Marine living resources sector has steadily increased over the period analysed in terms of production and profit while stagnating in terms of employment.
Marine living resources generated a gross value added (GVA) of about €19.1 billion in 2018, a 29% increase compared to 2009 (Figure 4.1). In 2018, the sector contributed to 10.8% of the EU Blue Economy GVA (established sectors), up from 9.6% in 2009.
Gross profit, valued at €7.3 billion in 2018, saw a 43% rise on 2009 (€5.1 billion). Turnover reached €117.4 billion, 26% more than in 2009, contributing to more than 18% of the total turn-over produced by the Blue Economy sectors covered. The sector invested (net) €2.4 billion in tangible goods, a figure that has fluctuated between €1.8 billion in 2011 and €3.1 billion in 2009 (Figure 4.1).
35
2021

Figure 4.1 Size of the EU Marine living resource sector, € million
Note: Turnover should be interpreted with caution due to the problem of double counting throughout the value chain.Source: Eurostat (SBS), DCF and own calculations.
0
2 500
5 000
7 500
10 000
12 500
15 000
17 500
20 000
2009 2010 2011 2012 2013 2014 2015 2016 2017 2018
GVA
0
2 000
4 000
6 000
8 000
10 000
2009 2010 2011 2012 2013 2014 2015 2016 2017 2018
Gross operating surplus
0
500
1 000
1 500
2 000
2 500
3 000
3 500
2009 2010 2011 2012 2013 2014 2015 2016 2017 2018
Net investment
0
20 000
40 000
60 000
80 000
100 000
120 000
140 000
2009 2010 2011 2012 2013 2014 2015 2016 2017 2018
Turnover
Figure 4.2 Persons employed (thousand), personnel costs (€ million) and average wage (€ thousand) in the EU Marine living
Source: Eurostat (SBS) and own calculations
0
2
4
6
8
10
12
14
0
100
200
300
400
500
600
2009 2010 2011 2012 2013 2014 2015 2016 2017 2018
Persons employed (left-axis)Personnel costs (right-axis)
0
5
10
15
20
25
2009 2010 2011 2012 2013 2014 2015 2016 2017 2018
Average remuneration per employee
36
THE
EU B
LUE
ECO
NO
MY
REPO
RT

Figure 4.3 Share of employment in the EU Marine living resources sector, 2018
Source: Eurostat (SBS) and own calculations
19%
16%
15%14%
6%
30%
Value added by country
Spain
Germany
France
Italy
Netherlands
Others
28%
27%
45%
Value added by sub-sector
Primary production
Processing of fishproducts
Distribution of fishproducts
28%
27%
45%
Value added by sub-sector
Primary production
Processing of fishproducts
Distribution of fishproducts
The activities included in the sector directly employed over 538 350 persons in 2018, representing 12.0% of the EU blue jobs (established sectors), slightly down from 12.5% in 2009. With the number of jobs decreasing and annual personnel costs increasing, amounting to €11.6 billion in 2018, the average annual wage was €21 545; a 27% increase on the 2009 average of €16 971 (Figure 4.2).
Spain leads the Marine living resources sector with 21% of the jobs and 19% of the GVA. Moreover, Spain generates the most jobs in all three sub-sectors apart from distribution, where Germany takes the lead.
Results by subsector and Member State
Employment: The Primary and Distribution sectors contributed each to 38% of the jobs, while Processing contributed with 24%. Employment fell from 2009 to 2014, and has been recover-ing since then; overall, it has decreased by 3%: Processing and Distribution saw increases of 6% each, while the Primary sec-tor decreased by 15%. The top employers, in descending order, include Spain, Italy, France, and Germany.
Gross value added: Distribution contributed with 45% of the sec-tor’s GVA of €19.1 billion, followed by the Primary sector (28%)
and then Processing (27%). GVA of the sub-sectors increased by 29% compared to 2009: +31% for the Primary sector, +26% for Processing and +30% for Distribution. The top contributors, in descending order, include Spain, Germany, France and Italy.
Gross profit: reaching almost €8.4 billion in 2018, gross profit increased by 37% compared to 2009: +139% for the Primary sector, +19% for Processing and +18% for Distribution. Distribution contributed to 46% of the sector’s total profit, followed by the Primary sector and the Processing sectors (26% each).
Net investment in tangible goods: Contrary to profit, net investment saw an overall cut of 18% compared to 2009. This decrease is driven by the 43% reduction in the Primary sec-tor and 4% in Distribution. Net investments increased in the Processing subsector by 33%. Still, most (38%) of the invest-ments take place in the Primary production subsector.
Turnover: Distribution contributed with 63% of the sector’s total turnover of €117 billion, followed by Processing (27%) and then the Primary sector (10%). Turnover of the three sub-sectors increased by 26% compared to 2009: +45% for Processing, +21% for Distribution and +15% for the Primary sector.
Figure 4.4 Share of the GVA generated by the EU Marine living resources sector, 2018
Source: Eurostat (SBS) and own calculations
38%
24%
38%
Employment by sub-sector
Primary production
Processing of fishproducts
Distribution of fishproducts
38%
24%
38%
Employment by sub-sector
Primary production
Processing of fishproducts
Distribution of fishproducts
21%
14%
11%11%
7%
36%
Employment by country
Spain
Italy
France
Germany
Poland
Others
37
2021
4.1.3. TRENDS AND DRIVERS
Within the primary sector, capture fisheries111 production has increased and may have the capacity to do so further, particularly in the Mediterranean Sea where stocks are not recovering yet. Profits have risen over the last few years, in part due to better status of fish stocks and increased fishing opportunities, in par-ticular in the North-East Atlantic and nearby waters, together with higher average market prices and reduced operating costs, such as fuel. The economic performance was expected to continue to improve as fish stocks recover and capacity continued to adapt.
According to the latest report on the EU fishing fleet, the EU-27 fleet continued to be profitable in 2018, with an overall gross profit of €1.5 billion and a net profit of almost €800 million. This represents significant progress, considering that the EU fleet was barely breaking even in 2008. Furthermore, the socio-economic data suggest that the economic performance and salaries of EU fishers tend to improve where fleets depend on stocks that are targeted sustainably and tend to stagnate where fleets depend on stocks that remain overfished or overexploited.
Likewise, there are marked differences in performance across fleet categories and fishing regions. The fleet segments oper-ating in the Atlantic and North Sea registered higher economic performance than the fleet segments operating in the Baltic and Mediterranean seas, where numerous stocks still face overfishing or overexploitation problems. Therefore, sustainable exploitation goes hand in hand with better economic performance and higher salaries for the EU fishers and welfare for fisheries-dependent communities.
In this context, the Common Fisheries Policy aims at ensuring that fishing (and aquaculture) activities are environmentally sustainable in the long-term and are managed in a way that is consistent with the objectives of achieving economic, social and employment benefits. Conservation measures tend to lead to more abundant fish stocks in the long term, which should be translated into an increase in the revenues and a reduction in the operational costs.
The control and enforcement of the conservation measures also play a key role in achieving this sustainability path. The European Fisheries Control Agency (EFCA) provides operational coordi-nation and support to Member States and the Commission as regards fisheries control activities via Joint Deployment Plans. This includes compliance with international obligations on con-trol and inspections of the EU in international waters, managed by Regional Fisheries Management Organisations (RFMOs). EFCA also supports the EU in its relations with Third Countries and RFMOs, including capacity building activities and support to the Commission in the implementation of the EU rules in the fight against IUU fishing worldwide. In West Africa and the Gulf of Guinea, EFCA has cooperated and supported, in the framework of a dedicated project, the Sub-Regional Fisheries Commission (SRFC) and the Fisheries Committee for the West Central Gulf of Guinea (FCWC) to tackle and combat IUU fishing activities in the area.
111 A detailed analysis of the economic performance of the EU fishing fleet activity is produced annually by the STECF and can be consulted at https://stecf.jrc.ec.europa.eu/reports/economic.
112 A detailed analysis of the economic performance of the EU aquaculture sector produced by the STECF can be consulted at https://stecf.jrc.ec.europa.eu/reports/economic113 STECF (Scientific, Technical and Economic Committee for Fisheries). The EU Aquaculture Sector – Economic report 2020 (STECF-20-12). Publications Office of the European
Union: Luxembourg, 2021.
The Agency supports fisheries control operations at sea with earth observation CMS service and through specifically tailored capacity building activities.
On the other hand, EU aquaculture112 production (in volume) has stagnated over the last decades even if its value has increased. The production mussels, which is the main species produced in the EU aquaculture in weight has decreased in recent years due to environmental factors (harmful algae blooms, lack of seed, diseases). The production of other important species (such as sea-bream and seabass), where the producers have higher degree of control on the production factors, has increased. Considering the increasing demand of seafood products and the opportunity to establish new farms partly due to Maritime Spatial Planning, it seems realistic to expect a growth of the EU aquaculture products, in particular of those with a high degree of control (e.g. in close systems).
While production is largely carried out by a large number of oper-ators, distribution is increasingly concentrated in the hands of a few players. Adding value can enable producers to recover part of the value of the product, which is usually generated further down the chain. Under the new European Maritime Fisheries and Aquaculture Fund (EMFAF), Fisheries Local Action Groups (FLAGs) continue to have the opportunity to support adding value, creating jobs, attracting young people and innovation at all stages of the supply chain of fishery and aquaculture products.
According to the most recent Scientific Technical and Economic Committee for Fisheries (STEFC) report on aquaculture113, overall, the performance of the aquaculture sector is improving. The EU aquaculture sector reached 1.2 million tonnes in sales weight and €4.1 billion in turnover in 2018, about a 5% increase compared to 2017. However, the overall EU aquaculture sector has experi-enced a slight decrease in all economic performance indicators in 2018 compared to 2017. The negative economic development is driven by the marine fish segment, whereas the fish and freshwa-ter shellfish segments experienced a slight increase. Profitability for the EU aquaculture sector was positive in 2018, however the GVA decreased 8% and Earnings Before Interest and Taxes (EBIT) decreased 23%. The labour productivity decreased 3%.
EU aquaculture production is mainly concentrated in four coun-tries: Spain (27%), France (18%), Italy (12%), and Greece (11%), making up 69% of the sales weight. These four countries are furthermore covering 62% of the turnover in the EU-27. The total number of enterprises in the EU is estimated to be around 15 000. More than 80% of the enterprises in the aquaculture sector are micro-enterprises, employing less than 10 employees. The sector employs around 69 000 people (39 000 FTEs), in 2018.
The EU aquaculture sector has three main production sectors: Marine fish, Shellfish and Freshwater fish production. The marine sector is the most important economically and generated the largest turnover of €1 811 million, followed by the shellfish sec-tor with €1 266 million and the freshwater sector with €1 016 million. The EU is the largest importer of seafood in the world.
38
THE
EU B
LUE
ECO
NO
MY
REPO
RT

Imports of fish and seafood products from around the globe help satisfy the needs of the processing and distribution sectors to have a steady supply of fish products for EU consumers through-out the year. The supply of fisheries and seafood products to the EU market is ensured by the EU’s own production and by imports.
EU production (from capture fisheries and aquaculture) covers about 30% of the total raw material requirements for the EU fish-processing sector114. The processing sector is therefore very dependent on global fish markets. Whether the dependency on imports will be reduced as more stocks in European waters are fished at Maximum Sustainable Yield (MSY) level remains to be seen. Raw material prices have not decreased over the last years, despite an increase in the supply, due partly to an increase in demand. The high percentage costs of raw material is expected to further increase and are not expected to be offset by improve-ments in efficiency (e.g. via innovations). Thus, the rising costs in raw materials and energy, is one of the main causes of the sector’s low, although slightly improved, profit margins. Moreover, several Member States, especially around the eastern Baltic Sea, are still being negatively affected by the Russian embargo and the subsequent substantial reduction in exports to Russia, which was extended until December 2020.
Production and consumption of organic fish and seafood still rep-resent a niche and new market in the EU despite growing demand in the recent years115. From a global perspective, Europe continues to be the largest market for organic seafood and although the consumption of organic seafood products is still relatively small, it is expected to grow strongly in the near future mainly because consumers are becoming more environmentally and socially aware. Several large retailers across Europe have declared their strong commitment to selling more sustainable seafood but this mostly includes the Aquaculture Stewardship Council (ASC) and the Marine Stewardship Council (MSC) certified products. Seafood labelled as sustainable does not need to be organic116.
Preliminary results indicate a 17% decrease in the landed value and 16% drop in GVA of the EU capture fisheries for 2020 com-pared to 2019 estimates mainly due to the COVID-19 pandemic. Despite this, the EU fleet as a whole continues to be profitable with gross and net profit margins of 26% and 14%, respec-tively117. This indicates a notable resilience of the EU fleet, which is the result of the efforts made by the sector in previous years to achieve sustainable fishing in growing number of stocks in con-junction with low fuel prices.
The lock down and subsequent economic crisis caused by the COVID-19, has presented a situation of: i) weaker demand due to lower purchasing power, difficulties in the continuity of buying seafood products (demand shifted from perishable to preserved
114 A detailed analysis of the economic performance of the EU fish processing sector produced by the STECF can be consulted at https://stecf.jrc.ec.europa.eu/reports/economic115 https://www.cbi.eu/market-information/fish-seafood/organic-seafood/116 It can be therefore considered a threat for pure organic fish and seafood. https://www.cbi.eu/market-information/fish-seafood/organic-seafood117 Carvalho, N.; Guillen, J. & Calvo Santos, A., The impact of COVID-19 on the EU-27 fishing fleet, EUR 30497 EN, Luxembourg, Publications Office of the European Union,
2020, ISBN 978-92-76-27237-3, doi:10.2760/419959, JRC122999.118 Brodeur, A., Gray, D., Islam, A., and S. J. Bhuiyan (2020). A Literature Review of the Economics of COVID-19. IZA Discussion Paper No. 13411. http://ftp.iza.org/dp13411.pdf. Nicola, M., Alsafi Z., Sohrabi, C., Kerwan, A., Al-Jabird, A., Iosifidis, Ch., Aghae, M., and R. Agha (2020). The socio-economic implications of the coronavirus pandemic (COVID-
19): A review. International Journal of Surgery 78, 185–193.119 Delphi survey estimating the impact ranges with 58 respondents representing aquaculture enterprises (65%) and producers associations (35%) participated in the first
group, contacted for the interview between January 1st to 31st 2021.120 STECF (Scientific, Technical and Economic Committee for Fisheries). The EU Aquaculture Sector – Economic report 2020 (STECF-20-12). Publications Office of the European
Union: Luxembourg, 2021.
products), and the closure of the food service and hotel industries (HORECA) channels, with the subsequent drop in some first sale prices; ii) slowdown of international trade; iii) a decrease in fishing activity, partly because of the declining demand but also due to health measures (need to maintain the safety distance between crew members at sea); and iv) increase in the cold storage and processing of seafood.
Estimates show that the small-scale coastal fleet sees the GVA and gross profits reduced by about 20% and the large-scale fleet by about 10% compared to 2019. Thus, it seems that the small-scale coastal has been more impacted by the COVID-19 than the large-scale fleet because their production tends to be products with a higher value that often are sold to restaurants. With the closure of restaurants, and sometimes the reduction of tourism (see 4.7), there was an important decrease in demand. One suc-cessful approach to overcome this difficulty was to distribute and sell their products on the local market directly to end consumers (i.e., direct sales and home delivery) with the help of digital tech-nologies (e.g. social media).
The COVID-19 pandemic has also shocked the EU aquacul-ture. Producers selling to processors and retail outlets were less affected than those with large shares of restaurants and other hospitality business in their customer’s portfolios. Large-scale farmers with alliances and long-term contracts with retail chains have stand much better than small-scale farms with stronger dependency on local markets and restaurants. However, in gen-eral, the small rise in household demand does not cover the losses in sales from the inactivity of the hospitality industry causing cash flow constrains and putting in risk the solvency of many companies. In general, lockdown measures, put in place world-wide, have forced several companies to temporarily close118, with special impact on industries with large shares of temporary and self-employed workers such as small-scale activities in the sea-food industry.
Preliminary results from different studies point to a decrease in all income sources and an increase in all cost items in the aquaculture sector caused by effects from the COVID-19 pan-demic. Following a survey119 conducted for the STEFC aquaculture report120, sales volumes show the large decreases in all groups participating in the survey, with an average 17% decrease. The most affected segment appears to be shellfish, at least in the decrease of incomes, as costs have not increased as much as in the other segments. Freshwater aquaculture follows in the rank of impacted segments and marine farming stands as the less affected industries. Although the important differences across species, industries and countries, the combination of decreased incomes and increased costs puts profitability at risk. Costs are estimated to have increased but to a lower extent than the
39
2021
decrease in the income sources. Total income and turnover result in the largest average decrease as a consequence of the corre-sponding decreases in sales and prices. The main average vari-ations are found in the costs of raw materials, energy costs and repair and maintenance, with increases around 5% in all the three cost categories.
The five most important reasons reported by producer organi-sations and enterprises to explain the economic impacts of the COVID-19 were: lower sales at markets due to lower demand from hotels and restaurants, loss of key customers such as schools or traditional markets, loss of markets due to absence of tourists, loss of international markets and decreases in purchase orders from buyers (middlemen). All of these were affected by the disruption of the lockdown and the close of commercialisation channels.
In addition to COVID-19, the living resources sector is going to be significantly affected by BREXIT. In particular, for the EU fishing fleet will see its fishing rights reduced 25% over a period of five years starting in 2021.
4.1.4. INTERACTIONS WITH OTHER SECTORS AND THE ENVIRONMENTCommercial fishing competes with other maritime activities in terms of access to resources and space. This is particularly the case with respect to Maritime transport, Marine non-living resources and Marine Renewable Energy (offshore windfarms). On the other hand, capture fisheries may benefit from Port activities and positive spill over effects generated by the Marine Protected Areas (MPAs) where fisheries resources are protected effectively. There are also some mixed interactions. For instance, Coastal tourism activities may compete for space with fishing but tourists are also an important source of demand for fish products, espe-cially from small-scale coastal fleets. Similarly, recreational fish-ing may target the same resources as commercial fishing but it also provides a potential reconversion opportunity for professional fishers to use their know-how to offer such a service for visitors121.
Aquaculture may compete for access to space with Coastal tourism, Port activities, Maritime transport, Non-living resources (offshore oil and gas, marine mining) and fishing. Synergies may exist with offshore windfarms (e.g. multi-use platforms) and mix interactions with Coastal tourism.
Since the early 2000s, better management of fish and shell-fish stocks has contributed to a decrease in fishing pressure in the North-east Atlantic Ocean and the Baltic Sea, and there are signs of recovery in the reproductive capacity of several fish and shellfish stocks. Currently, 41% of the assessed fish and shellfish stocks in those two regions are within safe biological limits122, meaning that the number of stocks within safe biological lim-its has almost doubled, from 15 in 2003 to 29 in 2017. Fishing mortality in these regions is on average near the levels producing
121 Note that various requirements, conditions and licencing may be required for providing such services. 122 Based on an assessment of around one third of the total commercial fish/shellfish stocks in the area.123 Commission staff working document no. SWD(2020)61. Review of the status of the marine environment in the European Union Towards clean, healthy and productive
oceans and seas Accompanying the Report from the Commission to the European Parliament and the Council on the implementation of the Marine Strategy Framework Directive (Directive 2008/56/EC)
124 Directive 2008/56/EC.
maximum sustainable yield, but further improvement is needed for all stocks to reach maximum sustainable yield fishing mortal-ity levels, in accordance with the CFP objectives.
In contrast, in the Mediterranean Sea and the Black Sea, the situ-ation remains critical, with 87% of the assessed stocks overfished and a significant lack of knowledge about fishing pressure and reproductive capacity. Upon the EU’s initiative, the MedFish4Ever and Sofia ministerial Declarations were adopted in 2017 and 2018 respectively. They launched a new political momentum to redress the governance of fisheries in the two sea basins. Also within the EU, good progress was achieved under the CFP in the past two years, notably with the adoption and implementation of the first ever Multi-Annual Plan (MAP) in the Mediterranean, the EU MAP for demersals in the Western Mediterranean, and the adoption of the send-alone Fishing opportunities regulation for the Mediterranean and the Black Sea.
Further urgent action is needed, and success will depend on the availability and quality of marine information, the commitment to implement scientific advice and an adequate uptake of manage-ment measures. Many stocks remain overfished and/or outside safe biological limits. It is clear that efforts by all actors will need to be intensified to ensure that stocks are managed sustainably.
Additional action may need to be considered also to reach the objective to better protect and preserve seabed habitats and reduce by-catch from fishing activities. For example, by-catch is supposed to be the main pressure for all of the threatened species of sharks, rays and skates in Europe seas, where 32-53% of all species are threatened. Seabed habitats are indeed under signifi-cant pressure across European seas from the cumulative impacts of demersal fishing, coastal developments and other activities. Preliminary results from a study presented by the European Commission in 2020123 indicate that about 43% of Europe’s shelf/slope area and 79% of the coastal seabed is considered to be physically disturbed, which is mainly caused by bottom trawling. During the first Marine Strategy Framework Directive (MSFD)124 implementation cycle, fisheries was identified as the main human activity causing physical damage on the seafloor. A quarter of the EU’s coastal area has probably lost its seabed habitats. It is likely that the impaired status of benthic habitats will influence species depending directly or indirectly on them, including the abundance of commercially exploited species.
40
THE
EU B
LUE
ECO
NO
MY
REPO
RT

4.2. MARINE NON-LIVING RESOURCES
4.2.1. BACKGROUND
The exploitation of Europe’s seas and oceans for non-living marine resources has increased over the last decade and is projected to continue growing. However, the mature offshore gas and oil sector has been in decline for some years.
For the purpose of this report, the Marine non-living resources sector comprises two main subsectors, further broken-down into activities:
(1) Oil and gas: Extraction of crude petroleum, Extraction of natural gas and Support activities for petroleum and natural gas extraction;
(2) Other minerals: Operation of gravel and sand pits; min-ing of clays and kaolin, Extraction of salt and Support activities for other mining and quarrying.
Other activities that are still on an exploratory or emerging phase are discussed in Section 5.4.
Most of the current European oil and gas production takes place offshore, mainly in the North Sea and to a lesser extent in the Mediterranean and Black Seas. Offshore production in the North Sea is carried out by Denmark, the Netherlands, Germany and Ireland. Offshore production occurs in the Baltic mainly along the Polish coast and in the Mediterranean on the continental shelf in Greece, Spain and Croatia. Romania and Bulgaria are hydrocarbon (oil and gas) producers in the Black Sea. Increasing exploration plans are foreseen for the Mediterranean region (in the Cypriot, Greek and Maltese continental shelves), the Black Sea (Bulgarian and Romanian continental shelves) as well as for the Atlantic East coast (Portuguese continental shelf)125. Italy established a mor-atorium on offshore oil and gas exploration permits, as well as a sharp increase in fees payable on upstream concessions, with the aim to prioritise renewable energy developments and move towards decarbonisation.
The mature offshore gas and oil sector is mostly in decline due to decreasing production and rising production costs, as well as a push towards clean energy in line with the EGD. Low oil prices and the trend towards alternative sources of energy with a lower carbon footprint have also had some influence in making offshore facilities less economically viable.
Conversely, the Other minerals sub-sector is expected to be on the rise. Mining the seabed is identified in Europe’s Blue Growth strategy as an important component of the future maritime econ-omy, especially to meet the requirements of high-tech industries. The demand for resources such as sand and gravel, used for con-struction purposes and creating concrete, is also likely to increase. Increasing demands for drinking water mean that desalination is
125 Joint Research Centre (JRC) (2015). EU Offshore Authorities Group – Web Portal: Offshore Oil and Gas Production. https://euoag.jrc.ec.europa.eu/node/63
also expected to grow. Likewise, as coastal communities attempt to adapt to new pressures posed by climate change, dredging, beach nourishment and sand reclamation may intensify.
Overall, the contribution of Marine non-living resources to the EU Blue Economy in 2018 was 0.2% to jobs, 2% to GVA and 5% to profits. The sector is in a decline due mainly to the decreasing production in the offshore oil sub-sector.
4.2.2. MAIN RESULTS
Size of the EU Marine non-living resources sector in 2018
In 2018, the GVA generated by the sector amounted to almost €4.2 billion, a 62% decrease compared to 2009. Gross profits, at €3.4 billion, shrunk by 65% on 2009 (€9.7 billion). Reported turnover was €13.6 billion, an 80% decrease on the €67 billion turnover in 2009 (Figure 4.5).
Net investments in tangible goods reached almost €1.3 billion in 2018, almost 47% less than in 2009. The ratio of net investment to GVA was estimated at 30% in 2018, up from 21.4% in 2009. New investments are being channelled into innovation, exploration and production units further offshore and in deeper waters.
The sector directly employed in 2018 more than 11 110 persons, 68% less than in 2009. Personnel costs totalled €0.9 billion, 44% less than in 2009. As personnel costs decreased less than persons employed, annual average wage, estimated at almost €77 400, increased compared to 2009 (€44 570) (Figure 4.6).
Denmark leads in Marine non-living resources with 25% of the jobs and 39% of the GVA, followed by Italy with 20% and 19%, and the Netherlands with 18% and 38%, respectively. The sector is in decline, in most part due to the oil and gas sub-sector.
Results by sub-sectors and Member States
Employment: Oil and gas accounted for more than 9 770 persons employed in 2018, which represents 88% of Marine non-living resources; other minerals employed the remaining 12%. Overall, employment in the sector decreased by 68% compared to 2009; a 70% decrease for oil and gas and a 20% decrease for other min-erals. The top contributors, in descending order, include Denmark, Italy, the Netherlands and Romania.
Turnover: Oil and gas accounts for almost €13.6 billion, which represents the 97% of the whole non-living resources sector’s turnover; other minerals only produced about €367 million. Overall turnover in the sector decreased by 80%, driven by a sim-ilar decrease for the oil and gas sub-sector.
Gross value added: Oil and gas accounts for almost €11.2 billion, which represents the 97% of the whole sector GVA; other minerals only produced about €10 million of GVA. Overall turnover in the sector decreased by 62%, driven by a similar decrease for the
41
2021

oil and gas sub-sector. The top contributors, in descending order, include Denmark (with 39%), the Netherlands (38%), and Italy (19%).
Gross profit: The bulk of profits are generated by oil and gas (€3.3 billion). Gross profits suffered a significant fall compared to 2009 (65%); both sub-sectors saw declines, with oil and gas declining by 65% and other minerals by 39%.
Net investment in tangible goods: The overall 47% fall in investments compared to 2009 was driven by the oil and gas sub-sector; while other minerals remained relatively stable (2% decrease).
4.2.3. TRENDS AND DRIVERS
The EU aims to be climate neutral by 2050. To achieve these reduction targets, significant investments need to be made in new low-carbon technologies, renewable energies, energy effi-ciency, and grid infrastructure. Natural gas should play a key role
126 Eurostat. Oil and petroleum products - a statistical overview. Available at: https://ec.europa.eu/eurostat/statistics-explained/index.php?title=Oil_and_petroleum_products_-_a_statistical_overview&oldid=315177#Imports_of_crude_oil
in achieving this reduction even with current technologies until supply of renewable energies becomes the main source. As invest-ments are made for time horizons of 20 to 60 years, policies that promote a stable business framework, which encourages low-car-bon investments, need to be in place well beforehand.
None of the EU Member States are self-sufficient in relation to their energy needs (as far as fossil fuels are concerned), with some smaller Member States, such as Malta, Cyprus and Luxembourg, almost completely reliant on external supplies. At the other end of the range, Estonia and Denmark are much less reliant on imports to meet their energy needs.
Despite decreasing crude oil production and consumption in the EU in recent years, crude oil and its derived products still remain the largest contributors to energy consumption.126 The EU imports more than half of the fossil fuel energy it consumes each year, with particularly high levels of dependency on crude oil and nat-ural gas. The main extra-EU crude oil and natural gas sources for the EU are Russia and Norway.
0
2 000
4 000
6 000
8 000
10 000
12 000
14 000
2009 2010 2011 2012 2013 2014 2015 2016 2017 2018
GVA
0
2 000
4 000
6 000
8 000
10 000
12 000
2009 2010 2011 2012 2013 2014 2015 2016 2017 2018
Gross operating surplus
Figure 4.5 Size of the EU Marine non-living resource sector, € million
Note: Turnover should be interpreted with caution due to the problem of double counting throughout the value chain.Source: Eurostat (SBS) and own calculations
0
1 000
2 000
3 000
4 000
5 000
6 000
2009 2010 2011 2012 2013 2014 2015 2016 2017 2018
Net investment
0
10 000
20 000
30 000
40 000
50 000
60 000
70 000
80 000
2009 2010 2011 2012 2013 2014 2015 2016 2017 2018
Turnover
42
THE
EU B
LUE
ECO
NO
MY
REPO
RT
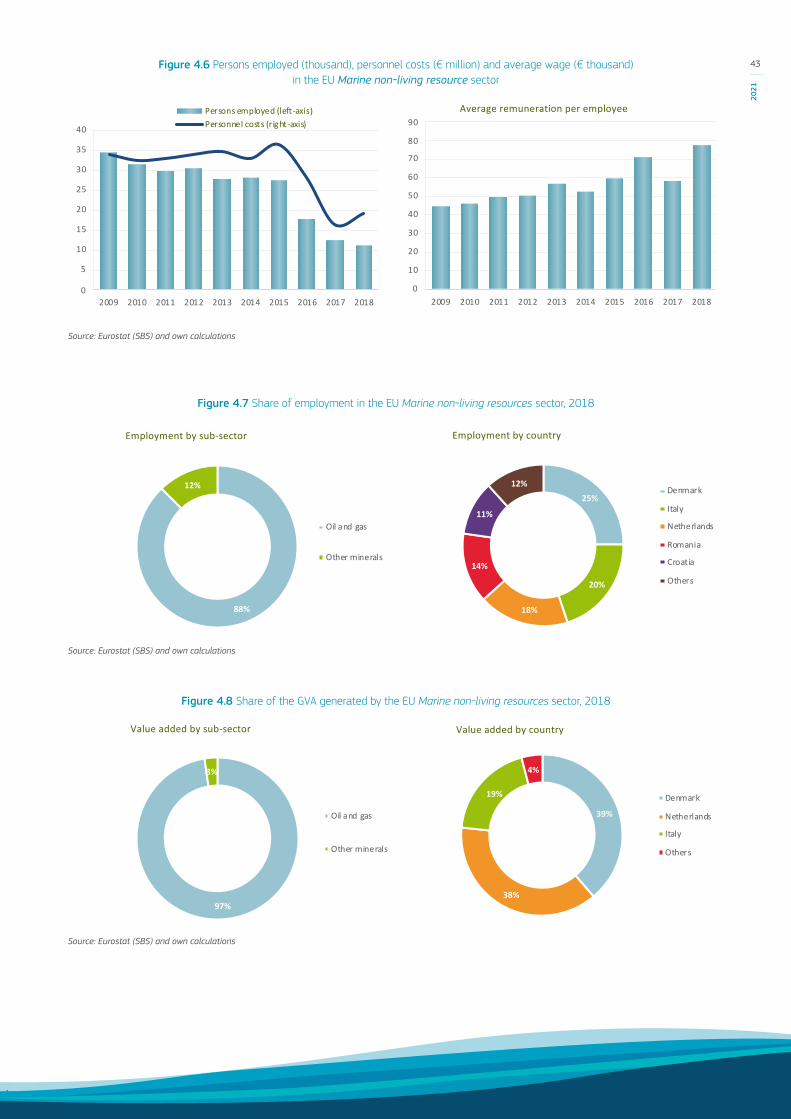
Figure 4.8 Share of the GVA generated by the EU Marine non-living resources sector, 2018
Source: Eurostat (SBS) and own calculations
Figure 4.7 Share of employment in the EU Marine non-living resources sector, 2018
`
Source: Eurostat (SBS) and own calculations
88%
12%
Employment by sub-sector
Oil and gas
Other minerals
25%
20%
18%
14%
11%
12%
Employment by country
Denmark
Italy
Netherlands
Romania
Croatia
Others
97%
3%
Value added by sub-sector
Oil and gas
Other minerals
39%
38%
19%
4%
Value added by country
Denmark
Netherlands
Italy
Others
Figure 4.6 Persons employed (thousand), personnel costs (€ million) and average wage (€ thousand) in the EU Marine non-living resource sector
Source: Eurostat (SBS) and own calculations
0
0,2
0,4
0,6
0,8
1
1,2
1,4
1,6
1,8
0
5
10
15
20
25
30
35
40
2009 2010 2011 2012 2013 2014 2015 2016 2017 2018
Persons employed (left-axis)Personnel costs (right-axis)
0
10
20
30
40
50
60
70
80
90
2009 2010 2011 2012 2013 2014 2015 2016 2017 2018
Average remuneration per employee
43
2021

Crude oil and gas prices have been relatively low in recent years. However, fluctuations due to endogenous and exogenous shocks make future fossil fuel prices uncertain. The reduction in EU demand for crude oil together with the potential reduction in Chinese demand and increases in world production of crude oil may lead to a decrease in oil prices. On the other hand, demand for gas is expected to continue increasing and, consequently, so will its price. The limited expected price increases, at least in the short term, together with a decreasing trend in production and increasing costs to exploit more remote reserves point to the con-tinued deterioration of the economic performance of the sector.
More recently and following the measures taken to confront the COVID-19 pandemic in early 2020, oil prices collapsed due to market concerns and the fall in economic activity, as well as the related Saudi Arabia-Russia oil price war that began in March 2020. Therefore, it is expected that offshore exploitation of oil and gas will further continue to decline.
4.2.4. INTERACTIONS WITH OTHER SECTORS AND THE ENVIRONMENT Activities related to Marine non-living resources may compete for access to space with activities in Coastal tourism, the Marine liv-ing resources’ primary sector (capture fisheries and aquaculture) and Maritime transport. In particular, gravel extraction may con-flict with capture fisheries because gravel beds are the principal spawning grounds for several commercially important species. On the other hand, synergies exit with Port activities and Shipbuilding and repair and mixed interactions with Marine renewable energy (offshore wind farms).
The sector has developed technologies, infrastructure and oper-ational skills of significant value to the Blue Economy. With the depletion of many exploited fields and the start of decommission-ing, these strengths could prove very useful for the development of new offshore activities, such as floating offshore windfarms or geothermal power and structures such as multi-use platforms.
Against a backdrop of increased renewable energy production, offshore oil and, in particular, natural gas projects are expected to continue to be a major source of hydrocarbon resources in the coming decade. These activities will further develop Port activi-ties, where a significant share of traffic involve offshore support vessels (OSV), such as, offshore construction vessels (OCV), dive support vessels, stand-by vessels, inspection, maintenance and repair vessels (IMR), ROV support vessels, etc. As well as offering further cargo and Engineering, Procurement, Construction (EPC) opportunities, offshore oil & gas also increases Port activities via decommissioning. This involves moving components away from hydrocarbon fields that are or soon will be at the end of their working lives. For example, the Port of Rotterdam is evaluating the expansion of its existing facilities to include decommissioning facilities as part of its “Maasvlakte 2" port upgrade project.
Projects for extraction of petroleum and gas have to undergo either an environmental impact assessment (EIA) or a screening procedure in accordance with the EIA Directive127. The pressures
127 Directive 2011/92/EU as amended by 2014/52/EU. 128 OSPAR Guidelines for the Management of Dredged Material at Sea, Agreement 2014-06. Available at: www.ospar.org/documents?d=34060.
and impacts of such human activities on the marine environment also need to be considered by Member States in their marine strategies under the MSFD. Physical loss or disturbance to the seabed, changes of hydrographical conditions, levels of contami-nant inputs of energy (e.g. underwater noise during the construc-tion phase) generated by such activities should be given particular attention. At regional level, this process should be carried out in close cooperation with regional seas conventions.
Aggregate extraction and dredging are activities thought to poten-tially cause significant environmental impact. In particular, they can create permanent hydrographical changes, including from seawater movement, salinity and sea temperature changes, During the first MSFD implementation cycle, dredging was identi-fied as the main human activity causing physical damage on the seafloor in the Black Sea. The Water Framework Directive (WFD) reporting shows that about 28% of EU’s coastline is affected by permanent hydrographical changes, including seawater move-ment, salinity or temperature. In Europe, dredging activities and the disposal of these materials are well established and regulated by national authorities, which in turn are normally based on inter-national guidelines (e.g. OSPAR guidelines)128.
44
THE
EU B
LUE
ECO
NO
MY
REPO
RT
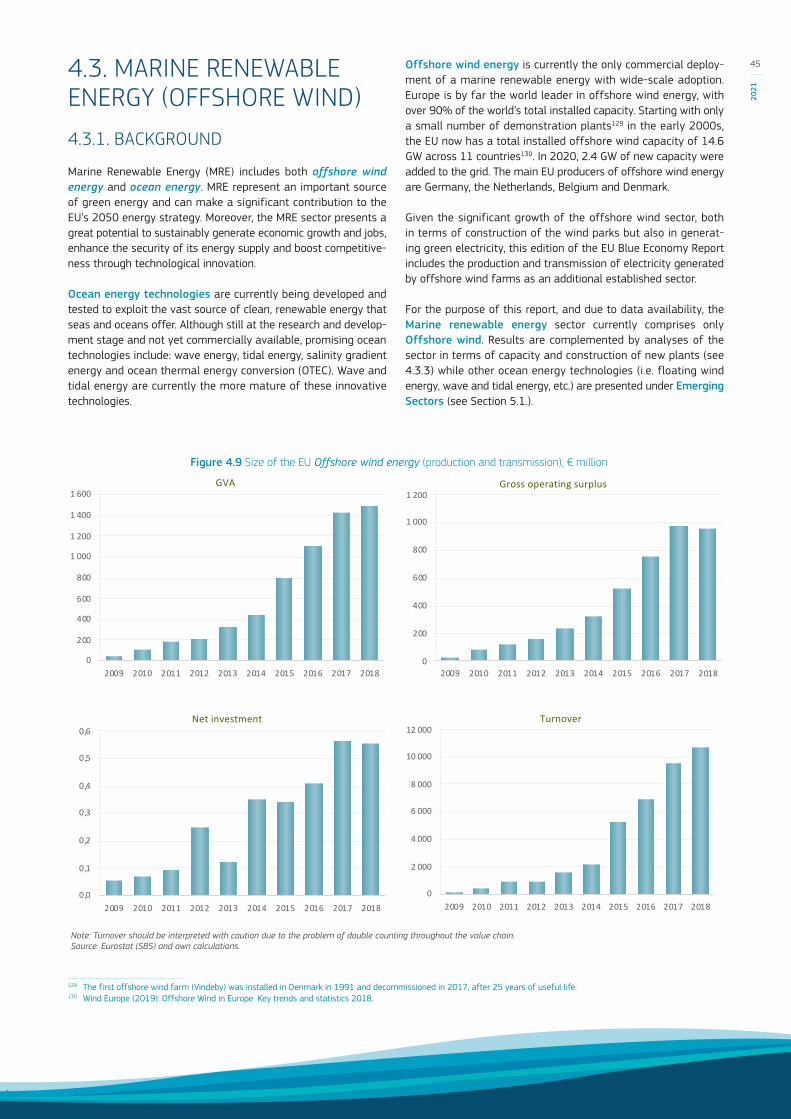
Figure 4.9 Size of the EU Offshore wind energy (production and transmission), € million
Note: Turnover should be interpreted with caution due to the problem of double counting throughout the value chain.Source: Eurostat (SBS) and own calculations.
4.3. MARINE RENEWABLE ENERGY (OFFSHORE WIND)
4.3.1. BACKGROUND
Marine Renewable Energy (MRE) includes both offshore wind energy and ocean energy. MRE represent an important source of green energy and can make a significant contribution to the EU’s 2050 energy strategy. Moreover, the MRE sector presents a great potential to sustainably generate economic growth and jobs, enhance the security of its energy supply and boost competitive-ness through technological innovation.
Ocean energy technologies are currently being developed and tested to exploit the vast source of clean, renewable energy that seas and oceans offer. Although still at the research and develop-ment stage and not yet commercially available, promising ocean technologies include: wave energy, tidal energy, salinity gradient energy and ocean thermal energy conversion (OTEC). Wave and tidal energy are currently the more mature of these innovative technologies.
129 The first offshore wind farm (Vindeby) was installed in Denmark in 1991 and decommissioned in 2017, after 25 years of useful life. 130 Wind Europe (2019): Offshore Wind in Europe. Key trends and statistics 2018.
Offshore wind energy is currently the only commercial deploy-ment of a marine renewable energy with wide-scale adoption. Europe is by far the world leader in offshore wind energy, with over 90% of the world’s total installed capacity. Starting with only a small number of demonstration plants129 in the early 2000s, the EU now has a total installed offshore wind capacity of 14.6 GW across 11 countries130. In 2020, 2.4 GW of new capacity were added to the grid. The main EU producers of offshore wind energy are Germany, the Netherlands, Belgium and Denmark.
Given the significant growth of the offshore wind sector, both in terms of construction of the wind parks but also in generat-ing green electricity, this edition of the EU Blue Economy Report includes the production and transmission of electricity generated by offshore wind farms as an additional established sector.
For the purpose of this report, and due to data availability, the Marine renewable energy sector currently comprises only Offshore wind. Results are complemented by analyses of the sector in terms of capacity and construction of new plants (see 4.3.3) while other ocean energy technologies (i.e. floating wind energy, wave and tidal energy, etc.) are presented under Emerging Sectors (see Section 5.1.).
0
200
400
600
800
1 000
1 200
1 400
1 600
2009 2010 2011 2012 2013 2014 2015 2016 2017 2018
GVA
0
200
400
600
800
1 000
1 200
2009 2010 2011 2012 2013 2014 2015 2016 2017 2018
Gross operating surplus
0,0
0,1
0,2
0,3
0,4
0,5
0,6
2009 2010 2011 2012 2013 2014 2015 2016 2017 2018
Net investment
0
2 000
4 000
6 000
8 000
10 000
12 000
2009 2010 2011 2012 2013 2014 2015 2016 2017 2018
Turnover
45
2021

Overall, Offshore wind energy (production and transmission) contributed 0.2% of the jobs, 0.8% of the GVA and 1.4% of the profits to the total EU Blue Economy in 2018. The sector is still relatively small but is in expansion.
4.3.2. MAIN RESULTS
Size of the EU Offshore wind energy (production and transmission) in 2018
In 2018, the GVA generated by the production and transmission of Offshore wind energy131 was almost €1.5 billion, a 3 582% increase compared to 2009 (€41 million). Gross profits, at €956 million, increased by 4 114% on 2009 (€23 million) (Figure 4.9). Reported turnover was just above €10.7 billion, 5 621% higher than the €187 million in 2009.
Net investments in tangible goods reached €557 million in 2018, about 890% more than in 2009. The ratio of net investment to GVA was estimated at 37%, much lower than the ratios between 2009 and 2012. New investments are being channelled into inno-vation, development, exploration and production units further off-shore and in deeper waters.
The sector directly employed 8 976 persons, up from 383 persons in 2009. Personnel costs totalled €416 million, 2 221% more than in 2009. The annual average wage, estimated at €46 340, was slightly lower compared to 2009 (€46 841) (Figure 4.10).
Germany currently leads in Offshore wind energy with 73% of the jobs and 61% of the GVA, followed by Denmark with 31% of the GVA. The sector is in large expansion.
131 Information on this still emerging sector is limited and the results presented are undervalued. Data are available for Belgium, Denmark and Germany. Only data on employment and investments are available for the Netherlands.
132 COM(2020) 741
Results by Member States
Employment: The top contributors, in descending order, include Germany with 73% (6 567 persons), followed by Belgium with 10% (872 persons), Denmark with 9% (785 persons), and the Netherlands with 8% (752 persons).
Gross value added: The top contributors, in descending order, include Germany with 61% (€912 million), Denmark (€468 mil-lion) and Belgium (€114 million).
Gross profit: Germany produced 53% of the profits (€507 mil-lion), followed by Demark with 43% (€412 million), and then Belgium with the remaining 4% (€37 million).
Net investment in tangible goods: Denmark invested 37% (€206 million) of the total reported, followed by Germany with 35% (€197 million), the Netherlands with 19% (€105 million) and then Belgium with the remaining 9% (€50 million).
Turnover: Germany accounted for 79% (€8.4 billion) of the turn-over produced, followed by Demark with 13% (€1.5 billion) and then Belgium with the remaining 8% (€818 million).
4.3.3. TRENDS AND DRIVERS
During the last decade, the wind energy sector saw a strong increase in offshore wind technologies due to higher capacity fac-tors achievable, much larger sites availability and a remarkable cost reduction, supported by important technological advances, such as in wind turbine reliability. Also, offshore could build on some lessons learned in the onshore wind sector and compet-itive tendering. Offshore wind is expected to play a significant role in reaching Europe’s carbon-neutrality targets. The European Commission Offshore Renewable Energy Strategy132 was pub-lished in November 2020 as part of the EGD roadmap. The Strategy outlines the ambitions to deploy 300 GW of offshore
Figure 4.10 Persons employed (thousand), personnel costs (€ million) and average wage (€ thousand) in EU Offshore wind energy (production and transmission)
Source: Eurostat (SBS) and own calculations
0
10
20
30
40
50
60
70
80
90
2009 2010 2011 2012 2013 2014 2015 2016 2017 2018
Average remuneration per employee
0
0,1
0,2
0,3
0,4
0,5
0,0
2,0
4,0
6,0
8,0
10,0
Persons employed (left-axis)Personnel costs (right-axis)
0
10
20
30
40
50
60
70
2009 2010 2011 2012 2013 2014 2015 2016 2017 2018
Average remuneration per employee
46
THE
EU B
LUE
ECO
NO
MY
REPO
RT

wind energy by 2050, supplying about 30% of the EU future elec-tricity, with an intermediate target of 60 GW by 2030. Starting as a first mover in the offshore sector, with the first offshore wind farm installed in Denmark in 1991, the EU currently is a global leader in offshore wind manufacturing.
The EU offshore wind energy sector has grown to a capacity of 14.6 GW by the end of 2020 (Figure 4.12)133, with an increase of 2.4 GW in the last year. It represents a growth of 20% from 2019 total installed capacity of offshore wind.
Most of the EU installed capacity (98%) is located in the North and Baltic Seas. Germany is the Member State with the largest installed capacity of offshore wind energy (53%) followed by the Netherlands (18%), Belgium (15%), Denmark (12%). A nascent industry is present in Finland, Sweden, France, Spain, Ireland and
133 WindEurope (2021): Offshore Wind in Europe. Key trends and statistics 2020.134 JRC (2021). Technology Development Report LCEO: Wind Energy. JRC123138
Portugal. EU's offshore wind industry keeps on leading the sector driven by a strong home market representing about 42 % of the worldwide capacity deployed134.
The total investment needed to deploy the 14.6 GW capacity installed between 2010 and 2020 is estimated to have amounted to €52 billion, with an average capital expenditure of around €3.6 million per MW.
In 2020, 3.6 GW of new EU offshore wind capacity was financed, reaching final investment decision (FID) for €10.4 billion worth of investment (Figure 4.13), representing a significant increase in new offshore wind commitments compared to 2019. 2.26 GW of the 3.6 GW of new offshore wind projects have been awarded in the Netherlands (Hollandse Kust Noord and Zuid Projects); with the remaining in France (0.99 GW) and in Germany (0.34 GW).
Figure 4.11 Share of employment and GVA generated by the EU Offshore wind energy (production and transmission), 2018
Source: Eurostat (SBS) and own calculations
73%
10%
9%
8%
Employment by Member State
Germany
Belgium
Denmark
Netherlands61%
31%
8%
Value added by Member State
Germany
Denmark
Belgium
Figure 4.12 EU offshore wind energy installed capacity, MW
Source: JRC, GWEC, WindEurope.
0
5
10
15
20
25
2010
2011
2012
2013
2014
2015
2016
2017
2018
2019
2020
Cum
ulat
ive
inst
alle
d ca
paci
ty
[GW
]
Belgium Denmark Finland France Germany
Ireland Netherlands Portugal Spain Sweden
47
2021

The average capital expenditure (CAPEX) of new EU projects is of €2.89 million per MW. It shall be noted, that while the trend of the average CAPEX is declining for offshore wind project, there is still significant difference in capital costs across projects. Factors such as rated turbine capacity, depth of the site (and the foundation technology pursued) and the size of a project affect the overall costs. Additionally, delays in administrative procedures could push the cost of a project up.
In the run up to 2050, decrease in estimated CAPEX for offshore wind is expected to range between €2.05 and €2.7 million per MW for an average offshore wind project135. This CAPEX reduction is mainly driven by the increase in average turbine sizes (e.g. from about 4 MW in 2016 and 8 MW in 2022 to about 12-15 MW in 2025) and the increase in offshore wind project size resulting in scaling effects136.
Offshore wind energy is gaining importance in relation to onshore wind energy: new offshore wind capacity installed, increased from 13.4% in 2017 to 24% in 2020. In cumulative terms, offshore wind represents about 8% of the total installed wind energy capacity in the EU, growing from 5% in 2016. It represents over 63% of the wind energy capacity installed in Belgium and 38% in the Netherlands (Figure 4.14).
The current number of jobs in the European offshore wind sector is 77 000 (38 000 direct jobs and 39 000 indirect jobs). Due to the globalisation of the wind energy sector (both onshore and offshore), the number of mergers and acquisitions increased over the last years. These transactions have consolidated the market, with wind players increasing their market share and economies of scale.
135 Excluding offshore wind floating technology.136 JRC, Low Carbon Energy Observatory, Wind Energy Technology Development Report 2020, European Commission, 2020, JRC120709.137 JRC Technology Market Report – Wind Energy (2019).138 EU + UK.139 An even stronger market concentration can be expected following the insolvency of Senvion and the closure of its Bremerhaven turbine manufacturing plant at the end of
2019.140 JRC Technology Market Report – Wind Energy (2019), March 2021 Update
In terms of market share, EU companies are ahead of their com-petitors in providing offshore generators of all power ranges, reflecting a well-established European offshore market and the increasing size of newly installed turbines137. In 2019, about 93% of the total offshore capacity installed in Europe138 was produced locally by European manufacturers (SiemensGamesa Renewable Energy, Vestas and Senvion139). Europe's offshore wind industry is also leading globally, accounting for about 79 % of the worldwide offshore capacity deployed. Moreover, SiemensGamesa RE and Vestas accounted for about 58% of the global newly installed offshore capacities in 2019. The growing offshore wind market offers the opportunity for European manufacturers to expand their market and production capabilities and allows to lift synergies from the onshore wind market.
Across all EU-27, + UK +NO a cumulative offshore wind capac-ity of about 20.6 GW has been allocated through competitive tendering procedures, which are expected to be commissioned until 2025. With about 12.6 GW of offshore capacity, the top 5 developers (Ørsted, Vattenfall, RWE Renewables (innogy SE), SSE Renewables and Equinor) account for more than 60% of the own-ership of the allocated capacity140.
Notably, the latest competitive tender schemes in the Netherlands (Hollandse Kust Noord) also saw a strong presence of major European Oil & Gas companies (Equinor, Shell, Eni, Total) stepping into the field of offshore wind development.
Figure 4.13 Announced financing and capacity to be installed, EU offshore wind energy
Notes: Data based on the finance deals closed each year. Capacity might be added in the respective year or in the following years. For years 2016-2019 UK based projects are also included. Source: WindEurope (2019, 2020.2021), EurObserver'ER (2019, 2020)
0
1
2
3
4
5
0
1000
2000
3000
4000
5000
6000
2016 2017 2018 2019 2020 Cap
acity
fina
nced
(m
EUR
/MW
)
Asse
t Fin
ance
€
Capacity Financed mEur/MW
0
1200
2400
3600
4800
6000
0
5000
10000
15000
20000
25000
2016 2017 2018 2019 2020
Cap
acity
fina
nced
(M
W)
Asse
t Fin
ance
m€
Finance Capacity Financed
New offshore wind investments Average capital expenditure per MW
48
THE
EU B
LUE
ECO
NO
MY
REPO
RT

BOX 4.1. Looking ahead: Offshore Renewable Energy Strategy
The Offshore Renewable Energy Strategy141 published by the European Commission at the end of 2020 paves the way for offshore wind and other offshore renewable technologies to contribute to the EU's ambitious energy and climate targets of the EGD. The Strategy proposes to increase Europe's offshore wind capacity from its current level of 12 GW to at least 60 GW by 2030 and to 300 GW by 2050. The investment needed to do so is estimated at up to €800 billion142.
Figure 4.15 JRC ENSPRESO technical potentials for offshore wind in sea basins accessible to EU-27 countries.
Source: JRC (2020)143, JRC (2019) 144
Social opposition against onshore wind energy, coupled with the depletion of onshore wind sites in selected countries and Western Europe’s relatively high acceptance of new technology for rotors and environmental pressures should create opportunities for more innovation and start-up growth in the offshore wind sector. In order for offshore wind energy to play its expected role in the energy transition, further innovations and actions are needed in specific areas.
141 https://eur-lex.europa.eu/legal-content/EN/ALL/?uri=SWD:2020:273:FIN142 JRC (2020) Facts and figures on Offshore Renewable Energy Sources in Europe, JRC121366143 JRC, Low Carbon Energy Observatory, Wind Energy Technology Development Report 2020, European Commission, 2020, JRC120709.144 JRC, ENSPRESO - WIND - ONSHORE and OFFSHORE. European Commission, Joint Research Centre (JRC) [Dataset] PID: http://data.europa.eu/89h/6d0774ec-4fe5-4ca3-
8564-626f4927744e, 2019.
Figure 4.14 Onshore vs. offshore wind energy in the EU-27: Historic ratio of offshore over total wind energy, percentage (left) and Ratio of new installed capacity (right)
Source: EurObserver'ER (2020) WindEurope (2021), JRC analysis
0%10%20%30%40%50%60%70%
Germany
Denmark
Belgium
Netherlands
EU27
2016 2017 2018 2019 2020
0%10%20%30%40%50%60%70%
Germany
Denmark
Belgium
Netherlands
EU27
2016 2017 2018 2019 2020
0%
20%
40%
60%
80%
100%
2017 2018 2019 2020
Annu
al i
nsta
lled
capa
city
(G
W)
Offshore Onshore
0%
20%
40%
60%
80%
100%
2017 2018 2019 2020
Annu
al i
nsta
lled
capa
city
(G
W)
Offshore Onshore
49
2021
The technology for floating offshore wind in deep waters and harsh environments is progressing steadily towards commercial viability145. Floating applications seem to become a viable option for EU countries and regions lacking shallower waters (floating offshore wind for depths between 50-1000 metres) and could open up new markets such as the Atlantic Ocean, the Mediterranean Sea and potentially the Black Sea. Therefore, floating offshore wind is one of the EU’s R&I priorities; increased R&I could foster EU competitiveness.
The first multi-turbine floating project was Hywind Scotland with a capacity of 30 MW, commissioned in 2017 by Equinor, followed by the Floatgen project in France and the WindFloat Atlantic in Portugal. There is a pipeline of projects that will lead to the instal-lation of 350 MW of floating capacity in European waters by 2024, which would need to accelerate afterwards146,147. Moreover, the EU wind industry targets 150 GW of floating offshore by 2050 in European waters in order to become climate-neutral148. The global market for floating offshore wind represents a considerable market opportunity for EU companies. In total about 6.6 GW of floating offshore wind energy is expected to be produced until 2030, with significant capacities in selected Asian countries (South Korea and Japan) besides the European markets (France, Norway, Italy, Greece, Spain). Due to good wind resources in shallow waters, no significant floating offshore capacity is expected in China in the mid-term149.
Harvesting renewable energy where there is abundance such as in the seas and oceans is key priority, but it is not enough to reach the 2050 targets. Infrastructure to bring offshore energy onshore is key for the development of offshore wind energy since the renewable energy generated needs to be delivered to the consumers on land. High Voltage Direct Current (HVDC) has been iden-tified as the most efficient and cost effective grid technology enabling to convey high amounts of energy over long distances and allowing the integration of increasing shares of renewables in the energy system.
Optimisation of wind turbine design (turbine size and generators) is another important factor to address, next generation turbines are expected to increase the penetration of configurations with Permanent Magnet Synchronous Generators (PMSGs), because more and more powerful generators with a reduced size and weight will be demanded. Optimisation can also go hand in hand with digitalisation; including automated solutions in manufacturing, better weather and output forecasting, and predictive maintenance. Innovations around blade design (computational fluid dynamics), asset monitoring (drones, robotics) and predictive maintenance (Artificial Intelligence) can improve performance and contribute to Levelised Cost of Energy (LCOE) savings. Edge computing is also expected to be a future growth area150.
Circularity encompassing the production, operation and removal of offshore wind farms are important to consider as well. It includes, among other activities, the need for solutions on lifetime extension, decommissioning and recycling of materials such as wind turbine blades. Planning for blade recycling relies heavily on visual inspection, which does not offer accurate assessment of the sub-surface materials. Additionally, much of the composite materials used in blades is made of a thermosetting matrix, which cannot be remoulded for later use151. However, the fiberglass and composites recycling capability is evolving. Improving both the lifetime and circularity of offshore wind farms is important for reducing societal costs, but also relevant in the context of depend-encies on critical raw materials, especially since the EU is not self-sufficient in any of the relevant raw materials and thus highly dependent on imports. New composite technology (thermoplastics/thermoplastic-behaving materials) increases recycling options152.
What is unique about the European rollout of offshore wind is that European waters are divided into different zones, with the potential to develop cross-border and interconnected projects. This highlights the convenience of coordinating grid integration and connection internationally (ultimately working towards a trans-European energy network), including further research into innovative grid elements. The Offshore Renewable Energy Strategy addresses long-term offshore grid planning taking into account aspects related to maritime spatial planning and potential Hydrogen and/or Power-to-X (H2/P2X) energy transformation facilities and smart sector integration. This could ensure vital co-existence with maritime transport routes, traffic separation schemes, anchorage areas, and port development and synergies, supporting the decarbonisation of the maritime transport and logistic industry.
145 UNEP & BloombergNEF, Global trends in renewable energy investment, 2019.146 JRC, Low Carbon Energy Observatory, Wind Energy Technology Development Report 2020, European Commission, 2020, JRC120709.147 Communication from the Commission, A Clean Planet for all - A European strategic long-term vision for a prosperous, modern, competitive and climate neutral economy.
COM (2018) 773 final.148 ETIPWind, Floating Offshore Wind. Delivering climate neutrality, 2020.149 GWEC, Global Offshore Wind Report 2020, 2020.150 ICF, commissioned by DG GROW - Climate neutral market opportunities and EU competitiveness study (Draft, 2020).151 ICF, commissioned by DG GROW - Climate neutral market opportunities and EU competitiveness study (Draft, 2020).152 ICF, commissioned by DG GROW - Climate neutral market opportunities and EU competitiveness study (Draft, 2020).
50
THE
EU B
LUE
ECO
NO
MY
REPO
RT

4.3.4. INTERACTIONS WITH OTHER SECTORS AND THE ENVIRONMENT Marine renewable energy may compete for access to space with the Marine living resources (primary sector), Coastal tourism and Maritime transport sectors.
Growth of marine energy, in particular offshore wind creates potential synergies with the offshore oil and gas sector, with competencies required to construct, maintain and decommis-sion offshore projects and to operate in harsh marine environ-ments. Integration could bring benefits in terms of reduced costs, improved environmental performance and utilisation of infrastruc-ture. The possibility to provide electricity to offshore oil and gas operations where there are wind farms nearby, or via floating turbines, reducing the need to run diesel or gas-fired generators on the platform and reducing emissions of carbon dioxide (CO2) and air pollutants. New uses for existing offshore infrastructure once it reaches the end of its operational life, in ways that might aid energy transitions: for example, platforms could provide off-shore bases for maintenance of wind farms, house facilities to convert power to hydrogen or ammonia, or be used to inject CO2 into depleted fields. In fact, some crossover between the sectors is already evident, in particular in the North Sea – a mature oil and gas basin with a thriving renewable energy industry - with some large oil and gas companies being also major players in offshore wind. For example, the former oil and gas company, Ørsted in Denmark, has moved entirely to wind and other renewables.
The potential synergies extend well beyond the energy sector to encompass shipping, port infrastructure, other maritime indus-tries. Port activities and Shipbuilding and repair (shipyards) ben-efit from the economic potential of offshore wind energy. Ports are home to the manufacturers of offshore wind turbines and their large components, as well as project developers and logis-tics companies. In particular, ports in the North and Baltic seas are adapting rapidly to offshore wind energy with, for example, expansion areas for plant and component manufacturers and heavy-duty terminals and berths for special ships in the sector. While coastal regions benefit in particular from this development, inland suppliers also benefit, e.g. from the metal and mechanical engineering industries, technical service providers, insurance or financing companies, certifiers and consulting firms.
Ports could play an essential role in manufacturing and assembly of foundations, production of large components (e.g. blades, tow-ers), and electrical infrastructure such as the substations, instal-lation, operation and maintenance of wind farms. Accommodating floating offshore wind development will however require signif-icant investments in upgrading port infrastructure (e.g. quays, dry-docks). Moreover, ports can also serve as hubs where sec-tor coupling of wind energy and power-to-x takes (P2X) place to decarbonise ‘hard-to-abate’ sectors, efficiently converting and storing excess energy. According to WindEurope, at least 14 European ports have dedicated wind activities and are located
153 WindEurope, Offshore Wind Ports Platform, https://windeurope.org/policy/topics/offshore-wind-ports/, 2020.154 WPM 2020, https://www.windpowermonthly.com/article/1690675/shell-eneco-win-hollandse-kust-noord-auction155 https://www.bwo-offshorewind.de/156 North Seas Energy Cooperation – Work Programme 2020-2023, 2019.157 North Seas Energy Cooperation – Work Programme 2020-2023, 2019.158 SWD(2020) 62 final.
mainly in the North Sea, Atlantic and Baltic Sea. Greening of ports and related operations are considered a priority, alongside with opportunities arising from floating offshore wind, storage and hydrogen production153. Moreover, the latest winning bid from Crosswinds B.V. (a Shell-Eneco consortium) in the subsidy-free Hollandse Kust Noord tender included the production of renewable hydrogen in the Port of Rotterdam with an electrolyser capacity of around 200 MW154.
Shipping is also a key enabler of the development of, efficient and sustainable solutions; offshore wind is considered one of them it could encourage the use of energy-efficient and environmentally friendly vessel serving functions across the full offshore project lifecycle, rewarding the use of vessels with limited to no GHG emissions. However, the transportation in the future of larger, heavier blades will probably be more costly, depending of the type of the vessels, and will require more planning at the design phase.
Thus, the expansion of offshore wind energy offers growth impulses throughout the EU Blue Economy as well as other sec-tors. It creates additional jobs in many businesses across its value chain (development, construction, operation). This means that off-shore wind power creates value in several economic sectors. For example, according to the German Federal Association of Offshore Wind Farm Operators (BWO),155 the development of offshore wind energy in Germany has so far created about 27 000 jobs. These are not only located near the coast, but also in the southern and western Germany, where important components such as bearings, gearboxes and generators are manufactured, due to the industrial value chain. The expansion of offshore wind energy has great eco-nomic potential: total sales along the entire value chain amounted to around €9 billion in 2018.
Nevertheless, environmental considerations are also important to address in the development of offshore wind energy, including an increased understanding of the ecological impacts of large-scale offshore wind. Maritime Spatial Planning (MSP) can be considered as instrumental to156 balance sea uses and sustainably manage the marine ecosystems157.
An independent assessment (ETC/ICM, 2019b) shows that wind-farms and oil and gas installations are the most frequent human-made structures liable to cause hydrographical pressure in the EU’s offshore waters. Offshore energy installations are present in almost 800 (10 km×10 km) grid cells, representing less than 0.5% of a total assessed offshore area (234 692 cells). The highest concentration is in the North-east Atlantic region with presence in 700 cells, representing 0.7% of assessed offshore area (101 943 cells)158. However, there is no region-wide assessment available to estimate the adverse effects of these installations on benthic and/or water column habitats.
51
2021

4.4. PORT ACTIVITIES 4.4.1. BACKGROUND
Port activities continue to play a key role in trade, economic development and job creation. Ports, as multi-activity transport and logistic nodes, also play a crucial role in the development of established and emerging maritime sectors.
Maritime transport, including sea and inland waterways, was used to import 82% and export 74% of the products in weight in 2016 into the EU, representing almost 50% of the total trade value159. In addition to 36% of intra-EU trade flows and almost 420 million passengers each year at EU ports160.
The number of containers heading into European ports has risen by more than four times over the past 20 years161. Europe’s busi-est container ports include Rotterdam (the Netherlands), Antwerp (Belgium); Hamburg (Germany); Amsterdam (the Netherlands) and Algeciras (Spain).
More and more ports across the EU, aim to reduce their environ-mental and climate impact while also enabling green shipping fleets or acting as clean energy hubs. These activities will have an important role in reaching the objectives of the EGD.
For the purpose of this report, the Port activities sector comprises two main sub-sectors, further broken-down into the following activities:
(1) Cargo and warehousing: Cargo handling and Warehousing and storage;
(2) Port and water projects: Construction of water projects and Service activities incidental to water transportation.
Port activities accounted for 9% of the jobs, 15% of the GVA and 16% of the profits in the EU Blue Economy in 2018. The sector has grown since 2009 in terms of jobs and GVA.
4.4.2. MAIN RESULTS
Size of the Port activities sector in 2018
The value added generated by Port activities grew by 15% from 2009 to 2018, reaching €26.5 billion. Gross profit, at €10.6 billion, was 8% higher than in 2009. Turnover amounted to €65.1 billion, an 18% rise on 2009 (Figure 4.16).
The sector directly employed 384 039 persons in 2018, nearly 1% more than in 2009. Personnel costs increased by 19%, from €13.3 billion in 2009 to €15.9 billion in 2018. This led to an 18% increase in average wages compared to 2009. The average annual wage was estimated at €41 295 (Figure 4.17).
159 European Commission (2018), EU transport in figures. Statistical pocketbook 2018, Luxembourg: Publications Office of the European Union. Available at: https://ec.europa.eu/transport/facts-fundings/statistics/pocketbook-2018_en.
160 Eurostat’s Passengers embarked and disembarked in all ports by direction - annual data.161 World Shipping Council.162 Net investments in tangible good are unavailable for most of the activities.
Germany leads Port activities by contributing 21% of the GVA and generating 24% of the jobs; followed by the Netherlands (16% and 9% in terms of jobs and GVA), Spain (13% and 11%) and France (12% and 10%).
Results by sub-sectors and Member States
Employment: The majority of the sector’s workforce (61%) is employed in Cargo and warehousing, with 312 649 direct jobs, while Ports and water projects employed 196 815 persons (39%). Compared to 2009, the number of jobs in Cargo and warehousing increased by 26% while decreasing 6% in Ports and water pro-jects, from 208 464 persons employed in 2009. The top contribu-tors, in descending order, include: Germany (24%) and then Spain (11%), France (10%), and Italy and the Netherlands (9% each).
Gross value added: The value added generated is almost evenly distributed between Cargo and warehousing (48%) and Ports and water projects (52%). The top contributors, in descending order, include Germany (21%), followed by the Netherlands (16%), Spain (13%) and France (12%).
Gross profit: Total gross profit amounted to €14.6 billion in 2018: €5.9 billion (40% of the sector total) in Cargo and warehousing, and €8.7 billion (60%) in Ports and water projects. Cargo and warehousing increased by 33% compared to 2009, while Ports and water projects registered an 8% increase.
Gross investments in tangible goods:162 Most of the investments went to Ports and water projects (65%), which saw a 3% drop on 2009 figures. Overall, the sector saw only a slight decrease (-1%) in investments, being compensated by a 10% increase in Cargo and warehousing.
Turnover: Total turnover amounted to €84.6 billion: €46.0 billion (54% of the sector total) in Cargo and warehousing and €38.6 billion (46%) in Ports and water projects. Cargo and warehous-ing increased by 42% compared to 2009 while Ports and water projects increased by 15%, with an overall increase of 28% for the sector.
52
THE
EU B
LUE
ECO
NO
MY
REPO
RT

Figure 4.16 Size of the EU Port activities sector, € million
Note: Turnover should be interpreted with caution due to the problem of double counting throughout the value chain.Source: Eurostat (SBS) and own calculations.
Figure 4.17 Persons employed (thousand), personnel costs (€ million) and average wage (€ thousand) in the EU Port activities sector
Source: Eurostat (SBS) and own calculations.
0
2 500
5 000
7 500
10 000
12 500
15 000
2009 2010 2011 2012 2013 2014 2015 2016 2017 2018
Gross operating surplus
0
200
400
600
800
1 000
1 200
2009 2010 2011 2012 2013 2014 2015 2016 2017 2018
Net investment
0
10 000
20 000
30 000
40 000
50 000
60 000
70 000
80 000
2009 2010 2011 2012 2013 2014 2015 2016 2017 2018
Turnover
0
2
4
6
8
10
12
14
16
18
0
50
100
150
200
250
300
350
400
450
2009 2010 2011 2012 2013 2014 2015 2016 2017 2018
Persons employed (left-axis)Personnel costs (right-axis)
0
5
10
15
20
25
30
35
40
45
2009 2010 2011 2012 2013 2014 2015 2016 2017 2018
Average remuneration per employee
0
5 000
10 000
15 000
20 000
25 000
30 000
2009 2010 2011 2012 2013 2014 2015 2016 2017 2018
GVA
53
2021

4.4.3. TRENDS AND DRIVERS
Ports are important to a number other sectors including Maritime transport, Shipbuilding and Maritime defence, among others. They act as facilitators of economic and trade development. Many European ports are important clusters of energy and industry; in other words, ports facilitate the clustering of energy and industrial companies in their proximity. Close cooperation between ports, shipping lines and other actors in the logistics chain is necessary to ensure efficient and smooth cargo flows163.
As a result of the COVID-19 crisis, Ports suffered significant losses since, for several months, most fishing, shipping and transport activities were halted. The International Association of Ports and Harbours (IAPH) Barometer for week 45 of 2020 showed increases in hinterland delays as well as port storage utilisation levels for medicines and consumer goods164. However, once activ-ities restarted and markets reopened, a restocking/stockpiling
163 https://www.espo.be164 https://sustainableworldports.org/iaph-wpsp-barometer-week-45-upticks-in-hinterland-delays-as-well-as-port-storage-utilization-levels-for-medicines-foodstuffs-and-
consumer-goods/165 https://sustainableworldports.org/iaph-wpsp-barometer-week-45-upticks-in-hinterland-delays-as-well-as-port-storage-utilization-levels-for-medicines-foodstuffs-and-
consumer-goods/166 https://sustainableworldports.org/wp-content/uploads/2020-06-22-COVID19-Barometer-Report.pdf167 https://www.drewry.co.uk/maritime-research/port-throughput-indices-update/port-throughput-indices168 Note amounts were converted into € using ECB exchange rates for the 1st half of 2020 (0.9075) https://www.ecb.europa.eu/stats/policy_and_exchange_rates/euro_
reference_exchange_rates/html/eurofxref-graph-usd.en.html.
wave was observed, which has resulted in a surge of container flows thereafter, with numerous ports in Europe reporting record traffic volumes on the import side165.
Further, in June 2020 of 75 ports, 48% had registered a decline in container vessel calls compared to pre-COVID times166. For Europe, ports expected over 50 stopovers between Asia and the Mediterranean to be eliminated by the end of 2020.
According to Drewry figures167, global port handling showed a decline of 2.6% during the third quarter of 2020, for the first time since 2016. Recovery in the Asian and North American markets has pushed the global port throughput index above 2019 levels, while the European market remains closer to the 2017 levels instead. Estimates showed that global revenues for the first half of 2020 were $1.7 billion (€1.5 billion) lower and Earnings Before Interest, Taxes, Depreciation, and Amortization (EBITDA) were $1.9 billion (€1.7 billion)168 lower than in the
Figure 4.19 Share of the GVA generated the EU Port activities sector, 2018
Source: Eurostat (SBS) and own calculations
Figure 4.18 Share of employment in the EU Port activities sector, 2018
`
Source: Eurostat (SBS) and own calculations
24%
11%
10%9%
9%
37%
Employment by country
Germany
Spain
France
Italy
Netherlands
Others
61%
39%
Employment by sub-sector
Cargo and warehousing
Port and water projects
61%
39%
Employment by sub-sector
Cargo and warehousing
Port and water projects
48%52%
Value added by sub-sector
Cargo and warehousing
Port and water projects
21%
16%
13%12%
9%
29%
Value added by country
Germany
Netherlands
Spain
France
Italy
Others
54
THE
EU B
LUE
ECO
NO
MY
REPO
RT

first half of 2019169. Despite some connectivity gains in the third quarter of 2020, half of the top 20 ports still have fewer weekly connections than in the third quarter of 2019. As for ship calls at EU ports, the drop observed at the start of the COVID-19 pan-demic has shown signs of improvement, reaching a fall of -5% for week 44 (25/10-1/11), compared to the same week in 2019170.
Overall, the recovery for the sector is expected to be relatively fast (see 2.2), despite the initial impacts having been quite severe. The measures put in place by the EU and the Member States through the Recovery fund should provide support for the sector. Additionally, EU initiatives, whether or not initially intended to contribute to the recovery of Ports, have the potential of doing so. As is the case with the new action plan for the Atlantic maritime strategy.
BOX 4.2 The Atlantic strategy revamped: New Action Plan
The Atlantic maritime strategy171 was adopted in 2011 to support the sustainable development of blue economy in the EU Member States bordering the Atlantic. In 2013, the European Commission put forward an Atlantic action plan172 to implement the strategy. In 2020, the European a new, updated Atlantic action plan173 to help boost a sustainable Blue Economy that can create jobs. The plan sets the priorities for regional cooperation, based on a stakeholders’ consultation and seeks to contribute to Europe’s recovery from the socio-economic crisis triggered by the COVID-19 pandemic.
The purpose of this revised Atlantic action plan 2.0 is to unlock the potential of the Blue Economy in the Atlantic area while preserv-ing marine ecosystems and contributing to climate change adaptation and mitigation. This is in line with the global commitments for sustainable development and fully integrated in the EGD, an Economy that works for people and a stronger Europe in the world. The action plan has the ambition to achieve seven goals under four thematic pillars, Ports being one of them, (the others are Blue skills, Marine renewables and Coastal resilience).
PILLAR I: Ports as Gateways and Hubs for the Blue EconomyCoastal tourism, Marine living resources, Marine renewable energy and Maritime defence, are centred on or closely interlinked with ports. Ports are at the heart of the maritime shipping industry, they are the departure, entry and transfer points for all goods, services, and persons transported by ship.
Ports can play a major role in the sustainable development of some of the above-mentioned sectors and for the transition to car-bon-free economy. At the same time, the role of port operators as catalysts for blue businesses needs to strengthen. Further, ports must cooperate to mobilise financing for smart infrastructures and better plan the development of capacity to accommodate trade growth. Maritime innovation can help with the decarbonisation of maritime sources through the use of technologies that reduce the carbon produced by vessels (e.g. liquefied natural gas (LNG), hydrogen production, wind propulsion etc.). Installing recharging and refuelling infrastructure for alternative fuels in ports and cargo terminals, including for docked vessels would significantly improve the air quality in coastal communities. The Ports pillar consists of a number of actions embedded in two main goals.
Table 4.2 Goals and Actions and under Pillar 1, Ports, of the new Atlantic action Plan
Source: Atlantic strategy: New Action Plan, own elaboration.
169 https://www.drewry.co.uk/maritime-research/port-throughput-indices-update/port-throughput-indices170 EMSA’s report on COVID-19 for shipping (Nov.2020).171 COM(2011) 782 final.172 COM(2013) 279 final. 173 COM(2020) 329 final.
Goal 1: Ports as gateways for trade in the Atlantic Goal 2: Ports as catalysts for business
Actions
Develop the TEN-T Motorways of the Sea in the Atlantic
Develop a blue accelerator scheme for Atlantic ports to help scale up innovative businesses
Create a network of green ports by 2025 Share best practices, exchange ideas and tackle problems jointly
Foster short-sea shipping links in the Atlantic area to better integrate Ireland Expand data collection beyond traditional (logistics) data
Launch an Atlantic strategy on liquefied natural gas Increase communication and availability of data on the economic potential of ports
Develop eco-incentive schemes to upgrade port infrastructure
Jointly develop waste and handling plans for Atlantic ports
55
2021
4.4.4. INTERACTIONS WITH OTHER SECTORS AND THE ENVIRONMENT Port activities provide the basic infrastructure and services for many other Blue Economy sectors including Marine living resources, Maritime transport, Marine non-living resources, Marine renewable energy, Coastal tourism and Maritime defence and security. Ports are at the heart of the maritime shipping industry, they are the departure, entry and transfer points for all goods, services, and persons travelling by ship. Beyond making use of these key services, ships also dock, refuel, and offload their waste at ports.
In this context, ports may act as facilitators of economic and trade development for their hinterland. On the other hand, ports may compete for space, for instance, with aquaculture and Coastal tourism.
Many European ports are important clusters of energy and indus-try. This role is taken either as provider of clean energy to vessels (for navigation and use while at berth), as import points for clean energy to be used upstream (LNG, hydrogen) or through energy production within their area. In the case of the provision of elec-tricity to vessels, the connections with the energy grid is quite important. Industrial activities can take place also within or close to port areas due to proximity to ease of access to resources or as staging points (for example, the assembly and/ or production of offshore wind equipment174.
Port activities come with challenges, as they can cause local and global environmental impacts such as air pollution, greenhouse gas emissions, waste and garbage generation, noise, ship waste, sediment impacts, dust, water pollution and use of land due to port development175.
174 https://www.espo.be175 ref 2nd draft EMSA-EEA report.176 Sea Europe.177 Balance (2017).
4.5. SHIPBUILDING AND REPAIR
4.5.1. BACKGROUND
The EU shipbuilding industry is a dynamic and competitive sector. With a market share of around 6% of the global order book in terms of compensated gross tonnage176 and 19% in terms of value; for marine equipment, the EU share rises to 50%177; the EU is a major player in the global shipbuilding industry.
The European Shipbuilding industry is currently composed of approximately 300 shipyards specialised in building and repairing the most complex and technologically advanced civilian and naval ships, platforms and other hardware for maritime applications.
The EU specialises in segments of shipbuilding with high level of technology and added value, such as cruise ships, offshore support vessels, fishing, ferries, research vessels, dredgers, mega-yachts, etc. The EU is also a global leader in the production of high-tech, advanced maritime equipment and systems. This spe-cialisation and leadership position is a direct result of the sector’s continuous investments in research and innovation as well as in a highly-skilled workforce.
The global economic and financial crisis of 2008 had a pro-found impact on the industry globally for several years, after which the business model changed and part of the workforce shifted to external subcontractors and suppliers. EU shipbuild-ers are reducing costs and restructuring capacity by adjusting their production programmes and optimising the supply chain. Figures show a significant drop in shipbuilding employment since 2009, yet recent results suggest that the sector is recov-ering, also employment wise.
For the purpose of this report, the Shipbuilding and repair sector includes the following sub-sectors and activities:
(1) Shipbuilding: building of ships and floating structures, building of pleasure and sporting boats, repair and main-tenance of ships and boats.
(2) Equipment and machinery: manufacture of cordage, rope, twine and netting, manufacture of textiles other than apparel, manufacture of sport goods, manufacture of engines and turbines, except aircraft and manufacture of instruments for measuring, testing and navigation.
Shipyards are clearly identified as working 100% in the domain of the Blue Economy. However, the equipment and machinery that is incorporated into the vessels is produced by companies working for both maritime and non-maritime industries (see methodolog-ical Annex for details). In addition, shipbuilding is an industry with multiple indirect and induced effects.
Overall, Shipbuilding and repair accounted for 7% of the jobs, 8% of the GVA and 5% of the profits in the total EU Blue Economy in 2018. The sector has expanded from recent low in 2012-3 and 2015.
56
THE
EU B
LUE
ECO
NO
MY
REPO
RT
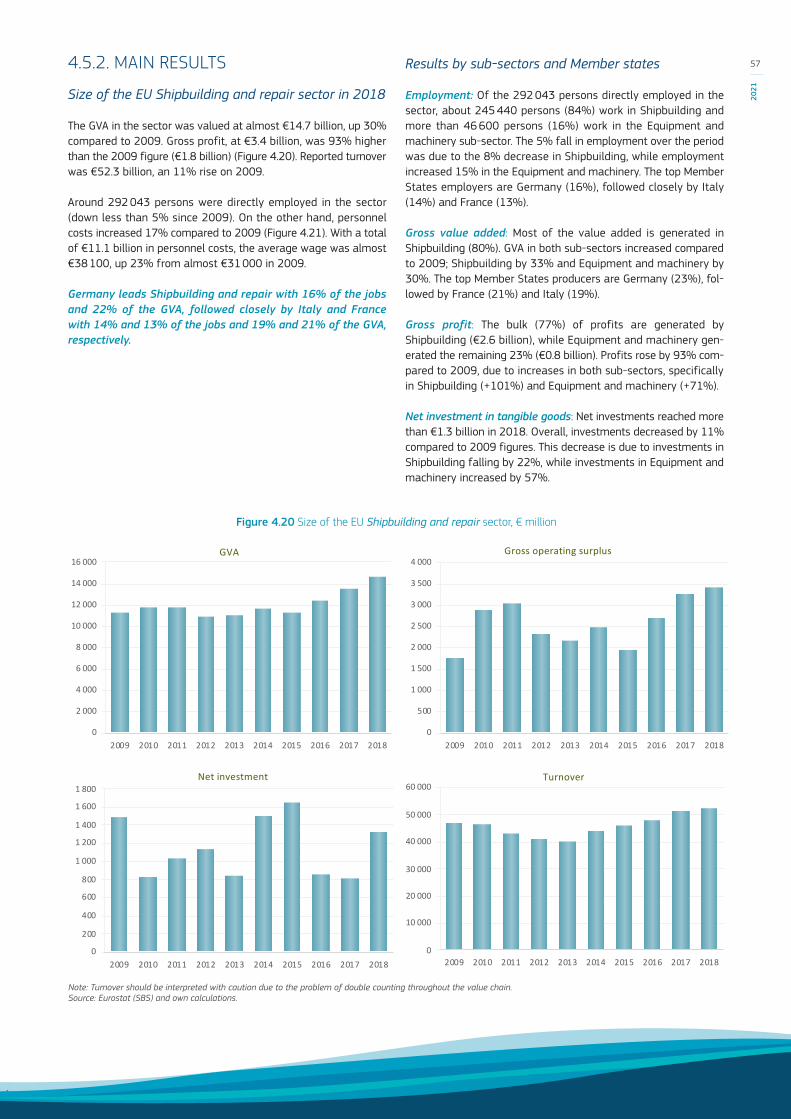
4.5.2. MAIN RESULTS
Size of the EU Shipbuilding and repair sector in 2018
The GVA in the sector was valued at almost €14.7 billion, up 30% compared to 2009. Gross profit, at €3.4 billion, was 93% higher than the 2009 figure (€1.8 billion) (Figure 4.20). Reported turnover was €52.3 billion, an 11% rise on 2009.
Around 292 043 persons were directly employed in the sector (down less than 5% since 2009). On the other hand, personnel costs increased 17% compared to 2009 (Figure 4.21). With a total of €11.1 billion in personnel costs, the average wage was almost €38 100, up 23% from almost €31 000 in 2009.
Germany leads Shipbuilding and repair with 16% of the jobs and 22% of the GVA, followed closely by Italy and France with 14% and 13% of the jobs and 19% and 21% of the GVA, respectively.
Results by sub-sectors and Member states
Employment: Of the 292 043 persons directly employed in the sector, about 245 440 persons (84%) work in Shipbuilding and more than 46 600 persons (16%) work in the Equipment and machinery sub-sector. The 5% fall in employment over the period was due to the 8% decrease in Shipbuilding, while employment increased 15% in the Equipment and machinery. The top Member States employers are Germany (16%), followed closely by Italy (14%) and France (13%).
Gross value added: Most of the value added is generated in Shipbuilding (80%). GVA in both sub-sectors increased compared to 2009; Shipbuilding by 33% and Equipment and machinery by 30%. The top Member States producers are Germany (23%), fol-lowed by France (21%) and Italy (19%).
Gross profit: The bulk (77%) of profits are generated by Shipbuilding (€2.6 billion), while Equipment and machinery gen-erated the remaining 23% (€0.8 billion). Profits rose by 93% com-pared to 2009, due to increases in both sub-sectors, specifically in Shipbuilding (+101%) and Equipment and machinery (+71%).
Net investment in tangible goods: Net investments reached more than €1.3 billion in 2018. Overall, investments decreased by 11% compared to 2009 figures. This decrease is due to investments in Shipbuilding falling by 22%, while investments in Equipment and machinery increased by 57%.
Figure 4.20 Size of the EU Shipbuilding and repair sector, € million
Note: Turnover should be interpreted with caution due to the problem of double counting throughout the value chain.Source: Eurostat (SBS) and own calculations.
0
2 000
4 000
6 000
8 000
10 000
12 000
14 000
16 000
2009 2010 2011 2012 2013 2014 2015 2016 2017 2018
GVA
0
500
1 000
1 500
2 000
2 500
3 000
3 500
4 000
2009 2010 2011 2012 2013 2014 2015 2016 2017 2018
Gross operating surplus
0
200
400
600
800
1 000
1 200
1 400
1 600
1 800
2009 2010 2011 2012 2013 2014 2015 2016 2017 2018
Net investment
0
10 000
20 000
30 000
40 000
50 000
60 000
2009 2010 2011 2012 2013 2014 2015 2016 2017 2018
Turnover
57
2021
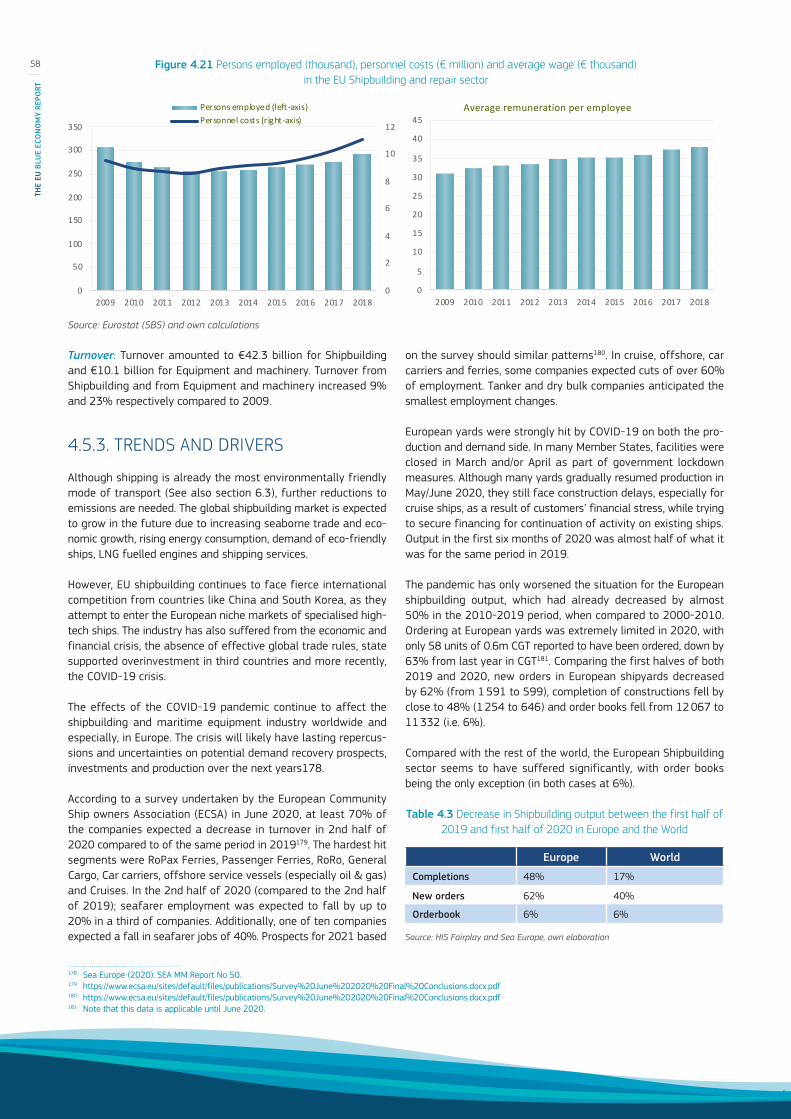
Turnover: Turnover amounted to €42.3 billion for Shipbuilding and €10.1 billion for Equipment and machinery. Turnover from Shipbuilding and from Equipment and machinery increased 9% and 23% respectively compared to 2009.
4.5.3. TRENDS AND DRIVERS
Although shipping is already the most environmentally friendly mode of transport (See also section 6.3), further reductions to emissions are needed. The global shipbuilding market is expected to grow in the future due to increasing seaborne trade and eco-nomic growth, rising energy consumption, demand of eco-friendly ships, LNG fuelled engines and shipping services.
However, EU shipbuilding continues to face fierce international competition from countries like China and South Korea, as they attempt to enter the European niche markets of specialised high-tech ships. The industry has also suffered from the economic and financial crisis, the absence of effective global trade rules, state supported overinvestment in third countries and more recently, the COVID-19 crisis.
The effects of the COVID-19 pandemic continue to affect the shipbuilding and maritime equipment industry worldwide and especially, in Europe. The crisis will likely have lasting repercus-sions and uncertainties on potential demand recovery prospects, investments and production over the next years178.
According to a survey undertaken by the European Community Ship owners Association (ECSA) in June 2020, at least 70% of the companies expected a decrease in turnover in 2nd half of 2020 compared to of the same period in 2019179. The hardest hit segments were RoPax Ferries, Passenger Ferries, RoRo, General Cargo, Car carriers, offshore service vessels (especially oil & gas) and Cruises. In the 2nd half of 2020 (compared to the 2nd half of 2019); seafarer employment was expected to fall by up to 20% in a third of companies. Additionally, one of ten companies expected a fall in seafarer jobs of 40%. Prospects for 2021 based
178 Sea Europe (2020). SEA MM Report No 50.179 https://www.ecsa.eu/sites/default/files/publications/Survey%20June%202020%20Final%20Conclusions.docx.pdf180 https://www.ecsa.eu/sites/default/files/publications/Survey%20June%202020%20Final%20Conclusions.docx.pdf181 Note that this data is applicable until June 2020.
on the survey should similar patterns180. In cruise, offshore, car carriers and ferries, some companies expected cuts of over 60% of employment. Tanker and dry bulk companies anticipated the smallest employment changes.
European yards were strongly hit by COVID-19 on both the pro-duction and demand side. In many Member States, facilities were closed in March and/or April as part of government lockdown measures. Although many yards gradually resumed production in May/June 2020, they still face construction delays, especially for cruise ships, as a result of customers’ financial stress, while trying to secure financing for continuation of activity on existing ships. Output in the first six months of 2020 was almost half of what it was for the same period in 2019.
The pandemic has only worsened the situation for the European shipbuilding output, which had already decreased by almost 50% in the 2010-2019 period, when compared to 2000-2010. Ordering at European yards was extremely limited in 2020, with only 58 units of 0.6m CGT reported to have been ordered, down by 63% from last year in CGT181. Comparing the first halves of both 2019 and 2020, new orders in European shipyards decreased by 62% (from 1 591 to 599), completion of constructions fell by close to 48% (1 254 to 646) and order books fell from 12 067 to 11 332 (i.e. 6%).
Compared with the rest of the world, the European Shipbuilding sector seems to have suffered significantly, with order books being the only exception (in both cases at 6%).
Table 4.3 Decrease in Shipbuilding output between the first half of 2019 and first half of 2020 in Europe and the World
Source: HIS Fairplay and Sea Europe, own elaboration
Figure 4.21 Persons employed (thousand), personnel costs (€ million) and average wage (€ thousand) in the EU Shipbuilding and repair sector
Source: Eurostat (SBS) and own calculations
0
2
4
6
8
10
12
0
50
100
150
200
250
300
350
2009 2010 2011 2012 2013 2014 2015 2016 2017 2018
Persons employed (left-axis)Personnel costs (right-axis)
0
5
10
15
20
25
30
35
40
45
2009 2010 2011 2012 2013 2014 2015 2016 2017 2018
Average remuneration per employee
Europe World
Completions 48% 17%
New orders 62% 40%
Orderbook 6% 6%
58
THE
EU B
LUE
ECO
NO
MY
REPO
RT

Figure 4.22 Share of employment in the EU Shipbuilding and repair sector, 2018
Source: Eurostat (SBS) and own calculations
Figure 4.23 Share of the GVA generated in the EU Shipbuilding and repair sector, 2018
Source: Eurostat (SBS) and own calculations
16%
14%
13%
9%9%
39%
Employment by Member State
Germany
Italy
France
Spain
Poland
Others
84%
16%
Employment by sub-sector
Shipbuilding
Equipment and machinery
80%
20%
Value added by sub-sector
Shipbuilding
Equipment and machinery
23%
21%
19%
7%
5%
25%
Value added by country
Germany
France
Italy
Spain
Netherlands
Others
Figure 4.24 Comparison in Shipbuilding output in Europe between 2019 and 2020
Source: HIS Fairplay in Sea Europe,
100
2 100
4 100
6 100
8 100
10 100
12 100
Completions New orders Orderbook
1st half 2019 1st half 2020
59
2021

4.5.4. INTERACTIONS WITH OTHER SECTORS AND THE ENVIRONMENTShipbuilding provides the assets, capabilities, technologies and knowhow for several Blue Economy activities such as the Primary sector (capture fisheries and offshore aquaculture), Maritime transport, Non-living resources, Marine renewable energy, Coastal tourism (transport) and Maritime defence and security. Shipbuilding and repair is also highly linked to Port activities. The EU Shipbuilding and equipment sectors have new opportunities, especially working alongside growing and emerging sectors, such as assistance vessels and structures for offshore wind farms, as well as, other ocean technologies and the exploration and exploitation of the deep-sea.
Shipbuilding and recycling activities exert pressures to the envi-ronment related to the management of hazardous wastes, waste-water, stormwater, and air emissions generated by vessel con-struction, maintenance, repair and dismantling activities (EBDR).
The potential impact of emissions from shipbuilding operations on their immediate environment can be very significant, espe-cially given that shipyards are inevitably near and on water, which increases the likelihood of propagation of some of those emis-sions, notably due to the hazardous materials (such as asbestos, lead or mercury) it contains in either its structure or equipment. After its construction, ships will continue to have impacts through-out their operational lives, and right through until their final dis-mantling. Regulation (EU) No 1257/2013 on ship recycling aims to prevent, reduce and minimise accidents, injuries and other nega-tive effects on human health and the environment when ships are recycled and the hazardous waste they contain is removed. It also forbids the use of certain hazardous materials. The legislation applies to all ships flying the flag of an EU country and to ves-sels with non-EU flags that call at an EU port or anchorage. The only exceptions are warships, other vessels on non-commercial government service and ships below 500 gross tonnes. Recycling may only take place at facilities listed on the EU list of facilities, which was launched by Commission Implementing Decision (EU) 2016/2323. The facilities may be located in the EU or in non-EU countries. They must comply with a series of requirements related to workers' safety and environmental protection.
182 International Maritime Organization (IMO) expert working group http://www.imo.org183 Swedish Network for Transport and the Environment.184 http://www.imo.org/en/OurWork/Environment/PollutionPrevention/AirPollution/Pages/Greenhouse-Gas-Studies-2014.aspx185 Eurostat’s Passengers embarked and disembarked in all ports by direction - annual data.186 Inland transport is considered part of the Blue Economy because it includes transport of passengers and freight via rivers, canals, lakes and other inland waterways,
including within harbours and ports.
4.6. MARITIME TRANSPORT
4.6.1. BACKGROUND
Maritime transport plays a key role in the world’s economy and holds a crucial contribution to decarbonisation. Shipping is the most carbon-efficient mode of transportation. International maritime shipping accounts for less than 3% of annual global greenhouse gas emissions (CO2)182 and produces less exhaust gas emissions - including nitrogen oxides, hydrocarbons, carbon mon-oxide and sulphur dioxide - for each tonne transported per kilo-metre than air or road transport183. However, given the importance of maritime transport and the prospects of increased maritime transport, it is indispensable that the industry continues to reduce its environmental impact.
Due to the expected growth of the world economy and associated transport demand from world trade, greenhouse gas emissions from shipping could grow from 50% to 250% by 2050 if meas-ures are not taken184, making it paramount for the industry to continue to improve energy efficiency of ships and to shift to alternative fuels.
Maritime transport plays a key role in the EU economy and trade, estimated to represent around 80% of worldwide goods trans-portation and one third of the intra-EU trade. Moreover, almost 420 million passengers aboard cruises and ferries embarked and disembarked at EU ports in 2019, a 1.8 % increase from the pre-vious year185.
In 2019, the total weight of goods transported to/from main ports in the EU-27 by short sea shipping (excludes the movement of cargo across oceans, deep sea shipping) was 1.8 billion tonnes.
For the purpose of this report, Maritime transport includes the following sub-sectors:
(1) Passenger transport: sea and coastal passenger water transport and inland186 passenger water transport;
(2) Freight transport: sea and coastal freight water trans-port and inland freight water transport;
(3) Services for transport: renting and leasing of water transport equipment.
Overall, Maritime transport accounted for 9% of the jobs, 17% of the GVA and 21% of the profits in the EU Blue Economy in 2018. The sector seems to have recovered from the drop in 2016.
60
THE
EU B
LUE
ECO
NO
MY
REPO
RT
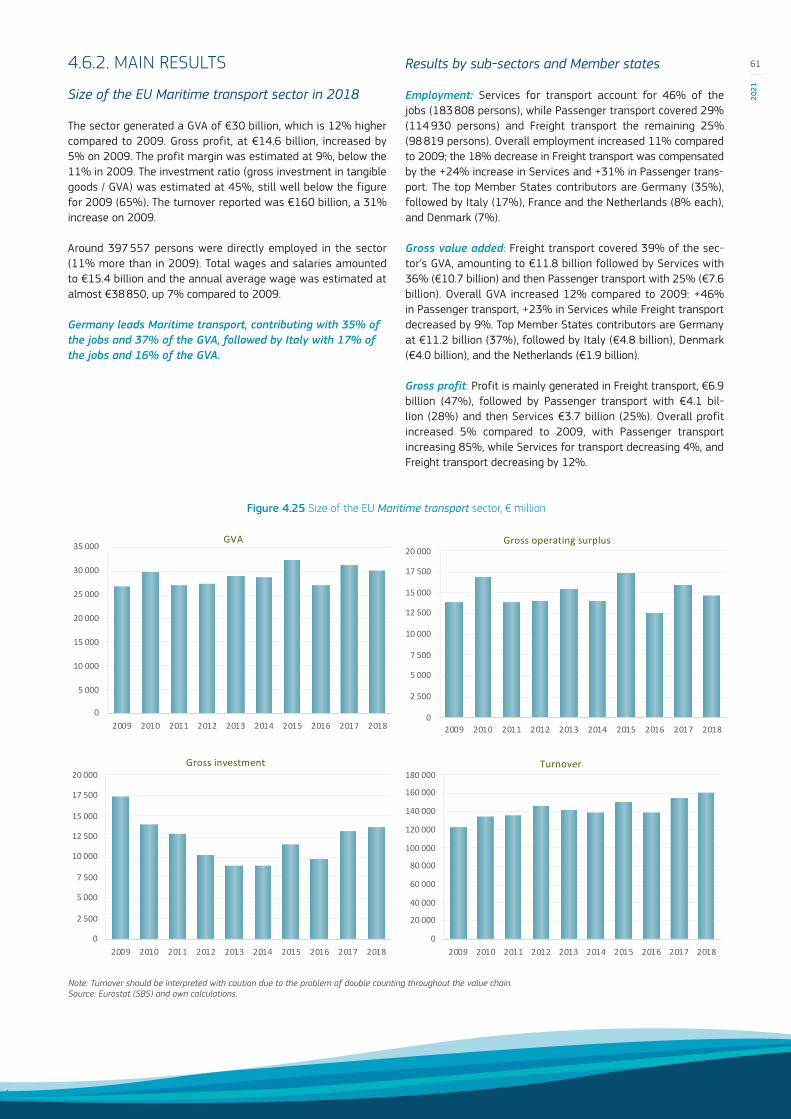
4.6.2. MAIN RESULTS
Size of the EU Maritime transport sector in 2018
The sector generated a GVA of €30 billion, which is 12% higher compared to 2009. Gross profit, at €14.6 billion, increased by 5% on 2009. The profit margin was estimated at 9%, below the 11% in 2009. The investment ratio (gross investment in tangible goods / GVA) was estimated at 45%, still well below the figure for 2009 (65%). The turnover reported was €160 billion, a 31% increase on 2009.
Around 397 557 persons were directly employed in the sector (11% more than in 2009). Total wages and salaries amounted to €15.4 billion and the annual average wage was estimated at almost €38 850, up 7% compared to 2009.
Germany leads Maritime transport, contributing with 35% of the jobs and 37% of the GVA, followed by Italy with 17% of the jobs and 16% of the GVA.
Results by sub-sectors and Member states
Employment: Services for transport account for 46% of the jobs (183 808 persons), while Passenger transport covered 29% (114 930 persons) and Freight transport the remaining 25% (98 819 persons). Overall employment increased 11% compared to 2009; the 18% decrease in Freight transport was compensated by the +24% increase in Services and +31% in Passenger trans-port. The top Member States contributors are Germany (35%), followed by Italy (17%), France and the Netherlands (8% each), and Denmark (7%).
Gross value added: Freight transport covered 39% of the sec-tor’s GVA, amounting to €11.8 billion followed by Services with 36% (€10.7 billion) and then Passenger transport with 25% (€7.6 billion). Overall GVA increased 12% compared to 2009: +46% in Passenger transport, +23% in Services while Freight transport decreased by 9%. Top Member States contributors are Germany at €11.2 billion (37%), followed by Italy (€4.8 billion), Denmark (€4.0 billion), and the Netherlands (€1.9 billion).
Gross profit: Profit is mainly generated in Freight transport, €6.9 billion (47%), followed by Passenger transport with €4.1 bil-lion (28%) and then Services €3.7 billion (25%). Overall profit increased 5% compared to 2009, with Passenger transport increasing 85%, while Services for transport decreasing 4%, and Freight transport decreasing by 12%.
Figure 4.25 Size of the EU Maritime transport sector, € million
Note: Turnover should be interpreted with caution due to the problem of double counting throughout the value chain.Source: Eurostat (SBS) and own calculations.
0
5 000
10 000
15 000
20 000
25 000
30 000
35 000
2009 2010 2011 2012 2013 2014 2015 2016 2017 2018
GVA
0
2 500
5 000
7 500
10 000
12 500
15 000
17 500
20 000
2009 2010 2011 2012 2013 2014 2015 2016 2017 2018
Gross operating surplus
0
2 500
5 000
7 500
10 000
12 500
15 000
17 500
20 000
2009 2010 2011 2012 2013 2014 2015 2016 2017 2018
Gross investment
0
20 000
40 000
60 000
80 000
100 000
120 000
140 000
160 000
180 000
2009 2010 2011 2012 2013 2014 2015 2016 2017 2018
Turnover
61
2021

Gross investment in tangible goods187: Gross investment amounted to €13.7 billion, a 22% plunge compared to 2009. Services received 13% of the sector investment, Passenger transport received 18% and Freight transport received 69%. All sub-sectors saw investments fall substantially compared to 2009: -42% in Services, -35% in Passenger transport, and -11% in Freight transport.
Turnover: Again, turnover is mainly generated in Freight transport, accounting for 59% of the total sector turnover (€94.3 billion), followed by Services at 28% (€44.7 billion) and then Passenger transport with 13% (€21.0 billion). Overall sector’s turnover increased 31% compared to 2009: +33% in Passenger transport, +34% in Services and +29% in Freight transport.
4.6.3. TRENDS AND DRIVERS
As most sectors in the economy, Maritime transport has been particularly hit by the COVID-19 pandemic. Economic shocks like COVID-19 and rising international trade disputes add to the volatility of international trade and cargo volumes in ports188. Projections for 2021 estimate trade growth of 4.2% to 12 billion tonnes, following a 3.6% decrease in 2020.
According to EMSA the number of ship calls declined from 53 035 to 49 908 ship calls, between January 2019 and January 2020, a 6% decrease189. The number of ships calls at EU ports fell by 10.2% in 2020 compared to 2019. Travel restrictions have also significantly reduced the number of passengers carried by ferries, leading to financial difficulties for companies that provide essen-tial connections, in particular to islands and other remote regions The most significantly affected sectors have been the Cruise ships (-85%), Passenger ships (-39%), and Vehicle carriers (-23%)190.
The total number of calls (worldwide) by vessels flying EU Member States flags (EU-27) in 2020 also fell by 3.5% in comparison to 2019; similarly, the related total GT decreased by 11.1%. Due to the lockdown measures put in place across the EU, a significant drop was felt from March 2020 particularly until August 2020, when the negative trend appeared to stabilise.
In 2020, ship traffic from Europe to China and the US had declined when compared to same periods in 2019. The first 39 weeks of 2020 saw a decline in the number of ship calls of 12.5% compared to 2019191. The month of May saw the highest monthly total in 2020 with 65 000 TEU shipped between Europe to Asia, showing -7.5% volumes compared to 2019. However, the China-Europe traffic flow has been almost unaltered, while
187 Net investment in tangible goods unavailable for the sector.188 Notteboom, T.E., Haralambides, H.E. Port management and governance in a post-COVID-19 era: quo vadis?. Marit Econ Logist 22, 329–352 (2020). https://doi.org/10.1057/
s41278-020-00162-7.189 EMSA COVID-19 – impact on shipping – 12 February 2021.190 EMSA COVID-19 – impact on shipping – 8 January 2021.191 In January-April 2020, the ship traffic from Europe to China and the US has declined by 29% and 12% respectively when compared to the same periods in 2019.192 Review of Maritime Transport 2020, UNCTAD, https://unctad.org/system/files/official-document/rmt2020_en.pdf 193 https://www.containerstatistics.com/ 194 Drewry Maritime Financial Insight – January 2021.195 Freightos Baltic Index https://fbx.freightos.com/. Exchange rates are based on ECB November 2020 average (0.8448) https://www.ecb.europa.eu/stats/
policy_and_exchange_rates/euro_reference_exchange_rates/html/eurofxref-graph-usd.en.html 196 http://www.ilo.org/global/about-the-ilo/newsroom/news/WCMS_755390/lang--en/index.htm197 Review of Maritime Transport 2020, UNCTAD, https://unctad.org/system/files/official-document/rmt2020_en.pdf198 https://ec.europa.eu/transport/sites/transport/files/guidelines_for_safe_mass.pdf
the US-Europe route registered a 19.2% reduction. As demand dropped, carriers have reduced supply by idling capacity, which in turn has kept prices stable. The United Nations Conference on Trade and Development (UNCTAD) forecasts maritime trade growth to return to a positive trend and expand by 4.8% in 2021, within the assumption of global economic recovery192. UNCTAD also estimated that the capacity of the largest container vessel went up by 10.9%, benefiting economies of scale.
According to Container Trades Statistics193 demand data, the worldwide decline in demand growth, reaches almost 17% per year on a yearly basis (until April). During the first quarter of 2020, the global demand declined by 8.1%, resulting in a total loss of 4.4 million TEU (twenty-foot equivalent unit) of 2020 cargo compared to 2019. Containership capacity growth is set to slow to a moderate 2.3% in full year 2020. Container shipping markets have seen clear improvements, and though major risks remain, the outlook is more promising than previously. Global container volumes were up 6.9% in September 2020 compared to 2019, and the trend is set to continue rising through a capacity curb194. The period starting from November 2020 saw a dramatic increase in the price of shipping containers in Asia to Europe routes, from about €2 112 in November to €6 893 in February195.
The pandemic negatively affected employment in the sector with around 300 000 seafarers still stranded on vessels196 by mid-Sep-tember 2020. Negative effects were also felt on the recreational boating sector, which includes boat and equipment manufacturers, marinas, as well as boat rental and service providers (BOX 4.4).
UNACT197 reported that, despite the growth in total fleet tonnage, in recent years the increase in vessel size, combined with mul-tiple efficiency gains and the recycling of less efficient vessels, have contributed to a limited growth in carbon dioxide emissions by the sector. As new ship are designed and as more environ-mentally friendly ones replace older, less efficient ones, further gains can be expected. However, these marginal improvements will not be sufficient to meaningfully decrease overall carbon-di-oxide emissions, and more engine and fuel technology changes will be required.
The EGD aims at a 90% reduction in greenhouse emissions by 2050. More and cleaner transport alternatives are needed. The use of information technology, digitalisation and automation will provide opportunities and challenges to the sector, and will con-tribute to more sustainable Maritime transport. The European Commission has been encouraging the use of Autonomous and Sustainable Ships and Shipping, and recently published the EU Operational Guidelines on trials of Maritime Autonomous Surface Ships198.
62
THE
EU B
LUE
ECO
NO
MY
REPO
RT

Figure 4.26 Persons employed (thousand), personnel costs (€ million) and average wage (€ thousand) in the EU Maritime transport sector
Source: Eurostat (SBS) and own calculations
0
2
4
6
8
10
12
14
16
18
0
50
100
150
200
250
300
350
400
450
2009 2010 2011 2012 2013 2014 2015 2016 2017 2018
Persons employed (left-axis)Personnel costs (right-axis)
0
5
10
15
20
25
30
35
40
45
2009 2010 2011 2012 2013 2014 2015 2016 2017 2018
Average remuneration per employee
Figure 4.27 Share of employment in EU Maritime transport sector, 2018
Source: Eurostat (SBS) and own calculations
Figure 4.28 Share of the GVA generated in the EU Maritime transport sector, 2018
Source: Eurostat (SBS) and own calculations
35%
17%8%
8%
7%
25%
Employment by Member State
Germany
Italy
France
Netherlands
Denmark
Others
29%
25%
46%
Employment by sub-sector
Passenger transport
Freight transport
Services for transport
25%
39%
36%
Value added by sub-sector
Passenger transport
Freight transport
Services for transport
25%
39%
36%
Value added by sub-sector
Passenger transport
Freight transport
Services for transport
37%
16%13%
6%
5%
23%
Value added by Member State
Germany
Italy
Denmark
Netherlands
France
Others
63
2021

The Commission also adopted an ambitious strategy (SSMS) for European transport under the umbrella of the EGD199. Sustainability, based on multimodal transport system (for both passengers and freight) and enhanced recharging and refuelling infrastructure for zero emission vehicles, (including ships, boats, ferries) and digitalisation and use of new technologies provide the base for this new strategy.
4.6.4. INTERACTIONS WITH OTHER SECTORS AND THE ENVIRONMENTMaritime transport requires Ports and their infrastructure to operate. Transport companies have an interest in optimising their routes, which may compete in space with other activities such fishing, offshore energy, aquaculture and marine protected areas.From an environmental point of view, maritime transport exerts pressures on the marine environment. Greenhouse gas emissions from shipping and ports contribute to global warming. Air pollu-tion from ships, especially nitrogen and sulphur oxide as well as particulate matter, damages the marine environment and human health, affecting almost 40% of Europeans living within 50 km of the sea200. Overall, these different emissions alter temperature, increase CO2 levels, acidify waters and soils and change nutrient and oxygen levels. They contribute as well to extreme weather events and sea level rise.
When released into the environment, contaminants such as waste and pollution, negatively affect marine fauna and flora. It can pro-duce changes in distribution of species, population size and migra-tion. Pollution events, such as oil spills, can also have dramatic effects on the economy of the affected areas. Other discharges,
199 COM(2020) 789 final.200 Environmental Maritime report of EEA/EMSA, to be published in Q2 2021.
such as marine litter, can impact marine fauna, entangle animals, lead to injuries or kill organisms. Communities may also need to rehabilitate their shorelines. In addition, ships create under-water noise. This noise can produce loss of hearing on marine species, reduction in communication between the species individ-uals, a potential increase in stress levels and various behavioural changes. Maritime transport also accounts for the largest propor-tion of Non-Indigenous Species (NIS) introductions in seas around the EU. NIS and aquatic pathogens can create a threat to local biodiversity, human health and severely damage local economies if they adapt to their new environment.
In addition, Marine habitats for which the greatest number of maritime transport related pressures have been reported are estuaries, large shallow inlets and bays, and sandbanks slightly covered by seawater. These areas are identified as good locations for ports, since they are sheltered from waves and wind.
In synergy with the deployment of alternative marine fuels, efforts under the zero pollution ambition should be made to drastically reduce further emissions to air, water, and the broader environ-mental footprint from the maritime transport sector. Delivering on the establishment of wide ranging ‘Emission Control Areas’ (ECA) in all EU waters with zero pollution to air and water from shipping for the benefits of sea basins, coastal areas and ports should be a priority. In particular, the Commission has spearheaded efforts to replicate the success of existing ECAs in the Mediterranean Sea requiring urgent protection. By 2030, such a designation could cut emissions of SO2 and NOx from international shipping by 80% and 20%, respectively, compared to the current regulations. Moreover, the Commission would aim to start similar work in the Black Sea area where progress is also needed.
Figure 4.29 Ship calls reported to SSN in 2019, 2020 and 2021 per month
Source: EMSA COVID-19 – impact on shipping – 12 February 2021
-35%
-30%
-25%
-20%
-15%
-10%
-5%
0%
5%
10%
15%
-
10 000
20 000
30 000
40 000
50 000
60 000
70 000
80 000
90 000
Jan Fev Mar Apr May Jun Jul Aug Sep Oct Nov Dez
2019 2020 Trend 2019 to 2020
64
THE
EU B
LUE
ECO
NO
MY
REPO
RT
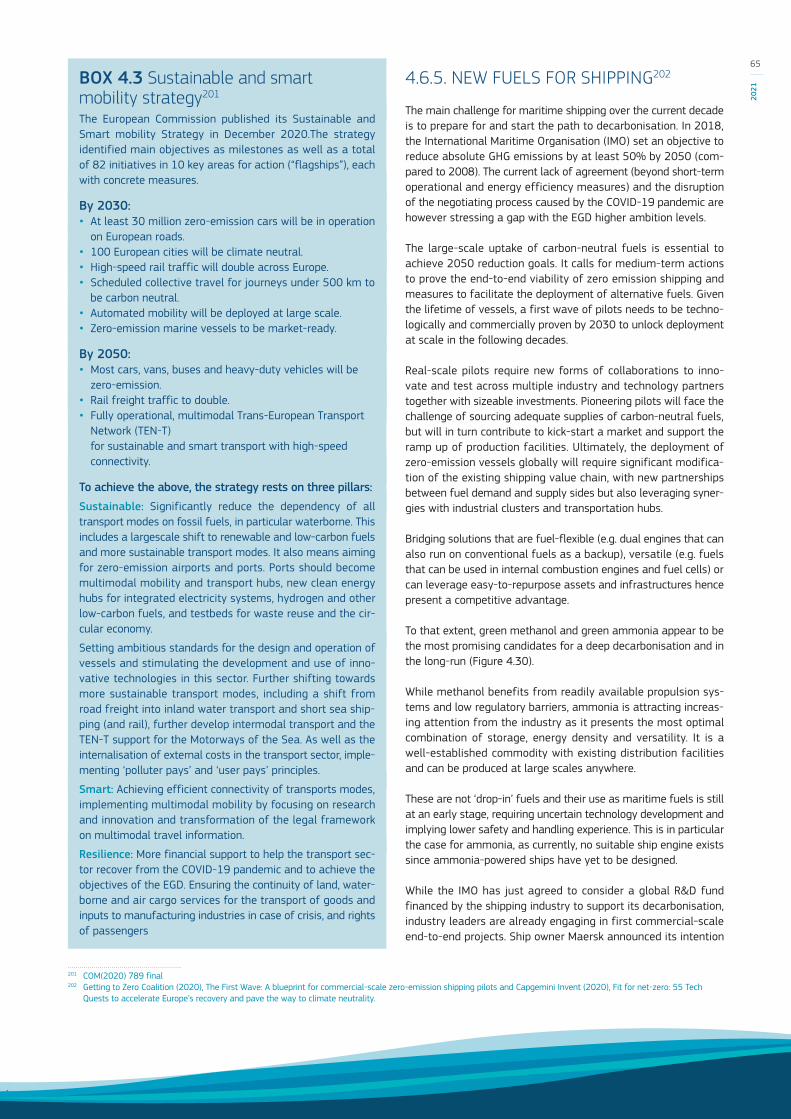
BOX 4.3 Sustainable and smart mobility strategy201 The European Commission published its Sustainable and Smart mobility Strategy in December 2020.The strategy identified main objectives as milestones as well as a total of 82 initiatives in 10 key areas for action (“flagships”), each with concrete measures.
By 2030:• At least 30 million zero-emission cars will be in operation
on European roads.• 100 European cities will be climate neutral.• High-speed rail traffic will double across Europe.• Scheduled collective travel for journeys under 500 km to
be carbon neutral.• Automated mobility will be deployed at large scale.• Zero-emission marine vessels to be market-ready.
By 2050:• Most cars, vans, buses and heavy-duty vehicles will be
zero-emission.• Rail freight traffic to double.• Fully operational, multimodal Trans-European Transport
Network (TEN-T) for sustainable and smart transport with high-speed connectivity.
To achieve the above, the strategy rests on three pillars: Sustainable: Significantly reduce the dependency of all transport modes on fossil fuels, in particular waterborne. This includes a largescale shift to renewable and low-carbon fuels and more sustainable transport modes. It also means aiming for zero-emission airports and ports. Ports should become multimodal mobility and transport hubs, new clean energy hubs for integrated electricity systems, hydrogen and other low-carbon fuels, and testbeds for waste reuse and the cir-cular economy.
Setting ambitious standards for the design and operation of vessels and stimulating the development and use of inno-vative technologies in this sector. Further shifting towards more sustainable transport modes, including a shift from road freight into inland water transport and short sea ship-ping (and rail), further develop intermodal transport and the TEN-T support for the Motorways of the Sea. As well as the internalisation of external costs in the transport sector, imple-menting ‘polluter pays’ and ‘user pays’ principles.
Smart: Achieving efficient connectivity of transports modes, implementing multimodal mobility by focusing on research and innovation and transformation of the legal framework on multimodal travel information.
Resilience: More financial support to help the transport sec-tor recover from the COVID-19 pandemic and to achieve the objectives of the EGD. Ensuring the continuity of land, water-borne and air cargo services for the transport of goods and inputs to manufacturing industries in case of crisis, and rights of passengers
201 COM(2020) 789 final202 Getting to Zero Coalition (2020), The First Wave: A blueprint for commercial-scale zero-emission shipping pilots and Capgemini Invent (2020), Fit for net-zero: 55 Tech
Quests to accelerate Europe’s recovery and pave the way to climate neutrality.
4.6.5. NEW FUELS FOR SHIPPING202
The main challenge for maritime shipping over the current decade is to prepare for and start the path to decarbonisation. In 2018, the International Maritime Organisation (IMO) set an objective to reduce absolute GHG emissions by at least 50% by 2050 (com-pared to 2008). The current lack of agreement (beyond short-term operational and energy efficiency measures) and the disruption of the negotiating process caused by the COVID-19 pandemic are however stressing a gap with the EGD higher ambition levels.
The large-scale uptake of carbon-neutral fuels is essential to achieve 2050 reduction goals. It calls for medium-term actions to prove the end-to-end viability of zero emission shipping and measures to facilitate the deployment of alternative fuels. Given the lifetime of vessels, a first wave of pilots needs to be techno-logically and commercially proven by 2030 to unlock deployment at scale in the following decades.
Real-scale pilots require new forms of collaborations to inno-vate and test across multiple industry and technology partners together with sizeable investments. Pioneering pilots will face the challenge of sourcing adequate supplies of carbon-neutral fuels, but will in turn contribute to kick-start a market and support the ramp up of production facilities. Ultimately, the deployment of zero-emission vessels globally will require significant modifica-tion of the existing shipping value chain, with new partnerships between fuel demand and supply sides but also leveraging syner-gies with industrial clusters and transportation hubs.
Bridging solutions that are fuel-flexible (e.g. dual engines that can also run on conventional fuels as a backup), versatile (e.g. fuels that can be used in internal combustion engines and fuel cells) or can leverage easy-to-repurpose assets and infrastructures hence present a competitive advantage.
To that extent, green methanol and green ammonia appear to be the most promising candidates for a deep decarbonisation and in the long-run (Figure 4.30).
While methanol benefits from readily available propulsion sys-tems and low regulatory barriers, ammonia is attracting increas-ing attention from the industry as it presents the most optimal combination of storage, energy density and versatility. It is a well-established commodity with existing distribution facilities and can be produced at large scales anywhere.
These are not ‘drop-in’ fuels and their use as maritime fuels is still at an early stage, requiring uncertain technology development and implying lower safety and handling experience. This is in particular the case for ammonia, as currently, no suitable ship engine exists since ammonia-powered ships have yet to be designed.
While the IMO has just agreed to consider a global R&D fund financed by the shipping industry to support its decarbonisation, industry leaders are already engaging in first commercial-scale end-to-end projects. Ship owner Maersk announced its intention
65
2021

to operate the world’s first carbon neutral liner vessel in 2023203 (a methanol fuelled feeder vessel) as well as a first of its kind partnership to develop an industrial-scale hydrogen and e-fuel production facility204 in the region of Copenhagen.
Several EU projects are dedicated to proving the feasibility of ammonia ships before 2025 and the topic will be further sup-ported by Horizon Europe partnerships205. The ShipFC project206 gathers European firms and organisations to install the first ammonia-powered fuel cell on a commercial vessel by late 2023. Engine designer MAN Energy Solutions is working to bring the first ammonia-fuelled ship engine to the market by 2024207. Finally, industry driven NoGAPS project208 launched in May 2020 studies the challenges for ammonia supply chains in order to enable the large-scale deployment of ammonia-powered deep-sea vessels in Europe.
203 https://www.maersk.com/news/articles/2021/02/17/maersk-first-carbon-neutral-liner-vessel-by-2023204 https://www.maersk.com/news/articles/2020/05/26/leading-danish-companies-join-forces-on-an-ambitious-sustainable-fuel-project205 https://www.waterborne.eu/images/210222_Joint_Declaration_CHE-ZEWT_final_clean_signed.pdf206 https://cordis.europa.eu/project/id/875156207 https://www.globalmaritimeforum.org/news/why-ammonia-may-be-part-of-the-future-fuel-mix208 https://www.ammoniaenergy.org/articles/maritime-ammonia-ready-for-demonstration/209 https://ec.europa.eu/maritimeaffairs/policy/coastal_tourism_en210 COM(2012) 494 final of 13.9.2012 ‘Blue Growth: opportunities for marine and maritime sustainable growth’.
4.7. COASTAL TOURISM4.7.1. BACKGROUND
Coastal tourism is the biggest sector across the Blue Economy in terms of GVA and employment209. As described in the EU’s Blue Growth strategy, coastal and maritime tourism bears large potential to promote a smart, sustainable and inclusive Europe210. Nevertheless, the sector suffered greatly from the COVID-19 cri-sis. Hence, this section aims to provide an overview regarding the overall size of the sector in 2018, outline the consequences of the pandemic and explores innovative approaches towards sustaina-ble tourism and related leisure activities.
Europe is the most-visited continent, welcoming half of the world’s international tourist arrivals. The EU alone accounts for almost 40% of the world’s international arrivals. Coastal areas and islands tend to be major tourism hotspots. These areas have always been sought for their unique characteristics making them
The first wave
34
Section 1
Exhibit 3. Pros and cons of different fuel options for ‘first mover’ pilots
Fuel production Bunkering Vessel Comment
Strong long-term scalability potential
Emerging consensus as most viable zero emissions-capable fuel
High toxicity levels; lack of existing maritime handling regulations
Existing distribution, but not for fuel purposes
Dual fuel ICE close to market but not yet commercially available
Lower volumetric density relative to HFO
• Likely to be the most scalable fuel option in the long-term
Carbon feedstock procurement can be difficult
Carbon capture technology still at nascent stage with uncertain costs
Soon to be passed maritime handling regulation
Relatively easy to repurpose existing infrastructure
Lower volumetric density relative to HFO
• Proven technology with ease of use throughout value chain
• Carbon procurement can be problematic
Close to cost parity with HFO/MGO for select feedstocks
Long-term scalability concerns due to feedstock and sustaina-bility constraints
Limited/no new bunkering infrastructure required
Drop-in fuel potential
ICE engines available with mature capex
• Proven technology with ease of use throughout value chain
• Doubts about long-term scalability
Multi-sector demand to underpin scale and cost reductions
High flammability; lack of existing maritime handling regulations
Minimal transportation by ship at present (1-2 ships)
ICE options not commercially available
Cost-intensive storage options
• Low technology readiness
• Low economic feasibility in short term
Carbon feedstock procurement can be difficult
Carbon capture technology still at nascent stage with uncertain costs
Limited/no new bunkering infrastructure required
Drop-in fuel potential
ICE engines available with mature capex
• Lowest technology readiness
• Low economic feasibility in short term
Dual fuel ICE available
Focus for the Blueprint
Figure 4.30 Pros and cons of different fuel options for ‘first mover’ pilots - Getting to Zero Coalition (2020)66
THE
EU B
LUE
ECO
NO
MY
REPO
RT
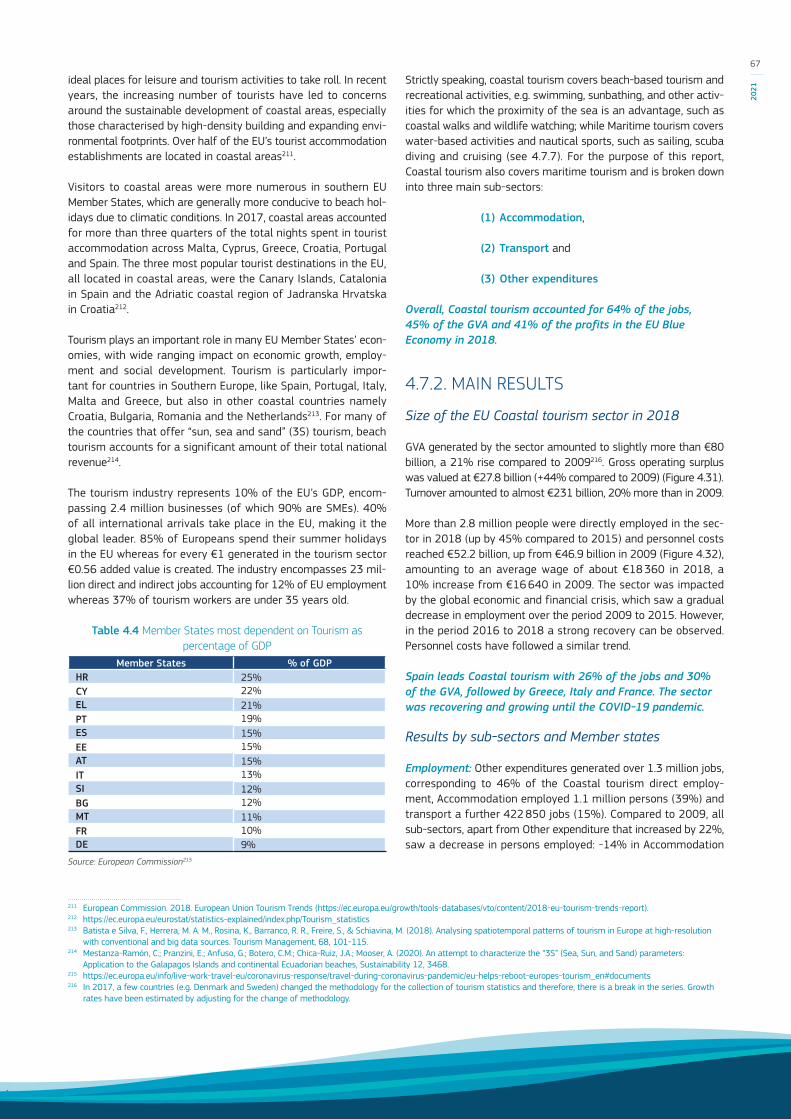
ideal places for leisure and tourism activities to take roll. In recent years, the increasing number of tourists have led to concerns around the sustainable development of coastal areas, especially those characterised by high-density building and expanding envi-ronmental footprints. Over half of the EU’s tourist accommodation establishments are located in coastal areas211.
Visitors to coastal areas were more numerous in southern EU Member States, which are generally more conducive to beach hol-idays due to climatic conditions. In 2017, coastal areas accounted for more than three quarters of the total nights spent in tourist accommodation across Malta, Cyprus, Greece, Croatia, Portugal and Spain. The three most popular tourist destinations in the EU, all located in coastal areas, were the Canary Islands, Catalonia in Spain and the Adriatic coastal region of Jadranska Hrvatska in Croatia212.
Tourism plays an important role in many EU Member States’ econ-omies, with wide ranging impact on economic growth, employ-ment and social development. Tourism is particularly impor-tant for countries in Southern Europe, like Spain, Portugal, Italy, Malta and Greece, but also in other coastal countries namely Croatia, Bulgaria, Romania and the Netherlands213. For many of the countries that offer “sun, sea and sand” (3S) tourism, beach tourism accounts for a significant amount of their total national revenue214.
The tourism industry represents 10% of the EU’s GDP, encom-passing 2.4 million businesses (of which 90% are SMEs). 40% of all international arrivals take place in the EU, making it the global leader. 85% of Europeans spend their summer holidays in the EU whereas for every €1 generated in the tourism sector €0.56 added value is created. The industry encompasses 23 mil-lion direct and indirect jobs accounting for 12% of EU employment whereas 37% of tourism workers are under 35 years old.
Table 4.4 Member States most dependent on Tourism as percentage of GDP
Member States % of GDPHR 25%CY 22%EL 21%PT 19%ES 15%EE 15%AT 15%IT 13%SI 12%BG 12%MT 11%FR 10%DE 9%
Source: European Commission215
211 European Commission. 2018. European Union Tourism Trends (https://ec.europa.eu/growth/tools-databases/vto/content/2018-eu-tourism-trends-report).212 https://ec.europa.eu/eurostat/statistics-explained/index.php/Tourism_statistics213 Batista e Silva, F., Herrera, M. A. M., Rosina, K., Barranco, R. R., Freire, S., & Schiavina, M. (2018). Analysing spatiotemporal patterns of tourism in Europe at high-resolution
with conventional and big data sources. Tourism Management, 68, 101-115.214 Mestanza-Ramón, C.; Pranzini, E.; Anfuso, G.; Botero, C.M.; Chica-Ruiz, J.A.; Mooser, A. (2020). An attempt to characterize the “3S” (Sea, Sun, and Sand) parameters:
Application to the Galapagos Islands and continental Ecuadorian beaches, Sustainability 12, 3468.215 https://ec.europa.eu/info/live-work-travel-eu/coronavirus-response/travel-during-coronavirus-pandemic/eu-helps-reboot-europes-tourism_en#documents216 In 2017, a few countries (e.g. Denmark and Sweden) changed the methodology for the collection of tourism statistics and therefore, there is a break in the series. Growth
rates have been estimated by adjusting for the change of methodology.
Strictly speaking, coastal tourism covers beach-based tourism and recreational activities, e.g. swimming, sunbathing, and other activ-ities for which the proximity of the sea is an advantage, such as coastal walks and wildlife watching; while Maritime tourism covers water-based activities and nautical sports, such as sailing, scuba diving and cruising (see 4.7.7). For the purpose of this report, Coastal tourism also covers maritime tourism and is broken down into three main sub-sectors:
(1) Accommodation,
(2) Transport and
(3) Other expenditures
Overall, Coastal tourism accounted for 64% of the jobs, 45% of the GVA and 41% of the profits in the EU Blue Economy in 2018.
4.7.2. MAIN RESULTS
Size of the EU Coastal tourism sector in 2018
GVA generated by the sector amounted to slightly more than €80 billion, a 21% rise compared to 2009216. Gross operating surplus was valued at €27.8 billion (+44% compared to 2009) (Figure 4.31). Turnover amounted to almost €231 billion, 20% more than in 2009.
More than 2.8 million people were directly employed in the sec-tor in 2018 (up by 45% compared to 2015) and personnel costs reached €52.2 billion, up from €46.9 billion in 2009 (Figure 4.32), amounting to an average wage of about €18 360 in 2018, a 10% increase from €16 640 in 2009. The sector was impacted by the global economic and financial crisis, which saw a gradual decrease in employment over the period 2009 to 2015. However, in the period 2016 to 2018 a strong recovery can be observed. Personnel costs have followed a similar trend.
Spain leads Coastal tourism with 26% of the jobs and 30% of the GVA, followed by Greece, Italy and France. The sector was recovering and growing until the COVID-19 pandemic.
Results by sub-sectors and Member states
Employment: Other expenditures generated over 1.3 million jobs, corresponding to 46% of the Coastal tourism direct employ-ment, Accommodation employed 1.1 million persons (39%) and transport a further 422 850 jobs (15%). Compared to 2009, all sub-sectors, apart from Other expenditure that increased by 22%, saw a decrease in persons employed: -14% in Accommodation
67
2021

and -5% in Transport. The top employers are Spain offering 26% of the jobs (729 700 persons), followed by Greece with 17% (492 390 persons) and then Italy with 11% (307 330 persons).
Gross value added: Most of the value added is generated by the Accommodation sub-sector: €37.6 million (47% of the total), followed by Other expenditure €24.5 million (31%) and Transport almost €18.0 million. Compared to 2009, all sub-sectors saw substantial increases in GVA: +11% in Accommodation, +32% in Other expenditure and +27% in Transport.
Gross profit: The bulk of profits are generated by the Accommodation sub-sector (€15.4 billion, 55%), followed by Other expenditure (24%) and Transport (21%). Compared to 2009, gross operating surplus increased for all sub-sectors: +48% in Accommodation, +14% in Other expenditure and +88% in Transport.
217 https://ec.europa.eu/maritimeaffairs/content/blue-growth-%E2%80%93-shaping-next-five-years-together_en
Turnover: Other expenditure generated €86.7 billion in turnover, followed by the Accommodation sub-sector with €77.7 billion and then Transport (€66.1 billion). Compared to 2009, all sub-sec-tors saw a turnover increase: +12% Accommodation, +26% Other expenditure and +22% Transport.
4.7.3. TRENDS AND DRIVERS
The growth rate in the tourism sector has accelerated since the recession that followed the 2008 financial crisis positively impact-ing on the EU economy. Sustained growth has been instrumental in supporting the economic recovery of many Member States, largely contributing to job creation, GDP and the balance of payments.
EU policy aims to maintain Europe's standing as a leading tourist destination while maximising the industry's contribution to growth and employment. As part of the EU's Blue Growth strategy, the coastal and maritime tourism sector has been identified as an area with special potential to foster a smart, sustainable and inclusive Europe217.
Figure 4.31 Size of the EU Coastal tourism sector, € million
Note: Turnover should be interpreted with caution due to the problem of double counting throughout the value chain. Gross investment is not available for Coastal Tourism.Source: Eurostat (SBS) and own calculations.
0
10 000
20 000
30 000
40 000
50 000
60 000
70 000
80 000
90 000
2009 2010 2011 2012 2013 2014 2015 2016 2017 2018
GVA
0
5 000
10 000
15 000
20 000
25 000
30 000
2009 2010 2011 2012 2013 2014 2015 2016 2017 2018
Gross operating surplus
0
50 000
100 000
150 000
200 000
250 000
2009 2010 2011 2012 2013 2014 2015 2016 2017 2018
Turnover
68
THE
EU B
LUE
ECO
NO
MY
REPO
RT
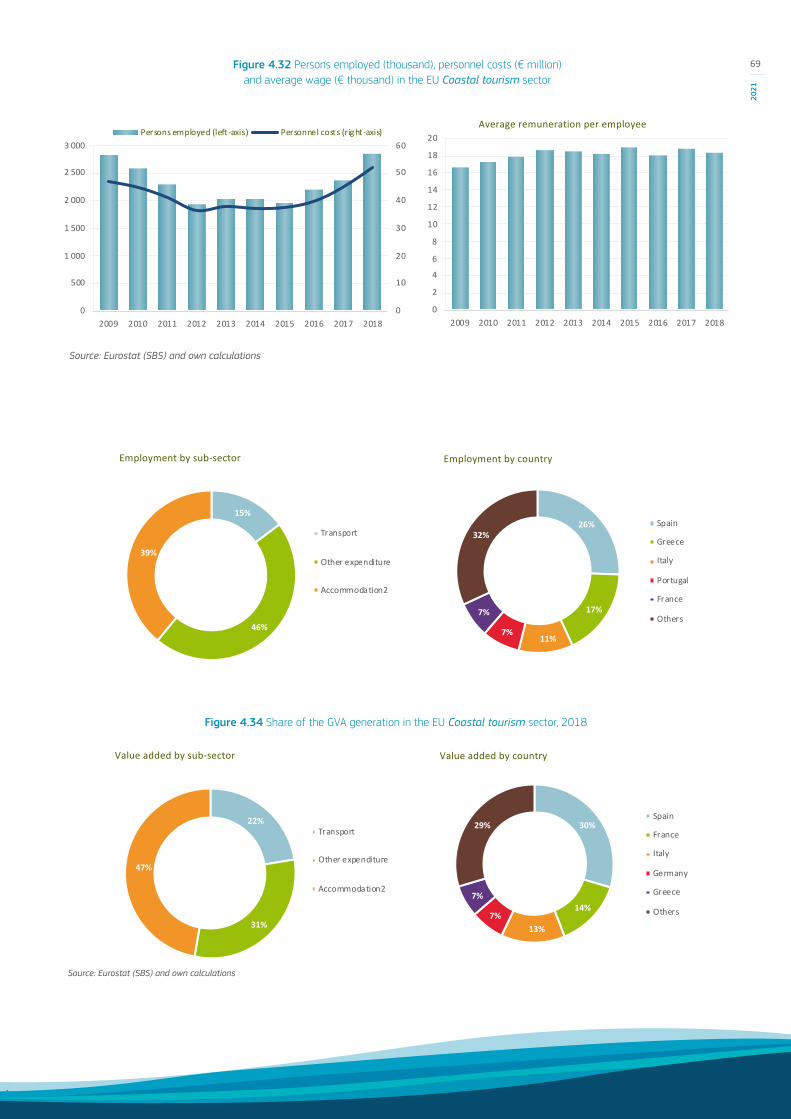
Figure 4.33 Share of employment in the EU Coastal tourism sector, 2018
Figure 4.34 Share of the GVA generation in the EU Coastal tourism sector, 2018
Source: Eurostat (SBS) and own calculations
15%
46%
39%
Employment by sub-sector
Transport
Other expenditure
Accommodation2
26%
17%
11%7%
7%
32%
Employment by country
Spain
Greece
Italy
Portugal
France
Others
22%
31%
47%
Value added by sub-sector
Transport
Other expenditure
Accommodation2
22%
31%
47%
Value added by sub-sector
Transport
Other expenditure
Accommodation2
30%
14%
13%7%
7%
29%
Value added by country
Spain
France
Italy
Germany
Greece
Others
Figure 4.32 Persons employed (thousand), personnel costs (€ million) and average wage (€ thousand) in the EU Coastal tourism sector
Source: Eurostat (SBS) and own calculations
0
10
20
30
40
50
60
0
500
1 000
1 500
2 000
2 500
3 000
2009 2010 2011 2012 2013 2014 2015 2016 2017 2018
Persons employed (left-axis) Personnel costs (right-axis)
0
2
4
6
8
10
12
14
16
18
20
2009 2010 2011 2012 2013 2014 2015 2016 2017 2018
Average remuneration per employee
69
2021

While good for development, the increase in tourist numbers has brought its own challenges, and many destinations, in particular coastal areas and small islands, strive to find sustainable ways to cope with the high tourism intensity.
The health crisis is leading to change in tourist preferences that may persist beyond the short term. For instance, during the summer of 2020, even if the conditions for travelling were met, the fear of contamination affected the willingness to travel and the prefer-ence for holiday destinations218. Tourists have been looking for more national and nature-based destinations, and tourist destinations with less risk of overcrowding219; and coastal areas are considered as overcrowded destinations during the summer.
Therefore, some places have been hit harder by the severe eco-nomic impact. Analysis of local transaction and unemployment data has found coastal areas to be disproportionately impacted by COVID-19. They have experienced some of the largest drops in local spending, as well as the highest rises in unemployment, due to the significant role that retail, hospitality and tourism sector paly in their local economies220, a problem exacerbated by the season-ality of the sector. Usually, smaller seaside towns show greater dependence on the tourism sector as key employer and driver of economic activity221.
The crisis began in March 2020, hitting coastal tourism businesses and activities at the worse time, i.e. when lower cash level times. Coastal activities usually rely on Easter as an income boost to sta-bilise finances and repay winter debts222. With the 2020 widespread lockdowns, this essential recovery period may have not taken place. A slow and long-term recovery process is expected with many activ-ities not being able to overcome the crisis. As leisure spending dete-riorates for many households, a fast recovery of tourism demand will be hindered by the economic slow-down223.
More uncertain is the impact of BREXIT on coastal tourism. Almost 60 million tourists from the United Kingdom visited the EU every year224, with the most popular destinations being Spain, Italy, France and Ireland. It is yet to be seen if after COVID-19, British tourists will continue to visit the EU in such large numbers.
218 Marques Santos, A., Madrid, C., Haegeman, K. and Rainoldi, A., (2020). Behavioural changes in tourism in times of Covid-19, EUR 30286 EN, Publications Office of the European Union, Luxembourg, ISBN 978-92-76-20401-5 (online), doi:10.2760/00411.
219 Marques Santos, A., Madrid, C., Haegeman, K. and Rainoldi, A., (2020). Behavioural changes in tourism in times of Covid-19, EUR 30286 EN, Publications Office of the European Union, Luxembourg, ISBN 978-92-76-20401-5 (online), doi:10.2760/00411.
220 Tomson, W. (2020). COVID-19 & Coastal Communities: Investing in the social economy to revive seaside resorts and coastal towns. Social Investment Business, July 2020.221 Beatty, C., Fothergill, S., & Wilson, I. (2008). England’s seaside towns: A ‘benchmarking’ study. Her Majesty’s Stationery Office.222 Zielinski, S., & Botero, C. M. (2020). Beach tourism in times of COVID-19 pandemic: critical issues, knowledge gaps and research opportunities. International Journal of
Environmental Research and Public Health, 17(19), 7288.223 Grech, V., Grech, P., & Fabri, S. (2020). A risk balancing act–tourism competition using health leverage in the COVID-19 era. International Journal of Risk & Safety in
Medicine, (Preprint), 1-5.224 https://www.etias.us/will-brexit-affect-tourism/225 Renaud, L. (2020). Reconsidering global mobility–distancing from mass cruise tourism in the aftermath of COVID-19. Tourism Geographies, 22(3), 679-689.226 Couto, G., Castanho, R. A., Pimentel, P., Carvalho, C., Sousa, Á., & Santos, C. (2020). The impacts of COVID-19 crisis over the tourism expectations of the Azores archipelago
residents. Sustainability, 12(18), 7612.227 Prideaux, B., Thompson, M., & Pabel, A. (2020). Lessons from COVID-19 can prepare global tourism for the economic transformation needed to combat climate change.
Tourism Geographies, 22(3), 667-678.228 Marques Santos, A., Madrid, C., Haegeman, K. and Rainoldi, A., (2020). Behavioural changes in tourism in times of Covid-19, EUR 30286 EN, Publications Office of the
European Union, Luxembourg, ISBN 978-92-76-20401-5 (online), doi:10.2760/00411.229 Hall, C. M., Scott, D., & Gössling, S. (2020). Pandemics, transformations and tourism: be careful what you wish for. Tourism Geographies, 22(3), 577-598.
Marques Santos, A., Edwards, J. and Laranja, M., From Digital Innovation to “Smart Tourism Destination”: Stakeholders’ reflections in times of a pandemic, European Commission, 2021, JRC123390.
230 https://ec.europa.eu/info/strategy/priorities-2019-2024/european-green-deal_en231 UNWTO (2021, February 6). Impact assessment of Covid-19 outbreak in international tourism. https://www.unwto.org/
impact-assessment-of-the-covid-19-outbreak-on-international-tourism232 https://read.oecd-ilibrary.org/view/?ref=124_124984-7uf8nm95se&title=Covid-19_Tourism_Policy_Responses233 https://ec.europa.eu/commission/presscorner/detail/en/FS_20_851
On the other hand, a change in government and private sector approach to tourism could push forward an optimistic scenario225. Studies show that tourists are willing to pay more for safer vaca-tions226. The COVID-19 recovery could thus contribute to the on-go-ing global transformation of the current economic system towards a carbon neutral one227, together with other market trends. Indeed, it is expected that tourists will look for more eco-friendly solutions for holidays in the future, as a result of the COVID-19 crisis228. For many industry experts, this is a transformative opportunity leading to a greater and faster adaption of more sustainable environmental solutions and a greater social appreciation of coastal natural and cultural values229. The EGD and the new EU growth strategy can help in such green transitions, thanks to policy reforms, specific financial mechanisms, as well as innovation, digitalisation, educa-tion and training230.
4.7.4. COVID-19 IMPACTS
The world is facing an unprecedented global health, social and eco-nomic crisis as result of the COVID-19 pandemic. According to the UN-World Trade Organization (UNWTO), among the most affected sectors is Travel and Tourism. Global travel restrictions, with periods of fully closed borders to contain the virus, has led to a substan-tial reduction of international demand since 2020231. Indeed, the outbreak of COVID-19 in Europe in February 2020 has put the EU tourism industry under unprecedented pressure.
With the absence of tourists as well as cancellations of cultural, sporting and business events, the tourism sector is one of the most affected with an estimated drop of 60-80% of tourism activity232. It is estimated that 6 million employees lost their job (out of 23 million). Moreover, there is a significant estimated loss of revenue: 85% hotels and restaurants, 85% tour operators, 85% long dis-tance rail and 90% cruises and airlines233.
The impact of the COVID-19 crisis particularly affected countries heavily relying on Coastal tourism: Greece (-12% in overall GDP), Croatia (-10%), Malta and Spain (both -9%). Due to strong reli-ance on air travel, these countries registered a decline in Coastal tourism whereas countries such as Denmark, Germany, France, the
70
THE
EU B
LUE
ECO
NO
MY
REPO
RT
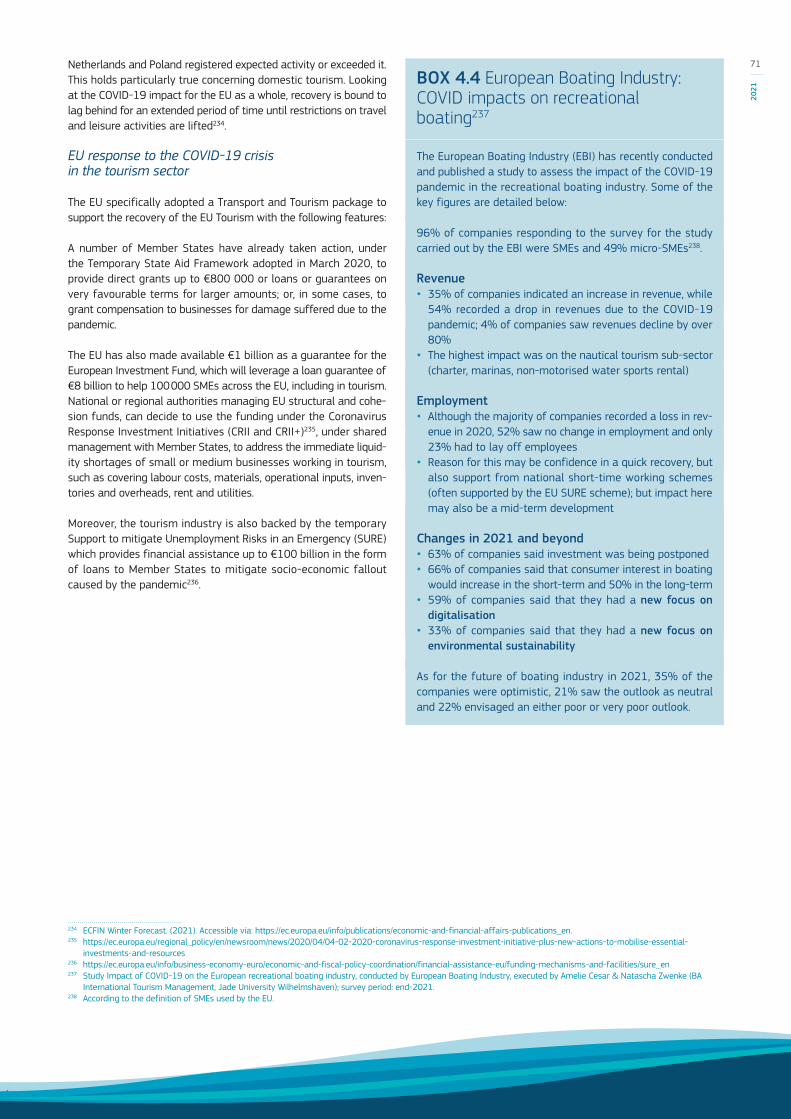
Netherlands and Poland registered expected activity or exceeded it. This holds particularly true concerning domestic tourism. Looking at the COVID-19 impact for the EU as a whole, recovery is bound to lag behind for an extended period of time until restrictions on travel and leisure activities are lifted234.
EU response to the COVID-19 crisis in the tourism sector
The EU specifically adopted a Transport and Tourism package to support the recovery of the EU Tourism with the following features:
A number of Member States have already taken action, under the Temporary State Aid Framework adopted in March 2020, to provide direct grants up to €800 000 or loans or guarantees on very favourable terms for larger amounts; or, in some cases, to grant compensation to businesses for damage suffered due to the pandemic.
The EU has also made available €1 billion as a guarantee for the European Investment Fund, which will leverage a loan guarantee of €8 billion to help 100 000 SMEs across the EU, including in tourism. National or regional authorities managing EU structural and cohe-sion funds, can decide to use the funding under the Coronavirus Response Investment Initiatives (CRII and CRII+)235, under shared management with Member States, to address the immediate liquid-ity shortages of small or medium businesses working in tourism, such as covering labour costs, materials, operational inputs, inven-tories and overheads, rent and utilities.
Moreover, the tourism industry is also backed by the temporary Support to mitigate Unemployment Risks in an Emergency (SURE) which provides financial assistance up to €100 billion in the form of loans to Member States to mitigate socio-economic fallout caused by the pandemic236.
234 ECFIN Winter Forecast. (2021). Accessible via: https://ec.europa.eu/info/publications/economic-and-financial-affairs-publications_en.235 https://ec.europa.eu/regional_policy/en/newsroom/news/2020/04/04-02-2020-coronavirus-response-investment-initiative-plus-new-actions-to-mobilise-essential-
investments-and-resources236 https://ec.europa.eu/info/business-economy-euro/economic-and-fiscal-policy-coordination/financial-assistance-eu/funding-mechanisms-and-facilities/sure_en237 Study Impact of COVID-19 on the European recreational boating industry, conducted by European Boating Industry, executed by Amelie Cesar & Natascha Zwenke (BA
International Tourism Management, Jade University Wilhelmshaven); survey period: end-2021.238 According to the definition of SMEs used by the EU.
BOX 4.4 European Boating Industry: COVID impacts on recreational boating237
The European Boating Industry (EBI) has recently conducted and published a study to assess the impact of the COVID-19 pandemic in the recreational boating industry. Some of the key figures are detailed below:
96% of companies responding to the survey for the study carried out by the EBI were SMEs and 49% micro-SMEs238.
Revenue • 35% of companies indicated an increase in revenue, while
54% recorded a drop in revenues due to the COVID-19 pandemic; 4% of companies saw revenues decline by over 80%
• The highest impact was on the nautical tourism sub-sector (charter, marinas, non-motorised water sports rental)
Employment • Although the majority of companies recorded a loss in rev-
enue in 2020, 52% saw no change in employment and only 23% had to lay off employees
• Reason for this may be confidence in a quick recovery, but also support from national short-time working schemes (often supported by the EU SURE scheme); but impact here may also be a mid-term development
Changes in 2021 and beyond • 63% of companies said investment was being postponed • 66% of companies said that consumer interest in boating
would increase in the short-term and 50% in the long-term• 59% of companies said that they had a new focus on
digitalisation • 33% of companies said that they had a new focus on
environmental sustainability
As for the future of boating industry in 2021, 35% of the companies were optimistic, 21% saw the outlook as neutral and 22% envisaged an either poor or very poor outlook.
71
2021

BOX 4.5 Estimating the impact of COVID-19 through google searches
Google trends analyses the popularity of top search queries in Google Search across various regions, languages and time. It allows comparing the relative search volume of searches between two or more terms. Considering that at the moment there is still a lack of disaggregated and refined data on the COVID-19 impact on tourism, Google trends can be used as proxy of tourists’ interest. Due its nature, the data in this case is mainly related to non-domestic tourists seeking further information on potential destinations. The data used in this analysis was collected by the World Travel & Tourism Council (WTTC)239.
Generally speaking, it is noticeable a step decrease in the “Sun & Beach” searches240 in the beginning of March 2020 reaching a decrease of over -60% on searches in EU countries against less than -40% for non-EU. This is coincident with the first widespread lockdowns initi-ated by national governments on March 2020241. The slight recover in May 2020 is due the gradual lift of most travel restrictions. During the rest of the year, values in EU fluctuated around -40% when compared with the previous 2019 year (figure 4.35).
While similar, when comparing the decrease in EU Google search for “Sun & Beach” segment with the Non-EU countries, EU had throughout most 2020 a higher decrease in searches. Only in the period July to August was the decrease less evident in EU than in the rest of the non-EU countries. Overall, since March 2020, the percentage change in non-EU countries was on average -32% and for EU -41%.
When compared with other tourism segments, “Sun and Beach” is the one where Google searches decreased the most since March 2020, below represented by the dark blue line in figure 5. As state before, it dropped on average by -42%, followed by “Urban” and “Family” with -38%, “Culture” with -34%, “Travel Services” with -28% and the less affected “Adventure” with -16%. During entire post-lockdown period, the “Adventure” segment was the relatively most searched. During summer, “Travel Services” followed a similar trajectory being the second-least decreasing. This could be linked with “Adventure” activities and locations where take place often requiring a tour or local operator.
239 In this analysis, as EU countries the following were considered: Denmark, France, Germany, Greece, Italy, Netherlands, Portugal and Spain. Non-EU countries used in the analysis: Argentina, Australia, Brazil, Canada, Colombia, Egypt, Ethiopia, India, Indonesia, Jamaica, Japan, Kenya, Malaysia, Mexico, New Zealand, Peru, Philippines, Russia, Saudi Arabia, South Africa, South Korea, Thailand, Turkey, United Arab Emirates, United Kingdom, United States of America.
240 Each segment has been constructed by putting together a set of ~20 keywords covering popular activities, sites and destination. Example keywords for “Sun & Beach” include beach, surf, etc.
241 Flaxman, S.; Mishra, S.; Gandy, A.; Unwin, A.J.T.; Mellan, T.A.; Coupland, H.; Whittaker, C.; Zhu, H.;Bhatt, S. (2020). Estimating the effects of non-pharmaceutical interventions on COVID-19 in Europe. Nature, 584, 257–261.
Figure 4.35A Percentage change in Google travel searches in 2020 for
“Sun and Beach” segment compared to corresponding week in 2019.
Figure 4.35 B Percentage change in EU Google travel searches in 2020 for tourism segments compared to
corresponding week in 2019.
Source: Own elaboration from WTTC data.
72
THE
EU B
LUE
ECO
NO
MY
REPO
RT

4.7.5. TOURISM CAPACITY IN COASTAL AREASThe estimated accommodation capacity, allows understanding the coastal tourism importance per NUTS3 region (Figure 4.36). Most regions have high shares of rooms located within the 10 km range, an indication of how coasts are the main tourism driver and visitors attraction.
Figure 4.36 Share of accommodation capacity (number of rooms) in coastal areas per NUTS3.
Source: Batista e Silva and others (2020)242.
When looking at absolute values, Italy is the EU country with most accommodation capacity in coastal areas with 916 000 rooms, followed by Spain (670 000), Greece (585 000), France (495 000) and Croatia (345 000). From the coastal countries, the ones with the least sum are Estonia (13 200 thousand), Lithuania (9 900 thousand), Finland (9 400 thousand), Slovenia (9 100 thousand) and finally Latvia with 8 500 thousand rooms (Figure 4.37).
Cyprus presents the highest average number of coastal rooms per NUTS3 (76 000 coastal rooms per NUTS3). This may due the entire island being considered one unique region. Together with Bulgaria (almost 53 000), Croatia (49 000) and Romania (46 000) are the countries with highest averages. The lower averages are found in Estonia (4 100), Netherlands (4 000) and Finland (1 500 coastal rooms per NUTS3). According to the definition of coastal tourism applied in this section to differentiate between typologies243, rooms located in coastal cities are classified as urban. This might partially explain the lower Dutch and Finish values (Figure 4.37).
242 Batista e Silva, F., Barranco, R., Proietti, P., Pigaiani, C., & Lavalle, C. (2020). A new European regional tourism typology based on hotel location patterns and geographical criteria. Annals of Tourism Research, 103077.
243 Coastal zones are delineated by applying a 10 km-straight line buffer to the coastline (Eurogeographics, EuroBoundaryMap, https://eurogeographics.org/maps-for-europe/ebm/. Copernicus EU-DEM, https://land.copernicus.eu/imagery-in-situ/eu-de). If an area is both a city and a coastal zone (e.g. Barcelona, Copenhagen), then we assume the city is the main driver of visitors. Similarly, if an area is both part of a coastal area and a mountain (not common, but may occur in, for example, Crete, Liguria and Sardinia), then we assume the coastal traits have higher prevalence in driving visitors to the area. The resulting layer was then overlaid with a 100m2 ‘hotel grid layer’ with the number of rooms in tourism accommodation, obtaining the coastal tourism capacity within each NUTS3. Regions where most accommodation capacity is located within the 10 km buffer were classified has coastal. It was additionally decided to consider all islands within this class. See for further details: Batista e Silva, F., Barranco, R., Proietti, P., Pigaiani, C., & Lavalle, C. (2020). A new European regional tourism typology based on hotel location patterns and geographical criteria. Annals of Tourism Research, 103077.
244 Barranco, R., Batista e Silva, F., Jacobs-Crisioni, C., Proietti. P., Pigaiani. C., Kavalov. B., Kucas, A., Kompil., M., Vandecasteele, I., Lavalle. C., Rainoldi. A., Characterisation of tourism expenditure in EU regions, JRC, European Commission 2020.
245 Batista e Silva, F., Herrera, M. A. M., Rosina, K., Barranco, R. R., Freire, S., & Schiavina, M. (2018). Analysing spatiotemporal patterns of tourism in Europe at high-resolution with conventional and big data sources. Tourism Management, 68, 101-115.
246 Marques Santos et al. (2020). Behavioural changes in tourism in times of COVID-19, EUR 30286 EN, Publications Office of the European Union, Luxembourg, doi:10.2760/00411.
EU-27 NUTS3 regions have on average 15 000 rooms, with Mallorca in Spain reaching the maximum value of 173 000, fol-lowed by Rhodes in Greece with 117 000, Burgas province in Bulgaria with 109 000, Algarve in Portugal with 105 000 and Istria in Croatia with 101 000 room completing the top 5.
At EU level, the majority of tourism expenditure is generated in the summer months and takes place in coastal regions (Figure 4.38). Such regions are predominantly oriented to beach tourism and thus highly affected by seasonality. In 2018, the total nights spent was over 95 million with the exceptional summer peak generating over €73 billion and representing 41% of the annual tourism expenditure in these regions. Moreover, the majority of the nights spent on islands and coasts originated from foreign tourists resulting in €113 billion (Figure 4.38)244. In general, these regions have also higher tourism intensity levels, with an aver-age 12.3 nights spent per local inhabitant, turning them among some of the most vulnerable to shocks in the tourism sector (e.g. Mediterranean, Atlantic, Baltic and in the Black sea).
Vulnerability in coastal regions
The tourism vulnerability index is calculated by taking into account two indicators: tourism intensity and seasonality. Tourism inten-sity is computed as the ratio of regional tourists per resident. Seasonality is the degree to which touristic activity is concentrated in one season. Regions with more tourists per inhabitant (higher intensity), and where touristic activity is concentrated in shorter periods (higher seasonality) are considered more vulnerable. EU NUTS3 regions were classified in four categories according to the relative vulnerability of their tourism sectors, ranging from Low, to Medium, High and Very High245. Regions with a higher tourism vulnerability index are also those where employment generated by tourism activities is most important (Table 4.5).
Table 4.5 Contribution of tourism sector (net overall effect)
to regional employment, by category of the regional vulnerability to tourism index, EU-27, 2018
Regional vulnerability to tourism index
Contribution of tourism sector to total employment (% Total)
Low 6.3%
Medium 11.1%
High 13.0%
Very High 18.1%
Source: Marques Santos et al. (2020)246.
73
2021

Figure 4.37 Tourism accommodation capacity in coastal areas per NUTS3 (sum and average rooms) 2018.
Source: Batista e Silva and others (2020)247.
Figure 4.38 Top: Tourism total annual expenditure by typology and season for 2018. Bottom: Tourism total annual expenditure by typology and tourism origin in 2018. € million.
Source: Barranco et al. (2020)248.
247 Batista e Silva, F., Barranco, R., Proietti, P., Pigaiani, C., & Lavalle, C. (2020). A new European regional tourism typology based on hotel location patterns and geographical criteria. Annals of Tourism Research, 103077.
248 Barranco, R., Batista e Silva, F., Jacobs-Crisioni, C., Proietti. P., Pigaiani. C., Kavalov. B., Kucas, A., Kompil., M., Vandecasteele, I., Lavalle. C., Rainoldi. A., Characterisation of tourism expenditure in EU regions, JRC, European Commission 2020.
0 5 10 15 20 25
-
10 000
20 000
30 000
40 000
50 000
60 000
70 000
80 000
90 000
-100 000 200 000
300 000 400 000
500 000 600 000 700 000
800 000 900 000
1 000 000
IT ES EL FR HR UK DK BG DE PT CY PL IE SE RO NL MT BE EE LT FI SI LV
Tourism accomodation capacity: 2018Sum and average rooms in coastal areas
Sum Average
38 095 31 233 66 655
41 513 22 826
29 981 25 580
83 342
27 593
17 166
12 435 10 280
29 808
10 653
7 530
-20 000 40 000 60 000 80 000
100 000 120 000 140 000 160 000 180 000 200 000
Cities Urban mixed Coast Nature Rural
Total expenditure per tourist origin: Million €
Domestic Intra-EU
Extra-EU
23167 20332
73293
23638
15219
0
10000
20000
30000
40000
50000
60000
70000
80000
Cities Urban mixed Coast Nature Rural
Expenditure by typology and season: Million € Spring Summer
Autumn Winter
74
THE
EU B
LUE
ECO
NO
MY
REPO
RT
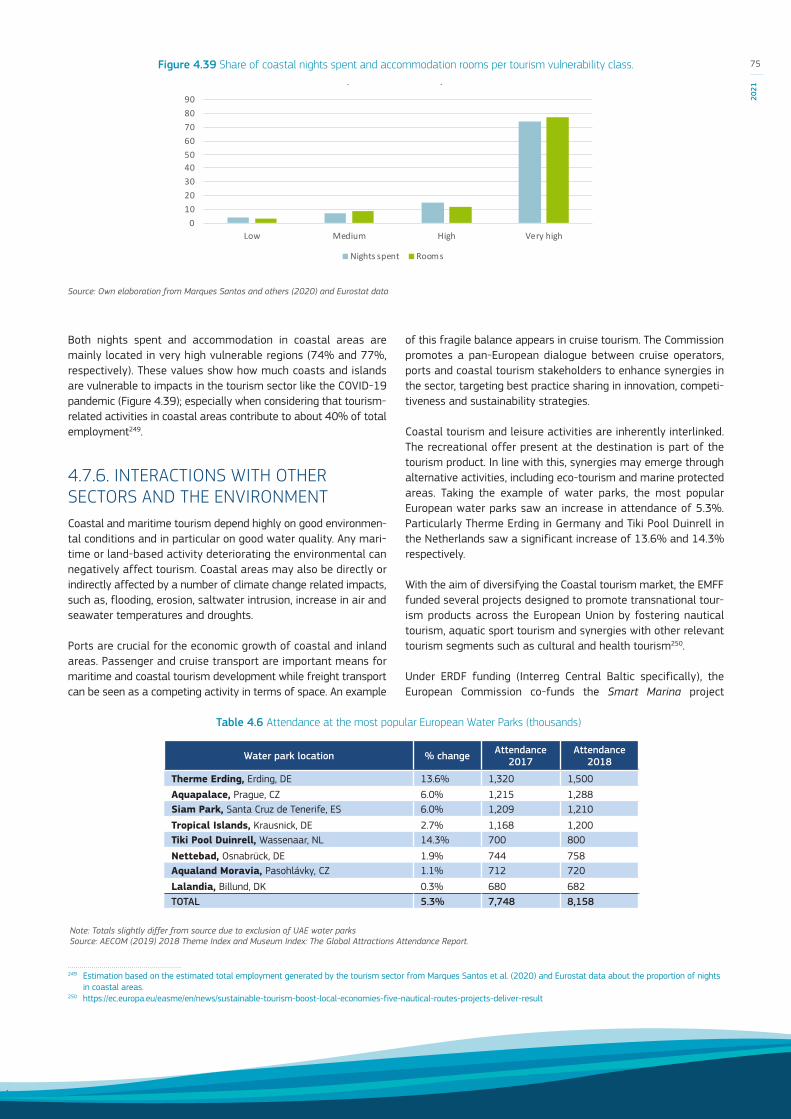
Both nights spent and accommodation in coastal areas are mainly located in very high vulnerable regions (74% and 77%, respectively). These values show how much coasts and islands are vulnerable to impacts in the tourism sector like the COVID-19 pandemic (Figure 4.39); especially when considering that tourism-related activities in coastal areas contribute to about 40% of total employment249.
4.7.6. INTERACTIONS WITH OTHER SECTORS AND THE ENVIRONMENT Coastal and maritime tourism depend highly on good environmen-tal conditions and in particular on good water quality. Any mari-time or land-based activity deteriorating the environmental can negatively affect tourism. Coastal areas may also be directly or indirectly affected by a number of climate change related impacts, such as, flooding, erosion, saltwater intrusion, increase in air and seawater temperatures and droughts.
Ports are crucial for the economic growth of coastal and inland areas. Passenger and cruise transport are important means for maritime and coastal tourism development while freight transport can be seen as a competing activity in terms of space. An example
249 Estimation based on the estimated total employment generated by the tourism sector from Marques Santos et al. (2020) and Eurostat data about the proportion of nights in coastal areas.
250 https://ec.europa.eu/easme/en/news/sustainable-tourism-boost-local-economies-five-nautical-routes-projects-deliver-result
of this fragile balance appears in cruise tourism. The Commission promotes a pan-European dialogue between cruise operators, ports and coastal tourism stakeholders to enhance synergies in the sector, targeting best practice sharing in innovation, competi-tiveness and sustainability strategies.
Coastal tourism and leisure activities are inherently interlinked. The recreational offer present at the destination is part of the tourism product. In line with this, synergies may emerge through alternative activities, including eco-tourism and marine protected areas. Taking the example of water parks, the most popular European water parks saw an increase in attendance of 5.3%. Particularly Therme Erding in Germany and Tiki Pool Duinrell in the Netherlands saw a significant increase of 13.6% and 14.3% respectively.
With the aim of diversifying the Coastal tourism market, the EMFF funded several projects designed to promote transnational tour-ism products across the European Union by fostering nautical tourism, aquatic sport tourism and synergies with other relevant tourism segments such as cultural and health tourism250.
Under ERDF funding (Interreg Central Baltic specifically), the European Commission co-funds the Smart Marina project
Figure 4.39 Share of coastal nights spent and accommodation rooms per tourism vulnerability class.
Source: Own elaboration from Marques Santos and others (2020) and Eurostat data
0102030405060708090
Low Medium High Very high
Share of coastal nights spent and accommodation rooms per vulnerability class
Nights spent Rooms
Table 4.6 Attendance at the most popular European Water Parks (thousands)
Note: Totals slightly differ from source due to exclusion of UAE water parks Source: AECOM (2019) 2018 Theme Index and Museum Index: The Global Attractions Attendance Report.
Water park location % change Attendance 2017
Attendance 2018
Therme Erding, Erding, DE 13.6% 1,320 1,500
Aquapalace, Prague, CZ 6.0% 1,215 1,288Siam Park, Santa Cruz de Tenerife, ES 6.0% 1,209 1,210
Tropical Islands, Krausnick, DE 2.7% 1,168 1,200Tiki Pool Duinrell, Wassenaar, NL 14.3% 700 800
Nettebad, Osnabrück, DE 1.9% 744 758Aqualand Moravia, Pasohlávky, CZ 1.1% 712 720
Lalandia, Billund, DK 0.3% 680 682TOTAL 5.3% 7,748 8,158
75
2021
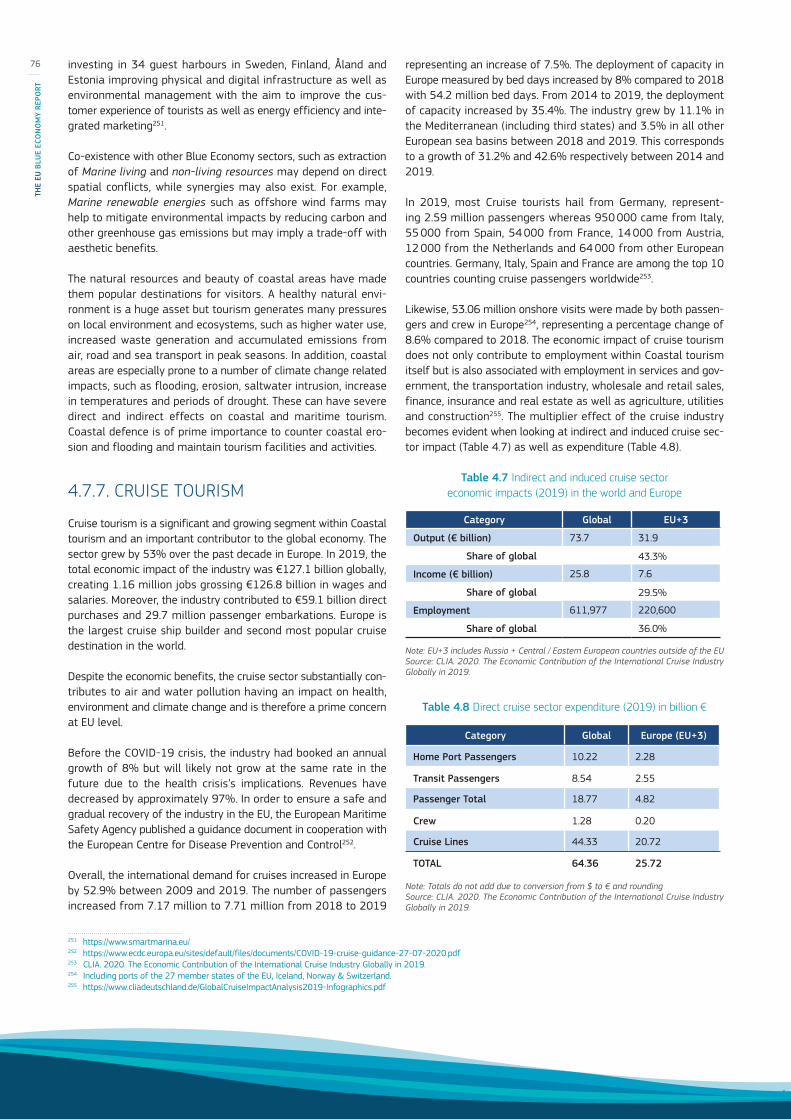
investing in 34 guest harbours in Sweden, Finland, Åland and Estonia improving physical and digital infrastructure as well as environmental management with the aim to improve the cus-tomer experience of tourists as well as energy efficiency and inte-grated marketing251.
Co-existence with other Blue Economy sectors, such as extraction of Marine living and non-living resources may depend on direct spatial conflicts, while synergies may also exist. For example, Marine renewable energies such as offshore wind farms may help to mitigate environmental impacts by reducing carbon and other greenhouse gas emissions but may imply a trade-off with aesthetic benefits.
The natural resources and beauty of coastal areas have made them popular destinations for visitors. A healthy natural envi-ronment is a huge asset but tourism generates many pressures on local environment and ecosystems, such as higher water use, increased waste generation and accumulated emissions from air, road and sea transport in peak seasons. In addition, coastal areas are especially prone to a number of climate change related impacts, such as flooding, erosion, saltwater intrusion, increase in temperatures and periods of drought. These can have severe direct and indirect effects on coastal and maritime tourism. Coastal defence is of prime importance to counter coastal ero-sion and flooding and maintain tourism facilities and activities.
4.7.7. CRUISE TOURISM
Cruise tourism is a significant and growing segment within Coastal tourism and an important contributor to the global economy. The sector grew by 53% over the past decade in Europe. In 2019, the total economic impact of the industry was €127.1 billion globally, creating 1.16 million jobs grossing €126.8 billion in wages and salaries. Moreover, the industry contributed to €59.1 billion direct purchases and 29.7 million passenger embarkations. Europe is the largest cruise ship builder and second most popular cruise destination in the world.
Despite the economic benefits, the cruise sector substantially con-tributes to air and water pollution having an impact on health, environment and climate change and is therefore a prime concern at EU level.
Before the COVID-19 crisis, the industry had booked an annual growth of 8% but will likely not grow at the same rate in the future due to the health crisis’s implications. Revenues have decreased by approximately 97%. In order to ensure a safe and gradual recovery of the industry in the EU, the European Maritime Safety Agency published a guidance document in cooperation with the European Centre for Disease Prevention and Control252.
Overall, the international demand for cruises increased in Europe by 52.9% between 2009 and 2019. The number of passengers increased from 7.17 million to 7.71 million from 2018 to 2019
251 https://www.smartmarina.eu/252 https://www.ecdc.europa.eu/sites/default/files/documents/COVID-19-cruise-guidance-27-07-2020.pdf253 CLIA. 2020. The Economic Contribution of the International Cruise Industry Globally in 2019.254 Including ports of the 27 member states of the EU, Iceland, Norway & Switzerland.255 https://www.cliadeutschland.de/GlobalCruiseImpactAnalysis2019-Infographics.pdf
representing an increase of 7.5%. The deployment of capacity in Europe measured by bed days increased by 8% compared to 2018 with 54.2 million bed days. From 2014 to 2019, the deployment of capacity increased by 35.4%. The industry grew by 11.1% in the Mediterranean (including third states) and 3.5% in all other European sea basins between 2018 and 2019. This corresponds to a growth of 31.2% and 42.6% respectively between 2014 and 2019.
In 2019, most Cruise tourists hail from Germany, represent-ing 2.59 million passengers whereas 950 000 came from Italy, 55 000 from Spain, 54 000 from France, 14 000 from Austria, 12 000 from the Netherlands and 64 000 from other European countries. Germany, Italy, Spain and France are among the top 10 countries counting cruise passengers worldwide253.
Likewise, 53.06 million onshore visits were made by both passen-gers and crew in Europe254, representing a percentage change of 8.6% compared to 2018. The economic impact of cruise tourism does not only contribute to employment within Coastal tourism itself but is also associated with employment in services and gov-ernment, the transportation industry, wholesale and retail sales, finance, insurance and real estate as well as agriculture, utilities and construction255. The multiplier effect of the cruise industry becomes evident when looking at indirect and induced cruise sec-tor impact (Table 4.7) as well as expenditure (Table 4.8).
Table 4.7 Indirect and induced cruise sector economic impacts (2019) in the world and Europe
Category Global EU+3
Output (€ billion) 73.7 31.9
Share of global 43.3%
Income (€ billion) 25.8 7.6
Share of global 29.5%
Employment 611,977 220,600
Share of global 36.0%
Note: EU+3 includes Russia + Central / Eastern European countries outside of the EUSource: CLIA. 2020. The Economic Contribution of the International Cruise Industry Globally in 2019.
Table 4.8 Direct cruise sector expenditure (2019) in billion €
Category Global Europe (EU+3)
Home Port Passengers 10.22 2.28
Transit Passengers 8.54 2.55
Passenger Total 18.77 4.82
Crew 1.28 0.20
Cruise Lines 44.33 20.72
TOTAL 64.36 25.72
Note: Totals do not add due to conversion from $ to € and roundingSource: CLIA. 2020. The Economic Contribution of the International Cruise Industry Globally in 2019.
76
THE
EU B
LUE
ECO
NO
MY
REPO
RT
C h A p T E R 5EMERGING
SEC TORS

This chapter presents the various emerging and innovative sectors of the Blue Economy256. It offers an analysis of the socio-eco-nomic performance impacts and/or opportunities deriving from these sectors to the extent possible. Depending on available data, measuring the contribution of emerging Blue Economy sectors can be more or less complex. Data gaps still exist and therefore a precise evaluation of these sectors, as can be done for the estab-lished ones, is not yet entirely possible. In the absence of common economic indicators (e.g. GVA, profits, etc.), alternative ones such as output and production capacity or number of licences, among others, have been used.
This chapter provides an analysis of Marine renewable energy (i.e. floating offshore wind257, wave and tidal energy, floating solar energy and offshore hydrogen), followed by Blue bioeconomy, Marine minerals, Desalination, and Maritime defence, security and surveillance. For the first time this chapter also presents a pre-liminary assessment of the Research and education sector and a section entitled Infrastructure, which covers last year's Submarine cables sector and a newly introduced Robotics sector.
Emerging Marine Renewable Energy includes various types of renewable energy: Floating offshore wind, Wave and tidal energy, Floating Solar Photovoltaic energy (FPV) and Offshore hydrogen generation all of which may help the EU meet its goals under the EGD. Moreover, offshore renewables will pave the way to achieving the objectives of the EU Hydrogen Strategy258 and the "Offshore Renewable Energy Strategy"259, which proposes to increase offshore wind capacity from its current level (12 GW) to at least 60 GW by 2030 and to 300 GW by 2050. Offshore wind deployment is to be complemented with 40 GW of ocean energy and other emerging technologies (e.g. FPV) by 2050.
The development activities of the Blue bioeconomy and bio-tech-nology vary from one MS to another. The most notable subsec-tor is the algae sector. Although recent socio-economic data are available for only a limited number of MSs (France, Spain and Portugal), turnover for these amounted to €10.7 million.
256 Please note that emerging sectors can be those which are new/innovative, but can also be those for which data is emerging (e.g. maritime Defence)257 Note that the fixed offshore wind has now transitioned into an established sector (Marine renewable energy, Section 4.3).258 COM(2020) 301 final, July 2020, https://ec.europa.eu/energy/sites/ener/files/hydrogen_strategy.pdf259 COM(2020) 741 final, November 2020, https://ec.europa.eu/energy/sites/ener/files/offshore_renewable_energy_strategy.pdf260 COM(2020)474 on Critical Raw Materials Resilience: Charting a Path towards greater Security and Sustainability.
Critical Raw Materials for Strategic Technologies and Sectors in the EU - A Foresight Study. https://ec.europa.eu/docsroom/documents/42881.261 Initial figures provided in USD: $2 473 million and forecasted to reach $4 914 million.
Another relevant sector is Desalination. In January 2021, there were 2 309 operational desalination plants in the EU (mostly spread across Mediterranean MSs) producing about 9.2 million cubic meters per day. As climate change leads to hotter and dryer summers, certain countries, e.g. Spain, must ensure water supply and hence have invested in desalination plants.
Further, the importance of raw materials is part of the EU long-term strategy260. In connection to this, Marine minerals should not only contribute to ensuring the supply of raw materials; but also employ appropriate technology and environmentally-friendly practices to limit any negative impacts.
The Maritime defence, security and surveillance sector although not an emerging activity as such, it has been categorised so because extensive, comparable data are not publicly available. This edition also provides an overview of the maritime security and surveillance sectors, which were not included in prior editions.
Research and education are key enablers for the twin green and digital transitions. The Horizon Europe programme (2021-27) has a budget of €95.5 billion (including €5.4 billion from the Next Generation of the EU Recovery Fund), of which at least 35% will be devoted to climate-related actions and supporting the transi-tion of maritime industries to climate neutrality.
The economic importance of Submarine Cables is due to the crucial role in global communications, channelling over 99% of international data transfers and communication. There are around 378 submarine cables spanning over 1.2 million km globally, of which 205 are connected to the EU.
Finally, this chapter briefly looks into the maritime Robotics sector (including underwater and marmite airborne drones). In 2019, the global underwater robotics market was valued at €2 209 million and forecasted to reach €4 390 million by 2025261.
Figure 5.1 State of play of offshore renewable energy projects in the EU.
Source: European Commission (2020) Offshore Renewable Strategy
78
THE
EU B
LUE
ECO
NO
MY
REPO
RT
5.1. OCEAN ENERGYThe marine renewable energy sector comprises different tech-nologies for the production of renewable energy: Offshore wind (with a bottom-fixed foundation to the seabed or anchored float-ing devices), ocean energy (tidal and wave power, Ocean Thermal Energy Conversion, salinity gradient), floating solar photovoltaic (FPV), and renewable hydrogen production offshore. Offshore wind (bottom fixed) represents the most advanced sector and has been analysed in 4.3. The other technologies are at an earlier stage of development, therefore an analysis of their state of play is presented in this Chapter instead.
Large commercial-scale projects are currently operating in European waters for bottom-fixed wind turbines but other tech-nologies are starting to catch up. Large commercial floating wind energy projects are being announced in some Member States and ocean energy is reaching a level of maturity that makes them attractive to future applications.
In November 2020, the European Commission published the Offshore Renewable Energy Strategy262, which outlines the expected contribution of the marine renewable energy sector to the EU ambitions to net zero emission by 2050. The Strategy proposes to increase Europe's offshore wind capacity from its current level of 12 GW to at least 60 GW by 2030 and to 300 GW by 2050. Offshore wind deployment is complemented with 40 GW of ocean energy and other emerging technologies such as floating wind and solar by 2050. In addition, offshore renewables are expected to contribute significantly to another EU strategy: the EU Hydrogen Strategy263. The objective is to have 40 GW of renewables linked electrolysis capacity in the EU by 2030. The linkage between offshore renewables and hydrogen production will be further explored in the upcoming revision of the Renewable Energy Directive in the course of 2021.
This ambitious growth is based on two key factors: the vast energy potential across all of Europe's sea basins and on the global lead-ership position of EU companies in the sector. This leadership posi-tion ranges from floating offshore wind264, to ocean energy tech-nologies such as wave or tidal265, or from floating photovoltaic installations, to the use of algae to produce biofuels.
Floating wind technology opens up the possibility to harvest the most resourceful wind energy sites in Europe. Nearly 80% of the wind in Europe blows in waters that are at least 60 meters deep, where it is too expensive to fix structures to the bottom of the sea. The JRC266 estimates the technical potential for float-ing offshore wind in Europe to be at about 4 540 GW, of which 3 000 GW to be located in deep sea (water depth between 100 m and 1000 m). Furthermore, every sea basin is different and has different potential due to its specific geological condition and the specific stage of offshore renewable energy development. Hence, different technologies suit different sea basins.
262 https://ec.europa.eu/energy/sites/ener/files/offshore_renewable_energy_strategy.pdf263 COM(2020) 301 final, July 2020, https://ec.europa.eu/energy/sites/ener/files/hydrogen_strategy.pdf264 4 out of 15 floating turbines worldwide are produced and located in the European Union.265 With 13,5 MW of the global 34 MW ocean energy capacity installed in EU-27 waters in 2019, ref. European Commission (2020) Clean Energy Transition –
Technologies and Innovations Report (Annex to {SWD (2020) 953}).266 JRC, 2019) JRC: ENSPRESO - WIND - ONSHORE and OFFSHORE. European Commission, Joint Research Centre (JRC) [Dataset] PID: http://data.europa.
eu/89h/6d0774ec-4fe5-4ca3-8564-626f4927744e
Ocean energy is a largely untapped renewable energy source, although it has significant potential to unlock further decarbonisation of the EU energy system. Tidal and wave energy technologies are the most advanced among the ocean energy technologies, with signif-icant potential located in different Member States and regions. For tidal energy, there is significant potential in France, Ireland and Spain, and localised potential in other Member States. For wave energy, high potential is to be found in the Atlantic, localised potential in North Sea, Baltic, Mediterranean, and Black Sea.
A new emerging trend in the offshore renewable energy sector is the development of FPV. While the current installed capacity is limited, the Offshore Renewable Energy Strategy recognises the potential of these technologies and the potential for fast technology progression based on the results of ongoing demonstration projects.
Nevertheless, meeting the ambitions set in the Offshore Renewable Energy Strategy (the Strategy) requires significant scale up, commitment and a greater involvement of the EU and Member State governments, as under current policies, the present and projected installation pace would lead to approximately only 90 GW by 2050. According to the Strategy, continued support will be needed for emerging offshore renewable technologies to move from pilot and demonstration phases to a utility scale, focusing on identifying technological solutions that best reconcile the EU’s economic and environmental goals.
EU instruments, such as InvestEU, the Connecting Europe Facility (CEF) or the Innovation Fund, could help mobilise the funds needed to support such endeavour. The CEF provides incentives for cross-border cooperation in the field of renewable energy, and could be used to for example, fund the joint development of a floating wind farm to support European technology leadership. The Innovation Fund can support the demonstration of innovative clean technologies at commercial scale, such as ocean energy, new floating offshore wind technologies or projects to couple off-shore wind parks with battery storage or hydrogen production.
79
2021
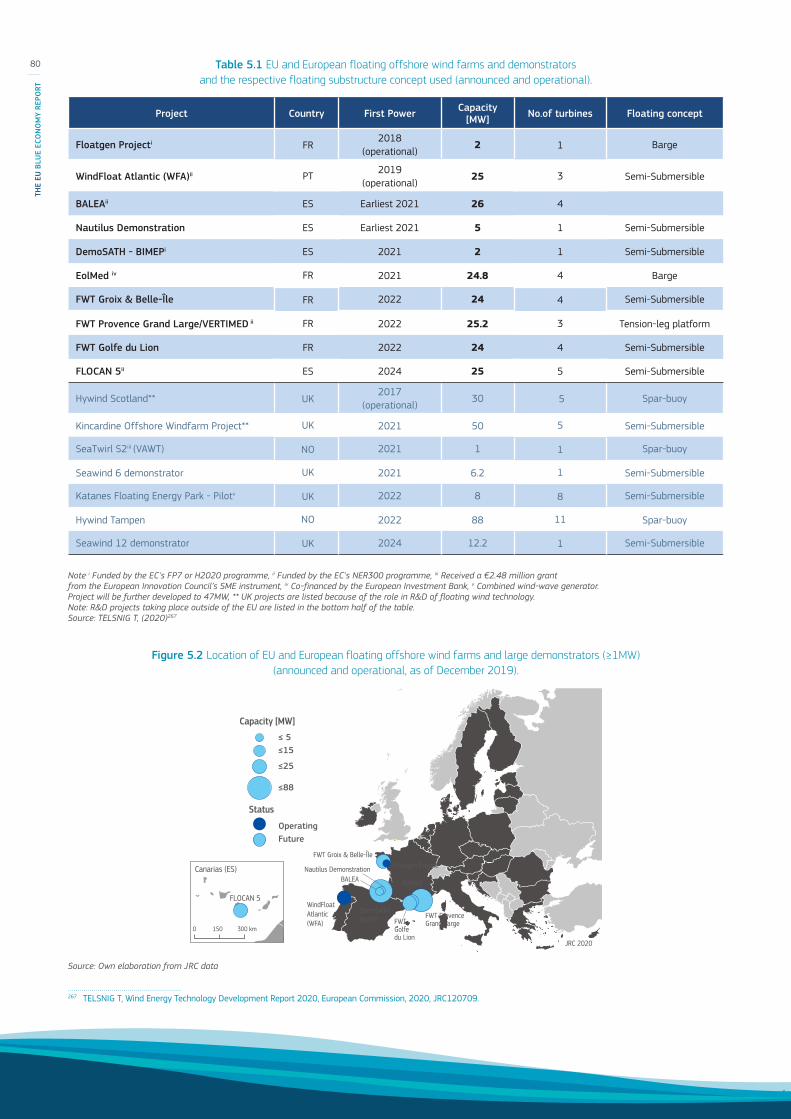
Table 5.1 EU and European floating offshore wind farms and demonstrators and the respective floating substructure concept used (announced and operational).
Note: i Funded by the EC's FP7 or H2020 programme, ii Funded by the EC's NER300 programme, iii Received a €2.48 million grant from the European Innovation Council’s SME instrument, iv Co-financed by the European Investment Bank, v Combined wind-wave generator. Project will be further developed to 47MW, ** UK projects are listed because of the role in R&D of floating wind technology.Note: R&D projects taking place outside of the EU are listed in the bottom half of the table.Source: TELSNIG T, (2020)267
Figure 5.2 Location of EU and European floating offshore wind farms and large demonstrators (≥1MW) (announced and operational, as of December 2019).
Source: Own elaboration from JRC data
267 TELSNIG T, Wind Energy Technology Development Report 2020, European Commission, 2020, JRC120709.
≤ 5≤15
≤25
≤88
FLOCAN 5
Canarias (ES)
0 150 300 km
Capacity [MW]
Status
WindFloat Atlantic (WFA)
OperatingFuture
Floatgen ProjectFWT Groix & Belle-Île
JRC 2020
Nautilus DemonstrationBALEA
DemoSATH - BIMEP FWT
Golfe du Lion
EolMed
FWT Provence Grand Large
Project Country First Power Capacity [MW] No.of turbines Floating concept
Floatgen Projecti FR 2018
(operational)2 1 Barge
WindFloat Atlantic (WFA)ii PT 2019
(operational)25 3 Semi-Submersible
BALEAii ES Earliest 2021 26 4
Nautilus Demonstration ES Earliest 2021 5 1 Semi-Submersible
DemoSATH - BIMEPi ES 2021 2 1 Semi-Submersible
EolMed iv FR 2021 24.8 4 Barge
FWT Groix & Belle-Île FR 2022 24 4 Semi-Submersible
FWT Provence Grand Large/VERTIMED ii FR 2022 25.2 3 Tension-leg platform
FWT Golfe du Lion FR 2022 24 4 Semi-Submersible
FLOCAN 5ii ES 2024 25 5 Semi-Submersible
Hywind Scotland** UK 2017
(operational)30 5 Spar-buoy
Kincardine Offshore Windfarm Project** UK 2021 50 5 Semi-Submersible
SeaTwirl S2iii (VAWT) NO 2021 1 1 Spar-buoy
Seawind 6 demonstrator UK 2021 6.2 1 Semi-Submersible
Katanes Floating Energy Park - Pilotv UK 2022 8 8 Semi-Submersible
Hywind Tampen NO 2022 88 11 Spar-buoy
Seawind 12 demonstrator UK 2024 12.2 1 Semi-Submersible
80
THE
EU B
LUE
ECO
NO
MY
REPO
RT
5.1.1. FLOATING OFFSHORE WIND
Floating offshore wind is a growing sector that is strengthen-ing Europe’s leadership in renewable energy. The technology for floating offshore wind in deep waters and harsh environments is progressing steadily towards commercial viability268. Floating applications seem to have become a viable option for EU coun-tries and regions with deep waters (depths between 50-1 000 m) and could open up new markets such as the Atlantic Ocean, the Mediterranean Sea and potentially the Black Sea. Hence, floating offshore wind is one of the EU’s R&I priorities; increased R&I could foster EU competitiveness269.
The first multi-turbine floating project was Hywind Scotland with a capacity of 30 MW, commissioned in 2017 by Equinor, followed by the Floatgen project in France and the WindFloat Atlantic in Portugal. There is a pipeline of projects that will lead to the installation of 350 MW of floating capacity in European waters by 2024, which would need to accelerate afterwards270,271. A higher level of ambition and clarity is needed to reach a mar-ket size sufficient to yield cost reductions: there is potential to reach an LCOE272 of less than €100/MWh in 2030 if large capacity is deployed. Moreover, the EU wind industry targets 150 GW of floating offshore by 2050 in order to become climate-neutral273.
The global market for floating offshore wind represents a con-siderable market opportunity for EU companies. In total, about 6.6 GW of floating offshore wind energy is expected by 2030, with significant capacities in some Asian countries (South Korea and Japan) besides the European markets (France, Norway, Italy, Greece, Spain). Due to good wind resources in shallow waters, no significant floating offshore capacity is expected in China in the mid-term274.
The main distinctive criterion in multiple floating designs is the substructure used to provide the buoyancy and thus the stabil-ity to the plant, such as Spar-buoy, Semi-Submersible, Tension-leg platform (TLP), Barge or Multi-Platforms substructures. So far, no concept has prevailed over the others; however, Equinor’s spar-buoy concept has already been deployed in a pre-commer-cial project (see Table 5.1 and Figure 5.2). Given the variety of concepts estimates are that the Technology Readiness Level of offshore floating wind concepts range between 4 and 9275. Spar-buoy and semi-submersible concepts have already reached TRL 8-9 as they are being built and tested at large scale. With a 2 MW floating prototype in France (Floatgen Project, generating 6 GWh in 2019276) Ideol aims to demonstrate the capabilities of a
268 UNEP & BloombergNEF, Global trends in renewable energy investment, 2019.269 TELSNIG T, Wind Energy Technology Development Report 2020, European Commission, 2020, JRC120709.270 JRC, Low Carbon Energy Observatory, Wind Energy Technology Development Report 2020, European Commission, 2020, JRC120709.271 Communication from the Commission, A Clean Planet for all - A European strategic long-term vision for a prosperous, modern, competitive and climate neutral economy.
COM (2018) 773 final.272 Levelized Cost of Energy.273 ETIPWind, Floating Offshore Wind. Delivering climate neutrality, 2020.274 GWEC, Global Offshore Wind Report 2020, 2020.275 Moro A, Antunes dos reis V and Watson S: JRC Workshop on identification of future emerging technologies in the wind power sector276 Ideol pilot doubles power yield and is “ready for deployment.” Accessed: 02/18/2020. URL: https://www.windpowermonthly.com/article/1671567/
ideol-pilot-doubles-power-yield-ready-deployment277 Watson et al. Future emerging technologies in the wind power sector: A European perspective. Renewable and Sustainable Energy Reviews 113 (109270). DOI:10.1016/j.
rser.2019.109270.278 TELSNIG T, Wind Energy Technology Development Report 2020, European Commission, 2020, JRC120709.279 New SGRE 6.6MW onshore turbines due for Swedish debut. Accessed: 01/13/2020. URL: https://www.windpowermonthly.com/article/1668587/
new-sgre-66mw-onshore-turbines-due-swedish-debut
concrete barge-type substructure (‘Damping Pool’ floating foun-dation) in a deep water setting. To date TLP designs have not yet reached this level of maturity277.
With 88 MW (11 8 MW SGRE-turbines), the next significant up-scaled project (Hywind Tampen) will be deployed close to the Gullfaks and Snorre fields to meet approximately 35% of the annual power requirement of five oil and gas platforms. This would also mean an increase in the design of the spar-buoy platforms (weight, draught and catenary length) as compared to the initial Hywind Scotland design as the project will be located 140 km from shore at a water depth of about 260-300 m278. In April 2020 and after achieving DNV GL’s technology qualifica-tion, Seawind Ocean Technologies (NL) announced the installation of a two-bladed 6.2 MW floating demonstrator (Seawind 6-126) at the European Marine Energy Centre in Scotland until 2021, followed by an upscaled prototype (Seawind 12-225) in 2022. Commercial availability for these turbines is planned for 2023 and 2024, respectively279.
Floating hybrid energy platforms are still at a lower TRL (1-5), though the announced Katanes Floating Energy Park – Pilot (based on the P80 wind-wave energy platform) comprising a 3.4 MW wave converter and an 8 MW wind turbine could lift this system to TRL 6-7 by 2022.
Floating offshore wind is one of the EU’s R&I priorities. The EC has boosted the development of floating offshore wind concepts and solutions. The FP7 programme funded seven research projects on floating offshore wind. Some projects such as FLOATGEN (Table 5.1) and DEMOWFLOAT demonstrated different floating concepts at pre-commercial scale in operational environment. H2020 has already allocated funding to 18 research projects on floating off-shore wind since 2014. In total, the EC has granted more than €78m to R&D projects on floating offshore wind solutions via FP7 and H2020 funding programmes since 2009, making floating offshore wind was the second most funded wind energy topic in the EU’s Framework Programmes (Figure 5.3). Floating offshore wind R&I received a significant boost in 2019, when 8 projects spread across the EU were awarded funds through H2020. The selected projects were: COREWIND (Coordinator: ES), FLOTANT (ES), PivotBuoy (ES), SeaTwirl (SE), SATH (ES), EDOWE (NL), ASSO (FR), FLOAWER (FR).
81
2021

5.1.2. WAVE AND TIDAL ENERGY
Tidal and wave energy technologies are the most advanced among the ocean energy technologies, with significant potential located in different Member States and regions. Tidal technol-ogies can be considered at pre-commercial stage, benefitting from design convergence, significant electricity generation (over 60 GWh since 2016280) and a number of projects and prototypes deployed across Europe and worldwide. Instead, most of the wave energy technological approaches are at R&D stage. Many pos-itive results on wave energy stem from ongoing European and national projects. Over the past 5 years, significant technological progress has been achieved thanks to the successful deployment of demonstration and first-of-a-kind farms; with the sector show-ing particular resilience in overcoming setbacks281 that hindered the industry in 2014/15282.
The variety in ocean resources and location requires different technological concepts and solutions. Therefore, several methods exist to turn ocean energy into electricity:
• Wave energy converters derive energy from the movement of waves. Most advanced technology can be considered at TRL 8-9, with Manufacturing Readiness Level of 1. Most of technology are at TRL 6-7. A convergence towards a common conceptual design to extract the energy from the waves and transform it into electricity, would help the industrialisation of the sector. Higher R&D effort is still necessary.
• Tidal stream turbines harness the flow of the currents to produce electricity. About 10 different converters designs are at an advantaged TRL stage [TRL 8-9], and are feeding electricity into the grid in real operational environments, both individually and as arrays.
280 Ocean Energy Europe (2021) Ocean Energy Key trends and statistics 2020.281 European Commission (2017) Study on Lessons for Ocean Energy Development EUR 27984.282 Magagna & Uihllein (2015) 2014 JRC Ocean Energy Status Report (https://publications.jrc.ec.europa.eu/repository/bitstream/JRC93521/jrc%20ocean%20energy%20
report_v2.pdf)283 JRC (2014) – Ocean Energy Status Report.
• Tidal range uses the difference in sea level between high and low tides to create power. It is the more established ocean energy technology, with several projects generating power around the world. Such systems let the tide fill a natural or artificial basin, then block the “opening.” Environmental con-siderations and the high upfront capital required have slowed the development of new projects in Europe.
• OTEC exploits the temperature difference between deep cold ocean water and warm surface waters to produce electricity via a heat-exchanger. OTEC is suited to oceans where high temperature differences will yield the most electricity. A num-ber of demonstration plants are planned for development in EU overseas territories, opening up export opportunities.
• Salinity gradient power generation utilises the difference in salt content between freshwater and saltwater, found in areas such as deltas or fjords, to provide a steady flow of electricity via Reverse Electro Dialysis (RED) or osmosis.
Given the resources available in the EU, and the advancement of the technologies, it is expected that in the short-to-medium term (up to 2030), ocean energy development will be largely dependent on the deployment of tidal and wave energy converters. In the EU, the highest resource potential for ocean energy exists along the Atlantic coast, with further localised exploitable potential in the Baltic and Mediterranean seas and in overseas regions (e.g. Reunion, Curacao). The theoretical potential of wave energy in Europe is about 2 800 TWh annually, whilst the potential for tidal current was estimated at about 50 TWh per year. OTEC offers potential only for overseas islands since its deployment is only possible in tropical seas283.
At the beginning of 2020, the total installed capacity of ocean energy worldwide was of 528 MW, including 494 MW of tidal range projects (of which 240 MW in France). Excluding tidal range,
Figure 5.3 EC funding on wind energy R&I priorities in the period 2009 -2019 under FP7 and H2020.
0 40 80 120 160
New materials & components
Resource assessment
Grid integration
Offshore technology
Floating offshore wind
Logistics, assembly & installation
Maintenance & monitoring
Airborne wind energy systems
Other
EC funding for wind energy under FP7 and H2020 (EUR million)
82
THE
EU B
LUE
ECO
NO
MY
REPO
RT

the total installed capacity of ocean energy worldwide284 reached 34 MW. 78% of the global capacity is installed in European waters, equally split between deployments in EU-27 and in the UK (13.3 and 13.7 MW respectively) (Figure 5.4285,286).
Figure 5.4 Global installed capacity post-BREXIT (excluding tidal range).
0
2
4
6
8
10
12
14
2006 2009 2011 2012 2014 2015 2016 2017 2018 2019
Capa
city
[MW
]
Europe - EU27 Europe - UK ROW
0% 20% 40% 60% 80% 100%
Source: JRC (2020) Facts and Figures
Wave. At the start of 2020, the global installed capacity of wave energy was of 12 MW, with 8MW (66%) installed in EU-27. In 2019, 600 kW of new wave energy capacity was deployed in the EU287.
Tidal. By 2020, the global installed capacity of tidal energy was of 22.4 MW, 76% of the installed capacity is deployed in Europe, of which 24% in EU waters. EU developers have largely benefit-ted from successful collaboration and interlinkage between EU support and the availability of ad-hoc infrastructure especially in Scotland and in Northern Ireland. In fact, 65% of the global tidal energy installed capacity comes from EU developers.
For both technologies the 2021 outlook is positive. Ocean Energy Europe expects that 2.9 MW of tidal energy capacity will be deployed in European waters, with an additional of 3.1 MW of wave energy capacity288. The ambition for the sector, as per the Offshore Renewable Energy Strategy, is to reach 100 MW of
284 JRC 2020, Facts and figures on Offshore Renewable Energy Sources in Europe, JRC121366 (upcoming).285 JRC 2020, Facts and figures on Offshore Renewable Energy Sources in Europe, JRC121366.286 These figures have been updated based on the JRC internal registry of projects and on the OES Annual Report. Given the R&D nature of some projects, it may contains
small inaccuracies in terms of status of a project such as operational/on pause.287 Ocean Energy Europe (2020) Ocean energy key trends and statistics 2019.288 Ocean Energy Europe (2021) Ocean Energy Key trends and statistics 2020.289 European Commission (2020) Offshore Renewable Energy Strategy.290 Ocean Energy Europe (2021) Ocean Energy Key trends and statistics 2020.291 JRC 2020, Facts and figures on Offshore Renewable Energy Sources in Europe, JRC121366 (upcoming).292 European Commission (2018) Market study on Ocean Energy.293 IEA (2019) World Energy Outlook 2019.294 Current policy initiative without specific support for emerging RES such as ocean.
installed capacity by 2025289. Ireland, Portugal and Spain have set targets for ocean energy deployment in their National Energy and Climate Plans for a total of 230 MW to become operational by 2035290.
Based on announced projects, the EU ocean energy project pipe-line consists of about 2.4 GW for the next 7 years. This pipeline comprises projects currently under development, and of industrial ambitions stated by some technology developers291. This pipeline is in line with market projections released by DG MARE292 and with the International Energy Agency293 modelling scenario in the most optimistic development scenarios for ocean energy. It shall be noted that in the pessimistic294 scenario this would be between 0.25 GW and 0.6 GW of installed capacity by 2025 and around 1GW by 2030 are expected instead.
The development of ocean energy technologies is still primarily at the R&D stage, nevertheless some technologies have already progressed towards first-of-a-kind demonstration and pre-com-mercial projects. Tidal energy technology has made the most sig-nificant stride forward with over 43 GWh of electricity generated from demo projects.
The landscape of the ocean energy supply chain is rapidly chang-ing thanks to technology validation projects ongoing in European test centres. The need to reduce the cost of ocean energy technol-ogy, also through economies of scale, implies that the presence of Original Equipment Manufacturers (OEMs) with access to large manufacturing facilities could be seen as an indicator of the sup-ply chain's consolidation.
Between 2012 and 2015 many OEMs have reduced their involve-ment in the sector, an inversion of tendency has been seen in the past years: new industrial players such as Enel Green Power, ENI, Fincantieri, Saipem, SBM Offshore, Total and Warstila have entered the market; bringing with them experience from the oil and gas and shipping sectors.
The increased presence of OEMs adds to the ones already pre-sented in the sector such as AndritzHydro Hammerfest, Lockheed Martin, Engie, Schottel can be seen as a sign of progress and confidence in the sector. Furthermore, the sector can also rely on the experience of key intermediate components and sub-com-ponents companies, such as Bosch Rexroth, AVV, SKF, Schaeffler and Siemens, that are actively supporting R&D and demonstration projects. These companies are currently engaged on an ad-hoc basis, but their involvement in the sector could grow once the market and supply chain consolidate.
83
2021

It is important to note that as witnessed in the wind energy sector, a strong project pipeline ensures sufficient demand for OEMs, and as a result ensures demand for the manufacturing of components and subcomponents and for the supply of raw materials295296.
The development of ocean energy has already seen almost 300 different concepts297. About half of these have progressed to higher TRL and even fewer have been tested in operational envi-ronment. 49.4% of the ocean energy developers in the EU-27, when considering technology at TRL6 or higher298.
In terms of tidal energy, 41% of the technology developers are based in the EU-27 (Figure 5.5). The Members States with the highest number of developers are the Netherlands and France. Major non-EU players are Canada, the US, the UK and Norway299.
For wave energy, 52% of active developers at TRL6 or higher are located in the EU (Figure 5.5). Other key players in the sector are the UK, the US, Australia, and Norway. A number of developers of technology at low TRL are not included in this analysis.
Whilst the highest concentration of wave and tidal energy devel-opers occurs within Europe many developers are looking to deploy their technologies outside of Europe thanks to the market instru-ments available elsewhere (e.g. high feed-in-tariffs in Canada). Developing a strong internal market will be fundamental for the EU in order to build and maintain its current leadership in the market (as seen for other renewable energy sources).
Figure 5.5 Distribution of tidal (left) and wave (right) energy developers.
Source: European Commission (2020) Clean Energy Transition – Technologies and Innovations report 300
295 FTI-Consulting. (2016). Global Wind Supply Chain Update 2016.296 Magagna, D., Monfardini, R., & Uihlein, A. (2016). JRC Ocean Energy Status Report 2016.297 EMEC. (2020). Marine Energy. http://www.emec.org.uk/marine-energy/ 298 TRL6 is used as cut-off point for developers receiving sufficient fuds to develop a small scale prototype of the device to be tested at sea. 299 JRC 2020, Facts and figures on Offshore Renewable Energy Sources in Europe, JRC121366. 300 COM (2020) Clean Energy Transition – Technologies and Innovations Report (Annex to {SWD (2020) 953}).301 JRC (2017) Supply chain of renewable energy technologies in Europe.302 JRC (2014) Overview of European innovation activities in marine energy technology.303 JRC (2020) - Facts and figures on Offshore Renewable Energy Sources in Europe, JRC121366 (upcoming).304 EURActive (2020) https://www.euractiv.com/section/energy/interview/irena-chief-europe-is-the-frontrunner-on-tidal-and-wave-energy/ 305 JRC (2020) - Facts and figures on Offshore Renewable Energy Sources in Europe, JRC121366.
European leadership spans across the whole ocean energy supply chain301 and innovation system302. The European cluster formed by specialised research institutes, developers and the availability of research infrastructures has allowed Europe to develop and maintain its current competitive position.
The EU maintains global leadership despite the UK’s withdrawal and changes in the market for wave and tidal energy technologies. 70% of the global ocean energy capacity has been developed by EU-27 based companies (Figure 5.6)303.
The ocean energy market is slowly forming. The next decade will be fundamental for EU developers with the global ocean energy capacity of 3.5 expected to reach 2.5 GW by 2025 and to 10 GW by 2030304. With significant investments in ocean energy outside of Europe, dedicated support is needed to ensure that a strong EU market can take off, allowing for the consolidation of the EU supply chain.
Figure 5.6 Installed capacity by origin of technology.
Source: JRC (2020) Facts and Figures305
AT DE ES FR IE IE NL SE
UK NO AU CA CN JP KR US
EU 41%
UK 18%
ROW 41%
BE DE DK ES FI FR IE IT NL SE
UK AU CN HK IL IN KR NO US
EU 52%
UK 14%
ROW 34%
0
2
4
6
8
10
12
14
2006 2009 2011 2012 2014 2015 2016 2017 2018 2019 2020
Capa
city
[MW
]
EU ROW UK
0% 20% 40% 60% 80% 100%
84
THE
EU B
LUE
ECO
NO
MY
REPO
RT
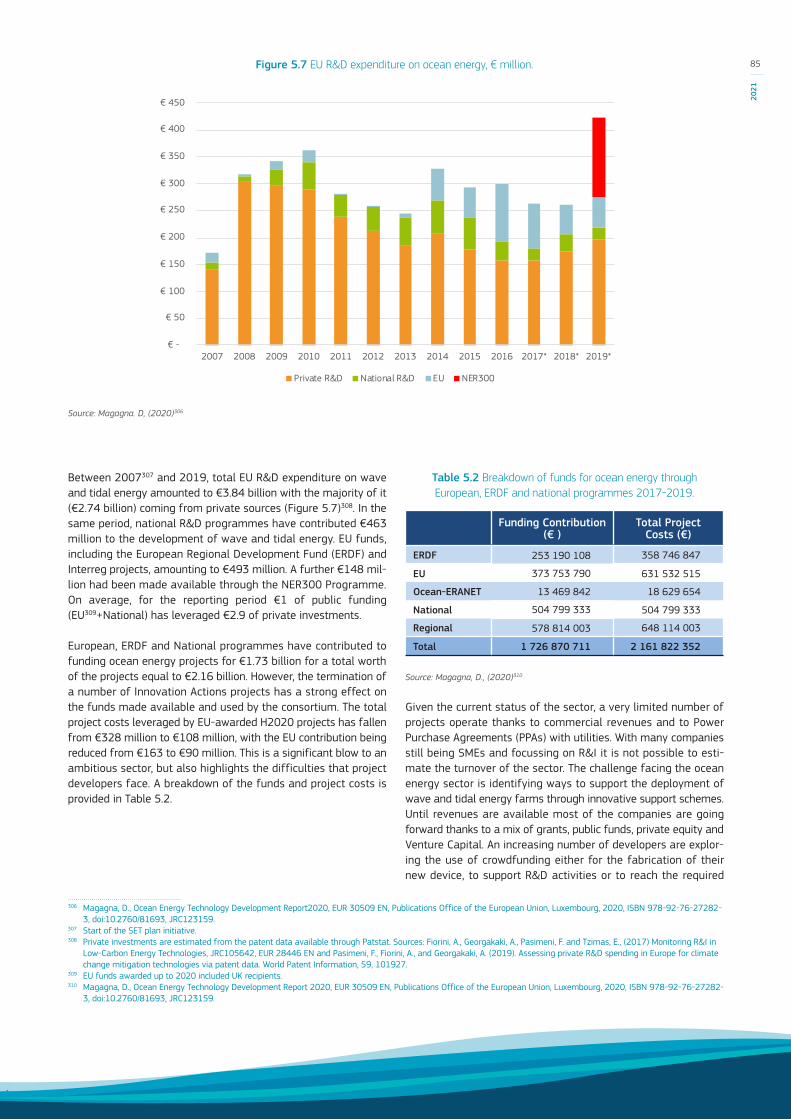
Source: Magagna. D, (2020)306
Between 2007307 and 2019, total EU R&D expenditure on wave and tidal energy amounted to €3.84 billion with the majority of it (€2.74 billion) coming from private sources (Figure 5.7)308. In the same period, national R&D programmes have contributed €463 million to the development of wave and tidal energy. EU funds, including the European Regional Development Fund (ERDF) and Interreg projects, amounting to €493 million. A further €148 mil-lion had been made available through the NER300 Programme. On average, for the reporting period €1 of public funding (EU309+National) has leveraged €2.9 of private investments.
European, ERDF and National programmes have contributed to funding ocean energy projects for €1.73 billion for a total worth of the projects equal to €2.16 billion. However, the termination of a number of Innovation Actions projects has a strong effect on the funds made available and used by the consortium. The total project costs leveraged by EU-awarded H2020 projects has fallen from €328 million to €108 million, with the EU contribution being reduced from €163 to €90 million. This is a significant blow to an ambitious sector, but also highlights the difficulties that project developers face. A breakdown of the funds and project costs is provided in Table 5.2.
306 Magagna, D., Ocean Energy Technology Development Report2020, EUR 30509 EN, Publications Office of the European Union, Luxembourg, 2020, ISBN 978-92-76-27282-3, doi:10.2760/81693, JRC123159.
307 Start of the SET plan initiative.308 Private investments are estimated from the patent data available through Patstat. Sources: Fiorini, A., Georgakaki, A., Pasimeni, F. and Tzimas, E., (2017) Monitoring R&I in
Low-Carbon Energy Technologies, JRC105642, EUR 28446 EN and Pasimeni, F., Fiorini, A., and Georgakaki, A. (2019). Assessing private R&D spending in Europe for climate change mitigation technologies via patent data. World Patent Information, 59, 101927.
309 EU funds awarded up to 2020 included UK recipients.310 Magagna, D., Ocean Energy Technology Development Report 2020, EUR 30509 EN, Publications Office of the European Union, Luxembourg, 2020, ISBN 978-92-76-27282-
3, doi:10.2760/81693, JRC123159.
Table 5.2 Breakdown of funds for ocean energy through European, ERDF and national programmes 2017-2019.
Funding Contribution (€ )
Total Project Costs (€)
ERDF 253 190 108 358 746 847
EU 373 753 790 631 532 515
Ocean-ERANET 13 469 842 18 629 654
National 504 799 333 504 799 333
Regional 578 814 003 648 114 003
Total 1 726 870 711 2 161 822 352
Source: Magagna, D., (2020)310
Given the current status of the sector, a very limited number of projects operate thanks to commercial revenues and to Power Purchase Agreements (PPAs) with utilities. With many companies still being SMEs and focussing on R&I it is not possible to esti-mate the turnover of the sector. The challenge facing the ocean energy sector is identifying ways to support the deployment of wave and tidal energy farms through innovative support schemes. Until revenues are available most of the companies are going forward thanks to a mix of grants, public funds, private equity and Venture Capital. An increasing number of developers are explor-ing the use of crowdfunding either for the fabrication of their new device, to support R&D activities or to reach the required
€ -
€ 50
€ 100
€ 150
€ 200
€ 250
€ 300
€ 350
€ 400
€ 450
2007 2008 2009 2010 2011 2012 2013 2014 2015 2016 2017* 2018* 2019*
Private R&D National R&D EU NER300
Figure 5.7 EU R&D expenditure on ocean energy, € million. 85
2021

capital for deployment. Such efforts have mobilised over €20.5 million over the past three years. The impact of crowdfunding is comparable to public funding for projects, and it is likely to have a limited impact, especially in terms of deployment of projects311. Nevertheless, it is telling of the difficulties being encountered by technology developers.
R&D activity in ocean energy involves over 838 EU compa-nies and research institutions in 26 Member States312. In the EU-27+UK, 51% of the ocean energy inventions patented are for wave energy technology, 43% for tidal energy, 2.7% on Oscillating Water Column (OWC, this represent a subset of wave energy technology), and 3% for Ocean Thermal Energy Conversion (OTEC). The EU-27+UK313 is a leader in the filing of patents in international markets, seeking protection in all key markets such as the US, South Korea, and China as well as Canada and Australia (included in ROW). Nevertheless, the EU receives only a small number of incoming patents applications from outside, primarily from the US (Figure 5.8). The patent filings indicate that the EU is a net exporter of Ocean energy technology and innovation, and that European Ocean energy developers are well positioned to exploit the growth of the sector globally.
5.1.3. FLOATING SOLAR PHOTOVOLTAIC ENERGYFPV installations open up new opportunities for employing con-ventional photovoltaic installations whilst reducing the impact on land. Structurally, FPV consists of a floating structure on which
311 Hume (2018) The Rise of Crowdfunding for Marine Energy https://www.maritime-executive.com/features/the-rise-of-crowdfunding-for-marine-energy 312 JRC (2020) Technology Development Report Ocean Energy 2020 Update.313 Note that patent data are currently not available for the EU-27 only.314 Saipem (2020) – New frontiers renewables floating solar.315 Green Tech Media (2021) - Super-Hybrid: Dutch Offshore Wind Farm to Include Floating Solar, Batteries and Hydrogen.316 Bringing Offshore Ocean Sun to the global market https://cordis.europa.eu/project/id/965671317 https://www.sinnpower.com/platform
traditional solar panels are installed. To date, most FPV structures have been installed on lakes and in the proximity of hydro-power reservoirs.
Deploying FPVs at sea requires overcoming a number of chal-lenges related to the survivability of the structure at sea, as well understanding the influence of the marine environment such as of algae growth, pollution, and salt deposits on the conversion system.
While at the state of the art of FPV offshore at sea is predom-inantly at R&D and demonstration phase, the sector has wit-nessed a surge of interest in 2020. In the EU, in addition to projects developed in the Netherlands (Oceans of Energy, TNO) and France (HelioRec), new players have entered the Floating PV Market, including many O&G companies that are diversifying their portfolio.
Saipem (IT) has entered into a partnership with Equinor to develop FPV for harsh environments, developing a modular PV system that can also be used for hybrid offshore projects314. Shell (NL) has announced that FPV modules will be installed from 2025 as part of their 759 MW offshore wind project Hollands Kust Noord developed in partnership with Eneco. Like Saipem, Shell is mov-ing towards the development of hybrid projects mixing multiple renewable energy sources offshore, with storage and hydrogen generation315. Fred Olsen and Ocean Sun have launched a new project, supported by EU H2020 to deploy 250 kW of FPV at sea in the Canary Island316. Similarly, ocean energy developer SINN Power is now investigating the development of a floating hybrid platform that combines wave energy, wind energy and FPV317.
Figure 5.8 Global patents flow, number of patents (for the years 2007-2016). The left side present the information of where inventions have been generated, whilst the right side indicates where companies are seeking protection.
Note: Intra-market patents are not included. 2016 is the latest full and validated year on Patstat.Source: Commission Services
86
THE
EU B
LUE
ECO
NO
MY
REPO
RT

Recognising the potential of FPV (both at sea and on inland waters), the Dutch government has published a roadmap for the development of the technology. In particular, concerning offshore photovoltaics the Dutch government is looking to develop pilot projects in the North Sea in the period 2021-2026 to monitor efficiency and environmental impact of such installations. The expectation, according to the roadmap, is that in the next 10-20 years, this technology will be one of the sources of renewable electricity in the country318.
The Netherlands already has some of the most advanced opera-tional pilot projects for FPV, such as Oceans of Energy, which has already withstood various storms and waves of above 5 m high319.
A number of challenges remain to be addressed in order to facil-itate the deployment of FPV at commercial scale, such as long-term reliability, costs, integration into the grid system and the development of substations. The technical viability in a harsh and remote environment and the potential for FPV production costs still needs to be demonstrated. Furthermore, a key step required for the commercialisation of FPV at sea is the assessment of its potential contribution to the EGD, and the interaction with other maritime uses to identify ideal sites for deployment.
FPV installations are expected to provide additional value to different sectors of the Blue Economy such as aquaculture and to help remote coastal communities offset diesel generators, by providing direct access to electricity offsite. According to the World Bank, FPVs are of particular value for small island communities, to decarbonise energy demand and whilst overcoming the limitations due to the limited availability of land suitable for ground-mounted PV installations320.
Furthermore, the development of FPV together with other off-shore renewable energy sources such as ocean energy and off-shore wind, paves the way for the development of hybrid projects in combination with storage and hydrogen generation, and for the future development of energy islands.
5.1.4. HYDROGEN GENERATION OFFSHOREThe production of offshore electricity is confronted with a number of challenges related to grid stability, and variability due to the temporal mismatch between the supply (e.g. when wind turbines are generating electricity) and the demand (when the electricity is required). The production of renewable hydrogen by electroly-sis can help overcome several of those challenges and provide alternatives for storing excess electricity generated at sea. Once produced, hydrogen could be employed for energy carrier (in fuel cells) or as fuel heavy transport by water, road and eventually by air.
318 Ministerie van Economische Zaken en Klimat (2021) Routekaart Zon Op Water.319 https://oceansofenergy.blue/north-sea-1-offshore-solar-project/320 http://documents.worldbank.org/curated/en/579941540407455831/pdf/Floating-Solar-Market-Report-Executive-Summary.pdf321 Green hydrogen or renewable hydrogen is hydrogen produced through the electrolysis of water (in an electrolyser, powered by electricity), and with the electricity stemming
from renewable sources.322 A hydrogen strategy for a climate-neutral Europe https://eur-lex.europa.eu/legal-content/EN/TXT/?qid=1594897267722&uri=CELEX:52020DC0301 323 A hydrogen strategy for a climate-neutral Europe https://eur-lex.europa.eu/legal-content/EN/TXT/?qid=1594897267722&uri=CELEX:52020DC0301324 A hydrogen strategy for a climate-neutral Europe https://eur-lex.europa.eu/legal-content/EN/TXT/?qid=1594897267722&uri=CELEX:52020DC0301325 Topsector energie (2020) https://projecten.topsectorenergie.nl/projecten/pre-pilot-power-to-gas-offshore-00031694
and https://projecten.topsectorenergie.nl/storage/app/uploads/public/5e5/f65/63d/5e5f6563d9095865360210.pdf (in Dutch)326 TNO (2020) https://www.tno.nl/en/focus-areas/energy-transition/roadmaps/towards-co2-neutral-fuels-and-feedstock/hydrogen-for-a-sustainable-energy-supply/
In 2020, the European Commission published the Hydrogen Strategy, stating the ambition to build 40 GW of green hydro-gen321 electrolysers by 2030. It is estimated that 80 to 120 GW of renewable energy sources are needed to power the green hydrogen electrolysers322. Together, the Hydrogen Strategy and the Offshore Renewable Energy Strategy have created the frame-work for the development of offshore hydrogen generation cou-pled with offshore wind parks, or even in hybrid renewable energy projects combining offshore wind, ocean energy and FPV.
The generation of hydrogen offshore has a number of advan-tages, as both hydrogen transportation and storage can be done at large scale and at a relatively low cost. Furthermore, offshore oil and gas platforms could be re-purposed for renewable hydro-gen production. This offers the advantage for upstream oil com-panies to transform their operations and to exploit their know-how of operating in harsh marine environments.
Overall, the Hydrogen Strategy estimates that from now to 2030, investments in electrolysers could range from €24 to €42 bil-lion. In addition, over the same period, €220-340 billion would be required to scale up and directly connect 80-120 GW of solar and wind energy production capacity to the electrolysers to provide the necessary electricity323. Offshore hydrogen generation could play a substantial role, offering new business cases to O&G companies, to the manufacturing of electrolysers and contributing to meeting the EGD objectives and boosting the EU Blue Economy.
It is essential, however, that the ongoing pilots and announced projects prove economically viable for generating green hydrogen offshore. The expectation is that renewable hydrogen technologies will reach maturity by 2030 and that they will be deployed at scale between 2030 and 2050324.
The foremost technical challenge for producing renewable hydro-gen offshore is the development of an electrolyser module, which is compatible with the ocean environment, able to operate effec-tively when coupled with intermittent renewable power and is sufficiently compact to achieve very high rates of hydrogen pro-duction per platform or per device. The technical viability in this harsh and remote environment and the potential for competitive hydrogen production costs still needs to be demonstrated.
A number of projects are already exploring the possibility of spe-cific options for the coupling of offshore energy and green hydro-gen production: coupling wind energy, ocean energy and FPV with electrolysers. Many pilot projects have already been launched in the past year. The potential reuse of existing gas infrastructure in a hydrogen supply chain has been investigated by the "Pre-Pilot Power to Gas Offshore" (3P2GO)325 project, which has been followed by the pilot project PosHydon326, led by TNO. The goal is the realisation of the world’s first offshore power-to-gas pilot to
87
2021

produce hydrogen offshore and a test centre for other innovative power-to-gas technologies. The plan foresees a scale-up process for this type of system, starting at 1-10 MW, then 20-250 MW and ultimately >250 MW systems. The location chosen is an old oil and gas platform, located off the coast of The Hague. This platform is fully electrified and in a first phase of the project, the megawatt electrolyser will be fed by main land power. The final goal is, however, to generate green hydrogen from solar farms and the offshore wind farms located nearby. This project shall be the basis for a technology expected to grow in parallel to planned future wind power in the North Sea. A more visionary project is the Norwegian project Deep Purple327 that envisages not only offshore hydrogen production from wind farms, but also its subsea storage. The electrolyser – fuel cell modules - are planned to be part of the windmill structure.
The ITEG project328 (funded under the Interreg program) com-bines the Orbital Marine O2 2 MW tidal turbine with a custom built hydrogen electrolyser (500 kW, developed by AREVA) and an onshore energy management system to be deployed as an energy storage solution. The Phares329 project comprises two Sabella tidal turbines rate 500 kW, one 0.9 MW wind turbine, a 500 kW photo-voltaic installation and a hydrogen-based energy storage systems to be deployed on island of Ushant. Both ITEG and Phares aim to demonstrate the viability of tidal energy for decarbonisation and its potential to provide grid stability, especially in islands ecosystems.
2020 saw an increased interest of O&G companies in green off-shore hydrogen. Shell announced the NorthH2 project, aiming to couple 3-4 GW offshore wind generation with hydrogen produc-tion near Groningen by 2027. The expectation is that by 2040 the project could grow to 10 GW of offshore wind capacity producing 800 000 tonnes of green hydrogen330. Norwegian Oil Company Equinor and German utility RWE have also joined the NorthH2 project. Shell has also plan to integrate hydrogen electrolysers in their 759 MW offshore wind project Hollandse Kust Noord, which also foresee the installation of floating PV module from 2025 onwards331.
These projects are framed in the ongoing ambition of the Dutch government to support the development of hydrogen as per its “Government Strategy on Hydrogen”332. Similar strategies have been unveiled in Spain333 and Germany334.
world-first-an-offshore-pilot-plant-for-green-hydrogen/ 327 Energy Valley (2019) https://energyvalley.no/wp-content/uploads/2019/04/Deep-Purple-.pdf328 For further information about ITEG project see: https://www.nweurope.eu/projects/project-search/iteg-integrating-tidal-energy-into-the-european-grid/. 329 Sabella (2020) - Phares Project https://www.sabella.bzh/en/projects/phares 330 Recharhe (2020) Shell unveils world's largest offshore wind plan to power green hydrogen - https://www.rechargenews.com/wind/
shell-unveils-worlds-largest-offshore-wind-plan-to-power-green-hydrogen/2-1-763610331 Green Tech Media (2021) - Super-Hybrid: Dutch Offshore Wind Farm to Include Floating Solar, Batteries and Hydrogen. 332 Rijksoverheid (2020) https://www.government.nl/documents/publications/2020/04/06/government-strategy-on-hydrogen 333 Miteco (2020) Hoja de Ruta del Hidrógeno: una apuesta por el hidrógeno renovable
https://www.miteco.gob.es/es/prensa/201006nphojaderutah2_tcm30-513813.pdf 334 BMWI (2020) Die Nationale Wasserstoffstrategie https://www.bmwi.de/Redaktion/EN/Publikationen/Energie/the-national-hydrogen-strategy.pdf?__blob=publicationFile&v=6 335 BMWI (2020) Die Nationale Wasserstoffstrategie https://www.bmwi.de/Redaktion/EN/Publikationen/Energie/the-national-hydrogen-strategy.pdf?__blob=publicationFile&v=6336 RWE (2020) Aquaventus https://www.group.rwe/en/our-portfolio/innovation-and-technology/hydrogen/aquaventus 337 RWE (2020) Rostock https://www.group.rwe/en/our-portfolio/innovation-and-technology/hydrogen/rostock 338 Orsted (2021) Ørsted takes final investment decision on first renewable hydrogen project https://orsted.com/en/media/newsroom/news/2021/01/672305561121775 339 Danish Energy Agency (2021) Denmark's Energy Islands https://ens.dk/en/our-responsibilities/wind-power/energy-islands/denmarks-energy-islands 340 Saipem (2021) https://www.saipem.com/en/media/press-releases/2021-03-04/saipem-and-alboran-hydrogen-together-green-hydrogen-production341 Naturgy (2021) Naturgy and Enagás are studying the production of green hydrogen from 350 MW of wind power in Asturias https://www.naturgy.com/en/
naturgy_and_enagas_are_studying_the_production_of_green_hydrogen_from_350_mw_of_wind_power_in_asturias
The German Roadmap foresees that by 2030, 5 GW of offshore wind energy will be coupled with hydrogen electrolysers, with the expectation that a further 5 GW will be added between 2035 and 2030335. Projects announced already match the government's ambition. RWE is leading the development of a 10 GW offshore wind – green hydrogen project to be developed in the North Sea, with the Island of Heligoland serving as a hub. The project is expected to be operative by 2035 developing 1 million tonnes of green hydrogen336. RWE is also exploring the potential to gener-ate green hydrogen in port facilities (onshore electrolysers) with electricity coming from wind farms located in the Baltic Sea337.
In Denmark, Orsted has reached final investment decision for the H2RES project. The project will have a capacity of 2MW and will be able to generate 1 tonne of green hydrogen daily, which will be used for road transportation in the Greater Copenhagen areas. The project is expected to become operational in 2021338. Denmark has also announced the development of energy islands in the North Sea (3GW to 10 GW) and in the Baltic Sea (2 GW). The projects are expected to deliver electricity to Denmark and neighbouring countries. Storage and Hydrogen generation (and refuelling for shipping) are currently being evaluated and their integration will depend on their maturity339.
Offshore green energy development are not only taking place in the North and Baltic Sea. In Italy, Saipem and Alboran have signed a Memorandum of Understanding for the development of 5 green hydrogen projects in the Mediterranean basin (3 in Italy, 1 in Albania and 1 in Morocco)340. In Spain, Naturgy and Energas have announced plans for a green hydrogen project off the coast of Asturias. The two-phase project will see the deployment of a pilot consisting of a 5 MW electrolyser connected to 50 MW of offshore wind. In the second stage, the offshore wind capacity will be expanded to 250 MW. The project is complemented with 100 MW of onshore wind coupled with a 10 MW electrolyser341.
88
THE
EU B
LUE
ECO
NO
MY
REPO
RT

5.2. THE BLUE BIOECONOMY & BIOTECHNOLOGYThe Blue Bioeconomy and biotechnology sectors in Europe include the non-traditionally commercially exploited groups of marine organisms and their biomass applications. Algae (macro- and micro-), bacteria, fungi and invertebrates are among the impor-tant marine resources used as feedstock in the Blue Bioeconomy. This biomass is used for a variety of commercial applications including food and food supplements, feed, cosmetics, fertilisers and plant biostimulants, and innovative commercial uses as bio-materials, bioremediation or biofuels. These groups of organisms and derived compounds are important resources in relation to a number of EU priorities such as carbon neutrality, innovative, healthy and sustainable food systems and sustainable and cir-cular bioeconomy. Hundreds of new compounds from the marine realm are being discovered every year demonstrating the inno-vative nature and potential of the sector342 , while new technolo-gies are being researched to increase the quality and reliability of these compounds343.
An analysis of EU funded projects estimates that, since 2014, around €262 million have been invested through the European Regional Development Fund (ERDF) and Horizon 2020 in pro-jects supporting Blue biotechnology covering thematic areas such as life sciences, bioeconomy, agri-food, new materials or bioenergy344.
Between 2014 and 2018, 536 operations addressing Blue bio-economy were funded by the ERDF through the EU Cohesion Policy, representing an EU contribution of €132 million to a total cost of €171 million. Out of the €132 million, €80 mil-lion have been allocated to technology transfer and universi-ty-industry cooperation primarily benefiting small and medi-um-sized enterprises (SMEs).
342 Carroll, A.R.; Copp, B.R.; Davis, R.A.; Keyzers, R.A.; Prinsep, M.R. (2019). Marine natural products. Natural Product Reports, 36, 122–173.343 EUMOFA. 2020. Blue Bioeconomy Report. Luxembourg: Publications Office of the European Union.344 Doussineau M., Haarich S., Gnamus A., Gomez J., Holstein F (2020). Smart Specialisation and Blue biotechnology in Europe, EUR 30521 EN, Publications Office of the
European Union, Luxembourg, 2020, ISBN 978-92-76-27753-8, doi:10.2760/19274, JRC122818.345 Araújo R, Vásquez Calderón F, Sanchez Lopez J, Azevedo I, Bruhn A, Flunch S, Garcia-Tasende M, Ghaderiardakani F, Ilmjärv T, Laurans M, MacMonagail M, Mangini S, Peteiro
C, Rebours C, Stefánsson T, Ullmann J (2021). Emerging sectors of the Blue Bioeconomy in Europe: status of the algae production industry. Frontiers in Marine Sciences doi: 10.3389/fmars.2020.626389.
The European Maritime and Fisheries Fund (EMFF) also finances projects in the area of the blue bioeconomy and the 2018 call supported the development of innovative applications such as the use of marine biomass waste, biobased materials and underex-ploited marine resources and microbial bioremediation.
Additionally, BlueInvest has supported access to finance for ear-ly-stage businesses, SMEs and scale-ups in the area of the Blue Economy, including 7 companies in the algae business with an average investment of €1.75 million per project.
In parallel to this investment and for a number of years, a grow-ing trend in the algae and spirulina biomass production industry has been observed. A recent study345 showed that the number of companies producing algae in Europe has increased significantly (150%) in the last decade (Figure 5.9).
5.2.1. CURRENT STATUS OF THE ALGAE SECTORSpain, France, Ireland and Norway are the countries in Europe with the largest number of macroalgae companies and macroal-gae production is being developed in 13 countries (Figure 5.10). The activities connected to the macroalgae industry represent an important cultural heritage and constitute an essential source of income for some coastal and rural communities.
Harvesting from wild stocks is the primary production method for macroalgae in Europe being the production technology used by 68% of the macroalgae production units and covering 11 European countries (Figure 5.11, Figure 5.12). Among these, 85% of the producers harvest the biomass by hand. Mechanical har-vesting is usually carried out by companies running a fleet of vessels, thus corresponding to higher biomass removal potential compared to manual harvesting. Spain, France and Ireland are the countries with the highest number of macroalgae harvesting companies (Figure 5.12).
Figure 5.9 Number of algae producing companies currently operating in Europe (starting activity since 1926)
Note: The values shown represent the number (left axis) and the accumulated (right axis) number of companies per year from the companies currently active. Source: Araujo et al. 2021
89
2021

Aquaculture production of macroalgae, presently ongoing in 13 European countries, is at an early stage of development in Europe in terms of production volumes and number of production units (Figure 5.10). According to official statistics, seaweed aquaculture production contributes to less than 1% of total European sea-weed biomass production346 although accounting for 32% of the mapped macroalgae production units (Figure 5.11). Most of the production units are located at sea (offshore or in coastal waters) with only 24% of the companies conducting land-based activities.
Germany, France and Spain host the largest number of microal-gae producers in Europe while France dominates the Spirulina production landscape with 65% of the mapped production units in Europe. Sixteen European countries have microalgae and 15 have Spirulina production plants (Figure 5.10).
Microalgae are cultivated by different production methods. Some production plants combine different production systems, e.g.
346 FAO (2020). FishStatJ - Software for Fishery and Aquaculture Statistical Time Series Rome: Food and Agricultural Organization of the United Nations
photobioreactors (PBR) with fermenters or open ponds. Overall, PBR are the most common system used for microalgae production (71%), while for Spirulina the primary production method used is open ponds (83% of the companies) (Figure 5.13).
Food supplements and nutraceuticals (24%), cosmetics (24%) and feed (19%) are the main applications of microalgae biomass, con-tributing together to 63% of the total uses (Figure 5.14). Spirulina production is mainly directed at food and food supplements and nutraceuticals, contributing to 75% of the reported uses.
Most of the seaweed companies in Europe direct their biomass production at food (36%), food-related uses (15%) i.e. food sup-plements, nutraceuticals and hydrocolloid production and, to feed (10%), accounting for 61% of the total uses. Cosmetics and well-being products also contribute to a significant share of the biomass uses (17%) while each of the other applications (e.g. fertilisers and biostimulants) individually contribute with less than
Figure 5.10 Number and relative distribution between macro- and microalgae (a) and Spirulina (b) production companies by country
Source: Araujo et al. 2021
Figure 5.11 Macroalgae production methods in Europe (share by the number of companies using these methods
Source: in Araujo et al. 2021.
90
THE
EU B
LUE
ECO
NO
MY
REPO
RT

11% to the total share. These values refer to the number of com-panies directing the produced biomass at each of the uses, which might not reflect the volumes allocated to each application.
The available data on the turnover and employment on the algae sector refer to the aquaculture industry347. These data are very fragmented and cover only France (macro-, microalgae and Spirulina), Spain (macro-, microalgae and Spirulina) and Portugal (macroalgae). The analysis of the data show that 87% of the total number of algae aquaculture companies are micro-enterprises with fewer than five employees. The EU aquaculture (considering these countries) employs 509 persons, 399 in full time equivalent (FTE). The sector has a total reported turnover (in these countries) of €10.7 million (Figure 5.15).
347 Scientific, Technical and Economic Committee for Fisheries (STECF) – The EU Aquaculture Sector – Economic report 2020 (STECF-20-12). Publications Office of the European Union, Luxembourg, 2021, EUR 28359 EN.
348 Zhang, X., and Thomsen, M. (2019). Biomolecular composition and revenue explained by interactions between extrinsic factors and endogenous rhythms of Saccharina latissima. Mar. Drugs 17:107. doi: 10.3390/md17020107.
5.2.2. NEW DEVELOPMENTS
The algae biorefinery (or algae biofactory) is currently being explored as an approach to increase the environmental sustain-ability (by optimising resources and minimising waste) and eco-nomic feasibility (by maximising profits) of existing conventional industrial processes. Different conversion pathways are being researched for the use, extraction and valorisation of algae bio-mass value-added products348. All potential impacts of such tech-nologies need to be addressed in a holistic way to ensure that they are sustainable.
Several European scale projects have been researching ways to optimise processes and upscale production with the aim of facil-itating the widespread implementation of an algae biorefinery in
Figure 5.12 Numbers of macro- and microalgae producing companies in Europe broken down by production technology and country
Note: Production volumes (tonnes) by country are detailed, when available, according to the FAO data (2020).Source: modified from Araujo et al. 2021
Figure 5.13 Microalgae and Spirulina share of production methods.
Note: The category “Ponds” includes both open and semi-open pondsSource: Araujo et al. 2021
91
2021

Table 5.3 Main research projects on the use of algae biorefineries in Europe
Source: own elaboration.
Project name Main achievements Expected impact on the algae sector in Europe
Valuemag - Valuable Products from Algae Using New Magnetic Cultivation and Extraction Techniques
Development of technological solutions for:• microalgae production;• metabolites extraction;• biomass harvesting, use and transformation;• scale-up of processing systems.
Demonstration of the feasibility and potential profitability of the applied innovative project solutions for cost reduction, added-value creation and sustainability.
MULTI-STR3AM – A sustainable multi-strain, multi-method, multi-product microalgae biorefinery integrating industrial side streams to create high-value products for food, feed and fragrance
• Definition of the main processes of the Biorefinery;• Start of the implementation of the production
systems;• Refining systems
The project reduces costs, increases scale and boosts sustainability creating a roadmap for economically viable industrial-scale microalgae cultivation.
SPIRALG – Making the best of Spirulina biomass from sustainably produced biomass to valuable phycocyanin and co-products (ongoing)
• Optimization of biomass production volumes;• Extraction and stabilization of byproducts and rich
fractions of byproducts;• Assessment of CO2 emissions, energy and water
costs
Demonstration of pilot production, at economical cost to address simultaneously different value markets from the same biomass, generating a new complete value chain on spirulina with potential for similar developments on other algal sources
PROMAC (Energy-efficient Processing of Macroalgae in blue-green value chains)
• Examination of variations in raw material composi-tion and quality;
• Development of primary processes to improve raw material properties;
• Establishment of fractionation and extraction methods to enrich beneficial proteins or remove unwanted antinutrients
• Evaluation of the nutritional and health value of processed ingredients to different animal groups.
Expansion of knowledge on preservation and protein extraction processes and life cycle manage-ment studies addressing the impact of the produc-tion systems regarding raw materials and energy.
Europe and boost the algae sector. A short description of some of these projectss main achievements and expected impacts is provided below (Table 5.3).
Offshore aquaculture
The production of macroalgae biomass by offshore aquacul-ture still corresponds to a minority of the aquaculture farms in Europe. The upscaling of this production method relies on over-coming technological constraints and knowledge limitations in order to reduce infrastructural and logistics costs and increase biomass yields. This cultivation method offers advantages in terms of management of maritime space and increase of the production capacity. At present, projects seek technological solu-tions to increase the profitability of offshore aquaculture349 and to combine multipurpose activities as for example wind farms with seaweed aquaculture facilities350.
349 Bak, U. G., Mols-Mortensen, A., and Gregersen, O. (2018). Production method an cost of commercial-scale offshore cultivation of kelp in the Faroe Islands usin multiple partial harvesting. Algal. Res. 33, 36–47. doi: 10.1016/j.algal.2018.05001.
350 van den Burg, S. W. K., Rockmann, C., Banach, J. L., and van Hoof, L. (2020). Governing risks of multi-use: seaweed aquaculture at offshore wind farms. Front. Mar. Sci. 7:60. doi: 10.3389/fmars.2020.00060.
351 Buck, B. H., Troell, M. F., Krause, G., Angel, D. L., Grote, B., and Chopin,T. (2018). State of the art and challenges for offshore integrated multitrophic aquaculture (IMTA). Front. Mar. Sci. 5:165. doi: 10.3389/fmars.2018.00165.
352 EUMOFA. 2020. Blue Bioeconomy Report. Luxembourg: Publications Office of the European Union.
Integrated Multi-Trophic Aquaculture (IMTA)
Integrated Multi-Trophic Aquaculture (IMTA) systems are regarded as a way to increase the environmental and economic sustainability of the production of all the involved cultures (Figure 5.16). The IMTA approach is based on the co-cultivation of species from different trophic levels (2 or more) with miti-gation potential by reducing the nutrients and organic matter inputs from finfish aquaculture351
5.2.3. OTHER SECTORS
The cultivation and harvesting of less exploited groups of organ-isms (e.g. sea urchins or sea stars) is being researched as a means to reduce the pressure on natural resources in specific areas, and to increase the diversification of aquaculture to low trophic levels. However, these activities are still at a very early stage of devel-opment in Europe.
The use of biomass from fish rest raw material for commercial applications not directly related to human consumption is being studied based on the example of some successful case studies352.
92
THE
EU B
LUE
ECO
NO
MY
REPO
RT

Figure 5.14 Share of commercial biomass applications by macroalgae and microalgae production company.
Note: These results are based on the share in the number of companies (not by volume)Source: Araujo et al. 2021
Figure 5.15 Total turnover € million (left) and number of employees and FTE’s (right) in the EU-27 algae aquaculture per MS.
Source: STECF’s aquaculture report (2021)
0
1
2
3
4
5
6
7
8
9
10
Spain France Portugal
Turnover
0
50
100
150
200
250
300
350
400
450
500
Spain France Portugal
Employment
Total employees FTE
the primary cultivated species which produceorganic and inorganic residues resulting from feeding
(uneaten feed pellets) and excretion of nutrients
Fishes or other organisms (shrimps, lobsters)
(naturally remove inorganic nutrients
(phosphorus and nitrates) from the water column)
Algae
filter the water column feeding on microalgae and zooplankton or
feed on particulate matter accumulated in the sediment
Filter feeders and detritivorous(oysters, mussels, sea urchins,
sea cucumber)
Integrated Multitrophic Aquaculture (IMTA)
Figure 5.16 Schematic description of the Integrated Multitrophic Aquaculture (IMTA) approach.
Source: Own elaboration based on material provided by Algaplus
Algaecultivation
Seabrass+
Seabreamcultivation
93
2021
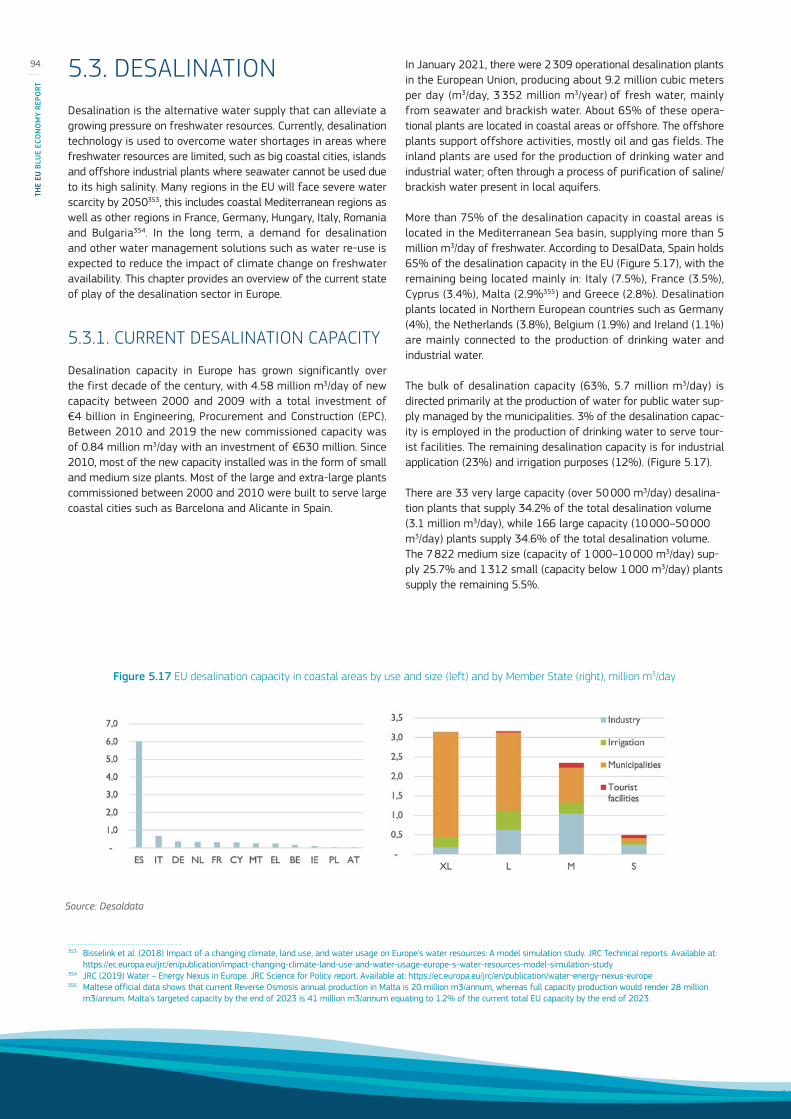
Figure 5.17 EU desalination capacity in coastal areas by use and size (left) and by Member State (right), million m3/day
Source: Desaldata
5.3. DESALINATIONDesalination is the alternative water supply that can alleviate a growing pressure on freshwater resources. Currently, desalination technology is used to overcome water shortages in areas where freshwater resources are limited, such as big coastal cities, islands and offshore industrial plants where seawater cannot be used due to its high salinity. Many regions in the EU will face severe water scarcity by 2050353, this includes coastal Mediterranean regions as well as other regions in France, Germany, Hungary, Italy, Romania and Bulgaria354. In the long term, a demand for desalination and other water management solutions such as water re-use is expected to reduce the impact of climate change on freshwater availability. This chapter provides an overview of the current state of play of the desalination sector in Europe.
5.3.1. CURRENT DESALINATION CAPACITY
Desalination capacity in Europe has grown significantly over the first decade of the century, with 4.58 million m3/day of new capacity between 2000 and 2009 with a total investment of €4 billion in Engineering, Procurement and Construction (EPC). Between 2010 and 2019 the new commissioned capacity was of 0.84 million m3/day with an investment of €630 million. Since 2010, most of the new capacity installed was in the form of small and medium size plants. Most of the large and extra-large plants commissioned between 2000 and 2010 were built to serve large coastal cities such as Barcelona and Alicante in Spain.
353 Bisselink et al. (2018) Impact of a changing climate, land use, and water usage on Europe’s water resources: A model simulation study. JRC Technical reports. Available at: https://ec.europa.eu/jrc/en/publication/impact-changing-climate-land-use-and-water-usage-europe-s-water-resources-model-simulation-study
354 JRC (2019) Water – Energy Nexus in Europe. JRC Science for Policy report. Available at: https://ec.europa.eu/jrc/en/publication/water-energy-nexus-europe355 Maltese official data shows that current Reverse Osmosis annual production in Malta is 20 million m3/annum, whereas full capacity production would render 28 million
m3/annum. Malta’s targeted capacity by the end of 2023 is 41 million m3/annum equating to 1.2% of the current total EU capacity by the end of 2023.
In January 2021, there were 2 309 operational desalination plants in the European Union, producing about 9.2 million cubic meters per day (m3/day, 3 352 million m3/year) of fresh water, mainly from seawater and brackish water. About 65% of these opera-tional plants are located in coastal areas or offshore. The offshore plants support offshore activities, mostly oil and gas fields. The inland plants are used for the production of drinking water and industrial water; often through a process of purification of saline/brackish water present in local aquifers.
More than 75% of the desalination capacity in coastal areas is located in the Mediterranean Sea basin, supplying more than 5 million m3/day of freshwater. According to DesalData, Spain holds 65% of the desalination capacity in the EU (Figure 5.17), with the remaining being located mainly in: Italy (7.5%), France (3.5%), Cyprus (3.4%), Malta (2.9%355) and Greece (2.8%). Desalination plants located in Northern European countries such as Germany (4%), the Netherlands (3.8%), Belgium (1.9%) and Ireland (1.1%) are mainly connected to the production of drinking water and industrial water.
The bulk of desalination capacity (63%, 5.7 million m3/day) is directed primarily at the production of water for public water sup-ply managed by the municipalities. 3% of the desalination capac-ity is employed in the production of drinking water to serve tour-ist facilities. The remaining desalination capacity is for industrial application (23%) and irrigation purposes (12%). (Figure 5.17).
There are 33 very large capacity (over 50 000 m3/day) desalina-tion plants that supply 34.2% of the total desalination volume (3.1 million m3/day), while 166 large capacity (10 000–50 000 m3/day) plants supply 34.6% of the total desalination volume. The 7 822 medium size (capacity of 1 000–10 000 m3/day) sup-ply 25.7% and 1 312 small (capacity below 1 000 m3/day) plants supply the remaining 5.5%.
94
THE
EU B
LUE
ECO
NO
MY
REPO
RT
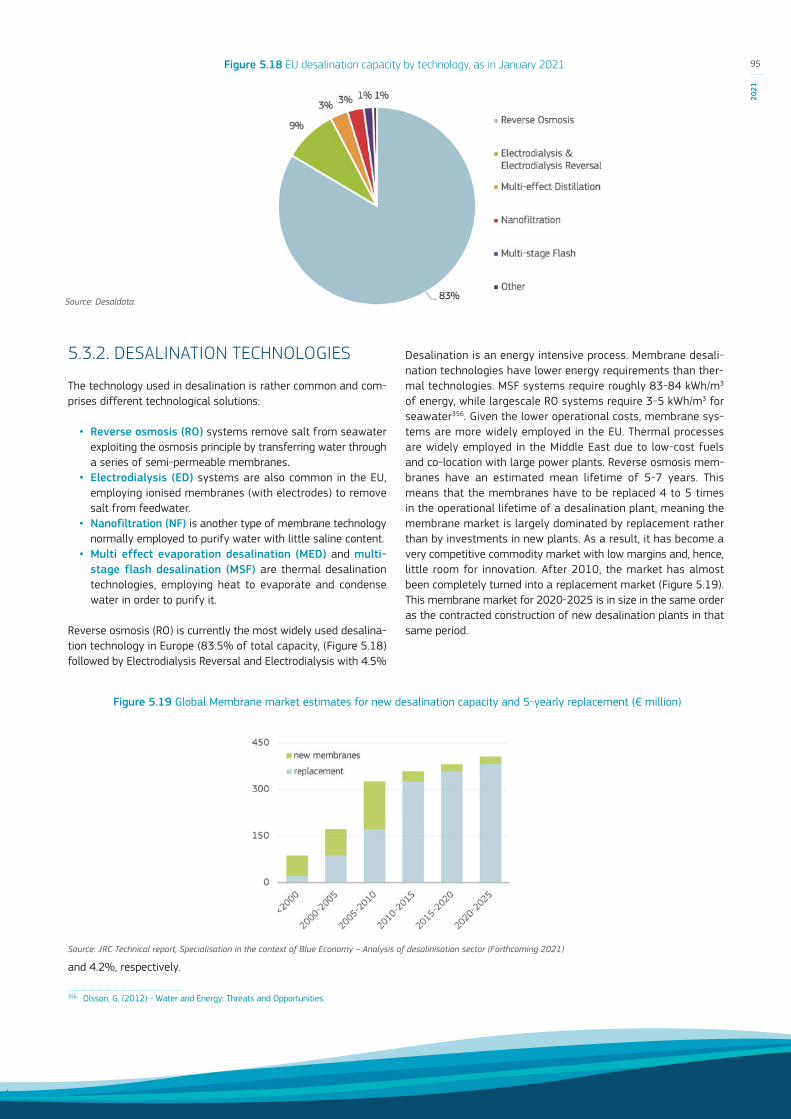
5.3.2. DESALINATION TECHNOLOGIES
The technology used in desalination is rather common and com-prises different technological solutions:
• Reverse osmosis (RO) systems remove salt from seawater exploiting the osmosis principle by transferring water through a series of semi-permeable membranes.
• Electrodialysis (ED) systems are also common in the EU, employing ionised membranes (with electrodes) to remove salt from feedwater.
• Nanofiltration (NF) is another type of membrane technology normally employed to purify water with little saline content.
• Multi effect evaporation desalination (MED) and multi-stage flash desalination (MSF) are thermal desalination technologies, employing heat to evaporate and condense water in order to purify it.
Reverse osmosis (RO) is currently the most widely used desalina-tion technology in Europe (83.5% of total capacity, (Figure 5.18) followed by Electrodialysis Reversal and Electrodialysis with 4.5%
and 4.2%, respectively.
356 Olsson, G. (2012) - Water and Energy: Threats and Opportunities.
Desalination is an energy intensive process. Membrane desali-nation technologies have lower energy requirements than ther-mal technologies. MSF systems require roughly 83-84 kWh/m3 of energy, while largescale RO systems require 3-5 kWh/m3 for seawater356. Given the lower operational costs, membrane sys-tems are more widely employed in the EU. Thermal processes are widely employed in the Middle East due to low-cost fuels and co-location with large power plants. Reverse osmosis mem-branes have an estimated mean lifetime of 5-7 years. This means that the membranes have to be replaced 4 to 5 times in the operational lifetime of a desalination plant, meaning the membrane market is largely dominated by replacement rather than by investments in new plants. As a result, it has become a very competitive commodity market with low margins and, hence, little room for innovation. After 2010, the market has almost been completely turned into a replacement market (Figure 5.19). This membrane market for 2020-2025 is in size in the same order as the contracted construction of new desalination plants in that same period.
Figure 5.18 EU desalination capacity by technology, as in January 2021
Source: Desaldata.
Figure 5.19 Global Membrane market estimates for new desalination capacity and 5-yearly replacement (€ million)
Source: JRC Technical report, Specialisation in the context of Blue Economy – Analysis of desalinisation sector (Forthcoming 2021)
95
2021
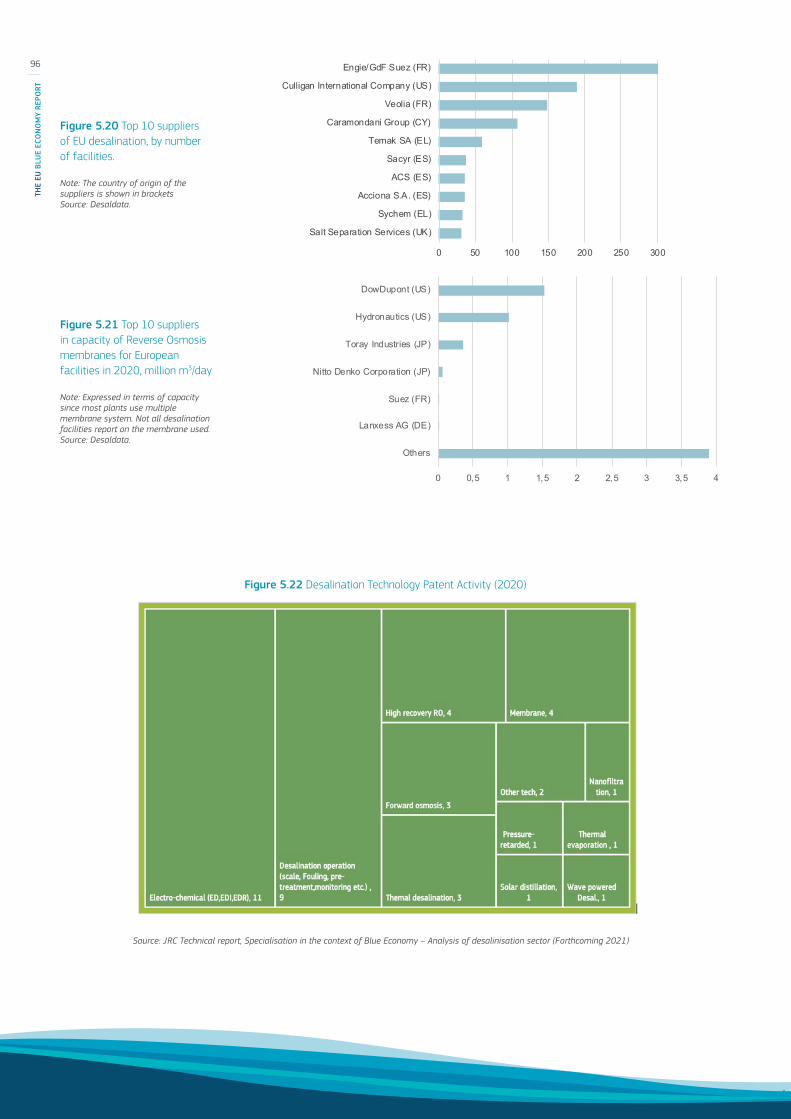
0 0,5 1 1,5 2 2,5 3 3,5 4
DowDupont (US)
Hydronautics (US)
Toray Industries (JP)
Nitto Denko Corporation (JP)
Suez (FR)
Lanxess AG (DE)
Others
Figure 5.20 Top 10 suppliers of EU desalination, by number of facilities.
Note: The country of origin of the suppliers is shown in bracketsSource: Desaldata.
Figure 5.21 Top 10 suppliers in capacity of Reverse Osmosis membranes for European facilities in 2020, million m3/day
Note: Expressed in terms of capacity since most plants use multiple membrane system. Not all desalination facilities report on the membrane used.Source: Desaldata.
0 50 100 150 200 250 300
Engie/GdF Suez (FR)
Culligan International Company (US)
Veolia (FR)
Caramondani Group (CY)
Temak SA (EL)
Sacyr (ES)
ACS (ES)
Acciona S.A. (ES)
Sychem (EL)
Salt Separation Services (UK)
Figure 5.22 Desalination Technology Patent Activity (2020)
Source: JRC Technical report, Specialisation in the context of Blue Economy – Analysis of desalinisation sector (Forthcoming 2021)
96
THE
EU B
LUE
ECO
NO
MY
REPO
RT
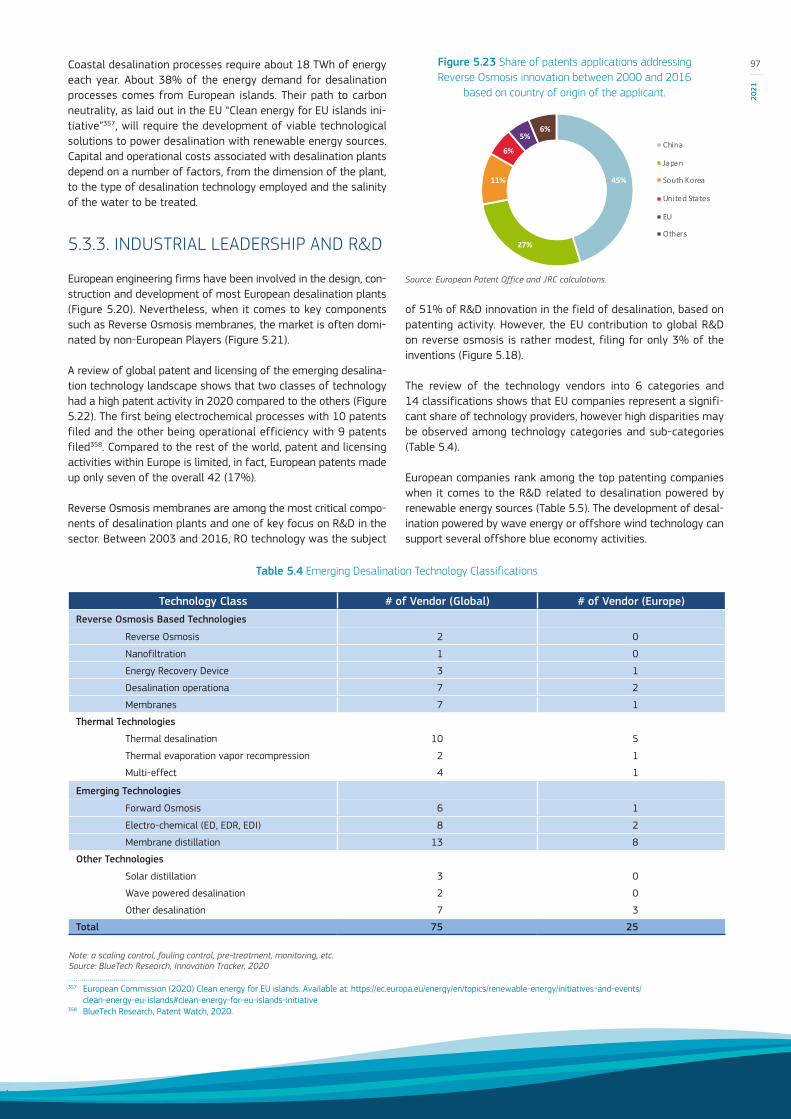
45%
27%
11%
6%
5%6%
Value added by Member State
China
Japan
South Korea
United States
EU
Others
Coastal desalination processes require about 18 TWh of energy each year. About 38% of the energy demand for desalination processes comes from European islands. Their path to carbon neutrality, as laid out in the EU “Clean energy for EU islands ini-tiative”357, will require the development of viable technological solutions to power desalination with renewable energy sources. Capital and operational costs associated with desalination plants depend on a number of factors, from the dimension of the plant, to the type of desalination technology employed and the salinity of the water to be treated.
5.3.3. INDUSTRIAL LEADERSHIP AND R&D
European engineering firms have been involved in the design, con-struction and development of most European desalination plants (Figure 5.20). Nevertheless, when it comes to key components such as Reverse Osmosis membranes, the market is often domi-nated by non-European Players (Figure 5.21).
A review of global patent and licensing of the emerging desalina-tion technology landscape shows that two classes of technology had a high patent activity in 2020 compared to the others (Figure 5.22). The first being electrochemical processes with 10 patents filed and the other being operational efficiency with 9 patents filed358. Compared to the rest of the world, patent and licensing activities within Europe is limited, in fact, European patents made up only seven of the overall 42 (17%).
Reverse Osmosis membranes are among the most critical compo-nents of desalination plants and one of key focus on R&D in the sector. Between 2003 and 2016, RO technology was the subject
357 European Commission (2020) Clean energy for EU islands. Available at: https://ec.europa.eu/energy/en/topics/renewable-energy/initiatives-and-events/clean-energy-eu-islands#clean-energy-for-eu-islands-initiative
358 BlueTech Research, Patent Watch, 2020.
of 51% of R&D innovation in the field of desalination, based on patenting activity. However, the EU contribution to global R&D on reverse osmosis is rather modest, filing for only 3% of the inventions (Figure 5.18).
The review of the technology vendors into 6 categories and 14 classifications shows that EU companies represent a signifi-cant share of technology providers, however high disparities may be observed among technology categories and sub-categories (Table 5.4).
European companies rank among the top patenting companies when it comes to the R&D related to desalination powered by renewable energy sources (Table 5.5). The development of desal-ination powered by wave energy or offshore wind technology can support several offshore blue economy activities.
Table 5.4 Emerging Desalination Technology Classifications
Note: a scaling control, fouling control, pre-treatment, monitoring, etc. Source: BlueTech Research, Innovation Tracker, 2020
Technology Class # of Vendor (Global) # of Vendor (Europe)Reverse Osmosis Based Technologies
Reverse Osmosis 2 0
Nanofiltration 1 0
Energy Recovery Device 3 1
Desalination operationa 7 2
Membranes 7 1
Thermal Technologies
Thermal desalination 10 5
Thermal evaporation vapor recompression 2 1
Multi-effect 4 1
Emerging Technologies
Forward Osmosis 6 1
Electro-chemical (ED, EDR, EDI) 8 2
Membrane distillation 13 8
Other Technologies
Solar distillation 3 0
Wave powered desalination 2 0
Other desalination 7 3
Total 75 25
Figure 5.23 Share of patents applications addressing Reverse Osmosis innovation between 2000 and 2016
based on country of origin of the applicant.
Source: European Patent Office and JRC calculations.
97
2021

5.3.4. OUTLOOK
The global population increase and the rise in demand for con-sumable water have driven the growth of the desalination sec-tor. However, the COVID-19 pandemic is hampering the sector's growth. The sector requires high initial investments in desalination plants, which may be difficult to include in the budget during this period. A year ago, for instance, a total capacity of 200 000 m3/day of new desalination projects were planned for the 2021 to 2024 period. However, by January 2021, only a total capacity of 79 400 m3/day of new desalination projects had been planned for the 2021-2025 period. Reverse osmosis is the predominant tech-nology that these newly planned desalination plants are expected to employ.
5.3.5. GOING BEYOND: SUSTAINABLE DESALINATION FOR EUROPE AND THE MEDITERRANEAN
Desalination has been proposed as a “win-win solution” to restore the water cycle and is expected to become commonly used as societies progressively understand its broader benefits. Coupling desalination with water reuse maximises the socioeconomic and ecological return on investments359. In order for desalination to be sustainable, the energy it requires must be fully decarbonised. Moreover, the impacts associated with brine disposal must be appropriately mitigated.
A seawater reverse osmosis plant may be designed in order to be fed by photovoltaic (PV) or other renewable energy sources,
359 Pistocchi, A., et al. (2020a). Can seawater desalination be a win-win fix to our water cycle? Water research, 115906. https://doi.org/10.1016/j.watres.2020.115906.360 Ganora, D., Dorati, C., Huld, T. A., Udias, A., & Pistocchi, A. (2019). An assessment of energy storage options for large-scale PV-RO desalination in the extended
Mediterranean region. Scientific Reports, 9(1), 16234. https://doi.org/10.1038/s41598-019-52582-y361 Pistocchi, A., et al. (2020a). Can seawater desalination be a win-win fix to our water cycle?. Water research, 115906. https://doi.org/10.1016/j.watres.2020.115906.362 Pistocchi, A., et al. (2020a). Can seawater desalination be a win-win fix to our water cycle?. Water research, 115906. https://doi.org/10.1016/j.watres.2020.115906.
Pistocchi, A., Bleninger, T., & Dorati, C. (2020b). Screening the hurdles to sea disposal of desalination brine around the Mediterranean. Desalination, 491, 114570.
at costs that are already, or may soon become, competitive with plants running on conventional fuels. The concept of a 100% PV-based desalination plant with a modular scheduling of water production following the monthly variability of radiation, battery and water storage has been proposed to increase autonomy from the grid in the extended Mediterranean region360. A saltwater res-ervoir at a certain elevation, followed by a booster pump, enables splitting the "fixed" energy demand of membrane operation from the "flexible" demand for pumping to the reservoir, which may use PV power as it is available.
Using an engineering costing model, it is estimated that a large share of the population in the Mediterranean region could be ser-viced by PV-fueled desalination at a cost below €1 /m3 (Figure 5.24)361. While the average cost of producing one cubic meter (1 000 litres) of desalted water using RO technology is of €0.86. The cost is reduced with an increasing capacity to buffer the intermittency of the energy source and would be minimal in the case that energy storage were possible directly on the general power grid. A stand-alone plant producing desalinated water on gear with PV production on site would be the most costly solution because of the higher incidence of capital costs. However, even in this case the costs would be lower than certain conventional solu-tions (such as diesel-powered local power grids or even transport with water tankers in certain Mediterranean islands).
Brine disposal may be a significant hurdle for the implemen-tation of desalination because of the potential impacts of high salinity on marine ecosystems. While impacts are typically local and limited in extent, they need to be properly mitigated362. The main solution in order to mitigate the impacts is to design an outfall providing sufficient initial dilution. This usually implies a
Table 5.5 Top 10 global patenting companies in Desalination powered by a renewable energy source, based on number of innovations patented between 2003 and 2016.
Notes: The data correspond to the Cooperative Patent Classification subclass CPC Y02A 20/138.Source: Patent Office and JRC calculations.
Company Country Renewable Source
Hitachi LTD JP
Mitsubishi heavy industries LTD JP
G24 innovations limited UK Solar thermal or photovoltaics
Gea bloksma BV NL Wave energy
Ecospec global technology PTE LTD SG
Hydropath holdings limited UK Wave energy
Eukrasia srl IT Wind power
Seapower pacific PTY LETD AU
University of Florida research foundation INC US
Lopez SPAS FR Wind power
98
THE
EU B
LUE
ECO
NO
MY
REPO
RT

Figure 5.25 cumulative distribution of population serviced with increasing velocity and disposal energy for different dilution requirements
Note: an estimated requirement based on the actual distribution of ecosystems; the requirement for more (Posidonia) or less sensitive (Cymodocea) seagrass, and constant dilution rate S=10, 20, 33. Source: Pistocchi et al., 2020a. https://doi.org/10.1016/j.desal.2020.114570, reproduced under CC-BY license.
Figure 5.24 costs of water production under different assumptions in the Mediterranean.
Note: The different strategies for energy storage are: grid= only exchange with the grid; b=battery; r=water reservoir; b+r=combined reservoir and battery. " Min" and "Max" correspond to combinations with cost of power exchange with the grid of 1and 10 Euro Cents/kWh; for battery and reservoir, we consider both an optimistic and a bottom line scenario whereby battery cost is higher and battery life is shorter. Source: Pistocchi et al., 2020a (Supporting information) reproduced under CC-BY license
sufficient outfall velocity. However, velocities may not be exces-sively high (e.g. much above 7 m/s) because of hydraulic and structural limitations with the outfalls, as well as increasing energy requirements. When a reasonable velocity per se does not ensure sufficient dilution, outfalls require more complex and expensive design, and brine disposal may become a major issue. A study analyses the conditions of potential desalination sites in this respect and highlights that indeed, a large percentage of the
363 Pistocchi, A., Bleninger, T., & Dorati, C. (2020). Screening the hurdles to sea disposal of desalination brine around the Mediterranean. Desalination, 491, 114570.
potentially served population may require complex outfall design with a standard brine corresponding to freshwater recovery from seawater of 50% (Figure 5.25) 363. Still, in certain sites, the dilution requirements are met with some margin of safety. In such cases, concentrating the brine beyond typical recovery would reduce the distance of disposal from the coast, and cut on disposal costs. Further brine concentration should be appraised in relation with the costs of increasing recovery anyway.
0
20 000 000
40 000 000
60 000 000
80 000 000
100 000 000
120 000 000
140 000 000
160 000 000
180 000 000
200 000 000
€ - € 0,50 € 1,00 € 1,50 € 2,00 € 2,50 € 3,00 € 3,50
pote
ntia
lly s
ervi
ced
popu
latio
n
cost per m3
grid strategy, min grid strategy, max stand a lone b strategy, min b strategy, max
r strategy, min r strategy, max b+r strategy, min b+r strategy, max
0
20 000 000
40 000 000
60 000 000
80 000 000
100 000 000
120 000 000
140 000 000
160 000 000
180 000 000
200 000 000
0 1 2 3 4 5 6 7
cum
ulat
ive
serv
iced
pop
ulat
ion
(cap
ita)
required initial jet velocity (m/s)
Posidonia Cymodocea S=10 S=20 S=33 actual
0
20 000 000
40 000 000
60 000 000
80 000 000
100 000 000
120 000 000
140 000 000
160 000 000
180 000 000
200 000 000
0 1 2 3 4 5 6 7
cum
ulat
ive
serv
iced
pop
ulat
ion
(cap
ita)
required initial jet velocity (m/s)
Posidonia Cymodocea S=10 S=20 S=33 actual
0
20 000 000
40 000 000
60 000 000
80 000 000
100 000 000
120 000 000
140 000 000
160 000 000
180 000 000
200 000 000
0 0,02 0,04 0,06 0,08 0,1
cum
ulat
ive
serv
iced
pop
ulat
ion
(cap
ita)
disposal pumping energy (kWh m-3)
Posidonia Cymodocea S=10 S=20 S=33 actual
99
2021
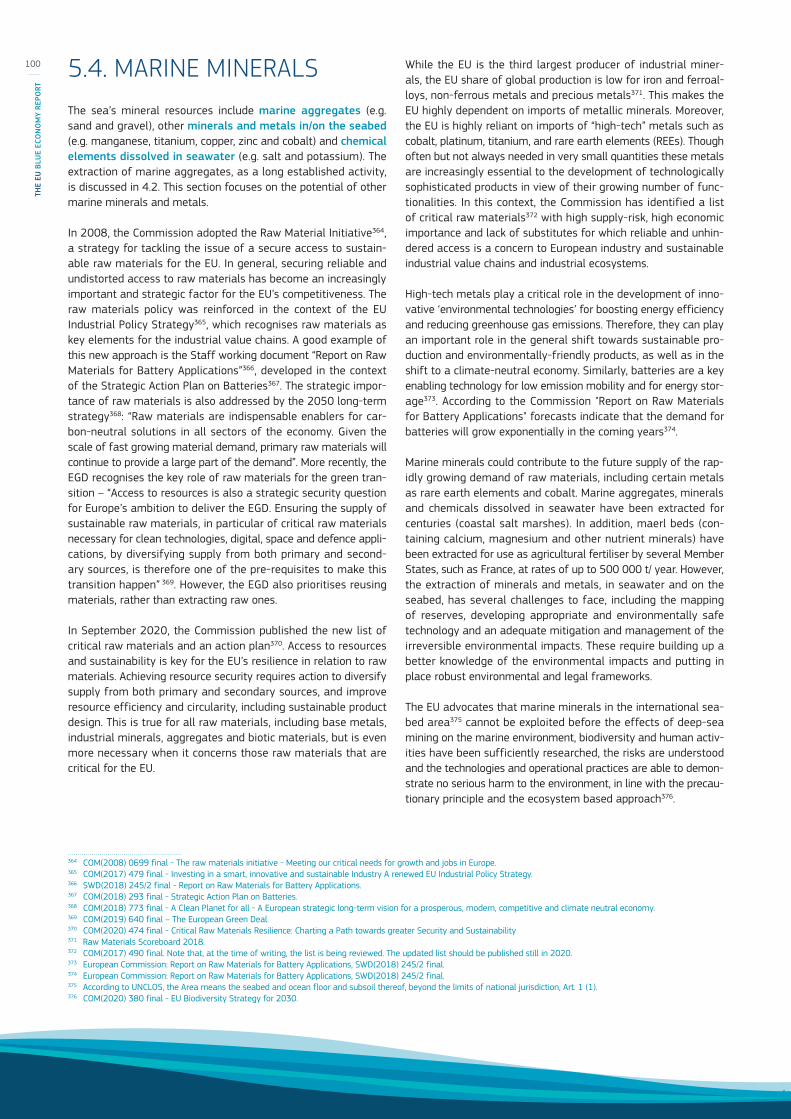
5.4. MARINE MINERALSThe sea’s mineral resources include marine aggregates (e.g. sand and gravel), other minerals and metals in/on the seabed (e.g. manganese, titanium, copper, zinc and cobalt) and chemical elements dissolved in seawater (e.g. salt and potassium). The extraction of marine aggregates, as a long established activity, is discussed in 4.2. This section focuses on the potential of other marine minerals and metals.
In 2008, the Commission adopted the Raw Material Initiative364, a strategy for tackling the issue of a secure access to sustain-able raw materials for the EU. In general, securing reliable and undistorted access to raw materials has become an increasingly important and strategic factor for the EU’s competitiveness. The raw materials policy was reinforced in the context of the EU Industrial Policy Strategy365, which recognises raw materials as key elements for the industrial value chains. A good example of this new approach is the Staff working document “Report on Raw Materials for Battery Applications”366, developed in the context of the Strategic Action Plan on Batteries367. The strategic impor-tance of raw materials is also addressed by the 2050 long-term strategy368: “Raw materials are indispensable enablers for car-bon-neutral solutions in all sectors of the economy. Given the scale of fast growing material demand, primary raw materials will continue to provide a large part of the demand”. More recently, the EGD recognises the key role of raw materials for the green tran-sition – “Access to resources is also a strategic security question for Europe’s ambition to deliver the EGD. Ensuring the supply of sustainable raw materials, in particular of critical raw materials necessary for clean technologies, digital, space and defence appli-cations, by diversifying supply from both primary and second-ary sources, is therefore one of the pre-requisites to make this transition happen” 369. However, the EGD also prioritises reusing materials, rather than extracting raw ones.
In September 2020, the Commission published the new list of critical raw materials and an action plan370. Access to resources and sustainability is key for the EU’s resilience in relation to raw materials. Achieving resource security requires action to diversify supply from both primary and secondary sources, and improve resource efficiency and circularity, including sustainable product design. This is true for all raw materials, including base metals, industrial minerals, aggregates and biotic materials, but is even more necessary when it concerns those raw materials that are critical for the EU.
364 COM(2008) 0699 final - The raw materials initiative - Meeting our critical needs for growth and jobs in Europe.365 COM(2017) 479 final - Investing in a smart, innovative and sustainable Industry A renewed EU Industrial Policy Strategy.366 SWD(2018) 245/2 final - Report on Raw Materials for Battery Applications.367 COM(2018) 293 final - Strategic Action Plan on Batteries.368 COM(2018) 773 final - A Clean Planet for all - A European strategic long-term vision for a prosperous, modern, competitive and climate neutral economy. 369 COM(2019) 640 final – The European Green Deal.370 COM(2020) 474 final - Critical Raw Materials Resilience: Charting a Path towards greater Security and Sustainability371 Raw Materials Scoreboard 2018.372 COM(2017) 490 final. Note that, at the time of writing, the list is being reviewed. The updated list should be published still in 2020.373 European Commission: Report on Raw Materials for Battery Applications, SWD(2018) 245/2 final. 374 European Commission: Report on Raw Materials for Battery Applications, SWD(2018) 245/2 final.375 According to UNCLOS, the Area means the seabed and ocean floor and subsoil thereof, beyond the limits of national jurisdiction, Art. 1 (1).376 COM(2020) 380 final - EU Biodiversity Strategy for 2030.
While the EU is the third largest producer of industrial miner-als, the EU share of global production is low for iron and ferroal-loys, non-ferrous metals and precious metals371. This makes the EU highly dependent on imports of metallic minerals. Moreover, the EU is highly reliant on imports of “high-tech” metals such as cobalt, platinum, titanium, and rare earth elements (REEs). Though often but not always needed in very small quantities these metals are increasingly essential to the development of technologically sophisticated products in view of their growing number of func-tionalities. In this context, the Commission has identified a list of critical raw materials372 with high supply-risk, high economic importance and lack of substitutes for which reliable and unhin-dered access is a concern to European industry and sustainable industrial value chains and industrial ecosystems.
High-tech metals play a critical role in the development of inno-vative ‘environmental technologies’ for boosting energy efficiency and reducing greenhouse gas emissions. Therefore, they can play an important role in the general shift towards sustainable pro-duction and environmentally-friendly products, as well as in the shift to a climate-neutral economy. Similarly, batteries are a key enabling technology for low emission mobility and for energy stor-age373. According to the Commission "Report on Raw Materials for Battery Applications" forecasts indicate that the demand for batteries will grow exponentially in the coming years374.
Marine minerals could contribute to the future supply of the rap-idly growing demand of raw materials, including certain metals as rare earth elements and cobalt. Marine aggregates, minerals and chemicals dissolved in seawater have been extracted for centuries (coastal salt marshes). In addition, maerl beds (con-taining calcium, magnesium and other nutrient minerals) have been extracted for use as agricultural fertiliser by several Member States, such as France, at rates of up to 500 000 t/ year. However, the extraction of minerals and metals, in seawater and on the seabed, has several challenges to face, including the mapping of reserves, developing appropriate and environmentally safe technology and an adequate mitigation and management of the irreversible environmental impacts. These require building up a better knowledge of the environmental impacts and putting in place robust environmental and legal frameworks.
The EU advocates that marine minerals in the international sea-bed area375 cannot be exploited before the effects of deep-sea mining on the marine environment, biodiversity and human activ-ities have been sufficiently researched, the risks are understood and the technologies and operational practices are able to demon-strate no serious harm to the environment, in line with the precau-tionary principle and the ecosystem based approach376.
100
THE
EU B
LUE
ECO
NO
MY
REPO
RT

The potential of minerals and metals on the seabed
There are five main classes of mineral deposits377 at different water depths and spatially associated with different geotectonic settings (Figure 5.26):
• Marine placers,378 typically found in shallow waters of the continental shelfs. Minerals found in marine placer deposits include zircon, monazite, xenotime (Y and P) ilmenite, rutile, magnetite, chromite, cassiterite and fine-grained gold and platinum.
• Phosphorites, form at depths between 95 and 1 950 m. These deposits are economically important for phosphate and have potential for rare earth elements (REEs), including yttrium, all considered critical raw materials.
• Seafloor Massive Sulphides, also known as polymetallic sulphides or hydrothermal mineralisation, form typically at depths between around 400 and 3 900 metres. These depos-its have a high content of copper, zinc, lead, silver and gold. In addition, have economic potential for a wide range of high-tech metals as cobalt, lithium, tin, barium, selenium, indium, germanium, bismuth, tellurium and gallium.
• Cobalt-rich ferromanganese crusts, form at depths between 800 and 7 000 m, although the thickest deposits occur at depths of about 800-2 500 m. These deposits are rich on manganese and have potential for, cobalt, tellurium, vana-dium, niobium, nickel, titanium, platinum group elements (PGEs) and REEs. The distribution of these deposits within EU waters are shown in Figure 5.27.
• Polymetallic nodules occur in the so-called abyssal plains at depths between 4 000 and 6 000 m. These nodules are mostly rich on manganese but have economic interest for other elements, such as copper, nickel, cobalt, molybdenum, titanium, lithium and REEs. The distribution of these deposits within EU waters are shown in Figure 5.27.
Conventional dredging has a theoretical depth limit of 150 m (i.e. between the surface and the seabed); however, dredging deeper than 80 m requires a high degree of innovative equipment and a
377 Seabed Mineral Deposits in European Seas: Metallogeny and Geological Potential for Strategic and Critical Raw Materials (MINDeSEA), GeoERA European Union's Horizon 2020 research and innovation programme under grant agreement No 731166.
378 Placer deposits have already been commercially exploited for decades in other parts of the world such as Namibia and New Zealand.379 See Rozemeijer et al. (2018). Seabed Mining in Building Industries at Sea: 'Blue Growth' and the New Maritime Economy, River Publishers.380 https://learningenglish.voanews.com/a/norway-moves-quickly-to-start-undersea-mining/5737646.html 381 The International Seabed Authority is an autonomous international organisation established under the 1982 United Nations Convention on the Law of the Sea and the
1994 Agreement relating to the Implementation of Part XI of the United Nations Convention on the Law of the Sea. The Authority is the organisation through which States Parties to the Convention shall, in accordance with the regime for the seabed and ocean floor and subsoil thereof beyond the limits of national jurisdiction (the Area) established in Part XI and the Agreement, organise and control all mineral-resources-related activities in the Area for the benefit of mankind as a whole. In so doing, the ISA has the mandate to ensure the effective protection of the marine environment from harmful effects that may arise from deep-seabed related activities.
382 https://www.isa.org.jm/exploration-contracts.383 International Seabed Authority https://www.isa.org.jm/exploration-contracts 384 Leray and Machida, Seabed mining could come at a high price for a unique fauna, Molecular Ecology. 2020;00:1–3; Chin, A and Hari, K (2020), Predicting the impacts of
mining of deep sea polymetallic nodules in the Pacific Ocean: A review of Scientific literature , Deep Sea Mining Campaign and MiningWatch Canada, 52 pages available at http://www.deepseaminingoutofourdepth.org/wp-content/uploads/Nodule-Mining-in-the-Pacific-Ocean-2.pdf (accessed in March 2021) ; Smith, et all, Deep-Sea Misconceptions Cause Underestimation of Seabed-Mining Impacts, Trends in Ecology & Evolution · October 2020, Vol. 35, No. 10, available athttps://www.researchgate.net/publication/343338250_Deep-Sea_Misconceptions_Cause_Underestimation_of_Seabed-Mining_Impacts (accessed in March 2021) ; Diva J. Amon et al, Insights into the abundance and diversity of abyssal megafauna in a polymetallic-nodule region in the eastern Clarion-Clipperton Zone, Scientific Reports (2016), available at https://www.nature.com/articles/srep30492 (accessed in March 2021); Ann Vanreusel et al. Threatened by mining, polymetallic nodules are required to preserve abyssal epifauna, Scientific Reports (2016), available at https://www.nature.com/articles/srep26808 (accessed in March 2021); Van Dover, C., Ardron, J., Escobar, E. et al. Biodiversity loss from deep-sea mining. Nature Geosci 10, 464–465 (2017), available at https://www.nature.com/articles/ngeo2983 (accessed in March 2021); Niner HJ, Ardron JA, Escobar EG, Gianni M, Jaeckel A, Jones DOB, Levin LA, Smith CR, Thiele T, Turner PJ, Van Dover CL, Watling L and Gjerde KM (2018) Deep-Sea Mining With No Net Loss of Biodiversity—An Impossible Aim. Front. Mar. Sci. 5:53, available at https://www.frontiersin.org/articles/10.3389/fmars.2018.00053/full (accessed in March 2020); An assessment of the risks and impacts of seabed mining on marine ecosystems, Flora and Fauna International, available at https://cms.fauna-flora.org/wp-content/uploads/2020/03/FFI_2020_The-risks-impacts-deep-seabed-mining_Report.pdf (accessed in March 2021). Simon-Lledó, E., Bett, B.J., Huvenne, V.A.I. et al. Biological effects 26 years after simulated deep-sea mining. Sci Rep 9, 8040 (2019), available at https://www.nature.com/articles/s41598-019-44492-w#citeas (accessed in March 2021).
385 European Parliament Resolution P8_TA(2018)0004 of 16 January 2018 on international ocean governance: an agenda for the future of our oceans in the context of the 2030 SDGs (2017/2055(INI)) https://www.europarl.europa.eu/doceo/document/TA-8-2018-0004_EN.pdf
386 Chin, A and Hari, K (2020), Predicting the impacts of mining of deep sea polymetallic nodules in the Pacific Ocean: A review of Scientific literature, Deep Sea Mining
significant amount of energy379. The technical, economic, finan-cial and environmental challenges to be solved multiply when the exploitation of minerals and metals has to be performed at a depth of up to 6 000 m. Therefore, marine mining activities at great depth remain on exploratory stages in both EU and interna-tional waters although Norway is planning to start mining in their continental shelf by 2023 and Japan as well, by 2026/2028380.
Currently, the International Seabed Authority (ISA)381 has 30 con-tracts (mostly awarded on a 15 year basis) into force for explo-ration382: 18 for polymetallic nodules, 7 for polymetallic sulphides and 5 for cobalt-rich ferromanganese crusts in the seabed of areas beyond national jurisdiction (the Area). Exploration licences have been allocated to eight explorative areas, spread across the Atlantic, Pacific and Indian Oceans. Among the EU Member States, Belgium, France, Germany, Bulgaria, Czechia, Poland and Slovakia have sponsored licences in the Atlantic Ocean (Mid-Atlantic Ridge), the Indian Ocean and Pacific Ocean (Clarion-Clipperton Fracture Zone)383.
For the time being, no commercial deep seabed-mining project exists in the Area nor in the areas under national jurisdiction of the EU Member States. In this context, scientists argue that bio-diversity loss from deep-sea mining is likely to be inevitable and irrevocable, and thus most likely permanent384. In parallel, the EU will continue to fund research on the impact of deep-sea mining activities and on environmentally-friendly technologies”. These scientific findings have raised the public awareness and stimu-lated a political debate within the EU, and beyond. The European Parliament adopted a Resolution on international oceans govern-ance in January 2018385, calling for a moratorium on commercial deep-sea mining exploitation licences until the risks to the envi-ronment are fully understood. At the international level in 2020 a coalition of 80 non-governmental organisations have advocated for an international moratorium on deep-sea mining following a report that argued that the impacts of polymetallic nodule min-ing in the Pacific Ocean would be extensive, causing essentially irreversible damage.386
101
2021

Figure 5.26 Marine mineral occurrences in EU waters
Notes: EEZ limits based on: Flanders Marine Institute (2019). Maritime Boundaries Geodatabase: Maritime Boundaries and Exclusive Economic Zones (200NM), version 11. ECS limits based on: http://continentalshelf.org/onesotpdatashop/6350.aspx. They do not necessarily correspond exactly with the officially recognised boundaries. Source: GeoERA-MINDeSEA.
Figure 5.27 Cobalt- and lithium-rich ferromanganese crusts and polymetallic nodules occurrences and deposits in pan-European seas
Notes: EEZ limits based on: Flanders Marine Institute (2019). Maritime Boundaries Geodatabase: Maritime Boundaries and Exclusive Economic Zones (200NM), version 11. ECS limits based on: http://continentalshelf.org/onesotpdatashop/6350.aspx. They do not necessarily correspond exactly with the officially recognised boundaries. Source: GeoERA-MINDeSEA.
102
THE
EU B
LUE
ECO
NO
MY
REPO
RT
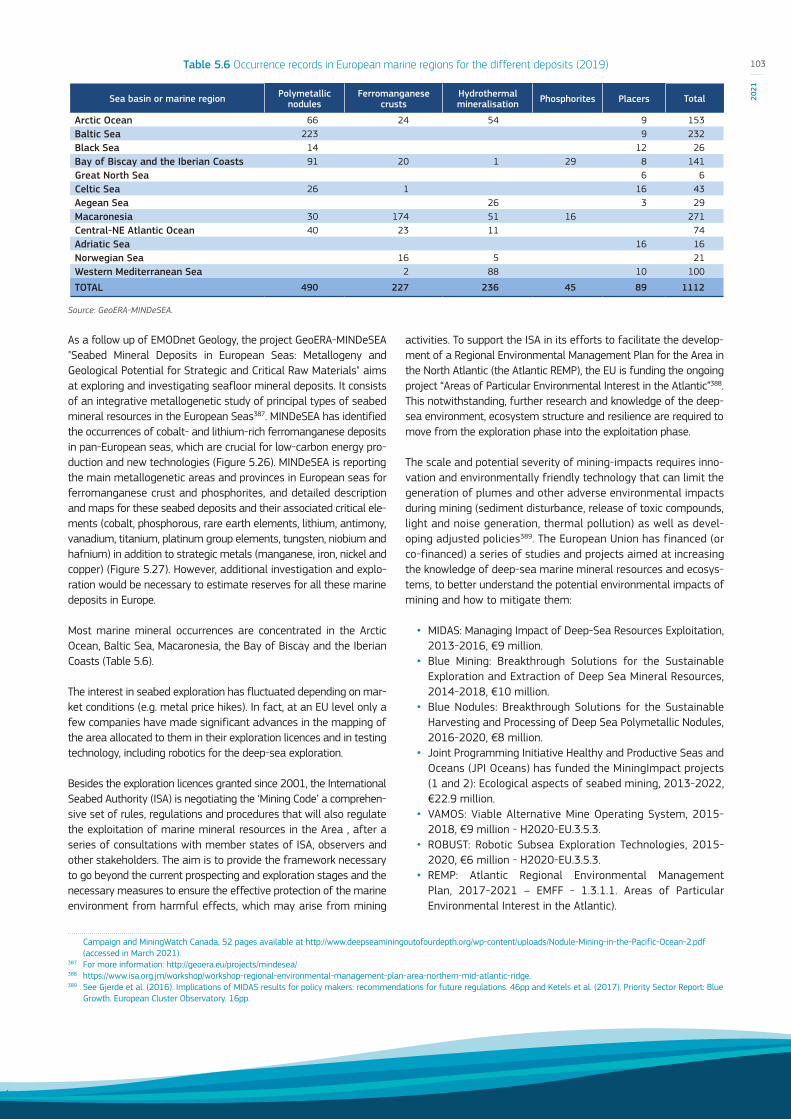
As a follow up of EMODnet Geology, the project GeoERA-MINDeSEA "Seabed Mineral Deposits in European Seas: Metallogeny and Geological Potential for Strategic and Critical Raw Materials" aims at exploring and investigating seafloor mineral deposits. It consists of an integrative metallogenetic study of principal types of seabed mineral resources in the European Seas387. MINDeSEA has identified the occurrences of cobalt- and lithium-rich ferromanganese deposits in pan-European seas, which are crucial for low-carbon energy pro-duction and new technologies (Figure 5.26). MINDeSEA is reporting the main metallogenetic areas and provinces in European seas for ferromanganese crust and phosphorites, and detailed description and maps for these seabed deposits and their associated critical ele-ments (cobalt, phosphorous, rare earth elements, lithium, antimony, vanadium, titanium, platinum group elements, tungsten, niobium and hafnium) in addition to strategic metals (manganese, iron, nickel and copper) (Figure 5.27). However, additional investigation and explo-ration would be necessary to estimate reserves for all these marine deposits in Europe.
Most marine mineral occurrences are concentrated in the Arctic Ocean, Baltic Sea, Macaronesia, the Bay of Biscay and the Iberian Coasts (Table 5.6).
The interest in seabed exploration has fluctuated depending on mar-ket conditions (e.g. metal price hikes). In fact, at an EU level only a few companies have made significant advances in the mapping of the area allocated to them in their exploration licences and in testing technology, including robotics for the deep-sea exploration.
Besides the exploration licences granted since 2001, the International Seabed Authority (ISA) is negotiating the ‘Mining Code’ a comprehen-sive set of rules, regulations and procedures that will also regulate the exploitation of marine mineral resources in the Area , after a series of consultations with member states of ISA, observers and other stakeholders. The aim is to provide the framework necessary to go beyond the current prospecting and exploration stages and the necessary measures to ensure the effective protection of the marine environment from harmful effects, which may arise from mining
Campaign and MiningWatch Canada, 52 pages available at http://www.deepseaminingoutofourdepth.org/wp-content/uploads/Nodule-Mining-in-the-Pacific-Ocean-2.pdf (accessed in March 2021).
387 For more information: http://geoera.eu/projects/mindesea/ 388 https://www.isa.org.jm/workshop/workshop-regional-environmental-management-plan-area-northern-mid-atlantic-ridge.389 See Gjerde et al. (2016). Implications of MIDAS results for policy makers: recommendations for future regulations. 46pp and Ketels et al. (2017). Priority Sector Report: Blue
Growth. European Cluster Observatory. 16pp.
activities. To support the ISA in its efforts to facilitate the develop-ment of a Regional Environmental Management Plan for the Area in the North Atlantic (the Atlantic REMP), the EU is funding the ongoing project “Areas of Particular Environmental Interest in the Atlantic”388. This notwithstanding, further research and knowledge of the deep-sea environment, ecosystem structure and resilience are required to move from the exploration phase into the exploitation phase.
The scale and potential severity of mining-impacts requires inno-vation and environmentally friendly technology that can limit the generation of plumes and other adverse environmental impacts during mining (sediment disturbance, release of toxic compounds, light and noise generation, thermal pollution) as well as devel-oping adjusted policies389. The European Union has financed (or co-financed) a series of studies and projects aimed at increasing the knowledge of deep-sea marine mineral resources and ecosys-tems, to better understand the potential environmental impacts of mining and how to mitigate them:
• MIDAS: Managing Impact of Deep-Sea Resources Exploitation, 2013-2016, €9 million.
• Blue Mining: Breakthrough Solutions for the Sustainable Exploration and Extraction of Deep Sea Mineral Resources, 2014-2018, €10 million.
• Blue Nodules: Breakthrough Solutions for the Sustainable Harvesting and Processing of Deep Sea Polymetallic Nodules, 2016-2020, €8 million.
• Joint Programming Initiative Healthy and Productive Seas and Oceans (JPI Oceans) has funded the MiningImpact projects (1 and 2): Ecological aspects of seabed mining, 2013-2022, €22.9 million.
• VAMOS: Viable Alternative Mine Operating System, 2015-2018, €9 million - H2020-EU.3.5.3.
• ROBUST: Robotic Subsea Exploration Technologies, 2015-2020, €6 million - H2020-EU.3.5.3.
• REMP: Atlantic Regional Environmental Management Plan, 2017-2021 – EMFF - 1.3.1.1. Areas of Particular Environmental Interest in the Atlantic).
Table 5.6 Occurrence records in European marine regions for the different deposits (2019)
Source: GeoERA-MINDeSEA.
Sea basin or marine region Polymetallic nodules
Ferromanganese crusts
Hydrothermal mineralisation Phosphorites Placers Total
Arctic Ocean 66 24 54 9 153Baltic Sea 223 9 232Black Sea 14 12 26Bay of Biscay and the Iberian Coasts 91 20 1 29 8 141Great North Sea 6 6Celtic Sea 26 1 16 43Aegean Sea 26 3 29Macaronesia 30 174 51 16 271Central-NE Atlantic Ocean 40 23 11 74Adriatic Sea 16 16Norwegian Sea 16 5 21Western Mediterranean Sea 2 88 10 100
TOTAL 490 227 236 45 89 1112
103
2021

Although the industry players active in the field have, in gen-eral, expressed their confidence in future developments, sea-bed mining at great depths remains uncertain. In particular, the potential environmental impacts and its sustainability are still unclear. Therefore, the extent to which the seabed will be tapped of its resources on a commercial scale and the costs-benefits of deep-seabed mining compared to its environmental impacts and other marine use deserve further research390.
Most recently, the EU has funded two projects to recover metals from the seawater, which may offer an alternative, less environ-mentally damaging route to extracting metals from the sea:
• SEA4VALUE: Development of radical innovations to recover minerals and metals from seawater desalination brines. This project will deliver a Multi-mineral Modular Brine Mining Process (MMBMP) for the recovery of valuable metals and minerals from brines produced in sea-water desalination plants. The project will test the feasibility of the next gen-eration technologies (including advanced concentration and crystallisation processes and highly selective separation pro-cesses) for recovery of Mg, B, Sc, In, V, Ga, Li, Rb, Mo and set the basis for their future assimilation in already existing sea-water desalination plants and those yet to come.
• SEArcularMINE: Circular Processing of Seawater Brines from Saltworks for Recovery of Valuable Raw Materials. This pro-ject will build on the ancient and still widely used process of saltworks, where seawater goes through natural evaporation and fractionated crystallisation in shallow basins. This pro-cess produces sea salt and a brine (bittern) free of calcium as a by-product, which is 20 to 40 times more concentrated than seawater. The SEArcularMINE project uses the bittern, targeting magnesium, lithium and other trace elements belonging to the alkali/alkaline earth metals (e.g. Rb, Cs, Sr) or transition/post-transition metals (e.g. Co, Ga, Ge) group.
390 European MSP Platform. Technical Study: MSP as a tool to support Blue Growth. Sector Fiche: Marine aggregates and Marine Mining. Final version: 16/02/2018 (and references therein). /www.msp-platform.eu.
391 All EU Member States except Denmark due to its opt-out. 392 These figures are for the EU-27.393 Domain trends, The Military Balance, 120:1, 7-8, DOI: 10.1080/04597222.2020.1707960 394 ASD 2020 Facts and Figures.395 In January 2020, Fincantieri and Naval Group created a 50/50 joint venture named Naviris JV.
5.5. MARITIME DEFENCE, SECURITY AND SURVEILLANCEAs in previous years, this chapter mainly covers the Maritime defence sector. The novelty in this edition however, is the inclu-sion of the Maritime security and surveillance sector. Although often closely interconnected, an attempt is made to distinguish between Defence and Maritime security and surveillance. These sectors are not new as such, and they are rapidly expanding with a growing number of technological innovations and applications for both military and civilian uses. However, publicly available data is somewhat scarce and hence its inclusion under the emerging sectors chapter.
5.5.1. MARITIME DEFENCE
This section covers the Maritime defence sector, navies in particu-lar. It seeks to provide an overview of the current state of play and the latest data available for the sector. It also provides a brief description of the newly established European Defence Fund (EDF).
The total defence expenditure of the members of the European Defence Agency391 (EDA) in 2019 amounted to €186 billion (1.4% of EU-27 GDP); a 5% increase compared to 2018, of which €41 billion were defence investments. Total defence expenditure has grown since 2015 in the aftermath of the economic and financial crisis; and by 2019, it reached over 2007 levels392. The European increase in spending is mainly directed at procurement, research, development and innovation where investments have grown by about 16% (2018-19) as share of total spending393.
The Naval sector
The European naval industry sector is responsible for the design and production of military vessels, aircraft carriers and nuclear submarines. In 2019, the turnover of European naval shipbuilding sector amounted to €26 billion, accounting for 23% of the total European defence revenues394.
The European naval industry is highly competitive across the whole range of naval ships and almost the totality of its core sys-tems and components. The main industrial players in this domain are large “tier-1” companies like Damen (NL), Fincantieri (IT) and Naval Group (FR) 395. In January 2020, the two latter created the 50/50 joint venture Naviris JV - Navantia (ES) and ThyssenKrupp (DE), but also include a wide network of highly specialised sub-contractors and suppliers of different sizes. It is interesting
104
THE
EU B
LUE
ECO
NO
MY
REPO
RT

to note that out of the total number of SMEs doing business in defence (estimated at between 2 000 and 2 500), 18.7% operates in the naval domain396.
In 2019, the naval sector employed 280 000 highly skilled workers (together with the land sector), which represent nearly 64% of the total 440 000 jobs attributable to the whole European Defence Industry397. As of February 2020, the EU naval sector accounted for 12% of the total Naval Industry Orderbook. With reference to specific platforms, the EU’s share amounts to 10% in the field of Naval Surface Vessels and 50% for Conventional Submarines398. According to The Military Domain publication "The increasing requirement to maintain long-range maritime presence has meant there is growing emphasis, notably in France, on forward presence and new crewing models to increase platform availability"399.
Notably, the effects of the COVID-19 pandemic have also hit the EU naval sector (although to a lesser extent in comparison to oth-ers, e.g. aeronautics), with multi-faceted negative repercussions both in the short as well as longer term. The impact of the crisis has hit business activities and has had negative impacts also in terms of security of supply, workforce and levels of future R&D investments. For instance, with reference to the broader maritime technology sector, it is estimated that in the first half of 2020, new orders for warships in Europe have decreased by 62% in ton-nage and 77% in value (compared to 2019)400. According to some forecasts401, the full impact of the pandemic in Europe’s maritime technology sector will mostly be felt in 2021/2022, when the lack of new orders will decrease workload. The impact of the pandemic in terms of military budget cuts may delay acquisition and mod-ernisation programs of EU Navies, with negative repercussions on the naval industry. This situation, as predicted, is expected to last until 2023/2024 at least402.
The European Defence Fund (EDF)
The European Defence Fund (EDF) is the European Union's key ini-tiative to foster the competitiveness, efficiency and innovation capacity of the European defence technological and industrial base throughout the Union. The implementation of the EDF under the multiannual financial framework of the Union (2021-2027) will financially support consortia of companies from different MSs undertaking cooperative defence research and development of defence products and technologies. The EDF also includes mech-anisms to stimulate the opening of supply chains.
The EDF aims to strengthen the EU defence sector contributing to the technological sovereignty of the Union. It is expected to reduce the Union’s reliance on foreign military technology and expand its geopolitical influence in the world. Further, It seeks to open the cross-border supply chain to new entrants. SME cross-border participation will be a key indication of success.
396 ASD 2020 Facts and Figures. 397 ASD 2020 Facts and Figures. Notably, data about the Naval sector are provided in an aggregated manner together with the land sector.398 AMI International/Sea Europe.399 (2020) Domain trends, The Military Balance, 120:1, 7-8, DOI: 10.1080/04597222.2020.1707960.400 Sea Naval.401 "Coronavirus, Climate Change and Smart Shipping: 3 maritime scenarios, 2020-2050”, Dr Martin Stopford, April 2020, A White paper published by Seatrade maritime, part
of Informa Markets.402 "Sea Europe “The Covid-19 impact on Europe’s maritime technology sector”.403 https://ec.europa.eu/info/sites/info/files/budget-may2018-eu-defence-fund_en_0.pdf 404 European Commission (2020) Commission welcomes the political agreement on the European Defence Fund [Press release] 10 December Available at: https://ec.europa.eu/
commission/presscorner/detail/en/IP_20_2319 (Accessed: 9 February 2021).
The Commission's initial proposal was to allocate €13 billion to the EDF403. In December 2020, the European Parliament and the EU Council reached an agreement on a defence R&D bud-get of €7.9 billion instead. Roughly, one-third going to collabo-rative research projects and two-thirds for MSs investment by co-financing the costs for defence capabilities development fol-lowing the research stage404. The EDF budget represents a sig-nificant increase from the €90 million biennium budget of the Preparatory Action on Defence Research (PADR) launched in 2017, and the €500 million budget of the European Defence Industrial Development Programme (EDIDP) for 2019 and 2020 (BOX 5.1).
The Fund will place the EU among the top 4 defence research and technology investors in Europe, and act as a catalyst for an innovative and competitive industrial and scientific base. The main features of the EDF are:
• Financing projects that help make the EU more secure and resilient, and correspond to priorities agreed by MSs in par-ticular, within the framework of the Common Secuirty and Defence Policy (CSDP);
• Only collaborative projects involving at least 3 participants from 3 Member States are eligible;
• The EU will only co-fund the development of common proto-types where MSs commit to buying the final product;
• Cross-border participation of SMEs and mid-caps is strongly incentivised by providing higher financing rates and favouring projects by consortia which include SMEs and mid-caps.
• Targeting breakthrough innovation, with up to 8% of the funds dedicated to disruptive technology and innovative equipment allowing the EU to boost its long-term techno-logical leadership.
105
2021
BOX 5.1 Maritime defence, security and surveillance under the European Defence Fund's precursor programmes1. The Preparatory action on defence research (PADR) with a budget of €90 million (2017-2019) proposals for coop-erative research projects.
The calls included a "Technological demonstrator for enhanced situational awareness in a naval environment cat-egory", under which the "OCEAN2020: Open Cooperation for European Maritime awareNess" was awarded €35.4 million of the overall budget405.
2. The European defence industrial development pro-gramme (EDIDP) with a total budget of €500 million 2019-2020 (€163.5 for 2020 alone). In 2020 the indicative budget for EDIDP calls allocated to the maritime defence, security and survellainace sectors amounted to €42.5 million, out of €163.5 million (i.e. 26%) and fall under two categories:
Underwater control contributing to resilience at sea (€22.5 million)406
• Solutions to detect, identify, counter and protect against mine threats (including at very high depths).
• Solutions to detect, identify, counter and protect against mobile manned, unmanned or autonomous underwater systems (including at very high depths).
• Enhanced defence diving solutions to detect, identify, coun-ter and protect against sub-surface threats.
Maritime surveillance capabilities (€20 million)407
• Integrated solution to enhance the maritime situational awareness.
• Multifunctional capabilities, including space based surveil-lance/tracking, to enhance maritime awareness focusing on maritime littoral and high-sea areas and protection of harbour and critical infrastructure.
• Coastal radars and passive sensors with associated rele-vant networks.
• Maritime surveillance generated by networks of sensors based on fixed/semi-fixed unmanned platforms.
5.5.2. MARITIME SECURITY AND SURVEILLANCEVarious Western maritime nations have become concerned about the tactical and capability implications of ‘hybrid’ or ‘grey-zone’ activities at sea, resulting in a renewed interest in maritime awareness, intelligence, surveillance assets408. The technological and innovation developments in surveillance systems and tools in
405 European Commission (2018) European Defence Fund delivers new pan-European research projects [Press release] 16 February. Available at: https://ec.europa.eu/commission/presscorner/detail/en/IP_18_763 (Accessed 11 march 2021).
406 Implementing decision (EC) (2019) 2205, on the financing of the European Defence Industrial Development Programme and the adoption of the work programme for the years 2019 and 2020 of19 March 2019.
407 Implementing decision (EC) (2019) 2205, on the financing of the European Defence Industrial Development Programme and the adoption of the work programme for the years 2019 and 2020 of19 March 2019.
408 (2020) Domain trends, The Military Balance, 120:1, 7-8, DOI: 10.1080/04597222.2020.1707960.409 Regulation (EC) No 1406/2002, establishing EMSA, as amended by Regulation (EU) No 2016/1625 of 14 September 2016410 European Union Naval Force Operation Atalanta: https://eunavfor.eu/mission/411 http://www.emsa.europa.eu/newsroom/71-european-institutions-maritime-safety-press-releases/723-eu-navfor-emsa-collaboration-results-in-significantly-increased-
ability-to-track-merchant-vessels-in-fight-against-piracy.html412 http://www.emsa.europa.eu/copernicus/cms-cases/item/3983-copernicus-infosheet-support-to-international-organisations-nemo-operations-in-the-gulf-of-guinea-west-
africa.html
order to protect EU waters and therefore EU citizens require exten-sive resources and investments. It further necessitates of strong cooperation and coordination between MSs, supported throughout by the European Commission and agencies in the framework of the European Union Maritime Security Strategy (EUMSS) and the development of Common Information Sharing Environment (CISE) as one of the achievement of the EU MSS.
The European Maritime Security Agency (EMSA) was set up in 2002409 with the objective to ensure a high, uniform and effective level of maritime safety, security, as well as the prevention and response to pollution caused by ships, and oil and gas installa-tions. The agency also contributes to the overall efficiency of mar-itime traffic and maritime transport, and facilitated the establish-ment of a European Maritime Transport Space without Barriers. The Budget for 2020 was €81.2 million.
Beyond EU waters: protecting EU interests
EU missions, patrolling and protecting trade routes with the EU representing a large bulk of maritime trade in terms of tonnage, all require significant investments in terms of funding, personnel and military and civilian assets. Pirate activity in the High-Risk Areas of the Indian Ocean and off the coast of Somalia threaten shipping trade, which the European Union Naval Force ATALANTA (EU NAVFOR-Somalia) was set up to combat410 (BOX 5.2).
Since April 2011411, EMSA has been supporting EU NAVFOR-Somalia with the provision of an Integrated Maritime Service (IMS), called EMSA-IMS-EUNAVFOR-Atalanta. The service is accessed through the SafeSeaNet Ecosystem Graphical User Interface (SEG) where a whole range of maritime information and analytical tools are available to approved users. Specific infor-mation provided by EUNAVFOR-Atalanta (for example, anti-piracy security measures on board vessels) were also integrated into the application. Through the Copernicus Maritime Surveillance (CMS) service managed by EMSA, satellite imagery has been used to detect vessels in areas of particular interest.
In West Africa and the Gulf of Guinea, the CMS, managed by EMSA, assists the United Nations Office on Drugs and Crimes (UNODC). The Global Maritime Crime Programme (GMCP), run by UNODC, carries out activities in the areas of counter-pi-racy, maritime capacity building, and combating maritime crime including the trafficking of illicit substances by sea. CMS has provided satellite imagery and value-added products for a number of the African NEMO exercises (Navy’s Exercise for Maritime Operations, coordinated by the French Navy). NEMO is designed to bolster coastal states’ maritime security capa-bilities in the Gulf of Guinea412.
106
THE
EU B
LUE
ECO
NO
MY
REPO
RT

BOX 5.2 EUNAVFOR-operation Atalanta: key figuresMandate: Under EU Council Joint Action 851, which is based on various UN resolutions, Operation ATALANTA413:• Protects vessels of the World Food Programme (WFP),
African Union Mission in Somalia (AMISOM) and other vul-nerable shipping.
• Deters, Prevents and Represses piracy and armed robbery at sea.
• Monitors fishing activities off the coast of Somalia.• Supports other EU missions and international organisations
working to strengthen maritime security and capacity in the region.
Location: the Area of Operations covers the Southern Red Sea, the Gulf of Aden and a large part of the Indian Ocean, including the Seychelles, Mauritius and Comoros. The Area of Operations also includes the Somali coastal territory, as well as its territorial and internal waters. This represents an area of about 4.7 million square nautical miles (approx. 8.7 million km2).
Contributors: Participation in EU NAVFOR goes beyond the EU MSs. Norway was the first non-EU country to contribute (2009), followed by Montenegro, Serbia, Ukraine and New Zealand.
Means of contributing:• Navy vessels (surface combat vessels and auxiliary ships,
including embarked helicopters)• Maritime Patrol and Reconnaissance Aircraft (MPRA)• Unmanned Aerial Systems (UAS)• Vessel Protection Detachment (VPD) teams• Provision of military and civilian staff to work at the OHQ
in Rota, Spain or onboard units
Composition: it typically comprises approximately 600 per-sonnel, 1–3 Surface Combat Vessels and 1-2 MPRA. However, it changes constantly due to the frequent rotation of units and monsoon seasons in the Indian Ocean.
Financing: The 2020 common budget was €4.7 million. However, military assets and personnel are provided by con-tributing states, with associated running and personnel costs being met on a national basis. The common budget covers extra costs that are incidental to the operation and is agreed and monitored annually by the Athena Committee of Member States.
413 Note: On 30 July 2018 the Council of the EU extended the Mandate of Operation ATALANTA until December 2020.414 http://www.emsa.europa.eu/newsroom/infographics/item/3941-integrated-maritime-services-users-types.html 415 http://www.emsa.europa.eu/copernicus/cms-cases/item/3992-copernicus-infosheet-customs-activities-overview.html 416 http://www.emsa.europa.eu/copernicus/cms-cases/item/3991-copernicus-infosheet-customs-activities-use-case-apprehending-the-ali-primera.html417 http://www.emsa.europa.eu/newsroom/latest-news/item/3339-integrated-maritime-services-operational-awareness-across-sectors-and-seas.html 418 http://www.emsa.europa.eu/recently-published/item/2880-copernicus-maritime-surveillance-service-overview.html
Technological developments and investments: helping coastguards
The Mediterranean is one of the world’s busiest sea areas, making it imperative that coastguard services have access to reliable, constantly updated data to help them react quickly to any issue, including accidents, pollution incidents and day to day monitoring.
Using a vast array of data and information (EMSA receives almost 30 million messages and satellite images a day), EMSA’s inte-grated maritime services (IMS) now serves more than 5 500 users414, including border control415, customs416, maritime security, defence and law enforcement417.
Figure 5.28 Surveillance: Traffic density maps displaying ship movement patterns
Source: EMSA SafeSeaNet Ecosystem Graphical User Interface (SEG) as seen in “EMSA 5-year Strategy 2020-2024”,
This means that Member State authorities can rely on terrestrial and satellite vessel position data, satellite optical imagery, drones and met-ocean data through one single service. This data allows for large areas of the sea to be monitored. EMSA’s IMS capabilities reduce costs for Member States administrations, allowing them access to a vast, constantly updated feed of data helping main-tain maritime security in MS waters.
From space, the CMS provides access to satellite surveillance information to all EU Member States' bodies with tasks at sea418. Data is available from the system just 30 minutes after the sat-ellite overpass. CMS value-added products can be used for vessel detection, feature detection, activity detection, oil spill detection and wind and wave information, hence facilitating search and res-cue missions or preventing accidents.
16 millionTotal messages received by EMSA in one day
ACTIVITIES COVERING:
day
96 265Distinct vessels detected in
one day from different sources
T - AIS
S - AIS
LRIT
VMS
S - AIS
T - AIS
LRIT
VMS
Baltic Sea area - August 2019
Mediterranean Sea area - August 2019
Black Sea area - August 2019
107
2021
Customs authorities aim to ensure that legitimate trade can flow freely, whilst preventing trafficking and smuggling, and import of illegal or dangerous goods. Customs authorities are interested in monitoring key links in the goods supply chain, such as the transport and entry of these goods into the EU. The EU customs services handle nearly 16% of total world trade, handling imports and exports worth over €3 400 billion every year, mostly trans-ported by sea. Customs authorities check almost 1 800 million tonnes of ship cargo per year (compared with 20 million tonnes of air cargo)419.
Satellite image products reinforce custom authorities’ capacity to maintain oversight of goods transported at sea, and to detect and intervene when criminal activity is suspected. Other dangers include the transport of dangerous cargo into the EU, such as firearms, explosives, drugs, counterfeit goods, unsafe products, and protected wildlife species. The relevant authorities are hence keen to use and invest in the most advanced technologies avail-able to monitor what happens at sea420. CMS provides assistance to customs through the detection of potentially suspicious vessels involved in trafficking or smuggling of goods, monitoring of ship-to-ship transfers, early warning and identification of all kinds of criminal trafficking.
419 http://www.emsa.europa.eu/copernicus/cms-cases/item/3992-copernicus-infosheet-customs-activities-overview.html 420 http://www.emsa.europa.eu/copernicus/cms-cases/item/3992-copernicus-infosheet-customs-activities-overview.html 421 Information leaflets and brochures - CISE leaflet - Cross-Border & Cross-Sector Information Sharing for Maritime Surveillance - EMSA - European Maritime Safety Agency
(europa.eu)
BOX 5.3 The Common Information Sharing Environment (CISE)421
Timely access to relevant maritime data provided by national authorities and agencies across EU waters is vital when con-ducting operations at strategic, operational and tactical level. CISE aims to make existing European surveillance systems interoperable. It is built on a voluntary and decentralised net-work of EU and EEA Member States and encourages the shar-ing of information among different sectors: maritime safety and security; fisheries; border control; defence; customs; law enforcement; and marine environmental protection. EMSA has been tasked with transforming CISE from an EU research pro-ject into an EU-wide operational network.
CISE will enable maritime surveillance information collected by one maritime authority, and considered necessary for the operational activities of others, to be shared and be subject to multiuse. It will help to avoid the duplication of data acqui-sition and will enhance classified/unclassified information exchange among public authorities from different sectors, on a voluntary basis. The CISE framework will also foster cooperation and create synergies among the stakeholders involved, including civil-military cooperation.
At present, ten Member States, and two agencies (EFCA and EMSA) are connected to the pre-operational CISE network, via dedicated nodes. The aim is to reach 30 nodes, connecting as many EU Member States, EEA countries and relevant agen-cies as possible to CISE over the next three years.
Funding CISEIn order for CISE to be successfully developed and imple-mented, the European Commission is committed to provid-ing the necessary funding. Since 2018, the Commission has provided an estimated (maximum) total of €11 530 000 towards CISE. As from April 2019, EMSA was entrusted to run the transitional phase of CISE up to 2023. The breakdown of funding, sources and actions is as follows:
• European Commission, grant agreement for Promotion of interoperability between industry and competent authori-ties in the European Maritime Single Window (EMSW) envi-ronment under the CISE Process: maximum of €3 million.
• European Commission, grant agreement for “Setting up and enabling the transition phase to CISE Operations”: maxi-mum of €3.5 million.
• European Commission, grant agreement for “CISE transi-tion”: maximum of €3.4 million.
• Administrative Agreement with the JRC to support EMSA and MSs on CISE implementation: €1.23 million (and an additional €950 000 under ISA2 programme with a possi-bility of additional budget for 2022-23).
• To support the CISE Security Study under ISA program: maximum of €400 000.
108
THE
EU B
LUE
ECO
NO
MY
REPO
RT

5.6. RESEARCH AND EDUCATIONThis chapter explores what research concerning Blue Economy development has been undertaken, which Blue Economy sectors have been covered most often and which technological develop-ments have been enabled through Research and Innovation (R&I) funding. Moreover, this chapter provides an overview of educa-tion programmes of relevance to Blue Economy sectors, as well as education gaps, touching upon the concept of blue careers. It also looks at the skills that are mostly looked for by employers, delineating the efforts being made to make the Blue Economy competitive and future-proof.
5.6.1. RESEARCH
R&I is a central driver not only for developing a sustainable Blue Economy but also for the EGD (see section 3.1) and recovery from the COVID-19 crisis. It is an enabler for the twin green and digi-tal transitions and is ideally placed to set the direction, address synergies and trade-offs as well as leverage the full range of EU instruments available. A forward-looking, mission-oriented and impact-focused research and innovation agenda is a critical lever to drive the transition towards a sustainable Blue Economy.
Science and evidence-based policies lead to effective actions. In the context of its commitment to the better regulation422, the European Commission sources sound scientific evidence from an extensive network of internal services and external partners - starting from the JRC, i.e. the in-house science and knowledge service of the European Commission with the mission to provide independent scientific evidence throughout the policy cycle. In addition, the EU actively promotes cross-disciplinary research and innovation to tackle societal challenges423.
Horizon Europe: The new Horizon Europe Framework Programme424, with its new policy instruments beyond the tradi-tional R&I topics, will actively foster green and digital transitions. The Programme has a budget of €95.5 billion (including €5.4 bil-lion from the Next Generation of the EU – Recovery Fund) over seven years (2021-2027)425, of which at least 35% to be devoted to climate-related actions, supporting the transition of maritime industries to climate neutrality. Horizon Europe foresees a number of mission areas, including the "Mission Area on Healthy Oceans, Seas, Coastal and Inland waters"426 which provides a holistic and coherent 2030 vision to, among other aspects, protecting and restoring the water cycle as a whole. Moreover, the future co-funded European Partnership for a climate-neutral, sustainable and productive Blue Economy will actively contribute to restoring the ocean’s health, resilience and productivity.
422 COM(2019) 178.423 European Commission (2015). Strengthening Evidence Based Policy Making through Scientific Advice.424 https://ec.europa.eu/info/horizon-europe_en425 Note: Cluster 6 of the Strategic Plan specifically targets the sustainable Blue Economy: “Research and innovation will support the transition to a climate neutral, sustainable
and productive blue economy, including thriving aquaculture, fisheries and emerging sectors such as marine biotechnology. Innovative nature-based solutions will unlock the potential of the sustainable bioeconomy and replace fossil-based, carbon-intensive and harmful materials with innovative, climate-neutral, bio-based, non-toxic materials and chemicals. Innovative solutions, a non-toxic and more circular use of resources and the mainstreaming of circular systems will contribute to achieving zero polluted land, soil, water and air, seas and oceans, including by taking a multi-stressors approach”.
426 https://ec.europa.eu/info/sites/info/files/research_and_innovation/funding/documents/ec_rtd_he-partnership-climate-neutral-sustainable-productive-blue-economy.pdf
Horizon 2020 (2013-2020): The largest European funding pro-gramme (and Horizon Europe predecessor), contributed largely to a more sustainable Blue Economy by investing in research. In areas such as marine litter and marine pollutions, among others, €79 billion went to Research and Innovation. This funding con-tributed to effectively monitor, make sense, protect, preserve and harness the oceans.
Figure 5.29 Number of projects funded under Horizon 2020 by sector
66
175
73
169
29
120
36
1433 Blue Growth
Blue bioeconomy & biotechnology
Aquaculture
Ocean observation
Marine biodiversity
Marine pollution (excluding marine litter)
Marine litter
Fisheries
Coastal tourism
Note: That some projects funded under the different portfolios and Blue Growth calls might overlapSource: DG RTD data, own elaboration.
The majority of Horizon 2020 funding dedicated to the Blue Economy was invested in Ocean Observation, followed by Blue Growth and Blue biotechnology. Additionally, funds were allocated to research dedicated to Blue biotechnology beyond algae.
Table 5.7 Thematic funding Horizon 2020 (€ millions)
Sector EU Funding (€ millions)
Ocean Observation 650
Blue Growth 448
Blue biotechnology 234
Marine living resources 204
Marine pollution 194
Marine biodiversity 114
Blue biotechnology (beyond algae) 110
Coastal tourism 53
Note: Figures correspond to EU exclusive fundingSource: DG RTD data, own elaboration
109
2021

Blue Growth Calls427
Dedicated Blue Growth calls for a total funding of €448 million were launched in support of the Commission’s Blue Growth long-term strategy428. The calls were designed to promote sustainable growth in the marine and maritime sectors through a responsible management of marine resources for a healthy, productive, safe, secure and resilient seas that are at the core of thriving eco-systems, climate regulation, global food security, human health, livelihoods and economies. Specifically, these calls aimed to boost the Blue Economy by:
• Improving integrated knowledge about reciprocal impact of climate change on marine ecosystems and biological resources to effectively manage response, mitigation and resilience capacities;
• Preserving and sustainably exploiting marine and coastal ecosystems and biological resources to deliver improved nutrition and health;
• De-risking major investments and boosting blue innovations on land and at sea to develop new bio-based marine value chains and open up to new markets;
• Developing smart and connected territories between land and sea; and
• Strengthening the international research and innovation cooperation around seas and oceans and to promote a glob-ally sustainable Blue Economy.
In other fields of contribution such as Marine living resources, EU funding was used, among other initiatives, to increase the com-petitiveness of European seafood and eliminating discarding prac-tices (through the landing obligation) in European fisheries as well as fostering sustainable aquaculture practices (primary produc-tion, processing and distribution). As regards Marine biodiversity, H2020 helped improve the design of restoration and rehabilitation measures and incentives leading to an effective integration of restoring the biodiversity and creating links to growth, job creation as well as better assessment of potential benefits of establish-ing restoration site networks, enabling long-term observation and potential exchanges for best practices.
H2020 enabled not only the exploration of algae (among others) as a contributor to food security and harvesting raw materials for added-value chains and products but also other marine organ-isms such as invertebrates (such as sponges) to micro-organisms and microbiomes with potentials for health, enzymes as well as environmental remediation. Research on Coastal tourism primar-ily addressed coastal ecosystem assessment and management, marine spatial planning and integrated coastal zone management. Marine pollution was tackled in various ways as well by address-ing a broad range of risk factors such as marine litter and plastics (see also Section 6.2), noise pollution, hydrocarbon / oil pollution, ship emissions, aerosols, mineral dust and wastewater among others.
427 Note: The Blue Growth strategy has now been replaced by the new Sustainable Blue Economy strategy. The term Blue Growth is no longer used and is only included here to signal that the paragraph is in relation to the old strategy.
428 https://ec.europa.eu/maritimeaffairs/sites/maritimeaffairs/files/swd-2017-128_en.pdf
429 https://ec.europa.eu/commission/presscorner/detail/en/ip_20_1196430 Maritime Alliance for fostering the European Blue Economy through a Marine Technology Skilling Strategy. MATES is a “Strategy baseline to bridge the skills gap between
training offers and industry demands of the Maritime Technologies value chain, September 2019 - MATES Project.”
5.6.2. SKILLS AND EDUCATION
A Sustainable Blue Economy is of high importance for the European Union, with great potential for growth and innovation, along with positive social and environmental impacts. However, there is lack of well-trained professionals and highly-skilled per-sonnel working in these industries. In addition, the COVID-19 crisis has increased the challenges further. Other concerns in career development in the Blue Economy include lack of:
• Communication and cooperation between education and industry;
• Attractiveness and awareness of career opportunities in the Blue Economy;
• Ocean literacy culture.
In 2020, the European Commission published its European Skills Agenda for sustainable competitiveness social fairness and resil-ience429. It sets ambitious, quantitative objectives for upskilling (improving existing skills) and reskilling (training in new skills) to be achieved within the next 5 years. Its 12 actions focus on skills for jobs by partnering up with Member States, companies and social partners working together for change, by empower-ing people to embark on lifelong learning, and by using the EU budget as a catalyst to unlock public and private investment in skills. This includes developing a set of core green skills, statisti-cal monitoring of the greening of the workplace, boosting digital skills through a Digital Education Action Plan and Information and Communication Technologies (ICT) jump-start training.
According to a MATES project report430, these are some of the trends regarding skills in the Blue Economy:
• A need to strengthen existing education provision in the marine fields and to develop specialised training adapted to the maritime industry (e.g. shipbuilding urgently needs edu-cation/ training in the digital domain, green technologies and soft skills).
• The shipbuilding sector must attract new talent while imple-menting generational replacement systems.
• Raising the level of Ocean Literacy would increase the visibil-ity of professional opportunities in the Blue Economy likely to appeal to younger generations and female applicants.
• Skill ecosystems, i.e. meeting points for relevant stakehold-ers will help them obtain reliable data at a time when skills needs are constantly evolving.
• Heightened efforts towards a special Digital Literacy and Data Literacy training in the maritime sector.
MATES is an Erasmus+ project with a budget of €4.9 million, cov-ering a consortium of 17 partners from 8 countries. Its objective is to develop a skills strategy that addresses the main drivers of change to the maritime industry, in particular shipbuilding and offshore renewable energy. The project runs from 2018-2021.
110
THE
EU B
LUE
ECO
NO
MY
REPO
RT

Note: (% of expert’s responses)Source: Own elaboration from MATES project data431
Gaps in Education and Training (E&T) in Shipbuilding and Offshore renewable energy
There are few programmes that directly target the shipbuilding sector. Metalworkers, engineers and engineering technicians are the occupational groups mostly addressed by the available pro-grammes. The majority of available programmes are Vocational Educational Training (VET) addressing the first phases of special-isation (mainly in metalworking), and do not provide technical workers with qualifications that will enable them to immediately enter the market. Only 17% of the programmes are offered in English or are bilingual and these mainly consist of higher educa-tion programmes432.
The main challenges to be considered in this sector are the age-ing workforce (average age exceeds 45), unattractiveness of the sectors among younger generations, and lack of sector knowledge and the responsibilities/working conditions of different the occu-pations. Skill shortages are often technical (e.g. welding, assem-bly), skills on Information and communication technologies, skills addressing Health & Safety issues, foreign languages, mechatron-ics and machine handling and operating (30-40% of respondents in the MATES’s survey considered these to be a big gap or a very big gap, Table 5.8).
As in shipbuilding, there is a shortage of education offer in the area of offshore renewable energy. Only 5% of available pro-grammes directly address offshore renewable energy. Only 35% of the primary occupational profiles are being targeted to a satis-factory extent by available programmes. Gaps were identified for occupations in the groups of electro-mechanics, assembling, div-ing, metalworking and health & safety. Some countries have gaps in common, mainly related to ocean energy technologies, cable installation, maintenance of energy systems, and energy distribu-tion. The majority of programmes identified were Master Degree
431 Strategy baseline to bridge the skills gap between training offers and industry demands of the Maritime Technologies value chain” September 2019 - MATES Project, www.projectmates.eu.
432 Strategy baseline to bridge the skills gap between training offers and industry demands of the Maritime Technologies value chain, September 2019 - MATES Project, www.projectmates.eu.
433 Ibid. 434 Sdoukopoulos, E. et al. (2020). Baseline Report on present skills needs in shipbuilding and offshore renewables value chains. Results of the MATES project (www.
projectmates.eu).
programmes (44%), highlighting that relevant qualifications are provided only as a specialisation. Very few VET programmes were found to provide technical skills. Approximately 50% of availa-ble programmes are being offered in English or are bilingual433.
Amongst the main challenges in this sector are the increased subcontracting of certain activities, temporary employment and unwillingness to relocate to more distant locations. In this view, temporary work relationships serving as the main form of employment, and the need for multi-disciplinary approaches (and teams) due to the complex nature some projects are additional challenges. The main skill shortages identified are related to both hard and soft skills:
• Hard skills: diversification and transferability of technical skills (adaptation to new needs), Multidisciplinary knowledge and better understanding of the offshore renewable energy value chain; project management skills and specialisation of managerial positions (e.g. project managers, offshore finan-cial officers); engineering skills (i.e. 3D design, foundations of wind turbines, etc.) and digital skills (computer science, big data analytics, automation, robotics, etc.)434.
• Soft skills: teamwork, collaboration and communication, analytical skills and problem-solving; leadership, critical and creative thinking, time management, prioritisation., and innovation.
With the fast-paced introduction of new technologies in the Blue economy sector, there is urgent need for a continuous evaluation of skills by companies operating in the sector and for upskilling or reskilling, their employees in order to ensure they are up to date with the new market demands and dynamics. This will contribute to closing the gap of adapting to disruptive technology implemen-tation and the new market.
Skills no gap very small gap small gap big gap very big gap
Soft skills (leadership, teamwork, etc.) 10 20 20 20 20
Information Communication Technology (ICT) 10 20 25 30 10
Interdisciplinary 5 10 35 25 10
Foreign languages 0 25 35 30 0
Machine handling and operating 0 25 40 10 10
Health and safety 5 15 30 30 15
Mechatronics 5 15 40 10 20
Engineering 0 40 25 10 15
Specific technical skills (welding, assembling, etc.) 5 10 20 40 20
Table 5.8 Heat map of skills gap in the shipbuilding sector (% of expert responses) 111
2021
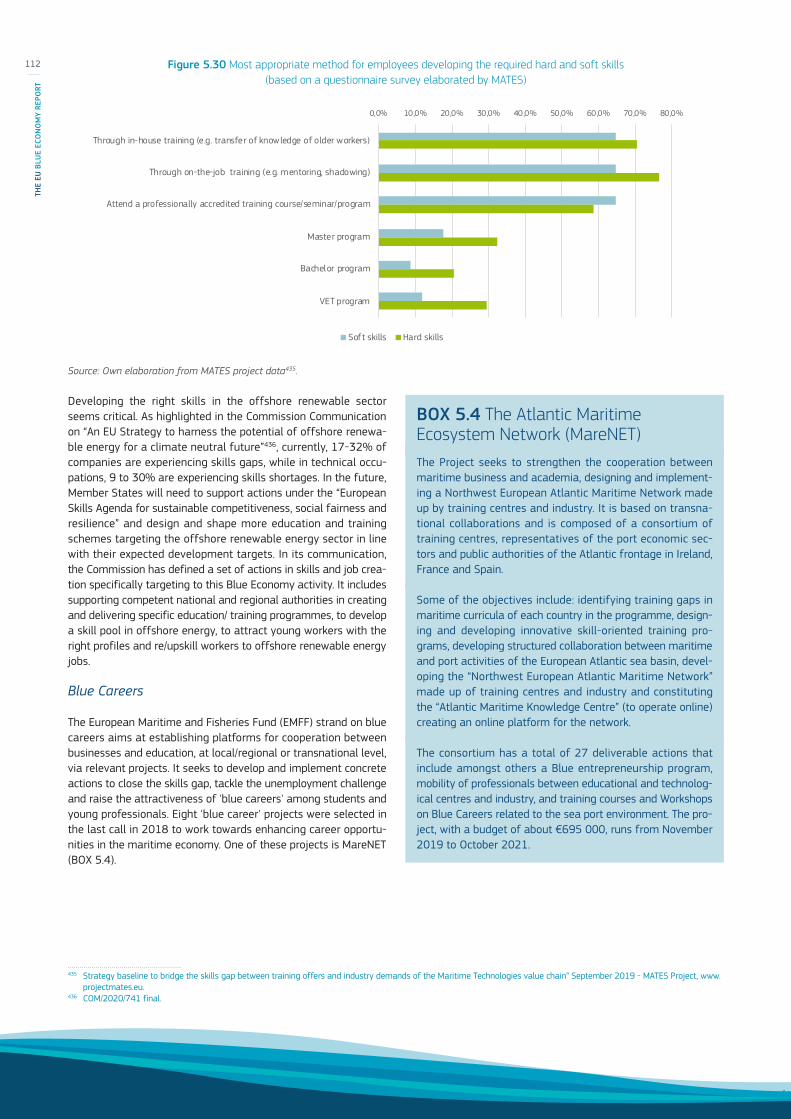
Source: Own elaboration from MATES project data435.
Developing the right skills in the offshore renewable sector seems critical. As highlighted in the Commission Communication on “An EU Strategy to harness the potential of offshore renewa-ble energy for a climate neutral future”436, currently, 17-32% of companies are experiencing skills gaps, while in technical occu-pations, 9 to 30% are experiencing skills shortages. In the future, Member States will need to support actions under the “European Skills Agenda for sustainable competitiveness, social fairness and resilience” and design and shape more education and training schemes targeting the offshore renewable energy sector in line with their expected development targets. In its communication, the Commission has defined a set of actions in skills and job crea-tion specifically targeting to this Blue Economy activity. It includes supporting competent national and regional authorities in creating and delivering specific education/ training programmes, to develop a skill pool in offshore energy, to attract young workers with the right profiles and re/upskill workers to offshore renewable energy jobs.
Blue Careers
The European Maritime and Fisheries Fund (EMFF) strand on blue careers aims at establishing platforms for cooperation between businesses and education, at local/regional or transnational level, via relevant projects. It seeks to develop and implement concrete actions to close the skills gap, tackle the unemployment challenge and raise the attractiveness of 'blue careers' among students and young professionals. Eight 'blue career' projects were selected in the last call in 2018 to work towards enhancing career opportu-nities in the maritime economy. One of these projects is MareNET (BOX 5.4).
435 Strategy baseline to bridge the skills gap between training offers and industry demands of the Maritime Technologies value chain” September 2019 - MATES Project, www.projectmates.eu.
436 COM/2020/741 final.
BOX 5.4 The Atlantic Maritime Ecosystem Network (MareNET)The Project seeks to strengthen the cooperation between maritime business and academia, designing and implement-ing a Northwest European Atlantic Maritime Network made up by training centres and industry. It is based on transna-tional collaborations and is composed of a consortium of training centres, representatives of the port economic sec-tors and public authorities of the Atlantic frontage in Ireland, France and Spain.
Some of the objectives include: identifying training gaps in maritime curricula of each country in the programme, design-ing and developing innovative skill-oriented training pro-grams, developing structured collaboration between maritime and port activities of the European Atlantic sea basin, devel-oping the “Northwest European Atlantic Maritime Network” made up of training centres and industry and constituting the “Atlantic Maritime Knowledge Centre” (to operate online) creating an online platform for the network.
The consortium has a total of 27 deliverable actions that include amongst others a Blue entrepreneurship program, mobility of professionals between educational and technolog-ical centres and industry, and training courses and Workshops on Blue Careers related to the sea port environment. The pro-ject, with a budget of about €695 000, runs from November 2019 to October 2021.
0,0% 10,0% 20,0% 30,0% 40,0% 50,0% 60,0% 70,0% 80,0%
Through in-house training (e.g. transfer of knowledge of older workers)
Through on-the-job training (e.g. mentoring, shadowing)
Attend a professionally accredited training course/seminar/program
Master program
Bachelor program
VET program
Soft skills Hard skills
Figure 5.30 Most appropriate method for employees developing the required hard and soft skills (based on a questionnaire survey elaborated by MATES)
112
THE
EU B
LUE
ECO
NO
MY
REPO
RT

Besides the traditional activities linked to the sea, the Blue Economy has been diversifying into emerging activities such as ocean energy, marine biotechnology, and surveillance, some of which require new skills sets to be fostered in Blue Economy com-munities, schools and organisations.
The European Commission has launched several initiatives that might, a mong others, help close the skills gap in blue careers needs. The European Ocean Coalition (EU4Ocean) is an inclusive initiative connecting diverse organisations, projects and people that contribute to ocean literacy and the sustainable management of the ocean. It consists of three components:
• EU4Ocean Platform, where organisations and individuals engaged in Ocean Literacy initiatives meet and exchange information;
• Youth4Ocean Forum, European Youth Forum for the Ocean;• Network of European Blue Schools; and• Other initiatives include the European Atlas of the Seas: an
interactive way to raise awareness and learn about Europe's seas and coasts.
437 International Cable Protection Committee. “About the ICPC” [www.iscpc.org/about-the-icpc/, accessed on 4 March 2021].438 Telegeography. “Submarine cable frequently asked questions” [https://www2.telegeography.com/submarine-cable-faqs-frequently-asked-questions].
5.7. INFRASTRUCTUREThis chapter builds on previous efforts to take into account sub-marine cables and robotics when assessing the socio-economic impacts of the EU Blue Economy. In the previous edition, it focused solely on Submarine cables, but this edition also looks at the Robotics. Future editions of this report and chapter may add other elements and sub-sectors if deemed relevant and fit under this category.
5.7.1. SUBMARINE CABLES
Submarine cable networks are a critical infrastructure ensuring that data, telecommunication, and power transmission connec-tions are possible within the EU and between the EU and third countries. The International Cable Protection Committee (ICPC) that brings together Government administrations and private par-ties that have a stake in the Submarine cable sector, is the forum where these stakeholders exchange technical, environmental and legal information, with an aim to enhance the security of subma-rine cables437.
According to estimations, there were more than 400 submarine cables around the world in 2020 (Figure 5.31), with 45 more expected to be added by 2025438.
Figure 5.31 European submarine cables
Source: Submarine Cable Map 2020 (https://submarine-cable-map-2020.telegeography.com/).
113
2021

The economic importance of submarine cable networks (responsi-ble for 99% of international data transfer and communication439) was further enhanced during the past year, with the COVID-19 pandemic and a heaver reliance on data and telecommunica-tion exchanges, provided by such subsea cables. According to Submarine Cable Map 2020440, data traffic demand is driving con-tent providers such as Amazon, Google, Facebook, and Microsoft to take part in submarine cable investment, driving projects and route prioritisation. These providers account for over 50% of demand in the Atlantic, intra-Asia, and trans-Pacific subma-rine route. With the massive demand for internet traffic further increasing, construction of new submarine cables might continue to be necessary to avoid service disruption, degradation and slower speeds.
Some of the challenges for submarine cables relate to damages from ship anchors and fishing nets. Other challenges that are ever more present relate to international security and data protec-tion in this critical infrastructure. Out of the 378 cables in service in 2019, 205 submarine cables were connected to EU Member States, including Outermost Regions (ORs) and Overseas Countries and Territories (OCTs). Of these cables, 105 cables were con-nected only among EU MSs, ORs and OCTs, and 100 cables were connected to third countries across most corners of the globe. Particularly in the EU, where a large number of submarine cables connected to EU MSs (including ORs and OCTs) were laid in the early 2000s or earlier (more than 100 cables with a length above 275 000 Km), replacement and construction of new cables in the coming years might hence, be necessary.
These cables amount to approximately 564 000 km length, of which approximately 518 000 km were connected to third coun-tries. Denmark is connected to the largest number of cables in thousand km (32 000), followed by Italy (27 000), Sweden (23 000), and France (21 000). In terms of length, France is connected to the largest network of submarine cables (206 000 km) followed by Italy (179 000), Portugal (137 000), and Spain (77 000).
5.7.2. MARITIME TECHNOLOGY: ROBOTICS, UNDERWATER DRONES, MARITIME AIRBORNE DRONES
Digitalisation and technological innovation have been emerging and transforming the maritime sector in nearly every aspect of its operations, from underwater to air equipment.
Recent years have seen an increased usage of maritime robots. Underwater robots can be used for different purposes in the mar-itime environment, such as surveys, scientific research, oil and gas exploration, border surveillance, infrastructure inspection, and farming. Underwater systems are one of the most valuable sectors within the robotics market. Underwater robots are increas-ingly being used for surveillance, including defence and military use (see also section 5.5.2 and BOX 5.1), but also for industrial and commercial purposes, as they enable ocean or underwater
439 International Cable Protection Committee (ICPC). 440 https://submarine-cable-map-2020.telegeography.com/ (accessed 4 March 2021).441 Initial figures provided in USD: $2 473 million and forecasted to reach $4 914 million.
exploration in challenging environmental situations. In 2019, the global underwater robotics market was valued at €2 209 million and forecasted to reach €4 390 million by 2025441.
Two of the main types of unmanned water vehicles are Remotely Operated Vehicles (ROV) and Autonomous Underwater Vehicles (AUV):
• A remotely operated vehicle (ROV) is an underwater vehicle, which is usually tied to a ship using a series of cables and is used along with a tether management system (TMS). These cables transmit commands and control signals between the operator and the ROV enabling remote navigation of the vehi-cle. The growth of the ROV segment is attributed to the rising offshore deep-sea oil and drilling industry due to its need to perform undersea operations, such as equipment assembling, drilling, underwater repair, and maintenance.
• An autonomous underwater vehicle (AUV) is an underwa-ter vehicle that does not require input from an operator. It is capable of carrying out simple activities with little or no human supervision. AUVs are often used as survey platforms to map the seafloor or characterise physical, chemical or bio-logical properties of the water.
Other types of robotics used in the maritime environment are for example the Remotely Piloted Aircraft System (RPAS), very often used in surveillance operations. These are small and light craft with a wide range and the capacity to stay in the air for many hours, while being controlled effectively from the ground, and sending back detailed data and images.
Technological advancement in the field of sensors and in state-of-the-art robotic technology will contribute to the growth of the AUV market. Yet, despite their importance, the mass uptake of marine robotics has been limited due to high costs associated to R&D, complexity of underwater operations, such as communica-tion and navigation, as well as technological constraints. Having the right skills to design, create and operate these robots is also an important challenge that needs to be addressed in the future (see section 5.6). Legal challenges related to robots, autonomous and artificial intelligence (AI)-based systems are other important issues in this domain.
Several projects across the EU are already using this technology, some of which have been aided by EU funding. Below are two examples of the use of maritime robotics in the EU Blue economy.
114
THE
EU B
LUE
ECO
NO
MY
REPO
RT

BOX 5.5 ARCHEOSUB
The ARCHEOSUB (Autonomous underwater Robotic and sens-ing systems for Cultural Heritage discovery Conservation and in situ valorisation) project442 combines underwater robotics and underwater communication, at the service of studying and conserving underwater cultural heritage. It used in-situ underwater sensor network deployed at a site for real-time monitoring and surveillance. The network comprised low-cost Autonomous Underwater Vehicles (AUVs) designed by the consortium to be sent to sites of interest, relying on the net-work nodes for accurate localization. The idea of ARCHEOSUB stemmed from various EU research projects funded under the 7th framework research programme. In 2016, the EMFF call enabled the "W-SENSE" start-up (funding beneficiary) and researchers to bring their ideas closer to the market and turn them into marketable products. The Archeosub project funding ran from February 2017 to January 2019 and was provided with an EU contribution of €496 652.
Thanks to the EMFF, the start-up responsible for the project has increased the number of employees from 0 to 23 within two years.
With a new follow-up project SEASTAR (running from October 2019 to September 2021), the technology is now applied to salmon aquaculture with test sites in Norway. SEASTAR will deliver an innovative underwater system with wearable sensors that will allow fish farmers to monitor the health of fish remotely, in real time, and to gather relevant data for accurate risk assessment and forecasting.
442 http://www.archeosub.eu/index.php/en/ 443 https://sites.google.com/view/blueroses-project/home or https://emff.easme-web.eu/?b=954983722
BOX 5.6 BLUE ROSES
Blue ROSES443 is a project whose objective is to develop innovative tools and services for marinas and leisure boat designers by combining state-of-the-art technology in marine robotics, Internet-of-Things, mobile apps and web services, with an eye to environmental challenges.
Customers will have access to the subsea environment through visiting underwater sites by piloting a Remotely Operated Vehicle (ROV) from a leisure boat, ground control room or web app. The project will foster the design of innova-tive leisure boats that integrate robotic vehicles with ever-im-proving ICT services. Environmental challenges will also be addressed since ROVs will be used to monitor water, seabed and yacht hulls for safer refitting and dismantling.
The project will be based on a partnership of research between universities, technological, business SMEs and a cluster of nautical companies.
115
2021

116
THE
EU B
LUE
ECO
NO
MY
REPO
RT

C h A p T E R 6ECOSYSTEM SERVICES,
ECONOMY AND THE ENVIRONMENT

The economy, and its relationship with the environment, has deeply evolved along its history, moving from an economy-cen-tred system (Silo approach), through equal-intersected systems (Venn diagram approach), to the embedded system (Sustainability approach)444.
This conception change consists in considering that sustainable development should not be delineated with three independent pillars (social, economy, and environment) of similar importance; but it should instead be portrayed as a series of embedded sys-tems445. This emphasises the importance of sustainability and the inherent relations between the economy, society and the environ-ment. Thus, important transformations in the ecological and social systems will also influence the economic system. Damaging the environment very often means eroding social support systems and harming the economy. In other words, the environment is the service provider that enables human society and the economy to exist and develop.
The ecosystem service approach aims to support ecosystem and biodiversity conservation policies446. Its rationale consists in rec-ognising that there are limits regarding damage to the use of nature and biodiversity. Limits that should never be broken beyond which there is a tipping point characterised by irreversible losses of ecosystem components, ecological functions and ecosystem services, many of which are irreplaceable or if replaceable they have proven much more costly.
Attempts to supply the lost services by other means tend to be expensive failures in the long run, meaning that no substitutes exist for extinct species and ecosystem services447. Hence, human-made capital and natural capital are not interchangeable but com-plementary448, making the conservation of “critical natural capi-tal” imperative for sustainability449. The flows of these ecosystem services are dependent on the ecological functions that underpin them and thus intrinsically linked to the resilience (and/or good status) of ecosystems. Section 6.1 show on the one hand the "dependencies" of Blue Economy sectors on a well preserved and sustainably managed blue natural capital, and on the other hand introduces the notion of pressures/impact of economic activities on the marine environment, i.e., "liabilities.
In this context, the EU is aiming to obtain a sustainable economy through the European Green Deal (see 3.1), turning climate and environment as main drivers of this new and inclusive growth strategy. Improve the efficient use of resources (e.g. Farm to Fork Strategy, see 3.1.2) by moving to a clean and circular economy,
444 Darwish H. 2018. Expanding Industrial Thinking by formalizing the Industrial Engineering identity for the knowledge era. North-West University.445 Göpel M. 2016. The Anthropocene: Politik—Economics—Society—Science, Vol.2. Springer Nature.446 Armsworth, P. R., Chan, K. M., Daily, G. C., Ehrlich, P. R., Kremen, C., Ricketts, T. H., & Sanjayan, M. A. 2007. Ecosystem-service science and the way forward for conservation.de
Sartre, X. A., Oszwald, J., Castro, M., & Dufour, S. 2014. Political ecology des services écosystémiques. France. 21, PIE Peter lang, 2014, EcoPolis, 978-2-87574-197-4.447 Ehrlich, P. R., & Mooney, H. A. 1983. Extinction, substitution, and ecosystem services. BioScience, 33(4), 248-254.448 Daly, H. E., & Griesinger, P. R. 1994. Investing in Natural Capital. Investing in natural capital: The ecological economics approach to sustainability, 22.449 Ekins, P., Simon, S., Deutsch, L., Folke, C., & De Groot, R. 2003. A framework for the practical application of the concepts of critical natural capital and strong sustainability.
Ecological economics, 44(2-3), 165-185. Pendleton, L. H., Thébaud, O., Mongruel, R. C., & Levrel, H. 2016. Has the value of global marine and coastal ecosystem services changed?. Marine Policy, 64, 156-158.
450 OECD. 2020. OECD work in support of a sustainable ocean.451 Stuchtey MR., Vincent A., Merkl A., Bucher M., Haughan PM, Lubchneco J, Pangestu ME. 2020. Ocean Solutions That Benefit People, Nature and the Economy. High Level
Panel for a Sustainable Ocean Economy.452 Section 6.6 highlights the importance of oceans as recreation and well-being providers (cultural services), and the impact of COVID-19 in human well-being related to the
blue nature areas.453 Also referred to as “global overshoot” (i.e. excess of humanity’s demand over the biosphere regenerative capacity – as defined by the Global Footprint Network).454 WWF Living Planet Report.455 Maes, J. et al. 2020. Mapping and Assessment of Ecosystems and their Services: An EU ecosystem assessment, EUR 30161 EN, Publications Office of the European Union,
Luxembourg, doi:10.2760/757183 (online),10.2760/519233 (supplement).
protect and restore the fragile marine resources (EU Biodiversity Strategy, 2030, see 3.1.1) are some of the ambitious goals included in the EGD. Section 6.2 on marine pollution shows the severity of the effects caused by an unsustainable and resource inefficient economy, which in turn damage the overall Blue Economy - and as such, it urges the adoption of a circular econ-omy approach. Section 6.3 on the CO2 emissions of Blue Economy sectors, such as maritime transport and wild-capture fisheries, shows the contribution of these sectors to global warming and the quest to reduce their emissions. While section 6.4 on the environmental impact of fisheries from an Life Cycle Assessment perspective digs deeper into the seafood production sector as an example of the impacts that are generated across the value chain - from resource extraction to disposal - thereby illustrating the importance to use a lifecycle approach.
Moreover, the OECD450 and the High Level Panel for a Sustainable Ocean Economy451 provide arguments and evidence in support of the transition to sustainable ocean management. According to these reports, the dichotomy between economic development and environmental protection can be overcome by a new approach that combines increased sustainable production with a more effective environmental protection.
The EU Taxonomy Regulation (entered into force on 12 July 2020) (see section 2.3) goes in this direction. It provides uniform cri-teria for companies and investors to determine which economic activities can be considered environmentally sustainable. In order to qualify as environmentally sustainable, an activity must meet four conditions: 1) it substantially contributes to at least one of six environmental objectives (climate change mitigation, climate change adaptation, sustainable use and protection of water and marine resources, transition to a circular economy, pollution prevention and control, and the protection and restoration of biodiversity and ecosystems); 2) it does not significantly harm any of the other environmental objectives; 3) it is carried out in compliance with minimum social safeguards, and 4) it complies with technical screening criteria established by the Commission through delegated acts. The Taxonomy aims to facilitate sus-tainable investment and thus contribute to the EU action plan on financing sustainable growth.
To increase the ecosystem contribution to human well-being452 and economy is necessary to reduce the environmental footprint and ecosystems deficit453. Since the early 1970s, the use of nat-ural resources exceeds that which ecosystems can regenerate454. A recent JRC report455 on the EU-wide ecosystems assessment
118
THE
EU B
LUE
ECO
NO
MY
REPO
RT
highlights the need to enhance regulating and cultural ecosystem services to cope with the increasing societal demand. This is also suggested by the large gap between the demand for ecosystem services and the amount of services effectively delivered by eco-systems. To narrow this gap, restoration actions using nature-based solutions should be prioritised in the proximity of areas where the demand for regulating and cultural services is not fully satisfied by ecosystems.
Nature-based solutions are defined as “solutions that are inspired and supported by nature, which are cost-effective, simultane-ously provide environmental, social and economic benefits and help build resilience. Such solutions bring more and more diverse, nature and natural features and processes into cities, landscapes and seascapes, through locally adapted, resource-efficient and systemic interventions”456. Thus, nature-based solutions are intended to support the achievement of society’s development goals and safeguard human well-being in ways that reflect cul-tural and societal values and enhance the resilience of ecosys-tems, their capacity for renewal and the provision of services457. Several EU-funded projects have developed important tools and expertise to address climate change, biodiversity loss and the degradation of ecosystem services through nature-based solu-tions for building sustainable, resilient and prosperous societies458.
Regarding the marine ecosystems, the nature-based solutions can support and enhance the natural capacity of marine and transi-tional ecosystems to mitigate and adapt to climate change while supporting biodiversity and a range of other ecosystem functions and services459. Section 6.7 on the carbon sequestration in EU waters highlights the role of oceans as a carbon sinks, show-ing the positive contribution of oceans to the climate mitigation/adaptation and to the achievement of climate neutrality targets.
Investing in nature-based solutions has proven to be a win-win solution for the economy and the environment. According to the High Level Panel for a Sustainable Ocean Economy460, “investing $2.8 trillion today in just four ocean-based solutions—offshore wind production, sustainable ocean-based food production, decar-bonisation of international shipping, and conservation and resto-ration of mangroves—would yield a net benefit of $15.5 trillion by 2050, a benefit-cost ratio of more than 5:1”.
Hence, this chapter addresses some of the environmental issues and human impacts of the Blue Economy on the environment. The first section provides an overview of human activities as they interact with the blue natural capital, highlighting the various pressures, liabilities and dependencies. The section that follows deals with the marine pollution, with a special focus on plastic pol-lution and the EU's response to it. It also covers the links between marine pollution and the COVID-19 crisis.
The third section presents the decarbonisation trends for the Blue Economy in the EU, specifically looking at the EU Fishing fleets,
456 https://ec.europa.eu/info/research-and-innovation/research-area/environment/nature-based-solutions_en457 IUCN Commission on Ecosystem Management 92020: https://www.iucn.org/commissions/commission-ecosystem-management/our-work/nature-based-solutions.458 https://cordis.europa.eu/article/id/421853-nature-based-solutions.Damage from coastal flooding in the EU currently amounts to €1 billion annually, but this damage is
expected to increase as global warming and climate change increase, to up to €814 million per year by 2100 if no mitigation or adaptation measures are taken. Last year’s edition of this report, analysed the costs and benefits of rising dykes. Section 6.5 of this year’s report, highlights the importance of coastal ecosystems on providing different services – including flood prevention – and how could they be impacted by climate change.
459 https://cordis.europa.eu/article/id/421774-getting-down-to-the-business-of-marine-ecosystem-restoration-in-european-seas-and-beyond https://www.futuremares.eu.460 Stuchtey MR., Vincent A., Merkl A., Bucher M., Haughan PM, Lubchneco J, Pangestu ME. 2020. Ocean Solutions That Benefit People, Nature and the Economy. High Level
Panel for a Sustainable Ocean Economy.
the Aquaculture sectors and the Maritime transport sector. This is followed by a section tackling the environmental impacts of fisheries products from a life cycle perspective. The next sections quantifies the economic losses of coastal ecosystems services due to sea level rises (resulting mostly from climate change). It provides an overall EU picture, as well as a breakdown by MS and European sea basin. The sixth section looks at the impacts of the COVID-19 pandemic in blue nature areas. The final section is devoted to carbon sequestration in the European seas.
119
2021

6.1. HUMAN INTERACTIONS WITH BLUE NATURAL CAPITALMaritime activities are dependent upon the “blue” natural cap-ital (either abiotic, biotic or both) held in Europe’s seas. The importance of using this capital sustainably is vital so that marine ecosystems and their services, and hence, the human activities that depend on them, can be maintained over time. A greater range of pressures are exerted on marine ecosys-tems indirectly by human activities using abiotic natural capital (e.g. non-living resources) than those activities using marine ecosystem services (e.g. living resources) directly461. This is a key point of concern since living resources depend on good environmental and ecosystem conditions, while activities using non-living resources, as well as land-based activities (also see section 3.2), cause pressures on marine ecosystems but are mostly not dependent on their state (Table 6.1).
461 European Environmental Agency. 2015. Marine Messages Our seas, our future — moving towards a new understanding. Available at: https://www.eea.europa.eu/publications/marine-messages. European Environmental Agency. 2019. Marine Messages II. Navigating the course towards clean, healthy and productive seas through implementation of an ecosystem-based approach. Report No 17/2019 (https://www.eea.europa.eu/publications/marine-messages-2/file).
462 EU 2020/852.463 ETC/ICM Technical Report 4/2019 Multiple pressures and their combined effects in Europe’s seas, see https://www.eionet.europa.eu/etcs/etc-icm/products/
etc-icm-report-4-2019-multiple-pressures-and-their-combined-effects-in-europes-seas
According to the latest MSFD reporting, each of the main Blue Economy activities may exert multiple pressures on the marine environment and its ecosystems (Figure 6.1). In addition, most land-based activities (notably agriculture and urban/industrial settlements), cause a range of widespread pressures across freshwater resources, oceans and seas. Pressures from human activities on marine habitats and species are found in 93% of Europe’s marine area. This being said, it is important to distin-guish well-managed activities from non-adequately managed or unsustainable activities. In this connection, detailed guidelines for the classification of activities that contribute to the environmental objective of “sustainable use and protection of water and marine resources” will be described in the Delegated Act to be finalised by the Commission by the end of 2021 under the EU Taxonomy regulation462 (also see section 2.2). The highest potential of com-bined effects from multiple pressures are found along coastal areas, in particular, in the North Sea, Southern Baltic Sea, Adriatic and Western Mediterranean regions. The most extensive combined effects in shelf areas occur in the North Sea, parts of the Baltic Sea and the Adriatic Sea463.
Table 6.1 Dependence and pressure of human activities on natural capital
Source: Own elaboration from European Environmental Agency (2019).
Blue Economy sector
Main dependence on: Main pressure on:
Marine abiotic natural capital
Marine biotic natural capital
Marine abiotic natural capital
Marine biotic natural capital
Marine living resources X X X
Marine non-living resources X X X
Marine renewable energy X X X
Port activities X X X
Shipbuilding and repair X
Maritime transport X X X
Coastal tourism X X X
120
THE
EU B
LUE
ECO
NO
MY
REPO
RT

6.2. MARINE POLLUTIONEvery year, millions and millions tonnes of litter end up in the ocean worldwide. In addition to demonstrating that an economy is unsustainable and resource inefficient, marine litter disrupts both terrestrial and marine ecosystems, affecting their regener-ative capacity, degrading the blue natural capital and its ability to supply valuable ecosystem services. In turn, this damages the Blue economy and has wide ranging socio-economic and health consequences.
Sources of marine pollution are both land-based activities (e.g. industrial emissions, agricultural runoffs, land-fills, untreated municipal sewerage, chemical/illegal discharges in rivers and floodwaters, littering of beaches and coastal areas) as well as sea-based activities (e.g. offshore mining and extractive activ-ities, aquaculture, illegal oil spills from tank vessels or ships, accidental dumping from sea transport or tourism, abandoned fishing gear, etc.)464.
Marine pollution threatens the health of the marine environment and the use of the seas for commercial and recreational activi-ties465. Indeed, pollution is also one of the main drivers for the loss of marine biodiversity. Marine pollution comprises different types of pollutant input to the seas, such as chemical and toxic substances, plastics and nutrients, but also underwater noise and other inputs from energy.
Pollution can occur as an intentional disposal of chemicals and waste, e.g. through waste water outlets, waste mismanagement, littering, or dumping. The introduction can be direct, from ships (e.g. oil and other chemical spills and sulphur pollution) or other activities at sea, as well as from coastal or inland sources, trans-ported by rivers to the sea. The discarding of litter into the seas has been recognised as a threat to the environment and to the undertaking of human activities466. In addition, long-range air-borne introduction of contaminants, e.g. pesticides and microplas-tics, through deposition and atmospheric washout contribute to the pollution of the marine environment.
464 Tornero V, Hanke G. 2016. Identification of marine chemical contaminants released from sea-based sources: A review focusing on regulatory aspects. EUR 28039. Luxembourg (Luxembourg): Publications Office of the European Union.Sobral, P. and Cronin, R. 2016. Identifying Sources of Marine Litter. MSFD GES TG Marine Litter Thematic Report; JRC Technical Report; EUR 28309; doi:10.2788/018068
465 Beaumont, N.J., Aanesen, M., Austen, M.C., Börger, T., Clark, J.R., Cole M., Hooper, T., Lindeque, P.K., Pascoe, C., Wylesd, K.J. 2019. Global ecological, social and economic impacts of marine plastic. Marine Pollution Bulletin 142:189-195.
466 EU. 2018. Staff working document: SWD (2018)254: COMMISSION STAFF WORKING DOCUMENT IMPACT ASSESSMENT Parts 1-3.
Different pollution types have different sources, environmental pathways and impacts. The introduction of persistent, toxic chemi-cal substances, which can bioaccumulate, eventually leads to high con tamination levels even if the emissions occur at low concentra-tion levels, e.g. through atmospheric input or from diffuse sources. These include heavy metals, POPs (Persistent Organic Pollutants) and other chemical substances of concern. Eutrophication is mostly caused by human activities like farming and other activi-ties that can lead to fertiliser run off into aquatic systems due to an overabundance of nutrients. The seas and oceans are de facto final sinks of different types of marine pollution, where re-con-centration and accumulation of pollutants, including litter and chemical contaminants can take place. Different types of pollu-tion can be interlinked, for example plastic material often contain additives (such as plasticisers, colorants, etc.) thereby constituting an additional pathway for these substances to enter the marine environment.
The relation between the economy and marine pollution is com-plex, as economic activities may result in pollution, while pollu-tion also hinders economic activities. The factors to be considered include costs for prevention, clean-up, reduction or cessation of pollution, costs causing socio-economic harm and the harm to wildlife and human wellbeing, which often cannot be expressed in monetary terms.
Figure 6.1 Human activities and pressures affecting the state of the marine environment
Notes: the size of the curves corresponds to the frequency of the linkage activi-ty-pressure being reported, but does not differentiate between well-managed activ-ities (e.g. the use of less noisy ships for maritime transport, the direct discharge of well-treated wastewater at sea, etc.) from non-adequately managed ones.Source: DG ENV, Marine Strategy Framework reporting 2018 under Art 8.1c.
121
2021

6.2.1. PLASTIC POLLUTION
At least 8 million tonnes of plastic end up in the ocean worldwide every year, making up 80 % of all marine litter from surface water to deep sea ecosystems467. It is estimated that more than 150 million tonnes of plastics have accumulated in the world's oceans, while 4.6-12.7 million tonnes are added every year468. According to recent studies, the annual flow of plastic waste into the ocean could triple by 2040, reaching to 29 million metric tonnes per year, equivalent to 50 kg of plastic for every metre of coastline worldwide469. Europe is the second largest plastics producer in the world, after China. It is estimated that 150 000-500 000 tonnes of macroplastics and 70 000-130 000 tonnes of microplastics end up in the European seas every year470.
It is generally assumed that most of the plastic waste entering the world’s ocean comes from land-based sources – i.e. approx-imately 80% of marine litter, with regional fluctuations471. In the Adriatic Sea, for example, sea-based activities accounted for 6.3% of marine litter, compared to 34.7% attributed to land-based sources472.
Microplastics (i.e. plastic items smaller than 5mm) are of par-ticular concern due to their potential toxicity, harm for animals, and other consequences, some of which are not fully known yet. Beyond a few estimations and comparisons473, precise data to assess the exact exposure of humans to micro- and nanoplastics through their diet cannot be produced until standardised methods and definitions are available474. Microplastics are used by different industries (e.g. as exfoliants or industrial abrasives), produced by fragmentation from larger pieces of plastic waste, or generated from wear (for example when washing clothes or from car tyre abrasion) or unintentional loss (e.g. marine paint). Microplastics are then carried by sewage and stormwater. While soils are by far the largest sinks of microplastics, a proportion of microplastic emissions end up reaching the aquatic and marine environment (Figure 6.2).
Plastic marine litter generates harmful effects at multiple levels and scales, including economic impacts (e.g. damage to vessels, fishing equipment, and fisheries), social impacts (e.g. reduction of aesthetic value and public safety), and environmental impacts (e.g. ecosystem disruption, soil degradation, habitat destruction, animal mortality, etc.). Given that litter can be transported over large distances, these effects can be produced in areas that are far away from the point of origin, impacting populations and eco-nomic sectors that are not solely responsible for its generation.
467 Thevenon, F., Carroll C., Sousa J. (editors), 2014. Plastic Debris in the Ocean: The Characterization of Marine Plastics and their Environmental Impacts, Situation Analysis Report. Gland, Switzerland: IUCN.
468 Jambeck, J. R., Geyer, R., Wilcox, C., Siegler, T. R., Perryman, M., Andrady, A., ... & Law, K. L. 2015. Plastic waste inputs from land into the ocean. Science, 347(6223), 768-771.469 Pew Charitable Trusts & SYSTEMIQ. 2020. Breaking the plastic wave. A Comprehensive Assessment of Pathways Towards Stopping Ocean Plastic Pollution. 470 Alessi, E. & Di Carlo, G. 2018. Out of the plastic trap: saving the Mediterranean from plastic pollution”. WWF Mediterranean Marine Initiative,Rome, Italy. 28 pp.471 Food and Agriculture Organization of the United Nations (FAO). 2020. Sea-based sources of marine litter – A review of current knowledge and assessment of data gaps.472 Vlachogianni, T., Fortibuoni, T., Ronchi, F., Zeri, C., Mazziotti, C., Tutman, P., ... & Scoullos, M. 2018. Marine litter on the beaches of the Adriatic and Ionian Seas: An assessment
of their abundance, composition and sources. Marine pollution bulletin, 131, 745-756.473 Ragusa, A., Svelato, A., Santacroce, C., Catalano, P., Notarstefano V., Carnevali, O., Papa, F., Rongioletti, M.C.A., Baiocco, F., Draghi, S., D’Amore, E., Rinaldo, D., Matta, M. , &
Giorgini, E. 2021. Plasticenta: First evidence of microplastics in human placenta. Environment International 146: 106274. https://doi.org/10.1016/j.envint.2020.106274.474 Toussaint, B., Raffael, B., Angers-Loustau, A., Gilliland, D., Kestens, V., Petrillo, M., Rio-Echevarria, I.M., & Guy Van den Eede. 2019. Review of micro- and nanoplastic
contamination in the food chain, Food Additives & Contaminants: Part A, 36:5, 639-673, DOI: 10.1080/19440049.2019.1583381.475 Directive 2008/56/EC of the European Parliament and of the Council, 17 June 2008.476 COM/2018/028.477 COM(2020) 259 “Report from the Commission and the European Parliament and the Council on the implementation of the Marine Strategy Framework Directive (Directive
2008/56/EC)”, p. 20.
6.2.2. THE EU RESPONSE
The Marine Strategy Framework Directive (MSFD), adopted in 2008, defines marine pollution as the direct or indirect introduc-tion into the marine environment, as a result of human activity, of substances or energy, including human-induced marine underwa-ter noise, which results or is likely to result in deleterious effects such as harm to living resources and marine ecosystems, includ-ing loss of biodiversity, hazards to human health, the hindering of marine activities, including fishing, tourism and recreation and other legitimate uses of the sea, impairment of the quality for use of sea water and reduction of amenities or, in general, impairment of the sustainable use of marine goods and services475.
The MSFD required EU Member States to ensure that properties and quantities of marine litter do not cause harm to the coastal and marine environment. Tackling pollution and littering of the seas by curbing plastics and microplastics is also one of the major areas of the Commission’s Plastics Strategy476, together with the promotion of plastics recycling, the creation of an enabling envi-ronment for innovation and investment towards circular solutions (see section 3.2), and the support for global action towards ade-quate plastic waste prevention, collection and recycling systems.
As of June 2020, the quality status of Europe’s seas portrayed a mixed picture. While EU rules regulating chemicals have led to a reduction in some contaminant levels, there has been an increased accumulation of plastics and plastic chemical resi-dues in most of the marine species including fish and shellfish products477. Some species show signs of recovery (e.g. white-tailed eagles in the Baltic Sea), while others show steep dete-rioration (40% of elasmobranchs in the Mediterranean). While fishing effort has decreased in the North-east Atlantic, about 79% of Europe’s coastal seabed and 43% of the shelf/slope area is physically disturbed, mainly caused by bottom trawling. 46% of Europe’s coastal waters are still subject to intense eutrophication (Figure 6.3).
122
THE
EU B
LUE
ECO
NO
MY
REPO
RT
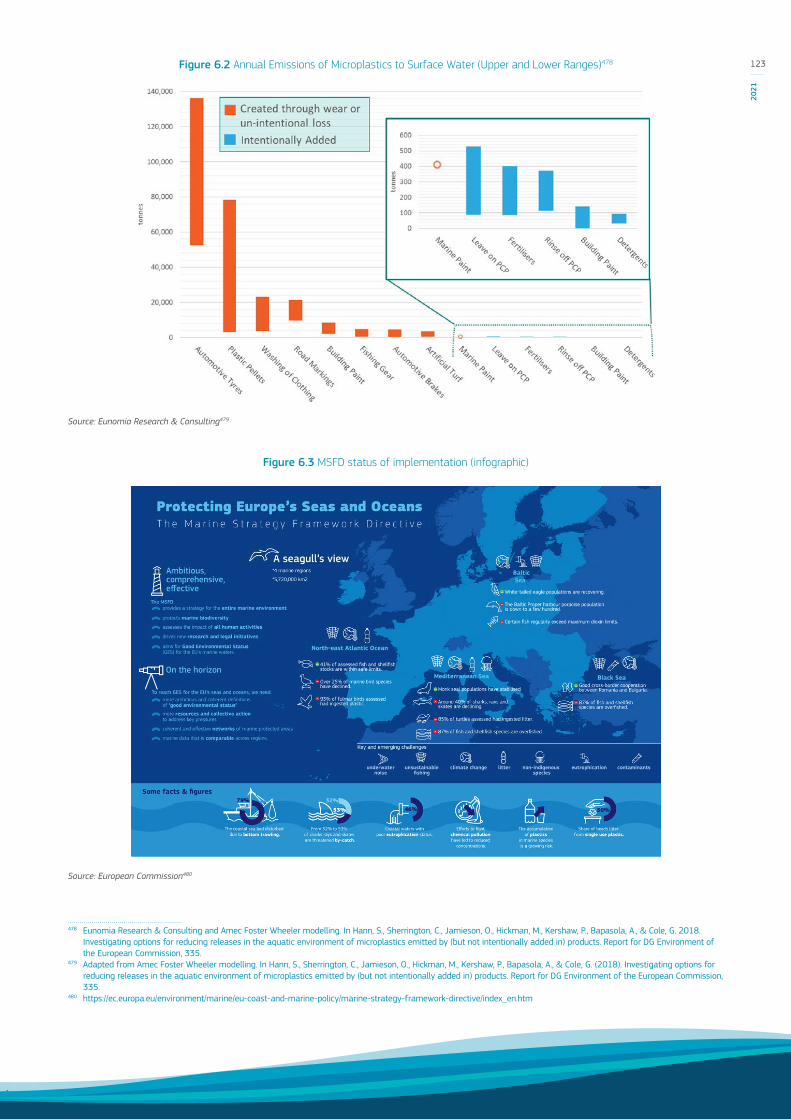
Figure 6.2 Annual Emissions of Microplastics to Surface Water (Upper and Lower Ranges)478
Source: Eunomia Research & Consulting479
Figure 6.3 MSFD status of implementation (infographic)
Source: European Commission480
478 Eunomia Research & Consulting and Amec Foster Wheeler modelling. In Hann, S., Sherrington, C., Jamieson, O., Hickman, M., Kershaw, P., Bapasola, A., & Cole, G. 2018. Investigating options for reducing releases in the aquatic environment of microplastics emitted by (but not intentionally added in) products. Report for DG Environment of the European Commission, 335.
479 Adapted from Amec Foster Wheeler modelling. In Hann, S., Sherrington, C., Jamieson, O., Hickman, M., Kershaw, P., Bapasola, A., & Cole, G. (2018). Investigating options for reducing releases in the aquatic environment of microplastics emitted by (but not intentionally added in) products. Report for DG Environment of the European Commission, 335.
480 https://ec.europa.eu/environment/marine/eu-coast-and-marine-policy/marine-strategy-framework-directive/index_en.htm
123
2021
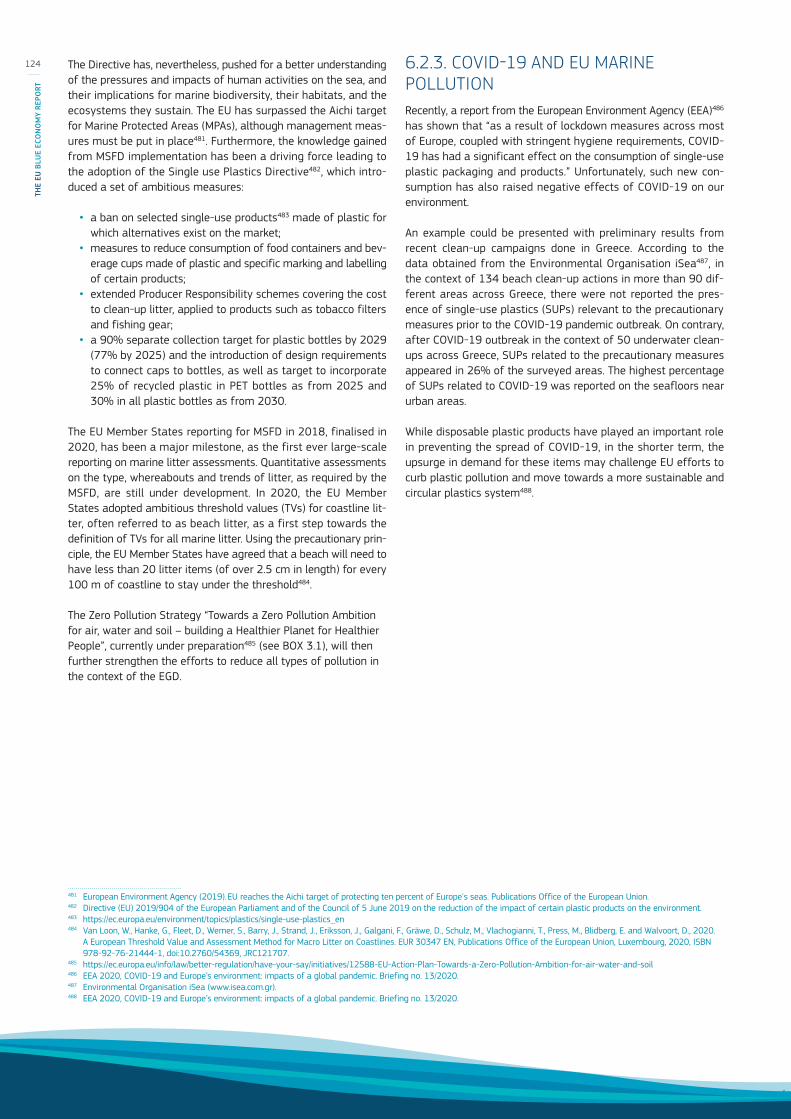
The Directive has, nevertheless, pushed for a better understanding of the pressures and impacts of human activities on the sea, and their implications for marine biodiversity, their habitats, and the ecosystems they sustain. The EU has surpassed the Aichi target for Marine Protected Areas (MPAs), although management meas-ures must be put in place481. Furthermore, the knowledge gained from MSFD implementation has been a driving force leading to the adoption of the Single use Plastics Directive482, which intro-duced a set of ambitious measures:
• a ban on selected single-use products483 made of plastic for which alternatives exist on the market;
• measures to reduce consumption of food containers and bev-erage cups made of plastic and specific marking and labelling of certain products;
• extended Producer Responsibility schemes covering the cost to clean-up litter, applied to products such as tobacco filters and fishing gear;
• a 90% separate collection target for plastic bottles by 2029 (77% by 2025) and the introduction of design requirements to connect caps to bottles, as well as target to incorporate 25% of recycled plastic in PET bottles as from 2025 and 30% in all plastic bottles as from 2030.
The EU Member States reporting for MSFD in 2018, finalised in 2020, has been a major milestone, as the first ever large-scale reporting on marine litter assessments. Quantitative assessments on the type, whereabouts and trends of litter, as required by the MSFD, are still under development. In 2020, the EU Member States adopted ambitious threshold values (TVs) for coastline lit-ter, often referred to as beach litter, as a first step towards the definition of TVs for all marine litter. Using the precautionary prin-ciple, the EU Member States have agreed that a beach will need to have less than 20 litter items (of over 2.5 cm in length) for every 100 m of coastline to stay under the threshold484.
The Zero Pollution Strategy “Towards a Zero Pollution Ambition for air, water and soil – building a Healthier Planet for Healthier People”, currently under preparation485 (see BOX 3.1), will then further strengthen the efforts to reduce all types of pollution in the context of the EGD.
481 European Environment Agency (2019). EU reaches the Aichi target of protecting ten percent of Europe's seas. Publications Office of the European Union.482 Directive (EU) 2019/904 of the European Parliament and of the Council of 5 June 2019 on the reduction of the impact of certain plastic products on the environment.483 https://ec.europa.eu/environment/topics/plastics/single-use-plastics_en 484 Van Loon, W., Hanke, G., Fleet, D., Werner, S., Barry, J., Strand, J., Eriksson, J., Galgani, F., Gräwe, D., Schulz, M., Vlachogianni, T., Press, M., Blidberg, E. and Walvoort, D., 2020.
A European Threshold Value and Assessment Method for Macro Litter on Coastlines. EUR 30347 EN, Publications Office of the European Union, Luxembourg, 2020, ISBN 978-92-76-21444-1, doi:10.2760/54369, JRC121707.
485 https://ec.europa.eu/info/law/better-regulation/have-your-say/initiatives/12588-EU-Action-Plan-Towards-a-Zero-Pollution-Ambition-for-air-water-and-soil 486 EEA 2020, COVID-19 and Europe’s environment: impacts of a global pandemic. Briefing no. 13/2020.487 Environmental Organisation iSea (www.isea.com.gr).488 EEA 2020, COVID-19 and Europe’s environment: impacts of a global pandemic. Briefing no. 13/2020.
6.2.3. COVID-19 AND EU MARINE POLLUTIONRecently, a report from the European Environment Agency (EEA)486 has shown that “as a result of lockdown measures across most of Europe, coupled with stringent hygiene requirements, COVID-19 has had a significant effect on the consumption of single-use plastic packaging and products.” Unfortunately, such new con-sumption has also raised negative effects of COVID-19 on our environment.
An example could be presented with preliminary results from recent clean-up campaigns done in Greece. According to the data obtained from the Environmental Organisation iSea487, in the context of 134 beach clean-up actions in more than 90 dif-ferent areas across Greece, there were not reported the pres-ence of single-use plastics (SUPs) relevant to the precautionary measures prior to the COVID-19 pandemic outbreak. On contrary, after COVID-19 outbreak in the context of 50 underwater clean-ups across Greece, SUPs related to the precautionary measures appeared in 26% of the surveyed areas. The highest percentage of SUPs related to COVID-19 was reported on the seafloors near urban areas.
While disposable plastic products have played an important role in preventing the spread of COVID-19, in the shorter term, the upsurge in demand for these items may challenge EU efforts to curb plastic pollution and move towards a more sustainable and circular plastics system488.
124
THE
EU B
LUE
ECO
NO
MY
REPO
RT

6.3. DECARBONISATION TRENDS IN THE EU BLUE ECONOMY
6.3.1. BACKGROUND
The EU aims to be climate-neutral by 2050489 – an economy with net-zero greenhouse gas (GHG) emissions. This goal is in line with the EU’s commitment to global climate action under the Paris Agreement’s objective to keep global warming well below 2°C and to limit the temperature increase even further to 1.5°C. This long-term strategy, endorsed by the European Parliament and Council in 2019, is at the heart of the EGD490 (section 3.1), which sets out a comprehensive package of measures ranging from ambitious GHG emission reductions, to cutting-edge research and innovation for the development of low carbon technologies, to the preserva-tion of Europe’s natural environment491.
The EGD calls for a transition towards a modern, resource-ef-ficient and competitive economy where net GHG emissions are gradually phased out and the EU's natural capital is protected. In the trajectory towards EU climate neutrality by 2050, the Commission aims to reduce net GHG by at least 55% by 2030492. The European Union’s blue economy can significantly contribute these challenges. In this context, a sustainable blue economy offers many solutions to achieve the EGD objectives, but some of the current activities, technologies and processes need to reduce their carbon footprint, while new, carbon-neutral activities and technologies need to take centre stage in the EU Blue Economy.
The transition to climate neutrality will also bring significant opportunities to the blue economy sectors, such as potential for establishing new business models and markets, create new jobs and boost technological progress. In this connection, it is notewor-thy to mention that the EGD Investment Plan, announced by the European Commission in January 2020, is expected to mobilise at least €1 trillion in public and private investments over the period from 2021 to 2030 to support a just and green transition (see section 2.3).
The EGD calls for a 90% reduction in GHG from all modes of transport, which are responsible for almost a quarter of Europe's GHG, and this includes a number of important sectors of the EU Blue Economy, such as shipping. Though comparatively less than transport by road or air on a per tonne-kilometre basis, shipping contributes to carbon emissions because of the great volumes involved, representing around 13% of the overall EU GHG from the transport sector493. Maritime transport faces huge decarbonisation
489 Long-term low greenhouse gas emission development strategy of the EU and its Member States. European Union. 6 March 2020.490 COM(2019) 640.491 https://ec.europa.eu/clima/policies/eu-climate-action_en 492 The European Commission’s Communication on the 2030 Climate Target Plan (COM/2020/562). 17 September 2020.493 https://ec.europa.eu/clima/policies/transport/shipping_en 494 COM(2020) 789.495 Directive (EU) 2018/410 of the European Parliament and of the Council of 14 March 2018.496 https://ec.europa.eu/info/law/better-regulation/have-your-say/initiatives/12227-Revision-of-the-Energy-Tax-Directive 497 Directive 2013/53/EU of the European Parliament and of the Council of 20 November 2013.498 Directive 2009/123/EC of the European Parliament and of the Council of 21 October 2009 amending Directive 2005/35/EC on ship-source pollution and on the introduction
of penalties for infringements.
challenges in the next decades, due to current lack of market ready zero-emission technologies, long development timeframes and life cycles of vessels.
The 2020 Communication on a Sustainable and Smart Mobility Strategy494 aims to bring the first zero emission vessels to mar-ket by 2030. It incentivises the deployment of renewable and low-carbon fuels (using hydrogen, for example, also see section 5.1.4.) and the feeding of onshore power supply with renewable energy. EU shipyards could seize the opportunities arising from the fast-growing markets of installation and maintenance of offshore wind parks and manufacturing of digitalised and ener-gy-efficient service vessels. European ship designers are already developing innovative wind-powered ships, which will significantly reduce fuel consumption and CO2 emissions in the near future.
Decarbonisation also includes the necessary energy transition in the EU fishing fleets. Despite some progress on reducing emis-sions from shipping and fishing vessels, this reduction may not be considered enough in relation to the goals of the Paris Agreement. The contribution of the shipping sector to emission reductions consistent with the temperature goals of the Paris Agreement remains an important issue in the EU. Therefore, the European Parliament has approved draft legislation to include GHG emis-sions from ships over 5 000 gross tonnes in the emissions trading system (EU ETS) by 1 January 2022. In parallel, the European Commission has launched an initiative to extend the EU Emission Trading System495 to maritime transport and to end fossil-fuel subsidies when revising the Energy Taxation Directive496, which would affect the current tax exemption for shipping and fishing fleets. It is also considering incorporating new propulsion systems in the current review of the Recreational Craft Directive497, and revising the ship source pollution Directive498.
6.3.2. ENERGY TRANSITION IN THE EU FISHING FLEETS: RECENT TRENDS IN FUEL EFFICIENCY AND FUEL INTENSITY
The EU fishing fleet consumed 2.02 billion litres of fuel to land 4.5 million tonnes of fish valued 6.7 billion at the first sale in 2018. This fuel consumption leads to the emission of roughly 5.2 million tonnes of CO2. Between 2009 and 2018, the fuel consumption and therefore CO2 emissions decreased by 18%, while fish land-ings in weight increased 3% and 13% in value.
Fuel (energy) costs amounted to €0.98 billion, with an average fuel price of €0.52 per litre. The fleet directly generated €3.8 billion of GVA and 1.5 billion of gross profits. Between 2009 and 2018, fuel costs decreased by 2%, while GVA and gross profits increased 11% and 44%, respectively.
125
2021
The quantity of fuel used by the EU fishing fleet is influenced by several factors, in particular the type of fishing operation, fishing gear and fuel price. Fuel use and efficiency are often measured for the fisheries sector with several indicators499:
• Fuel intensity is defined as the quantity of fuel consumed per quantity of fish landed, expressed as litres per kg;
• Fuel efficiency is defined as the ratio between fuel costs and income from landings, expressed as a percentage. The lower the percentage the more fuel efficient the vessel (i.e., less income is used to cover fuel costs);
• Fuel efficiency of production is defined as the ratio between fuel costs and the production in weight, expressed as a euro per kg. For The lower the value the more fuel efficient the vessel (i.e., less income is used to catch fish);
• Fuel use per income generated is defined as the ratio between the quantity of fuel consumed and the value of landings, expressed as litres per euro;
• Fuel use per value-added generated is defined as the ratio between the quantity of fuel consumed and the gross value added, expressed as litres per euro.
Naturally, instead of fuel consumed, in most cases it CO2 emis-sions can be reported, resulting in indicators that are proportional – i.e., showing the same trends but in a slightly different scale. However, considering CO2 emissions rather than fuel consumed might make comparisons across sectors easier. Hence, the previ-ous indicators would become: CO2 emissions intensity, CO2 emis-sions per income generated, and CO2 emissions per value-added generated; with both indicators Fuel (or emissions) efficiency and Fuel (or emissions) efficiency of production, remaining the same.
The EU fleet has become more fuel efficient over the years, yet has shown less efficiency in more recent years. This is largely a result of higher fuel prices in 2017 and 2018 that lead into higher fuel costs, as this indicator is very dependent on the fuel price. Fuel costs as a proportion of income were estimated at 15% in 2018, up 2 percentage points compared to 2017 and 3 percent-age points compared to 2016.
The improvement in fleet performance can largely be attributed to lower fuel prices. However, it is noteworthy that fuel intensity – the amount of fuel consumed per landed tonne – has declined, stabilising since 2014 at around 0.45 lit per landed kg.
This analysis can be repeated at more detailed levels, e.g. at sea basin (Mediterranean and Black Seas, North East Atlantic Ocean, and Other Fishing Regions), at activity level (small-scale, large scale and distant water fleets) or even at fishing gear level (purse seiners, trawlers, long-liners, etc.). Due to the heterogeneity of the EU fishing fleets and the species they target, results are expected to differ significantly.
499 STECF (Scientific, Technical and Economic Committee for Fisheries). The 2020 Annual Economic Report on the EU Fishing Fleet; Publications Office of the European Union: Luxembourg, 2020. Cheilari, A., Guillen, J., Damalas, D., & Barbas, T. (2013). Effects of the fuel price crisis on the energy efficiency and the economic performance of the European Union fishing fleets. Marine Policy, 40, 18-24. Tyedmers P.H. Fisheries and energy use. Encyclopedia Energy 2004; 2: 683–693. Muir. J.F. 2015. Fuel and energy use in the fisheries sector – approaches, inventories and strategic implications. FAO Fisheries and Aquaculture Circular No. 1080. Rome, Italy.
500 STECF (Scientific, Technical and Economic Committee for Fisheries). The 2020 Annual Economic Report on the EU Fishing Fleet; Publications Office of the European Union: Luxembourg, 2020. Carvalho, N.; Guillen, J. Economic Impact of Eliminating the Fuel Tax Exemption in the EU Fishing Fleet. Sustainability 2021, 13, 2719. https://doi.org/10.3390/su13052719.
501 Scientific, Technical and Economic Committee for Fisheries (STECF) – The EU Aquaculture Sector – Economic report 2020 (STECF-20-12). Publications Office of the European Union, Luxembourg, 2021, EUR 28359 EN.
The small-scale fleet represents 76% of the EU fishing vessels, 50% of the employment, 5% of the landings in weight and 15% in value, and 7% of the fuel consumed. The large-scale fleet rep-resents 24% of the EU fishing vessels, 45% of the employment, 79% of the landings in weight and 70% in value, and 74% of the fuel consumed. The distant-water fleet represents less than 0.5% of the EU fishing vessels, 5% of the employment, 16% of the landings in weight and 15% in value, and 18% of the fuel consumed500.
Moreover, it should be considered that these CO2 emissions and landings also helped the EU fish processing and distribution sec-tors to generate value added and profits, as well as providing food and nutrition security to the EU consumers. Section 6.4 on the environmental impacts of fisheries products from a life-cycle perspective digs deeper into the seafood production sector as an example of the environmental impacts and emissions that are generated across the value chain - from resource extraction to disposal - thereby illustrating the importance to use a life-cycle approach.
6.3.3. TRENDS IN FUEL EFFICIENCY AND FUEL INTENSITY IN THE EU AQUACULTURE SECTOR
In 2018, the EU aquaculture sector produced 1.2 million tonnes of fish with a value of €4.1 billion in the first-sale. This represents slightly more than 20% of the EU domestic production (consider-ing fisheries and aquaculture) of fish products in terms of weight and about 38% in terms of value.
EU finfish aquaculture production amounted to 0.47 million tonnes valued €2.6 in 2018; while shellfish aquaculture produced 0.47 million tonnes valued €1.3 billion, for the same period.
Information on energy consumption is not available for the EU aquaculture sector; instead, there is information of the energy costs501. Hence, only CO2 emissions efficiency and CO2 emissions efficiency of production can be estimated.
Given the interest of the EGD on the aquaculture production of shellfish and other low trophic level species to reduce the carbon footprint of the food system, as well as its significant differences with the aquaculture of finfish species, both indicators are pre-sented for the shellfish and finfish aquaculture, and compared with the wild-capture fisheries.
126
THE
EU B
LUE
ECO
NO
MY
REPO
RT

Figure 6.4 A) Evolution of Fuel intensity (l/kg) Fuel efficiency (%) and Fuel price (€/l). 6.4 B) Evolution of Fuel use per income (l/€) Fuel use per value-added (l/€) and Fuel price (€/l).
Source: Own elaboration from STECF data502
Figure 6.5 A) Evolution of CO2 emissions intensity (l/kg) Fuel efficiency (%) and Fuel price (€/l). 6.5 B) Evolution of CO2 emissions per income (l/€) CO2 emissions per value-added (l/€) and Fuel price (€/l).
Source: Own elaboration from STECF data503
Figure 6.6 A) Evolution of CO2 emissions efficiency (%) for the wild-capture fisheries, shellfish and finfish aquaculture. 6.6 B) Evolution of CO2 emissions efficiency of production (€/kg) for the wild-capture fisheries, shellfish and finfish aquaculture.
Source: Own elaboration from STECF data504
502 STECF (Scientific, Technical and Economic Committee for Fisheries). The 2020 Annual Economic Report on the EU Fishing Fleet; Publications Office of the European Union: Luxembourg, 2020.
503 STECF (Scientific, Technical and Economic Committee for Fisheries). The 2020 Annual Economic Report on the EU Fishing Fleet; Publications Office of the European Union: Luxembourg, 2020.
504 STECF (Scientific, Technical and Economic Committee for Fisheries). The EU Aquaculture Sector – Economic report 2020 (STECF-20-12). Publications Office of the European Union: Luxembourg, 2020.
0,00
0,10
0,20
0,30
0,40
0,50
0,60
0,70
0,80
2009 2010 2011 2012 2013 2014 2015 2016 2017 2018
Fuel intensity Fuel price Fuel efficiency
0,00
0,10
0,20
0,30
0,40
0,50
0,60
0,70
0,80
2009 2010 2011 2012 2013 2014 2015 2016 2017 2018
Fuel price Fuel use per value-added Fuel use per income
0
0,2
0,4
0,6
0,8
1
1,2
1,4
1,6
2009 2010 2011 2012 2013 2014 2015 2016 2017 2018
CO2 emissions intensity Fuel price Fuel efficiency
0,00
0,25
0,50
0,75
1,00
1,25
1,50
1,75
2,00
2009 2010 2011 2012 2013 2014 2015 2016 2017 2018
Fuel price CO2 emissions per value-added CO2 emissions per income
0,00
0,05
0,10
0,15
0,20
0,25
2009 2010 2011 2012 2013 2014 2015 2016 2017 2018
Fisheries Aquaculture Fish Aquaculture Shellfish
0,00
0,05
0,10
0,15
0,20
0,25
0,30
0,35
0,40
2009 2010 2011 2012 2013 2014 2015 2016 2017 2018
Fisheries Aquaculture Fish Aquaculture Shellfish
127
2021

Figure 6.6 A) on the left shows the CO2 emissions efficiency, i.e., the energy costs as a proportion of the production value, expressed as a percentage. As seen in previous Figure 6.6, for the wild capture fisheries, the evolution of this indicator is very dependent on the fuel price. For the period 2009-18, the ratio for wild-capture fisheries oscillates between 12% and 23%. The higher the fuel price, the less efficient the sector is, as it spends more on energy to produce the same amount. While for shellfish and finfish aquaculture, energy costs represent between 3% and 7% of the value of production, with the exception of the first year.
Figure 6.6 B) on the right shows the CO2 emissions efficiency of production, i.e., the energy costs necessary to produce a kg of fish. For the wild-capture fisheries, this indicator also shows a high dependence on the fuel price. While for shellfish and finfish aquaculture, the indicator has an increasing trend, showing that the energy costs have increased more than aquaculture produc-tion, which has been rather stable during this period. During the same period, the value of aquaculture production has increased significantly, but at a similar rate than the energy costs as seen on the left Figure.
In this case, the indicator for shellfish aquaculture is much lower than for finfish, showing that less CO2 emissions are required to produce a kg of shellfish than producing of finfish, highlighting the importance of the shellfish and low trophic level production to reduce the carbon footprint of the food system. Whereas the CO2 emissions efficiency (on the left) for both shellfish and fin-fish aquaculture is very similar due to the higher prices of finfish compared to shellfish ones.
It should be noted that these ratios refer just to the production phase and its direct emissions. Emissions in other supply chain levels (e.g. distribution) or in the production of fishmeal used as a
505 https://ec.europa.eu/clima/policies/transport/shipping_en https://www.imo.org/en/OurWork/Environment/Pages/Greenhouse-Gas-Studies-2014.aspx
506 European Commission (2018), EU transport in figures. Statistical pocketbook 2018, Luxembourg: Publications Office of the European Union. Available at: https://ec.europa.eu/transport/facts-fundings/statistics/pocketbook-2018_en.
507 Eurostat’s Passengers embarked and disembarked in all ports by direction - annual data.508 https://ec.europa.eu/clima/policies/transport/shipping_en.
feed input in finfish aquaculture are not accounted here. Section 6.4 on the environmental impacts of fisheries products from a life-cycle perspective, provides a broader perspective of the envi-ronmental impacts and emissions that are generated across the value chain using a life-cycle approach.
6.3.4. ENERGY TRANSITION IN THE EU MARITIME TRANSPORTMaritime transport emitted around 940 million tonnes of CO2 annually and is responsible for about 2.5% of global greenhouse gas (GHG) emissions505.
Maritime transport, including sea and inland waterways, was used to import into the EU 82% and export 74% of the products in weight in 2016, representing almost 50% of the total trade value506. In addition to 36% of intra-EU trade flows and almost 420 million passengers each year at EU ports507.
Maritime transport was responsible of almost the 14% of the CO2 and GHG emissions from transport in 2016, with about 167.2 million tonnes of GHG (CO2e) emissions (Figure 6.7 A, left). From 1 January 2018, large ships over 5 000 gross tonnage loading or unloading cargo or passengers at ports in the European Economic Area (EEA) are to monitor and report their related CO2 emissions and other relevant information508. This covers around 90% of all CO2 emissions, whilst only including around 55% of all ships call-ing into EEA ports. First results show that large ships with over 5 000 gross tonnage emitted more than 138 million tonnes of CO2 in 2018.
Figure 6.7 A) GHG emissions by transport mode in 2016 6.7 B) Freight transport measured in weight per distance by transport mode in 2016
Source: European Commission (2018).
14%
72%
13%1% 0%
Maritime transport
Road
Civil aviation
Railways
Others
37%
49%
0%
11%3%
Maritime transport
Road
Civil aviation
Railways
Others
128
THE
EU B
LUE
ECO
NO
MY
REPO
RT
Maritime transport is one of the most energy-efficient modes of transport available; i.e., shipping is one of the lowest emitting freight transport modes per kilometre (Table 6.2).
Table 6.2 CO2 emissions range per tonne-kilometre for freight. In g CO2/km
Transport mode Transport meanCO2
emission range
Maritime transport
container ship coastal, 20-45container ship ocean 5-25bulk carrier ocean 1-5bulk tanker ocean 2-7
RoadHeavy-duty vehicles (big truck)
70-90
Railwaydiesel freight train 25-60
electric freight train 5-25
Civil aviationshort haul cargo aircraft 1 200-2 900
long haul cargo aircraft 350-950
Source: Intergovernmental Panel on Climate Change, 2014509.
These monitored vessels consumed about 44 million tonnes of fuel, i.e., almost 7% of the EU total fuel consumption of 635.8 million tonnes. About 70% of their fuel consumption consisted of heavy fuel oils, which are a highly pollutant, and 20% of marine gas oil and diesel. The use of Liquefied Natural Gas (LNG) was still very minor, with only 3% of the total fuel consumed510.
Hence, despite the maritime transport efficiency, the sector will need to undergo major changes to lower its emissions while retaining its competitive edge, including how ships are being operated, fuelled, designed and built, and how they interact with ports511.
The Commission is working to propose a number of actions as part of the EGD to make the sector more sustainable and inno-vative. These are described in the Sustainable and Smart Mobility Strategy (see BOX 4.3). One of these actions is the contribution of the European Commission with €10 million funding to an EC-IMO energy efficiency project512.
509 Sims R., et al., 2014: Transport. In: Climate Change 2014: Mitigation of Climate Change. Contribution of Working Group III to the Fifth Assessment Report of the Intergovernmental Panel on Climate Change [Edenhofer, O., et al. (eds.)]. Cambridge University Press, Cambridge, United Kingdom and New York, NY, USA.
510 COMMISSION STAFF WORKING DOCUMENT (2020). Full-length report. Accompanying the document Report from the Commission 2019 Annual Report on CO2 Emissions from Maritime Transport. {C(2020) 3184 final}.
511 COMMISSION STAFF WORKING DOCUMENT (2020). Full-length report. Accompanying the document Report from the Commission 2019 Annual Report on CO2 Emissions from Maritime Transport. {C(2020) 3184 final}.
512 https://www.imo.org/en/MediaCentre/PressBriefings/Pages/01-2016-MTCC-.aspx.513 European Commission (EC) (2020) A Farm to Fork Strategy for a fair, healthy and environmentally-friendly food system. COM(2020)381 final.514 European Commission (EC) (2018) Report from the Commission to the Council and the European Parliament in respect of the delegation of powers referred to in Article
11(2), Article 15(2), (3), (6), (7) and Article 45(4) of Regulation (EU) No 1380/2013 of the European Parliament and of the Council of 11 December 2013 on the Common Fisheries Policy. COM(2018) 79 final.
515 International Organization for Standardization (ISO) (2006a) ISO 14040. Environmental management – Life cycle assessment – Principles and framework. Geneva, Switzerland. International Organization for Standardization (ISO) (2006b) ISO 14044. Environmental management – Life cycle assessment – Requirements and guidelines. Geneva, Switzerland.
516 Sala S., Benini L., Beylot A., Castellani V., Cerutti A., Corrado S., Crenna E., Diaconu E., Sanyé Mengual E, Secchi M., Sinkko T., Pant R. (2019) Consumption and Consumer Footprint: methodology and results. Indicators and Assessment of the environmental impact of EU consumption. Luxembourg: Publications Office of the European Union, ISBN 978-92-79-97255-3, doi 10.2760/15899.
6.4. THE ENVIRONMENTAL IMPACTS OF FISHERIES PRODUCTS FROM A LIFE CYCLE PERSPECTIVEThe need for sustainable fishing is highlighted by the Farm to Fork Strategy (section 3.1.2)513 and the Common Fisheries Policy514, including not only the need of assessing the environmental foot-print of fish products but also to ensure the sustainable man-agement of wild fish populations. The environmental footprint of fisheries could be assessed by means of life cycle assessment. Life Cycle Assessment (LCA)515 is a method to systematically and holistically assess the environmental impacts of the life cycle of products and processes, from raw material extraction to waste management. The main advantage of LCA is that, thanks to its comprehensiveness, it allows assessing a multitude of environ-mental impacts highlighting possible trade-offs and burdens shifting between not only environmental impacts but also life cycle stages.
As part of its commitment towards a more sustainable production and consumption, the European Commission has developed an indicator framework to monitor the evolution of environmental impacts associated to consumption in the EU. The Consumption Footprint indicator516 is a set of 16 LCA-based indicators (also available as single score), whose purpose is to quantify the environmental impacts of an average EU citizen, based on the consumption of goods in five areas (Food, Mobility, Housing, Household goods, and Appliances) and a total of around 150 rep-resentative products. For each representative product, the envi-ronmental impact has been modelled by employing LCA, including the extraction of raw materials, manufacturing, distribution, pack-aging, use and end of life management.
With regard to fisheries, the Consumption Footprint included fish and seafood products. The climate change of the life cycle of these products ranged between 4.6 and 9.0 kg CO2 eq. per kg of product (Figure 6.8). Most of the impacts are generated during the primary production (i.e. fishing activities), which represents between 57% (cod) to 77% (salmon) (Figure 6.9).
129
2021

Figure 6.8 Climate change impacts of food products with protein content: fish & seafood, dairy & eggs, meat and vegetal.
Source: Own elaboration based on Sala and others (2019)517
Figure 6.9 Distribution of climate change impacts (kg CO2 eq./kg) of fish and seafood products per life cycle stage.
Source: Own elaboration based on Sala and others (2019)518
Figure 6.10 Life cycle stages of fish fillet from marine fish either from wild caught or from open net pen aquaculture.
Source: Own elaboration from Buchspies and others (2011)519
517 Sala S., Benini L., Beylot A., Castellani V., Cerutti A., Corrado S., Crenna E., Diaconu E., Sanyé Mengual E, Secchi M., Sinkko T., Pant R. (2019) Consumption and Consumer Footprint: methodology and results. Indicators and Assessment of the environmental impact of EU consumption. Luxembourg: Publications Office of the European Union, ISBN 978-92-79-97255-3, doi 10.2760/15899.
518 Sala S., Benini L., Beylot A., Castellani V., Cerutti A., Corrado S., Crenna E., Diaconu E., Sanyé Mengual E, Secchi M., Sinkko T., Pant R. (2019) Consumption and Consumer Footprint: methodology and results. Indicators and Assessment of the environmental impact of EU consumption. Luxembourg: Publications Office of the European Union, ISBN 978-92-79-97255-3, doi 10.2760/15899.
519 Buchspies B.; Tölle S.J., Jungbluth N. (2011) Life Cycle Assessment of High-Sea Fish and Salmon Aquaculture. ESU-Services, Uster. Available from http://esu-services.ch/fileadmin/download/buchspies-2011-LCA-fish.pdf (Accessed April 2021).
0
5
10
15
20
25
30
35
40
45
Shrimp Salmon Cod Butter Cheese Eggs Beef Pork Poultry Tofu Beans
Fish & seafood Dairy & eggs Meat Vegetal
Clim
ate
chan
ge (k
g CO
2 eq
./kg)
Catch fish on high sea
Unload target species and by-catch at harbor
Processing
Packaging
Fish population in nature
Factory
Overexploitation
Wild caught marine fish
Fish Fillet
Production of smoltsat hatchery
Fish farming in net pens
Processing
Packaging
Factory
Marine fish from marine open net pen aquaculture
Fish Fillet
Fish feed
130
THE
EU B
LUE
ECO
NO
MY
REPO
RT

The climate change impact of fish and seafood products was compared to other sources of protein in the EU diet (Figure 6.8). Fish and seafood showed a lower climate change impact com-pared to meat, although poultry meat had a similar impact per mass of product to shrimp and salmon. Compared to dairy and eggs, fish products showed a lower climate change impact than butter and cheese, although only cod was less impacting than eggs. Vegetal alternatives for protein source, such as pulses and tofu, and milk had a lower impact than fish and seafood, with tofu having a similar impact to cod.
Considering the 16 environmental impact categories, the com-parison of the different food products in terms of single weighted score confirmed the observed relations. However, an analysis at the impact category level revealed potential trade-offs regarding freshwater and marine eutrophication, and photochemical ozone formation when substituting other food products by fish and sea-food products in the diet.
The Product Environmental Footprint (PEF) of marine fish (wild caught and aquaculture)
The Product Environmental Footprint (PEF) and Organization Environmental Footprint (OEF) are the LCA-based methods rec-ommended by the European Commission to calculate the life cycle environmental performance of products and organisations520. PEF and OEF are multi-criteria methods and consider 16 environmen-tal impact categories521. After the first publication of the PEF and OEF in 2013, a 5-year pilot phase (2013-2018) and a subsequent a transition phase (since 2019 until now) have been established to allow testing the method on a multiplicity of products and sectors. According to what was foreseen in the 2020 Circular Economy Action Plan, a policy initiative aiming at substantiating green claims522 based on PEF and OEF is under discussion523.
To enable the comparison of products and organisations perfor-mance, Product Environmental Footprint Category Rules (PEFCRs) and Organisation Environmental Footprint Sector Rules (OEFSRs) are developed by a Technical Secretariat, composed by companies representing at least the 51% of the EU market for the specific product group or organisation type. During the pilot phase, 19 PEFCRs were developed including on food, drink and related prod-ucts (beer, dairy, feed for food producing animals, packed water,
520 European Commission (EC) (2013) Commission Recommendation of 9 April 2013 on the use of common methods to measure and communicate the life cycle environmental performance of products and organisations, 2013/179/EU.
521 Climate change, ozone depletion, human toxicity – cancer, human toxicity – non-cancer, particulate matter, ionizing radiation – human health, photochemical ozone formation – human health, acidification, eutrophication – terrestrial, eutrophication – freshwater, eutrophication – marine, ecotoxicity – freshwater, land use, water use, resource use – minerals and metals, resource use – fossils.
522 https://ec.europa.eu/environment/eussd/smgp/initiative_on_green_claims.htm523 European Commission (EC) (2020b) A new Circular Economy Action Plan For a cleaner and more competitive Europe. COM (2020) 98.524 Finnveden G., Hauschild MZ., Ekvall T., Guinée J., Heijungs R., Hellweg S., Koehler A., Pennington D., Suh S. (2009) Recent developments in Life Cycle Assessment. Journal of
Environmental Management 91, 1–21. https://doi.org/10.1016/j.jenvman.2009.06.018. Crenna E., Sozzo S., Sala S. (2018) Natural biotic resources in LCA: Towards an impact assessment model for sustainable supply chain management. Journal of Cleaner Production 172, 3669–3684. https://doi.org/10.1016/j.jclepro.2017.07.208.
525 Sala S., Benini L., Castellani V., Vidal Legaz B., De Laurentiis V., Pant R. (2019) Suggestions for the update of the Environmental Footprint Life Cycle Impact Assessment. Impacts due to resource use, water use, land use, and particulate matter. EUR 28636 EN, Publications Office of the European Union, Luxembourg, ISBN 978-92-79-69335-9, https://doi.org/10.2760/78072.
526 Tittensor DP, et al. (2014) A mid-term analysis of progress towards international biodiversity targets. Science 346, 241–244. https://doi.org/10.1126/science.1257484. IPBES (2019) Summary for policymakers of the global assessment report on biodiversity and ecosystem services of the Intergovernmental Science-Policy Platform on Biodiversity and Ecosystem Services. IPBES secretariat, Bonn, Germany.
527 Beylot A., Ardente F., Penedo De Sousa Marques A., Mathieux F., Pant R., Sala S. and Zampori L. (2020) Abiotic and biotic resources impact categories in LCA: development of new approaches, EUR 30126 EN, Publications Office of the European Union, Luxembourg, ISBN 978-92-76-17227-7, doi: 10.2760/232839.
528 The framework did not include soils. Although they are potentially subject to regenerate over time, they should not be considered a NOBR, since soils are considered non-renewable resources (soil formation processes take very long to occur, and therefore soils are not recoverable within a human lifespan) (EC, 2006).
529 Beylot A., Ardente F., Penedo De Sousa Marques A., Mathieux F., Pant R., Sala S. and Zampori L. (2020) Abiotic and biotic resources impact categories in LCA: development of new approaches, EUR 30126 EN, Publications Office of the European Union, Luxembourg, ISBN 978-92-76-17227-7, doi: 10.2760/232839.
pasta, pet food and wine). In the transition phase, a PEFCR for Marine Fish is being developed, coordinated by the Norwegian Seafood Federation (NSF). The PEFCR Marine Fish is expected to be published by end 2022. The PEFCR considers both wild caught marine fish and marine fish from marine open net pen aquacul-ture. The wild caught and the open net pen aquaculture (Figure 6.10) entail different fishing processes thus impacting the envi-ronment differently. For example, an important aspect to consider in the wild caught, which is not so critical in the marine open net pen aquaculture, is the potential overexploitation of natural fish populations.
Addressing fish overexploitation in life cycle assessment studies
Although LCA already covers a significant number of impact cat-egories, overexploitation of natural occurring biotic resources are still poorly covered in available Life Cycle Impact Assessment methods524. The need for improvements and further research for biotic resource proper assessment has emerged525. With the growing degradation of ecosystems, including due to resources overexploitation526, addressing the impacts of the exploitation of biotic resources when assessing environmental sustainability is thus essential.
To address this issue, the JRC developed a comprehensive four-steps approach to characterise the impacts due to the overex-ploitation of naturally occurring biotic resources (NOBR) in LCA by considering (i) the renewability rate of the resource, (ii) the vul-nerability of the species, and (iii) the current exploitation level527. These three elements are those hampering a steady provision of biotic resource from the wild. The impact assessment frame-work allows determining the impacts of exploitation of natural occurring biotic resources in terms of number of years necessary to have the same amount of resource available in nature once again528.
An operationalisation of the impact assessment framework, for naturally occurring biotic resources (NOBRs), was presented focused on fish species, since this the NOBR for which systematic information regarding the status of exploitation was available (information on exploitation status and vulnerability for 42 fish species was compiled)529.
131
2021

Source: Own elaboration from Beylot and others (2020)530
Results show that the consumption of different species has very different impacts in terms of exploitation of NOBR (Figure 6.11). Using the geometric mean to aggregate species level, results show that while tuna (multispecies group considering skipjack, yellowfin, albacore, bigeye, bluefin and miscellaneous) .is the spe-cies most consumed per capita in the EU, the consumption of cod is the one with the highest impact. Nevertheless, the authors point out that aggregating characterisation factors (CFs) (i.e., the impact factor for each individual species) per species groups greatly influ-ence the results. If data would be available, performing the same analysis at the species level (for tuna) would probably yield dif-ferent results. Hence, the recommendation is to apply the CFs at species level when assessing NOBR.
530 Beylot A., Ardente F., Penedo De Sousa Marques A., Mathieux F., Pant R., Sala S. and Zampori L. (2020) Abiotic and biotic resources impact categories in LCA: development of new approaches, EUR 30126 EN, Publications Office of the European Union, Luxembourg, ISBN 978-92-76-17227-7, doi: 10.2760/232839.
531 Barbier E.B., Hacker S.D., Kennedy C., Koch E.W., Stier A.C., Silliman B.R. (2011) The value of estuarine and coastal ecosystem services. Ecological Monographs 81, 169–193. https://doi.org/10.1890/10-1510.1
532 Roebeling P.C., Costa L., Magalhães-Filho L., Tekken V. (2013) Ecosystem service value losses from coastal erosion in Europe: historical trends and future projections. Journal of Coastal Conservation 17, 389--395. https://doi.org/10.1007/s11852-013-0235-6
533 Paprotny D., Terefenko P., Giza A., Czapliński P., Vousdoukas M.I. (2021) Projecting losses of ecosystem services due to coastal erosion in Europe with remote sensing data. Science of the Total Environment, 760, 144310. https://doi.org/10.1016/j.scitotenv.2020.144310
6.5. QUANTIFICATION OF ECONOMIC LOSS OF COASTAL ECOSYSTEM SERVICES FROM SEA LEVEL RISEThe coastal zone provides valuable ecosystem services531 to the European citizens, related to waste treatment, climate and water regulation, food production, and recreation, among others532. The main source of coastal ecosystem services are currently agricul-tural areas (34% of total) followed by wetlands (29%) and for-ests (20%). Within a 10 km coastal zone of the EU-27 countries, almost €400 billion worth of services was generated in 2018533.
However, rising seas due to climate change are expected to reduce the area and ecosystem services of Europe’s coasts. Based on existing projections, 4-5% of coastal ecosystem services in Europe could be lost by 2100 (corresponding to more than €15 billion annually), with very large diversity of impacts at national and regional level. Many regions located especially along the North Sea and eastern Mediterranean Sea would suffer from heavy decline in ecosystem services.
Despite the ongoing natural trend of coastal erosion, human interventions (e.g. land reclamations, and expansion of ports and harbours) resulted in a small expansion of Europe’s coastal zone.
0
1000
2000
3000
4000
5000
6000
0 1 2 3 4
Impa
ct in
yea
rs
Per capita consumption (kg from wild)
Tuna
Cod
HerringSardine
0
20
40
60
80
100
120
140
0 0,5 1 1,5 2
Impa
ct in
yea
rs
Per capita consumption (kg from wild)
Trout, salmon
Sardine
Herring
Trout, salmon
Figure 6.11 Relation between consumption per capita of wild fish species groups (kg from wild) and the resulting impact of exploitation (years).
132
THE
EU B
LUE
ECO
NO
MY
REPO
RT
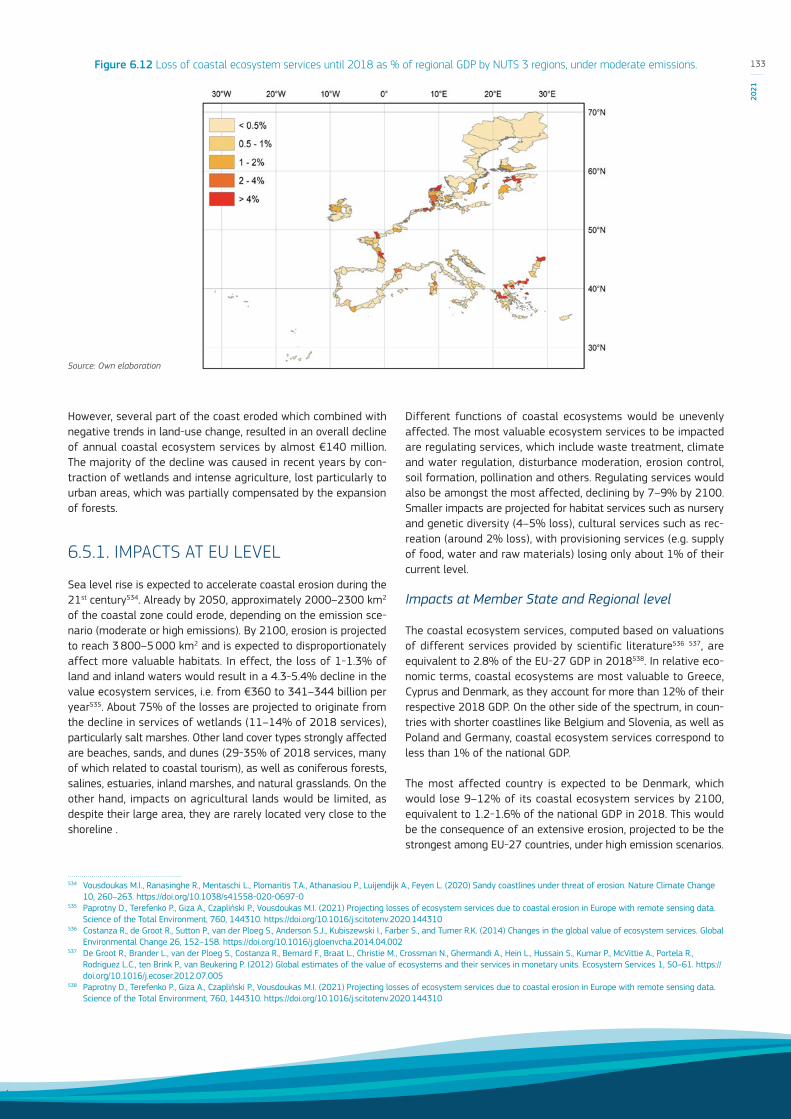
However, several part of the coast eroded which combined with negative trends in land-use change, resulted in an overall decline of annual coastal ecosystem services by almost €140 million. The majority of the decline was caused in recent years by con-traction of wetlands and intense agriculture, lost particularly to urban areas, which was partially compensated by the expansion of forests.
6.5.1. IMPACTS AT EU LEVEL
Sea level rise is expected to accelerate coastal erosion during the 21st century534. Already by 2050, approximately 2000–2300 km2 of the coastal zone could erode, depending on the emission sce-nario (moderate or high emissions). By 2100, erosion is projected to reach 3 800–5 000 km2 and is expected to disproportionately affect more valuable habitats. In effect, the loss of 1-1.3% of land and inland waters would result in a 4.3-5.4% decline in the value ecosystem services, i.e. from €360 to 341–344 billion per year535. About 75% of the losses are projected to originate from the decline in services of wetlands (11–14% of 2018 services), particularly salt marshes. Other land cover types strongly affected are beaches, sands, and dunes (29-35% of 2018 services, many of which related to coastal tourism), as well as coniferous forests, salines, estuaries, inland marshes, and natural grasslands. On the other hand, impacts on agricultural lands would be limited, as despite their large area, they are rarely located very close to the shoreline .
534 Vousdoukas M.I., Ranasinghe R., Mentaschi L., Plomaritis T.A., Athanasiou P., Luijendijk A., Feyen L. (2020) Sandy coastlines under threat of erosion. Nature Climate Change 10, 260–263. https://doi.org/10.1038/s41558-020-0697-0
535 Paprotny D., Terefenko P., Giza A., Czapliński P., Vousdoukas M.I. (2021) Projecting losses of ecosystem services due to coastal erosion in Europe with remote sensing data. Science of the Total Environment, 760, 144310. https://doi.org/10.1016/j.scitotenv.2020.144310
536 Costanza R., de Groot R., Sutton P., van der Ploeg S., Anderson S.J., Kubiszewski I., Farber S., and Turner R.K. (2014) Changes in the global value of ecosystem services. Global Environmental Change 26, 152–158. https://doi.org/10.1016/j.gloenvcha.2014.04.002
537 De Groot R., Brander L., van der Ploeg S., Costanza R., Bernard F., Braat L., Christie M., Crossman N., Ghermandi A., Hein L., Hussain S., Kumar P., McVittie A., Portela R., Rodriguez L.C., ten Brink P., van Beukering P. (2012) Global estimates of the value of ecosystems and their services in monetary units. Ecosystem Services 1, 50–61. https://doi.org/10.1016/j.ecoser.2012.07.005
538 Paprotny D., Terefenko P., Giza A., Czapliński P., Vousdoukas M.I. (2021) Projecting losses of ecosystem services due to coastal erosion in Europe with remote sensing data. Science of the Total Environment, 760, 144310. https://doi.org/10.1016/j.scitotenv.2020.144310
Different functions of coastal ecosystems would be unevenly affected. The most valuable ecosystem services to be impacted are regulating services, which include waste treatment, climate and water regulation, disturbance moderation, erosion control, soil formation, pollination and others. Regulating services would also be amongst the most affected, declining by 7–9% by 2100. Smaller impacts are projected for habitat services such as nursery and genetic diversity (4–5% loss), cultural services such as rec-reation (around 2% loss), with provisioning services (e.g. supply of food, water and raw materials) losing only about 1% of their current level.
Impacts at Member State and Regional level
The coastal ecosystem services, computed based on valuations of different services provided by scientific literature536 537, are equivalent to 2.8% of the EU-27 GDP in 2018538. In relative eco-nomic terms, coastal ecosystems are most valuable to Greece, Cyprus and Denmark, as they account for more than 12% of their respective 2018 GDP. On the other side of the spectrum, in coun-tries with shorter coastlines like Belgium and Slovenia, as well as Poland and Germany, coastal ecosystem services correspond to less than 1% of the national GDP.
The most affected country is expected to be Denmark, which would lose 9–12% of its coastal ecosystem services by 2100, equivalent to 1.2-1.6% of the national GDP in 2018. This would be the consequence of an extensive erosion, projected to be the strongest among EU-27 countries, under high emission scenarios.
Figure 6.12 Loss of coastal ecosystem services until 2018 as % of regional GDP by NUTS 3 regions, under moderate emissions.
Source: Own elaboration
133
2021
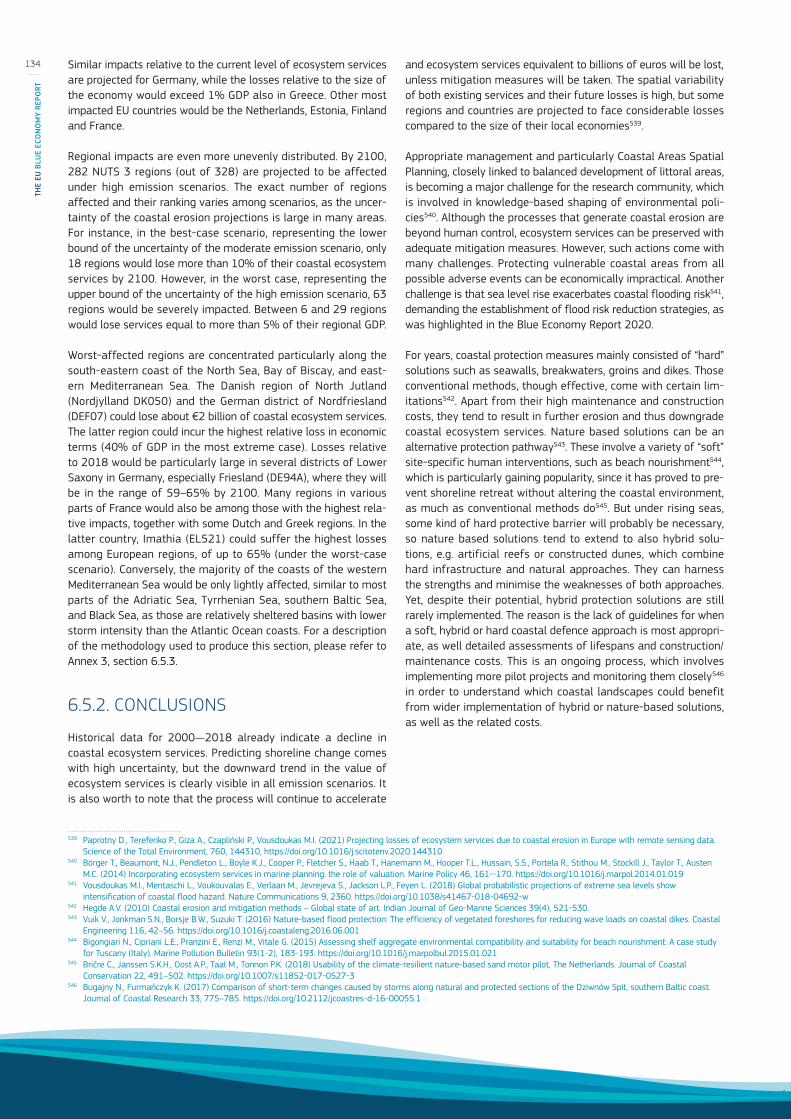
Similar impacts relative to the current level of ecosystem services are projected for Germany, while the losses relative to the size of the economy would exceed 1% GDP also in Greece. Other most impacted EU countries would be the Netherlands, Estonia, Finland and France.
Regional impacts are even more unevenly distributed. By 2100, 282 NUTS 3 regions (out of 328) are projected to be affected under high emission scenarios. The exact number of regions affected and their ranking varies among scenarios, as the uncer-tainty of the coastal erosion projections is large in many areas. For instance, in the best-case scenario, representing the lower bound of the uncertainty of the moderate emission scenario, only 18 regions would lose more than 10% of their coastal ecosystem services by 2100. However, in the worst case, representing the upper bound of the uncertainty of the high emission scenario, 63 regions would be severely impacted. Between 6 and 29 regions would lose services equal to more than 5% of their regional GDP.
Worst-affected regions are concentrated particularly along the south-eastern coast of the North Sea, Bay of Biscay, and east-ern Mediterranean Sea. The Danish region of North Jutland (Nordjylland DK050) and the German district of Nordfriesland (DEF07) could lose about €2 billion of coastal ecosystem services. The latter region could incur the highest relative loss in economic terms (40% of GDP in the most extreme case). Losses relative to 2018 would be particularly large in several districts of Lower Saxony in Germany, especially Friesland (DE94A), where they will be in the range of 59–65% by 2100. Many regions in various parts of France would also be among those with the highest rela-tive impacts, together with some Dutch and Greek regions. In the latter country, Imathia (EL521) could suffer the highest losses among European regions, of up to 65% (under the worst-case scenario). Conversely, the majority of the coasts of the western Mediterranean Sea would be only lightly affected, similar to most parts of the Adriatic Sea, Tyrrhenian Sea, southern Baltic Sea, and Black Sea, as those are relatively sheltered basins with lower storm intensity than the Atlantic Ocean coasts. For a description of the methodology used to produce this section, please refer to Annex 3, section 6.5.3.
6.5.2. CONCLUSIONS
Historical data for 2000—2018 already indicate a decline in coastal ecosystem services. Predicting shoreline change comes with high uncertainty, but the downward trend in the value of ecosystem services is clearly visible in all emission scenarios. It is also worth to note that the process will continue to accelerate
539 Paprotny D., Terefenko P., Giza A., Czapliński P., Vousdoukas M.I. (2021) Projecting losses of ecosystem services due to coastal erosion in Europe with remote sensing data. Science of the Total Environment, 760, 144310, https://doi.org/10.1016/j.scitotenv.2020.144310
540 Börger T., Beaumont, N.J., Pendleton L., Boyle K.J., Cooper P., Fletcher S., Haab T., Hanemann M., Hooper T.L., Hussain, S.S., Portela R., Stithou M., Stockill J., Taylor T., Austen M.C. (2014) Incorporating ecosystem services in marine planning: the role of valuation. Marine Policy 46, 161--170. https://doi.org/10.1016/j.marpol.2014.01.019
541 Vousdoukas M.I., Mentaschi L., Voukouvalas E., Verlaan M., Jevrejeva S., Jackson L.P., Feyen L. (2018) Global probabilistic projections of extreme sea levels show intensification of coastal flood hazard. Nature Communications 9, 2360. https://doi.org/10.1038/s41467-018-04692-w
542 Hegde A.V. (2010) Coastal erosion and mitigation methods – Global state of art. Indian Journal of Geo-Marine Sciences 39(4), 521-530.543 Vuik V., Jonkman S.N., Borsje B.W., Suzuki T. (2016) Nature-based flood protection: The efficiency of vegetated foreshores for reducing wave loads on coastal dikes. Coastal
Engineering 116, 42–56. https://doi.org/10.1016/j.coastaleng.2016.06.001544 Bigongiari N., Cipriani L.E., Pranzini E., Renzi M., Vitale G. (2015) Assessing shelf aggregate environmental compatibility and suitability for beach nourishment: A case study
for Tuscany (Italy). Marine Pollution Bulletin 93(1-2), 183-193. https://doi.org/10.1016/j.marpolbul.2015.01.021545 Bričre C., Janssen S.K.H., Oost A.P., Taal M., Tonnon P.K. (2018) Usability of the climate-resilient nature-based sand motor pilot, The Netherlands. Journal of Coastal
Conservation 22, 491–502. https://doi.org/10.1007/s11852-017-0527-3546 Bugajny N., Furmańczyk K. (2017) Comparison of short-term changes caused by storms along natural and protected sections of the Dziwnów Spit, southern Baltic coast.
Journal of Coastal Research 33, 775–785. https://doi.org/10.2112/jcoastres-d-16-00055.1
and ecosystem services equivalent to billions of euros will be lost, unless mitigation measures will be taken. The spatial variability of both existing services and their future losses is high, but some regions and countries are projected to face considerable losses compared to the size of their local economies539.
Appropriate management and particularly Coastal Areas Spatial Planning, closely linked to balanced development of littoral areas, is becoming a major challenge for the research community, which is involved in knowledge-based shaping of environmental poli-cies540. Although the processes that generate coastal erosion are beyond human control, ecosystem services can be preserved with adequate mitigation measures. However, such actions come with many challenges. Protecting vulnerable coastal areas from all possible adverse events can be economically impractical. Another challenge is that sea level rise exacerbates coastal flooding risk541, demanding the establishment of flood risk reduction strategies, as was highlighted in the Blue Economy Report 2020.
For years, coastal protection measures mainly consisted of “hard” solutions such as seawalls, breakwaters, groins and dikes. Those conventional methods, though effective, come with certain lim-itations542. Apart from their high maintenance and construction costs, they tend to result in further erosion and thus downgrade coastal ecosystem services. Nature based solutions can be an alternative protection pathway543. These involve a variety of “soft” site-specific human interventions, such as beach nourishment544, which is particularly gaining popularity, since it has proved to pre-vent shoreline retreat without altering the coastal environment, as much as conventional methods do545. But under rising seas, some kind of hard protective barrier will probably be necessary, so nature based solutions tend to extend to also hybrid solu-tions, e.g. artificial reefs or constructed dunes, which combine hard infrastructure and natural approaches. They can harness the strengths and minimise the weaknesses of both approaches. Yet, despite their potential, hybrid protection solutions are still rarely implemented. The reason is the lack of guidelines for when a soft, hybrid or hard coastal defence approach is most appropri-ate, as well detailed assessments of lifespans and construction/maintenance costs. This is an ongoing process, which involves implementing more pilot projects and monitoring them closely546 in order to understand which coastal landscapes could benefit from wider implementation of hybrid or nature-based solutions, as well as the related costs.
134
THE
EU B
LUE
ECO
NO
MY
REPO
RT

6.6. IMPACTS OF COVID-19 PANDEMIC IN BLUE NATURE AREASNearly 2.4 billion people (around 40% of the world’s population) live within 100 km of the coast. While coastal areas include zones for different activities, blue nature areas are those that have an explicit human-nature connection. Ecosystem services provided by blue nature areas offer an alternative to traditional 'grey' infra-structure, offering a wide range of goods and services, including health-related, aesthetic, cultural and recreational benefits for citizens as well as habitat for biodiversity.
Since the first quarter of 2020, the COVID-19 pandemic has increasingly impacted global health with significant social and economic consequences on people who live in these areas. Vulnerable coastal communities and informal workers in Europe have been hit hard by lockdown measures, border closures, and non-essential travel restrictions adopted in response to the health crisis, which affected all Blue Economy sectors, particularly marine and coastal tourism, shipping, port activities, and fisheries547.
At the UN General Assembly that in December 2020 debated two resolutions on Oceans and Law of the Seas and on Sustainable Fisheries, the EU recognised the important role seafarers and fish-ers play in providing the global community with goods, including the medicines and equipment used to fight the COVID-19 pan-demic, as well as food. In this regard, the EU welcomed the con-sensual adoption by the UN General Assembly of a Resolution on “International cooperation to address challenges faced by sea-farers as a result of the COVID-19 pandemic to support global supply chains”548.
547 Northrop, E., et al. 2020. ‘‘A Sustainable and Equitable Blue Recovery to the COVID-19 Crisis.’’ Report. Washington, DC: World Resources Institute. Available online at http://www.oceanpanel.org/Bluerecovery
548 United Nations General Assembly resolution no. A/75/L.37 of 24 November 2020.549 https://ec.europa.eu/fisheries/press/eu-stresses-need-blue-post-covid-19-recovery-strategies-un-general-assembly_en
Furthermore, the EU stressed that in addressing the socio-eco-nomic impacts of the COVID-19 pandemic, recovery strategies should aim at keeping oceans healthy and productive, fighting climate change, halting biodiversity loss, as well as tackling ocean inequality. “These should not be seen as 'either or' options, as ensuring resilience of the society, economies as well as the envi-ronment to future shocks can only be achieved by tackling these challenges”549.
For the EU, in line with the principles of its EGD, the best way forward to recover from this pandemic is by rebuilding greener and bluer, which requires decision-making on the basis of the best available science. To contribute to increased knowledge and also helping the scientific community, policy makers, and maritime industries to better understand the COVID-19 impacts on human wellbeing and interactions with coastal nature, ICES Working Group on Resilience and Marine Ecosystem Services (WGRMES) is conducting a global survey to better understand the impacts of the COVID-19 pandemic on blue nature areas.
Below, are the preliminary results of the survey. Respondents in our sample of 206 people were mostly female and univer-sity educated. The most frequent ages of the respondents were included in the age groups between 35 and 49 years, even if all age groups above 25 years were widely represented. Respondents represented 35 countries from six continents with the majority living in the UK (37%), USA (22%) and Spain (6%).
Personal connection with nature was strong among respondents, with almost all describing themselves as being wholly, very, or moderately connected with nature (Figure 6.13).
This is likely related to the fact that respondents typically lived in accommodation with a garden or rural setting (73%; Figure 6.13),
Figure 6.13 Perception about connection of respondents with nature (left), and characteristics of the surroundings of their home (right).
Source: Own elaboration
23%
60%
14%
3%
Which of these diagrams best represents your personal connection with nature in general?
I am whol ly connected withnature
I am very connected withnature
I am moderately connectedwith nature
I am slightly connected withnature
32%
4%
1%23%
32%
3%
1%3% 1%
What kind of home do you live in?
town/city house with garden
town/city house without garden
city apartment with garden
town/city apartment
rural/village house with garden
rural/village house without garden
rural/village apartment
farm or other agricultural setting
not stated
What kind of home do you live in?Which of these diagrams best represents your personal connection with nature in general?
135
2021

0102030405060708090
100
sea/ocean sand dunes beaches coastalwaterways (e.g.
tidal canals,rivers, lakes,
lagoons, ponds)
coastal cliffs coastalwoodland/forest
wetlands (e.g.saltmarshes)
other
%
How often do you usually visit any of the following blue areas near your home?
often regularly sometimes rarely never no area like this nearby not stated
Figure 6.14 Frequency of visits to different types of green (top), and coastal blue areas (bottom).
Source: Own elaboration.
Figure 6.15 Perceptions about benefits of coastal blue areas for physical and mental health.
Source: Own elaboration.
0102030405060708090
100
recreational parksor gardens
hills or mountains woodlands orforests
sporting areas (e.g.golf course, football
pitch)
conservation areas(e.g. national park,
reserve)
agricultural areas(e.g. farmland,
vineyard, orchard)
other
%
How often do you usually visit any of the following green areas near your home (i.e. within a convenient travelling distance)?
often regularly sometimes rarely never no area like this nearby not stated
How often do you usually visit any of the following green areas near your home (i.e. within a convenient travelling distance)?
How often do you usually visit any of the following blue areas near your home?
0102030405060708090
100
very positively qui te positively neutral qui te negatively very negatively not stated
%
How do your interactions with your favourite coastal blue area tend to affect your health?
physical health mental health moods levels of stress social interactions
How do your interactions with your favourite coastal blue area tend to affect your health?
and frequently visited green areas (namely recreational parks, woodlands/forests, and hills/mountains), or coastal blue areas (especially sea/ocean, and beaches; Figure 6.14).
When asked about coastal blue areas, nearly all said that inter-acting with their favourite coastal blue area positively affected their mental and/or physical health, and had a positive effect on moods, levels of stress and/or social interactions (Figure 6.15). A range of emotions were described when visiting these favourite
areas such as feelings of appreciation (94%), happiness (90%), hope (56%), satisfaction (53%), concentration (35%), sadness (23%), peace or calm (8%) and fear (6%).
As a result of government efforts to control the COVID-19 pan-demic in their country, most respondents were affected by severe or strict restrictions on their usual activities immediately prior to or while completing the survey (85%; Figure 6.16). This meant they spent less time than usual in coastal blue areas (67%) or could not visit any coastal blue areas away from home (37%; Figure 6.16).
136
THE
EU B
LUE
ECO
NO
MY
REPO
RT
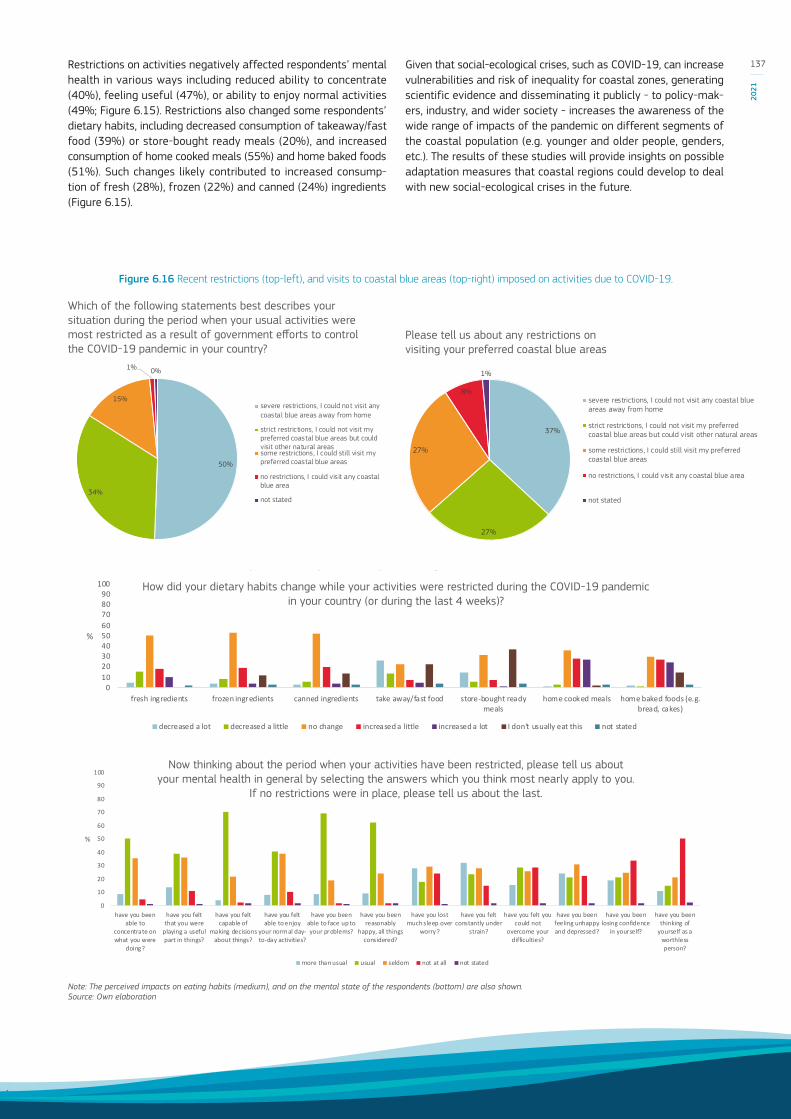
0102030405060708090
100
fresh ingredients frozen ingredients canned ingredients take away/fast food store-bought readymeals
home cooked meals home baked foods (e.g.bread, cakes)
%
How did your dietary habits change while your activities were restricted during the COVID-19 pandemic in your country (or during the last 4 weeks)?
decreased a lot decreased a little no change increased a little increased a lot I don't usually eat this not stated
0
10
20
30
40
50
60
70
80
90
100
have you beenable to
concentrate onwhat you were
doing?
have you feltthat you were
playing a usefulpart in things?
have you feltcapable of
making decisionsabout things?
have you feltable to enjoy
your normal day-to-day activities?
have you beenable to face up toyour problems?
have you beenreasonably
happy, all thingsconsidered?
have you lostmuch sleep over
worry?
have you feltconstantly under
strain?
have you felt youcould not
overcome yourdifficulties?
have you beenfeeling unhappyand depressed?
have you beenlosing confidence
in yourself?
have you beenthinking of
yourself as aworthlessperson?
%
Now thinking about the period when your activities have been restricted, please tell us about your mental health in general by selecting the answers which you think most nearly apply to you. If no restrictions were in place, please
tell us about the last
more than usual usual seldom not at all not stated
Figure 6.16 Recent restrictions (top-left), and visits to coastal blue areas (top-right) imposed on activities due to COVID-19.
Note: The perceived impacts on eating habits (medium), and on the mental state of the respondents (bottom) are also shown. Source: Own elaboration
Which of the following statements best describes your situation during the period when your usual activities were most restricted as a result of government efforts to control the COVID-19 pandemic in your country?
How did your dietary habits change while your activities were restricted during the COVID-19 pandemic in your country (or during the last 4 weeks)?
Now thinking about the period when your activities have been restricted, please tell us about your mental health in general by selecting the answers which you think most nearly apply to you.
If no restrictions were in place, please tell us about the last.
Please tell us about any restrictions on visiting your preferred coastal blue areas
37%
27%
27%
8%
1%
severe restrictions, I could not visit any coastal blueareas away from home
strict restrictions, I could not visit my preferredcoastal blue areas but could visit other natural areas
some restrictions, I could still visit my preferredcoastal blue areas
no restrictions, I could visit any coastal blue area
not stated
50%
34%
15%
1% 0%
severe restrictions, I could not visit anycoastal blue areas away from home
strict restrictions, I could not visit mypreferred coastal blue areas but couldvisit other natural areassome restrictions, I could still visit mypreferred coastal blue areas
no restrictions, I could visit any coastalblue area
not stated
Restrictions on activities negatively affected respondents’ mental health in various ways including reduced ability to concentrate (40%), feeling useful (47%), or ability to enjoy normal activities (49%; Figure 6.15). Restrictions also changed some respondents’ dietary habits, including decreased consumption of takeaway/fast food (39%) or store-bought ready meals (20%), and increased consumption of home cooked meals (55%) and home baked foods (51%). Such changes likely contributed to increased consump-tion of fresh (28%), frozen (22%) and canned (24%) ingredients (Figure 6.15).
Given that social-ecological crises, such as COVID-19, can increase vulnerabilities and risk of inequality for coastal zones, generating scientific evidence and disseminating it publicly - to policy-mak-ers, industry, and wider society - increases the awareness of the wide range of impacts of the pandemic on different segments of the coastal population (e.g. younger and older people, genders, etc.). The results of these studies will provide insights on possible adaptation measures that coastal regions could develop to deal with new social-ecological crises in the future.
137
2021
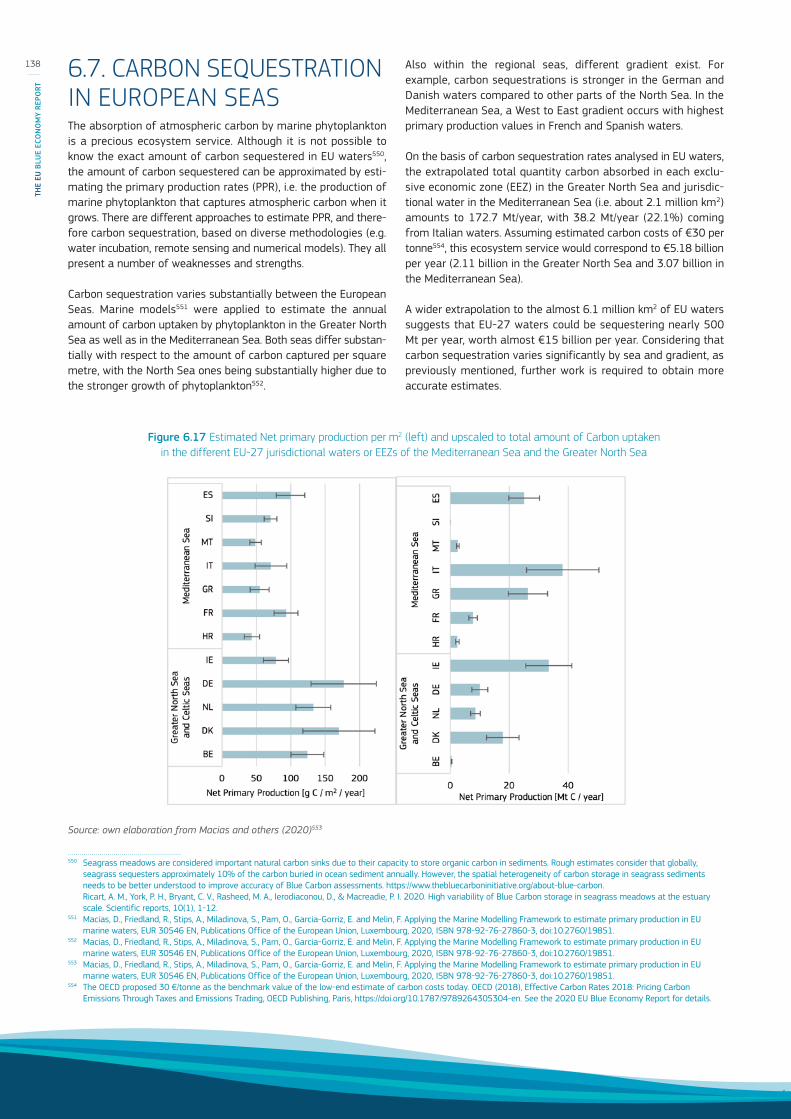
6.7. CARBON SEQUESTRATION IN EUROPEAN SEASThe absorption of atmospheric carbon by marine phytoplankton is a precious ecosystem service. Although it is not possible to know the exact amount of carbon sequestered in EU waters550, the amount of carbon sequestered can be approximated by esti-mating the primary production rates (PPR), i.e. the production of marine phytoplankton that captures atmospheric carbon when it grows. There are different approaches to estimate PPR, and there-fore carbon sequestration, based on diverse methodologies (e.g. water incubation, remote sensing and numerical models). They all present a number of weaknesses and strengths.
Carbon sequestration varies substantially between the European Seas. Marine models551 were applied to estimate the annual amount of carbon uptaken by phytoplankton in the Greater North Sea as well as in the Mediterranean Sea. Both seas differ substan-tially with respect to the amount of carbon captured per square metre, with the North Sea ones being substantially higher due to the stronger growth of phytoplankton552.
Source: own elaboration from Macias and others (2020)553
550 Seagrass meadows are considered important natural carbon sinks due to their capacity to store organic carbon in sediments. Rough estimates consider that globally, seagrass sequesters approximately 10% of the carbon buried in ocean sediment annually. However, the spatial heterogeneity of carbon storage in seagrass sediments needs to be better understood to improve accuracy of Blue Carbon assessments. https://www.thebluecarboninitiative.org/about-blue-carbon. Ricart, A. M., York, P. H., Bryant, C. V., Rasheed, M. A., Ierodiaconou, D., & Macreadie, P. I. 2020. High variability of Blue Carbon storage in seagrass meadows at the estuary scale. Scientific reports, 10(1), 1-12.
551 Macias, D., Friedland, R., Stips, A., Miladinova, S., Parn, O., Garcia-Gorriz, E. and Melin, F. Applying the Marine Modelling Framework to estimate primary production in EU marine waters, EUR 30546 EN, Publications Office of the European Union, Luxembourg, 2020, ISBN 978-92-76-27860-3, doi:10.2760/19851.
552 Macias, D., Friedland, R., Stips, A., Miladinova, S., Parn, O., Garcia-Gorriz, E. and Melin, F. Applying the Marine Modelling Framework to estimate primary production in EU marine waters, EUR 30546 EN, Publications Office of the European Union, Luxembourg, 2020, ISBN 978-92-76-27860-3, doi:10.2760/19851.
553 Macias, D., Friedland, R., Stips, A., Miladinova, S., Parn, O., Garcia-Gorriz, E. and Melin, F. Applying the Marine Modelling Framework to estimate primary production in EU marine waters, EUR 30546 EN, Publications Office of the European Union, Luxembourg, 2020, ISBN 978-92-76-27860-3, doi:10.2760/19851.
554 The OECD proposed 30 €/tonne as the benchmark value of the low-end estimate of carbon costs today. OECD (2018), Effective Carbon Rates 2018: Pricing Carbon Emissions Through Taxes and Emissions Trading, OECD Publishing, Paris, https://doi.org/10.1787/9789264305304-en. See the 2020 EU Blue Economy Report for details.
Also within the regional seas, different gradient exist. For example, carbon sequestrations is stronger in the German and Danish waters compared to other parts of the North Sea. In the Mediterranean Sea, a West to East gradient occurs with highest primary production values in French and Spanish waters.
On the basis of carbon sequestration rates analysed in EU waters, the extrapolated total quantity carbon absorbed in each exclu-sive economic zone (EEZ) in the Greater North Sea and jurisdic-tional water in the Mediterranean Sea (i.e. about 2.1 million km2) amounts to 172.7 Mt/year, with 38.2 Mt/year (22.1%) coming from Italian waters. Assuming estimated carbon costs of €30 per tonne554, this ecosystem service would correspond to €5.18 billion per year (2.11 billion in the Greater North Sea and 3.07 billion in the Mediterranean Sea).
A wider extrapolation to the almost 6.1 million km2 of EU waters suggests that EU-27 waters could be sequestering nearly 500 Mt per year, worth almost €15 billion per year. Considering that carbon sequestration varies significantly by sea and gradient, as previously mentioned, further work is required to obtain more accurate estimates.
Figure 6.17 Estimated Net primary production per m2 (left) and upscaled to total amount of Carbon uptaken in the different EU-27 jurisdictional waters or EEZs of the Mediterranean Sea and the Greater North Sea
138
THE
EU B
LUE
ECO
NO
MY
REPO
RT

C h A p T E R 7REGIONAL AND
INTERNAT IONAL ANALYSES
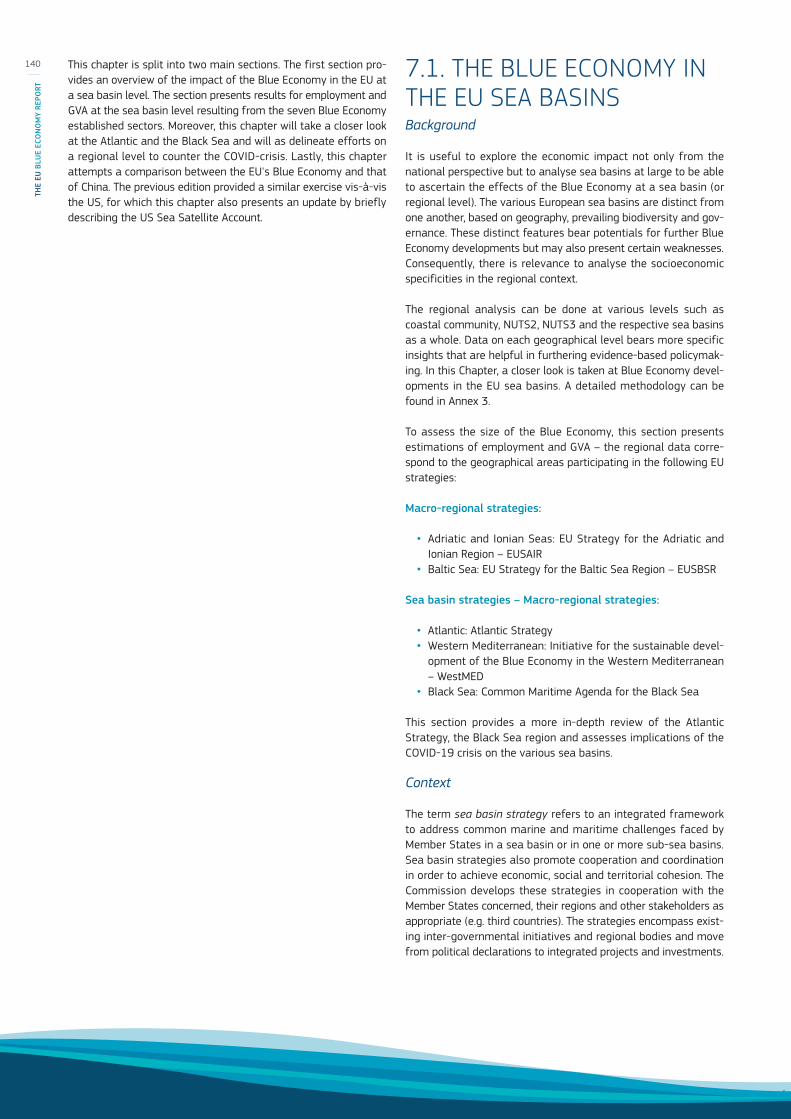
This chapter is split into two main sections. The first section pro-vides an overview of the impact of the Blue Economy in the EU at a sea basin level. The section presents results for employment and GVA at the sea basin level resulting from the seven Blue Economy established sectors. Moreover, this chapter will take a closer look at the Atlantic and the Black Sea and will as delineate efforts on a regional level to counter the COVID-crisis. Lastly, this chapter attempts a comparison between the EU's Blue Economy and that of China. The previous edition provided a similar exercise vis-à-vis the US, for which this chapter also presents an update by briefly describing the US Sea Satellite Account.
7.1. THE BLUE ECONOMY IN THE EU SEA BASINSBackground
It is useful to explore the economic impact not only from the national perspective but to analyse sea basins at large to be able to ascertain the effects of the Blue Economy at a sea basin (or regional level). The various European sea basins are distinct from one another, based on geography, prevailing biodiversity and gov-ernance. These distinct features bear potentials for further Blue Economy developments but may also present certain weaknesses. Consequently, there is relevance to analyse the socioeconomic specificities in the regional context.
The regional analysis can be done at various levels such as coastal community, NUTS2, NUTS3 and the respective sea basins as a whole. Data on each geographical level bears more specific insights that are helpful in furthering evidence-based policymak-ing. In this Chapter, a closer look is taken at Blue Economy devel-opments in the EU sea basins. A detailed methodology can be found in Annex 3.
To assess the size of the Blue Economy, this section presents estimations of employment and GVA – the regional data corre-spond to the geographical areas participating in the following EU strategies:
Macro-regional strategies:
• Adriatic and Ionian Seas: EU Strategy for the Adriatic and Ionian Region – EUSAIR
• Baltic Sea: EU Strategy for the Baltic Sea Region – EUSBSR
Sea basin strategies – Macro-regional strategies:
• Atlantic: Atlantic Strategy• Western Mediterranean: Initiative for the sustainable devel-
opment of the Blue Economy in the Western Mediterranean – WestMED
• Black Sea: Common Maritime Agenda for the Black Sea
This section provides a more in-depth review of the Atlantic Strategy, the Black Sea region and assesses implications of the COVID-19 crisis on the various sea basins.
Context
The term sea basin strategy refers to an integrated framework to address common marine and maritime challenges faced by Member States in a sea basin or in one or more sub-sea basins. Sea basin strategies also promote cooperation and coordination in order to achieve economic, social and territorial cohesion. The Commission develops these strategies in cooperation with the Member States concerned, their regions and other stakeholders as appropriate (e.g. third countries). The strategies encompass exist-ing inter-governmental initiatives and regional bodies and move from political declarations to integrated projects and investments.
140
THE
EU B
LUE
ECO
NO
MY
REPO
RT
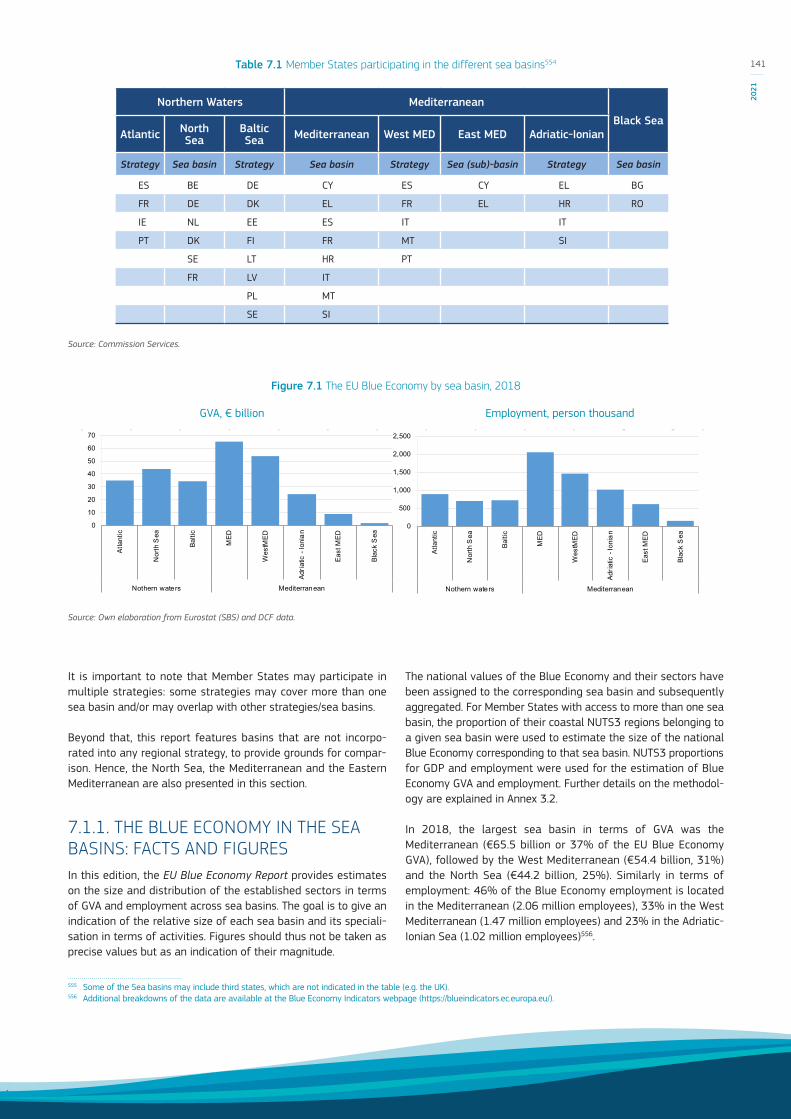
It is important to note that Member States may participate in multiple strategies: some strategies may cover more than one sea basin and/or may overlap with other strategies/sea basins.
Beyond that, this report features basins that are not incorpo-rated into any regional strategy, to provide grounds for compar-ison. Hence, the North Sea, the Mediterranean and the Eastern Mediterranean are also presented in this section. 555
7.1.1. THE BLUE ECONOMY IN THE SEA BASINS: FACTS AND FIGURESIn this edition, the EU Blue Economy Report provides estimates on the size and distribution of the established sectors in terms of GVA and employment across sea basins. The goal is to give an indication of the relative size of each sea basin and its speciali-sation in terms of activities. Figures should thus not be taken as precise values but as an indication of their magnitude.
555 Some of the Sea basins may include third states, which are not indicated in the table (e.g. the UK).556 Additional breakdowns of the data are available at the Blue Economy Indicators webpage (https://blueindicators.ec.europa.eu/).
The national values of the Blue Economy and their sectors have been assigned to the corresponding sea basin and subsequently aggregated. For Member States with access to more than one sea basin, the proportion of their coastal NUTS3 regions belonging to a given sea basin were used to estimate the size of the national Blue Economy corresponding to that sea basin. NUTS3 proportions for GDP and employment were used for the estimation of Blue Economy GVA and employment. Further details on the methodol-ogy are explained in Annex 3.2.
In 2018, the largest sea basin in terms of GVA was the Mediterranean (€65.5 billion or 37% of the EU Blue Economy GVA), followed by the West Mediterranean (€54.4 billion, 31%) and the North Sea (€44.2 billion, 25%). Similarly in terms of employment: 46% of the Blue Economy employment is located in the Mediterranean (2.06 million employees), 33% in the West Mediterranean (1.47 million employees) and 23% in the Adriatic-Ionian Sea (1.02 million employees)556.
Source: Commission Services.
Table 7.1 Member States participating in the different sea basins554
Northern Waters Mediterranean
Black SeaAtlantic North
SeaBaltic Sea Mediterranean West MED East MED Adriatic-Ionian
Strategy Sea basin Strategy Sea basin Strategy Sea (sub)-basin Strategy Sea basin
ES BE DE CY ES CY EL BG
FR DE DK EL FR EL HR RO
IE NL EE ES IT IT
PT DK FI FR MT SI
SE LT HR PT
FR LV IT
PL MT
SE SI
Figure 7.1 The EU Blue Economy by sea basin, 2018
Source: Own elaboration from Eurostat (SBS) and DCF data.
0
500
1,000
1,500
2,000
2,500At
lant
ic
Nor
th S
ea
Balti
c
MED
Wes
tMED
Adria
tic -
Ioni
an
East
MED
Blac
k S
ea
Nothern waters Mediterranean
0
10
20
30
40
50
60
70
Atla
ntic
Nor
th S
ea
Balti
c
MED
Wes
tMED
Adria
tic -
Ioni
an
East
MED
Blac
k S
ea
Nothern waters Mediterranean
GVA, € billion Employment, person thousand
141
2021

Figure 7.2 The Atlantic Ocean Strategy Blue Economy by sector, 2018
Source: Own elaboration from Eurostat (SBS) and DCF data.
Table 7.2 The EU Blue Economy by sea basin, GVA, € billion
Total Blue Economy 2009 2010 2011 2012 2013 2014 2015 2016 2017 2018
European Union 155.7 158.5 154.4 142.4 146.4 146.4 154.1 152.8 166.5 178.1 N
othe
rn
wat
ers Atlantic Ocean 17.2% 17.6% 19.2% 18.4% 18.8% 18.9% 18.4% 18.9% 18.9% 19.6%
North Sea 24.6% 24.9% 25.4% 27.5% 27.1% 26.8% 27.2% 25.6% 25.9% 24.8%
Baltic Sea 19.0% 20.7% 21.7% 22.5% 22.6% 22.4% 22.5% 20.4% 20.6% 19.5%
Med
iter
rane
an Mediterranean 39.8% 38.3% 35.7% 33.3% 33.2% 33.8% 33.8% 36.0% 35.8% 36.8%
West Mediterranean 28.5% 28.0% 27.6% 26.9% 27.0% 27.2% 27.5% 29.2% 28.9% 30.5%
Adriatic-Ionian Sea 17.6% 16.3% 13.7% 12.0% 11.9% 12.5% 12.4% 13.3% 13.6% 13.6%
East Mediterranean 9.1% 7.0% 5.4% 4.0% 4.3% 4.7% 4.3% 4.8% 5.2% 5.1%
Black Sea 1.6% 1.3% 1.4% 1.0% 1.0% 0.9% 1.0% 1.2% 1.0% 1.1%
Source: Own elaboration from Eurostat (SBS) and DCF data.
Table 7.3 The EU Blue Economy by sea basin, employment, person thousand
Total Blue Economy 2009 2010 2011 2012 2013 2014 2015 2016 2017 2018
European Union 4,454 4,184 3,838 3,486 3,560 3,617 3,576 3,797 3,991 4,477
Not
hern
w
ater
s Atlantic Ocean 17.6% 18.0% 18.6% 20.0% 20.3% 19.8% 19.8% 19.4% 19.8% 19.9%
North Sea 13.1% 14.2% 15.0% 16.0% 16.0% 16.2% 16.7% 16.2% 15.9% 15.6%
Baltic Sea 14.6% 16.0% 16.6% 18.2% 18.5% 18.1% 18.6% 17.8% 17.7% 16.1%
Med
iter
rane
an Mediterranean 47.8% 46.9% 44.2% 42.9% 42.7% 43.7% 42.5% 43.7% 44.5% 45.9%
West Mediterranean 31.4% 30.7% 30.6% 32.1% 31.9% 30.9% 31.6% 31.6% 31.9% 32.7%
Adriatic-Ionian Sea 24.4% 24.0% 21.0% 18.9% 19.0% 20.9% 19.3% 20.3% 21.3% 22.8%
East Mediterranean 13.8% 12.3% 10.3% 8.2% 9.3% 11.3% 10.0% 11.4% 12.0% 13.7%
Black Sea 8.4% 6.6% 7.3% 4.4% 4.2% 3.7% 3.8% 4.2% 3.4% 3.7%
Source: Own elaboration from Eurostat (SBS) and DCF data.
0
100
200
300
400
500
600
700
Coa
stal
tour
ism
Livi
ng re
sour
ces
Mar
itim
e tra
nspo
rt
Non
-livi
ng re
sour
ces
Oce
an e
nerg
y
Ports
act
ivitie
s
Ship
build
ing
and
repa
ir
0
5
10
15
20
25
Coa
stal
tour
ism
Livi
ng re
sour
ces
Mar
itim
e tra
nspo
rt
Non
-livi
ng re
sour
ces
Oce
an e
nerg
y
Ports
act
ivitie
s
Ship
build
ing
and
repa
ir
GVA, € billion Employment, person thousand
142
THE
EU B
LUE
ECO
NO
MY
REPO
RT
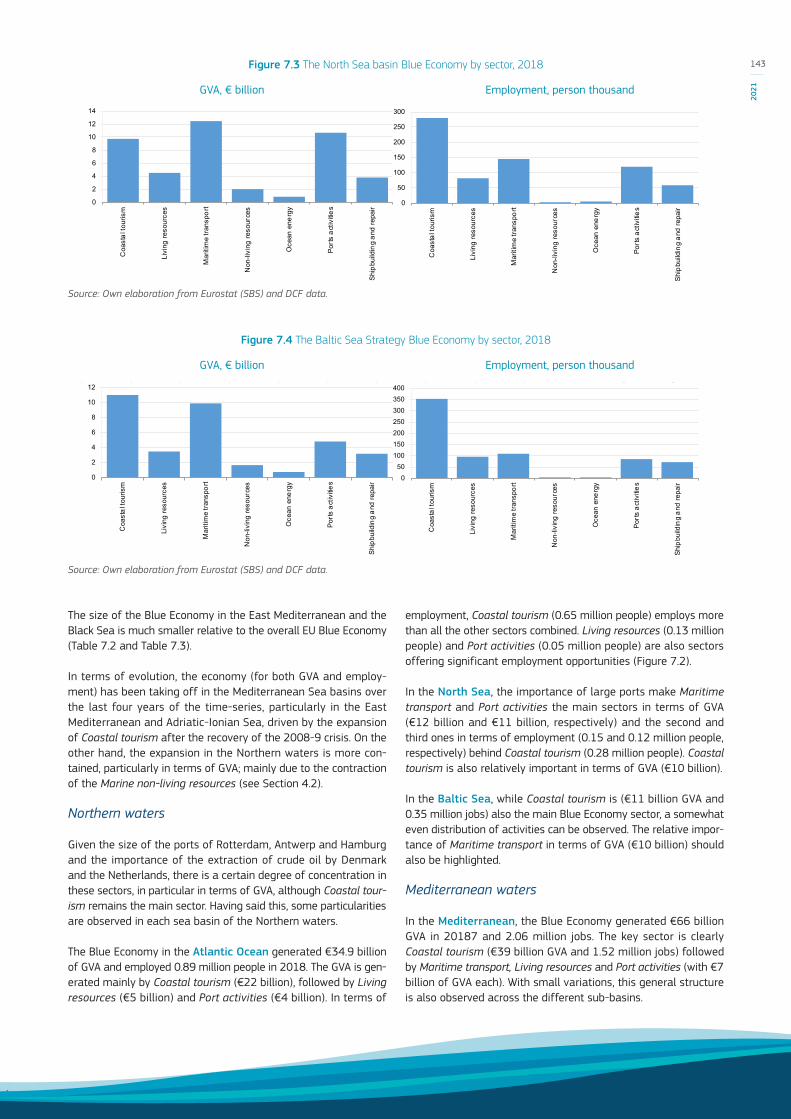
The size of the Blue Economy in the East Mediterranean and the Black Sea is much smaller relative to the overall EU Blue Economy (Table 7.2 and Table 7.3).
In terms of evolution, the economy (for both GVA and employ-ment) has been taking off in the Mediterranean Sea basins over the last four years of the time-series, particularly in the East Mediterranean and Adriatic-Ionian Sea, driven by the expansion of Coastal tourism after the recovery of the 2008-9 crisis. On the other hand, the expansion in the Northern waters is more con-tained, particularly in terms of GVA; mainly due to the contraction of the Marine non-living resources (see Section 4.2).
Northern waters
Given the size of the ports of Rotterdam, Antwerp and Hamburg and the importance of the extraction of crude oil by Denmark and the Netherlands, there is a certain degree of concentration in these sectors, in particular in terms of GVA, although Coastal tour-ism remains the main sector. Having said this, some particularities are observed in each sea basin of the Northern waters.
The Blue Economy in the Atlantic Ocean generated €34.9 billion of GVA and employed 0.89 million people in 2018. The GVA is gen-erated mainly by Coastal tourism (€22 billion), followed by Living resources (€5 billion) and Port activities (€4 billion). In terms of
employment, Coastal tourism (0.65 million people) employs more than all the other sectors combined. Living resources (0.13 million people) and Port activities (0.05 million people) are also sectors offering significant employment opportunities (Figure 7.2).
In the North Sea, the importance of large ports make Maritime transport and Port activities the main sectors in terms of GVA (€12 billion and €11 billion, respectively) and the second and third ones in terms of employment (0.15 and 0.12 million people, respectively) behind Coastal tourism (0.28 million people). Coastal tourism is also relatively important in terms of GVA (€10 billion).
In the Baltic Sea, while Coastal tourism is (€11 billion GVA and 0.35 million jobs) also the main Blue Economy sector, a somewhat even distribution of activities can be observed. The relative impor-tance of Maritime transport in terms of GVA (€10 billion) should also be highlighted.
Mediterranean waters
In the Mediterranean, the Blue Economy generated €66 billion GVA in 20187 and 2.06 million jobs. The key sector is clearly Coastal tourism (€39 billion GVA and 1.52 million jobs) followed by Maritime transport, Living resources and Port activities (with €7 billion of GVA each). With small variations, this general structure is also observed across the different sub-basins.
Figure 7.3 The North Sea basin Blue Economy by sector, 2018
Source: Own elaboration from Eurostat (SBS) and DCF data.
Figure 7.4 The Baltic Sea Strategy Blue Economy by sector, 2018
Source: Own elaboration from Eurostat (SBS) and DCF data.
0
50
100
150
200
250
300
Coa
sta
l tou
rism
Livi
ng r
esou
rces
Mar
itim
e tr
ansp
ort
Non
-livi
ng re
sour
ces
Oce
an e
nerg
y
Por
ts a
ctiv
itie
s
Shi
pbu
ildin
g a
nd r
epai
r
0
2
4
6
8
10
12
14C
oast
al t
ouris
m
Livi
ng r
esou
rces
Mar
itim
e tr
ansp
ort
Non
-livi
ng re
sour
ces
Oce
an e
nerg
y
Por
ts a
ctiv
itie
s
Shi
pbu
ildin
g a
nd r
epai
r
050
100150200250300350400
Coa
stal
tour
ism
Livi
ng re
sour
ces
Mar
itim
e tra
nspo
rt
Non
-livi
ng re
sour
ces
Oce
an e
nerg
y
Ports
act
ivitie
s
Ship
build
ing
and
repa
ir
0
2
4
6
8
10
12
Coa
stal
tour
ism
Livi
ng re
sour
ces
Mar
itim
e tra
nspo
rt
Non
-livi
ng re
sour
ces
Oce
an e
nerg
y
Ports
act
ivitie
s
Ship
build
ing
and
repa
ir
GVA, € billion Employment, person thousand
GVA, € billion Employment, person thousand
143
2021
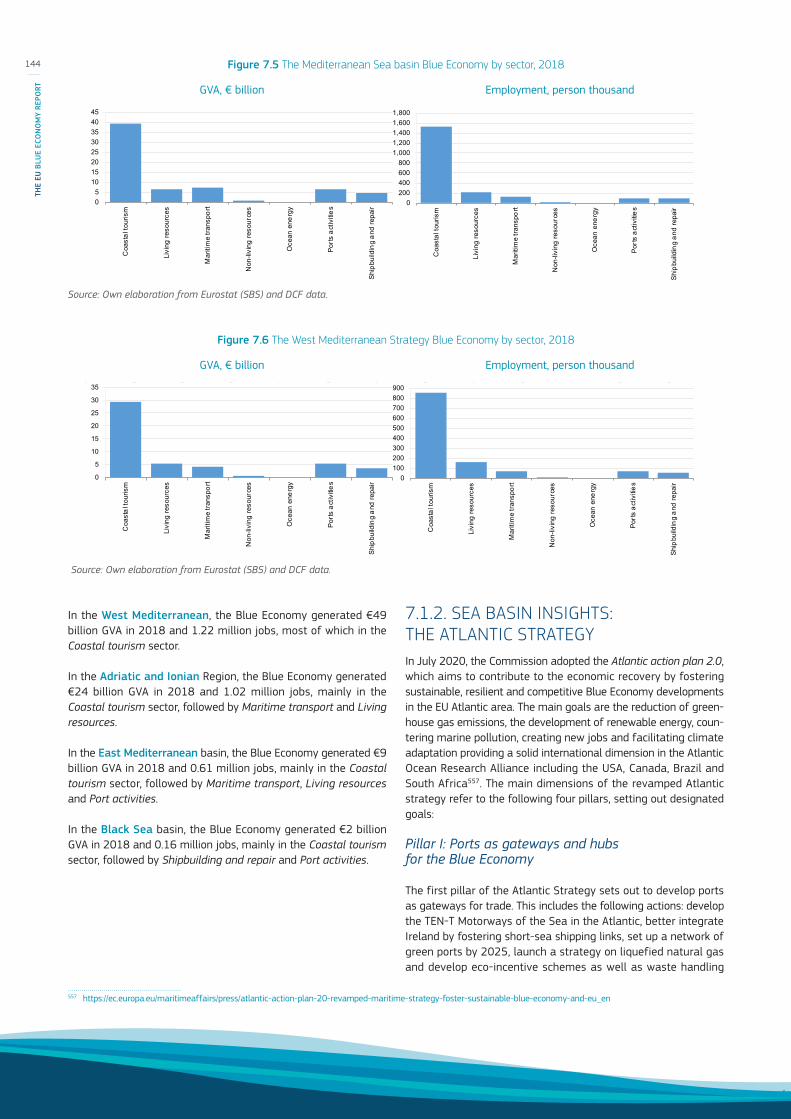
In the West Mediterranean, the Blue Economy generated €49 billion GVA in 2018 and 1.22 million jobs, most of which in the Coastal tourism sector.
In the Adriatic and Ionian Region, the Blue Economy generated €24 billion GVA in 2018 and 1.02 million jobs, mainly in the Coastal tourism sector, followed by Maritime transport and Living resources.
In the East Mediterranean basin, the Blue Economy generated €9 billion GVA in 2018 and 0.61 million jobs, mainly in the Coastal tourism sector, followed by Maritime transport, Living resources and Port activities.
In the Black Sea basin, the Blue Economy generated €2 billion GVA in 2018 and 0.16 million jobs, mainly in the Coastal tourism sector, followed by Shipbuilding and repair and Port activities.
557 https://ec.europa.eu/maritimeaffairs/press/atlantic-action-plan-20-revamped-maritime-strategy-foster-sustainable-blue-economy-and-eu_en
7.1.2. SEA BASIN INSIGHTS: THE ATLANTIC STRATEGY In July 2020, the Commission adopted the Atlantic action plan 2.0, which aims to contribute to the economic recovery by fostering sustainable, resilient and competitive Blue Economy developments in the EU Atlantic area. The main goals are the reduction of green-house gas emissions, the development of renewable energy, coun-tering marine pollution, creating new jobs and facilitating climate adaptation providing a solid international dimension in the Atlantic Ocean Research Alliance including the USA, Canada, Brazil and South Africa557. The main dimensions of the revamped Atlantic strategy refer to the following four pillars, setting out designated goals:
Pillar I: Ports as gateways and hubs for the Blue Economy
The first pillar of the Atlantic Strategy sets out to develop ports as gateways for trade. This includes the following actions: develop the TEN-T Motorways of the Sea in the Atlantic, better integrate Ireland by fostering short-sea shipping links, set up a network of green ports by 2025, launch a strategy on liquefied natural gas and develop eco-incentive schemes as well as waste handling
Figure 7.5 The Mediterranean Sea basin Blue Economy by sector, 2018
Source: Own elaboration from Eurostat (SBS) and DCF data.
Figure 7.6 The West Mediterranean Strategy Blue Economy by sector, 2018
Source: Own elaboration from Eurostat (SBS) and DCF data.
0200400600800
1,0001,2001,4001,6001,800
Coa
sta
l tou
rism
Livi
ng r
esou
rces
Mar
itim
e tr
ansp
ort
Non
-livi
ng re
sour
ces
Oce
an e
nerg
y
Por
ts a
ctiv
itie
s
Shi
pbu
ildin
g a
nd r
epai
r
05
1015202530354045
Coa
sta
l tou
rism
Livi
ng r
esou
rces
Mar
itim
e tr
ansp
ort
Non
-livi
ng re
sour
ces
Oce
an e
nerg
y
Por
ts a
ctiv
itie
s
Shi
pbu
ildin
g a
nd r
epai
r
0100200300400500600700800900
Coa
sta
l tou
rism
Livi
ng r
esou
rces
Mar
itim
e tr
ansp
ort
Non
-livi
ng re
sour
ces
Oce
an e
nerg
y
Por
ts a
ctiv
itie
s
Shi
pbu
ildin
g a
nd r
epai
r
0
5
10
15
20
25
30
35
Coa
sta
l tou
rism
Livi
ng r
esou
rces
Mar
itim
e tr
ansp
ort
Non
-livi
ng re
sour
ces
Oce
an e
nerg
y
Por
ts a
ctiv
itie
s
Shi
pbu
ildin
g a
nd r
epai
r
GVA, € billion Employment, person thousand
GVA, € billion Employment, person thousand
144
THE
EU B
LUE
ECO
NO
MY
REPO
RT
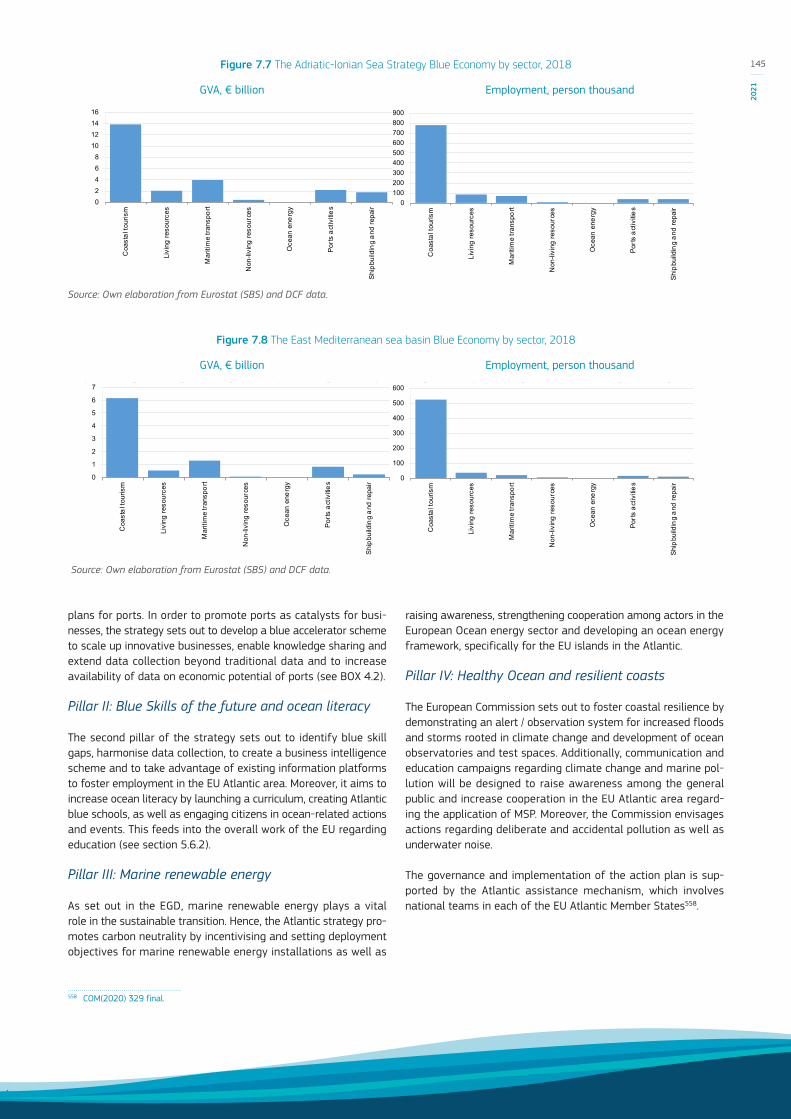
plans for ports. In order to promote ports as catalysts for busi-nesses, the strategy sets out to develop a blue accelerator scheme to scale up innovative businesses, enable knowledge sharing and extend data collection beyond traditional data and to increase availability of data on economic potential of ports (see BOX 4.2).
Pillar II: Blue Skills of the future and ocean literacy
The second pillar of the strategy sets out to identify blue skill gaps, harmonise data collection, to create a business intelligence scheme and to take advantage of existing information platforms to foster employment in the EU Atlantic area. Moreover, it aims to increase ocean literacy by launching a curriculum, creating Atlantic blue schools, as well as engaging citizens in ocean-related actions and events. This feeds into the overall work of the EU regarding education (see section 5.6.2).
Pillar III: Marine renewable energy
As set out in the EGD, marine renewable energy plays a vital role in the sustainable transition. Hence, the Atlantic strategy pro-motes carbon neutrality by incentivising and setting deployment objectives for marine renewable energy installations as well as
558 COM(2020) 329 final.
raising awareness, strengthening cooperation among actors in the European Ocean energy sector and developing an ocean energy framework, specifically for the EU islands in the Atlantic.
Pillar IV: Healthy Ocean and resilient coasts
The European Commission sets out to foster coastal resilience by demonstrating an alert / observation system for increased floods and storms rooted in climate change and development of ocean observatories and test spaces. Additionally, communication and education campaigns regarding climate change and marine pol-lution will be designed to raise awareness among the general public and increase cooperation in the EU Atlantic area regard-ing the application of MSP. Moreover, the Commission envisages actions regarding deliberate and accidental pollution as well as underwater noise.
The governance and implementation of the action plan is sup-ported by the Atlantic assistance mechanism, which involves national teams in each of the EU Atlantic Member States558.
Figure 7.7 The Adriatic-Ionian Sea Strategy Blue Economy by sector, 2018
Source: Own elaboration from Eurostat (SBS) and DCF data.
Figure 7.8 The East Mediterranean sea basin Blue Economy by sector, 2018
Source: Own elaboration from Eurostat (SBS) and DCF data.
0100200300400500600700800900
Coa
sta
l tou
rism
Livi
ng r
esou
rces
Mar
itim
e tr
ansp
ort
Non
-livi
ng re
sour
ces
Oce
an e
nerg
y
Por
ts a
ctiv
itie
s
Shi
pbu
ildin
g a
nd r
epai
r
02468
10121416
Coa
sta
l tou
rism
Livi
ng r
esou
rces
Mar
itim
e tr
ansp
ort
Non
-livi
ng re
sour
ces
Oce
an e
nerg
y
Por
ts a
ctiv
itie
s
Shi
pbu
ildin
g a
nd r
epai
r
0
100
200
300
400
500
600
Coa
sta
l tou
rism
Livi
ng r
esou
rces
Mar
itim
e tr
ansp
ort
Non
-livi
ng re
sour
ces
Oce
an e
nerg
y
Por
ts a
ctiv
itie
s
Shi
pbu
ildin
g a
nd r
epai
r
0
1
2
3
4
5
6
7
Coa
sta
l tou
rism
Livi
ng r
esou
rces
Mar
itim
e tr
ansp
ort
Non
-livi
ng re
sour
ces
Oce
an e
nerg
y
Por
ts a
ctiv
itie
s
Shi
pbu
ildin
g a
nd r
epai
r
GVA, € billion Employment, person thousand
GVA, € billion Employment, person thousand
145
2021
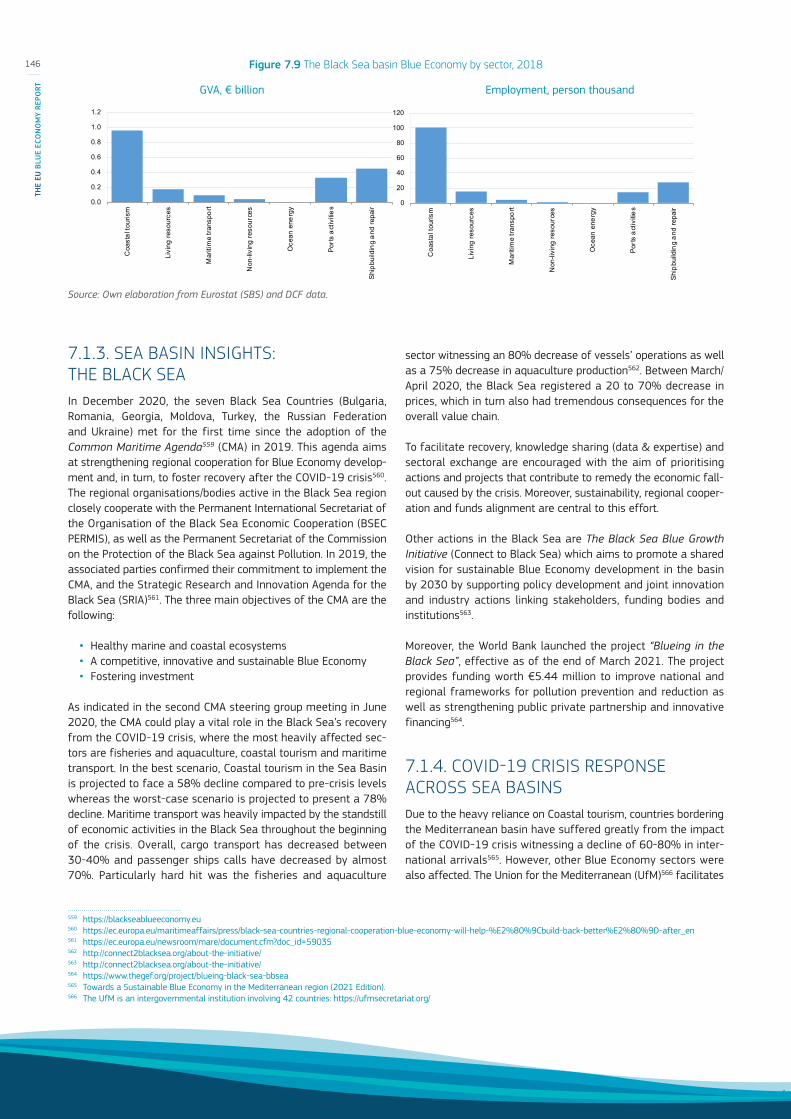
7.1.3. SEA BASIN INSIGHTS: THE BLACK SEAIn December 2020, the seven Black Sea Countries (Bulgaria, Romania, Georgia, Moldova, Turkey, the Russian Federation and Ukraine) met for the first time since the adoption of the Common Maritime Agenda559 (CMA) in 2019. This agenda aims at strengthening regional cooperation for Blue Economy develop-ment and, in turn, to foster recovery after the COVID-19 crisis560. The regional organisations/bodies active in the Black Sea region closely cooperate with the Permanent International Secretariat of the Organisation of the Black Sea Economic Cooperation (BSEC PERMIS), as well as the Permanent Secretariat of the Commission on the Protection of the Black Sea against Pollution. In 2019, the associated parties confirmed their commitment to implement the CMA, and the Strategic Research and Innovation Agenda for the Black Sea (SRIA)561. The three main objectives of the CMA are the following:
• Healthy marine and coastal ecosystems• A competitive, innovative and sustainable Blue Economy• Fostering investment
As indicated in the second CMA steering group meeting in June 2020, the CMA could play a vital role in the Black Sea’s recovery from the COVID-19 crisis, where the most heavily affected sec-tors are fisheries and aquaculture, coastal tourism and maritime transport. In the best scenario, Coastal tourism in the Sea Basin is projected to face a 58% decline compared to pre-crisis levels whereas the worst-case scenario is projected to present a 78% decline. Maritime transport was heavily impacted by the standstill of economic activities in the Black Sea throughout the beginning of the crisis. Overall, cargo transport has decreased between 30-40% and passenger ships calls have decreased by almost 70%. Particularly hard hit was the fisheries and aquaculture
559 https://blackseablueeconomy.eu560 https://ec.europa.eu/maritimeaffairs/press/black-sea-countries-regional-cooperation-blue-economy-will-help-%E2%80%9Cbuild-back-better%E2%80%9D-after_en561 https://ec.europa.eu/newsroom/mare/document.cfm?doc_id=59035562 http://connect2blacksea.org/about-the-initiative/563 http://connect2blacksea.org/about-the-initiative/564 https://www.thegef.org/project/blueing-black-sea-bbsea565 Towards a Sustainable Blue Economy in the Mediterranean region (2021 Edition).566 The UfM is an intergovernmental institution involving 42 countries: https://ufmsecretariat.org/
sector witnessing an 80% decrease of vessels’ operations as well as a 75% decrease in aquaculture production562. Between March/April 2020, the Black Sea registered a 20 to 70% decrease in prices, which in turn also had tremendous consequences for the overall value chain.
To facilitate recovery, knowledge sharing (data & expertise) and sectoral exchange are encouraged with the aim of prioritising actions and projects that contribute to remedy the economic fall-out caused by the crisis. Moreover, sustainability, regional cooper-ation and funds alignment are central to this effort.
Other actions in the Black Sea are The Black Sea Blue Growth Initiative (Connect to Black Sea) which aims to promote a shared vision for sustainable Blue Economy development in the basin by 2030 by supporting policy development and joint innovation and industry actions linking stakeholders, funding bodies and institutions563.
Moreover, the World Bank launched the project “Blueing in the Black Sea”, effective as of the end of March 2021. The project provides funding worth €5.44 million to improve national and regional frameworks for pollution prevention and reduction as well as strengthening public private partnership and innovative financing564.
7.1.4. COVID-19 CRISIS RESPONSE ACROSS SEA BASINS Due to the heavy reliance on Coastal tourism, countries bordering the Mediterranean basin have suffered greatly from the impact of the COVID-19 crisis witnessing a decline of 60-80% in inter-national arrivals565. However, other Blue Economy sectors were also affected. The Union for the Mediterranean (UfM)566 facilitates
Figure 7.9 The Black Sea basin Blue Economy by sector, 2018
Source: Own elaboration from Eurostat (SBS) and DCF data.
0
20
40
60
80
100
120
Coa
sta
l tou
rism
Livi
ng r
esou
rces
Mar
itim
e tr
ansp
ort
Non
-livi
ng re
sour
ces
Oce
an e
nerg
y
Por
ts a
ctiv
itie
s
Shi
pbu
ildin
g a
nd r
epai
r
0.0
0.2
0.4
0.6
0.8
1.0
1.2
Coa
sta
l tou
rism
Livi
ng r
esou
rces
Mar
itim
e tr
ansp
ort
Non
-livi
ng re
sour
ces
Oce
an e
nerg
y
Por
ts a
ctiv
itie
s
Shi
pbu
ildin
g a
nd r
epai
r
GVA, € billion Employment, person thousand
146
THE
EU B
LUE
ECO
NO
MY
REPO
RT
the recovery by specifically targeting women and youth employ-ability with their flagship cross-sector initiative Med4Jobs567. It is important to note that the UfM does not exclusively address the Blue Economy sectors per se, but rather aims to promote stability, human development and integration across the region.
Moreover, the German Corporation for International Cooperation (GIZ) supports these efforts by co-financing a grant scheme for employment promotion568. The priorities of this particular grant scheme include:
• Improving economic resilience of citizens (especially more vulnerable groups through employment-related capacity development)
• Promoting new channels of training and skills attainment to foster employability and economic activity
• Supporting entrepreneurial activities and building the capacities of Micro, Small & Medium Enterprises (MSMEs) to enable income and job generation
Beyond that, the EU Strategy for the Adriatic and Ionian Region (EUSAIR) adopted the updated Action Plan in April 2020 to posi-tively contribute to the recovery by569:
• Fostering Blue Growth (Blue technologies, fisheries and aquaculture, maritime and marine governance)
• Connecting the region (Maritime transport, intermodal con-nections to the hinterland & energy networks)
• Ensuring environmental quality (marine environment & biodiversity)
• Sustainable tourism (diversify offer, foster sustainable tour-ism practices)
As per the EUSAIR, the EU Strategy for the Baltic Sea Region (EUSBSR) adopted an updated Action Plan with the aim of facil-itating a green and digital transition and to inform investments under the 2021-2027 programming period of the Cohesion policy. Moreover, a Sea Strategy Point was established with the aim to facilitate capacity building and knowledge exchange570.
To conclude, the various sea basins tackle the fallout from the crisis slightly differently based on the challenges that are faced by the respective key sectors.
567 https://ufmsecretariat.org/project/mediterranean-initiative-for-jobs-med4jobs/568 https://ufmsecretariat.org/wp-content/uploads/2020/07/UfM-brochure-grant.pdf569 SWD(2020) 57 final.570 https://ec.europa.eu/regional_policy/en/newsroom/news/2021/02/17-02-2021-new-action-plan-of-the-eusbsr-macro-regional-strategy-for-boosting-resilience-and-
recovery-in-the-baltic-sea-region571 The main source for this section is a 2018 publication is To, Wai-Ming; Lee, Peter K.C. 2018. "China’s Maritime Economic Development: A Review, the Future Trend, and
Sustainability Implications" Sustainability 10, no. 12: 4844. https://doi.org/10.3390/su10124844.572 To, Wai-Ming; Lee, Peter K.C. 2018. "China’s Maritime Economic Development: A Review, the Future Trend, and Sustainability Implications" Sustainability 10, no. 12: 4844.
https://doi.org/10.3390/su10124844.
7.2. BLUE ECONOMY: THE INTERNATIONAL DIMENSIONThe previous edition of this report sought to present the US Blue economy in contrast with that of the EU. This year, a similar attempt is made vis-a-vis the Chinese Blue Economy. Although the goal of the EU Blue Economy Report is to provide information on the state of the EU Blue Economy, assessing what is being done at the international level is key, to fully comprehend the bigger pic-ture. It is for this reason that this section was initially introduced.
7.2.1. THE BLUE ECONOMY IN CHINA571
China, with its 32 000 km coastline, has extensive access to marine resources and, like the US, is one of the EU's main counter-parts when it comes to the Blue Economy. China's maritime econ-omy has rapidly grown over the last decade. The Standardisation Administration of China defines the maritime economy as the exploitation, use and protection of oceanic resources and asso-ciated activities572.
Since 1953, China follows detailed economic development guidelines in the form of five-year Plans for National and Social Development. The 12th five-year plan (2011-15) included for the first time actions for developing the maritime economy. “Strengthening the marine economy” was confirmed in the 13th 5-year plan (2016-2020). As a result, a need for data for the Blue economy sectors has grown significantly. China refers to the Blue Economy mostly as the "maritime" economy or at times "ocean economy". These terms are used interchangeably.
Scope and classification
China has a long list of maritime activities, most of which have an EU equivalent and tend to include roughly similar sub-sectors and activities. China's most important maritime sectors are mainly those that the EU Blue Economy report categorises as established sectors. In addition, other sectors offer significant contributions. Table 7.5 shows the key Chinese maritime sectors, and their EU equivalent. The EU emerging sectors also have an equivalent in China; however, for practical purposes they have not been included here (unless considered as main sectors of China's Blue Economy) since this section focuses mainly on the established sectors for which there is abundant and more accurate data, making the EU-China comparison more feasible.
147
2021

Table 7.5 China vs EU Blue Economy sector equivalents573.
China Marine Economy Sectors EU Blue Economy SectorsMarine Fishery Marine living resources
Offshore oil & gas
Marine non-living resourcesOcean mining
Marine salt
Shipbuilding Shipbuilding and repair
Coastal tourism Coastal tourism
Marine engineering, architecture and construction Port, warehousing and water projects
Marine electric power Marine renewable energy
Marine communications and transportation Maritime transport
Marine biomedicine Blue bioeconomy and biotechnology
Seawater utilisation Desalination
Marine chemical No direct equivalent
Note: Under the EU Blue Economy report the equivalent to China's Marine biomedicine and Seawater utilisation fall under emerging sectors and hence have not been included in the figures for the established sectors analysis and comparison.Source: EU sectors as featured in this report, Commission Services, Sectors as featured in Xiaohui (2016) "The Ocean Economic Statistical System of China and Understanding of the Blue Economy"
573 For a full list of sectors, codes and categories please refer to the following: for China Wang, Xiaohui (2016) "The Ocean Economic Statistical System of China and Understanding of the Blue Economy," Journal of Ocean and Coastal Economics: Vol. 2: Iss. 2, Article 10. DOI: https://doi.org/10.15351/2373-8456.1055, for the EU https://blueindicators.ec.europa.eu/published-reports_en, Methodology: https://blueindicators.ec.europa.eu/sites/default/files/annex_ii_methodological_framework.pdf
Table 7.4 Marine Economy Framework - Classification.
Source: W. Song, National Marine Data and Information Service (NMDIS), Ministry of Natural Resources, China.
Marine industryMarine scientific
research and education
Marine public governance and service
Marine backward industry Marine forward industry
1. Marine Fishery1. Marine scientific
research1. Marine governance
1. Marine-related equipment manufactural
1. Marine-related product processing
2. Coastal tidal and planting 2. Marine education2. Marine team
and international organization
2. Marine-related material manufactural
2. Marine product wholesale and retail
3. Marine aquatic products processing
3. Marine tech service3. Marine-related
operating and service
4. Marine oil and natural gas 4. Marine information service
5. Marine mineral5. Marine bio-environment
protection and recovering
6. Marine salt6. Marine geographic
prospecting
7. Marine ship building
8. Marine engineering equipment manufactural
9. Marine chemical
10. Marine medicine and biological products
11. Marine engineering construction
12. Marine electricity
13. Marine desalination and comprehensive utilization
14. Marine transportation
15. Marine tourism
148
THE
EU B
LUE
ECO
NO
MY
REPO
RT
The ocean economy, as defined by China’s State Oceanic Administration’s Industrial Classification for Ocean industries and their related activities, is the summation of both of ocean indus-tries (e.g. marine shipbuilding, marine transportation) and ocean related industries (e.g. wholesale and retail, marine equipment production)574. In other words, all industrial activities that explore, use and protect the ocean, and the activities related to them, are included in the Chinese definition of ocean or marine economy.
The national industry classification has been revised in 2017. As a result of two marine industry surveys, in 2014 and 2019, the new ocean-related inventory according to the industry classification is illustrated in Table 7.4.
From a sectoral perspective, the main, established industries in China comprise marine fishery, offshore oil and gas, ocean mining, marine salt, shipbuilding, the marine chemical industry, marine biomedicine, marine engineering, marine electric power, the seawater utilisation industry, marine communications and transportation and coastal tourism575. These are often split into three main sectors: primary, secondary, and tertiary. The primary sector includes marine living-resources (fisheries, aquaculture and processing). The secondary sector includes the salt industry, offshore oil and gas, non-living resources, shipbuilding, and blue biomedicine. The tertiary sector includes maritime transport and coastal tourism576.
Economic performance577
China's Blue Economy has been growing fast throughout the last year's only suffering greatly in 2009 with the economic crises, much like the EU and the rest of the world. The crisis mainly had an impact on the maritime transport and the marine non-living resources (especially offshore oil and gas578) sectors. In spite of this, the Chinese Blue Economy recovered, and has mostly seen an upward trend since.
According to available data, the total production value of China’s maritime economy increased from €429 billion in 2010 to €1 018 billion in 2017, thus contributing to about 10% of China’s total GDP and is expected to reach 15% by 2030579. However, when considering only the six established sectors with an EU equivalent, this amount is €394.2 billion. In contrast, the Blue Economy in the EU represented 1.3% of the overall economy with €179.7 billion for the same period580.
574 Zhao, Rui & Hynes, Stephen & Shun He, Guang, 2014. "Defining and quantifying China's ocean economy," Marine Policy, Elsevier, vol. 43(C), pages 164-173. doi:10.1016/j.marpol.2013.05.008.
575 Wang, Xiaohui (2016) "The Ocean Economic Statistical System of China and Understanding of the Blue Economy," Journal of Ocean and Coastal Economics: Vol. 2: Iss. 2, Article 10. DOI: https://doi.org/10.15351/2373-8456.1055.
576 To, Wai-Ming; Lee, Peter K.C. 2018. "China’s Maritime Economic Development: A Review, the Future Trend, and Sustainability Implications" Sustainability 10, no. 12: 4844. https://doi.org/10.3390/su10124844.
577 Note that all figures for China were provided in local currency and have been converted into Euro using the ECB average exchange rate for the year to which the data refer.578 Note: In the Chinese Industry Classification System, chemical extraction/processing is considered a secondary industry. As such, “marine chemical” could either (or partly) be
considered as part of “marine non-living resources” (insofar as it refers to NACE code B8.9.1 - Mining of chemical and fertiliser minerals) or (partly) be included in the blue biotechnology (insofar as it refers to NACE code M72.1.1 - Research and experimental development on biotechnology).
579 Choi, Y. R. (2017) ‘The Blue Economy as governmentality and the making of new spatial rationalities’, Dialogues in Human Geography, 7(1), pp. 37–41. doi: 10.1177/2043820617691649.
580 European Commission (2019). The EU Blue Economy Report. 2019. Publications Office of the European Union. Luxembourg.581 To, Wai-Ming; Lee, Peter K.C. 2018. "China’s Maritime Economic Development: A Review, the Future Trend, and Sustainability Implications" Sustainability 10, no. 12: 4844.
https://doi.org/10.3390/su10124844.582 The comparison is between GDP and GVA because China uses GDP at market prices as an indicator where the BER uses GVA (i.e. at factor costs). This difference can be
seen as minor and do not jeopardise the comparison of the general magnitude and figures.583 Zhao, Rui & Hynes, Stephen & Shun He, Guang, 2014. "Defining and quantifying China's ocean economy," Marine Policy, Elsevier, vol. 43(C), pages 164-173. doi:10.1016/j.
marpol.2013.05.008.584 European Commission (2019). The EU Blue Economy Report. 2019. Publications Office of the European Union. Luxembourg.585 Zhao, Rui & Hynes, Stephen & Shun He, Guang, 2014. "Defining and quantifying China's ocean economy," Marine Policy, Elsevier, vol. 43(C), pages 164-173. doi:10.1016/j.
Table 1581 presents details of China’s maritime economy for the period of 2010 to 2017. The primary sector increased from €23 billion in 2010 to €47 billion in 2017. The secondary sector from €202 billion in 2010 to €395 billion in 2017 while the ter-tiary sector increased from €204 billion in 2010 to €576 billion in 2017. In terms of percentage of total maritime economy, in 2017, the primary sector represented 4.6%, the secondary 38.8% and the tertiary 56.6%, meaning maritime transport and costal tourism together contributed to over half of the total Chinese Blue Economy.
If broken down into main sectors. In 2017, Coastal tourism is by far the largest Chinese Blue Economy sector, worth €192 billion in 2017, followed by maritime transport, which contributed €82.8 billion to China’s GDP582. When confronted with EU data for the same year, it can be seen that although the figures are very dif-ferent and the Chinese Blue Economy is much larger, the contri-bution of most sectors coincides. Coastal tourism and Maritime transport were also the two largest contributors in terms of GVA in the EU (€76.2 and €35.6 billion, respectively).
The third largest sector in terms of GDP was marine fisheries, aquaculture, and their associated services industries (i.e. marine living resources) amounting to €61.3 billion. In contrast, the third most important sector in 2017 in the EU was Port Activities with a GVA of €35.2 billion. The living resources sector came fourth rep-resenting roughly a third of that of China (€21.1 billion). The other four include marine engineering architecture, marine shipbuilding, offshore oil and gas, and marine chemical industries contributing between €13.6 billion and €24.1 billion to China’s GDP (Table 7.5). In 2017, the sectors, which contributed the least to the EU and Chinese economy, were the non-living resources and shipbuilding. For the latter, the overall contribution was €19.1 billion in China and €17.1 in the EU.
China's major ocean industries employed approximately 9.25 mil-lion people in 2010583, whereas the EU Blue Economy employed around 3.64 million individuals584. The marine living-resources sector is a major sector, employing around 14 million people in 2017 a substantial increase from 2010, when it was slightly over 5.5 million585. In 2017, employment in the Marine living resources sector in the EU was at 570 000.
In terms of how much each sector represented in the Blue Economy as whole, Coastal tourism was the most significant
149
2021

in both regions, representing 48.7% (€192 billion) in China and 37.2% (€76.2 billion) in the EU. While generally most Blue Economy sectors in China represent a larger proportion of their Blue Economy than their EU counterparts, there are some excep-tions. Shipbuilding represented 8.4% (€17.1 billion) of the EU's total Blue Economy, while in China the sectors represented 4.8% (€19.1 billion) instead.
Table 7.6 GDP and GVA comparison586 between the EU and the China per established sector, 2017587
SectorGDP (€ billion) GVA (€ billion)
CN EU
Living-resources 61.3 21.1
Shipbuilding 19.1 17.1
Coastal tourism 192 76.2
Maritime Transport 82.8 35.6
Non-living resources 14.8 19.4
EU Port Activities n/a 35.2
CN Marine constructions 24.2 n/a
TOTAL 394.2 204.6
Note: For China, the non-living resources sector only includes extraction of oil and gas Note: the comparison is between GDP and GVA because China uses GDP at market prices as an indicator where the BER uses GVA (i.e. at factor costs). This difference can be seen as minor and do not jeopardise the comparison of the general magni-tude and figures.Source: BE report 2020 and China’s Maritime Economic Development: A Review, the Future Trend, and Sustainability Implications – 2018 (original source SOA).
Emerging sectors
The emerging sectors of the Blue Economy were not within the scope of this section. This is mainly because for the EU, the data available is not normally comparable (i.e. different sectors have data for only some indicators or only some years). Two of the EU's emerging sectors Blue Bio economy / Biotechnology and Desalination have a Chinese equivalent (marine biomedicine and seawater utilisation respectively). China places these sec-tors under main (established) sectors as they have significant impact on its maritime economy; this is not the case for the EU. Nevertheless, it is worth highlighting some of the latest develop-ments regarding these sectors.
marpol.2013.05.008.586 It should be noted that the comparison is between GDP and GVA because China uses GDP at market prices as an indicator where the BER uses GVA (i.e. at factor costs).
This difference can be seen as minor and do not jeopardise the comparison of the general magnitude and figures.587 Chinese figures have been converted into Euro using the average currency exchange rate for the year of analysis (0.117, for 2010, 0.1312 for 2017 and 0.1293 for 2019),
as provided by European Central Bank (ECB): https://www.ecb.europa.eu/stats/policy_and_exchange_rates/euro_reference_exchange_rates/html/eurofxref-graph-cny.en.html 588 Wang, Xiaohui (2016) "The Ocean Economic Statistical System of China and Understanding of the Blue Economy," Journal of Ocean and Coastal Economics: Vol. 2: Iss. 2,
Article 10. DOI: https://doi.org/10.15351/2373-8456.1055.589 European Commission (2019). The EU Blue Economy Report. 2019. Publications Office of the European Union. Luxembourg.
China's 12th five-Year Plan specifically addressed and sought to promote the development of seawater desalination and Marine biomedicine. Specifically, the 12th Five-Year Plan for Bio-industrial Development highlighted the importance of developing the Marine biomedicine sector. The Seawater Desalination Plan sets a target for 2015, to reach more than 2.2 million m3/day588 for Europe the figure for 2017/2018 was around 9 million m3/day589.
It is should also be noted that contrary to the EU, China does not include Maritime defence (i.e. Navy) in its Blue Economy statistics, although it may include some elements of surveillance and safety under some of the more minor sectors.
Conclusions
Comparing the Chinese and EU Blue Economy is a complex task, not only because the respective classifications include different sectors, whose size and impact vary greatly, but also because accessing data sets, which are accurate and comparable across time and sectors remains a challenge. Nevertheless, this section has attempted to provide a broad overview of the Chinese Blue Economy, its main sectors, how these compare to the EU, and what their contribution to the economy is.
As regards the Blue Economy's contribution to the overall national economy, that of China is significantly greater, as are the figures produced by the individual established sectors. However, similari-ties can be observed in terms of sectors with the most impact, i.e., Coastal tourism and Maritime transport for both the EU and China. Overall, China's established sectors contribute to its economy at a larger scale, however, the EU's shipbuilding sector represents a higher proportion of its overall Blue Economy than its Chinese equivalent.
Key differences in sectors exist, with the Desalination (Seawater utilisation) sector and Biomedicine (Blue biotechnology) being con-sidered major sectors for China, whereas small in the EU. Finally, the non-living resources statistic for China tend to only include extraction of oil and gas, differing from its EU counterpart.
150
THE
EU B
LUE
ECO
NO
MY
REPO
RT

7.2.2. THE US SEA SATELLITE ACCOUNT
The previous edition of this report (2020) included a comparison between the EU and US Blue Economy. This edition briefly pre-sents the US satellite account system. A system that has also been developed by other countries, such as Portugal and Ireland. An illustration of what these accounts are, what they entail and how they function using the US as an example follows. It should be noted that the Commission services are currently assess-ing whether setting up a similar EU system is indeed feasible. Thereafter, a brief update with the latest US figures in contrast with those of the EU.
Background, scope and process
Together with the National Oceanic and Atmospheric Administration (NOAA), the Bureau of Economic Analysis (BEA) has developed prototype statistics to measure the ocean’s contribution to the U.S. economy. Ocean Economic activities exists within BEA’s national accounts, but are not always evident within the standard national accounts structure. A satellite account is a framework that corresponds to national accounts where detailed parts of it have been extracted and reorganised to provide an overview of a concrete area of the economy.
The ocean economy prototype statis tics that BEA has developed do not include the real estimates, price measures, and other in-formation that a full BEA satellite account contains; however, they were constructed follow ing the same techniques used to construct BEA’s other satellite accounts590.
In order to set the system up, NOAA developed a conceptual defi-nition of ocean economy, identifying the concrete goods/ services relevant to it (within BEA’s supply-use framework) and BEA then identified and defined the activities associated with the Blue Economy. Following this, BEA and NOAA estimated the maritime ocean-related proportion of the various activities/services. Finally, BEA identified the industries producing or providing the goods and services, and measured the output, value added, compensation, and employment linked with it.
590 The Bureau of Economic Analysis (BEA) "Defining and Measuring the U.S. Ocean Economy” (June 2020) and cite the source (https://www.bea.gov/system/files/2020-06/defining-and-measuring-the-united-states-ocean-economy.pdf).
591 The Bureau of Economic Analysis (BEA) "Defining and Measuring the U.S. Ocean Economy” (June 2020) and cite the source (https://www.bea.gov/system/files/2020-06/defining-and-measuring-the-united-states-ocean-economy.pdf).
592 US dollar figures have been converted into Euros using the average currency exchange rate (0.8476) for the year of analysis (2018), as provided by European Central Bank (ECB): https://www.ecb.europa.eu/stats/policy_and_exchange_rates/euro_reference_exchange_rates/html/eurofxref-graph-usd.en.html
593 The Bureau of Economic Analysis (BEA) "Defining and Measuring the U.S. Ocean Economy” (June 2020) and cite the source (https://www.bea.gov/system/files/2020-06/defining-and-measuring-the-united-states-ocean-economy.pdf)
594 For a list of sectors, codes and categories please refer to the following: for the US https://www.bea.gov/data/special-topics/ocean-economy, for the EU https://blueindicators.ec.europa.eu/published-reports_en, Methodology: https://blueindicators.ec.europa.eu/sites/default/files/annex_ii_methodological_framework.pdf
Sectors and key figures
Under the national satellite accounts system, the US identified 10 ocean economy sectors, as illustrated in Table 7.7. This list includes additional sectors to those included by the NOAA report, analysed in the previous edition of the Blue Economy Report. Some of the sectors correspond to the main EU established sec-tors, some are still categorised as emerging for the EU and for some there is no direct equivalent.
The BEA provides a new set of figures for the US Blue Economy for 2018 in their report "Defining and Measuring the US Ocean Economy"591. Below is a brief overview of the main GVA, employ-ment and salary figures as well as a short description of the most important sectors, in terms of their contribution to the Blue Economy. According to the prototype statistics of Ocean Economy Satellite Accounts (OESA), the US Ocean economy amounted to €315592 billion value added, representing 1.8% of national GDP in 2018. The largest contributors were Coastal tourism which repre-sented 38.3% of the total Blue Economy (€121 billion), followed by Maritime defence (€105 billion), Non-living resources (€41 billion) and Maritime transport (€21 billion). Additionally, the US ocean economy provided 2.3 million jobs in 2018593.
Table 7.7 US-EU Blue Economy main sector comparison594
US BE sectors EU BE sector equivalent Type
Marine living resourcesMarine living resources
Established
Coastal and marine construction
Port activities Established
Offshore minerals Non-living resources Established
Maritime transport and warehousing
Maritime transport Established
Coastal and offshore Tourism and recreation
Coastal Tourism Established
Ship and boat building, non-recreational
Shipbuilding and repair
Established
National Defense and public administration
Defence Emerging
Research and educationResearch and education
Emerging
Coastal utilities (electric power generation)
Marine renewable Energy
Established / Emerging
Coastal/marine professional and technical services
n/a n/a
Source: US BEA report (2020) and BER2020 – Commission Service
151
2021
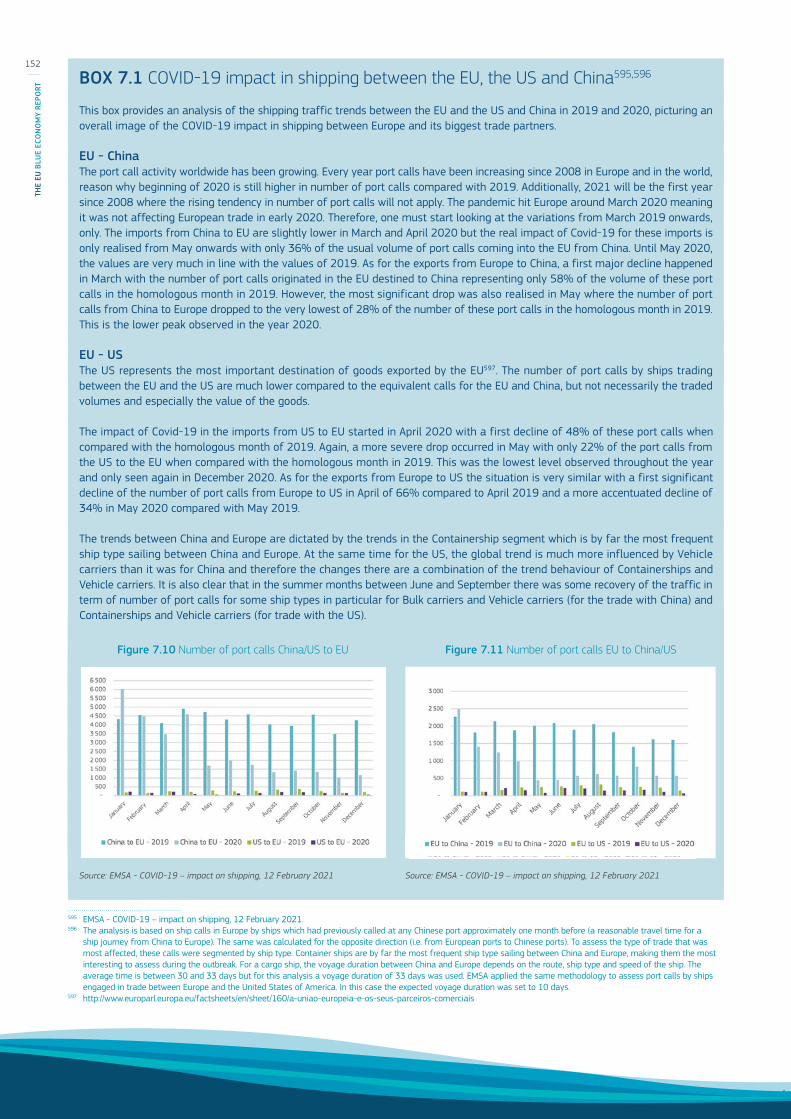
BOX 7.1 COVID-19 impact in shipping between the EU, the US and China595,596
This box provides an analysis of the shipping traffic trends between the EU and the US and China in 2019 and 2020, picturing an overall image of the COVID-19 impact in shipping between Europe and its biggest trade partners.
EU - ChinaThe port call activity worldwide has been growing. Every year port calls have been increasing since 2008 in Europe and in the world, reason why beginning of 2020 is still higher in number of port calls compared with 2019. Additionally, 2021 will be the first year since 2008 where the rising tendency in number of port calls will not apply. The pandemic hit Europe around March 2020 meaning it was not affecting European trade in early 2020. Therefore, one must start looking at the variations from March 2019 onwards, only. The imports from China to EU are slightly lower in March and April 2020 but the real impact of Covid-19 for these imports is only realised from May onwards with only 36% of the usual volume of port calls coming into the EU from China. Until May 2020, the values are very much in line with the values of 2019. As for the exports from Europe to China, a first major decline happened in March with the number of port calls originated in the EU destined to China representing only 58% of the volume of these port calls in the homologous month in 2019. However, the most significant drop was also realised in May where the number of port calls from China to Europe dropped to the very lowest of 28% of the number of these port calls in the homologous month in 2019. This is the lower peak observed in the year 2020.
EU - USThe US represents the most important destination of goods exported by the EU597. The number of port calls by ships trading between the EU and the US are much lower compared to the equivalent calls for the EU and China, but not necessarily the traded volumes and especially the value of the goods.
The impact of Covid-19 in the imports from US to EU started in April 2020 with a first decline of 48% of these port calls when compared with the homologous month of 2019. Again, a more severe drop occurred in May with only 22% of the port calls from the US to the EU when compared with the homologous month in 2019. This was the lowest level observed throughout the year and only seen again in December 2020. As for the exports from Europe to US the situation is very similar with a first significant decline of the number of port calls from Europe to US in April of 66% compared to April 2019 and a more accentuated decline of 34% in May 2020 compared with May 2019.
The trends between China and Europe are dictated by the trends in the Containership segment which is by far the most frequent ship type sailing between China and Europe. At the same time for the US, the global trend is much more influenced by Vehicle carriers than it was for China and therefore the changes there are a combination of the trend behaviour of Containerships and Vehicle carriers. It is also clear that in the summer months between June and September there was some recovery of the traffic in term of number of port calls for some ship types in particular for Bulk carriers and Vehicle carriers (for the trade with China) and Containerships and Vehicle carriers (for trade with the US).
595 EMSA - COVID-19 – impact on shipping, 12 February 2021.596 The analysis is based on ship calls in Europe by ships which had previously called at any Chinese port approximately one month before (a reasonable travel time for a
ship journey from China to Europe). The same was calculated for the opposite direction (i.e. from European ports to Chinese ports). To assess the type of trade that was most affected, these calls were segmented by ship type. Container ships are by far the most frequent ship type sailing between China and Europe, making them the most interesting to assess during the outbreak. For a cargo ship, the voyage duration between China and Europe depends on the route, ship type and speed of the ship. The average time is between 30 and 33 days but for this analysis a voyage duration of 33 days was used. EMSA applied the same methodology to assess port calls by ships engaged in trade between Europe and the United States of America. In this case the expected voyage duration was set to 10 days.
597 http://www.europarl.europa.eu/factsheets/en/sheet/160/a-uniao-europeia-e-os-seus-parceiros-comerciais
Figure 7.10 Number of port calls China/US to EU
Source: EMSA - COVID-19 – impact on shipping, 12 February 2021
Figure 7.11 Number of port calls EU to China/US
Source: EMSA - COVID-19 – impact on shipping, 12 February 2021
152
THE
EU B
LUE
ECO
NO
MY
REPO
RT
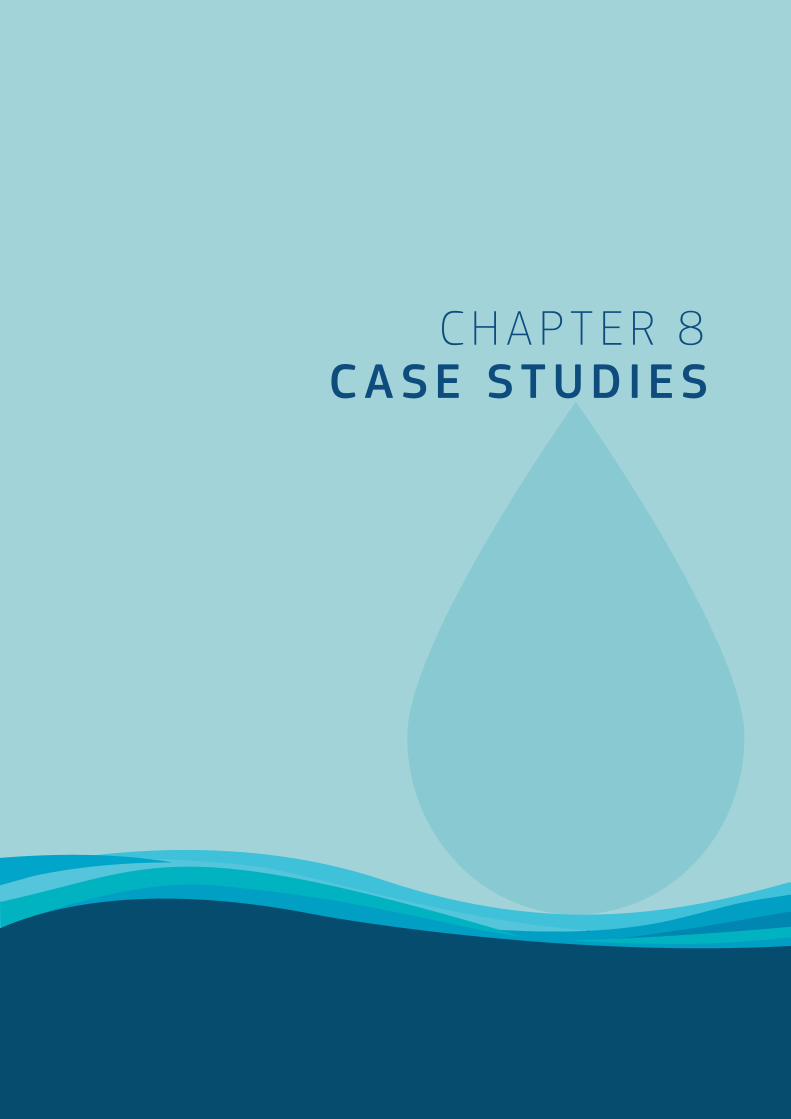
C h A p T E R 8C ASE STUDIES
As with prior editions, this report includes case studies that explore and help illustrate additional elements of the Blue Economy. The case studies focus on a number of specific or niche areas, on Member State best practices and/or initiatives and on efforts undertaken by the sectors involved to invest and develop a more sustainable Blue Economy. The case studies in this specific edition of the report focus mainly on the decarbonisation strategy and the green transition. They depict various technological devel-opments, initiatives and projects undertaken by Member States and stakeholders in an effort to achieve the goals set out in the European Green Deal.
The first case study illustrates the work undertaken by Denmark towards decarbonisation of the transportation sector by highlight-ing a number of ongoing projects on zero-emission shipping and alternative fuels. A second case study looks at marine renewable energy, particularly at the future of floating offshore wind, delving into some of the challenges that manufacturers might face but also the benefits. A final case study presents the various initi-atives undertaken by Portugal, particularly regarding innovation and R&D, in order to promote and develop a sustainable Blue Economy.
598 https://www.cedelft.eu/en/publications/2488/fourth-imo-greenhouse-gas-study 599 https://www.imo.org/en/MediaCentre/HotTopics/Pages/Reducing-greenhouse-gas-emissions-from-ships.aspx
8.1. DENMARK'S GREEN TRANSITION AND DECARBONISATION STRATEGY: RESEARCH, DEVELOPMENT AND INNOVATIONTransportation constitutes one of the world’s largest sources of greenhouse gas emissions, and one of the most complex sectors to transform due to its pivotal role in the global economy. Indeed, shipping is the backbone of international trade. Without intercon-tinental trade of affordable food, commodities and manufactured goods would not be possible.
Although shipping is more climate efficient than other modes of transport (on a per ton basis), it is still responsible for 2-3% of global GHG emissions today, and emissions are set to grow by more than 50% over the next 30 years in a business-as-usual scenario according to the International Maritime Organisation (IMO)598. This is because the demand for shipping is expected to continue to grow in line with global economic growth.
To align itself with the climate targets in the Paris Agreement, the shipping industry has adopted its own climate strategy in the IMO, which entails 50% reduction of GHG emissions from ships by 2050 and a commitment to phasing them out as soon as possi-ble599. Shipping is a hard-to-abate sector due to the international nature of maritime transport, where ships can easily change flags, routes and port calls. As such, national or regional regulation will not suffice, and international collaboration is needed in order to enable a zero-emission global fleet.
Research and development centre for zero carbon shipping
In November 2020, the Mærsk Mc-Kinney Møller Centre for Zero Carbon Shipping was established by seven Founding Partners (American Bureau of Shipping, A.P. Moller Maersk, Cargill, MAN Energy Solutions, Mitsubishi Heavy Industries, NYK Line and Siemens Energy) and made possible by a 400m DKK donation from the A. P. Møller Foundation. It is an independent, not-for-profit research and development Centre. In 2021, Alfa Laval, Haldor Topsøe and Total also joined. The purpose of the centre is to facilitate the development of new energy technologies; build confidence in new concepts and their supply chains; and acceler-ate the transition by defining and maturing viable strategic path-ways to the required systemic change. The centre will support companies’ strategic planning by creating overview and clarity on the direction in which zero-emission shipping is headed. Research and development will be done in collaboration with the Partners, relevant organisations, NGOs and consortia across different sec-tors. Research results, knowledge and experience not restricted by intellectual property rights (IPR) will be widely shared for the purpose of reducing emissions from international shipping.
154
THE
EU B
LUE
ECO
NO
MY
REPO
RT

It is vital to build a common understanding and consensus as to the preferred transition pathways, to understand the associated challenges, and to avoid inertia—not only in the shipping industry, but across the energy supply chain as well. The shipping industry could find itself at an impasse, where they cannot use alternative zero-emission fuels before there is enough supply, while produc-ers of zero-emission fuels will not produce at large-scale unless they know there will be sufficient demand. Incentives, collective action, and/or the sharing of risks can often help overcome these issues. Public-private partnerships are essential, while research and demonstration projects will show the possible pathways towards zero-emission shipping.
While there is common agreement on potential fuel pathways, further work is required to meet technological challenges and to restructure financial and regulatory incentives. This could include more efficient production at industrial scale to reduce costs and make them more competitive vis-a-vis fossil fuels. Power-to-X (PtX) technology is an area under rapid development in Denmark as well as other EU countries, e.g. the Netherlands and Germany. PtX has shown that it is possible to create growth, value and jobs in Europe by transitioning away from fossil fuels. In doing so, the industry not only reduces its impact on the global climate, but also on human health, as many ports are located in densely populated areas. Whilst a global Sulphur cap is now in place, ships still emit fine particles, small amounts of SOx and NOx. A recent publication shows that fine particles continue to cause the most substantial health impacts600. By eliminating these particles, the benefits of PtX extend beyond economic and climate benefits.
According to the Hydrogen Industry601, Denmark can create over 50 000 jobs and an energy export up to DKK 84 billion annually if focusing on Hydrogen and PtX. However, investments in PtX and Hydrogen will have to increase over the coming years to ful-fil this potential. In June 2020, the Danish Parliament, by a large majority, adopted a climate agreement on the green transforma-tion of industry and the energy sectors, which includes a tender to support the establishment of large-scale PtX plants with a total capacity of 100 MW. This is more than five times the capacity of the largest plants found in the world today.602
Decarbonising the shipping industry requires not only new fuel types, but also new technologies. To accelerate the develop-ment of viable technologies, a coordinated effort within applied research is needed across the entire supply chain. Furthermore, engagement from a broad set of key stakeholders including gov-ernments and governmental organisations, public research insti-tutions and academia as well as international organisations and private sector actors is key. A research and development centre, like the Mærsk McKinney Møller Centre for Zero Carbon Shipping, can help create an overview of the possible pathways towards zero-emission shipping and set in motion the needed demonstra-tion projects, which in turn can help create confidence among investors and regulators and help drive the shipping sector’s transformation.
600 https://www.eea.europa.eu/themes/air/health-impacts-of-air-pollution601 https://brintbranchen.dk/wp-content/uploads/2020/06/membership-e1589908155669.jpg 602 https://kefm.dk/Media/C/B/faktaark-klimaaftale%20(English%20august%2014).pdf 603 https://orsted.com/en/media/newsroom/news/2020/05/485023045545315604 https://videnskab.dk/teknologi-innovation/forskere-efter-overraskende-gode-forsoegsresultater-danske-faerger-boer-sejle
Large-scale hydrogen and e-fuel production facility
Transforming the transport sector is a momentous task and criti-cal to fulfilling the Paris Agreement and the European Green Deal.
Six Danish companies have announced that they plan to build a hydrogen and e-fuel production facility near Copenhagen in 2023. The power-to-X production facility will be able to use renewable energy and transform it into various types of fuel, such as e.g. methanol, hydrogen, and e-kerosene via electrolysis. When fully scaled in 2030, the 1.3-gigawatt electrolyser facility will produce 250 000 metric tonnes (mt) of carbon-neutral fuel for buses, lor-ries, aviation and shipping per year, reducing carbon emissions by 850 000 mt per year. From 2027, the production facility will include production of hydrogen from offshore wind being used as a feedstock for methanol for ships603.
Ellen, the Electric Ferry
Ferries perform critical tasks in many EU countries and connect islands together with the EU mainland. However, most ferries consume bunkers oil, whose emissions contribute significantly to global warming. Battery technology is an example of a known and available technology that can eliminate these emissions.
Beyond eliminating CO2, battery-powered ferries do not emit harmful particles into urban environments and provide signifi-cant economic benefits to the owners of the vessel. Whilst electric ferries are more expensive to build, they have reduced operating costs. The Danish electric car ferry Ellen operates between the Danish islands of Als and Ærø. Ellen was 40% more expensive than a conventional bunkers-powered ferry, but operating costs are 75% lower. Ellen will save the release of 2 500 metric tonnes (mt) of CO2 per year as well as 14.3 mt of NOx, 1.5 mt of SO2, 1.8 mt of CO as well as 0.5 mt of harmful particles. It is estimated that the extra costs associated with Ellen will be paid off in 4-8 years, making it a very compelling business case604.
155
2021

8.2. ENVISIONING FLOATING OFFSHORE WIND: A MANUFACTURERS PERSPECTIVEOffshore wind is a key element in the fight against the climate crisis. The wind conditions at sea enable the production of clean and cost-effective energy and an almost continuous power output throughout the year, rendering offshore wind base load capable. In combination with hydrogen production, offshore wind has the potential to contribute to the decarbonisation of shipping and aviation as well as other industries. These economic and environ-mental advantages lead to a rapidly increasing demand for the next generation of offshore wind technology as well as the market entry of new players worldwide.
A new pathway for harvesting ocean wind energy is floating off-shore wind. Several European wind-turbine manufacturers and the supplier industry have taken on the task and are currently working on options to extend the reach of wind power into deeper waters. While several pilot plants are being built and some are already operational in the EU, it is evident that the largest share of tech-nical potential for offshore wind is located in deep-sea areas with water depths beyond 60 m.
Table 8.1 shows the technical potential for floating offshore wind in different regions in the world contrasted by what is already installed today and what is expected to be installed by 2030. The numbers show that Europe will likely continue to play a leading role in floating offshore wind markets with several projects in the pipeline.
Challenges
Attracting investment for technology development specific to the sector and bringing down costs are amongst the main challenges in this market. The construction of conventional offshore wind tur-bines is more time-consuming than wind turbines on land. Floating offshore wind construction presents even greater difficulties, both logistically and in terms of the time required for its construction. The main engineering challenges are the development of suitable anchoring and cable systems and keeping the floating turbines stable and static in the wind. To solve these challenges, different concepts for floating foundations have been developed in recent years. While the tension leg platform (TLP) is tightly connected to the seabed, the other three concepts – barge, semi-submersible and spar buoy – are only loosely moored. Moreover, the tension leg platform requires special purpose vessels for transport and installation and, so far, represents the most expensive option605.
605 IRENA (2016), Floating Foundations: A Game Changer For Offshore Wind Power, International Renewable Energy Agency, 2016, Abu Dhabi.606 IRENA (2016), Floating Foundations: A Game Changer For Offshore Wind Power, International Renewable Energy Agency, 2016, Abu Dhabi.607 WindEurope (2017), Floating offshore wind - vision statement. Technical report, WindEurope, 2017, Brussels, Belgium.608 WindEurope (2017), Floating offshore wind - vision statement. Technical report, WindEurope, 2017, Brussels, Belgium.609 DNV GL (2020), Floating Wind: The Power to Commercialize, DNV GL, 2020, Høvik, Norway.610 DNV GL (2020), Floating Wind: The Power to Commercialize, DNV GL, 2020, Høvik, Norway.
The semi-submersible and spar buoy platforms are currently the most frequently used options for floating offshore wind projects. Spar buoy platforms are ballasted cylinders that keep the cen-tre of gravity below the required level for stability. This rather simple design offers little surface to waves, minimising wave-in-duced motions, but requires substantial water depths beyond 100 metres and heavy-lift vessels for offshore operations. Semi-submersible platforms are buoyant cylinders, which are hydrostat-ically stabilised through interlinkage. The resulting draught below 10 metres allows for construction and installation of the entire wind turbine at the harbour. The fully equipped platforms can then be tugged to the site. On the other hand, semi-submersible structures are more complex, use more material and offer more surface to pick up wave motions at sea606. Barge platforms are floating pontoon-like structures usually made of concrete. As for semi-submersible platforms, they can be fully equipped at the port and tugged to the site.
While – from an engineering perspective – the technical chal-lenges will be overcome eventually, the challenge of economic viability remains. The required investments and the political commitment for further development of pre-commercial float-ing offshore wind projects represent the main barriers for the technology607.
Potential
Floating offshore wind turbines are not a completely new tech-nology but rather a novel combination of offshore platforms and wind turbines. The main task offshore wind manufacturers face is the adaptation of existing technologies and equipment to new circumstances. The potential advantages of floating offshore wind include utilising wind energy potential in deep-sea areas, whether in coastal or offshore waters. Some coastal areas, for instance, have rapidly descending water depths – making the installation of conventional offshore wind turbines impossible. Another advan-tage pertains to the considerably reduced maintenance costs due to the floating nature of their foundations. A new market is about to emerge in the control and regulation technology of floating wind turbines – addressing the challenges of disruptive vibra-tions and of independently turning the rotors into the wind. Digital solutions are also required for the operation and maintenance of floating offshore plants, ensuring that downtimes are avoided by anticipating any damage remotely.
Due to the novelty of floating offshore wind technology and the only few pilot projects already in place today, information on costs is scarce. However, industry experts expect the median "levelised cost of electricity" (LCOE) of floating offshore wind to decrease by 38%608 to 70%609 by 2050, from approximately 145 €/MWh in 2020610.
156
THE
EU B
LUE
ECO
NO
MY
REPO
RT

Figure 8.1 European Outlook for Offshore Wind Total Installed Power Capacity (GW) to 2050611
Source: DNV GL (2020), Energy Transition Outlook 2020, DNV GL, 2020, Høvik, Norway
611 DNV GL (2020), Energy Transition Outlook 2020, DNV GL, 2020, Høvik, Norway
Table 8.1 Floating offshore wind potential
Country / Region
Share of offshore wind resource in +60m depth
(i)
Potential for floating offshore wind power
capacity (ii)
Currently installed floating offshore wind
power capacity
Market outlook to 2030 – expected new
installations of floating wind power capacity (iii)
Europe 80% 4,000,000 MW 62 MW (in 2020) [4] +4,117 MW
USA 60% 2,450,000 MW - +162 MW
Japan 80% 500,000 MW 19 MW (in 2019) [5] +1,017 MW
Source: (i) Carbon Trust (2015), Floating Offshore Wind: Market and Technology Review, Carbon Trust, 2015, London, UK, (ii) Floating Offshore Wind: Market and Technology Review, Carbon Trust, 2015, London, UK and (iii) GWEC (2020), Global Offshore Wind Report 2020, Global Wind Energy Council, 2020, Brussels, Belgium
Table 8.2 Levelised Cost of Energy (LCOE) of floating offshore wind compared with other energy sources
Technology Levelised Cost of Energy Before Subsidy, 2020
Expected Levelised Cost of Energy Before Subsidy, 2050
Floating Offshore Wind ~145 €/MWh ~40 €/MWh
Fixed Offshore Wind ~85 €/MWh ~34 €/MWh
Onshore Wind ~53 €/MWh ~38 €/MWh
Source: Data from DNV GL (2020), Energy Transition Outlook 2020, DNV GL, 2020, Høvik, Norway.
0
50
100
150
200
250
300
2020 2025 2030 2035 2040 2045 2050
Fixed offshore Floating offshore
157
2021

The expected cost decline (Table 8.2) highlights the cost-reduction potential of floating offshore wind while suggesting that it will still likely remain more expensive than other wind energy sources in the long run. Floating offshore wind could potentially take a share of 14% of the total offshore wind market in Europe and approximately 3% of Europe’s total power supply by 2050 with an installed capacity of around 40 GW612.
Floating offshore wind will thus play an important role in terms of potential for the EU Blue Economy. At this early stage in float-ing offshore wind development, it is difficult to provide economic figures specifically for floating wind. However, in 2020, total European offshore wind projects have attracted record invest-ments of €26.3 billion – up from €6 billion in 2019613.
Recent employment figures in the fixed offshore wind manufac-turing industry are merely indicative: one example of job crea-tion by this industry include 1,000 direct and indirect jobs in Hull, United Kingdom by Siemens Gamesa and ABP in turbine assembly and blade manufacturing; another is an expansion at the MHI Vestas Offshore Wind blade manufacturing facility on the Isle of Wight that led to the creation of a total of 380 direct jobs and an additional 720 indirect and induced jobs614.
A Growing Opportunity: Value Creation in Remote Coastal Areas
Placing offshore wind turbine manufacturing sites in close proxim-ity to the sea is a common approach, thereby avoiding time-con-suming and expensive road transport. By doing so, the offshore wind industry has become an important added value creator and employer in remote coastal areas – and will continue to do so, especially if the vast potential of floating offshore wind is to be harnessed. For instance, according to Siemens Gamesa, in 2017 the wind turbine manufacturer invested around €200 million in the construction of a plant in Cuxhaven, Germany, creating about 1 000 jobs in the plant. Around 700 of these are in direct employ-ment at Siemens Gamesa615.
Serial production has been running since 2018 and every year approximately 250 nacelles – the machine cabin on top of the wind turbine tower – leave the site towards the North Sea. With the current eight MW turbine in production, the yearly output of Cuxhaven enables a clean power supply for more than two million households and a reduction in greenhouse gas emissions of more than seven million tonnes of CO2-equivalents annually616. In the plant, the three main components; the hub, the generator and the back end are built in three production lines and then assembled. Large value-added effects arise for the suppliers of the com-ponents. A full-time job at Siemens Gamesa is estimated to be
612 DNV GL (2020), Energy Transition Outlook 2020, DNV GL, 2020, Høvik, Norway.613 WindEurope (2021), Offshore Wind in Europe - Key trends and statistics 2020, WindEurope, 2021, Brussels, Belgium.614 IRENA (2020), Fostering a blue economy: Offshore renewable energy, International Renewable Energy Agency, 2020, Abu Dhabi.615 Siemens Gamesa (2018), Press Release: “Siemens Gamesa celebrates inauguration of production facility for offshore nacelles in Cuxhaven”, Germany,
Siemens Gamesa Renewable Energy Gmbh & Co. KG, 2018, Hamburg, Germany. Accessed on 24th February 2021 from: https://www.siemensgamesa.com/newsroom/2018/06/180605_pi_cux_inauguration_en_v12.
616 Siemens Gamesa (2021), Environmental Product Declaration SG 8.0-167 DD: A clean energy solution – from cradle to grave, Germany, Siemens Gamesa Renewable Energy Gmbh & Co. KG, 2021, Hamburg, Germany. Accessed on 24th February 2021 from: https://www.siemensgamesa.com/en-int/-/media/siemensgamesa/downloads/en/products-and-services/offshore/brochures/siemens-gamesa-environmental-product-declaration-epd-sg-8-0-167.pdf.
617 AfW Cuxhaven (2020), Regionalökonomische Effekte der Ansiedlung von Siemens Gamesa Renewable Energy in Cuxhaven, Agentur für Wirtschaftsförderung Cuxhaven, 2020, Cuxhaven, Germany.
618 AfW Cuxhaven (2020), Regionalökonomische Effekte der Ansiedlung von Siemens Gamesa Renewable Energy in Cuxhaven, Agentur für Wirtschaftsförderung Cuxhaven, 2020, Cuxhaven, Germany.
619 DNV GL (2020), Energy Transition Outlook 2020, DNV GL, 2020, Høvik, Norway.
creating 0.6-0.8 full-time positions at suppliers. Comparable cases in regional economic studies have also shown indirect employ-ment effects from 1 to 2 full-time positions617.
An example of the development of local value creation is the production/impact of the hub. With offshore wind industry tech-nology constantly improving, the formation of industrial clusters is promoted. This in turn reduces constraints such as transporting large turbine components. The hub manufacturing in Cuxhaven, Germany, involves two companies on the supply side: That is Nordmark for the production and Muelhan AG for the hub’s cor-rosion protection coating. After its final assembly at Siemens Gamesa, the nacelles are loaded onto special ships by the local port operator and transported to the installation port in Esbjerg, Denmark.
The Municipality in Cuxhaven estimates that, in addition to all the effects triggered by the plant settlement, the purchasing power of the administrative district of Cuxhaven will increase by 20 to 36 million euros per year from 2020618. The plant also raises the skill level of the workforce and expands local apprenticeship capacity, while its employees revitalise the city's real estate market and retail.
In 2020, Siemens Gamesa announced that it had purchased space for an extension area of 200 000 square metres. The Cuxhaven site will thus continue to benefit from the projected growth of the offshore industry in Europe.
Conclusions
The future potential for floating and fixed offshore wind in terms of expected installed capacity looks very promising in Europe and worldwide. Strong policy support from the European Commission and national governments, and a growing need for renewable energy will continuously increase the demand for clean bulk energy from offshore wind. Floating offshore wind – now in its pre-commercial phase – will see considerable growth after 2030619. This is good news for European wind turbine manu-facturers. Despite some technical challenges, the wind industry expects floating offshore wind to operate at competitive costs once technical maturity is reached, and regulations are consoli-dated. As global technology leaders in wind turbine construction and its associated supplier industry, the European wind industry will strongly benefit from these developments.
Offshore wind also entails major opportunities for the European blue economy. The previous examples illustrate the positive impact offshore wind industry can have on local value creation in remote coastal areas and how it creates perspectives for local
158
THE
EU B
LUE
ECO
NO
MY
REPO
RT
businesses, suppliers and local people. Although the competition for space, in relation to other sectors, notably fisheries, might cre-ate some conflicting priorities, the introduction of a new industry in these areas brings new direct and indirect jobs to the local blue economy. Furthermore, the establishment of new offshore energy infrastructures and even energy islands for the production and distribution of power, and prospectively hydrogen, will become a major economical factor in the years to come. The energy transi-tion is, slowly but surely, becoming a major driver of the European blue economy.
620 https://blueindicators.ec.europa.eu/published-reports_en621 https://www.ine.pt/xportal/xmain?xpid=INE&xpgid=ine_destaques&DESTAQUESdest_boui=459804030&DESTAQUEStema=5414331&DESTAQUESmodo=2622 https://96594c97-1436-40ba-b257-d6d0d780b25f.filesusr.com/ugd/eb00d2_ef4823a6a40b4828a2ff244d16df84e3.pdf623 https://96594c97-1436-40ba-b257-d6d0d780b25f.filesusr.com/ugd/eb00d2_a0d094c9f79541688a3345c0addd9683.pdf624 https://www.ine.pt/xportal/xmain?xpid=INE&xpgid=ine_destaques&DESTAQUESdest_boui=459804030&DESTAQUEStema=5414331&DESTAQUESmodo=2625 Authors’ free translation.626 More information about those and other projects promoted by an entity, or with a partner, from Portugal can be obtained on the website of the Directorate-General for
Maritime Polity, Ministry of the Sea (https://www.dgpm.mm/gov.pt), and in the EC Maritime Hub Database (https://maritime.easme-web.eu/)
8.3. INNOVATION IN PORTUGAL TO BOOST A SUSTAINABLE BLUE ECONOMYIn the EU, Portugal’s ocean economy occupies a central place within the broader domestic economy.620. According to the Satellite Account for the Sea621, in Portugal, the direct and indirect impact of the ocean economy on the national economy was about 5.1% of the Gross Domestic Product (GDP) in 2018.
The Portuguese ocean economy has shown resilience in past peri-ods of economic crisis and it is now expected to play an important role in the post-pandemic recovery period. On the one hand, there will be a need to boost growth and jobs, while on the other, it will be crucial to make strong commitments to long-term sustaina-bility, which includes developing an agenda for the climate goals and a more circular and digital economy. This cannot be achieved without research and innovation, namely with regards to technol-ogy, and it must engage traditional and emerging sectors. With the support of European Funds under shared management (CF, ERDF, EMFF and ESF), Portugal invested about €244 million in ocean economy-related research and innovation, during the cur-rent programming period622.
In addition, Portugal runs the Blue Fund, a national fund dedi-cated to ocean economy-related objectives, as well as the Blue Growth EEA Grants Programme. Statistics in R&D show that R&D expenditures In Blue Economy grew about 47% between 2014 and 2018, an annual growth rate of about 10%, higher than the annual 6% growth rate of total R&D expenditures in Portugal. During this period, R&D expenditures in the ocean economy rep-resented around 3.6% of total R&D expenditures. The two most representative areas in terms of expenditures in Blue Economy R&D were “Marine Food Resources” and “natural systems and renewable energy resources”, together representing more than half of the total (33% and 23%, respectively)623. Regarding mac-roeconomic data624, investment in R&D represented 24% of the total investment (gross fixed capital formation) in the ocean econ-omy for the 2016-2017 period.
These figures reflect the growing importance of R&D in the Portuguese ocean economy as a relevant asset regarding the Vision presented in the new version of the Portuguese National Ocean Strategy 2021-2030: "promoting a healthy ocean to enhance sustainable blue development, the well-being of the Portuguese and affirming Portugal as a leader in ocean govern-ance, supported by scientific knowledge"625. Some relevant exam-ples of the innovative technological solutions supported/made possible by this financing are presented below.626.
159
2021
COMPACT
The COMPACT Project will develop an innovative lightweight pres-sure casing (cylinder) for a pre-tension system of a wave energy converter (WEC) to improve energy efficiency and lower the costs of energy production. The development includes manufacturing a set of prototype cylinders, which will undergo thorough testing. The result of the project is a full-scale certified pressure casing ready to be installed on an operational WEC and demonstrated in the ocean afterwards. COMPACT is a project developed by CorPower Ocean Portugal, in partnership with OPS Composite Solutions (from Norway), representing a total investment of €688 714, with 70% support from the EEA Grants’ Blue Growth Programme. The project is part of the overall wave energy tech-nology being developed by CorPower Ocean Portugal.
The project's main objectives are: 1) To improve performance and reduce the price of wave energy technology, thus contributing to its quicker commercialisation; and 2) To actively contribute to the Portuguese Industrial Strategy for Ocean Renewable Energies, promoting jobs and socio-economic growth in the region. It is expected that CorPower Ocean Portugal will create around 85 jobs by 2030, most highly qualified positions (mainly engineering and component design) due to the concrete knowledge and technology involved in the activity.
ENDURE - Enabling Long-Term Deployments of Underwater Robotic Platforms in Remote Oceanic Locations
The ENDURE Project aimed at planning, constructing, and test-ing a cost-effective solution that allows for autonomous under-water vehicles (AUV) to wirelessly recharge their batteries near an underwater charging station, for use in remote oceanic areas including for deep-sea deployments. By avoiding complex mechanical docking, the proposed solution requires minimal main-tenance, making it cost-effective and enabling long-term opera-tion in remote oceanic locations. The proposed solution consists of an underwater charging station moored to the seabed and connected to a surface platform that generates energy through renewable energy sources. This technology was developed by the Portuguese institute INESC TEC, in partnership with IPMA (PT) and MARLO (NO), representing a total investment of €241 947, with 85% support from the EEA Grants 2009-2014. One of the goals of ENDURE was to create around 29 jobs during the development stage627.
627 Some of these were permanent others temporary
I.nano.WEC - Innovative nanotechnology for Wave Energy Conversion
The i.nano.WEC Project aims to develop the first marine buoy prototype that integrates highly efficient energy capture sys-tems based on triboelectric nanogenerators (TENGs). The dis-ruptive technology to be developed and optimised can be an alternative to solar panels, overcoming their current limitations in terms of energy supply, size, efficiency and price. Achieving this goal will promote continuous monitoring of environmental and human activities in remote locations, enabling the implementa-tion of robust, modular, and energetically autonomous systems for diverse markets such as aquaculture, signalling equipment or long-term data monitoring markets. The i.nano.WEC project is promoted by the Portuguese start-up inanoEnergy, in partnership with the University of Porto and the INEGI institute. With a 90% contribution from the Portugal’s Blue Fund, the project’s expected cost is €199 799.
160
THE
EU B
LUE
ECO
NO
MY
REPO
RT

8.4. RECREATIONAL MARITIME FISHING IN CATALONIA628
Introduction629
Recreational fishing is defined as “a non-commercial fishing activ-ity exploiting marine living resources for recreation, tourism or sport”630. In other words, it is a non-professional activity practiced for sport and leisure with no commercial purpose. This activity includes three main modalities: shore fishing, boat fishing, and spearfishing. The popularity of this practice in coastal popula-tions all year round in Catalonia reflects its social and cultural relevance. There has been a significant increase in this practice in recent decades mostly due to a rise in citizen interest in expe-riencing outdoor activities, but also likely due to the expansion of tourism.
Professional and recreational maritime fishing often impact the same fishing resources. However, their combined effect on natural resources is yet unknown. This fact has now drawn the attention of decision makers and the scientific community, convinced that management should incorporate knowledge about the impact of recreational maritime fishing.
The Directorate General for Fisheries and Maritime Affairs, through the Catalan Research Institute for the Governance of the Sea (ICATMAR), developed, in the framework of the 2030 Maritime
628 This case study was based on the Diagnosis of Marine Recreational Fishing in Catalonia done by the Catalan Research Institute for the Governance of the Sea in 2019. A complete analysis can be consulted on the following address: http://agricultura.gencat.cat/web/.content/08-pesca/politica-maritima/enllacos-documents/fitxers-binaris/diagnosis-marine-recreational-fishing-catalonia-2019-ICATMAT-20-04_ENG.pdf
629 Note: The information presented must be taken with caution, given that many of the data used are subject to important sources of bias (avidity, seasonality, perception and memory biases); but particularly due to the fact that voluntary respondents tend to engage the activity more actively and hence tend to be in the upper side of the avidity spectrum. Additionally, both surveys were undertaken during the warmer months, for which cold season activity is underrepresented
630 Council Regulation (EC) No 1224/2009 and FAO, 2018.
Strategy of Catalonia, a monitoring program, which takes into account recreational maritime fishing. During 2019, this program included a pilot study for which data from online and onsite sur-veys were collected. Results of the pilot study show preliminary figures regarding the economic, social and environmental impacts of recreational fishing in Catalonia.
Methodology. Data was collected from the practitioners of the activity via voluntary field and online surveys. Both included ques-tions regarding the modality used, the socio-economic profile, the fishing effort, the fishing performance, the target species, and the daily and annual expenses for the practice of the activity. The area
The Catalan Research Institute for the Governance of the Sea was created as a result of the collaboration between the Directorate General for Fisheries and Maritime Affairs of the Government of Catalonia and the Institute of Marine Sciences (ICM-CSIC). It is an autonomous organisation that responds to the need for generating scientific advice for management purposes in the Blue Economy. During 2019, ICATMAR car-ried out the first qualitative and quantitative assessment of recreational maritime fishing along the Catalan coast. The results and experience gathered throughout 2019, in addi-tion to offering a preliminary overview, have made it possible to design a continuous data collection program, which was launched in 2020.
Figure 8.2 Division of the Catalan coast into 21 zones. Zones 1-8 correspond to the North region, zones 9-13 to the Centre region, and zones 14-21 to the South region.
161
2021

of the study divides the Catalan coast into 3 large regions (North, Centre and South), which are subdivided into a total of 21 areas based on geomorphic characteristics (Figure 8.2).
For the field survey, eleven sampling points from the central and northern area of Catalonia representative of the general charac-teristics of the Catalan coast were selected. During a five-month period, thirty fieldwork days were carried out in different ports, beaches, and other parts of the coast, surveying fishermen and obtaining information about their catches. The surveys were done during different days of the week, during various times of the day, with the intention of and for each of the three fishing modal-ities of interest. Data was obtained from a total of 423 individual interviews (from May to September 2019).
The online survey was designed with specialised software. It was sent through an official email to all the practitioners that obtained the license between 2014 and 2018. It was also spread through an official campaign via social media and transmitted directly to representative organisations from the recreational fishing sector. Access to the survey was open for three months, and a total of 9 000 responses were obtained.
Results of the survey
Social impact. There are close to 50 000 marine recreational fishers in Catalonia (approximately seven recreational fishers out of 1 000 inhabitants) of which 60% are mostly dedicated to shore fishing, 34% practice mainly boat fishing, and 6% are spear fishers. In general, it is a predominantly male activity (95% male participants), with an average age between 40 and 50, depending on the fishing modality (Figure 8.3).
Seasonality. Recreational fishing is a largely seasonal activity for all three fishing modalities. All of them present activity peaks during the summer season and a strong decrease during winter (Figure 8.4). Shore fishing is comparatively more seasonal than the other two modalities, with a declared participation during the summer months almost tripling that of the winter months. Conversely, spearfishing is least dissimilar during the warmer and cooler seasons; the activity also decreases considerably, but in this case, it is only halved.
Catch composition. Catch observations generally showed a ten-dency towards small individuals of abundant species. Fishers gen-erally did not practice catch and release and those who released catches mostly did so because the minimum landing size was not met (Figures 8.5, 8.6 and 8.7).
Total annual catch. Total annual catches were calculated individ-ually for each respondent using their Catch per Unit Effort (CPUE) and effort values. The most harvest intensive activity was boat fishing (760 tonnes/year), followed by shore fishing (508 tonnes/year) and spearfishing (98 tonnes/year) (Table 8.3). Altogether they result in 1 366 tonnes/year, which represents 5.3% of the total commercial catch in Catalonia in 2019.
Table 8.3 Average total annual catch by recreational fisher (RF) for each modality and total annual catch by modality.
Average annual catch per RF (kg/year)
Total annual catch (t/year)
Coast fishing 16 508
Boat fishing 42 760
Spearfishing 28 98
Total 1,366
Note: Estimates were obtained from the online surveys.Source: ICATMAR 2019
Uneven distribution of the total catch. Recreational fishers are notoriously heterogeneous in their fishing avidity and productivity. This causes the total individual catch per fisher values to have very wide ranges. While a relatively small proportion of partic-ipants have very high annual catches, the majority of fishers’ annual harvest is one order of magnitude smaller: The top 10% of practitioners gather 50% of the overall catch, while the bottom 50% of practitioners gather only 10% of the overall catch.
Economic impact per fishing modality. The economic impact of marine recreational fishing in Catalonia has been estimated at approximately €90 million, out of which roughly one third corre-sponds to direct impacts on fishing gear shops and distributors (Table 8.4).
Table 8.4 Total annual expenditure in fishing gear and total annual expenditure including expenses indirectly related to fishing activity.
Expenses in fishing gear Total activity
Shore fishing 16.178.446 € 30.256.536 €
Boat fishing 11.984.832 € 53.422.600 €
Spearfishing 993.80 € 5.422.256 €
Total 29.157.080 € 89.101.392 €
Source: ICATMAR 2019
While absolute values resulting from this pilot study are prelim-inary and should therefore be taken with caution, this study has been very successful in providing a first approximation of the social, environmental and economic impact of the recreational fishing sector in Catalonia. Moreover, the study has laid essential groundwork for developing a strategy for the continuous and per-manent monitoring of the activity in order to provide the neces-sary information for its proper management.
The recreational fishing sector is one of the sectors to be included in the recently developed official statistics of the Blue Economy in Catalonia in the framework of the implementation of the 2030 Maritime Strategy of Catalonia.
162
THE
EU B
LUE
ECO
NO
MY
REPO
RT
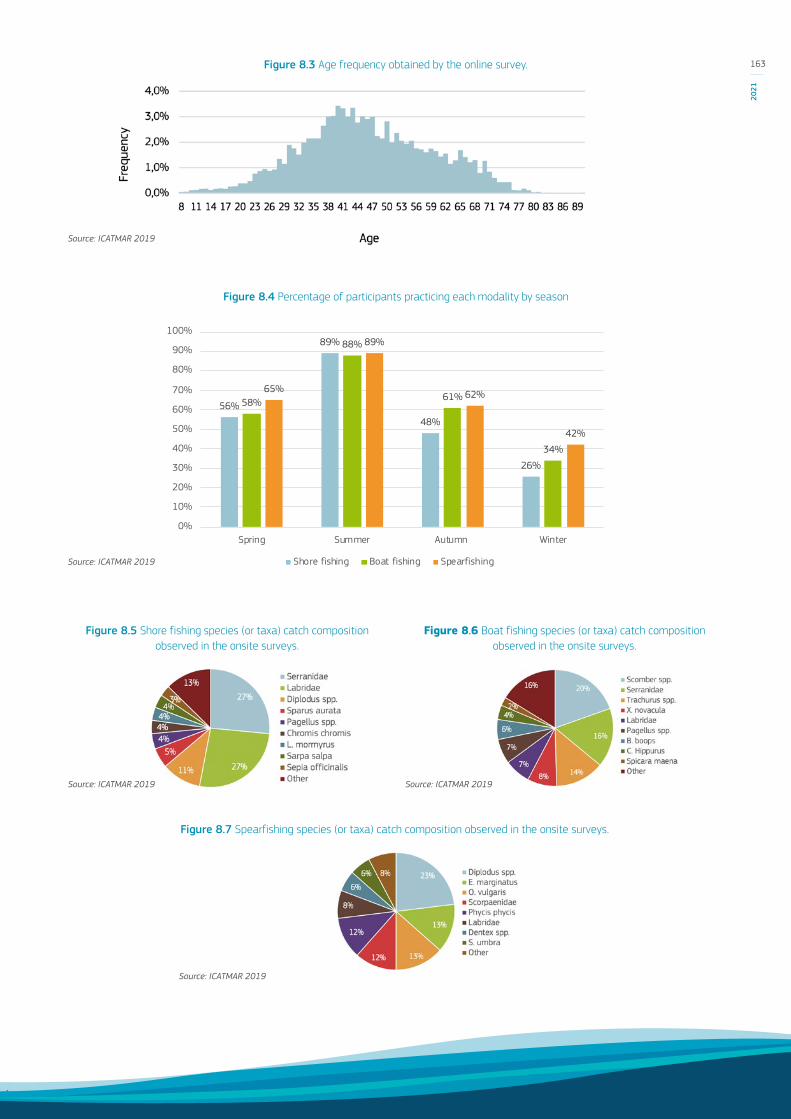
Figure 8.3 Age frequency obtained by the online survey.
Source: ICATMAR 2019
Figure 8.4 Percentage of participants practicing each modality by season
Source: ICATMAR 2019
56%
89%
48%
26%
58%
88%
61%
34%
65%
89%
62%
42%
0%
10%
20%
30%
40%
50%
60%
70%
80%
90%
100%
Spring Summer Autumn Winter
Shore fishing Boat fishing Spearfishing
Figure 8.6 Boat fishing species (or taxa) catch composition observed in the onsite surveys.
Source: ICATMAR 2019
Figure 8.7 Spearfishing species (or taxa) catch composition observed in the onsite surveys.
Source: ICATMAR 2019
Figure 8.5 Shore fishing species (or taxa) catch composition observed in the onsite surveys.
Source: ICATMAR 2019
163
2021
T HE FOL LOWING A NNE XES
A RE AVA IL A BL E IN A SEPA R AT E F IL E :
ANNEX 1 M EM B ER STATE PROFILES
ANNEX 2 SUM MARY TABLES
ANNEX 3 M ETHODOLOGIC AL FR AM EWORK
ACRONYMS
GLOSSARY
164
THE
EU B
LUE
ECO
NO
MY
REPO
RT


ISBN 978-92-76-37879-2 doi:10.2771/8217
KL-AR-21-001-EN-N