Embed Size (px)
Citation preview

The Canadian Journal of Higher Education La revue canadienne d'enseignement supérieur
Volume XXX, No. 3, 2000 pages 5 7 - 1 2 6
The Eroding Standards Issue: A Case Study from the University of Waterloo
SUSAN MILLER & JOHN GOYDER* University of Waterloo
ABSTRACT
The proposition is addressed that the mathematical skills of first year entrants into the Faculties of Mathematics, Engineering, Science and Applied Health Sciences at The University of Waterloo have declined. Analysis of a series of scores f rom a mathematics diagnostic test for new s tuden ts sugges t s a dec l ine over the per iod 1 9 9 1 - 9 3 and poss ib ly through to 1995. This reproduces a trend detected at The University of Western Ontario. By the mid-1990s, however, the scores level out. Many of the faculty members questioned in a survey also perceived a decline, and, independently of the time series data, informants pointed to the early 1990s as the critical period of decline. The feeling of being under pressure to adjust to declining standards by upward "belling" of grades varied greatly by faculty, being far more prevalent within the Faculty of Mathematics than in other faculties surveyed. The survey respondents claimed that most deficiencies in mathematics preparation in the high schools were remediable by working to alter the attitudes and expecta-tions of first year university students.
* This project was assisted by a small grant from the Teaching Resource Office and the Dean of Arts at UW. We are indebted also to respondents on the survey, to the Faculty of Mathematics Associate Dean for Undergraduate Studies together with Gordon Stubley of the First Year Engineering Office for information on teachers of first year classes, and to Professor Edward Vrscay for organizing the interview with informants. The article is based on an Honours B.A. Thesis by Susan Coutts (now Miller).

58 S. Miller & J. Goyder
RÉSUMÉ
Cet ar t ic le révé lé une baisse du niveau de connaissances en ma théma t iques des é tudiants de première année des Facul tés de mathématiques, ingéniérie, sciences et sciences appliquées de la santé à l'Université de Waterloo. L'analyse d'une série de notes issue d'un test diagnostique en mathématiques destiné aux nouveaux étudiants semble indiquer un déclin portant sur la période 1991-93, voire jusqu'en 1995. C'est la reproduction d'une tendance détectée à l'University of Western Ontario. Toutefois, au milieu des années 90, les notes se nivélent. Bon nombre de membres des facultés sondées ont également perçu un déclin et, indépendamment des données chronologiques, ils situent le début des années 90 comme la période critique du déclin. La pression liée à la nécessité de s'adapter au niveau de connaissances à la baisse en gonflant les notes a varié de façon importante d 'une faculté à l 'autre et a été beaucoup plus fortement ressentie dans celle de math matiques que dans les autres facultés interrogées. Les personnes sondées déclarent qu'il est possible de remédier à la plupart des lacunes dans la préparation des mathématiques au collège en s'appliquant modifier les attitudes et les attentes des étudiants en première année à l'université.
When to the sessions of sweet silent thought I summon up remembrance of things past (Shakespeare, Sonnet 30)
INTRODUCTION
Concern about decline in standards for secondary and postsecondary students in Canada has been expressed at least as far back as Hilda Neatby's (1953) So Little for the Mind, nearly a half century ago. This early work complained of "this 'age without standards' " (p. 1) corrupted by the "progressive education" movement dating back to the turn of the century. It is a theme repeated many times since and never more emphat-ically than in recent times.
In the 1970s, the Association of Universities and Colleges of Canada (AUCC) released a report addressing enrollment and quality issues. The report (Barbeau, Bruce, Clake, et al., 1997) stated:
The Canadian Journal of Higher Education Volume XXX, No. 3, 2000
The Eroding Standards Issue 59
Whatever the reason, there is no doubt that large numbers of f i rs t year s tudents have d i f f icul ty in wri t ing essays, in expressing themselves coherently, and in manipulating mathe-matical symbols and expressions, (p. 20).
The AUCC report was motivated largely by the ending of provincial level high school leaving examinations in the 1960s and early 70s, but in 1984 a more fundamental critique appeared with The Great Brain Robbery: Canada s Universities On The Road To Ruin (Bercuson, Bothwell, & Granatstein, 1984). The authors pointed precisely to the accessibility and expansion of universities in the 1960s and early 70s as the reasons for declining academic standards:
Canadian universities no longer take only the best students and no longer give their students the best education. The value, if not the very meaning, of a university degree has been steadily eroded. (Bercuson, et al., 1984, p. 7)
It was a later book by the same authors (Bercuson, et al., 1997) that provoked a counter-interpretation. Michiel Horn, an historian at York University, presented an alternative view of Ontario universities in his October 1997 Globe and Mail article, "The Myth of a Golden Age in Higher Education." Horn dismissed much discussion on higher educa-tion as romanticizing of the past, asserting that few delusions are more widespread than a belief in a lost golden age. He contended:
Unhappy with what, as we age, we take to be evidence of general decline, we conjure up a period in the past when life was good, when children and serving personnel knew their place, when trains and buses ran on time, and when high qual-ity at a low price was assured. The field of education is noto-riously prone to such beliefs.. .(p. A23)
In this alternative interpretation of Canadian higher education, the attri-bution of declining standards to the rising generation may be a mere epiphenomenon of the life cycle, exacerbated at the present moment in Canadian educational history by the aging baby boom effect noted by Foote and Stoffman (1996).
The Canadian Journal of Higher Education Volume XXX, No. 3, 2000
60 S. Miller & J. Goyder
C l e a r l y , i s s u e s o f t r e n d s in e d u c a t i o n a l s t a n d a r d s m u s t be approached with an open mind and with the best evidence obtainable. The present paper reports on The University of Waterloo (UW) as a case study, with reference to levels of preparation in students' mathematical skills. The study is confined to those disciplines for which mathematical skills are central in part since concern about standards at Waterloo has been publically voiced with express reference to mathematics, but also because mathematical skills are more easily measured than arts skills such as rhetoric or essay writing.
While the data are not necessarily representative of all Canadian or even Ontario universities, they do bring some unique leverage to the problem outlined above. First, this case study arises specifically from a contention among some U W faculty members that the decline in skill among first year entrants had by the mid 1990s become acute (Vrscay, 1996). Thus, we begin with an intuitive hypothesis from faculty mem-bers who deal with students on a daily basis and within the context of some of the more selective programs at Waterloo, where there is sensi-tivity to the maintenance of standards. Secondly, we employ not only test score data from mathematics diagnostic instruments, but also per-ceptual data from a survey of teaching faculty members. The two types of data enable certain conclusions to cohere, as shall be outlined below.
SPECIFICATION OF THE PROBLEM AND METHODS USED
Preliminary Interview
We began with a group discussion and interview — one could almost term it a focus group — with five professors from UW's Faculty of Mathematics. This helped in defining the problem and key variables. We were directed to first year students as the key group to examine, since problems of diminished standards or expectations at the University were linked so emphatically to a perceived decline in high school stan-dards. Our sources felt that some catch-up may occur during the univer-sity years, so that the graduating students are not necessarily much inferior to their predecessors. It was noted that diluted standards might be revealed both by the amount of material covered in first year classes
The Canadian Journal of Higher Education Volume XXX, No. 3, 2000

The Eroding Standards Issue 61
and by the "belling" or upward adjusting of grades. A problem of admin-istration pressure to bell was cited several times. One of the informants visualized the problem mainly in terms of the changing expectations of first year students regarding the amount of work required of them. A consequence, we were told of the "special me" and "self-esteem" fixa-tion in the schools was that first year university students underestimated the amount of work required to acquire mathematical proficiency. In this argument, once the attitudes and expectations are turned around, stu-dents today perform as well as ever. A ten year time frame was sug-gested for our study. The main decrease in the academic preparation of students was traced to the late 1980s and early 1990s, continuing more gradually to the present. To examine a more extended time frame would also have led to difficulties in finding sufficient respondents for the opin-ion survey component of the present research, due to the recent wave of retirements at the University.
It became clear f rom the group interview that some challenging research design issues lay behind the questions being raised. The main problems are (i) that each year 's incoming class could differ from its predecessor for reasons beyond the content of the high school curricu-lum (see also, Casas & Meaghan, 1995); (ii) that academic preparation may be subject to lateral "skill shifts" that are neither higher nor lower than before, simply different.
As for the first point, each year's first year class is shaped by demo-graphic shift, by the priority high school graduates give to acceptance at UW, and by decisions University authorities make about the admission standard and size of the incoming class. In the ideal design, we would have begun the study long ago, each year gathering data on students' demographic background, high school grades, IQ, and study habits/ attitudes. And we would have administered a fixed diagnostic test at the beginning and at the end of each student's university career.
Would such a test be even theoretically possible? The group inter-view with mathematics faculty raised some doubts. It was noted, for example, that with the growing accessibility of computers and software, mathematical operations that once were important skills for students to have at their fingertips now are handled by computer applications. This
The Canadian Journal of Higher Education Volume XXX, No. 3, 2000

62 S. Miller & J. Goyder
could mean a switch from an operational to a conceptual emphasis that would amount to a lateral, not a vertical, skill change. It is analogous to an occupation that neither gains nor loses skill demands with the introduction of workplace technology, but instead simply changes in skill profile.
These doubts about the measurability of trends in mathematical skill underscored the need for perceptual data to stand alongside a time series of results from diagnostic tests.1 The impressions of classroom lecturers could, conceivably and paradoxically, be more accurate than test score trends if it were true that lateral skill shift was occurring. Thus, simulta-neously as a search was undertaken for sources of data for entrance level mathematical ability, a perceptions survey of U W faculty members from certain departments was designed. We shall describe first the data from diagnostic testing in mathematics.
Longitudinal Data on Mathematical Ability
Each September, in the week prior to commencement of lectures, The F a c u l t y of E n g i n e e r i n g at U W admin i s t e r s a " M a t h e m a t i c s Preparedness Test" (MPT for short) to all of its incoming class. The exam was designed to improve first year performance and is used as an early identification tool to determine which students will likely have dif-ficulty in the engineering programs so that assistance can be sought before problems arise (Ford, 1995). The test is revised every three years. The pair of MPT time series for 1991-93 and 1994-96 were considered by an informant we interviewed in the Engineering Faculty to be highly comparable. For 1997, however, the test paper was changed more funda-mentally to accommodate its administration to Faculty of Mathematics first year students along with the engineering class. The version for 1997-99, so our informant advised us, is not comparable to the earlier ones. In the analysis presented below, each three year series is modeled separately, as a stand-alone set. Conclusions are attempted regarding overall trends by examining internal trends within each set of three years, and with awareness of the greater similarity between the 1991-93/ 1994—96 instruments than between the most recent data and either earlier series. These data cover 6,194 students in total.
The Canadian Journal of Higher Education Volume XXX, No. 3, 2000
The Eroding Standards Issue 63
The MPT is divided into six different sections comprising logarithms, geometry, trigonometry, algebra, analytic geometry and differentiation. From 1991 to 1996 there were 31 questions, five per section except for six in the algebra section. Copies of these tests can be found in Coutts (1997, Appendix B).2 The post-1996 version used 25 questions.
The Opinion and Perception Survey
Given the impossibility of turning back the clock to test and inter-view students from past years, an alternative strategy was to measure the perceptions of instructors of first year courses at UW. A short survey was des igned for this purpose . The comple te ques t ionna i re is in Coutts (1997). Initially the Mathematics and Engineering faculties were chosen for the survey, but later in the research the faculties of Science and Applied Health Sciences were added for a confirmatory test of some first impressions.
The eleven question survey was initially administered by e-mail in March 1997. Since anonymity could not be provided by a survey returned through e-mail, respondents were given the option of printing the survey and returning it via campus mail. The sampling for the initial survey began with names of professors in the Mathematics and Engineering fac-ulties who, according to listings in the undergraduate calendars for 1986-87 and 1996-97, had instructed at the University of Waterloo for at least ten years. Lists of professors who instructed first year courses at any time during the past five years were then obtained from the First Year E n g i n e e r i n g O f f i c e and the F a c u l t y of M a t h e m a t i c s D e a n fo r Undergraduate Studies, giving the final sampling frame. The historical records to capture just those with ten years of continuous first year teach-ing were impossible or at least impracticable to obtain. The number of faculty who have such extensive experience teaching first year students is probably miniscule in any case. We envisioned the survey respondents as informants who were reporting in part the general impression within their own faculty, verified by at least some personal knowledge.
Since the sample gave only 33 (of 57 potential) cases even with our relatively loose criteria, the survey was, as noted, later administered to the Science and Applied Health Sciences faculties to determine if the results
The Canadian Journal of Higher Education Volume XXX, No. 3, 2000

64 S. Miller & J. Goyder
of the initial survey were reproducible. Similar to the Mathematics and Engineering faculties, Science and Applied Health Sciences were chosen due to the less subjective nature of grading in those faculties relative to Arts and Environmental Studies. The sampling frame had to be slightly r e -de f ined for this Sc ience and Appl ied Heal th Sciences sample . Although again selecting those with ten years service at UW, as per cal-endar listings, we had to use the Course Information Report for Fall 1997 to identify recent first year teaching activity. The population was thus defined a little more restrictively for the Science/AHS portion of the sur-vey. The new fieldwork took place by e-mail on October 9th, 1997. Two weeks later, and due to a low initial response, a follow-up copy was sent to the science/AHS sample through campus mail to confirm that all potential respondents received the questionnaire.
The response rate across all faculties surveyed was still discourag-ingly low, about one in three on a sampling frame with N = 78, and so in the winter of 1998 yet another contact was made, by campus mail, with all nonrespondents. We were mindful that some one-seventh of university faculty contacted in any one term may be hard to reach due to sabbatical leave, and further suspected that in part the low 1997 response was attrib-utable to those who, feeling unqualified to give definitive answers to the issues raised, self-selected themselves out of the sample. The new cover letter stressed that all views would be useful even if the instructor had not taught first year courses continuously over ten years. A question was added to find out exactly how extensive the first year teaching experience was. As already reported, the survey was only sent in the first place to those known from administrative records to have taught first year stu-dents at some point over the previous five years. The 1998 questionnaire was trimmed slightly by deleting some questions which did not prove important in analysis of the first wave responses. The February 1998 fol-low-up generated another 23 cases, and also gave us confirmation that three people in the sample had retired and were no longer connected with the University. In all, 52 out of 78 eligible instructors answered the sur-vey. The final response rate of 67% is consistent with previous experi-ence of surveying faculty members at UW and indeed of many samples surveyed within organizational settings (Goyder, 1987).
The Canadian Journal of Higher Education Volume XXX, No. 3, 2000

The Eroding Standards Issue 65
The survey, being retrospective and historically incomplete insofar as not every respondent taught continuously at the first year level since 1991, is not a full triangulation of the Mathematics Preparedness Test. Moreover, the survey data base permits only the most rudimentary statis-tical analysis, and yet the survey is far from valueless. Each of these respondents, after all, taught hundreds of first year students. We shall demonstrate below that, in a general way, the two sources of data rein-force each other. The faculty survey had value if only for the ideas it generated for interpreting the time series of MPT test scores. The depth of experience tapped even from this limited survey became apparent in the extended write-in comments volunteered by many respondents and frequent reference to this material appears below.
RESULTS
Mathematics Preparedness Test
The MPT data were analyzed using dummy variable multiple regres-sion analysis, with gives the same information as analysis of variance while adding size of effect estimates (Cohen & Cohen, 1975). These results appear in Table 1, along with some descriptive statistics.
Each set of coefficients is a self-contained model, as explained pre-viously. Test scores were released to us in grouped form. For data cover-ing 1991 to 1996, these are categories grouping number of questions correct into threes (except that the first category stands for zero or one correct), for the 31 questions posed in the test. The scores entering the regression models are midpoints for these categories. The final three years grouped 25 questions by twos, and again midpoints were entered. There is no purpose served trying to transpose the scores into a common metric (e.g., percent correct) because, as noted already, the 1991-96 series is not comparable to that for 1997-99.
To illustrate the meaning of the table, for the 1991-93 series, 1991 is the reference category (set to zero; see Cohen & Cohen, 1975: ch. 5 for explanation). The coefficient o f -1 .777 shows that students taking the test in 1992 scored about 1.8 (rounded) fewer questions correct than did their 1991 counterparts. The next year's decline was 1.842, again rounding to
The Canadian Journal of Higher Education Volume XXX, No. 3, 2000

66 S. Miller & J. Goyder
Table 1 Regression of MPT Score on Year of Test
Regression % Variance Descriptive Statistics Coefficient (B) Explained N of cases SD
Model of 1991-92 1.8 1991 (set to zero) 0.000 708 5.99 1992 -1.777* 660 6.44 1993 -1.842* 662 6.66 Intercept 16.500
Model for 1993-96 0.4 (new version of test)
1994 (set to zero) 0.000 671 6.60 1995 -0.303 711 6.59 1996 +0.691 650 6.44 Intercept 13.378
Model for 1997-99 0.3 (new test and enlarged population of students)
1997 (set to zero) 0.000 777 5.65 1998 -0.311 748 6.02 1999 +0.447 607 5.67
• p < .0001 ; all others have p > .05 ns.
1.8. Essentially here we would conclude that each year's class was get-ting nearly two fewer questions correct than in the previous year, rather a notable decline.
The variance explained computation, however, makes another obser-vation about the data. There is considerable variance in the test scores for each year (Table 1 includes the standard deviations), and they are close to normally distributed, meaning that many students achieve a
The Canadian Journal of Higher Education Volume XXX, No. 3, 2000

The Eroding Standards Issue 67
middling result, a few do very well and a few very poorly. The decline in relation to this overall variance is rather subtle (hence the variance explained figure of 1.8% for the 1991-93 series in Table 1).
A majo r conclusion of our analysis is that most of the decline occurred in the early 1990s part of the series. The models for the 1994—96 and 1997-99 series each reveal minor, non-statistically signifi-cant fluctuations.3 The changes here are in terms of fractions of one question correct (e.g., from 1999 = .447 more questions correct com-pared to the 1997 baseline). Variances explained by across-year mean differences now are miniscule (and n.s.). It is convincing that a sharp drop in the early 1990s, with a tapering later, was predicted by our infor-mants independently of the time series just described.
Multiple regression analysis has the added strength beyond simple anova (analysis of variance) that smoothed trend lines can be fitted by scoring year as continuous variable (in place of the dummy codes pre-sented in Table 1). Taking the three sets of data separately, these trend line slopes are just as would be expected from the year-by-year figures already seen. The trend is thus B = -0 .930 (significant at p < .0001) for 1991-93, levelling to the small (n.s.) positive figure of .342 for 1994-96 and +0.200 (n.s.) for 1997-99. If, and this may be a large if, the 1993-96 version of the test was of equivalent difficulty to the earlier one, then we can see the downward trend as extending from 1991 up to and including 1995 (B coefficient for those years = -0.822).
The downward drift seen least ambiguously in the 1991-93 series for the Engineering Mathematics Preparedness Test at U W collates with similar data collected at the University of Western Ontario by mathe-matics professor Christopher Essex (1997). To measure a suspected decline in academic preparation of first year engineering students at Western, Essex and several colleagues took a 20-question mathematics diagnostic test first used in 1984 and re-administered it to the 1992 class of first year engineering students. Both in 1984 and 1992 the test was administered during the "opening weeks" of university, with the data on the header page of the test simply changed from 1984 to 1992 for the later sitting. Essex (1997) has published results in graphic form in his own report, but for present purposes we read off the graph in
The Canadian Journal of Higher Education Volume XXX, No. 3, 2000

68 S. Miller & J. Goyder
order to transform his data back into numerical form and re-analyze them. In the Western data, we compute the average (smoothed using OLS regression) decline in score over the nine year interval to be just over half a question question (.592) correct per year, not too different to our 1991-95 coefficient o f - 0 . 8 2 2 from above.4
Professor Opinion Survey
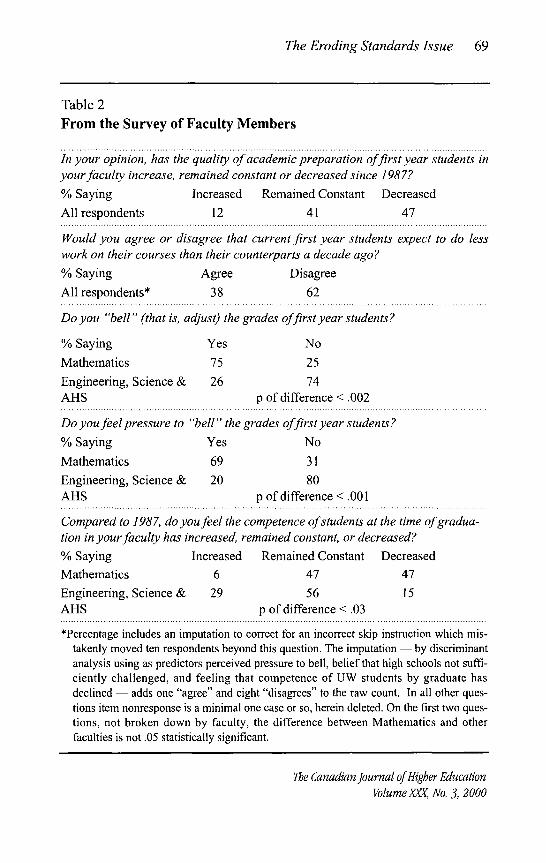
In answer to the fundamental survey question, 47% of respondents felt academic preparation of first year students decreased relative to first year students in 1987 while 41% perceived no trend. Just 12% perceived an increase in preparation as of 1997 relative to 1987 (see Table 2).
Three factors might account for this dissensus among instructors. First, as seen above, there is more than one trend in the time series data. In the early period, and reproducing the findings from Western for the mid-1980s to 1992, erosion of preparation level from high school did occur. By the mid-1990s however, the trend line had leveled out to essentially a steady state. Maybe it is to be expected that results from the survey of faculty member perceptions gave rather divided views, espe-cially given that the years of exposure to first year students does vary within the sample, and the sample size is too small to control this. Secondly, perhaps the division of opinion is re-articulating the point made earlier about how the decline in scores on the diagnostic test accounts for a very small por t ion of variance, even in the crucial 1 9 9 1 - 9 3 per iod . Both s t ronger and weaker s tudents come to the University every year, and as seen in the statistical results the dominant source of variation derives f rom these differences f rom individual to individual. A third factor would return attention to the de-skilling vs. lat-eral skilling issue broached earlier. Dissensus among respondents would indeed occur if some respondents interpret substitution of pencil and paper computational knowledge with computer software manipulation knowledge as skill loss, others as skill lateral shift.
As already explained, the number of faculty combining ten or more years service at U W with extensive first year teaching was just under 80, and the proportion responding to the survey still less. Even this modest data base, however, suggests some differences in perception
The Canadian Journal of Higher Education Volume XXX, No. 3, 2000
The Eroding Standards Issue 69
Table 2 From the Survey of Faculty Members
In your opinion, has the quality of academic preparation offirst year students in your faculty increase, remained constant or decreased since 1987? % Saying Increased Remained Constant Decreased All respondents 12 41 47
Would you agree or disagree that current first year students expect to do less work on their courses than their counterparts a decade ago? % Saying Agree Disagree All respondents* 38 62
Do you "bell" (that is, adjust) the grades offirst year students?
% Saying Yes No Mathematics 75 25 Engineering, Science & 26 74 AHS p of difference < .002
Do you feel pressure to "bell" the grades offirst year students? % Saying Yes No Mathematics 69 31 Engineering, Science & 20 80 AHS p of difference <.001
Compared to 1987, do you feel the competence of students at the time of gradua-tion in your faculty has increased, remained constant, or decreased? % Saying Increased Remained Constant Decreased Mathematics 6 47 47 Engineering, Science & 29 56 15 AHS p of difference <.03
•Percentage includes an imputation to correct for an incorrect skip instruction which mis-takenly moved ten respondents beyond this question. The imputation — by discriminant analysis using as predictors perceived pressure to bell, belief that high schools not suffi-cient ly chal lenged, and feel ing that competence of U W students by graduate has declined — adds one "agree" and eight "disagrees" to the raw count. In all other ques-tions item nonresponse is a minimal one case or so, herein deleted. On the first two ques-tions, not broken down by faculty, the di f ference between Mathemat ics and other faculties is not .05 statistically significant.
The Canadian Journal of Higher Education Volume XXX, No. 3, 2000

70 S. Miller & J. Goyder
across faculty academic units. The greatest sense of decline in preparation among incoming students occurred among mathematics faculty respon-dents. These instructors also reported the most concern about administra-tion pressure to bell grades upward, they were the most likely to see a problem in student expectations of reasonable work load, they tended to report having to dilute the difficulty level of their exams, and they were the most pessimistic about the quality of UW graduates. One informant, on seeing the results from our survey, pointed out that even outside the mathematics faculty, in engineering for example, much of the first year curriculum is devoted to mathematics courses. Since most of these are taught by staff from the Faculty of Mathematics, it is these instructors who are the most likely to witness, and have to deal with, problems of t ransi t ion s tudents encounter be tween high school and universi ty. Implicitly, according to this argument, the early 1990s decline in stan-dards in mathematics was a particular weak spot within the secondary school system, rather than simply one marker of a larger syndrome.
On the expectations issue, many write-in comments were offered by survey respondents. One mathematics professor stated "I have been astonished that my students in Mathematics do not work as hard as stu-dents did 10 years ago. I can not speak for their expectations. They do not live up to mine." Another mathematics professor gave this comment:
. . .what is a more serious problem is the attitude of students. I think that we have been able to address this issue in our own department undergraduate curriculum. A clear message is sent to the students that we expect them to work. To their credit, many do respond to the challenge... The modern philosophy of ' se l f -es teem' and 'outcomes-based ' education has been responsible for a decrease in the expectations from students — the material actually being taught is of a more superficial nature (esp. in mathematics and science). Th i s has naturally led to a change in the attitudes of students. They have a much different attitude of what 'work ' is as compared to students from even 5 -10 years ago. I think that we have done a good job in keeping the waters of mediocrity from flooding our institution as far as (a) impressing upon students the need to
The Canadian Journal of Higher Education Volume XXX, No. 3, 2000

The Eroding Standards Issue 71
develop critical thinking skills and solid work ethic and (b) teaching them the essentials of their chosen disciplines.
According to one engineering professor, students "are willing to work hard, but they want to be spoon fed in a different way. They process information differently." Another engineer offered this explana-tion of the expectations of students: "I ascribe the changes to a philo-sophical change in our t reatment of first year students. Previously standards were set high and a considerable portion of students flunked out or withdrew in the first year. This helped motivate all students and also ensured that the remaining were at least minimally capable. Now the philosophy is to retain all entering students if possible. The new approach is probably more humane, but can't help but result in lowered standards." A mathematics professor offered a solution to adjust the expectations of first year students:
Today's students are more strongly motivated by fear of not being able to get a good job, and they seem ready to work a lit-tle harder... What is certainly clear to me is that, despite the fact that most high school math teachers are competent, students are not given enough work to do. First year is a terrible shock for many of them. Also, for what ever reasons, their grades may not reflect their relative abilities, which is tremendously tough on them, because they are basing their expectations on faulty premises. The kindest thing we could do would be to institute entrance exams of some sort, just to let the students know where they really stand relative to their classmates.
Criticism of the school system was widespread across the survey. One of the science professors articulated the notion that " . . . the public school system shortchanges OAC graduates by failing to provide them with essential skills in reading, comprehension, expression (within the bounds of grammar, spelling and punctuation, that is), and numeracy." An engineering professor told us that "the school system in Ontario, as before, does not challenge the best students." One mathematician offered an example of the lack of challenge encountered by students in high school: "students will acknowledge that in high school they were never given a problem they couldn't immediately solve." Another mathematics
The Canadian Journal of Higher Education Volume XXX, No. 3, 2000

72 S. Miller & J. Goyder
professor expressed fears about changes in high schools: "I worry about the changes we are witnessing in our high schools. I believe that things that are taught there now will become part of our curriculum in the relatively near future. I think that we are not prepared for this shift of responsibility."
According to another mathematics professor, however, high school performance is only one of many aspects that affect students' perfor-mance. This informant said:
I have, on several occasions, taught two sections of first year giving the same lectures, problem sets, tests, and examina-tions, and had as much as 7 or 8% variation in their final grades. Sometimes I can trace it back to incoming high school performance, but more often not. There are a lot of parame-ters which affect student performance.
About three-quarters of engineering respondents indicated that they cover the same amount of material in current first year courses relative to first year courses in 1987. One of the mathematics professors, how-ever, thought that:
.. .students are learning less since [their] curriculum has become 'watered down' (less courses, less material)... However, admin-istrators are reacting quite prematurely and rather irresponsibly to perceived threats of future decreases in enrollments. There are pressures to dilute the curricula even further.
An engineer responded that "students may be less well prepared, but not less competent." Similarly, another engineering professor stated that "students now are as intelligent as before but are not drilled as well in the fundamentals of algebra, geometry, English, physics and chemistry. Their learning and knowledge seems more superficial." And finally, a mathe-matics professor articulated a theme we first heard in the group interview:
. . . the style of questioning, especially for more complicated problems, has changed. There has been a trend to structure questions in a way that leads a student from the beginning, along a series of steps, toward the final goal. Rather than just asking, 'prove or show that... ' we now first ask the student to
The Canadian Journal of Higher Education Volume XXX, No. 3, 2000

The Eroding Standards Issue 73
write down a relevant definition or theorem, (in essence a pretty big hint) and then take that information, make the appropriate substitutions, etc., to eventually arrive at the desired goal . . . problems in current exams. . . are generally more straightforward and less challenging than in the past.
What do these comments sum to? One theme noticeably lacking is any anxiety that the diminished standard attributed by the university instructors to the public school system leads to permanent cognitive h a n d i c a p s . It w o u l d h a v e been in t e l l ec tua l ly f a s h i o n a b l e (e .g . , Blakeslee, 1996; Wilson, 1998) had the survey respondents voiced fears about permanent losses in potential due to insufficient stimulation of the brain chemistry. It intrigued us that these respondents, all natural scien-tists, engineers and mathematicians, conceptualized the issue put to them not in terms of synapses and neuro-transmitters, but in the much softer and sociological vocabulary of first year students' attitudes and expecta-tions. As seen, the likelihood of recovery of standards following some first year trauma to the student's self-esteem was voiced by more than one respondent.
The survey responses thus do more than simply put flesh onto the statistical skeleton from Table 1. They point to interpretations, and tem-per the most pessimistic conclusions that might be reached from the numbers alone.
CONCLUSION
We became persuaded that indeed there did occur some dilution in the level of mathematical preparation of high school graduates entering the University of Waterloo. Our data picked up this trend as of 1991, and saw it level off by mid-decade. The Western data suggest the decline had been under way since the mid-1980s. Taken together, the various sources of data examined here point toward a real but historically specific period of change in mathematical skills among students entering UW. The change was tied up with student attitude and expectation regarding work, according to our survey respondents. The respondents also seemed to tell us that the changes concerned mathematics in particular, not so much non-mathematical, but
The Canadian Journal of Higher Education Volume XXX, No. 3,2000

74 S. Miller & J. Goyder
still scientific skill or knowledge. It bears on interpretation of the data that the years from around 1985 to 1995 marked the coming of age of the home computer (Goyder, 1997), and diffusion of PCs into school classrooms. As our circle of informants had suggested early in the study, part of the issue around mathematical skills concerned the computer mechanization of some of the traditional operational skills. Clearly, the issue of eroding standards is controversial and multi-dimensioned. For us to interpret the findings with adjectives such as weak, moderate or strong serves no useful purpose. For assessing the substance of the early 1990s trend, the data must speak for themselves, and directly to the reader.
The low variance in scores explained by temporal change highlights the heterogeneity of students of each year. This heterogeneity, coupled with the recent leveling off in MDT scores, may be one factor account-ing for the variant perceptions among course instructors. It was clear, nevertheless, that on balance more perceive slippage in preparation than an e n h a n c e m e n t ; the conce rns ra i sed by facu l ty m e m b e r s at the University of Waterloo were not just a nostalgia trip summoning up remembrance of things past, as our opening Shakespearian quotation phrased it. The trend detected with the diagnostic testing was large enough, for all the differences in definition and coverage between the MPT time series and the survey of faculty members, to trigger a corre-sponding perception among a plurality of the university instructors. Something happened in the school system during the latter 1980s and first half decade of the 1990s (see also Casas & Meaghan, 1995), and whether it was primarily administrative, curricular, technological or atti-tudinal one cannot say because such factors are tied up together.
The survey data revealed, however, another facet to the perceptions issue. At Waterloo, there seems to be a difference in workplace culture among faculty in Mathemat ics compared to sister faculties such as Engineering, Science or Applied Health Sciences. Differences between the faculties consistently pass .05 statistical significance even with the small case base gathered for the survey. Judging from the question-naires, many mathematics instructors feel particularly pressured to adjus t their grades. This aspect of the organizational culture of the
The Canadian Journal of Higher Education Volume XXX, No. 3, 2000

The Eroding Standards Issue 75
mathematics faculty seems to make frontline instructors especially par-ticularly sensitive to issues of standards.
Course instructors who feel pressured to inflate grades can point to several commentators who see this as a harmful aspect of the contempo-rary culture of Canadian university life. Bercuson et al. (1984), for example, deplored the growing equality between professors and students and noted classroom course evaluations of teaching as symbolic of the erosion of faculty authority. A recent CJHE paper by Brodie (1998) sus-tains that view in linking favourable course evaluations to easy grading. It is a theme echoed by Emberley (1996), who speaks of the "empower-ment" of students within the Canadian university system over the past 20 years as a cause of grade inflation. According to Emberley (1996): " . . .many students believe and act on the belief that grades are nego-tiable, others see rules and regulations as being subject to personal review, still others think academic decisions are open to endless appeal" (pp. 99-100). He links such empowerment with the determination by government to increase accountability within universities. Further dis-cussion on the issue of grade inflation appears in sources such as Easton (1993), Casas and Meaghan (1995), and Young (1997).
Perhaps inevitably, when two quite different sources of data (i.e., the MPT and faculty survey) are placed side-by-side, as many issues are raised as solved. For example, the conviction among some of the survey informants that under-preparation among university entrants is cor-rected after a reality bath in first year in a way trivializes the whole issue of preparation. If catch-up is that feasible, why worry about high school preparation?
Given such loose ends, we will end by underlining the value of con-tinuing with diagnostic tests of the mathematical skills of incoming stu-dents. Future issues around standards, for example, around concerning the double cohort soon to graduate from Ontario schools, may thereby be better assessed by drawing methodological lessons from the early 1990s shock wave. Given administration resolve, much more could be done with diagnostic data. The tests might be linked with background infor-mation from the Registrar's files, or alternatively a short questionnaire gathering background information might be appended to the test itself.
The Canadian journal of Higher Education Volume XXX, No. 3, 2000

76 S. Miller & J. Goyder
As a reviewer noted, attitudinal and expectation questions should be included in such data-collection, given the outcome of the present study. Any such research should build in an independent assessment of the com-parability of the tests used in different years, in recognition of the lateral skills issue we learned about from the interview with key informants.'*!'1
Notes
' Perception is of course a form of reality that may have important conse-quences, but for present purposes this seems the simplest word for differentiat-ing between the objective and the subjective aspects of the research problem.
2 Complete available results by section and overall are contained in this source. For the most part the break down of results by section shows few differ-ences in performance by year. The trigonometry, analytic geometry and geome-try results show very similar distributions from 1991 to 1996. In 1995, the loga-rithms and differentiation results show slight declines in performance, but these differences are slight and the results return to similar distributions as previous years in 1996. The algebra section has shown the least consistent results of the six sections from 1991 to 1996. The performance of the students on the algebra section in 1991 was very high with most students answering between four and six out of six questions correctly. The 1992 results produce a very different dis-tribution with many students answering only two or three questions correctly out of six questions. The algebra results improved in 1993, although not to 1991 levels, and remained fairly consistent from 1993 to 1996.
3 Although the test is administered to all engineering students, making for a population rather than a sample, the results can be regarded as sample data insofar as we are drawing implications for University of Waterloo students in general.
^ Some of our informants in the Faculty of Mathematics examined the Essex test at our request, with a view to addressing the lateral skills issue. Their conclusion was that, while a core of some 5 to 7 of the 20 questions could be considered valid in any period, at least three concerned issues less important in 1992 than in 1984. In other words, our informants were inclined to feel that to some degree the 1984 to 1992 comparison had exaggerated decline in skills among first year students at Western.
The Canadian Journal of Higher Education Volume XXX, No. 3, 2000
The Eroding Standards Issue 11
References
Barbeau, M., Bruce, I., Clake, J., Morgan, J., Patry, R., & Porter, M. (1977). The role of the university with respect to enrollments and career opportunities, admission policies, continuing education and community colleges. Ottawa, ON: Association of Universities and Colleges of Canada.
Bercuson, D., Bothwell, R., & Granatstein, J. (1984). The great brain robbery: Canada's universities on the road to ruin. Toronto, ON: McClelland and Stewart.
Bercuson, D., Bothwell, R., & Granatstein, J. (1997). Petrified campus: The crisis in Canada's universities. Toronto, ON: Random House of Canada.
Blakeslee, T.R. (1996). Beyond the conscious mind: Unlocking the secrets of the self. New York, NY: Plenum.
Brodie, D.A. (1998). Do students report that easy professors are excellent teachers? Canadian Journal of Higher Education, 28(1), 1-20.
Casas, F., & Meaghan, D. (1995). Grade inf lat ion and universi ty admissions in Ontario: Separating fact from perception. The Canadian Journal of Higher Education, 25(3), 49-70.
Cohen, J., & Cohen, P. (1975). Applied multiple regression/correlation analysis for the behavioral sciences. New York, NY: Erlbaum.
Coutts, S. (1997). Quality of academic preparation of first year students. Honours B.A. Thesis, University of Waterloo.
Easton, S. (1993). Ending the squeeze on universities. Montreal, QC: Institute for Research on Public Policy.
Emberley, P. (1996). Zero tolerance: Hot button politics in Canada's universities. T o r o n t o , O N : P e n g u i n B o o k s .
Essex, C. (1997). Education standards and the role of universities. Organization for Quality Education Forum, 5(4), 7.
Foote, D., & Stoffman, D. (1996). Boom, bust & echo: How to profit from the coming demographic shift. Toronto, ON: Macfarlane, Walter & Ross.
Ford, J. (1995). Freshman retention: An overall approach centered on mathematics assessment. American Society for Engineering Education, 1995 Annual Conference Proceedings, Session 1253, California.
Goyder, J. (1987). The silent minority: Nonrespondents on sample surveys. Cambridge: Polity Press.
Goyder, J. (1997). Technology and society: A Canadian perspective. Peterborough, ON: Broadview.
Horn, M. (1997). The myth of a golden age in higher education. The Globe and Mail, October 28, A23.
The Canadian Journal of Higher Education Volume XXX, No. 3, 2000
78 S. Miller & J. Goyder
Neatby, H. (1953). So little for the mind. Toronto, ON: Clarke, Irwin & Co. Vrscay, E. (1996). 'Come back to reality': Math prof comments on
academic standards. UW Gazette, December 11, 5-6. Wilson, E.O. (1998). Consilience: The unity of knowledge. New York, NY:
Knopf. Young, R. (1997). One professor's credo. University Affairs, Association of
Universities and Colleges of Canada, February, 1011.
The Canadian Journal of Higher Education Volume XXX, No. 3, 2000

![Intestinal Obstruction Due to Retained, Eroding Surgical ... · Intestinal Obstruction Due to Retained, Eroding Surgical Sponge: A Case Report 131 [7] Wattanasirichaigoon S. Transmural](https://img.pdfslide.us/doc/110x75/5e8cd279baba4b78b8137e03/intestinal-obstruction-due-to-retained-eroding-surgical-intestinal-obstruction.jpg)