Embed Size (px)
Citation preview

The Erie County Drug Court: Outcome Evaluation Findings
February 2001
By:
Shelley Johnson Listwan, M.S. Co-Project Director
Deborah Koetzle Shaffer, M.A.
Co-Project Director
and
Edward J. Latessa, Ph.D. Principal Investigator
Center for Criminal Justice Research PO Box 210389
University of Cincinnati Cincinnati, OH 45221-0389
This research was made possible with a grant from the Supreme Court of Ohio. Views expressed are those of the authors and do not necessarily reflect the views of the Supreme Court.

2
Table of Contents Topic Page Acknowledgements 3 List of tables and figures 4 Introduction: 5 Evaluating Drug Courts 5 Site Description 6 Methods 7 Design 7 Sample 7-8 Data Collection 9 Analysis 9 Limitations 9-10 Profile 10 Social Demographics 12 Offense & Disposition 12 Prior Criminal History 13 Drug & Alcohol Abuse History 13-17 Treatment Considerations 17-18 Treatment Needs 18-19 Treatment Retention Rates 19-20 In-Program Behavior and Perceptions 20 Court Reported Violations 20-26 Participant Satisfaction 26-33 Subsequent Criminal Behavior (Recidivism Rates) 33 Termination Information 33 Rearrest Rates 36 Determinants of Rearrest 36 Summary 39 Conclusions 40-41 Recommendations 41-42 Appendix 43

3
Acknowledgements
This report would not have been possible without the cooperation and support of a number of individuals. We would like to thank everyone involved in the project for their time and effort. In particular, we would like to thank the following: Supreme Court of Ohio: Meghan Wheeler, Melissa Knopp, and Chief Justice Moyer. Erie County Drug Court: Judge Ann Maschari, Magistrate Nancy Dellisanti, Mary Bower, Mary Zimmerman, and Amy Montgomery. We also wish to thank all of the drug court treatment staff . University of Cincinnati:
Alex Holsinger, Jamie Price, Chris Lowenkamp, and Robert Brown.

4
List of Tables and Figures
Table 1 Social Demographic Information 11 Table 2 Offense & Prior Record Information 14 Table 3a-b Alcohol & Drug History 15-16 Figure 1 Treatment Needs 21 Table 4 Treatment Needs 22 Table 5a-b Treatment Phase Outcome 23-24 Table 6 Court Reported Violations 25 Figure 2 Satisfaction by Component 27 Table 7a-e Satisfaction Survey Results 28-32 Figure 3 Satisfaction Survey Results 34 Figure 4 Satisfaction Survey Results 34 Figure 5 Satisfaction Survey Results 35 Table 8 Termination Information 37 Table 9 Rearrest Information 38
5
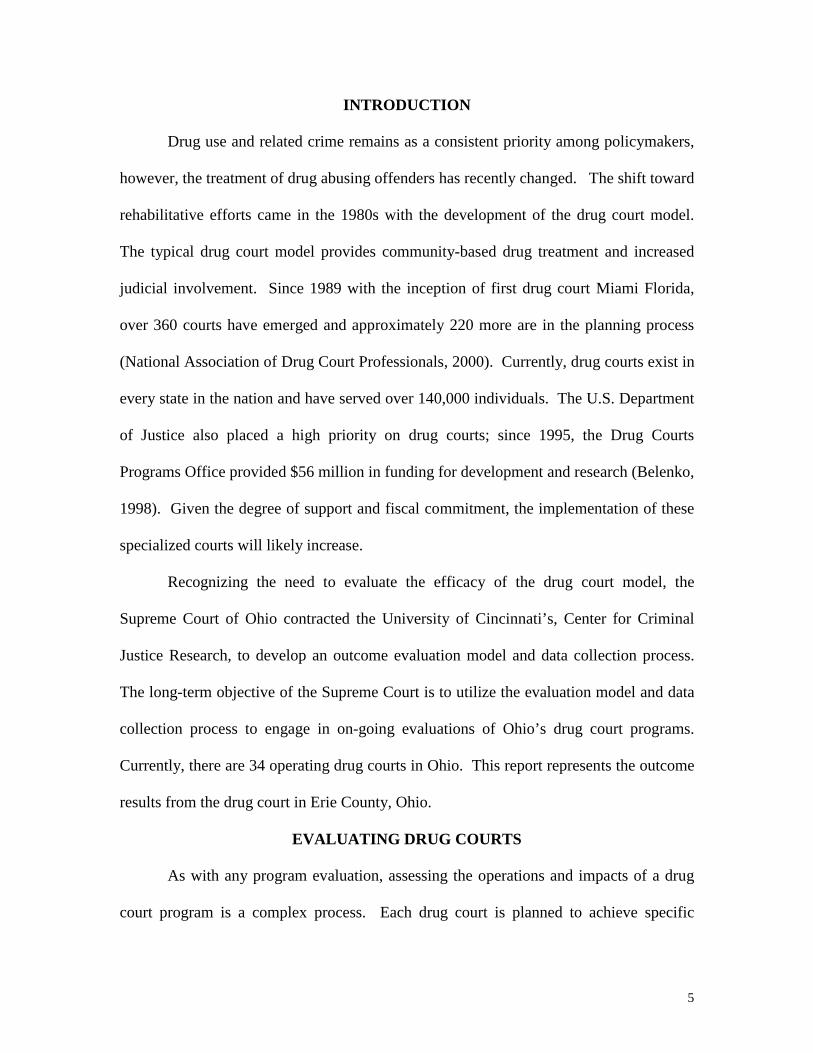
INTRODUCTION
Drug use and related crime remains as a consistent priority among policymakers,
however, the treatment of drug abusing offenders has recently changed. The shift toward
rehabilitative efforts came in the 1980s with the development of the drug court model.
The typical drug court model provides community-based drug treatment and increased
judicial involvement. Since 1989 with the inception of first drug court Miami Florida,
over 360 courts have emerged and approximately 220 more are in the planning process
(National Association of Drug Court Professionals, 2000). Currently, drug courts exist in
every state in the nation and have served over 140,000 individuals. The U.S. Department
of Justice also placed a high priority on drug courts; since 1995, the Drug Courts
Programs Office provided $56 million in funding for development and research (Belenko,
1998). Given the degree of support and fiscal commitment, the implementation of these
specialized courts will likely increase.
Recognizing the need to evaluate the efficacy of the drug court model, the
Supreme Court of Ohio contracted the University of Cincinnati’s, Center for Criminal
Justice Research, to develop an outcome evaluation model and data collection process.
The long-term objective of the Supreme Court is to utilize the evaluation model and data
collection process to engage in on-going evaluations of Ohio’s drug court programs.
Currently, there are 34 operating drug courts in Ohio. This report represents the outcome
results from the drug court in Erie County, Ohio.
EVALUATING DRUG COURTS
As with any program evaluation, assessing the operations and impacts of a drug
court program is a complex process. Each drug court is planned to achieve specific

6
outcomes for identified types of cases or offenders. While some program impacts are
common to all courts (reduced criminality, reduced substance abuse, etc.), the
characteristics of participants, treatment options, monitoring activities, and sanctions vary
across sites. The statewide evaluation system was designed to handle differences
between the courts while also producing summary information about drug courts in
general.
A drug court program can be viewed as a process designed to produce specific
impacts, much like a manufacturing operation. The program has inputs (offenders and
offenses, staff, resources), throughput (procedures, treatments, sanctions) and outputs
(changes in recidivism and substance abuse). The drug court evaluation required the
measurement of each component. The impact or effect of drug court programming can
be understood against a benchmark of what would be expected had there been no court
program. The outcome evaluation is designed to compare the drug court products
(recidivism rates, relapse, severity of addiction) with similar measures for cases that did
not participate in the drug court program. Ideally, the evaluation would enable us to
attribute any observed differences to the drug court.
SITE DESCRIPTION
This report contains data from an outcome evaluation conducted on the Erie
County Common Pleas Drug Court. The evaluation compared those who participated in
the drug court with those designated as comparison cases to determine whether
participation in the drug court was associated with differences in outcome. The Erie
County Drug Court, located in Sandusky Ohio, began in April 1996. The target
population included drug dependent adults charged with a non-violent drug or alcohol

7
related misdemeanor or felony offense. To qualify for the drug court the client had to
apply through the Public Defender’s Office. Background checks were then conducted
and provided to the Public Defenders office, the Prosecutor’s office, and the Drug Task
Force. If the parties approved the applicant, the treatment agency provided an assessment
of drug and alcohol dependency. The results were then given to all involved parties and a
hearing with the judge was scheduled to determine whether the client should enter the
program.
METHODS
Research Design
This project used a quasi-experimental matched comparison group design in order
to estimate the impact of the drug court on future criminal involvement. Random
assignment to groups was not feasible; however, groups were matched with regard to
selected demographic characteristics (race and gender), as well as the presence of a
substance abuse problem. The criteria for inclusion in the comparison group were that
each participant must have (1) a reported substance abuse problem, and (2) be eligible for
the drug court program. The sample includes cases screened for the program during the
time period of May 1997 to August 1999. A total of 39 offenders were in the treatment
group, and 48 were identified as comparison cases.
Treatment Group
Individuals who are eligible and willing to participate in court mandated drug
treatment were required to attend status review hearings in front of the judge and attend
four phases of chemical dependency treatment. In the first phase of treatment,
participants engaged in a six to eight week intensive outpatient (IOP) program.

8
Programming was provided four days per week for three hours per day. The services
offered include individual and group counseling, crisis intervention services,
occupational therapy, activities therapy, expression therapy (art, drama, poetry, music,
movement), and drug screening. The agency also provided alcohol and drug education,
relapse prevention education, and individual counseling once a week. Family counseling
sessions were also provided to willing family members. Phase II, called continuing care,
included group and individual counseling for five hours a week for approximately twelve
weeks. Phase III, also considered continuing care, offered group and individual
counseling for three hours a week for eight weeks. Phase IV offered services once a
week for the remainder of the program. The total amount of time between phases I to IV
spanned an average of 17 months. Successful completion of the treatment program
required that the client comply with all conditions set out by the court, attend court
hearings, comply with treatment goals, provide clean drug and alcohol screens, attend
AA/NA meetings, develop a sober support system, and not be charged with any new
violations. Placement into additional services such as residential and inpatient
hospitalization was determined on a case-by-case basis.
Comparison Group
The comparison group included in the present study consisted of men and women
who were eligible for drug court, but for a variety of reasons did not receive drug court
services. This group of clients did in fact have a drug abuse problem; however, they
either refused drug treatment or were rejected by the treatment provider. Although this
was not an ideal comparison group, differences between the two groups were statistically
controlled.

9
Data Collection
As part of the Supreme Court project, the University of Cincinnati created an
automated database to assist courts with data collection and provide a mechanism for
reporting results. The database was installed at the Erie County Drug Court in 1997.
Erie County Drug Court personnel collect and enter the data into this automated system.
The data collected include: basic offender demographics, offense and disposition, prior
criminal history, drug use and treatment history, current treatment needs, treatment
placement and outcome, court reported violations, satisfaction with the drug court and its
process, and termination status of drug court participants. Recidivism data were collected
during September and October of 2000.
Analysis
This study examines the differences among the drug court participants and
comparison group members along a variety of measures. In some circumstances data
were not collected for the comparison group cases. When this is the case only data from
the treatment group is presented. The primary dependent variable was rearrest rates for
the drug court and comparison groups. Chi-square and t-tests were conducted to examine
the differences between the groups, and logistic regression was used to estimate the
probability of rearrest.
Limitations
There are several limitations of this study. First, the small sample size prohibited
the use of treatment completion and dropout rates as a measure of outcome among the
drug court population. Further, although the Erie County drug court has been in
existence since 1996, the data indicated that the court has only graduated five

10
participants. The small number of graduates limits the analysis that could be conducted.
The second major limitation concerns the comparison group. Despite efforts to match the
two groups on important characteristics, the fact remains that the offenders selected for
the comparison group were either not willing or not deemed appropriate by the treatment
provider to participate in the drug court. As a result, comparisons between the two
groups with regard to outcome must be viewed with caution. Third, the court did not
collect supervision or court reported violation data on comparison group cases. As a
result, we do not know what, if any treatment and supervision the comparison group
received, nor do we know how well they met any requirements imposed by the court.
This information would have allowed us to explore differences in outcome in more detail.
Despite these limitations, we believe that the results from this study provide an accurate
profile of the Erie County drug court participants as well as their outcome with regard to
outcome.
RESULTS
Social demographic data were collected in an effort to describe the drug court and
comparison groups, and to investigate whether differences in outcome were related to
individual differences within the two samples. Moreover, knowing the population served
by the drug court allows us to determine whether case outcome was influenced by any of
these factors. This section profiles the two groups based on basic demographic
characteristics such as age, race, gender, marital status, education level, employment
status, and criminal history. This section will address the following questions:
• What are the characteristics of the offenders served by the Erie County drug court? • What if any differences exist between the drug court and comparison groups with
regard to demographics, current offense, disposition, and prior history factors?

11
Table 1. Frequency and percentage distribution of participants’ intake information. Treatment Control N % N % Characteristics (N = 39) (N = 48) Race: White 17 44.7 22 45.8 Black 20 52.6 26 53.5 Hispanic 1 2.6 0 0.0 Gender: Male 28 71.8 36 73.6 Female 11 28.2 12 25.0 Age: 18 – 22 15 38.5 17 36.2 23 – 27 8 20.5 4 8.5 28 – 32 2 5.1 6 12.8 33 – 37 5 12.8 12 25.5 38 – 42 8 20.5 3 6.4 43 and above 1 2.6 5 10.6 Mean 28.4 39.6 Marital Status: Married 7 17.9 14 29.2 Not Married 32 82.1 34 70.8 Highest Grade Completed: Less than High School Graduate 15 38.5 21 43.8 High School Graduate 18 46.2 22 45.8 Post High School 6 15.4 5 10.4 Hours Per Week Worked: 35 hours or more a week 11 29.7 11 22.9 15- 34 hours a week 9 24.3 5 10.4 Less than 15 hours a week 1 2.7 1 2.1 Zero hours (outside home) 16 43.2 31 64.6

12
Social Demographic Information
Table 1 compares the two groups race, gender, age, martial status, education
level, and employment. Although some minor differences exist, none were statistically
significant. With regard to race and gender, slightly more individuals in both groups
were African American and male. Similarities also exist with regard to age, as the typical
client in the treatment group was 28 years of age and the comparison group was 30 years
of age. Individuals in the treatment group were more likely to be unmarried (82%) than
the comparison group (71%). The two groups, however, were very similar with regard
to education level, with about 46 percent of the treatment and comparison groups
reporting a high school diploma. Finally, slightly more individuals in the comparison
group were unemployed at the time they were screened for the drug court. Again, none
of these differences were statistically significant, and overall the data indicate that the
two groups were fairly well matched on basic social demographic characteristics.
Offense and Disposition Information
As illustrated by Table 2, the two groups were also similar with regard to charge
or offense information. It appears that 42 percent of the treatment group and 41 percent
of the comparison group were arrested on a drug or drug related crime. However, the
treatment group was more likely to be charged with theft, and the comparison group with
trafficking. It also appears that drug court participants were most likely to be sentenced
to drug treatment and testing, with a few clients sentenced to ISP and restitution. The
drug court staff did not collect disposition data on comparison group cases.

13
Prior Criminal History
Table 2 illustrates the number of prior arrests among the drug court and
comparison group members. Of those with a prior record,1 67 percent of the treatment
group and 71 percent of the comparison group reported a prior felony arrest record;
however, members of the treatment group were less likely to have multiple prior felony
arrests. In contrast, there is a significant difference between the two groups with regard
to prior misdemeanor arrests; nearly 80 percent of the treatment group had a prior
misdemeanor record compared to 48 percent of the comparison group. The treatment
group members were also less likely to have a prior record that contained multiple
misdemeanor offenses.
Drug & Alcohol Abuse History
A majority of the participants entering the drug court were assessed with the
MAST. The data in Table 3 indicate that 95 percent of the treatment group and 52
percent of the comparison group were assessed upon intake. Participants in this study
were also asked a variety of questions related to their drug and alcohol use. With regard
to primary drug of choice, marijuana, crack/cocaine, and alcohol were the three most
commonly cited drugs between both groups. The same trend continues for the second
drug of choice, however, more individuals in the treatment group cited alcohol first
followed by marijuana and then crack/cocaine. The comparison group participants
preferred alcohol followed by crack/cocaine and then marijuana. The same three drugs
are again listed as important in the third drug of choice, however a small group of clients
in both groups also mention hallucinogens.
1 We were unable to delineate whether an individual had no prior record or whether the data were missing. As a result, the prior record information is limited to those with a prior record.

14
Table 2. Frequency and percentages of participants’ offense information2.
Treatment Control N % N % Characteristics (N = 39) (N = 48) Current Offense: Drug 17 43.6 19 41.3 Theft 10 25.6 2 4.3 Trafficking 12 30.8 23 50.0 System Violation 0 0.0 1 2.2 Domestic Violence 0 0.0 1 2.2 χ = 8.632; p = .013 Disposition:
Drug Testing Yes 36 100.0 --- ---
Drug Treatment Yes 35 97.2 --- ---
Intensive Supervision Probation Yes 1 3.0 --- ---
Restitution Yes 1 3.0 --- --- Prior Felony Record: Yes 13 66.7 14 70.8 Number of Prior Felony Arrests: One 9 69.2 5 35.7 Two 1 7.7 3 21.4 Three 0 0.0 5 35.7 Four or More 3 23.1 1 7.1 Mean 2.15 2.14 Prior Misdemeanor Record: Yes 31 79.5 23 48.0 Number of Prior Misdemeanor Arrests: One to Three 14 45.2 6 26.1 Four to Six 7 22.6 2 8.7 Seven to Nine 5 16.1 3 13.0 Ten to Twelve 1 3.2 2 8.7 Thirteen or more 4 12.9 10 43.5 Mean 5.8 11.8 F= 6.625; p = .013 ______________________________________________________________________________
2 N may not always sum to 39 and 48 due to missing data.

15
Table 3. Frequency and percentage distribution of participants’ drug intake history. Treatment Control
N % N % Characteristics (N = 38) (N = 48) Did Offender Receive Drug Assessment: Yes 37 94.9 22 52.4 No 2 5.1 20 47.6 Primary Drug of Choice: Alcohol 6 15.4 12 27.3 Marijuana 17 43.6 16 36.4 Crack/Cocaine 14 35.9 14 31.8 Narcotics 1 2.6 2 4.5 Depressants 1 2.6 0 0.0 Second Drug of Choice: Alcohol 21 61.8 10 43.5 Marijuana 8 23.5 5 21.7 Crack/Cocaine 4 11.8 8 34.8 Narcotics 1 2.9 0 0.0 Third Drug of Choice: Alcohol 4 26.7 2 22.2 Marijuana 5 33.3 4 44.4 Crack/Cocaine 1 6.7 2 22.2 Stimulants 1 6.7 0 0.0 Hallucinogens 3 20.0 1 11.1 Other 1 6.7 0 0.0 Age of First Alcohol Use: 10 – 13 9 25.0 8 36.4 14 – 17 19 52.8 8 36.4 18 – 22 7 19.4 4 18.2 23 – 27 1 2.8 2 9.1 Mean 15.8 15.7 Frequency of Alcohol Use: Daily 9 25.7 6 27.3 Once a week 20 57.1 14 63.6 Less than once a week 6 17.1 2 9.1
16
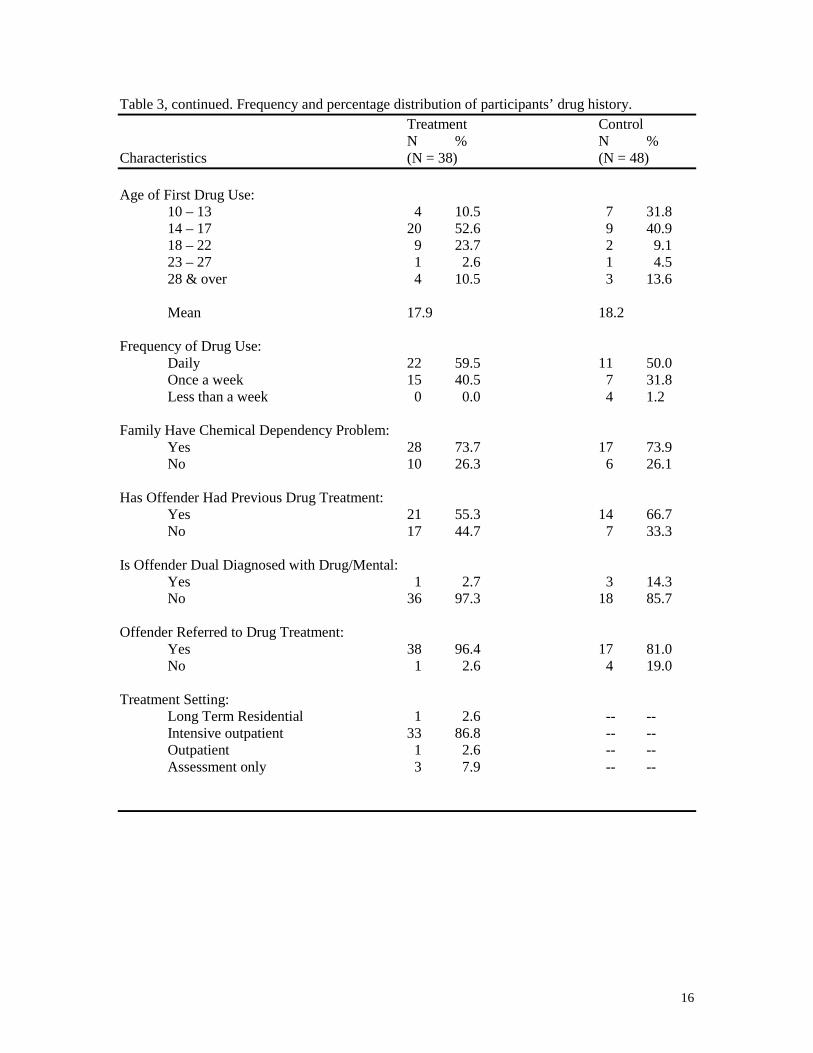
Table 3, continued. Frequency and percentage distribution of participants’ drug history. Treatment Control
N % N % Characteristics (N = 38) (N = 48) Age of First Drug Use: 10 – 13 4 10.5 7 31.8 14 – 17 20 52.6 9 40.9 18 – 22 9 23.7 2 9.1 23 – 27 1 2.6 1 4.5 28 & over 4 10.5 3 13.6 Mean 17.9 18.2 Frequency of Drug Use: Daily 22 59.5 11 50.0 Once a week 15 40.5 7 31.8 Less than a week 0 0.0 4 1.2 Family Have Chemical Dependency Problem: Yes 28 73.7 17 73.9 No 10 26.3 6 26.1 Has Offender Had Previous Drug Treatment: Yes 21 55.3 14 66.7 No 17 44.7 7 33.3 Is Offender Dual Diagnosed with Drug/Mental: Yes 1 2.7 3 14.3 No 36 97.3 18 85.7 Offender Referred to Drug Treatment: Yes 38 96.4 17 81.0 No 1 2.6 4 19.0 Treatment Setting: Long Term Residential 1 2.6 -- -- Intensive outpatient 33 86.8 -- -- Outpatient 1 2.6 -- -- Assessment only 3 7.9 -- --

17
The age of first exposure to alcohol and the frequency of current use were very
similar between the two groups. The average age of first alcohol use was 16 for both the
treatment and comparison group, and the majority indicated that they used alcohol once a
week. Also worth noting is that 26 percent of the treatment group and 27 percent of the
comparison group used alcohol daily.
Age of first exposure and frequency of drug use were also similar between the
two groups. The typical client in both groups began using drugs around the age of 18,
however, only 11 percent of the treatment group, compared to 32 percent of the in the
comparison group started using drugs during early adolescence (10-13 years of age).
Capturing the frequency of the current use allows for an accounting of the severity of the
clients drug use problem. Nearly 60 percent of the treatment group and 50 percent of the
comparison group used drugs on a daily basis.
Telling, however, is the number of individuals that have a family member with a
chemical dependency problem. A clear majority in both groups (74 percent) have at least
one family member with a chemical dependency problem. Moreover, a majority, (55%
of the treatment group and 67% of the comparison group) have also previously engaged
in drug treatment. In sum, it appears that the clients in both groups have a drug and
alcohol treatment need, have been using since a young age, have family members with a
chemical dependency problem, and have previously engaged in treatment.
Treatment Considerations
An effective outcome evaluation depends on whether the researcher knows what
happened to the client while under drug court supervision. This may include
documenting whether a participant moved to different phases based on progress and the

18
outcome of treatment. Throughput data allow us to document the drug court treatment
and determine how differences in treatment are related to differences in case outcome.
The purpose of this section is to identify treatment needs and retention rates. The specific
questions addressed were:
• What were the treatment needs presented by drug court participants? • What was the treatment retention rates among participants as they proceeded
through the treatment program? Treatment Needs
Logically, drug-abusing offenders have drug and alcohol problems, however, they
often have other needs in the areas of housing, mental and physical health, family
circumstances, employment, and education. Each drug court participant was asked to
provide information relevant to each of these areas and the counselor rated whether the
problem was chronic, frequent, situational, or non-existent. Figure 1 lists the areas of
need in order of most severe or chronic to least. Table 4 delineates the areas of need
among drug court participants3. As expected, nearly everyone indicated that they had a
problem with drug abuse. Moreover, roughly half of the sample indicated that their
alcohol problem could be considered chronic or frequent, whereas the other 50 percent
saw their alcohol problem as situational. Of those who consider housing an important
need, 38 percent felt it is occasional and only 13 percent felt housing is a frequent or
chronic problem in their life. Mental health was not an area of great concern for most of
the participants. The results are more mixed when it relates to family problems.
Specifically, Table 4 indicates that 25 percent have chronic or continuous family
problems, however, 44 percent felt it was only an occasional problem. Moreover, 31
3 Data on comparison group members were not available.

19
percent indicated no family problems at this time. However, 31 percent indicate they
have occasional problems with their physical health. With regard to employment status,
38 percent indicate that they are in need of employment assistance at least occasionally
and 25 percent indicate this is a frequent problem they experience. Finally, the vast
majority, 78 percent, do not consider their educational background as a problem.
Treatment Retention Rates
The retention rate among drug courts across the nation averages 70 percent for
drug court participants (Drug Court Programs Office, 1999). The Erie County Drug
Court has not accepted very many cases, therefore, the data on treatment outcome was
fairly limited. As indicated in the description of the treatment sample, the vast majority of
participants begin treatment in the intensive outpatient phase. Data in Table 5 indicate
that 87 percent of those who began treatment in the intensive outpatient phase completed
this phase. Of those who did not complete treatment, 33 percent were referred to another
level of care, 50 percent were considered non-compliant, and 17 percent absconded. In
the second phase of treatment, 89 percent began the outpatient phase. Of those
individuals, 75 percent completed treatment. Of those who did not complete treatment, 14
percent were referred to another level of care, 29 percent were considered non-compliant,
and 57 percent did not finish because of “other” reasons. According to the court, this
may include those individuals with a pending charge or a positive drug screen. Finally,
in the third phase of treatment, 86 percent were still in outpatient. Of those individuals,
87 percent completed the third phase. Those who did not complete treatment were
referred to another level of care. In sum, it appears that the drug court participants

20
exhibit multiple needs that should be addressed by treatment. In addition, the data
indicate that the treatment agency was able to retain a majority of its clients in treatment4.
In-Program Behavior and Perceptions
The purpose of this section is to address behavior while in the drug court program
as well as participant satisfaction with the process. In-program behavior, as measured by
technical violations and satisfaction, can have a significant impact on treatment retention
and behavioral change. Data were only available on drug court participants. Questions
addressed in this section will include:
• What were the court reported violation rates for the drug court participants? • Among those charged with a violation, what are the sanctions given for violations? • What is the level of satisfaction with the process among drug court participants?
Court Reported Violations
Table 6 indicates that 18 percent of the treatment group received a court violation
while under the supervision of the drug court. Of those with a technical violation, 4
percent were rearrested, 2 percent failed to appear in court, 25 percent had a positive
urine screen, 3 percent absconded, 37 percent were non-compliant with treatment, and 28
received a technical violation that was defined as ‘other’ by the drug court staff. Of those
who violated, the mean number of violations received during this follow-up period is six.
The court chose to use a number of sanctions for those who received a court
ordered violation. Table 6 shows that 29 percent were given a sanction classified as
‘other’. According to the court, this includes attending extra AA/NA meetings or writing
4 Missing data due to incomplete treatment records limited treatment phase status information on some

21
Figure 1
Percent Exhibiting Various Treatment Needs
Combines chronic and fequent disruption categories
97
47
25 25 2212.6
3.1 3.1Drug
AlcoholFamily
EmploymentEducation
HousingMental Health
Physical Health
0
20
40
60
80
100
cases. This data, although informative, should be viewed with caution.

22
Table 4. Frequency and percentage distribution of participants’ treatment activity. Treatment N % Characteristics (N = 38) Alcohol Abuse Need: Chronic, Severe disruption 13 40.6 Frequent disruption 2 6.3 Situational/Occasional problems 16 50.0 No disruption of functioning 1 3.1 Housing Need: Chronic, Severe disruption 2 6.3 Frequent disruption 2 6.3 Situational/Occasional problems 12 37.5 No disruption of functioning 16 50.0 Mental Health Need: Chronic, Severe disruption 1 3.1 Frequent disruption 0 0.0 Situational/Occasional problems 6 18.8 No disruption of functioning 25 78.1 Drug Abuse Need: Chronic, Severe disruption 25 78.1 Frequent disruption 6 18.8 Situational/Occasional problems 0 0.0 No disruption of functioning 1 3.1 Family Need: Chronic, Severe disruption 1 3.1 Frequent disruption 7 21.9 Situational/Occasional problems 14 43.8 No disruption of functioning 10 31.3 Physical Health Need: Chronic, Severe disruption 0 0.0 Frequent disruption 1 3.1 Situational/Occasional problems 10 31.3 No disruption of functioning 21 65.6 Employment Need: Chronic, Severe disruption 3 9.4 Frequent disruption 5 15.6 Situational/Occasional problems 12 37.5 No disruption of functioning 12 37.5 Education Need: Frequent disruption 3 9.4 Situational/Occasional problems 4 12.5 No disruption of functioning 25 78.1 _____________

23
Table 5. Frequency and percentage distribution of participants’ treatment activity. Treatment N % Characteristics (N = 38) First Treatment Setting: Long Term Residential 1 3.0 Short Term Residential 0 0.0 Intensive Outpatient 31 93.9 Outpatient 1 3.0 Aftercare 0 0.0 Outcome of Placement: Completed phase 27 87.1 Did not complete phase 4 12.9 Reason for Not Completing Placement: Referred to another level of care 2 33.3 Non-compliance 3 50.0 Absconded 1 16.7 Revoked 0 0.0 Other 0 0.0 Second Treatment Setting: Long Term Residential 0 0.0 Short Term Residential 2 7.1 Intensive Outpatient 1 3.6 Outpatient 25 89.3 Aftercare 0 0.0 Outcome of Placement: Completed Phase 18 75.0 Did not Complete Phase 6 25.0 Reason for not Completing Phase: Referred to another level of care 1 14.3 Non-compliance 2 28.6 Absconded 0 0.0 Revoked 0 0.0 Other 4 57.1

24
Table 5. Frequency and percentage distribution of participants’ treatment activity, continued. Treatment N % Characteristics (N = 38) Third Treatment Setting: Long Term Residential 0 0.0
Short Term Residential 2 9.5 Intensive Outpatient 1 4.8 Outpatient 18 85.7 Aftercare 0 0.0
Outcome of Placement: Completed Phase 13 86.7 Did not complete phase 2 13.3 Reason for not Completing Placement: Referred to another level of care 2 100.0 Non-compliance 0 0.0 Absconded 0 0.0 Revoked 0 0.0 Other 0 0.0 Fourth Treatment Setting: Long Term Residential 0 0.0 Short Term Residential 1 6.3 Intensive Outpatient 2 12.5 Outpatient 5 31.3 Aftercare 8 50.0 Outcome of Placement: Completed Phase 9 90.0 Did not Complete Phase 1 10.0 Reason for not Completing Placement: Referred to another level of care 0 0.0 Non-compliance 0 0.0 Absconded 0 0.0 Revoked 0 0.0 Other 2 100.0

25
Table 6. Frequency and percentage distribution of participants’ supervision activity.
Treatment N %
Characteristics (N = 38) Court Reported Violations: Yes 29 17.7 Type of Violation Reported:
New Arrest 7 4.3 Failure to Appear 4 2.4 Positive Urine Screen 41 25.0 Absconded 5 3.0
Non-compliance with treatment 61 37.2 Other 46 28.0 Number of Violations Received: One to Three 10 34.5 Four to Six 9 31.0 Seven to Nine 7 24.1 Ten or more 3 10.3 Sanctions for Violations: Bench Warrant 7 4.3 Jail 17 10.6 Curfew 7 4.3 Community Service 12 7.5 House Arrest 17 10.6 Electronic Monitoring 8 5.0 Change in Drug Testing 12 7.5 Change in treatment intensity 35 21.7 Other 46 28.6

26
a paper related to their behavior. In addition, the court chose to increase or change the
intensity of treatment (22%), place the client on house arrest (11%) or send the client to
jail (11%). Other sanctions utilized less frequently included bench warrants, curfew
restrictions, community service, electronic monitoring, and a change in the frequency of
drug testing.
Participant Satisfaction
Drug court clients were asked to complete a self-report survey of their level of
satisfaction with the drug court process, the judge, the probation staff, and the treatment
staff. All drug court clients were asked to complete the 36-item survey. Figure 2
displays the overall satisfaction with each component (i.e., Judge, probation, and
treatment) on a variety of indicators. The strongly agree and agree were summed to
create an overall percentage satisfied with each component. On average, all of the drug
court participants are generally satisfied with the drug court and its process. Table 7
indicates that a clear majority of the participants felt the judge treated them with respect,
was fair, concerned, and helped them stay drug free. The majority also indicated that
they did not feel the judge expected too much of them. The same trends hold for the
relationship to the probation officer the treatment staff. As indicated in Figures 3 & 4, a
clear majority felt that the drug court was easier than prison or jail, however, not easier
than probation. The participants cited that their participation in the drug court should
help them avoid drugs in the future, they were better off in general, and were personally
helped through their participation in the court. Figure 5 displays the overall satisfaction
with each requirement imposed during their participation in drug court. In sum, it
appears that the majority of clients received violations related to their compliance with

27
Figure 2
Overall Agreement by Component
Response 'strongly agree' and 'agree' summed
Judge Probation Treatment0
20
40
60
80
100
RespectfulFairConcernedReduced Drug UseExpected too much
Respectful 96.5 93.1 96.6Fair 93.1 93.1 93.1
Concerned 85.7 96.5 100Reduced Drug Use 75.9 82.2 100Expected too much 28.6 17.9 31

28
Table 7. Frequency and percentage distribution of participants’ satisfaction survey information. Treatment Characteristic N %
SURVEY FOR DRUG COURT CLIENTS
The judge treated me with respect
Strongly agree 15 51.7 Agree 13 44.8 Disagree 1 3.4 Strongly disagree 0 0.0 The judge was fair
Strongly agree 11 37.9 Agree 16 55.2 Disagree 2 6.9 Strongly disagree 0 0.0 The judge was concerned about me
Strongly agree 8 28.6 Agree 16 57.1 Disagree 3 10.7 Strongly disagree 1 3.6 Visits with the judge helped me to stay drug free
Strongly agree 12 41.4 Agree 10 34.5 Disagree 5 17.2 Strongly disagree 2 6.9 The judge expected too much of me
Strongly agree 1 3.6 Agree 7 25.0 Disagree 10 35.7 Strongly disagree 10 35.7 My probation officer treated me with respect
Strongly agree 14 48.3 Agree 13 44.8 Disagree 2 6.9 Strongly disagree 0 0.0 My probation officer was fair
Strongly agree 13 44.8 Agree 15 51.7 Disagree 1 3.4 Strongly disagree 0 0.0

29
Table 7. Frequency and percentage distribution of participants’ satisfaction survey information, continued. Treatment Characteristic N % My probation officer was concerned about me
Strongly agree 13 44.8 Agree 15 51.7 Disagree 1 2.5 Strongly disagree 0 0.0 Visits with my probation officer helped me to stay drug free
Strongly agree 11 39.3 Agree 12 42.9
Disagree 4 14.3 Strongly disagree 1 3.6 My probation officer expected too much of me
Strongly agree 1 3.6 Agree 4 14.3 Disagree 15 53.6 Strongly disagree 8 28.6 The treatment staff treated me with respect
Strongly agree 16 55.2 Agree 12 41.4 Disagree 1 3.4 Strongly disagree 0 0.0 The treatment staff was fair
Strongly agree 16 55.2 Agree 11 37.9 Disagree 3 6.9 Strongly disagree 0 0.0 The treatment staff was concerned about me
Strongly agree 17 60.7 Agree 11 39.3 Disagree 0 0.0 Strongly disagree 0 0.0 Visits with the treatment staff helped me to stay drug free
Strongly agree 18 62.1 Agree 11 37.9 Disagree 0 0.0 Strongly disagree 0 0.0

30
Table 7. Frequency and percentage distribution of participants’ satisfaction survey information, continued. Treatment Characteristic N % The treatment staff expected too much of me Strongly agree 5 17.2 Agree 4 13.8 Disagree 10 34.5 Strongly disagree 10 34.5 It helped me appear in court on a regular basis
Strongly agree 9 31.0 Agree 17 58.6 Disagree 2 6.9 Strongly disagree 1 3.4 It helped me to report to my probation officer on a regular basis
Strongly agree 5 17.9 Agree 18 64.3 Disagree 4 14.3 Strongly disagree 1 3.6 It helped me attend treatment on a regular basis
Strongly agree 12 41.4 Agree 15 51.7 Disagree 1 3.4 Strongly disagree 1 3.4 Drug Court was easier than jail or prison
Strongly agree 19 67.9 Agree 8 28.6 Disagree 1 3.6 Strongly disagree 0 0.0 Drug Court was easier than regular probation
Strongly agree 5 18.5 Agree 8 29.6 Disagree 12 44.4 Strongly disagree 2 7.4 I think that my participation in the Drug Court will help me avoid drug use in the future
Strongly agree 20 69.0 Agree 9 31.0 Disagree 0 0.0 Strongly disagree 0 0.0

31
Table 7. Frequency and percentage distribution of participants’ satisfaction survey information, continued. Treatment Characteristic N % In general, I am better off for participating in Drug Court as opposed to other court sanctions
Strongly agree 19 65.5 Agree 10 34.5 Disagree 0 0.0 Strongly disagree 0 0.0 I was personally helped through participation in Drug Court
Strongly agree 14 48.3 Agree 14 48.3 Disagree 3 3.4 Strongly disagree 0 0.0 Residential Treatment Poor 0 0.0 Good 4 14.3 Excellent 4 14.3 Did not participate 20 71.4 Outpatient Treatment
Poor 0 0.0 Good 11 39.3 Excellent 16 57.1 Did not participate 1 3.6 Intensive Probation Treatment Poor 1 3.4 Good 9 31.0 Excellent 5 17.2 Did not participate 14 48.3 Regular Probation Supervision
Poor 1 3.6 Good 12 42.9 Excellent 8 28.6 Did not participate 7 25.0 Electronic Monitoring
Poor 1 3.7 Good 3 11.1 Excellent 3 11.1 Did not participate 20 74.1

32
Table 7. Frequency and percentage distribution of participants’ satisfaction survey information, continued. Treatment Characteristic N % Community Service
Poor 0 0.0 Good 3 11.5 Excellent 3 11.5 Did not participate 20 76.9 Drug Testing
Poor 3 10.7 Good 11 39.3 Excellent 14 50.0 Did not participate 0 0.0 AA/NA
Poor 1 3.7 Good 11 40.7 Excellent 15 55.6 Did not participate 0 0.0 Previous Trouble with the Law Yes 19 67.9 No 9 32.1 Previous Substance Abuse Treatment Yes 13 46.4 No 15 53.6

33
treatment, but feel very satisfied with the drug court process and the members of the drug
court team.
Case Outcome & Subsequent Criminal Behavior
The main purpose of an outcome evaluation is to determine the impact of the
intervention, in this case the drug court, on behavior. The commonly used measure of
behavior is recidivism. Hence, the purpose of this section is to address the recidivism
rates between the two groups and identify factors associated with outcome. A number of
research questions are examined.
• What were the completion rates among drug court participants? • What was the rearrest rates among the experimental and comparison groups? • What was the rate of time to elapse between initial arrest to rearrest among the two
groups? • What were the determinants or factors associated with recidivism?
Termination Information
As indicated by Table 8, only 5 clients have successfully graduated from the
program. The data indicate that those five individuals had their original charges
dismissed as a result of their successful completion and one had his or her record
expunged. Of those who did not successfully complete the program, five (33 percent)
were termination, 1 (7 percent) absconded, and 4 (27 percent) were listed as failing for
other reasons. Other reasons may include failing to comply with all sanctions or still
having a pending charge or sanction.

34
Figure 3
Drug Court was easier than jail or prison
Survey Response0
20
40
60
80
100
Strongly AgreeAgreeDisagree
Strongly Agree 67.9Agree 28.6
Disagree 3.6
Figure 4
Drug Court was easier than regular probation
Survey Response0
20
40
60
80
100
Strongly AgreeAgreeDisagreeStrongly Disagree
Strongly Agree 18.5Agree 29.6
Disagree 44.4Strongly Disagree 7.4

35
Figure 5
Percent Satisfied with Requirements
Responses 'Excellent' and 'Good' Summed
100 96.3 95.2 93.3
44.3
Outpatient AA/NA Probation ISP Drug Testing0
20
40
60
80
100
Satisfied

36
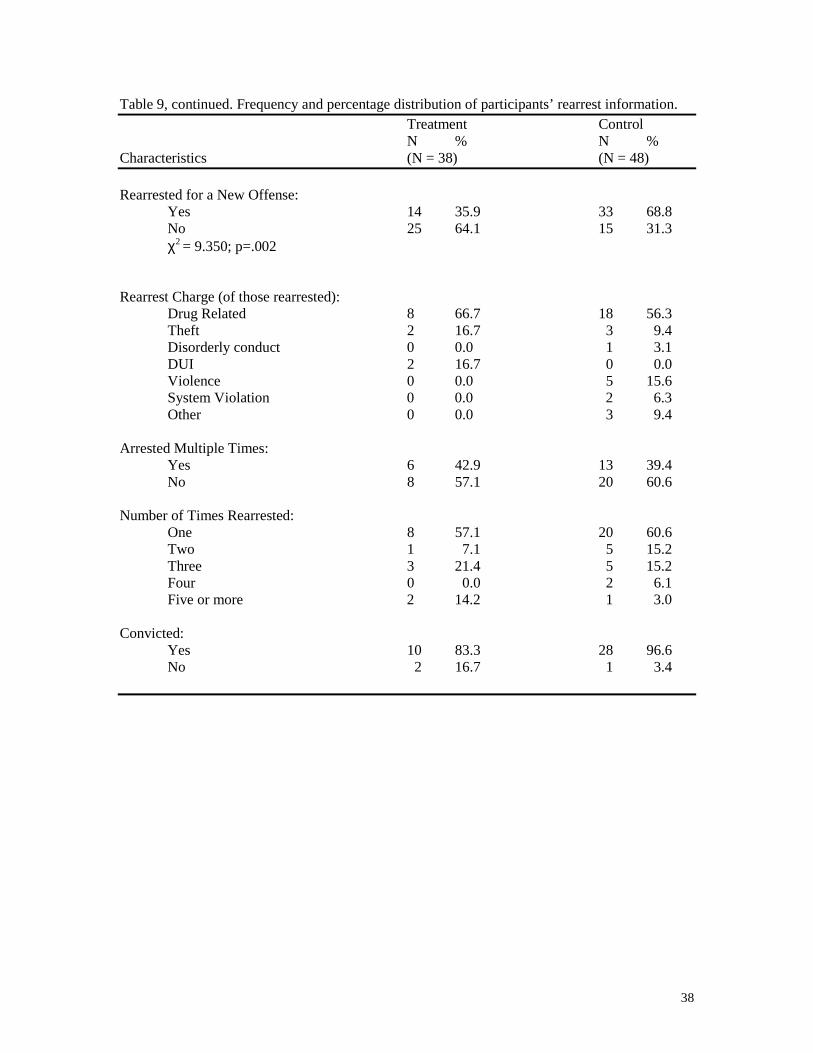
Rearrest Rates
As indicated in Table 9, there is a statistically significant difference with regard to
rearrest. Specifically, 40 percent of the treatment group were rearrested during the
follow-up period versus 69 percent of the comparison group. The new arrest could have
been incurred while the participant was engaged in drug court services or during the
follow-up period. With regard to charge, it appears that 67 percent of the treatment group
and 56 percent of the comparison group members were charged with a drug related
offense. The follow up data also indicate that 16 percent of the comparison group
members were rearrested on an offense involving violence. Moreover, 43 percent of those
rearrested in the treatment group were rearrested multiple times during the follow up
period compared to 39 percent of the comparison group. Finally, of those rearrested, 83
percent of the treatment group were convicted versus 97 percent of the comparison group.
Determinants of Rearrest
In order to attempt to identify the factors associated with recidivism, a logistic
regression analysis was conducted. The characteristics in the model were race, gender,
marital status, group, and time at risk5. Time at risk was included as a control for the
differing lengths of time each client was followed. The results indicated that only one
variable predicted who was likely to be rearrested: group membership. Those offenders
who received drug court treatment services were less likely to be rearrested. Furthermore,
the characteristics of the individual were not significant in predicting who would be
rearrested.

37
Table 8. Frequency and percentage distribution of participants’ termination information. Treatment N % Characteristics (N = 38) Did Offender Successfully complete Drug Court: Yes 5 31.3 No 11 68.8 Were Original Charges Dismissed: Yes 5 31.3 No 11 68.8 Was Defendant’s Record Expunged: Yes 1 6.3 No 15 93.8 Status at Termination: Graduated from Drug Court 5 33.3 Terminated Unsuccessful 5 33.3 Absconded 1 6.7 Other 4 26.7
5 The sample size prohibited the inclusion of additional independent variables.
38
Table 9, continued. Frequency and percentage distribution of participants’ rearrest information. Treatment Control
N % N % Characteristics (N = 38) (N = 48) Rearrested for a New Offense: Yes 14 35.9 33 68.8 No 25 64.1 15 31.3 χ2 = 9.350; p=.002
Rearrest Charge (of those rearrested): Drug Related 8 66.7 18 56.3 Theft 2 16.7 3 9.4 Disorderly conduct 0 0.0 1 3.1 DUI 2 16.7 0 0.0 Violence 0 0.0 5 15.6 System Violation 0 0.0 2 6.3 Other 0 0.0 3 9.4 Arrested Multiple Times: Yes 6 42.9 13 39.4 No 8 57.1 20 60.6 Number of Times Rearrested: One 8 57.1 20 60.6 Two 1 7.1 5 15.2 Three 3 21.4 5 15.2 Four 0 0.0 2 6.1 Five or more 2 14.2 1 3.0 Convicted: Yes 10 83.3 28 96.6 No 2 16.7 1 3.4

39
SUMMARY AND RECOMMENDATIONS
The findings of this evaluation can be summarized as follows:
• The drug court and comparison groups were very similar with regard to social demographic characteristics. Specifically, the typical person in both groups was African American, male, approximately 29 years of age, and not married. The groups were also similar with regard to education level and employment status.
• A majority of offenders in both groups were referred on a drug charge. However,
the drug court group was more likely to be charged with theft, and the comparison group with drug trafficking.
• With regard to criminal history, a majority of both groups reported a prior felony
record. There were however, several significant differences: the comparison group was more likely to have a prior record involving multiple felony and misdemeanor charges, and the drug court group was significantly more likely to have a prior misdemeanor record.
• The majority of the participants in both groups ranked marijuana as their primary
drug of choice followed by alcohol. The top three drugs of choice were marijuana, crack/cocaine, and alcohol.
• The typical participant in both groups started using alcohol at 16 and drugs at 18
years of age. Moreover, participants in both groups indicate a weekly use of alcohol, but a daily use of drugs. Finally, the majority had a family member with a chemical dependency problem, and had previously engaged in treatment.
• The drug court participants exhibited a number of treatment needs. When ranked
in order of importance the following treatment needs emerged: drug use, alcohol use, family difficulties, employment, education, housing, mental health, and physical health.
• The drug court was succeeding in retaining its clients. Specifically, 87 percent
completed their first phase of treatment. For those who did not complete the first phase, the following reasons were offered: higher level of care needs, non-compliance, and no-shows (absconded).
• The court reported violation rates among drug court clients was fairly low. Only
18 percent of the drug court clients were charged with a court ordered violation. Those violations included: rearrest, failure to appear, positive drug screen, absconded, non-compliance with treatment, and other.
• Overall, the drug court clients were very satisfied with the drug court. The clients
were satisfied with the judge, the probation staff, and the treatment staff. While they felt the drug court was more difficult than standard probation, they also

40
agreed that their participation in the drug court would help them in the future with their drug abuse problem
• Bivariate analyses revealed a statistically significant difference between the
treatment and comparison group with regard to rearrest. The data indicate that 40 percent of the drug court treatment group were rearrested during the follow up period versus 67 percent of the comparison group. The majority of those rearrested, were charged with a drug related crime. Slightly more individuals in the treatment group, however, were rearrested multiple times during the follow-up period. The only factor predicting rearrested was whether the defendant was part of the drug court group.
Previous research by Goldkamp has concluded that the technical violation rate is
higher among drug court participants. This may be because the drug court participants
are being monitored more closely. While we do not have information on comparison
cases, it appears that the technical violation rate among drug court participants is fairly
low (18%). In addition, the retention rate in treatment was similar, even slightly above,
the national average among drug court participants. In addition, the level of satisfaction
among participants was also very high. Moreover, the majority did not feel the demands
of the court or the treatment agency were too much to handle.
The outcome findings indicated that offenders who participated in the Erie
County Drug Court were less likely to be rearrested than a comparison group of offenders
who did not receive drug court services. As noted earlier, the basic social demographic
characteristics were similar between the two groups. Clearly, however, there is one main
difference between the groups: the drug court participants elected to engage in drug
treatment while the comparison group did not. Due to this and other limitations to the
study we must offer a word of caution when interpreting the results. Increasing the
sample size, extending the follow-up period, and more complete data on the comparison

41
cases are all necessary ingredients to learning more about the effectiveness of the drug
court in Erie County.
Given the popularity of the drug court model across the country as well as in
Ohio, their ability to reduce drug abuse and recidivism remains a key issue. The drug
court model embraces the perspective that get tough polices towards drug abuse have
fallen short. By endorsing the view that treatment can be an effective tool in reducing
recidivism, drug courts hold more promise than traditional policies that rely on
incarceration and stricter sentences.
In order to increase the effectiveness of the Erie County Drug Court further, the
following recommendations can be offered:
Recommendations
1. The court should make additional efforts find appropriate clients that could be served by the drug court. The number of participants in the Erie County Drug Court during the three-year study period is fairly low. Efforts should be made to increase the number of participants served. Furthermore, since the characteristics of the offenders were not related to outcome, it is not unreasonable to conclude that participation in treatment increased the likelihood of success. This means that the treatment provider may be rejecting some offenders who would benefit from treatment.
2. In order to engage more drug court clients, the court should have its staff
trained on motivational interviewing techniques that can be used with those offenders that appear unmotivated or unwilling to participate in treatment. Some jurisdictions have even develop pre-treatment groups designed to increase the motivation and willingness of resistant offenders. The Erie County Drug Court should consider these options.
3. In addition to varying degrees of substance abuse problems, offenders will
have varying degrees of other risk factors (e.g., antisocial values, antisocial peer associations, and so forth). On important element in improving the effectiveness of programs is the use of standardized risk/need assessment instruments. The Erie County Drug Court should consider the implementation of such a tool. These instruments include risk and need factors that are known correlates of criminal behavior. Furthermore, they provide a summary score that predicts the offender’s likelihood of recidivism, and can be used in case

42
classification and treatment planning. This will allow the program staff to distinguish risk levels, and more importantly make appropriate assignment to treatment groups. For example, risk and needs can then be used when considered the intensity and duration of the program. A valid and reliable risk and needs assessment instrument will serve to provide an overall risk/need level, and will identify those offenders with substance abuse as a criminogenic need. Once these offenders have been identified a more detailed assessment of substance abuse should then be conducted in order to develop a more precise treatment plan.
4. In order to conduct a more comprehensive evaluation of the Erie County Drug
Court, more detailed information on the comparison cases needs to be collected. This would include data on supervision activities, drug testing results, and services received.

43
APPENDIX

Logistical Regression Predicting Arrest: Treatment versus Control
Variable B S.E. Wald df Significance Group* -1.318 .518 6.474 1 .011 Race -.214 .487 .193 1 .661 Gender .881 .563 2.449 1 .118 Prior Misdemeanor -.460 .579 .632 1 .427 Time to arrest .001 .001 .968 1 .325 *p < .01