Embed Size (px)
Citation preview

THE EQUITABLE LIFE ASSURANCE SOCIETY
Annual FSA Insurance Returns for the year ended 31 December 2010
Appendices 9.1, 9.3, 9.4, 9.4A & 9.6 from the Interim Prudential Sourcebook for Insurers
Registered Office 20 - 22 Bedford Row, London, WC1R 4JS


Contents
Balance Sheet and Profit and Loss Account
Form 2 Statement of solvency - long-term insurance business 1Form 3 Components of capital resources 3Form 13 Analysis of admissible assets 6Form 14 Long term insurance business liabilities and margins 9Form 17 Analysis of derivative contracts 10Form 18 With-profits insurance capital component for the fund 11Form 19 Realistic balance sheet 12
Long Term Insurance Business: Revenue Account and Additional Information
Form 40 Revenue account 14Form 41 Analysis of premiums 15Form 42 Analysis of claims 16Form 43 Analysis of expenses 17Form 46 Summary of new business 18Form 47 Analysis of new business 19Form 48 Assets not held to match linked liabilities 22Form 49 Fixed and variable interest assets 23Form 50 Summary of mathematical reserves 24Form 51 Valuation summary of non-linked contracts (other than
accumulating with-profits contracts)25
Form 52 Valuation summary of accumulating with-profits contracts 31Form 53 Valuation summary of property linked contracts 37Form 54 Valuation summary of index linked contracts 43Form 56 Index linked business 47Form 57 Analysis of valuation interest rate 48Form 58 Distribution of surplus 50Form 59 With-profits payouts on maturity (normal retirement) 51Form 60 Long-term insurance capital requirement 53
Supplementary notes to the return 54
Abstract of the Valuation Report 60
Abstract of the Realistic Report 78
Additional information on derivative contracts 98
Additional information on controllers 99
Directors' Certificate 100
Auditor's Report 102
Statement of information on the with-profits actuary 105


23032011:10:15:47
Form 2
Statement of solvency - long-term insurance business
Name of insurer Equitable Life Assurance Society
Global business
Financial year ended 31 December 2010
Adjusted solo solvency calculation Company GL/registration UK/ day month year Units number CM
R2 37038 GL 31 12 2010 £000
As at end of As at end ofthis financial the previous
year year
1 2
Capital resources
Capital resources arising within the long-term insurance fund 11 359200 612785
12
13 359200 612785
Guarantee fund
Guarantee fund requirement 21 79366 76796
22 279834 535989
Minimum capital requirement (MCR)
Long-term insurance capital requirement 31 238097 230388
Resilience capital requirement 32
Base capital resources requirement 33 2280 2346
Individual minimum capital requirement 34 238097 230388
Capital requirements of regulated related undertakings 35
Minimum capital requirement (34+35) 36 238097 230388
Excess (deficiency) of available capital resources to cover 50% of MCR 37 240151 497591
Excess (deficiency) of available capital resources to cover 75% of MCR 38 180627 439994
Enhanced capital requirement
With-profits insurance capital component 39 121103 382397
Enhanced capital requirement 40 359200 612785
Capital resources requirement (CRR)
Capital resources requirement (greater of 36 and 40) 41 359200 612785
42 0 0
Contingent liabilities
51Quantifiable contingent liabilities in respect of long-term insurance business as shown in a supplementary note to Form 14
Capital resources allocated towards long-term insurance business arising outside the long-term insurance fund
Capital resources available to cover long-term insurance business capital resources requirement (11+12)
Excess (deficiency) of available capital resources to cover guarantee fund requirement
Excess (deficiency) of available capital resources to cover long-term insurance business CRR (13-41)
1

23032011:10:15:47
Form 2
Covering Sheet to Form 2
Name of insurer Equitable Life Assurance Society
Global business
Financial year ended 31 December 2010
Ian Brimecome, Chairman
Chris Wiscarson, Chief Executive
Tim Bateman, Finance Director
London , 30/03/2011
2

23032011:10:15:47
Form 3(Sheet 1)
Components of capital resources
Name of insurer Equitable Life Assurance Society
Global business
Financial year ended 31 December 2010Company GL/registration UK/ Units number CM
R3 GL 31 12 2010 £000
General Long-term Total as at Total as atinsurance insurance the end of the end of business business this financial the previous
year year1 2 3 4
Core tier one capital
Permanent share capital 11
Profit and loss account and other reserves 12
13
Positive valuation differences 14 360622 360622 614783
15
16
Core tier one capital (sum of 11 to 16) 19 360622 360622 614783
Tier one waivers
21
Implicit Items 22
Tier one waivers in related undertakings 23
24
Other tier one capital
25
26
27
28
31 360622 360622 614783
32
33
34
35
36
37
39 360622 360622 614783
Other negative valuation differences
Deductions in related undertakings
Deductions from tier one (32 to 36)
Total tier one capital after deductions (31-37)
Total tier one capital before deductions (19+24+25+26+27+28)
Investments in own shares
Intangible assets
Amounts deducted from technical provisions for discounting
Perpetual non-cumulative preference shares as restricted
Perpetual non-cumulative preference shares in related undertakings
Innovative tier one capital as restricted
Innovative tier one capital in related undertakings
Fund for future appropriations
Core tier one capital in related undertakings
Unpaid share capital / unpaid initial funds and calls for supplementary contributions
Total tier one waivers as restricted (21+22+23)
day month year
37038
Share premium account
3

23032011:10:15:47
Form 3(Sheet 2)
Components of capital resources
Name of insurer Equitable Life Assurance Society
Global business
Financial year ended 31 December 2010Company GL/registration UK/ Units number CM
R3 GL 31 12 2010 £000
General Long-term Total as at Total as atinsurance insurance the end of the end of business business this financial the previous
year year1 2 3 4
Tier two capital
41
42
43
44
45
46
Upper tier two capital in related undertakings 47
Upper tier two capital (44 to 47) 49
Fixed term preference shares 51
Other tier two instruments 52
Lower tier two capital in related undertakings 53
Lower tier two capital (51+52+53) 59
61
Excess tier two capital 62
63
69
Perpetual subordinated debt and securities
Total tier two capital before restrictions (49+59)
Further excess lower tier two capital
Total tier two capital after restrictions, before deductions (61-62-63)
Perpetual non-cumulative preference shares excluded from line 25
Innovative tier one capital excluded from line 27
Tier two waivers, innovative tier one capital and perpetual non-cumulative preference shares treated as tier two capital (41 to 43)
Perpetual cumulative preference shares
day month year
37038
Implicit items, (tier two waivers and amounts excluded from line 22)
4

23032011:10:15:47
Form 3(Sheet 3)
Components of capital resources
Name of insurer Equitable Life Assurance Society
Global business
Financial year ended 31 December 2010Company GL/registration UK/ Units number CM
R3 GL 31 12 2010 £000
General Long-term Total as at Total as atinsurance insurance the end of the end of business business this financial the previous
year year1 2 3 4
Total capital resources
71
72 360622 360622 614783
73 1422 1422 1997
74
75
76
77
79 359200 359200 612785
Available capital resources for GENPRU/INSPRU tests
81 359200 359200 612785
82 359200 359200 612785
83 359200 359200 612785
Financial engineering adjustments
91
92
93
94
95
96
Financial reinsurance - accepted
Outstanding contingent loans
Any other charges on future profits
Sum of financial engineering adjustments(91+92-93+94+95)
Available capital resources for 50% MCR requirement
Available capital resources for 75% MCR requirement
Implicit items
Financial reinsurance - ceded
Deductions for regulated non-insurance related undertakings
Deductions of ineligible surplus capital
Total capital resources after deductions (72-73-74-75-76-77)
Available capital resources for guarantee fund requirement
Total capital resources before deductions (39+69+71)
Inadmissible assets other than intangibles and own shares
Assets in excess of market risk and counterparty limits
Deductions for related ancillary services undertakings
day month year
37038
Positive adjustments for regulated non-insurance related undertakings
5

23032011:10:15:47
Form 13(Sheet 1)
Analysis of admissible assets
Name of insurer Equitable Life Assurance Society
Global business
Financial year ended 31 December 2010
Category of assets Total long term insurance business assets
Company GL/ Categoryregistration UK/ day month year Units ofnumber CM assets
R13 37038 GL 31 12 2010 £000 10
As at end of this financial year
As at end of the previous year
1 2
Land and buildings 11 320666 374929
21222324252627 25252 24439
282930
Other financial investments
Equity shares 41 3207 17188
Other shares and other variable yield participations 42Holdings in collective investment schemes 43 189911 265047
Rights under derivative contracts 44 9198 7124
45 2018608 2047434
46 1960760 2479721
47 240645 218294
48Participation in investment pools 49Loans secured by mortgages 50 747 757
51
52 375 495
Other loans 5354 1133653 503600
55Other financial investments 56Deposits with ceding undertakings 57
58 240276 239096
59Assets held to match linked liabilities
Index linked
Property linked
Loans to public or local authorities and nationalised industries or undertakings
Loans secured by policies of insurance issued by the company
Bank and approved credit & financial institution deposits
One month or less withdrawal
More than one month withdrawal
Fixed interest securitiesApproved
Other
Variable interest securitiesApproved
Other
Other group undertakingsShares
Debts and loans
Participating interestsShares
Debts and loans
Other insurance dependantsShares
Debts and loans
Non-insurance dependantsShares
Debts and loans
Investments in group undertakings and participating interests
UK insurance dependantsShares
Debts and loans
6

23032011:10:15:47
Form 13(Sheet 2)
Analysis of admissible assets
Name of insurer Equitable Life Assurance Society
Global business
Financial year ended 31 December 2010
Category of assets Total long term insurance business assets
Company GL/ Categoryregistration UK/ day month year Units ofnumber CM assets
R13 37038 GL 31 12 2010 £000 10
As at end of this financial year
As at end of the previous year
1 2
60
61
62
63
71 4121 4328
72737475767778 10719 9235
79
80
81 11251 2919
82
83
84 85010 104650
85
86 613 814
87
89 6255013 6300069
Deductions from the aggregate value of assets
Grand total of admissible assets after deduction of admissible assetsin excess of market risk and counterparty limits (11 to 86 less 87)
Other assets (particulars to be specified by way of supplementary note)
Accrued interest and rent
Deferred acquisition costs (general business only)
Other prepayments and accrued income
Other assets
Tangible assets
Deposits not subject to time restriction on withdrawal with approvedinstitutions
Cash in hand
Dependantsdue in 12 months or less
due in more than 12 months
Otherdue in 12 months or less
due in more than 12 months
Salvage and subrogation recoveries
ReinsuranceAccepted
Ceded
Other
Debtors and salvage
Direct insurance businessPolicyholders
Intermediaries
Reinsurers' share of technical provisions
Provision for unearned premiums
Claims outstanding
Provision for unexpired risks
7

23032011:10:15:47
Form 13(Sheet 3)
Analysis of admissible assets
Name of insurer Equitable Life Assurance Society
Global business
Financial year ended 31 December 2010
Category of assets Total long term insurance business assets
Company GL/ Categoryregistration UK/ day month year Units ofnumber CM assets
R13 37038 GL 31 12 2010 £000 10
As at end of this financial year
As at end of the previous year
1 2
91 6255013 6300069
92
93 1422 1997
94
95
96
97
98
99
100 2441405 2333075
101 (13878) (20697)
102 8683962 8614444
103
Total assets determined in accordance with the insurance accountsrules or international accounting standards as applicable to the firmfor the purpose of its external financial reporting (91 to 101)
Amounts included in line 89 attributable to debts due from relatedinsurers, other than those under contracts of insurance or reinsurance
Other differences in the valuation of assets (other than for assetsnot valued above)
Deferred acquisition costs excluded from line 89
Reinsurers' share of technical provisions excluded from line 89
Other asset adjustments (may be negative)
Capital resources requirement deduction of regulated related undertakings
Ineligible surplus capital and restricted assets in regulated related insurance undertakings
Inadmissible assets of regulated related undertakings
Book value of related ancillary services undertakings
Reconciliation to asset values determined in accordance with the insurance accounts rules or international accounting standards as applicable to the firm for the purpose of its external financial reporting
Total admissible assets after deduction of admissible assetsin excess of market risk and counterparty limits (as per line 89 above)
Admissible assets in excess of market and counterparty limits
Inadmissible assets directly held
8

23032011:10:15:47
Form 14Long term insurance business liabilities and margins
Name of insurer Equitable Life Assurance Society
Global business
Financial year ended 31 December 2010
Total business/Sub fund ORDINARY LONG TERM
Units £000 As at end of As at end ofthis financial the previous
year year1 2
Mathematical reserves, after distribution of surplus 11 5722004 5498486
12
Balance of surplus/(valuation deficit) 13Long term insurance business fund carried forward (11 to 13) 14 5722004 5498486
Gross 15 15717 18530
Reinsurers' share 16 Net (15-16) 17 15717 18530
Taxation 21 Other risks and charges 22 77300 76700
Deposits received from reinsurers 23 Direct insurance business 31 10258 10923
Reinsurance accepted 32 Reinsurance ceded 33 534 1456
Secured 34 Unsecured 35
Amounts owed to credit institutions 36 5368 7368
Taxation 37 145
Other 38 44763 54895
Accruals and deferred income 39 19870 18781
41Total other insurance and non-insurance liabilities (17 to 41) 49 173809 188798
Excess of the value of net admissible assets 51 359200 612785
Total liabilities and margins 59 6255013 6300069
61 5368 8239
62
71 5895813 5687284
Increase to liabilities - DAC related 72Reinsurers' share of technical provisions 73 2441405 2333075
Other adjustments to liabilities (may be negative) 74 346744 594085
Capital and reserves and fund for future appropriations 75
76 8683962 8614444
Amounts included in line 59 attributable to liabilities in respect of property linked benefits
Total liabilities (11+12+49)
Total liabilities under insurance accounts rules or international accounting standards as applicable to the firm for the purpose of its external financial reporting (71 to 75)
Debenture loans
Creditors
Provision for "reasonably foreseeable adverse variations"
Amounts included in line 59 attributable to liabilities to related companies, other than those under contracts of insurance or reinsurance
Cash bonuses which had not been paid to policyholders prior to end of the financial year
Claims outstanding
Provisions
Creditors
9

23032011:10:15:47
Form 17
Analysis of derivative contracts
Name of insurer Equitable Life Assurance Society
Global business
Financial year ended 31 December 2010
Category of assets Total long term insurance business assets
Company GL/ Categoryregistration UK/ day month year Units ofnumber CM assets
R17 37038 GL 31 12 2010 £000 10
Derivative contracts
Assets Liabilities Bought / Long Sold / Short
1 2 3 4
11 25788
Interest rates 12
Inflation 13
Credit index / basket 14
Credit single name 15
16
Equity stock 17
Land 18
Currencies 19 1222 18840 105683
Mortality 20
Other 21
31 34899 867000
Equity index calls 32
Equity stock calls 33
Equity index puts 34
Equity stock puts 35
Other 36
Swaptions 41
Equity index calls 42
Equity stock calls 43
Equity index puts 44
Equity stock puts 45
Other 46
Total (11 to 46) 51 34899 1222 911629 105683
52 (25701)
53 9198 1222 Total (51 + 52)
THE NOTIONAL AMOUNTS IN COLUMNS 3 AND 4 ARE NOT A MEASURE OF EXPOSURE. Please see instructions 11 and 12 to this Form for the meaning of these figures.
In the money options
Swaptions
Out of the money options
Adjustment for variation margin
Value as at the endof this financial year
Notional amount as at the endof this financial year
Futures and contracts for differences
Fixed-interest securities
Equity index
10

23032011:10:15:47
Form 18
With-profits insurance capital component for the fund
Name of insurer Equitable Life Assurance Society
With-profits fund ORDINARY LONG TERM
Financial year ended 31 December 2010
Units £000
As at end of As at end of this financial year the previous year
1 2
Regulatory excess capital
11 6255013 6300069
12
13 777789 756042
14 39774 39941
15
19 5437450 5504086
21 4944215 4742444
22 173809 188798
29 5118024 4931242
31 198323 190447
32
39 5316347 5121689
Regulatory excess capital (19-39) 49 121103 382397
Realistic excess capital
51
Excess assets allocated to with-profits insurance business
61 121103 382397
62
63
64
65
66 121103 382397
Present value of other future internal transfers not already taken into accountWith-profits insurance capital component for fund (if 62 exceeds 63, greater of 61+62-63-64-65 and zero, else greater of 61-64-65 and zero)
Excess (deficiency) of assets allocated to with-profits insurance business in fund (49-51)Face amount of capital instruments attributed to the fund and included in capital resources (unstressed)Realistic amount of capital instruments attributed to the fund and included in capital resources (stressed)Present value of future shareholder transfers arising from distribution of surplus
Long-term insurance capital requirement in respect of the fund's with-profits insurance contractsResilience capital requirement in respect of the fund's with-profits insurance contractsSum of regulatory value of liabilities, LTICR and RCR (29+31+32)
Realistic excess capital
Regulatory value of liabilities
Mathematical reserves (after distribution of surplus) in respect of the fund's with-profits insurance contracts
Regulatory current liabilities of the fund
Total (21+22)
Regulatory value of assets
Long-term admissible assets of the fund
Implicit items allocated to the fund
Mathematical reserves in respect of the fund's non-profit insurance contractsLong-term admissible assets of the fund covering the LTICR of the fund's non-profit insurance contracts Long-term admissible assets of the fund covering the RCR of the fund's non-profit insurance contracts
Total (11+12-(13+14+15))
11

23032011:10:15:47
Form 19Realistic balance sheet (Sheet 1)
Name of insurer Equitable Life Assurance Society
With-profits fund ORDINARY LONG TERM
Financial year ended 31 December 2010
Units £000
As at end of As at end of this financial year the previous year
1 2
Realistic value of assets available to the fund
11 5437450 5504086
12
13
21
22 7936 16615
23
24
25
26 5445386 5520701
27
29 5445386 5520701
Realistic value of liabilities of fund
31 3844993 4143186
32
33
34 692908 672911
35 294611 290067
36 18946 28406
41 755141 573742
42
43 5535 11058
44
45
46
47 286556 249479
49 1426584 1188717
Realistic current liabilities of the fund 51 173809 188798
59 5445386 5520701 Realistic value of liabilities of fund (31+49+51)
Financing costs
Any other liabilities related to regulatory duty to treat customers fairly
Other long-term insurance liabilities
Total (32+34+41+42+43+44+45+46+47-(33+35+36))
Future policy related liabilities
Past miscellaneous surplus attributed to with-profits benefits reservePast miscellaneous deficit attributed to with-profits benefits reservePlanned enhancements to with-profits benefits reservePlanned deductions for the costs of guarantees, options and smoothing from with-profits benefits reservePlanned deductions for other costs deemed chargeable to with-profits benefits reserveFuture costs of contractual guarantees (other than financial options)
Future costs of non-contractual commitments
Future costs of financial options
Future costs of smoothing (possibly negative)
Realistic value of assets of fund (11+21+22+23+24+25-(12+13))
Support arrangement assets
Assets available to the fund (26+27)
With-profits benefit reserve
Present value of future profits (or losses) on non-profit insurance contracts written in the fundValue of derivatives and quasi-derivatives not already reflected in lines 11 to 22
Value of shares in subsidiaries held in fund (realistic)
Prepayments made from the fund
Regulatory value of assets
Implicit items allocated to the fund
Value of shares in subsidiaries held in fund (regulatory)
Excess admissible assets
12

23032011:10:15:47
Form 19(Sheet 2)
Realistic balance sheet
Name of insurer Equitable Life Assurance Society
With-profits fund ORDINARY LONG TERM
Financial year ended 31 December 2010
Units £000
As at end of As at end of this financial year the previous year
1 2
Realistic excess capital and additional capital available
62 5445386 5520701
63
64 5445386 5520701
65
66
67
68
69
Other assets potentially available if required to cover the fund's risk capital margin
81
82
Additional amount potentially available for inclusion in line 62
Additional amount potentially available for inclusion in line 63
Realistic excess capital for fund (26-(59+65))
Realistic excess available capital for fund (29-(59+65))
Working capital for fund (29-59)
Working capital ratio for fund (68/29)
Value of relevant assets before applying the most adverse scenario other than the present value of future profits arising from business outside with-profits funds
Amount of present value of future profits (or losses) on long-term insurance contracts written outside the fund included in the value of relevant assets before applying most adverse scenario
Value of relevant assets before applying the most adverse scenario (62+63)
Risk capital margin for fund (62-59)
13

23032011:10:15:47
Form 40
Long-term insurance business : Revenue account
Name of insurer Equitable Life Assurance Society
Total business / subfund ORDINARY LONG TERM
Financial year ended 31 December 2010
Units £000
Financial year Previous year
1 2
Income
Earned premiums 11 73673 156164
12 278395 321435
13 428881 (161353)
14 16199 8799
Other income 15 2039 2875
Total income 19 799187 327921
Expenditure
Claims incurred 21 491341 684604
22 81456 114990
23 15 195
24 2858 1649
Other expenditure 25
Transfer to (from) non technical account 26
Total expenditure 29 575670 801438
Business transfers - in 31
Business transfers - out 32
Increase (decrease) in fund in financial year (19-29+31-32) 39 223517 (473517)
Fund brought forward 49 5498486 5972003
Fund carried forward (39+49) 59 5722004 5498486
Interest payable before the deduction of tax
Taxation
Investment income receivable before deduction of tax
Increase (decrease) in the value of non-linked assets brought into account
Increase (decrease) in the value of linked assets
Expenses payable
14

23032011:10:15:47
Form 41
Long-term insurance business : Analysis of premiums
Name of insurer Equitable Life Assurance Society
Total business / subfund ORDINARY LONG TERM
Financial year ended 31 December 2010
Units £000
UK Life UK Pension Overseas Total Financial year
Total Previous year
1 2 3 4 5
Gross
Regular premiums 11 17567 64880 2518 84965 81524
Single premiums 12 12 54263 384 54659 137087
Reinsurance - external
Regular premiums 13 11623 43061 1498 56181 52985
Single premiums 14 10 9685 74 9769 9462
Reinsurance - intra-group
Regular premiums 15
Single premiums 16
Net of reinsurance
Regular premiums 17 5944 21819 1020 28784 28539
Single premiums 18 2 44578 310 44890 127625
Total
Gross 19 17579 119143 2902 139624 218612
Reinsurance 20 11633 52746 1572 65951 62447
Net 21 5946 66397 1330 73673 156164
15

23032011:10:15:47
Form 42
Long-term insurance business : Analysis of claims
Name of insurer Equitable Life Assurance Society
Total business / subfund ORDINARY LONG TERM
Financial year ended 31 December 2010
Units £000
UK Life UK Pension Overseas Total Financial year
Total Previous year
1 2 3 4 5
Gross
Death or disability lump sums 11 12874 20832 1216 34922 37295
Disability periodic payments 12
Surrender or partial surrender 13 24773 213008 6810 244592 330775
Annuity payments 14 5543 61243 8569 75354 77558
Lump sums on maturity 15 44908 319993 5439 370340 444753
Total 16 88098 615076 22034 725208 890381
Reinsurance - external
Death or disability lump sums 21 7720 8338 511 16569 18915
Disability periodic payments 22
Surrender or partial surrender 23 9813 130250 3499 143562 126645
Annuity payments 24 923 6337 140 7400 6312
Lump sums on maturity 25 11832 53932 572 66336 53905
Total 26 30288 198857 4722 233867 205776
Reinsurance - intra-group
Death or disability lump sums 31
Disability periodic payments 32
Surrender or partial surrender 33
Annuity payments 34
Lump sums on maturity 35
Total 36
Net of reinsurance
Death or disability lump sums 41 5154 12494 705 18353 18380
Disability periodic payments 42
Surrender or partial surrender 43 14960 82758 3311 101030 204130
Annuity payments 44 4620 54906 8429 67955 71246
Lump sums on maturity 45 33076 266061 4867 304004 390849
Total 46 57810 416219 17312 491341 684604
16

23032011:10:15:47
Form 43
Long-term insurance business : Analysis of expenses
Name of insurer Equitable Life Assurance Society
Total business / subfund ORDINARY LONG TERM
Financial year ended 31 December 2010
Units £000
UK Life UK Pension Overseas Total Financial year
Total Previous year
1 2 3 4 5
Gross
Commission - acquisition 11
Commission - other 12
Management - acquisition 13 135 135 311
Management - maintenance 14 1337 30262 1239 32838 36255
Management - other 15 1966 44696 1821 48483 78424
Total 16 3303 75093 3060 81456 114990
Reinsurance - external
Commission - acquisition 21
Commission - other 22
Management - acquisition 23
Management - maintenance 24
Management - other 25
Total 26
Reinsurance - intra-group
Commission - acquisition 31
Commission - other 32
Management - acquisition 33
Management - maintenance 34
Management - other 35
Total 36
Net of reinsurance
Commission - acquisition 41
Commission - other 42
Management - acquisition 43 135 135 311
Management - maintenance 44 1337 30262 1239 32838 36255
Management - other 45 1966 44696 1821 48483 78424
Total 46 3303 75093 3060 81456 114990
17

23032011:10:15:47
Form 46
Long-term insurance business : Summary of new business
Name of insurer Equitable Life Assurance Society
Total business
Financial year ended 31 December 2010
Units £000
UK Life UK Pension Overseas Total Financial year
Total Previous year
1 2 3 4 5
Regular premium business 11 15 15 6
Single premium business 12 2311 15 2326 2489
Total 13 15 2311 15 2341 2495
Amount of new regular premiums
Direct insurance business 21 10 19241 46 19297 13471
External reinsurance 22
Intra-group reinsurance 23
Total 24 10 19241 46 19297 13471
Amount of new single premiums
Direct insurance business 25 12 54450 394 54856 137611
External reinsurance 26
Intra-group reinsurance 27
Total 28 12 54450 394 54856 137611
Number of new policyholders/ scheme members for direct insurance business
18

23032011:10:15:47
Form 47
Long-term insurance business : Analysis of new business
Name of insurer Equitable Life Assurance Society
Total business
Financial year ended 31 December 2010
Units £000
UK Life / Direct Insurance Business
Number of policyholders /
scheme membersAmount of premiums
Number of policyholders /
scheme membersAmount of premiums
1 2 3 4 5 6
100 Conventional whole life with-profits OB 1 3
120 Conventional endowment with-profits OB savings 1 0
325 Level term assurance 13 7
500 Life UWP single premium 2
700 Life property linked single premium 0
715 Life property linked endowment regular premium - savings 0 10
19
Product code
numberProduct description
Regular premium business Single premium business

23032011:10:15:47
Form 47
Long-term insurance business : Analysis of new business
Name of insurer Equitable Life Assurance Society
Total business
Financial year ended 31 December 2010
Units £000
UK Pension / Direct Insurance Business
Number of policyholders /
scheme membersAmount of premiums
Number of policyholders /
scheme membersAmount of premiums
1 2 3 4 5 6
380 Miscellaneous protection rider 1
390 Deferred annuity non-profit 1 1
400 Annuity non-profit (CPA) 1995 24962
545 Individual deposit administration with-profits 293 3 5501
555 Group deposit administration with-profits 465 30 10629
565 DWP National Insurance rebates UWP 19 5707
725 Individual pensions property linked 643 12 510
735 Group money purchase pensions property linked 17839 106 2185
745 DWP National Insurance rebates property linked 2 2654
750 Income drawdown property linked 1 4
905 Index linked annuity 142 2297
20
Product code
numberProduct description
Regular premium business Single premium business

23032011:10:15:47
Form 47
Long-term insurance business : Analysis of new business
Name of insurer Equitable Life Assurance Society
Total business
Financial year ended 31 December 2010
Units £000
Overseas / Direct Insurance Business
Number of policyholders /
scheme membersAmount of premiums
Number of policyholders /
scheme membersAmount of premiums
1 2 3 4 5 6
395 Annuity non-profit (PLA) 3 172
400 Annuity non-profit (CPA) 11 125
500 Life UWP single premium 1
510 Life UWP endowment regular premium - savings 0 0
545 Individual deposit administration with-profits 5 23
555 Group deposit administration with-profits 1
715 Life property linked endowment regular premium - savings 0 48
725 Individual pensions property linked 39 1 24
735 Group money purchase pensions property linked 2
21
Product code
numberProduct description
Regular premium business Single premium business

23032011:10:15:47
Form 48
Long-term insurance business : Assets not held to match linked liabilities
Name of insurer Equitable Life Assurance Society
Category of assets 10 Total long term insurance business assets
Financial year ended 31 December 2010
Units £000
Unadjusted assets
Economic exposure
Expected income from
assets in column 2
Yield before adjustment
Return on assets in
financial year
1 2 3 4 5
Land and buildings 11
Approved fixed interest securities 12 226299 226299 9482 3.51
Other fixed interest securities 13 319512 319512 18121 5.18
Variable interest securities 14
UK listed equity shares 15
Non-UK listed equity shares 16
Unlisted equity shares 17
Other assets 18 21702 21702 122 0.56
Total 19 567513 567513 27725 4.34
Land and buildings 21 320666 379462 16361 4.31 13.73
Approved fixed interest securities 22 1825857 1825857 84925 2.86 7.91
Other fixed interest securities 23 1687804 1690006 98342 5.23 8.80
Variable interest securities 24 241883 241883 2354 -0.27 9.39
UK listed equity shares 25 0 11256 0 0.00 4.57
Non-UK listed equity shares 26 0 32152 0 0.00 8.54
Unlisted equity shares 27 28459 90186 23 0.02 20.75
Other assets 28 1342555 1176421 5945 0.51 1.41
Total 29 5447224 5447224 207948 2.98 7.46
Overall return on with-profits assets
Post investment costs but pre-tax 31 7.71
Return allocated to non taxable 'asset shares' 32 0.00
Return allocated to taxable 'asset shares' 33 0.00
Assets backing non-profit liabilities and non-profit capital requirements
Assets backing with-profits liabilities and with-profits capital requirements
22

23032011:10:15:47
Form 49
Long-term insurance business : Fixed and variable interest assets
Name of insurer Equitable Life Assurance Society
Category of assets 10 Total long term insurance business assets
Financial year ended 31 December 2010
Units £000
Value of assets Mean term Yield before adjustment
Yield after adjustment
1 2 3 4
11 1262266 7.41 2.85 2.85
Other approved fixed interest securities 21 789890 7.92 3.06 3.01
Other fixed interest securities
AAA/Aaa 31 317180 5.69 4.19 3.98
AA/Aa 32 293191 8.00 4.95 4.51
A/A 33 809996 7.77 5.20 4.59
BBB/Baa 34 457944 6.87 5.76 4.49
BB/Ba 35 24232 9.10 7.09 2.21
B/B 36 6875 4.99 9.44 (2.07)
CCC/Caa 37 6354 5.10 6.23 (22.10)
Other (including unrated) 38 93747 5.41 6.26 (21.81)
Total other fixed interest securities 39 2009519 7.16 5.22 3.09
Approved variable interest securities 41 241883 10.92 (0.27) (0.27)
Other variable interest securities 51
Total (11+21+39+41+51) 61 4303558 7.58 3.82 2.81
UK Government approved fixed interest securities
23

23032011:10:15:47
Form 50
Long-term insurance business : Summary of mathematical reserves
Name of insurer Equitable Life Assurance Society
Total business / subfund ORDINARY LONG TERM
Financial year ended 31 December 2010
Units £000
UK Life UK Pension Overseas Total Financial year
Total Previous year
1 2 3 4 5
GrossForm 51 - with-profits 11 80823 36728 10681 128231 136886
Form 51 - non-profit 12 52045 718233 125119 895397 854082
Form 52 13 99915 4664448 73606 4837969 4629057
Form 53 - linked 14 111941 1867180 50558 2029678 1936203
Form 53 - non-linked 15 422 11675 2112 14208 21289
Form 54 - linked 16 17277 235745 253022 250998
Form 54 - non-linked 17 224 4652 4875 3015
Total 18 362645 7538660 262075 8163381 7831531
Reinsurance - externalForm 51 - with-profits 21 84 34 118 128
Form 51 - non-profit 22 21053 329581 11326 361960 339316
Form 52 23 66 21828 1 21895 23400
Form 53 - linked 24 111941 1867180 50558 2029678 1936203
Form 53 - non-linked 25 422 11675 2112 14208 21289
Form 54 - linked 26 100 12646 12746 11902
Form 54 - non-linked 27 799 799 835
Total 28 133665 2243710 64030 2441405 2333075
Reinsurance - intra-groupForm 51 - with-profits 31
Form 51 - non-profit 32
Form 52 33
Form 53 - linked 34
Form 53 - non-linked 35
Form 54 - linked 36
Form 54 - non-linked 37
Total 38
Net of reinsuranceForm 51 - with-profits 41 80738 36728 10647 128114 136758
Form 51 - non-profit 42 30993 388652 113793 533437 514766
Form 52 43 99849 4642620 73605 4816073 4605656
Form 53 - linked 44
Form 53 - non-linked 45
Form 54 - linked 46 17177 223098 240276 239096
Form 54 - non-linked 47 224 3853 4076 2179
Total 48 228981 5294951 198044 5721976 5498456
24

23032011:10:15:47
Form 51
Long-term insurance business : Valuation summary of non-linked contracts (other than accumulating with-profits contracts)
Name of insurer Equitable Life Assurance Society
Total business / subfund ORDINARY LONG TERM
Financial year ended 31 December 2010
Units £000
UK Life / Gross
Product code
numberProduct description
Number of policyholders /
scheme members
Amount of benefit
Amount of annual office
premiums
Nominal value of units
Discounted value of units Other liabilities
Amount of mathematical
reserves
1 2 3 4 5 6 7 8 9
100 Conventional whole life with-profits OB 2016 46506 1240 23080
120 Conventional endowment with-profits OB savings 1992 16428 555 13146
125 Conventional endowment with-profits OB target cash 2756 88166 1794 37062
165 Conventional deferred annuity with-profits 268 1062 5 1824
205 Miscellaneous conventional with-profits 221 969
210 Additional reserves with-profits OB 4741
300 Regular premium non-profit WL/EA OB 417 5341 82 3473
315 Individual deposit administration non-profit 270 1175 1 4497
325 Level term assurance 29358 2421626 6046 7989
330 Decreasing term assurance 11460 519978 1833 219
390 Deferred annuity non-profit 70 105 89
395 Annuity non-profit (PLA) 1683 4202 34839
435 Miscellaneous non-profit 3814 445159 859 940
25

23032011:10:15:47
Form 51
Long-term insurance business : Valuation summary of non-linked contracts (other than accumulating with-profits contracts)
Name of insurer Equitable Life Assurance Society
Total business / subfund ORDINARY LONG TERM
Financial year ended 31 December 2010
Units £000
UK Life / Reinsurance ceded external
Product code
numberProduct description
Number of policyholders /
scheme members
Amount of benefit
Amount of annual office
premiums
Nominal value of units
Discounted value of units Other liabilities
Amount of mathematical
reserves
1 2 3 4 5 6 7 8 9
120 Conventional endowment with-profits OB savings 1307 84 84
300 Regular premium non-profit WL/EA OB 5341 82 3473
315 Individual deposit administration non-profit 1175 1 4497
325 Level term assurance 2421626 6046 7989
330 Decreasing term assurance 519978 1833 219
390 Deferred annuity non-profit 105 89
395 Annuity non-profit (PLA) 756 3846
435 Miscellaneous non-profit 445159 859 940
26

23032011:10:15:47
Form 51
Long-term insurance business : Valuation summary of non-linked contracts (other than accumulating with-profits contracts)
Name of insurer Equitable Life Assurance Society
Total business / subfund ORDINARY LONG TERM
Financial year ended 31 December 2010
Units £000
UK Pension / Gross
Product code
numberProduct description
Number of policyholders /
scheme members
Amount of benefit
Amount of annual office
premiums
Nominal value of units
Discounted value of units Other liabilities
Amount of mathematical
reserves
1 2 3 4 5 6 7 8 9
155 Conventional pensions endowment with-profits 285 1201 5 2079
165 Conventional deferred annuity with-profits 198 791 1375
210 Additional reserves with-profits OB 33274
315 Individual deposit administration non-profit 383 2219 11 6187
325 Level term assurance 5452 335342 883 3445
330 Decreasing term assurance 240 5217 28 15
380 Miscellaneous protection rider 1422071 3927 7327
390 Deferred annuity non-profit 3808 10058 237728
400 Annuity non-profit (CPA) 26820 30575 461532
411 Group death in service dependant's annuities 7187 339 339
435 Miscellaneous non-profit 1657 164486 358 1658
27

23032011:10:15:47
Form 51
Long-term insurance business : Valuation summary of non-linked contracts (other than accumulating with-profits contracts)
Name of insurer Equitable Life Assurance Society
Total business / subfund ORDINARY LONG TERM
Financial year ended 31 December 2010
Units £000
UK Pension / Reinsurance ceded external
Product code
numberProduct description
Number of policyholders /
scheme members
Amount of benefit
Amount of annual office
premiums
Nominal value of units
Discounted value of units Other liabilities
Amount of mathematical
reserves
1 2 3 4 5 6 7 8 9
315 Individual deposit administration non-profit 2219 11 6187
325 Level term assurance 335342 883 3445
330 Decreasing term assurance 5217 28 15
380 Miscellaneous protection rider 1422071 3927 7327
390 Deferred annuity non-profit 10058 237728
400 Annuity non-profit (CPA) 3890 72880
411 Group death in service dependant's annuities 7187 339 339
435 Miscellaneous non-profit 164486 358 1658
28

23032011:10:15:47
Form 51
Long-term insurance business : Valuation summary of non-linked contracts (other than accumulating with-profits contracts)
Name of insurer Equitable Life Assurance Society
Total business / subfund ORDINARY LONG TERM
Financial year ended 31 December 2010
Units £000
Overseas / Gross
Product code
numberProduct description
Number of policyholders /
scheme members
Amount of benefit
Amount of annual office
premiums
Nominal value of units
Discounted value of units Other liabilities
Amount of mathematical
reserves
1 2 3 4 5 6 7 8 9
195 Annuity with-profits (PLA) 19 69 907
205 Miscellaneous conventional with-profits 20 1375 13 56
210 Additional reserves with-profits OB 9718
325 Level term assurance 1462 172202 509 757
330 Decreasing term assurance 1012 57507 229 13
380 Miscellaneous protection rider 7652 68 240
390 Deferred annuity non-profit 190 2343 7453
395 Annuity non-profit (PLA) 196 1211 12157
400 Annuity non-profit (CPA) 1154 7372 104499
29

23032011:10:15:47
Form 51
Long-term insurance business : Valuation summary of non-linked contracts (other than accumulating with-profits contracts)
Name of insurer Equitable Life Assurance Society
Total business / subfund ORDINARY LONG TERM
Financial year ended 31 December 2010
Units £000
Overseas / Reinsurance ceded external
Product code
numberProduct description
Number of policyholders /
scheme members
Amount of benefit
Amount of annual office
premiums
Nominal value of units
Discounted value of units Other liabilities
Amount of mathematical
reserves
1 2 3 4 5 6 7 8 9
205 Miscellaneous conventional with-profits 708 6 34
325 Level term assurance 172202 509 757
330 Decreasing term assurance 57507 229 13
380 Miscellaneous protection rider 7290 47 181
390 Deferred annuity non-profit 2343 7453
395 Annuity non-profit (PLA) 16 212
400 Annuity non-profit (CPA) 143 2710
30

23032011:10:15:47
Form 52
Long-term insurance business : Valuation summary of accumulating with-profits contracts
Name of insurer Equitable Life Assurance Society
Total business / subfund ORDINARY LONG TERM
Financial year ended 31 December 2010
Units £000
UK Life / Gross
Product code
numberProduct description
Number of policyholders /
scheme members
Amount of benefit
Amount of annual office
premiums
Nominal value of units
Discounted value of units Other liabilities
Amount of mathematical
reserves
1 2 3 4 5 6 7 8 9
500 Life UWP single premium 4178 46783 45097 44894 1799 46693
510 Life UWP endowment regular premium - savings 8508 192054 1641 34464 31833 3554 35388
555 Group deposit administration with-profits 2 12 12 12 0 12
575 Miscellaneous UWP 1996 1587 744 1587 866 85 950
610 Additional reserves UWP 16871 16871
31

23032011:10:15:47
Form 52
Long-term insurance business : Valuation summary of accumulating with-profits contracts
Name of insurer Equitable Life Assurance Society
Total business / subfund ORDINARY LONG TERM
Financial year ended 31 December 2010
Units £000
UK Life / Reinsurance ceded external
Product code
numberProduct description
Number of policyholders /
scheme members
Amount of benefit
Amount of annual office
premiums
Nominal value of units
Discounted value of units Other liabilities
Amount of mathematical
reserves
1 2 3 4 5 6 7 8 9
510 Life UWP endowment regular premium - savings 14303 6 6
575 Miscellaneous UWP 119365 60 60 32

23032011:10:15:47
Form 52
Long-term insurance business : Valuation summary of accumulating with-profits contracts
Name of insurer Equitable Life Assurance Society
Total business / subfund ORDINARY LONG TERM
Financial year ended 31 December 2010
Units £000
UK Pension / Gross
Product code
numberProduct description
Number of policyholders /
scheme members
Amount of benefit
Amount of annual office
premiums
Nominal value of units
Discounted value of units Other liabilities
Amount of mathematical
reserves
1 2 3 4 5 6 7 8 9
535 Group money purchase pensions UWP 21391 21391 21391 437 21828
545 Individual deposit administration with-profits 74387 1903743 1908404 1998968 36324 2035292
555 Group deposit administration with-profits 104204 904286 904286 891211 21811 913022
565 DWP National Insurance rebates UWP 123923 990751 990751 938973 29789 968762
570 Income drawdown UWP 2474 75359 75359 75359 75359
571 Trustee investment plan UWP 1 61 61 52 1 53
610 Additional reserves UWP 650133 650133
33

23032011:10:15:47
Form 52
Long-term insurance business : Valuation summary of accumulating with-profits contracts
Name of insurer Equitable Life Assurance Society
Total business / subfund ORDINARY LONG TERM
Financial year ended 31 December 2010
Units £000
UK Pension / Reinsurance ceded external
Product code
numberProduct description
Number of policyholders /
scheme members
Amount of benefit
Amount of annual office
premiums
Nominal value of units
Discounted value of units Other liabilities
Amount of mathematical
reserves
1 2 3 4 5 6 7 8 9
535 Group money purchase pensions UWP 21391 21391 21391 437 21828
34

23032011:10:15:47
Form 52
Long-term insurance business : Valuation summary of accumulating with-profits contracts
Name of insurer Equitable Life Assurance Society
Total business / subfund ORDINARY LONG TERM
Financial year ended 31 December 2010
Units £000
Overseas / Gross
Product code
numberProduct description
Number of policyholders /
scheme members
Amount of benefit
Amount of annual office
premiums
Nominal value of units
Discounted value of units Other liabilities
Amount of mathematical
reserves
1 2 3 4 5 6 7 8 9
500 Life UWP single premium 309 4677 4677 4657 94 4751
510 Life UWP endowment regular premium - savings 936 28230 740 14883 14710 47 14757
545 Individual deposit administration with-profits 519 7844 571 7844 9672 36 9708
545 Individual deposit administration with-profits Deferred annuity 1120 29488 29488 27090 1304 28394
555 Group deposit administration with-profits 844 8092 8092 6945 1056 8000
570 Income drawdown UWP 9 408 408 408 408
575 Miscellaneous UWP 2 30 1 2 1 0 1
610 Additional reserves UWP 7587 7587
35

23032011:10:15:47
Form 52
Long-term insurance business : Valuation summary of accumulating with-profits contracts
Name of insurer Equitable Life Assurance Society
Total business / subfund ORDINARY LONG TERM
Financial year ended 31 December 2010
Units £000
Overseas / Reinsurance ceded external
Product code
numberProduct description
Number of policyholders /
scheme members
Amount of benefit
Amount of annual office
premiums
Nominal value of units
Discounted value of units Other liabilities
Amount of mathematical
reserves
1 2 3 4 5 6 7 8 9
510 Life UWP endowment regular premium - savings 4976 1 1
575 Miscellaneous UWP 30 0 0 36

23032011:10:15:47
Form 53
Long-term insurance business : Valuation summary of property linked contracts
Name of insurer Equitable Life Assurance Society
Total business / subfund ORDINARY LONG TERM
Financial year ended 31 December 2010
Units £000
UK Life / Gross
Product code
numberProduct description
Number of policyholders /
scheme members
Amount of benefit
Amount of annual office
premiums
Nominal value of units
Discounted value of units Other liabilities
Amount of mathematical
reserves
1 2 3 4 5 6 7 8 9
700 Life property linked single premium 1134 44299 44543 44543 23 44567
710 Life property linked whole life regular premium 704 15178 89 15860 15860 30 15890
715 Life property linked endowment regular premium - savings 2295 72529 1293 49981 49981 351 50332
735 Group money purchase pensions property linked 1 10 10 10 10
795 Miscellaneous property linked 377 24411 135 1547 1547 17 1564
37

23032011:10:15:47
Form 53
Long-term insurance business : Valuation summary of property linked contracts
Name of insurer Equitable Life Assurance Society
Total business / subfund ORDINARY LONG TERM
Financial year ended 31 December 2010
Units £000
UK Life / Reinsurance ceded external
Product code
numberProduct description
Number of policyholders /
scheme members
Amount of benefit
Amount of annual office
premiums
Nominal value of units
Discounted value of units Other liabilities
Amount of mathematical
reserves
1 2 3 4 5 6 7 8 9
700 Life property linked single premium 44299 44543 44543 23 44567
710 Life property linked whole life regular premium 15178 89 15860 15860 30 15890
715 Life property linked endowment regular premium - savings 72529 1293 49981 49981 351 50332
735 Group money purchase pensions property linked 10 10 10 10
795 Miscellaneous property linked 24411 135 1547 1547 17 1564
38

23032011:10:15:47
Form 53
Long-term insurance business : Valuation summary of property linked contracts
Name of insurer Equitable Life Assurance Society
Total business / subfund ORDINARY LONG TERM
Financial year ended 31 December 2010
Units £000
UK Pension / Gross
Product code
numberProduct description
Number of policyholders /
scheme members
Amount of benefit
Amount of annual office
premiums
Nominal value of units
Discounted value of units Other liabilities
Amount of mathematical
reserves
1 2 3 4 5 6 7 8 9
725 Individual pensions property linked 82403 980788 980706 980706 2539 983245
735 Group money purchase pensions property linked 60469 436469 436469 436469 9099 445568
745 DWP National Insurance rebates property linked 34438 388876 388876 388876 388876
750 Income drawdown property linked 629 28670 28670 28670 2 28671
755 Trustee investment plan 1 18 18 18 18
795 Miscellaneous property linked 948 2734 32441 32441 35 32476
39

23032011:10:15:47
Form 53
Long-term insurance business : Valuation summary of property linked contracts
Name of insurer Equitable Life Assurance Society
Total business / subfund ORDINARY LONG TERM
Financial year ended 31 December 2010
Units £000
UK Pension / Reinsurance ceded external
Product code
numberProduct description
Number of policyholders /
scheme members
Amount of benefit
Amount of annual office
premiums
Nominal value of units
Discounted value of units Other liabilities
Amount of mathematical
reserves
1 2 3 4 5 6 7 8 9
725 Individual pensions property linked 980788 980706 980706 2539 983245
735 Group money purchase pensions property linked 436469 436469 436469 9099 445568
745 DWP National Insurance rebates property linked 388876 388876 388876 388876
750 Income drawdown property linked 28670 28670 28670 2 28671
755 Trustee investment plan 18 18 18 18
795 Miscellaneous property linked 2734 32441 32441 35 32476
40

23032011:10:15:47
Form 53
Long-term insurance business : Valuation summary of property linked contracts
Name of insurer Equitable Life Assurance Society
Total business / subfund ORDINARY LONG TERM
Financial year ended 31 December 2010
Units £000
Overseas / Gross
Product code
numberProduct description
Number of policyholders /
scheme members
Amount of benefit
Amount of annual office
premiums
Nominal value of units
Discounted value of units Other liabilities
Amount of mathematical
reserves
1 2 3 4 5 6 7 8 9
700 Life property linked single premium 29 473 462 462 36 498
715 Life property linked endowment regular premium - savings 768 22715 122 19434 19434 284 19717
725 Individual pensions property linked 1294 20317 20317 20317 1113 21430
735 Group money purchase pensions property linked 326 6435 6435 6435 461 6896
750 Income drawdown property linked 4 372 372 372 0 372
795 Miscellaneous property linked 195 3539 215 3539 3539 217 3756
41

23032011:10:15:47
Form 53
Long-term insurance business : Valuation summary of property linked contracts
Name of insurer Equitable Life Assurance Society
Total business / subfund ORDINARY LONG TERM
Financial year ended 31 December 2010
Units £000
Overseas / Reinsurance ceded external
Product code
numberProduct description
Number of policyholders /
scheme members
Amount of benefit
Amount of annual office
premiums
Nominal value of units
Discounted value of units Other liabilities
Amount of mathematical
reserves
1 2 3 4 5 6 7 8 9
700 Life property linked single premium 473 462 462 36 498
715 Life property linked endowment regular premium - savings 22715 122 19434 19434 284 19717
725 Individual pensions property linked 20317 20317 20317 1113 21430
735 Group money purchase pensions property linked 6435 6435 6435 461 6896
750 Income drawdown property linked 372 372 372 0 372
795 Miscellaneous property linked 3539 215 3539 3539 217 3756
42

23032011:10:15:47
Form 54
Long-term insurance business : Valuation summary of index linked contracts
Name of insurer Equitable Life Assurance Society
Total business / subfund ORDINARY LONG TERM
Financial year ended 31 December 2010
Units £000
UK Life / Gross
Product code
numberProduct description
Number of policyholders /
scheme members
Amount of benefit
Amount of annual office
premiums
Nominal value of units
Discounted value of units Other liabilities
Amount of mathematical
reserves
1 2 3 4 5 6 7 8 9
900 Life index linked single premium 7 82 82 82 82
905 Index linked annuity 249 1161 17177 17177 224 17401
910 Miscellaneous index linked 18 0 18 18 18
43

23032011:10:15:47
Form 54
Long-term insurance business : Valuation summary of index linked contracts
Name of insurer Equitable Life Assurance Society
Total business / subfund ORDINARY LONG TERM
Financial year ended 31 December 2010
Units £000
UK Life / Reinsurance ceded external
Product code
numberProduct description
Number of policyholders /
scheme members
Amount of benefit
Amount of annual office
premiums
Nominal value of units
Discounted value of units Other liabilities
Amount of mathematical
reserves
1 2 3 4 5 6 7 8 9
900 Life index linked single premium 82 82 82 82
910 Miscellaneous index linked 18 0 18 18 18 44

23032011:10:15:47
Form 54
Long-term insurance business : Valuation summary of index linked contracts
Name of insurer Equitable Life Assurance Society
Total business / subfund ORDINARY LONG TERM
Financial year ended 31 December 2010
Units £000
UK Pension / Gross
Product code
numberProduct description
Number of policyholders /
scheme members
Amount of benefit
Amount of annual office
premiums
Nominal value of units
Discounted value of units Other liabilities
Amount of mathematical
reserves
1 2 3 4 5 6 7 8 9
905 Index linked annuity 3780 13046 231864 231864 3866 235729
910 Miscellaneous index linked 116 3881 3881 3881 786 4667 45

23032011:10:15:47
Form 54
Long-term insurance business : Valuation summary of index linked contracts
Name of insurer Equitable Life Assurance Society
Total business / subfund ORDINARY LONG TERM
Financial year ended 31 December 2010
Units £000
UK Pension / Reinsurance ceded external
Product code
numberProduct description
Number of policyholders /
scheme members
Amount of benefit
Amount of annual office
premiums
Nominal value of units
Discounted value of units Other liabilities
Amount of mathematical
reserves
1 2 3 4 5 6 7 8 9
905 Index linked annuity 304 8765 8765 13 8778
910 Miscellaneous index linked 3881 3881 3881 786 4667 46

23032011:10:15:47
Form 56
Long-term insurance business : Index linked business
Name of insurer Equitable Life Assurance Society
Total business
Financial year ended 31 December 2010
Units £000
Value of assets Mean Term
1 2
11 215243 14.01
12 24032 7.63
13
14
15
16
17
18 1000
19
20 240276
AAA/Aaa 31
AA/Aa 32
A/A 33
BBB/Baa 34
BB/Ba 35
B/B 36
CCC/Caa 37
Other (including unrated) 38
39
Credit rating of other fixed interest and other variable interest securities
Total other fixed interest and other variable interest securities
Inflation swaps
Other assets
Variation margin
Total (11 to 19)
Approved fixed interest securities
Other fixed interest securities
Cash and deposits
Equity index derivatives
Analysis of assets
Approved variable interest securities
Other variable interest securities
47

23032011:10:15:47
Form 57Long-term insurance business: Analysis of valuation interest rate (Sheet 1)
Name of insurer Equitable Life Assurance Society
Total business ORDINARY LONG TERM
Financial year ended 31 December 2010
Units £000
Net mathematical reserves
Net valuation interest rate
Gross valuation interest rate
Risk adjusted yield on
matching assets
2 3 4 5
1854 3.60 3.60 4.07
78884 2.88 3.60 4.07
16266 4.19 4.66 4.67
14727 4.66 4.66 4.67
33491 2.88 3.60 4.07
66343 0.88 1.10 1.75
15 3.60 3.60 4.07
15449 0.47 0.52 0.55
1951 0.52 0.52 0.55
36728 3.60 3.60 4.07
388652 4.66 4.66 4.67
3211225 3.60 3.60 4.07
1225892 1.10 1.10 1.75
205502 0.00 0.00 0.69
226951 0.52 0.52 0.55
911 3.50 3.50 4.07
22 2.88 3.60 4.07
9718 3.60 3.60 4.07
113793 4.66 4.66 4.67
Total
OVS Form 51 Non profit - annuities in payment
UK Pens Form 54 Annuity in payment - Index Linked
OVS Form 51 With Profits Policies - annuities in payment
OVS Form 51 With Profits Policies (net)
OVS Form 51 With Profits Policies (gross)
UK Pens Form 51 Non Profit annuity in payment
UK Pens Form 52 With Profits Policies
UK Pens Form 52 With Profits Policies short term business
UK Pens Form 52 With Profits - miscellaneous
UK L&G Form 52 With Profits Policies (gross)
UK L&G Form 54 Annuity in payment - Index Linked post 1991
UK L&G Form 54 Annuity in payment - Index Linked pre 1992
UK Pens Form 51 With Profits Policies
UK L&G Form 51 With Profits Policies - Non-Profit annuities in payment post 1991
UK L&G Form 51 With Profits Policies - Non-Profit annuities in payment pre 1992
UK L&G Form 52 With Profits Policies (net)
UK L&G Form 52 With Profits Policies (net) short term business
Product group
1
UK L&G Form 51 With Profits Policies - deferred annuities
UK L&G Form 51 With Profits Policies - other
48

23032011:10:15:47
Form 57Long-term insurance business: Analysis of valuation interest rate (Sheet 2)
Name of insurer Equitable Life Assurance Society
Total business ORDINARY LONG TERM
Financial year ended 31 December 2010
Units £000
Net mathematical reserves
Net valuation interest rate
Gross valuation interest rate
Risk adjusted yield on
matching assets
2 3 4 5
2845 2.88 3.60 4.07
4404 0.88 1.10 1.75
42765 3.60 3.60 4.07
5039 1.10 1.10 1.75
18575 0.00 0.00 4.07
Total 5722004
OVS Form 52 With Profits Policies (gross)
OVS Form 52 With Profits Policies (gross) short term business
OVS Form 52 With Profits - miscellaneous
Product group
1
OVS Form 52 With Profits Policies (net)
OVS Form 52 With Profits Policies (net) short term business
49

23032011:10:15:47
Form 58
Long-term insurance business : Distribution of surplus
Name of insurer Equitable Life Assurance Society
Total business / subfund ORDINARY LONG TERM
Financial year ended 31 December 2010
Units £000
Financial year Previous year
1 2
Valuation result
Fund carried forward 11 5722004 5498486
Bonus payments in anticipation of a surplus 12 18946 21725
Transfer to non-technical account 13
Transfer to other funds / parts of funds 14
Subtotal (11 to 14) 15 5740950 5520211
Mathematical reserves 21 5721976 5498456
29 18974 21755
Composition of surplus
Balance brought forward 31
Transfer from non-technical account 32
Transfer from other funds / parts of fund 33
Surplus arising since the last valuation 34 18974 21755
Total 39 18974 21755
Distribution of surplus
Bonus paid in anticipation of a surplus 41 18946 21725
Cash bonuses 42
Reversionary bonuses 43 28 30
Other bonuses 44
Premium reductions 45
Total allocated to policyholders (41 to 45) 46 18974 21755
Net transfer out of fund / part of fund 47
Total distributed surplus (46+47) 48 18974 21755
Surplus carried forward 49
Total (48+49) 59 18974 21755
Percentage of distributed surplus allocated to policyholders
Current year 61 100.00 100.00
Current year - 1 62 100.00 100.00
Current year - 2 63 100.00 100.00
Current year - 3 64 100.00 100.00
Surplus including contingency and other reserves held towards the capital requirements (deficiency) (15-21)
50
23032011:10:15:47
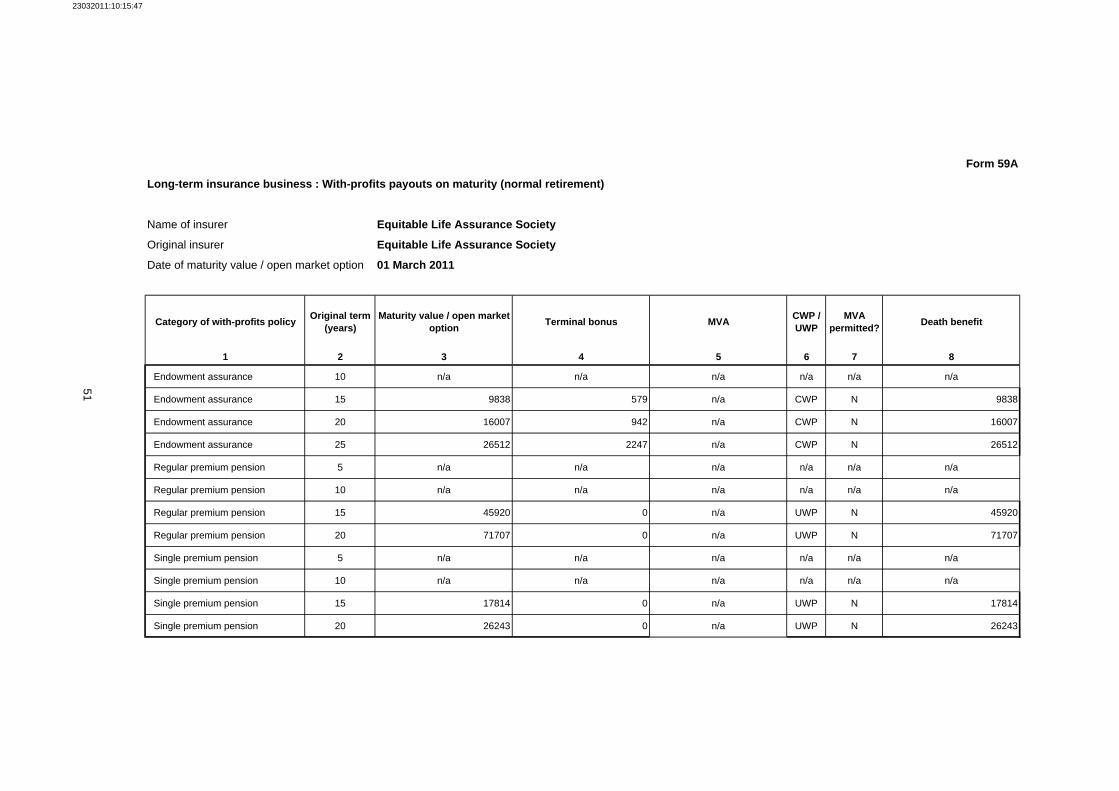
Form 59A
Long-term insurance business : With-profits payouts on maturity (normal retirement)
Name of insurer Equitable Life Assurance Society
Original insurer Equitable Life Assurance Society
Date of maturity value / open market option 01 March 2011
Category of with-profits policy Original term (years)
Maturity value / open market option Terminal bonus MVA CWP /
UWPMVA
permitted? Death benefit
1 2 3 4 5 6 7 8
Endowment assurance 10 n/a n/a n/a n/a n/a n/a
Endowment assurance 15 9838 579 n/a CWP N 9838
Endowment assurance 20 16007 942 n/a CWP N 16007
Endowment assurance 25 26512 2247 n/a CWP N 26512
Regular premium pension 5 n/a n/a n/a n/a n/a n/a
Regular premium pension 10 n/a n/a n/a n/a n/a n/a
Regular premium pension 15 45920 0 n/a UWP N 45920
Regular premium pension 20 71707 0 n/a UWP N 71707
Single premium pension 5 n/a n/a n/a n/a n/a n/a
Single premium pension 10 n/a n/a n/a n/a n/a n/a
Single premium pension 15 17814 0 n/a UWP N 17814
Single premium pension 20 26243 0 n/a UWP N 26243
51

23032011:10:15:47
Form 59B
Long-term insurance business : With-profits payouts on surrender
Name of insurer Equitable Life Assurance Society
Original insurer Equitable Life Assurance Society
Date of surrender value 01 March 2011
Category of with-profits policyDuration at surrender
(years)Surrender value Terminal bonus MVA CWP /
UWPMVA
permitted? Death benefit
1 2 3 4 5 6 7 8
Endowment assurance 5 n/a n/a n/a n/a n/a n/a
Endowment assurance 10 n/a n/a n/a n/a n/a n/a
Endowment assurance 15 8931 0 n/a CWP Y 17742
Endowment assurance 20 15013 0 n/a CWP Y 20968
With-profits bond 2 n/a n/a n/a n/a n/a n/a
With-profits bond 3 n/a n/a n/a n/a n/a n/a
With-profits bond 5 n/a n/a n/a n/a n/a n/a
With-profits bond 10 n/a n/a n/a n/a n/a n/a
Single premium pension 2 n/a n/a n/a n/a n/a n/a
Single premium pension 3 n/a n/a n/a n/a n/a n/a
Single premium pension 5 n/a n/a n/a n/a n/a n/a
Single premium pension 10 n/a n/a n/a n/a n/a n/a
52

23032011:10:15:47
Form 60Long-term insurance capital requirement
Name of insurer Equitable Life Assurance Society
Global business
Financial year ended 31 December 2010Units £000
LTICR factor
Gross reserves / capital at
risk
Net reserves / capital at
risk
Reinsurance factor
LTICR Financial
year
LTICR Previous
year
1 2 3 4 5 6
Insurance death risk capital component
Life protection reinsurance 11 0.0%
Classes I (other), II and IX 12 0.1%
Classes I (other), II and IX 13 0.15%
Classes I (other), II and IX 14 0.3% 5987776 339617 8982 10210
Classes III, VII and VIII 15 0.3% 25728 0.50 39 58
Total 16 6013505 339617 9020 10267
Insurance health risk and life protection reinsurance capital componentClass IV supplementaryclasses 1 and 2 and life protection reinsurance
21 45 37
Insurance expense risk capital componentLife protection and permanenthealth reinsurance 31 0%
Classes I (other), II and IX 32 1% 5861565 5477652 0.93 54777 52641
Classes III, VII and VIII(investment risk) 33 1% 268684 244352 0.91 2444 2344
Classes III, VII and VIII(expenses fixed 5 yrs +) 34 1% 17500 0.85 149 142
Classes III, VII and VIII(other) 35 25%
Class IV (other) 36 1% 71 0.85 1 1
Class V 37 1%
Class VI 38 1%
Total 39 57369 55128
Insurance market risk capital componentLife protection and permanenthealth reinsurance 41 0%
Classes I (other), II and IX 42 3% 5861565 5477652 0.93 164330 157923
Classes III, VII and VIII(investment risk) 43 3% 268684 244352 0.91 7331 7031
Classes III, VII and VIII(expenses fixed 5 yrs +) 44 0% 17500
Classes III, VII and VIII(other) 45 0% 2015588
Class IV (other) 46 3% 71 0.85 2 2
Class V 47 0%
Class VI 48 3%
Total 49 8163409 5722004 171662 164956
Long term insurance capital requirement 51 238097 230388
0.50
53

54
RETURNS UNDER INSURANCE COMPANIES LEGISLATION THE EQUITABLE LIFE ASSURANCE SOCIETY FINANCIAL YEAR END 31 DECEMBER 2010 SUPPLEMENTARY NOTES TO THE RETURN *0301* Net Admissible Assets and Capital Resources Valuation differences between assets in Form 3 and assets in Forms 13 and 14 are illustrated below: Description Reference £000
Net Admissible Assets
Form 13 Line 89 6,255,013
Mathematical Reserves Form 14 Line 11 (5,722,004)
Other Insurance Liabilities
Form 14 Line 49 (173,809)
Total Capital Resources Form 3 Line 79 359,200 *0310* Positive Valuation Difference The positive valuation difference detailed in line 14 represents the difference between the value of with-profits liabilities as valued in accordance with the FSA Handbook of rules and guidance and the value of with-profits liabilities that the Society has used in its external financial reporting to comply with FRS 27 and the Financial Reporting Council – Board of Actuarial Standards guidance note 45 (section 3.3.3.1 relevant to closed funds). *1308* Aggregate Values The aggregate value of unlisted investments included at lines 41, 42, 46 or 48 which have been valued in accordance with GENPRU rule 1.3 is £4.1m (2009: £17.3m). Part of the Society's assets is invested in property (including property unit trusts) and unlisted equity, amounting to £451m at year end 2010 (2009: £657m). In adverse market conditions, it may not be possible to realise these investments without delay. The aggregate value of investments in collective investment schemes in line 43 that are not schemes falling within the UCITS Directive are £68.5m (2009: £68.9m). *1309* Aggregate Value of Hybrid Securities The aggregate value of hybrid securities included at lines 46 or 48 is £109.2m (2009: £125.6m). *1310* Amounts Receivable and Payable Amounts due to and from any one person have been offset where appropriate in accordance with generally accepted accounting principles.

55
*1312* Large Counterparty Exposures There were no exposures to counterparties at the end of the financial year exceeding 5% of the Society’s base capital resources requirement and long-term insurance liabilities, excluding property linked liabilities and net of reinsurance ceded. *1318* Other asset adjustments The Society has adopted 'FRS26 Financial Instruments: Measurement' in the preparation of its external financial reporting. As a result, the reinsurers' share of technical provisions reported on Form 13 differs from that recorded in the Society's Annual Statutory Report and Accounts. The difference, £13.9m (2009: £20.7m), is recorded on Line 101 of Form 13. *1319* Investment Guidelines, Maximum Counterparty Exposure The maximum amount that the investment manager is permitted to expose the funds of the Society to any one Counterparty is controlled by the following limits for individual entities or groups including exposure across significant asset classes as follows; Maximum investment in any individual entity or group % of total
fixed interest Supranational and Government guaranteed “AAA” rated 5.00% Other “AAA” 2.00% “AA” rated 2.00% “A” rated 1.00% “BBB” rated 0.50% All new purchases should be rated as BBB- or above at the time of purchase. Certain specified securities (known as 'grandfathered' securities) are excluded from these limits. These are securities which were historically held by the Society, which will be sold down when market conditions are considered favourable. The Society has no appetite to actively increase it's exposure to illiquid securities. As such, unless it receives prior approval from the Society, the investment manager is not permitted to purchase securities which it deems to be illiquid at the time of purchase. Additionally, as a further step, the maximum of the outstanding amount of any one issue that may be held shall be 5%. For Medium Term Notes, Asset Backed Securities and Mortgage-backed Securities issues, such percentages shall be measured against the issue in the aggregate rather than against the individual tranches of such issue. For any individual group or entity that is classified as Supranational or Government Guaranteed by the investment manager and is rated "AAA", the maximum of the outstanding amount of any one issue that may be held shall be 15%. *1401* Provision for Adverse Changes Investment guidelines for the use of conventional derivatives operated throughout the year and did not permit the writing of uncovered call options. Consequently, no provision for adverse changes is considered necessary.

56
*1402* Charges, Contingent Liabilities, Guarantees, Indemnities and Contractual Commitments No liabilities included in Form 14 are secured by a charge. There exist some uncertainties that, if they were to materialise, could adversely impact on the financial position of the Society. Over the last few years, these uncertainties have been addressed to a very significant extent, and the range of possible outcomes has continued to narrow. The major development during 2010 was Government’s announcement of a payment scheme in response to the Parliamentary Ombudsman’s report into the regulatory handling of the Society. In contrast, there was little change in respect of the 91 claims against the Society in district courts across Germany where the cases have all been defended successfully so far. Also outstanding are investigations initiated by the Accountancy and Actuarial Disciplinary Board (“AADB”). The AADB are investigating an accountant and an actuary in respect of the provision of information for use by the Financial Reporting Review Panel relating to the financial statements of Equitable Life in 1999. The actuary is also being investigated by the AADB in relation to audits of the 1997, 1998 and 1999 financial statements. The AADB is also investigating the conduct of certain actuaries in relation to the provision of advice by, or on behalf of, the Government Actuary’s Department to prudential regulators. It is not considered that the uncertainties described above represent a significant financial threat, and it is considered that the risk of any material new issues arising for the Society appears limited. The Board continues to closely monitor the contractual commitments the Society has in respect of the two pension schemes for which HBOS is principal employer. There remains a possibility that it may be necessary for a more conservative basis to be adopted in future in calculating the Society’s obligations. Additionally, there remains a risk to the Society that investment conditions change or policyholders defer their retirement, which may materially alter the calculations of technical provisions for policy liabilities. The process of transferring administration services back to the Society brings with it a range of operational risks, which makes the estimation of future costs more uncertain, and will require careful management. The Society has arrangements in place for identifying, monitoring and managing these risks. The financial position of the Society has been projected under a range of economic scenarios, in order to assess how robust it remains in adverse conditions. The projections make allowance for capital distribution. The Board has also considered the level of contingent liabilities in its analysis of the Society’s financial position and considers that these have reduced in significance in recent years. Based on these analyses, the Board is confident of its ability to manage adverse scenarios that may arise, recognising that in some scenarios very strong action to reduce policyholder payouts would be required. The Board has assessed these uncertainties using the latest available information and has concluded that it is appropriate to prepare this return on a going concern basis. *1405* Reconciliation of Total Liabilities to Financial Statements The value in line 74 represents the difference between the value of liabilities as valued in accordance with FSA Handbook of Rules and Guidance and the value of liabilities detailed in external financial reporting to comply with FRS27 and the Financial Reporting Council - Board of Actuarial Standards guidance note 45 (section 3.3.3.1 relevant to closed funds).

57
*1701* Treatment of the variation margin The aggregate excess variation margin received in respect of derivatives in 2010 was £0.8m (2009: £3.0). The variation margin is included within line 54 of Form 13. The liability to repay the excess variation margin at the end of 2010 is reflected in line 54 of Form 13. *4002* Other Income Other Income is comprised of the following: 2010 2009 £'000 £'000 Stock Lending commission 526 640 Investment management fee rebate 750 1,008 Other Income 763 1,227 2,039 2,875 *4005* Income and Expenditure Translation Foreign currency values for income and expenditure have been translated at rates of exchange ruling at the time of the respective transactions. *4008* Management Services During 2010, substantially all management services for The Equitable Life Assurance Society have been provided by Lloyds Banking Group. Investment services transferred from Insight Investment Management (Global) Limited to BlackRock Investment Management (UK) Limited in October 2010. Property administration services have remained with Invista Real Estate Investment Management throughout 2010. *4010* Investment Income from Linked Assets Included within line 12 is £4.3m of income earned on linked assets. *4803* Assumed redemption dates For callable securities with a range of redemption (or option) dates we take advice from our investment managers as to the most likely date of redemption. Remaining securities are assumed to be redeemed at the earliest or latest redemption (or option) date, whichever gives the lower yield. The value of 'approved fixed interest securities' and 'other fixed interest securities' with variable redemption (or option) dates are £127,601 and £270,017,156 respectively. Irredeemable assets with no first option date are assumed to have a redemption date in 2049. Property and equity are assumed not to be redeemed. *4806* Assets used to calculate the investment returns All assets in column 2 have been used to calculate the investment returns in column 5.

58
*4807* Return allocated to Asset Shares The return allocated to asset shares is an increase of 0.0% for pension contracts and 0.0% for life contracts. This is the return allocated by the Board, after consideration of all risks, reserving and capital matters. *4901* Rating agencies The credit rating used is the lower of Moody's, Standard & Poor's and Fitch (if available). In the absence of such ratings, one is supplied by BlackRock Investment Management (UK) Limited; the Society's third party investment manager who is not connected with the Society. Any fixed interest elements of collective investment schemes in column 1 allocated to column 2 of Form 48 are classified as unrated. *4902* Negative redemption yield The allowance made for risk of default of income and redemption payments on fixed interest corporate bonds has led to negative redemption yields for assets in ratings categories "B/B", "CCC/Caa" and "Other (including unrated)". The negative yield on approved variable interest securities is due to negative real yields at short durations. *5102* Policy count The benefits under code 380 are attributable to life cover and death in service benefits attached to individual and group policies in codes 545, 555, 725 and 735. The policy count has been set to zero to avoid double counting. *5201* Group scheme member count There are 42 Final Salary schemes included in code 555 where benefits are not required at member level. Column 3 has been set to zero for these policies. *5202* Group scheme member count There are three schemes in the figures for code 555 where the number of members has been approximated to 100. These schemes are administered by a third party. *5203* Policy count Where a policy has both with-profits and unit linked benefits the policy count has been entered on Form 53. *5301* Group scheme member count There are 28 Final Salary schemes included in code 735 where benefits are not required at member level. Column 3 has been set to zero for these policies.

59
*5302* Policy count Where a policy has both with-profits and unit linked benefits the policy count has been entered on Form 53. *5303* Miscellaneous reserves The reserves of £37.796m under code 795 are attributable to property linked immediate annuities (£33.501m), property linked deferred annuities (£3.756m), property linked health products (£0.482m) and Building Society linked endowment assurance (£0.057m). *5702* Section 148 Waiver - Determination of Rates of Interest on Fixed Interest Securities The Financial Services Authority, on the application of the firm, made a direction under section 148 of the Act in December 2007. The effect of the direction is to modify INSPRU 3.1.35 to require the firm to calculate the yield on certain categories of fixed interest security on an aggregate basis. *5703* Classification of Product Groups The product groups set out in Form 57 reflect the changes in determining the interest rate for various classes of with profit contracts as noted in appendix 9.4. *5901* Market Value Adjustment For CWP contracts no explicit MVA is applied as part of the surrender basis. Surrender values are set so that they are comparable to UWP policies on surrender. *6001* Class IV business and supplementary accident and sickness insurance Forms 11 and 12 are not completed, as the gross annual office premiums for the relevant classes are less than 1% of the total gross annual office premiums. The figure in line 21 of Form 60 exceeds the amount that would be obtained had Forms 11 and 12 been completed and is calculated as follows: These classes are 100% reinsured and closed to new business. Premiums are payable monthly and so the premiums earned and receivable are essentially the same. The premiums to the supplementary accident and sickness insurance were £37,852 and the premiums to Class IV business were £853,997. The 'premiums amount' is therefore 0.18 x (£37,852 + £853,997 / 3) x 0.5 = £29,027 Claims in the last 12 months were nil for the supplementary accident and sickness insurance and £1,042,507 for the Class IV business. The 'claims amount' is therefore 0.26 x (0 + £1,042,507 / 3) x 0.5 = £45,175. Therefore, 'claims amount' of £45,175 is used.
THE EQUITABLE LIFE ASSURANCE SOCIETY
REGULATORY VALUATION REPORT
60
Introduction 1. (1) The date of the valuation was 31 December 2010.
(2) The date of the previous valuation was 31 December 2009.
(3) The date of the interim valuation was 30 June 2010. Product range 2. There were no significant changes to the Society's product range. The Society is closed to new business
except by increment.
Discretionary charges and benefits
3. (1) A market value reduction (or equivalent) was applied throughout 2010 for non-contractual withdrawals from all with-profits contracts.
(2) There were no changes to the basis for setting premiums on reviewable protection policies during
the year. (3) The interest rate added to non-profit deposit administration policies varied depending on the date
the policy commenced. This rate is fixed until benefits are taken. (4) There were no changes to service charges on linked policies. (5) There were no changes to benefit charges on linked policies. (6) There were no changes to the method and basis for management charges on unit-linked or
accumulating with-profits policies. (7) – (10) All linked liabilities are wholly reassured with Halifax Life and Clerical Medical Managed Funds
Limited. Linked fund prices mirror those set by the reassurer. Valuation Basis 4. The bases (and methodology) are set out in the following paragraphs.
(1) General
The main method used was that of a gross premium valuation with specific reserves for the future expenses of running the business. Accumulating with-profits policies For accumulating with-profits policies in the Basic Life Assurance and General Annuity and Pension Business Funds which were grouped by calendar year of vesting date, it has been assumed that the vesting date falls in the middle of the group year.

THE EQUITABLE LIFE ASSURANCE SOCIETY
REGULATORY VALUATION REPORT
61
The liability was calculated by discounting the guaranteed benefits (including any declared and attaching bonus) with an allowance for guaranteed investment return (GIR) where appropriate. Policies effected before 1 July 1996 have a GIR of 3.5% p.a. (with the exception of some Retirement Annuity policies effected prior to 1 October 1975 that have a GIR of 2.5% p.a.) and policies effected on or after 1 July 1996 have a GIR of 0.0% p.a. For policies with flexible retirement dates, the dates at which retirement benefits are assumed to be taken are based on an amounts analysis of recent Society experience and are set out in section 4 (8). Certain pension policies also contain a guaranteed minimum level of pension. The liability for these policies was set to the higher of the discounted cash fund and declared bonus cash fund or the discounted value of the guaranteed minimum pension at retirement. The reserves were calculated using the same mortality and expense basis and methodology used to value annuities in payment but with interest appropriate to pre retirement pension policies. This value was then discounted to the valuation date using interest and mortality for pre retirement pension policies. For with-profits managed pension policies, school fee trust plans and with-profits personal pension trustee income drawdown policies, the current full value of the guaranteed fund and attaching declared bonus fund was reserved. The attributable expense reserves are based on the ongoing costs directly relating to administration derived from the current expected future expenses of the Society. These will be covered by the policy fees from gross policies before their assumed benefit payment dates. None of these expenses are therefore assumed to be covered by policy fees on policies past their assumed benefit payment date, which includes all managed pension contracts. These expenses are assumed to increase in line with inflation. For policies with flexible retirement dates the dates at which retirement benefits are assumed to be taken are based on a lives analysis of recent Society experience and are set out in section 4 (8). Annuities Life immediate annuities were valued individually assuming payments are continuous. Joint-life and last survivor annuities were valued individually by equivalent factors based on the ages of the respective lives and the incidence of payments. Outstanding guaranteed periods and escalation in payment are also allowed for in the valuation where applicable. Temporary immediate annuities were valued as annuities certain. For with-profits immediate annuities the liability was calculated by valuing the guaranteed payments and attaching bonus payments. Conventional Business For the main classes of annual premium business the liability was calculated by deducting from the value of the guaranteed benefits, including vested bonus additions, the value of office premiums receivable after deducting from these a provision for future expenses. Whole life assurances were valued individually and the factors for valuing sums assured and bonuses were increased by one half-year's interest to allow for immediate payment of claims.

THE EQUITABLE LIFE ASSURANCE SOCIETY
REGULATORY VALUATION REPORT
62
Endowment assurances were grouped according to the calendar year of maturity and attained age. An allowance was made for immediate payment of claims. Level temporary assurances and decreasing temporary assurances (other than those tabulated below) were valued individually. An allowance was made for the immediate payment of claims.
Assurances upon sub-standard lives were valued as though they were upon normal lives assured at the tabular rates of premium and the valuation liability was increased by the amount of one year's extra premium. Surrender Value Reserve For accumulating with-profits business, an additional reserve for the amount of a cash payment secured by the exercise of an option to surrender the policy has been calculated in accordance with INSPRU 1.2.71R. This is calculated by comparing the “normal” policy reserve obtained using the gross premium valuation method applied to the guaranteed benefits for accumulating with-profits policies as described earlier in section 4 (1) plus the allowance for future expenses as described in paragraph 4 (6), with the lower of: • the current surrender value that could reasonably be expected to be paid having regard to the
representations made to policyholders, and • that value disregarding discretionary adjustments (i.e. disregarding both the financial
adjustment and final bonus beyond the current guaranteed value). Where the “normal” reserve is higher, no additional reserve is held. Where it is lower, the difference is held within this additional reserve. The bases to be used in the event of surrender or transfer are not guaranteed, and the primary objective when setting the basis is to protect the interests of the continuing with-profits policyholders. In the event of a significant level of policy discontinuances, the Society reserves the right to reduce surrender payments. If it were required in order to protect solvency, surrender payouts could be made equal to the discounted value of the guaranteed benefits. An additional reserve is also calculated for conventional with-profits business, in a similar way to that described above. Unit Linked The unit liability under all linked contracts was valued by taking the number of units deemed to attach to policies multiplied by the valuation price per unit. The valuation prices match those set by Halifax Life for liabilities reinsured through Halifax Life. The valuation prices match those set by Clerical Medical Managed Funds Limited (CMMF) for liabilities reinsured through CMMF. The business is fully reinsured. The unit liability under all contracts linked directly to the Halifax UK Growth OEIC was valued by taking the number of units deemed to attach to policies multiplied by the mid price of Halifax UK Growth OEIC shares on the valuation date. The non-unit liability was calculated using a per policy projected cash flow methodology. The only non-linked liabilities are in respect of expenses and mortality and are described in section 4 (4) and 4 (6) below.

THE EQUITABLE LIFE ASSURANCE SOCIETY
REGULATORY VALUATION REPORT
63
Other Business For with-profits Flexible Protection Plans and German Deferred Annuity policies, which were grouped by calendar year of maturity date or annuity vesting date as appropriate, it has been assumed that the maturity or vesting date falls in the middle of the group year. The liability was calculated by discounting the guaranteed fund and attaching bonuses where appropriate and adding the amount of the current month's mortality charge deduction. With-profits Bonds, with-profits Personal Investment Plans, with-profits Personal Pension Trustee Investment policies and with-profits International Investment Plans were grouped by calendar year of the next option date on which full withdrawal can be made on guaranteed terms. For this purpose the guaranteed fund and bonuses attaching to different single premiums paid to the policy were included in the appropriate group years. It has been assumed that the next option date falls in the middle of the group year. The liability was calculated by discounting the guaranteed fund and attaching bonuses. Recurrent single premium death-in-service group pension arrangements were valued using one year’s premium.
(2) Interest rates used are set out in the following table:
With-profits business classes are split into short- and long-term business in accordance with the average remaining term of the class. Product group Rate at
31 December 2010 Rate at 31 December 2009
UK non-profit annuities (Pensions) 4.66% 5.00% UK non-profit annuities pre-1992 (Life) 4.66% 5.00% UK non-profit annuities post-1991 (Life) 4.19% 4.50% Overseas non-profit annuities (Pensions) 4.66% 5.00% German with-profits annuities (Life) 3.50% 3.50% UK index-linked annuities pre-1992 (Life) 0.52% 0.54% UK index-linked annuities post-1991 (Life) 0.47% 0.49% UK index-linked annuities (Pensions) 0.52% 0.54% Long-term pension contracts 3.60% 4.00% Short-term pension contracts 1.10% 4.00% UK with-profits endowments and whole life 2.88% 3.20% UK term assurance 2.78% 3.10% UK with-profits long-term policies (Flexible Protection Plan, Regular Savings Plan, Major Medical Cash Plan, Critical Illness Plan)
2.88% 3.20%
UK with-profits short-term policies (With-Profits Bond, Personal Investment Plan)
0.88% 3.20%
Overseas with-profits policies (Life) 2.88% 3.20% UK non-profit annuities in deferment (Pensions)
3.50% 3.90%

THE EQUITABLE LIFE ASSURANCE SOCIETY
REGULATORY VALUATION REPORT
64
(3) Yields on assets are reduced to allow for risk as follows:- Equity shares are assumed to have no yield. Property (and property unit trust) yields are capped at 6.5%. The rates of interest on fixed interest securities have been determined using an aggregate yield basis, i.e. by calculating the rate of interest as the rate which equates the aggregate market value to the discounted value of the aggregate cash flows. The fixed interest portfolio (excluding convertible fixed interest securities) has been separated into two segments of securities which have like attributes (being the categories on Forms 48 and 49), i.e.: • approved fixed interest securities, and • other fixed interest securities. Yields on approved fixed interest assets with credit ratings of "exceptionally or extremely strong" or "very strong" are not reduced for risk. At the 31 December 2007 valuation, all other fixed interest assets had their yield reduced by reference to historic default rates. These were based on 20 years of Moody's data and represented the mean default rate plus two standard deviations plus a 40% margin for prudence. These default rates were increased by a factor of 140% for the valuation at 31 December 2009. This allowance for default was set with regard to the Bank of England's analysis of the decomposition of corporate bond spreads, market assessment of default risk in the Credit Default Swap market, and the pessimistic view from the range of expected default outcomes presented by the Society's investment managers. After consideration of the most recent market data available and in absence of any actual defaults on the Society's portfolio, the future default allowance for A and BBB rated bonds has been reduced at the 2010 year end. The allowance for defaults ascribes 38% of the credit spread seen on the Society's corporate bond portfolio to be due to default risk. The overall strength broadly equates to the mean default rate plus two standard deviations. The assumptions used to reduce the yield are shown in the following table:
Credit Rating Yield Reduction at 31 December 2010
Yield Reduction at 31 December 2009
AAA 0.20% 0.20% AA+ 0.25% 0.25% AA 0.35% 0.35% AA- 0.47% 0.47% A+ 0.48% 0.64% A 0.50% 0.88% A- 0.67% 1.20%
BBB+ 0.83% 1.63% BBB 1.00% 2.23% BBB- 3.04% 3.04% BB+ 4.15% 4.15% BB 5.65% 5.65% BB- 7.71% 7.71% B+ 10.51% 10.51% B 14.34% 14.34% B- 19.55% 19.55%
CCC 26.67% 26.67% CC 26.67% 26.67%

THE EQUITABLE LIFE ASSURANCE SOCIETY
REGULATORY VALUATION REPORT
65
Non-rated stocks are treated as having rating CC. For stocks with variable redemption dates we have taken the view of investment advisors and set the redemption date to the expected redemption date and taken into account any anticipated changes to income until this date. Where our investment advisors have no view as to the likely redemption date and where the income yield was greater than the gross redemption yield, the stocks were assumed to redeem at the earliest date.
(4) The mortality rates are summarised in the following tables:
(i) Immediate Annuities
Complete expectation of life
Complete expectation of life
Product Group
Table at 31 December 2010 in possession 65 75
Table at 31 December 2009 in possession 65 75
UK non-profit annuities (Pensions)
87.5%PNMA00mc U=2013 80.0%PNFA00mc U=2013
Male 24.6 Female 27.9
Male 15.3 Female 18.0
87.5%PNMA00mc U=2012 80.0%PNFA00mc U=2012
Male 24.4 Female 27.6
Male 15.1 Female 17.8
UK non-profit annuities (Life)
72.5%IML00ult U=2010 77.5%IFL00ult U=2010
Male 24.6 Female 27.1
Male 15.1 Female 17.0
72.5%IML00ult U=2009 77.5%IFL00ult U=2009
Male 24.5 Female 27.1
Male 15.1 Female 16.9
Overseas with-profits annuities (Life)
87.5%PNMA00mc U=2013 80.0%PNFA00mc U=2013
Male 24.6 Female 27.9
Male 15.3 Female 18.0
87.5%PNMA00mc U=2012 80.0%PNFA00mc U=2012
Male 24.4 Female 27.6
Male 15.1 Female 17.8
Overseas non-profit annuities (Pensions)
87.5%PNMA00mc U=2013 80.0%PNFA00mc U=2013
Male 24.6 Female 27.9
Male 15.3 Female 18.0
87.5%PNMA00mc U=2012 80.0%PNFA00mc U=2012
Male 24.4 Female 27.6
Male 15.1 Female 17.8
UK unit- linked annuities (Pensions)
80.0%PNMA00mc U=2013 65.0%PNFA00mc U=2013
Male 25.5 Female 29.9
Male 16.0 Female 19.7
80.0%PNMA00mc U=2012 65.0%PNFA00mc U=2012
Male 25.2 Female 29.6
Male 15.8 Female 19.5
UK index- linked annuities (Life)
72.5%IML00ult U=2010 77.5%IFL00ult U=2010
Male 24.6 Female 27.1
Male 15.1 Female 17.0
72.5%IML00ult U=2009 77.5%IFL00ult U=2009
Male 24.5 Female 27.1
Male 15.1 Female 16.9
UK index- linked annuities (Pensions)
87.5%PNMA00mc U=2013 80.0%PNFA00mc U=2013
Male 24.6 Female 27.9
Male 15.3 Female 18.0
87.5%PNMA00mc U=2012 80.0%PNFA00mc U=2012
Male 24.4 Female 27.6
Male 15.1 Female 17.8
The allowance for future mortality improvements for PNMA/PNFA00 is based on the implied future mortality improvements in the PMA/PFA 92 MC tables subject to a minimum improvement of 1.5% p.a.. The allowance for future mortality improvements for IML/IFL00ult is based on the implied future mortality improvements in the IML/IFL 92 tables subject to a minimum improvement of 1.5% p.a..

THE EQUITABLE LIFE ASSURANCE SOCIETY
REGULATORY VALUATION REPORT
66
ii) Deferred annuities
In deferment
Product group Table at 31 December 2010 in deferment
Table at 31 December 2009 in deferment
UK non-profit deferred annuities (Pensions)
90.0%AMC00ult 97.5%AFC00ult
90.0%AMC00ult 97.5%AFC00ult
German with-profits deferred annuities (Life)
90.0%AMC00ult 97.5%AFC00ult
90.0%AMC00ult 97.5%AFC00ult
In payment
Complete expectation of life at age 65 for current age
Complete expectation of life at age 65 for current age
Product Group
Table at 31 December 2010
45 55
Table at 31 December 2009
45 55 UK non-profit deferred annuities (Pensions)
87.5%PNMA00mc U=2013 80.0%PNFA00mc U=2013
Male 27.6 Female 30.8
Male 26.1 Female 29.3
87.5%PNMA00mc U=2012 80.0%PNFA00mc U=2012
Male 27.3 Female 30.6
Male 25.8 Female 29.1
German with- profits deferred annuities (Life)
87.5%PNMA00mc U=2013 80.0%PNFA00mc U=2013
Male 27.6 Female 30.8
Male 26.1 Female 29.3
87.5%PNMA00mc U=2012 80.0%PNFA00mc U=2012
Male 27.3 Female 30.6
Male 25.8 Female 29.1
iii) Linked business
For Managed Pensions no mortality was assumed. Otherwise, AM80 ultimate mortality
was assumed with a 2-year deduction from age for male lives and a 6-year deduction from age for female lives.
iv) Other products Product group Table at
31 December 2010 Table at 31 December 2009
All pension contracts 90.0%AMC00ult 97.5%AFC00 ult
90.0%AMC00ult 97.5%AFC00 ult
UK endowments and whole life 90.0%AMC00ult 97.5%AFC00 ult
90.0%AMC00ult 97.5%AFC00 ult
UK term assurance 72.5% TMC00 77.5% TFC00
72.5% TMC00 77.5% TFC00
UK with-profits policies (Life) 90.0%AMC00ult 97.5%AFC00 ult
90.0%AMC00ult 97.5%AFC00 ult
Overseas with- profits policies (Life) 90.0%AMC00ult 97.5%AFC00 ult
90.0%AMC00ult 97.5%AFC00 ult

THE EQUITABLE LIFE ASSURANCE SOCIETY
REGULATORY VALUATION REPORT
67
(5) There are no significant morbidity risks.
(6) The attributable expense basis is summarised in the following tables. The basis reflects the costs under insourcing of administration as described in section 4 (1). The 2009 figures reflect the charges under the agreement signed with HCL. There are no Zillmer adjustments. For net business it is assumed that the tax relief will be at 20%. Accumulating with-profits business For accumulating with-profits business, the following current levels of administrative expenses (excluding fund management) were assumed. It was further assumed that these expenses would increase at a rate of 3.4% per annum (2009 - 5.1% per annum).
Product code
Product name Year ending 31 December 2010
Year ending 31 December
2009 120 CWP savings endowment £250.78 per benefit £11.69 per benefit 125 CWP target cash endowment £250.78 per benefit £11.69 per benefit 500 UWP Bond £19.77 per benefit £11.69 per benefit 510 UWP savings endowment £19.77 per benefit £11.69 per benefit 535 UWP group regular premium
pension £3.12 per benefit £8 per benefit
555 Group deposit administration with-profits
£3.12 per benefit £8 per benefit
545 Individual deposit administration with-profits
£16.10 per benefit £6.68 per benefit
Separate allowance was made for fund management expenses using a loading of 1.40 per mille (2009 – 1.20 per mille) of the basic benefit including declared bonuses. These expenses were assumed to escalate in line with the valuation interest rates, i.e. a net rate of discount of 0%. For life assurance and general annuity business the appropriate per policy expenses and fund management assumptions shown above were netted down for tax at a rate of 20%. No other explicit reserve was made for expenses on policies where premiums have ceased, no future premiums are payable or the method of valuation does not take credit for future premiums as an asset. Conventional business Product code
Product name Year ending 31 December 2010
Year ending 31 December 2009
120 CWP savings endowment
3% of office premium 3% of office premium
125 CWP target cash endowment
3% of office premium 3% of office premium
155/165 CWP pensions 4% of office premium 4% of office premium 325/330 Term assurance 4.5% of office premium 4.5% of office premium
In addition, an annual loading of £3 (2009 – £3) was reserved per individual policy.

THE EQUITABLE LIFE ASSURANCE SOCIETY
REGULATORY VALUATION REPORT
68
Annuities For annuities in payment, the following current levels of administrative expenses were assumed. It was further assumed that the per benefit expenses would increase at a rate of 3.4% per annum (2009 – 5.1%). Product code
Product name
Year ending 31 December 2010
Year ending 31 December 2009
Per benefit Fund management Per benefit Fund management 400 Annuity £3.13 1.1 per mille £4.46 0.6 per mille
Linked business Future administration charges for unit-linked and “FTSE 100” linked policies are paid by Clerical Medical Managed Funds Limited as contractually agreed. In Forms 53 and 54 we have treated reserves set up in respect of these charges as reassured liabilities. Difference between these charges and future expenses are reserved for separately in the unattributable expense reserve. For UK regular premium business no future premiums have been assumed in the calculation of the non-unit-reserve. Product code
Product name Year ending 31 December 2010
Year ending 31 December 2009
700 Bond £7.51 per policy £11.96 per policy 715 Savings endowment £7.51 per policy £11.96 per policy 725 Regular premium pension £11.41 per policy £14.52 per policy 735 Group regular
premium pension £13.88 per member £17.68 per member
For Non-UK regular premium business no future premiums have been assumed in the calculation of the non-unit-reserve. Product code Product
name Year ending 31 December 2010
Year ending 31 December 2009
700 Bond £64.42 per policy £102.48 per policy 715 Savings
endowment £64.42 per policy £102.48 per policy
725 Regular premium pension
£96.77 per policy £123.17 per policy
735 Group regular premium pension
£119.02 per member £151.48 per member
There is also a 15bps (2009 – 15bps) expense charge p.a. to allow for investment expenses and overheads.

THE EQUITABLE LIFE ASSURANCE SOCIETY
REGULATORY VALUATION REPORT
69
(6) The unit growth rates (before management charges) and expense inflation rates are:
Year ending 31 December 2010 Year ending 31 December 2009
Unit growth rate Expense inflation Unit growth rate Expense inflation
4.0% 4.9% 4.6% 5.1%
(7) The method of valuation described above makes an allowance for any future guaranteed investment return described in section 4 (1) – Accumulating With-profits Policies. The assumption for future discretionary bonus for with-profits contracts is zero for all classes.
(8) The persistency assumptions are as follows:
There are no non-contractual withdrawals assumed. For pension policies where there is a range of contractual retirement dates. Recent Society experience for lives and benefits has been used to derive the persistency assumptions for expenses and policy values respectively. Experience has been split into two categories: policies that are yet to reach and those already past the Earliest Contractual Date (ECD) shown in the table below. The assumed retirement ages in relation to ECD are shown in the following tables (where NRA = Normal Retirement Age): Assumption for expenses for policies yet to reach ECD: Product Type Year ending 31
December 2010 Year ending 31 December 2009
Original ECD
Group Pensions 2.25 years before ECD
3.00 years before ECD
NRA
Individual (executive) Pensions At ECD 0.75 years before
ECD NRA
Personal Pensions (non-DSS)
8.00 years after ECD
6.75 years after ECD 55
Personal Pensions (DSS) 4.50 years after ECD
3.75 years after ECD 60
Retirement Annuities 5.00 years after ECD
3.75 years after ECD 60

THE EQUITABLE LIFE ASSURANCE SOCIETY
REGULATORY VALUATION REPORT
70
Assumption for expenses for policies already past ECD: Product Type Year ending 31
December 2010 Year ending 31 December 2009
Original ECD
Group Pensions 11.00 years after ECD
9.75 years after ECD NRA
Individual (executive) Pensions
3.50 years after ECD
2.25 years after ECD NRA
Personal Pensions (non-DSS)
11.25 years after ECD
9.00 years after ECD 55
Personal Pensions (DSS) 7.00 years after ECD
6.00 years after ECD 60
Retirement Annuities 9.00 years after ECD
7.50 years after ECD 60
Assumption for benefits for policies yet to reach ECD: Product Type Year ending 31
December 2010 Year ending 31 December 2009
Original ECD
Group Pensions 2.25 years before ECD
3.25 years before ECD NRA
Individual (executive) Pensions At ECD 1.00 years before
ECD NRA
Personal Pensions (non-DSS)
7.50 years after ECD
5.25 years after ECD 55
Personal Pensions (DSS)
4.25 years after ECD
3.50 years after ECD 60
Retirement Annuities 4.25 years after ECD
2.75 years after ECD 60
Assumption for benefits for policies already past ECD: Product Type Year ending 31
December 2010 Year ending 31 December 2009
Original ECD
Group Pensions 9.25 years after ECD
7.75 years after ECD NRA
Individual (executive) Pensions
3.50 years after ECD
2.00 years after ECD NRA
Personal Pensions (non-DSS)
11.25 years after ECD
9.00 years after ECD 55
Personal Pensions (DSS)
6.75 years after ECD
5.75 years after ECD 60
Retirement Annuities 8.50 years after ECD
6.75 years after ECD 60

THE EQUITABLE LIFE ASSURANCE SOCIETY
REGULATORY VALUATION REPORT
71
Group final salary benefits are assumed to terminate in 1.5 years.
Income drawdown policies are assumed to terminate immediately.
For group money purchase schemes, where individual member data is not required, the term to retirement is assumed to be the same as all other group money purchase schemes.
For life policies where there is a range of potential contractual termination dates, the following assumptions are used: Personal Investment Plans: next contractual withdrawal date. Bonds: next contractual withdrawal date. School Fee Trust Plans are assumed to terminate immediately.
(9) There are no other material assumptions stated elsewhere. (10) The Society does hold derivative contracts but none were used to justify the valuation rate of
interest.
(11) There have been no changes in methodology as a result of changes to INSPRU. Options and guarantees 5. (1) Guaranteed annuity rate options
(a) The method used is a deterministic one. The basic reserve represents the value of the cash benefit. The extra reserve for the guarantee is calculated as (Guaranteed Annuity Rate / Valuation Annuity rate -1) x basic reserve (subject to a minimum of zero) with an additional contingency margin of 70%.

THE EQUITABLE LIFE ASSURANCE SOCIETY
REGULATORY VALUATION REPORT
72
(b)
Product name Deferred annuity
Accumulating class Endowments
German Deferred Annuity
Basic reserve £1.7m £5.5m £2.3m £6.4m Spread of outstanding durations
0 to 20 years 0 to 10 years 0 to 23 years 0 to 40 years
Guarantee reserve £1.6m £5.1m £2.1m £1.9m Guaranteed annuity rate (male aged 65) 9.92% 9.92% 9.92% 6.94%
Increments permissible? No Yes No Yes
Form of annuity
Half yearly, in arrear, level, single life, no guarantee period
Half yearly, in arrear, level, single life, no guarantee period
Half yearly, in arrear, level, single life, no guarantee period
Monthly, in advance, level, single life, no guarantee period
Retirement ages 60 to 70 60 to 70 60 to 70 50 to 75
(2) Options which guarantee surrender values at specified dates are automatically valued as a result of the persistency assumption set out in paragraph 4(8).
(3) Guaranteed Insurability options
(a) Under some UK bonds the death benefit is 105% or 110% of the fund value. Due to the low level of new premiums, the low level of sum assured at risk and the prudent persistency assumption no extra reserve is held.
All Flexible Protection Plans issued on normal terms carry the option to effect further policies without evidence of health. Broadly, the option allows the life cover to be increased at intervals, by effecting further policies, in line with increases in the Retail Prices Index. Due to the low level of increases permitted and the reviewable and prudent nature of the mortality charges, no extra reserve is held.
Prior to 15 August 1986 an option to effect further policies without evidence of health could be included on the Society’s standard whole life and endowment assurances in the life fund. Due to the non-guaranteed and prudent premium basis for new policies, no extra reserve is held. Mortgage protection policies and endowment assurances with guaranteed minimum death benefit, where used as collateral security in respect of a house purchase loan carry the option to effect further policies or increase the death benefit on existing policies when an additional loan is effected or the terms of a loan are changed. Due to the size of this policy class, the conditional nature of the option and the prudent, non-guaranteed new policy premium bases, no extra reserve is held.
(b) Individually and in aggregate the sums assured of the policy classes listed above do not
exceed £1bn.

THE EQUITABLE LIFE ASSURANCE SOCIETY
REGULATORY VALUATION REPORT
73
(4) Guaranteed minimum pensions and guaranteed interest rates are valued as described in paragraph 4(1).
Expense reserves 6. (1) The aggregate amount of expense loadings expected to arise during the 12 months following the
valuation date from explicit reserves made is £74.4m.
Homogeneous risk group
Implicit allowances
(£m)
Explicit allowances
(investment)(£m)
Explicit allowances
(maintenance)(£m)
Non-attributable expenses
(maintenance) (£m)
Non-attributable expenses
(exceptional) (£m)
Total
(£m)UK Life n/a 0.1 1.6 0.8 1.7 4.2 UK Pensions n/a 5.9 4.9 19.9 37.2 67.9 Overseas n/a 0.1 0.4 0.7 1.5 2.7 Total n/a 6.1 6.9 21.4 40.4 74.8
The non-attributable expense is made up of £21.4m maintenance expenses and £40.4m exceptional expenses. Total maintenance expenses in 2011 are £34.4m.
(2) There are no implicit allowances. All expense assumptions and reserves are calculated explicitly.
(3) The difference of the amount of maintenance expenses from the maintenance expenses in 2010
shown in line 14 on Form 43 is due to increases in the current expected future expenses.
(4) The Society is closed to new business.
(5) The reserving basis already incorporates factors reflecting the closed nature of the fund.
(6) An exceptional expense reserve of £103.8m covers short term exceptional costs and is attributed to homogeneous risks groups in proportion to overall reserves. These costs are principally strategic business projects and pension funding commitments. A non-attributable regular expense reserve of £483.2m covers the regular expenses that exceed the explicit per policy expense allowance plus a margin for prudence and is split between homogeneous risks groups in proportion to overall reserves. This provision is calculated as the net present value of the projected budget which reduces at a rate related to the projected run off of the business.
Mismatching reserves 7. (1) There is just one with-profits fund which contains all the non-profit, index-linked and non-
sterling liabilities. The total mathematical reserves (other than liabilities for property-linked benefits), analysed by reference to the currencies in which the liabilities are expressed to be payable, together with the total value of the assets, analysed by reference to currency, which match the total liabilities are tabulated below:
Currency Mathematical Reserves
(£000,000) Assets
(£000,000) Sterling 5,554 5,965 Euro 166 190 US Dollar 2 100

THE EQUITABLE LIFE ASSURANCE SOCIETY
REGULATORY VALUATION REPORT
74
The Society holds a dollar hedge with exposure of £87m at the valuation date to mitigate the dollar mismatch.
(2) Not applicable.
(3) No mismatching reserve is required.
(4) Not applicable.
(5) Not applicable.
(6) Not applicable.
(7) No additional reserves are required arising from the tests on assets in INSPRU 1.1.34R.
The cash flows emerging from benefits and expenses from non-profit, index-linked and with-profits in force business have been considered. Index linked assets can be allocated to expenses such that the cash flows emerging from those assets match those from the expected expenses. Fixed interest assets can be allocated to non-profit business such that the cash flows emerging from those assets match closely those from the non-profit in force benefits. Index linked assets and cash can be allocated to index linked business such that the cash flows emerging from those assets match broadly those from the index-linked in force benefits. The remaining assets are allocated to with-profits business. Taking into account the nature and the term of this business, it is envisaged that there will be no future liquidity problems in a wide rage of investment scenarios. A significant proportion of the fund is held in British Government securities to allow for uncertainties of cash flows given the flexibility of the policies.
Other special reserves 8. (1) UK Accumulating With-Profits Pensions - Additional Reserves UWP
This reserve of £650.1m represents unattributable expenses, exceptional expenses, investment expense on unallocated funds and the potential cost of maintaining the current with-profits non-contractual termination terms. Descriptions of each of the principal elements of this reserve are detailed below.
Where appropriate, the assumptions used to determine this reserve are consistent with those assumptions defined in earlier section of this appendix. Those assumptions are combined with past experience to determine anticipated payments for the various components of the reserve. The likelihood of a payment being made has been based on past experience and expert advice (where appropriate). • Unattributable Regular Expenses
A provision is held for the regular administration costs of the Society in excess of the per policy loadings. This provision is calculated as the net present value of the projected budget which reduces at a rate related to the projected run off of the business.
• Exceptional Expenses
A provision is held for anticipated additional expenses over future years, including contractual commitments to HBOS in respect of pension scheme future service costs,

THE EQUITABLE LIFE ASSURANCE SOCIETY
REGULATORY VALUATION REPORT
75
anticipated additional costs associated with servicing policies in the medium term and non-recurring project costs.
• Investment Expenses
An allowance for anticipated fund management expenses that are not covered in individual policy reserves elsewhere is included in this reserve.
• Non Contractual Withdrawals
The reserve also includes an allowance for potential surrenders where the "surrender value" exceeds the "normal reserve" (as described in 4 (1) above).
(2) UK Non-Linked Pension (Other than Accumulating With-Profits) - Additional Reserves With-Profits OB
This reserve of £33.3m is the allowance made for unattributable expenses and exceptional expenses.
(3) UK Accumulating With-Profits Life - Additional Reserves UWP
This reserve of £16.9m represents unattributable expenses and the potential cost of maintaining the current with-profits non-contractual termination terms as detailed in section 4 (1) above.
(4) UK Non-Linked Life (Other than Accumulating With-Profits) – Additional Reserves With- Profits OB
This reserve of £4.7m is the allowance made for the potential cost of maintaining the current with-profits non-contractual termination terms as detailed in section 4 (1) above and unattributable expenses.
(5) Non UK Non-Linked Accumulating With-Profits – Additional Reserves UWP
This reserve of £7.6m is the allowance made for mis-selling claims against the Society and unattributable expenses.
(6) Non UK Non-Linked (Other than Accumulating With-Profits) - Additional Reserves With-Profits
OB
This reserve of £9.7m is the allowance made for unattributable expenses. Reinsurance details
9. (1) All reinsurance ceded on a facultative basis is with reinsurers who are authorised to carry on
insurance business in the United Kingdom.
(2) (i) (d) The reinsurer is Halifax Life Limited.
(e) The reinsurer automatically provides cover in respect of 100% of the liabilities under all linked and non-profit policies, with the exception of immediate annuities in payment other than those arising from deferred annuity policies after 1 March 2001.

THE EQUITABLE LIFE ASSURANCE SOCIETY
REGULATORY VALUATION REPORT
76
(f) The premium payable since the last investigation was £62,697,473 (g) There is no deposit-back arrangement. (h) The treaty is open to new business. (i) There is no undischarged obligation of the insurer.
(j) £2,395m of mathematical reserves were ceded under the treaty. (k) There is nil retention by the insurer for new policies being ceded.
(l) The reinsurer is authorised to carry out insurance business in the United
Kingdom.
(m) The Society and the reinsurer are not connected. (n) The treaty is not subject to any material contingencies.
(o) Not applicable. (p) There were no financing arrangements in force at 31 December 2010.
(ii) (d) The reinsurer is Clerical Medical Investment Group Limited (CMIG).
(e) The reinsurer automatically provides 100% of the liabilities in respect of units
purchased in CMIG With-Profits fund which are available as an investment option for members of certain group pension schemes.
(f) The premium payable since the last investigation was £800,774.
(g) There is no deposit back arrangement.
(h) The treaty is open to new business.
(i) There is no undischarged obligation of the insurer.
(j) £22m of mathematical reserves were ceded under the treaty.
(k) There is nil retention by the insurer for new policies being ceded.
(l) The reinsurer is authorised to carry out business in the United Kingdom.
(m) The Society and the reinsurer are not connected.
(n) The treaty is not subject to any material contingencies.
(o) Not applicable. (p) There were no financing arrangements in force at 31 December 2010.

THE EQUITABLE LIFE ASSURANCE SOCIETY
REGULATORY VALUATION REPORT
77
(iii) (d) The reinsurer is Clerical Medical Managed Funds Limited (CMMF).
(e) The reinsurer automatically provides 100% of the liabilities in respect of units purchased in CMMF funds which are available as an investment option for members of certain group pension schemes.
(f) The premium payable since the last investigation was £283,884. (g) There is no deposit back arrangement.
(h) The treaty is open to new business.
(i) There is no undischarged obligation of the insurer.
(j) £24m of mathematical reserves were ceded under the treaty.
(k) There is nil retention by the insurer for new policies being ceded.
(l) The reinsurer is authorised to carry out business in the United Kingdom.
(m) The Society and the reinsurer are not connected.
(n) The treaty is not subject to any material contingencies.
(o) Not applicable. (p) There were no financing arrangements in force at 31 December 2010.
Reversionary bonus 10. Reversionary bonus has not been declared on classes of business where the mathematical reserves exceed
the lesser of £10m and 1% of the total.

THE EQUITABLE LIFE ASSURANCE SOCIETY REALISTIC VALUATION REPORT
78
Introduction 1. (1) The date of the valuation was 31 December 2010
(2) The previous valuation was at 31 December 2009. (3) The date of the interim valuation was 30 June 2010. The Society has only one with-profits fund. Each of the following sections refers to that fund.
Assets 2. (1) The economic assumptions used to determine the value of future profits arising
from the non-profit insurance contracts were: Level and fixed escalation annuities
Current Valuation
Previous Valuation
Earned rate of interest on Non-profit assets (gross)
4.12% 4.35%
Discount rate applied to future cash flows
6.62% 6.85%
Per policy expense rate pa £3.13 p.a. £4.46 p.a. Expense inflation rate pa 3.40% 5.10%
The expense inflation rate shown is based on RPI inflation of 3.40% p.a. (previous valuation 3.60% p.a.) At the previous valuation there was an allowance for additional expense inflation of 1.50% p.a. due to a contract with a third party administrator (TPA). There is no additional allowance for additional expense inflation at the current valuation as the TPA contract no longer applies.
Index-linked annuities
Current Valuation
Previous Valuation
Earned real rate of interest on index-linked assets (gross)
0.22% 0.72%
Real discount rate applied to future cash flows
2.72%
3.22%
Per policy expense rate pa £3.13 p.a. £4.46 p.a. Real expense inflation rate pa 0.00% 1.50%
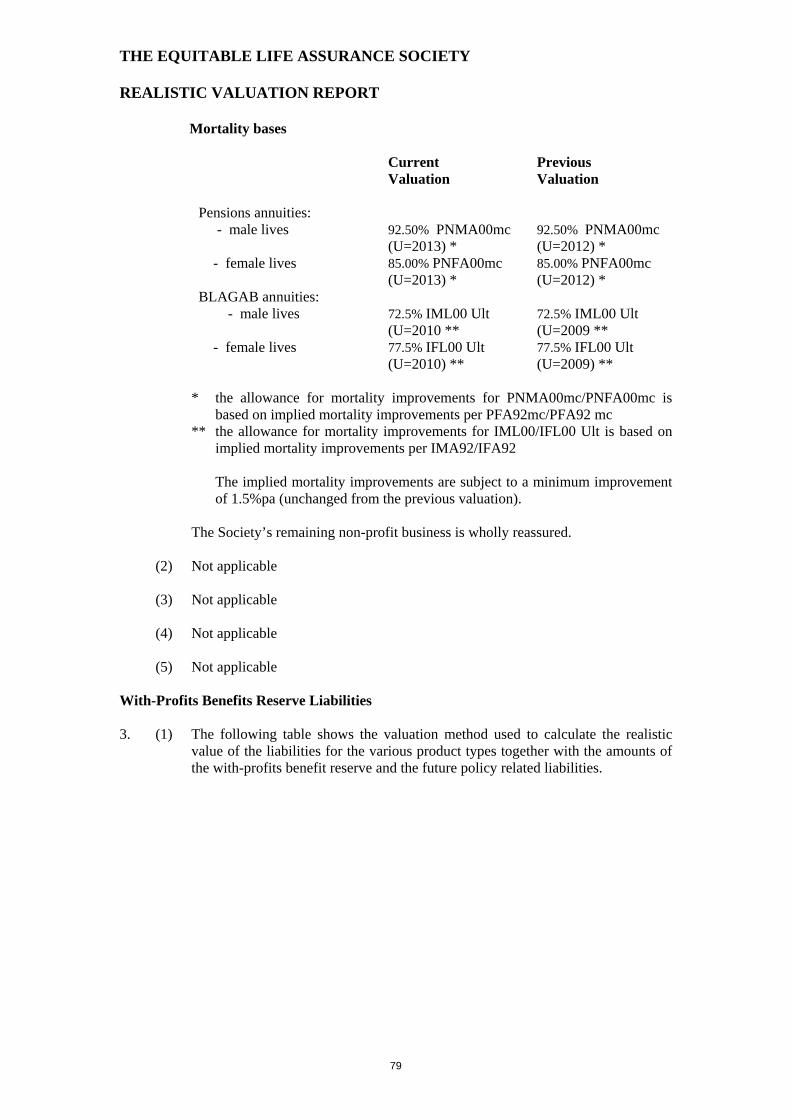
THE EQUITABLE LIFE ASSURANCE SOCIETY REALISTIC VALUATION REPORT
79
Mortality bases
Current Valuation
Previous Valuation
Pensions annuities: - male lives 92.50% PNMA00mc
(U=2013) * 92.50% PNMA00mc (U=2012) *
- female lives 85.00% PNFA00mc (U=2013) *
85.00% PNFA00mc (U=2012) *
BLAGAB annuities: - male lives 72.5% IML00 Ult
(U=2010 ** 72.5% IML00 Ult (U=2009 **
- female lives 77.5% IFL00 Ult (U=2010) **
77.5% IFL00 Ult (U=2009) **
* the allowance for mortality improvements for PNMA00mc/PNFA00mc is
based on implied mortality improvements per PFA92mc/PFA92 mc ** the allowance for mortality improvements for IML00/IFL00 Ult is based on
implied mortality improvements per IMA92/IFA92
The implied mortality improvements are subject to a minimum improvement of 1.5%pa (unchanged from the previous valuation).
The Society’s remaining non-profit business is wholly reassured.
(2) Not applicable
(3) Not applicable (4) Not applicable
(5) Not applicable
With-Profits Benefits Reserve Liabilities 3. (1) The following table shows the valuation method used to calculate the realistic
value of the liabilities for the various product types together with the amounts of the with-profits benefit reserve and the future policy related liabilities.

THE EQUITABLE LIFE ASSURANCE SOCIETY REALISTIC VALUATION REPORT
80
Product type Valuation
Method With-Profits Benefit Reserve £m
Future Policy Related Liabilities £m
Conventional with-profits P 83 (4) Life RSP contract R 94 (2) Flexible Protection Plans R 18 (4) Pensions RSP (3.5% GIR) R 2,957 495 Pensions RSP (0% GIR) R 676 (43) Total for these products 3,828 442 Aggregate de minimis contracts 17 (0) Grand total 3,845 442
R=Retrospective Method, P=Prospective Method
The Future Policy Related liabilities shown are based on the future cost of contractual guarantees (line 41 of Form 19), less the future value of charges of 1.0% p.a. (as described in section 4.(4)) to be taken from investment returns (line 35 of Form 19) and the future value of profits on surrender (line 36 of Form 19).
Actual expenses are charged to policy values and their equivalents each year. The realistic balance sheet allows for a realistic estimate of future expenses including an allowance for diseconomies of scale.
(2) Not applicable.
(3) With-profits insurance contracts with total with-profits benefit reserves of £17m
and future policy related liabilities of £0m were not modelled explicitly. To allow for these contracts the explicitly modelled liabilities were scaled up using the ratio of total regulatory reserves including these contracts to the total regulatory reserves excluding these contracts.
(4) Not applicable.
With-profits benefit reserves – Retrospective method
4. (1) (a) The methodology is unchanged from the previous year end. For all the Recurrent Single Premium that was valued on a retrospective basis 100% of the with-profits benefit reserve was calculated on an individual basis.
For Recurrent Single Premium business Policy Values have been
established as a proxy for asset shares (and hence the with-profits benefit reserve).
(b) None.
(c) Not applicable.
(2) (a) None.
(b) Not applicable.

THE EQUITABLE LIFE ASSURANCE SOCIETY REALISTIC VALUATION REPORT
81
(3) (a) The date of the previous expense investigation was 31/12/09.
(b) Expense investigations are carried out every 12 months, and updated at six
monthly intervals. The numbers in this section relate to the year to 31 December 2010.
(c) (i) There were no initial expenses identified relating to the issue of new
policies where the policyholder has a contractual right to take out a new policy. There were no other initial expenses.
(ii) A charge of 1%pa of the with-profits benefit reserve (amounting to
approximately £40m) was made in respect of maintenance expenses that relate to the servicing, claims handling and management of the business.
(iii) expenses are charged to the with-profits benefits reserve by way of an
expense charge of 1% pa deducted from all contracts. The expense charge is expected to remain at 1% pa. This is a change from the assumption at the previous valuation that the expense charge would reduce from 1% pa to 0.5% pa from 1 January 2011.
(iv) £61m of expenses were categorised as exceptional expenses. These
expenses are charged against specific provisions held on the balance sheet.
(4) A charge of 1.0% p.a. of policy values (the “charge for capital and cost of guarantees”) is taken to make some allowance for the cost of guarantees incurred and to act as a buffer against risk and adverse experience.
(5) Not applicable
(6) The claims paid during the year comprised maturity values (being the higher of
Policy Values and the guaranteed benefit) and surrender values (being Policy Values reduced by the financial adjustment which for UK policies was 5% throughout 2010). The ratio of maturity claims to the corresponding Policy Values over the year prior to the valuation date was 100% (although more would have been paid out for cases where the guarantee bit). The corresponding ratio for surrenders/transfers was about 95%. The corresponding figures for maturities and surrenders/transfers for 2009 were 100% and 95% respectively, and for 2008 were 100% and 95% respectively.
(7) The investment return earned over the period from 31 December 2009 to 31
December 2010 was 8.4% (2009: 6.0%) before tax and expenses. There has been no increase in the with-profits benefit reserve for the period from 31 December 2009 to 31 December 2010. (2009: 5.5%) for with-profits recurrent single premium pension policies.

THE EQUITABLE LIFE ASSURANCE SOCIETY REALISTIC VALUATION REPORT
82
With-profits benefits reserve – Prospective method
5. (1) For conventional with-profits business (whole of life and endowments) the key assumptions used in the prospective method of calculating the with-profits benefits reserve were:
(a) The discount rate applied to future benefits and premiums was 2.00% per
annum. This is based on the risk free rate of around 2.75%, netted down for tax and rounded down.
(b) Not applicable. (c) No assumption for future inflation of expenses is required in this
methodology.
(d) Future reversionary bonuses are assumed to be zero. The following table of final bonus factors was used to calculate the policy values at the valuation date.
Elapsed Final Bonus Rate
Term - Yrs % 0 0 1 0 2 0 3 1 4 2 5 3 6 3 7 3 8 4 9 4 10 4 11 4 12 4 13 4 14 4 15 5 16 5 17 5 18 5 19 5 20 5 21 5 22 5 23 5 24 5 25 6 26 7 27 10 28 16 29 24 30 32 31 39

THE EQUITABLE LIFE ASSURANCE SOCIETY REALISTIC VALUATION REPORT
83
32 45 33 50 34 56 35 67 36 73 37 80 38 85 39 88 40 90 > 41 90
(e) Expenses are implicitly allowed for in the premiums valued.
(f) No allowance for surrenders was made.
(2) The methods in (1) involve only one set of key assumptions.
Costs of guarantees, options and smoothing 6. (1) Not applicable
(2) The methodology and assumptions are unchanged from the previous year end.
All the with-profits insurance contracts mentioned in 3 (1) were valued using a market consistent stochastic model. All the contracts were grouped according to the following grouping rules:
Recurrent Single Premium – these contracts were grouped by outstanding term,
ratio of final bonus to policy value (in 2% bands) and by the level of guaranteed interest rate (3.5% or 0% per annum).
For with-profits UK transfer plans and miscellaneous deferred annuities, a number of contracts have a Guaranteed Minimum Pension (GMP) underpin. These contracts also have the guarantees common to all Recurrent Single Premium business described above. For these policies the average cost of buying out the revalued GMP annuity benefit at State Pension Age (SPA) was calculated based on 500 simulations using the mortality basis for non-profit annuities set out section 2.(1) above and risk-free yields for 10 year Zero Coupon Bonds at SPA. Allowance was also made for expenses in payment including diseconomies of scale between the valuation date and SPA.
Conventional Endowments – these contracts were grouped by original term and
then by outstanding term.

THE EQUITABLE LIFE ASSURANCE SOCIETY REALISTIC VALUATION REPORT
84
Numbers of benefits before and after applying grouping rules:
Product type Benefits Model Points
Conventional with-profits 6,271 668 Life RSP contracts 12,136 173 Flexible Protection Plans 3,781 147 Pensions RSP (3.5% GIR) 589,627 5,856 Pensions RSP (0% GIR) 190,299 4,495 Total 802,114 11,339
The grouping bases have been reviewed for this valuation, but no changes have been made since the 2005 year-end valuation.
In reviewing the grouping basis for each contract type, tests were done using
2009 year-end data with higher numbers of groups modelled. The value of the guarantee costs did not materially change. Therefore, no changes were made to the grouping bases.
(3) Not applicable.
(4) (a) (i) The methodology is unchanged from the previous year end.
For Recurrent Single Premium business there is a guarantee that the death benefit and the maturity benefit will not be less than the amount of the guaranteed fund plus any declared reversionary bonuses. The maturity guarantee applies where the policyholder retires on or after the Earliest Contractual Date (ECD) written into their policy. Most policies effected before 1 July 1996 have a guaranteed rate of interest of 3.5% that will be credited to the guaranteed amounts each year.
For the purpose of determining when policyholders will exit on
contractual terms, policies have been split into 2 categories -those that have not yet reached the ECD and those that have passed that date.
The assumed retirement ages in relation to the ECD are shown in the following table. The assumptions used have changed from the assumptions used in the previous valuation.

THE EQUITABLE LIFE ASSURANCE SOCIETY REALISTIC VALUATION REPORT
85
Policyholders Before ECD
(years)
Policyholders on or after
ECD (years)
OriginalECD
Group Pensions -2 9 NRA Individual ("executive") Pensions
0 4 NRA
Personal Pensions (non-DSS)
8 12 55*
Personal Pensions (DSS)
4 7 60
Retirement Annuities 5 9 60 where NRA = Normal Retirement Age
* the ECD for Personal Pensions (non-DSS) business has changed to 55 from 50 following a change in legislation.
Policyholders already past the assumed retirement age were assumed
to retire immediately. This assumption is unchanged from the previous valuation.
Managed Pension policies were assumed to mature evenly over the 3 year period beginning at the valuation date. This assumption is unchanged from the previous valuation.
For endowment assurances there is a guarantee that the amount payable on death and the maturity value will not be less than the sum assured and any declared reversionary bonuses.
For some with-profits UK transfer plans and miscellaneous deferred annuities there is a Guaranteed Minimum Pension (GMP) at State Pension Age (see section 6.(2) above). A very small set of policies has guaranteed annuity options for which a provision of £6m is held. The provision was calculated deterministically, and increased by over 50% to allow for stochastic variation. For contracts other than conventional with-profits, the extent to which policy values exceeded guaranteed values at the valuation date, banded into percentages of policy values, is shown in the following table:

THE EQUITABLE LIFE ASSURANCE SOCIETY REALISTIC VALUATION REPORT
86
% In / Out of money*
Policy values (£m)
Percentage
-100% to -50% 0 0% -49% to -30% 306 8% -29% to -20% 464 12% -19% to -15% 537 14% -14% to -10% 454 12% -9% to -5% 667 18% -4% to 0% 297 8% 1% to 5% 233 6% 6% to 10% 212 6% 11% to 15% 254 7% 16% to 20% 93 3% 21% to 30% 166 4% 31% to 50% 68 2% 51% to 100% 2 0% Total 3,753 100%
* Negative values indicate contracts currently “in the money” (i.e. where the current guaranteed fund exceeds the current policy value – this may change by maturity). The figures shown are percentages of policy value.
(a) (ii) The asset model used in the valuation is the Barrie & Hibbert
Economic Scenario Generator.
Nominal short-term interest rates are assumed to follow a LIBOR Market Model with semi-annual timesteps. The risk-free curve has been fitted to the gilt curve, and the volatility of interest rates has been calibrated to the implied volatility of swaption prices. In the Realistic Balance Sheet, liabilities are discounted at 0.02% above calibrated risk-free rates. This adjustment reflects the yields available on the risk-free assets held to back with-profits liabilities relative to yields implied by the calibrated yield curve. It also reflects the proportion of such assets. The adjustment made at the previous valuation was 0.03%.
The model for the real short-term rate is similar in structure.
Price inflation is modelled as the difference between the nominal and real short-term rate process.
Credit risk on corporate bonds is modelled using Barrie and Hibbert’s credit model, which is an extension of the Jarrow-Landow-Turnbull model.

THE EQUITABLE LIFE ASSURANCE SOCIETY REALISTIC VALUATION REPORT
87
For equities and for properties, the ratios of total return in excess of the nominal short-term interest rate is assumed to be lognormally distributed with equity volatility varying by term, and a constant volatility assumption for property.
The volatility assumptions for the major classes of asset are chosen to be consistent with option market prices where available.
Barrie & Hibbert supply recommended parameters for use at each valuation, which are analysed before acceptance and use.
For the Realistic Balance Sheet, a risk-neutral set of parameters has been calibrated to be market-consistent. Barrie & Hibbert conduct a survey of OTC (over the counter) derivative price quotes from investment banks every quarter. These prices are used to update the market consistent calibrations every quarter.
At 31 December 2010, equity volatility is assumed to be as shown below, calibrated to implied volatilities on at-the-money FTSE 100 options varying by term as follows:
Term Implied Volatility
1 year 20.6% 2 years 22.0% 3 years 23.0% 5 years 24.3% 7 years 25.1% 10 years 26.1%
Over longer terms the excess volatility tends to 27.5%. This is Barrie & Hibbert's best estimate of long term excess volatility from their research.
Property volatility is assumed to be 15%. As it is not currently possible to observe meaningful option prices (and hence derive volatilities), this is based on Barrie & Hibbert’s best estimate from their research. Property Unit Trusts (PUTs) are modelled as property. These vehicles have issued a significant amount of debt in order to finance the property development. The market value of the PUTs modelled reflects the total exposure to property prices, with the amount of the debt being offset against cash in the with-profits fund.

THE EQUITABLE LIFE ASSURANCE SOCIETY REALISTIC VALUATION REPORT
88
Swaption volatilities implied by the calibration vary by term and duration with those obtained from market data. The fitting method is least squares over the swaption volatility surface with additional weight applied to options on 20 year swaps. The swaption volatilities from the Barrie & Hibbert ESG are shown in the following table. The volatilities shown are for at-the-money swaptions.
Swap Term (years) Option
Term (years)
1 5 10 20 30
5 23.1% 17.5% 15.8% 15.2% 14.6% 10 14.4% 13.3% 13.5% 13.2% 12.6% 15 14.4% 13.6% 13.6% 13.2% 12.2% 20 14.3% 13.9% 13.9% 13.0% 11.7% 25 15.2% 14.7% 14.5% 13.0% 11.5%
Correlations
Barrie & Hibbert also specified a correlation matrix. The risk-neutral correlations between equities and bonds and equities and short-term interest rates were derived from an analysis of historical data.
Key correlations are:
Equities / Government Bonds +0.16 Equities / Short Term Interest Rates -0.15 Equities / Property +0.35 Property / Government Bonds +0.10 Property / Short Term Interest Rates -0.10
These correlations are based on excess returns over cash rather than total returns

THE EQUITABLE LIFE ASSURANCE SOCIETY REALISTIC VALUATION REPORT
(a) (iii) Asset type (all UK assets)
n 5 15 25 35 5 15 25 35 5 15 25 35r Annualised compound equivalent of the risk
free rate assumed for the period.(to two decimal places) 2.40% 4.27% 4.49% 4.35% x x x x x x x x
1 Risk-free zero coupon bond 887,963 534,304 333,474 225,095 x x x x x x x x
2 FTSE All Share Index (p=1) 88,199 231,796 330,597 407,779 215,451 395,009 511,666 604,010 588,008 777,661 910,666 1,024,775 3 FTSE All Share Index (p=0.8) 81,456 181,726 234,314 268,173 201,362 316,354 369,517 404,648 558,743 638,293 673,862 701,026 4 Property (p=1) 31,407 107,071 176,137 235,522 133,025 241,126 328,984 402,884 522,073 616,287 709,235 794,460 5 Property (p=0.8) 27,277 72,104 105,055 129,318 120,113 173,284 207,179 233,008 490,279 474,081 478,503 490,672 6 15 year risk free zero coupon bonds (p=1) 12,678 11,703 9,030 20,336 74,436 63,588 77,076 122,480 485,327 459,959 467,971 506,131 7 15 year risk free zero coupon bonds (p=0.8) 10,934 5,846 1,997 1,747 64,667 30,621 15,627 19,486 450,501 291,527 214,439 198,353 8 15 year corporate bonds (p=1) 6,475 17,604 40,081 77,524 61,922 91,807 150,408 212,626 498,933 509,356 554,052 614,373 9 15 year corporate bonds (p=0.8) 5,335 8,141 13,372 22,766 52,047 46,269 56,878 75,897 464,035 341,623 300,632 297,296
10 Portfolio of 65% FTSE All Share and 35% Property (p=1) 49,407 155,686 238,443 307,423 161,453 302,720 403,275 487,178 543,422 676,640 787,899 888,615
11 Portfolio of 65% FTSE All Share and 35% Property (p=0.8) 44,273 114,328 156,034 186,031 148,143 229,805 272,984 304,622 512,701 537,947 557,026 578,456
12 Portfolio of 65% equity and 35% 15 risk free zero coupon bonds (p=1) 38,627 119,826 188,799 248,979 143,526 254,901 340,987 416,490 524,613 620,552 712,123 803,136
13 Portfolio of 65% equity and 35% 15 risk free zero coupon bonds (p=0.8) 34,113 83,790 116,208 142,280 130,738 186,623 220,154 246,443 493,582 482,875 487,502 503,450
14 Portfolio of 40% equity, 15% property, 22.5% 15 year risk free zero coupon bonds and 22.5% 15 year corporate bonds (p=1) 18,920 70,028 123,437 174,592 106,675 187,675 259,836 327,054 503,832 554,956 625,601 704,397
15 Portfolio of 40% equity, 15% property, 22.5% 15 year risk free zero coupon bonds and 22.5% 15 year corporate bonds (p=0.8) 15,988 42,970 65,220 84,615 94,642 125,985 150,127 172,382 471,165 413,268 401,678 409,933
16 Receiver swaption 5.90% 6.50% 5.80% 4.55% 7.25% 8.20% 7.11% 5.45% 8.62% 9.68% 8.15% 6.10%
K=0.75 K=1 K=1.5
L=15 L=20 L=25

THE EQUITABLE LIFE ASSURANCE SOCIETY REALISTIC VALUATION REPORT
90
(a) (iv) The initial net yields on equities and property were taken as 3.1% and 4.3% respectively.
(a) (v) Not applicable (a) (vi) For contracts other than conventional with-profits, the distribution of
contracts that currently have guaranteed values greater or less than policy values is shown in the following table:
Guaranteed values greater than policy values Outstanding Term Policy Value (£m) Percentage 20 to 40 Years 221 8% 10 to 20 Years 1,049 39% 5 to 10 Years 930 34% 0 to 5 Years 525 19% Whole Life* 0 0% Total 2,725 100%
Guaranteed values less than policy values Outstanding Term Policy Value (£m) Percentage 20 to 40 Years 111 11% 10 to 20 Years 264 26% 5 to 10 Years 313 30% 0 to 5 Years 340 33% Whole Life* 0 0% Total 1,028 100%
* A number of Recurrent Single Premium life policies (Critical Illness and Major Medical Plans) are written as whole of life policies.
The asset model has been calibrated to UK Government Bonds using Gilt Strips for a range of terms.
The model is calibrated to implied volatilities. The asset model produces:
• An equity implied volatility of 25.8% over ten years for the total return index. For comparison, the implied volatility of a ten-year at-the-money equity capital return index put option used for calibrating the model was 26.1%.
• Property volatility over ten years of 15.2% p.a. For comparison, the implied volatility assumption used for calibrating the model was 15%.

THE EQUITABLE LIFE ASSURANCE SOCIETY REALISTIC VALUATION REPORT
91
• Zero coupon bond volatilities varying by outstanding term to redemption as follows:
Term (years)
Average expected volatility over next 20 years (%)
1 3.0 5 4.8
10 6.2 15 11.8 20 14.7 25 17.1
• Average correlations between asset classes as follows: - Total equity return and 10 year bond return: 17.3% - Total equity return and short term interest rates -14.7% - Total equity return and property return: 34.8% - Property return and 10 year bond return: 11.2% - Property return and short term interest rates -9.6%
These correlations are based on excess returns over cash rather than total returns.
Correlations with bonds of shorter and longer terms were similar to those shown above.
(a) (vii) The risk-free rate implied by the economic scenarios is compared against the calibrated risk free rate.
Checks were also made to ensure that the present value of future income, gains and losses on bonds, property and equities equal the starting market values of the assets.
(a) (viii) The results are based on 5000 simulations. Results based on batches
of 500 simulations show that increasing the number of simulations increases the accuracy of the results based on the assumptions used.
(b) Not applicable.
(c) Not applicable.
(5) (a) In the projection of assets and liabilities it has been assumed that policy
values (and hence the with-profits benefit reserve) would be changed in line with the change to the market value of assets. Any residual excess of assets over liabilities would be distributed over the lifetime of the existing business. In Form 19, any residual excess of assets over liabilities would be included under planned enhancements to with-profits benefits reserve (line 34) such that the working capital is zero.

THE EQUITABLE LIFE ASSURANCE SOCIETY REALISTIC VALUATION REPORT
92
In the projection of assets and in line with planned investment strategy it is also assumed that the fund is rebalanced at the end of each year to a year dependant target asset mix. The target asset mix for the end of 2010 comprises of 8% equities, 8% property, 69% fixed interest assets (37% gilts and 32% corporate bonds) and the remainder in cash asset types. The projection of assets in future years comprises of a phased reduction to 0% property by the end of 2012 and a phased reduction to 0% equity by the end of 2016. The target asset mix for the end of 2016 comprises of 73% fixed interest assets (41% gilts and 32% corporate bonds) with the remainder in cash asset types. In previous valuations it has been assumed that the asset mix would remain constant from year to year. At the previous valuation the target asset mix was 11% equities, 9% property, 75% fixed interest assets (35% gilts and 40% corporate bonds) and the remainder in cash type assets.
(b) Future proportion of assets backing the with-profits benefit reserve which
consists of equities: 31/12/2010 31/12/2015 31/12/2020
(i) Base scenario 3.8% 1% 0% (ii) Yields increase by 17.5% 4.1% 0% 0% (iii) Yields reduce by 17.5% 3.8% 0% 0%
A further 1.8% of assets (allowing for gearing) were invested in Property
Unit Trusts and a further 8.3% of assets were directly invested in property. As described in section 10(b)(i), the assumed asset mix to which the fund is
rebalanced each year is changed in stress scenarios. The initial investment mix described in section 6(5)(a) is replaced by the initial asset mix immediately following application of the stress in the stress scenario being considered. The phased reduction of equity and property assets would still apply. The resulting percentages, as shown in the table above, are maintained over time through rebalancing the portfolio as required.
Future declared reversionary bonus rates are assumed to be zero throughout the projection period (unchanged from previous year end).
(6) Policyholders are assumed to take benefits on non-contractual terms at the
following rates. Some of the assumptions have changed from those used at the previous valuation:

THE EQUITABLE LIFE ASSURANCE SOCIETY REALISTIC VALUATION REPORT
93
Product Surrender rate Initial Rate Ultimate Rate
Current
Valuation Previous Valuation
Current Valuation
Previous Valuation
Group AVC surrender 4.0% 4.5% 1.5% 1.5% Group Money
Purchase surrender 4.0% 4.5% 1.5% 1.5%
Individual ("executive") Pensions surrender 2.5% 4.0% 1.5% 1.5%
Personal Pensions (non-DSS) surrender 3.0% 5.5% 1.5% 1.5%
Personal Pensions (DSS) surrender 3.0% 5.5% 1.5% 1.5%
Retirement Annuities surrender 3.0% 5.5% 1.5% 1.5%
Life Business surrender 5.0% 5.0% 1.5% 1.5%
Single premium bonds automatic withdrawals 5.0% 5.0% 5.0% 5.0%
The surrender assumptions do not vary by policy year. They vary by duration from the valuation date. The assumed rate in the year following the valuation is the "Initial Rate" in the table above. Thereafter, the surrender rate is assumed to reduce by 0.5% each year until it reaches the "Ultimate Rate" in the table above. The paid-up assumptions were that no further contributions would be made to policies, except where contractually required to maintain the policy. For Recurrent Single Premium life policies it was assumed that, with the exception of the surrenders described above, all policyholders would take their benefits at their 10th anniversary dates (or, where policies have been extended, the next date at which any benefit could be taken on contractual terms). For Conventional with-profits policies it was assumed that, with the exception of the surrenders described above, all policyholders would take benefits on the date their policies mature.
(7) It was assumed that policyholders would make no further contributions to policies, except where contractually required to maintain the policy. Surrender rates are assumed not to vary by economic scenario. It was assumed that there would be no changes to retirement behaviour in low interest rate scenarios.

THE EQUITABLE LIFE ASSURANCE SOCIETY REALISTIC VALUATION REPORT
94
A sensitivity analysis has been carried out to illustrate the potential impact on planned enhancements to with-profits benefits reserve of GIRs on RSP business under certain scenarios modelled on a stochastic basis, where the results are aggregated and the average liability is calculated. If investment returns fall below a given level, it is possible that policyholders may defer their retirement. If policyholders defer their retirement by up to 5 years (from that previously assumed), while the interest rate in the scenario is below 2.5%, then the planned enhancements would reduce by £40m. If the level of interest rates at which behaviour changes is 3.5% and the same period of deferment is assumed, the amount is £70m. If the deferral were for a period of up to 10 years, the amounts are £50m at 2.5% and £100m at 3.5% respectively. The Society has purchased a series of receiver swaptions with a range of terms. The purpose of these swaptions is to provide additional capital when interest rates on similar fixed-interest securities are anticipated to fall. These swaptions are designed to partially mitigate any increase in liabilities for RSP policies with a non–zero GIR if policyholders defer their retirement plans. The total market value of the swaptions at 31 December 2010 was £35m. A fall in interest rates of 1.0% at all terms would increase the value of the swaptions by £36m and a similar increase would decrease the value by £18m.
Financing Costs
7. Not applicable.
Other long-term insurance liabilities 8. There are several provisions in respect of various review programmes and to cover
other risks. These liabilities also include allowance for short-term exceptional expenses mainly in connection with these review programmes and litigation costs. The total provision of £286.6m is composed of the following elements:
£m Regular expenses 180.8 Exceptional expenses 103.8 Other miscellaneous liabilities including mis-selling 2.0 Total other long-term insurance liabilities 286.6
An expense provision of £180.8m has been established against potential higher future costs arising as the fund runs off. The aim is to be able to maintain a stable percentage point charge to with-profits policies for regular expenses. The charge will remain at 1% p.a. This is a change from the assumption at the previous valuation that the expense charge would reduce from 1% pa to 0.5% pa from 1 January 2011 This change in assumptions reflects the decision to bring administration services back in-house rather than proceed with the planned change in TPA provider.

THE EQUITABLE LIFE ASSURANCE SOCIETY REALISTIC VALUATION REPORT
95
Realistic current liabilities 9. These liabilities include tax and social security creditors, other creditors arising out of
direct insurance operations and a liability relating to the staff pension scheme (£83 m). The total realistic current liabilities of £173m are the same as the regulatory valuation current liabilities.
Risk Capital Margin 10. (a) The Risk Capital Margin at 31 December 2010 was zero. This is a consequence
of reducing the planned enhancements to policyholders as described in section 10(b)(i) below. The stress scenarios described below were tested:
(i) The scenarios tested were rises and falls in the values of equities and
property of 20% and 12.5% respectively. These percentages were applied to both UK and non-UK assets. The scenario where the market values of equities and property fell was the most onerous scenario.
(ii) The scenarios tested were a rise and fall of 17.5% of the long term gilt yield
(being 69.81 basis points) for yields at all durations. The scenario where yields rise was the most onerous scenario prior and after to the impact of management actions.
(iii) (a) The credit risk scenario resulted in an average increase in the spread
of about 72 basis points in respect of corporate bonds in the with-profits fund. The resultant fall in market values was approximately 6.3% of the total value of those bonds.
(b) Not applicable
(c) The credit risk event was not applied to the portfolio of business that is reassured with HBOS plc (a subsidiary of Lloyds Banking Group).
(d) Not applicable (e) Not applicable
(iv) The overall increase in the realistic value of the liabilities as a result of applying the persistency stress was 1.0%.
(v) Not applicable
(b) (i) In the stress scenarios it has been assumed that when asset values fall at the start of the projection there will be an immediate reduction in policy values equal to the same percentage reduction. When asset values increase due to a fall in yields no further change in the policy values was assumed.
In the stress scenarios where yields rise it has been assumed that the charge
for capital and cost of guarantees is increased from 1% to 1.25%. In the stress scenarios where yields fall it has been assumed that the charge for capital and cost of guarantees is increased from 1% to 1.5%.

THE EQUITABLE LIFE ASSURANCE SOCIETY REALISTIC VALUATION REPORT
96
In the stress scenarios the value of the swaptions changes. In the stress scenarios where yields rise the value of assets was reduced by the £14m fall in the value of the swaptions. In the stress scenarios where yields fall the swaptions increased in value by £23m. However, the value of assets was not adjusted as it was assumed that the increase would be exactly offset by the impact of RSP policyholders deferring their retirement plans.
In the stress scenarios it is assumed that the target asset mix to which the
fund is rebalanced at the end of each year, as described in section 6(5)(a), is changed with the fund instead being rebalanced each year to the actual asset mix immediately following application of the stresses.
(ii) The reduction to policy values, changes to asset mix as described above and
increase in charges described in section 10(b)(i) above reduces the RCM. The amount of the RCM calculated before and after these changes would be as follows:
Stress scenario Before After
------------------ -------- -------- Yields rise £160m £50m Yields fall £190m £108m As described in section 6(5)(a), any residual excess of assets over liabilities would be included under planned enhancements to with-profits benefits reserve such that the Working Capital remains zero. Therefore the Risk Capital Margin is zero.
(iii) Changing the asset mix in the stress scenarios, as described above, results
in the equity backing ratios as shown in the table below.
31/12/2010 31/12/2015 31/12/2020
Yields increase by 17.5% without management action
4.1%
0%
0%
Yields reduce by 17.5% without management action
3.8%
0%
0%
Yields increase by 17.5% with management action
4.1%
0%
0%
Yields reduce by 17.5% with management action
3.8% 0% 0%
There are assumed to be no future declared reversionary bonuses.
(iv) In the most onerous stress scenario the value of past and future cost of guarantees is in excess of the value of past and future charges i.e. the requirements of INSPRU 1.3.188R would be met.
(c) (i) No assets are required to cover the risk capital margin.
(ii) Not applicable.

THE EQUITABLE LIFE ASSURANCE SOCIETY REALISTIC VALUATION REPORT
97
11. Tax
Tax is payable on an “I-E” basis for life business. The tax payable is deducted from future increases to policy values (or their equivalents).
12. Derivatives
The Society holds a series of swaptions to partially mitigate the impact of RSP pensions policyholders deferring their retirement plans during periods of low interest rates. Margining is used to provide appropriate collateral. The total market value of the swaptions at 31 December 2010 was £35m (£34m at 31 December 2009). In December 2009 the Society purchased a US Dollar forward exchange contract to reduce its exposure to exchange rate movements. During 2010, the Society bought a long US Dollar forward exchange contract to adjust its exposure to exchange rate movements following the sale of some US Dollar denominated assets. At 31 December 2010 the nominal amount of the contracts net of the long position was US$136m (US$130 at 31 December 2009). At December 2010, a number of long Gilt futures contracts with a nominal value of £26m were held. This was a temporary position while rebalancing the fund’s fixed interest holdings was carried out. The contracts were sold in January 2011.
13. Analysis of change in working capital The movement in the Working Capital from £0m at the previous valuation to £0m has been analysed as follows:
Item Effect (£m)
Add back opening zeroisation impact 673 Investment return on the opening working capital 52 Mismatch profits and losses on assets backing the future policy related liabilities -147 Economic assumption changes -1 Other valuation assumption changes 83 Investment variance 229 Demographic and expense variance -211 Change in provisions and current liabilities 0 Modelling changes 0 Other 15 Closing zeroisation impact (693) Total change 0
14. Optional Disclosure
Not applicable

98
RETURNS UNDER INSURANCE COMPANIES LEGISLATION THE EQUITABLE LIFE ASSURANCE SOCIETY FINANCIAL YEAR END 31 DECEMBER 2010 ADDITIONAL INFORMATION AS REQUIRED BY IPRU (INS) 9.29 (a) All derivative transactions may only be entered into following prior approval by the
Society’s Executive Investment Committee, which operates within guidelines set by the Board. In all cases, use of derivative instruments is restricted to the purpose of managing exposure and reducing risk. No derivative contracts were entered into on a speculative basis.
(b) There are no specific guidelines for the use of contracts not reasonably likely to be
exercised. However, the Society's Board only allows the use of derivatives for the purpose of efficient portfolio management or to reduce risk.
(c) The fund holds receiver swaptions, at a range of terms, to partially hedge guaranteed
investment return risk within the fund. Each position pays out if 10-year swap rates are below 4.5% at the time of exercise. The strike of 4.5% is at a high enough level that the Society considers itself not to have entered into contracts not reasonably likely to be exercised. As at 31 December 2010, 100% of the swaption holdings by value are 'in the money'.
(d) The Society did not, at any time during the financial year, hold a derivative contract
which required a significant provision to be made for it under INSPRU 3.2.17R or (where appropriate) did not fall within the definition of a permitted derivative contract.
(e) The Society did not grant any rights under derivative contracts during the óÉ~r.

99
RETURNS UNDER INSURANCE COMPANIES LEGISLATION THE EQUITABLE LIFE ASSURANCE SOCIETY FINANCIAL YEAR END 31 DECEMBER 2010 ADDITIONAL INFORMATION AS REQUIRED BY IPRU (INS) 9.30 The Society has no shareholder controllers because it is a mutual company.

100
RETURNS UNDER INSURANCE COMPANIES LEGISLATION THE EQUITABLE LIFE ASSURANCE SOCIETY FINANCIAL YEAR END 31 DECEMBER 2010 CERTIFICATE REQUIRED BY IPRU(INS) 9.34 AND APPENDIX 9.6 We certify that: 1) the return has been properly prepared in accordance with the requirements in
IPRU(INS), GENPRU and INSPRU; 2) we are satisfied that:
a) throughout the financial year ended 31 December 2010 and other than as specified below, the Society has complied in all material respects with the requirements in SYSC and PRIN as well as the provisions of IPRU(INS), PRU, GENPRU and INSPRU (as applicable); and
The Society is dependent on the delivery of administration and investment services by HBOS group of companies within the Lloyds Banking Group (“HBOS”), BlackRock Investment Management (UK) Limited ("BlackRock") (from 1 October 2010), Insight Investment Management (Global) Limited ("Insight") (until 30 September 2010) and Invista Real Estate Investment Management ("Invista"). The Society is reliant on the systems and controls operated by HBOS, BlackRock, Insight and Invista and, in making the above statement in respect of SYSC, the directors have relied upon information received from and appropriate disclosures having been made by those organisations to the Society.
b) other than as specified in (a) it is reasonable to believe that the
Society has continued so to comply subsequently, and will continue so to comply in future;
3) in our opinion, premiums for contracts entered into during the financial year
ended 31 December 2010 and the resulting income earned are sufficient, under reasonable actuarial methods and assumptions, and taking into account the other financial resources of the Society that are available for the purpose, to enable the Society to meet its obligations in respect of those contracts and, in particular, to establish adequate mathematical reserves;
4) the sum of the mathematical reserves and the deposits received from
reinsurers as shown in Form 14 constitute proper provision as at 31 December 2010 for the long-term insurance liabilities (including all liabilities arising from deposit back arrangements, but excluding other liabilities which had fallen due before 31 December 2010) including any increase in those liabilities arising from a distribution of surplus as a result of an actuarial investigation as at that date into the financial condition of the long-term insurance business;
5) the with-profits fund has been managed in accordance with the Principles and
Practices of Financial Management, as established, maintained and recorded under COBS 20.3; and

101
6) we have, in preparing the return, taken and paid due regard to:
a) advice from the actuary appointed by the Society to perform the actuarial function in accordance with SUP 4.3.13R; and
b) advice from the actuary appointed by the Society to perform the
with-profits actuary function in accordance with SUP 4.3.16AR. Ian Brimecome, Chairman ________________________________________________________________ Chris Wiscarson, Chief Executive ______________________________________________________________ Tim Bateman, Finance Director ________________________________________________________________ 30 March 2011

102
RETURNS UNDER INSURANCE COMPANIES LEGISLATION AUDITORS' REPORT: REGULATORY RETURN FOR A LIFE INSURANCE COMPANY FINANCIAL YEAR END 31 DECEMBER 2010 REPORT TO THE DIRECTORS PURSUANT TO RULE 9.35 OF THE INTERIM PRUDENTIAL SOURCEBOOK FOR INSURERS We have audited the following documents prepared by the insurer pursuant to the Accounts and Statements Rules set out in Part I and Part IV of Chapter 9 to IPRU(INS) the Interim Prudential Sourcebook for Insurers, GENPRU the General Prudential Sourcebook and INSPRU the Prudential Sourcebook for Insurers (‘the Rules’) made by the Financial Services Authority under section 138 of the Financial Services and Markets Act 2000:
• Forms 2, 3, 13, 14, 17 to 19, 40 to 43, 48, 49, 56, 58 and 60, (including the supplementary notes on pages 54 to 59) (‘the Forms’);
• the statement required by IPRU(INS) rule 9.29 on page 98 (‘the Statement’);
• the valuation report required by IPRU(INS) rule 9.31(a) on pages 60 to 77 (‘the
valuation report’); and
• the statements, analysis and reports required by IPRU(INS) rule 9.31(b) on pages 78 to 97 (“the realistic valuation report”)
We are not required to audit and do not express an opinion on:
• Forms 46 to 47, 50 to 54, 57, 59A and 59B (including the supplementary notes on pages 54 to 59);.
• the statements required by IPRU(INS) rules 9.30 and 9.36 on pages 99 and 105; and
• the certificate required by IPRU(INS) rule 9.34(1) on pages 100 to 101 (‘the
Certificate’). Respective responsibilities of the insurer and its auditors The Society is responsible for the preparation of an annual return (including the Forms, the Statement, the valuation report, and the realistic valuation report), the forms and statements not examined by us and the certificate under the provisions of the Rules. The requirements of the Rules have been modified by a direction issued under section 148 of the Financial Services and Markets Act 2000 on 21 December 2007. Under IPRU(INS) rule 9.11 the Forms, the Statement, the valuation report, the realistic valuation report, the forms and statements not examined by us and the certificate are required to be prepared in the manner specified by the Rules and to state fairly the information provided on the basis required by the Rules. The methods and assumptions determined by the Society and used to perform the actuarial investigation as set out in the valuation report and the realistic valuation report, prepared in accordance with IPRU(INS) rule 9.31 are required to reflect appropriately the requirements of INSPRU 1.2 and 1.3.

103
It is our responsibility to form an independent opinion as to whether the Forms, the Statement, the valuation report and the realistic valuation report meet these requirements, and to report our opinion to you. We also report to you if, in our opinion:
• adequate accounting records have not been kept, or returns adequate for our audit have not been received from branches not visited by us; or
• the Forms, the Statement and the valuation report are not in agreement with the accounting records and returns; or
• we have not received all the information we require for our audit. This report has been prepared for the directors of the insurer to comply with their obligations under IPRU(INS) rule 9.35 and for no other purpose. We do not, in providing this report, accept or assume responsibility for any other purpose save where expressly agreed by our prior consent in writing. Basis of opinion We conducted our work in accordance with Practice Note 20 'The audit of insurers in the United Kingdom (Revised)' issued by the Auditing Practices Board. Our work included examination, on a test basis, of evidence relevant to the amounts and disclosures in the Forms, the Statement, the valuation report and the realistic valuation report. The evidence included that previously obtained by us relating to the audit of the financial statements of the Society for the financial year. It also included an assessment of the significant estimates and judgements made by the Society in the preparation of the Forms, the Statement, the valuation report and the realistic valuation report. We planned and performed our work so as to obtain all the information and explanations which we considered necessary in order to provide us with sufficient evidence to give reasonable assurance that the Forms, the statement, the valuation report and the realistic valuation report are free from material misstatement, whether caused by fraud or other irregularity or error and comply with IPRU(INS) rule 9.11. In accordance with IPRU(INS) rule 9.35 (1A), to the extent that any document, Form, Statement, analysis or report to be examined under IPRU(INS) rule 9.35(1) contains amounts or information abstracted from the actuarial investigation performed pursuant to IPRU(INS) rule 9.4, we have obtained and paid due regard to advice from a suitably qualified actuary who is independent of the Society.

104
Opinion In our opinion: (i) the Forms, the Statement, the valuation report and the realistic valuation report fairly state the information provided on the basis required by the Rules as modified and have been properly prepared in accordance with the provisions of those Rules; and (ii) the methods and assumptions determined by the Society and used to perform the actuarial investigation as set out in the valuation report appropriately reflect the requirements of INSPRU 1.2 and 1.3. PricewaterhouseCoopers LLP Registered Auditor 30 March 2011

105
RETURNS UNDER INSURANCE COMPANIES LEGISLATION THE EQUITABLE LIFE ASSURANCE SOCIETY FINANCIAL YEAR END 31 DECEMBER 2010 STATEMENT OF INFORMATION REQUIRED BY IPRU (INS) 9.36 R Merry was the With-Profits Actuary for the Society throughout the year. The particulars to be given in compliance with IPRU (INS) 9.36 are :- a) Shareholding
R Merry had no interest in any shares or debentures issued by the Society.
b) Pecuniary Interest
R Merry holds unit-linked benefits in the AVC Scheme of the Equitable Pension Fund and Life Assurance Scheme under which premiums of £2,400 were paid during 2010.
c) Aggregate Remuneration
R Merry's services as With-Profits Actuary were supplied under a contract of administration between the Society and a subsidiary of HBOS plc, which is part of Lloyds Banking Group. R Merry was employed by companies in the Lloyds Banking Group during the period in question. R Merry was not a Director of the Society.
d) Other Pecuniary Benefits
R Merry received no other pecuniary benefit from the Society. The Society requested R Merry to furnish the particulars specified in IPRU (INS) 9.36. The above particulars were furnished by R Merry and they agree with the Society's records.