Embed Size (px)
Citation preview

The epidemiology of overweight and obesity
Katherine M. Flegal, Ph.D.
Centers for Disease Control and PreventionNational Center for Health Statistics
Center for Weight and HealthUniversity of California, Berkeley

Outline
• Trends in overweight and obesity in the US
• Definitions of overweight
• US population estimates of the prevalence of overweight categories and of comorbidities
• Possible benefits and risks of weight change in mildly overweight people with comorbid conditions
National Health and NutritionExamination Surveys
NHES I 1960-62 18-79 yearsNHES II 1963-65 6-11 yearsNHES III 1966-70 12-17 yearsNHANES I 1971-75 1-74 yearsNHANES II 1976-80 6 mo.-74 yearsHHANES 1982-84 6 mo.-74 yearsNHANES III 1988-94 2 mo. +NHANES 1999- All ages
Survey Dates Ages
OP96025

05
10152025303540
Men 20-74 y Women 20-74 y
1960-62 1971-74 1976-801988-94 1999-2000
Prevalence (%)
Age-adjusted trends in obesity (BMI >=30): United States
SOURCE: CDC/NCHS;NHES I, NHANES I, NHANES II, NHANES III, NHANES 99-2000

Age-adjusted Trends in Overweight
01020304050607080
Men 20-74 y Women 20-74 y
1960-62 1971-74 1976-80
1988-94 1999-2000Prevalence (%)
(BMI >= 25): United States
SOURCE: CDC/NCHS;NHES I, NHANES I, NHANES II, NHANES III, NHANES 99-2000

Definitions of overweight and obesity
• Based on Body mass index (BMI) =
weight (kg)/height (m)2
• Overweight: BMI 25-29.9 OR BMI >=25
• Obesity: BMI >= 30
• Healthy weight: BMI 18.5-<25

Evolution of definitions of overweight
Up to early 1980s, not systematized, wide international variations
Weight-for-height tables (e.g. life insurance tables)
Skinfold measurements and prediction equations
Wide variety of weight-height indexes (e.g. Broca index, ponderal index), used with a variety of metric systems

Evolution of definitions of overweight
During the 1980s, consensus gradually settled on body mass index (wt/ht squared), also called Quetelet index, as the index of choice for epidemiologic use.
NIH consensus conference in 1985 recommended BMI
Cutoff values still not standardized

Evolution of definitions of overweight
1959 Metropolitan Life weight for height tables had ranges of desirable weights. Overweight sometimes defined as weight 120% or more of the midpoint of the medium frame weight range for the person’s height.
NIH consensus conference: BMI of 27.8 for men, 27.3 for women closely corresponded to the Met Life definition.
These values are the 85th percentile values for men and women ages 20-29 y from NHANES II

BMI cut-points of 25 (overweight) and 30 (obesity) recommended by expert committees
1995 World Health Organization. Physical status: the use and interpretation of anthropometry. Report of a WHO Expert Committee
1998 Clinical Guidelines on the Identification, Evaluation, and Treatment of Overweight and Obesity in Adults. NHLBI

1995 WHO expert committee report
“For adults, the Expert Committee proposed classification of BMI with the cut-off points 25, 30 and 40…This classification is based principally on the association between BMI and mortality.”
“The method used to establish BMI cut-off points has been largely arbitrary. In essence, it has been based on visual inspection of the relationship between BMI and mortality: the cut-off of 30 is based on the point of flexion of the curve.”

Relation between mortality and BMI
Data from Lew EA: Mortality and weight: insured lives and the American Cancer Society studies. Ann Intern Med
103:1024-1029, 1985.

1998 NHLBI Clinical Guidelines
“In this report, overweight is defined as a BMI of 25.0 to 29.9 kg/m2 and obesity as a BMI of 30 kg/m2. The rationale behind these definitions is based on epidemiological data that show increases in mortality with BMIs above 25 kg/m2. The increase in mortality, however, tends to be modest until a BMI of 30 kg/m2 is reached.”
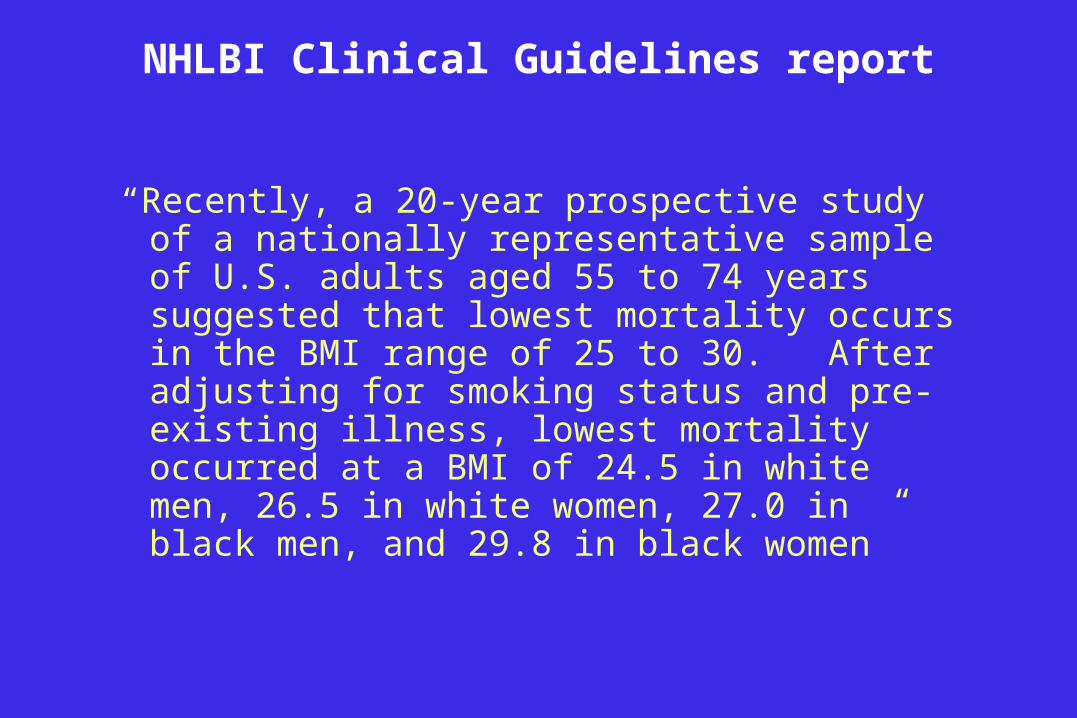
NHLBI Clinical Guidelines report
“Recently, a 20-year prospective study of a nationally representative sample of U.S. adults aged 55 to 74 years suggested that lowest mortality occurs in the BMI range of 25 to 30. After adjusting for smoking status and pre-existing illness, lowest mortality occurred at a BMI of 24.5 in white men, 26.5 in white women, 27.0 in black men, and 29.8 in black women”

Age-adjusted Trends in Overweight
0
10
20
30
40
50
Men 20-74 y Women 20-74 y
1960-62 1971-74 1976-80
1988-94 1999-2000Prevalence (%)
(BMI 25-29.9): United States
SOURCE: CDC/NCHS;NHES I, NHANES I, NHANES II, NHANES III, NHANES 1999-2000

Number (millions) in BMI categories by gender
13.916
21.8
14.112.8
15.7
0
5
10
15
20
25
23-<25 25-<27 27-<30
Male Female
SOURCE: NHANES 1999-2002

Number (millions) by gender, age
and BMI category:
0
5
10
Men Women Men Women
20-39 y 40-59 y 60-79 y 80+ y
SOURCE: NHANES 1999-2002, provisional estimates
BMI 25-<27 BMI 27-<30

Comorbidities
•Hypertension
•Hyperlipidemia
•Diabetes mellitus/glucose intolerance
•Cardiovascular disease
•Sleep apnea
•Other obesity-related conditions

Prevalence of hypertension by age and BMI group-men
0
10
20
30
40
50
60
70
80
Prevalence (%)
SOURCE: NHANES 1999-2002, provisional estimates
23-<25 25-<27 27-<30 30-<35<23
20-39 y
40-59 y
60-79 y
80+ y

Prevalence of hypertension by age and BMI group-women
0102030405060708090
100
Prevalence (%)
SOURCE: NHANES 1999-2002, provisional estimates
23-<25 25-<27 27-<30 30-<35<23
20-39 y
40-59 y
60-79 y
80+ y
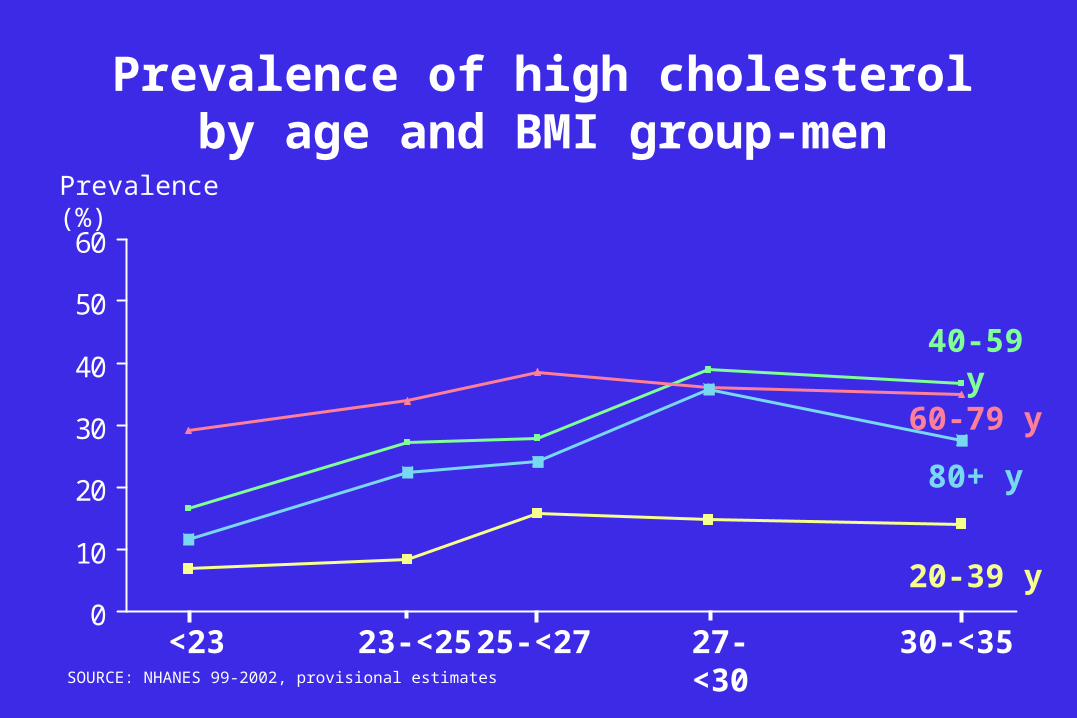
Prevalence of high cholesterol by age and BMI group-men
0
10
20
30
40
50
60
Prevalence (%)
SOURCE: NHANES 99-2002, provisional estimates
23-<25 25-<27<23 27-<30 30-<35
20-39 y
80+ y
40-59 y
60-79 y

Prevalence of high cholesterol by age and BMI group-women
0
10
20
30
40
50
60
Prevalence (%)
SOURCE: NHANES 99-2002, provisional estimates
23-<25 25-<27<23 27-<30 30-<35
80+ y
60-79 y
40-59 y
20-39 y
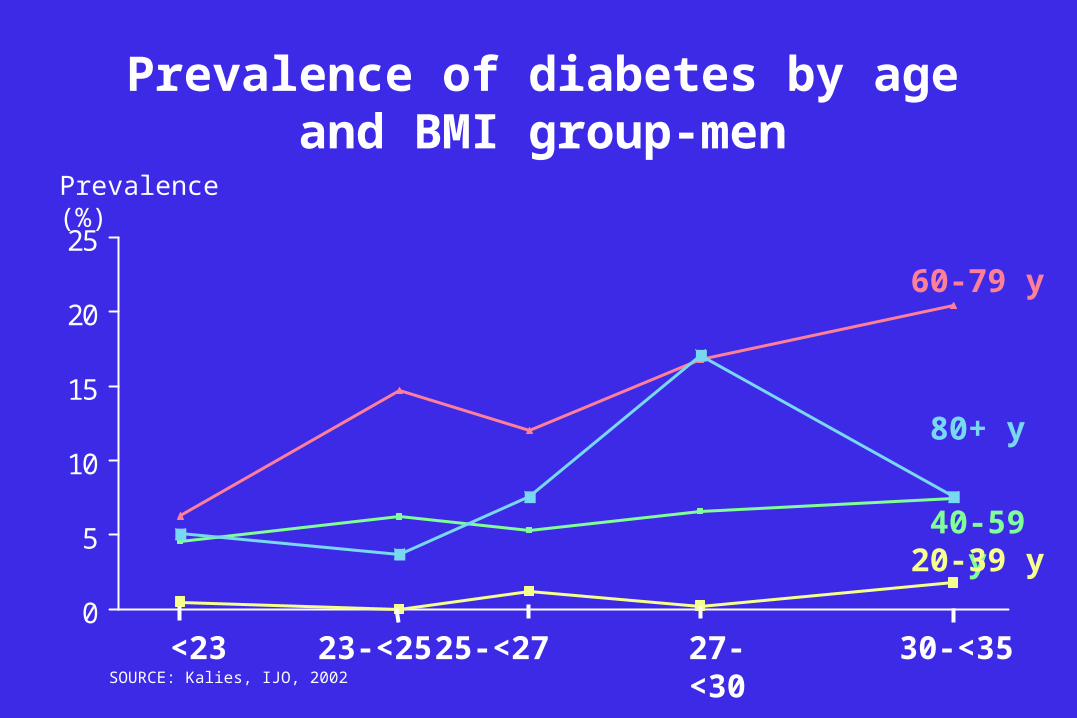
Prevalence of diabetes by age and BMI group-men
0
5
10
15
20
25
Prevalence (%)
SOURCE: Kalies, IJO, 2002
23-<25 25-<27
80+ y
60-79 y
40-59 y20-39 y
<23 27-<30 30-<35

Prevalence of diabetes by age and BMI group-women
0
5
10
15
20
25
Prevalence (%)
SOURCE: NHANES 99-02, provisional estimates
23-<25 25-<27
80+ y
60-79 y
40-59 y
20-39 y
<23 27-<30 30-<35

Prevalence of any comorbidity by age and BMI group- men
0102030405060708090
100
Prevalence (%)
SOURCE: NHANES 1999-2000, provisional estimates<23
23-<25
25-<27
27-<30 30-<35
80+ y
60-79 y
40-59 y
20-39 y

Prevalence of any comorbidity by age and BMI group- women
0102030405060708090
100
Prevalence (%)
SOURCE: NHANES 1999-2000, provisional estimates<23 23-<25 25-<27 27-<30 30-<35
80+ y
40-59 y
60-79 y
20-39 y

Number (millions) with 2+ comorbidities by BMI categories
0.9 1
2
2.9 2.9
1.7 1.8 1.9
2.9
3.8
0
1
2
3
4
<23 23-<25 25-<27 27-<30 30-<35
Male Female
SOURCE: NHANES 1999-2002, provisional estimates
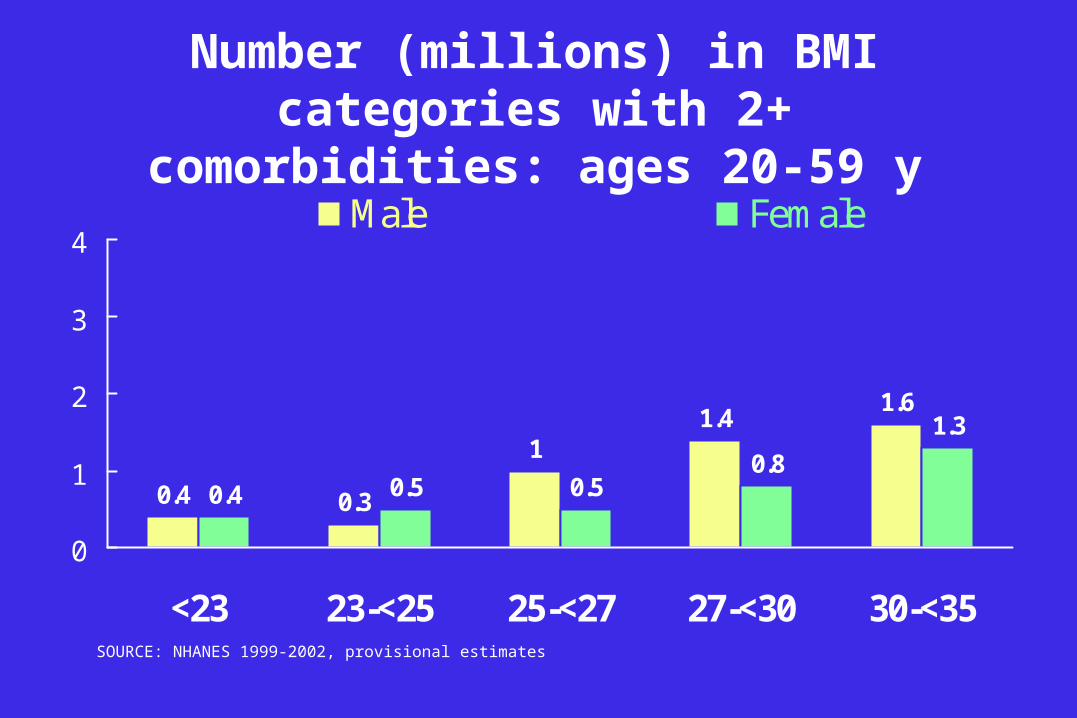
Number (millions) in BMI categories with 2+ comorbidities: ages 20-59 y
0.4 0.3
11.4
1.6
0.4 0.5 0.50.8
1.3
0
1
2
3
4
<23 23-<25 25-<27 27-<30 30-<35
Male Female
SOURCE: NHANES 1999-2002, provisional estimates
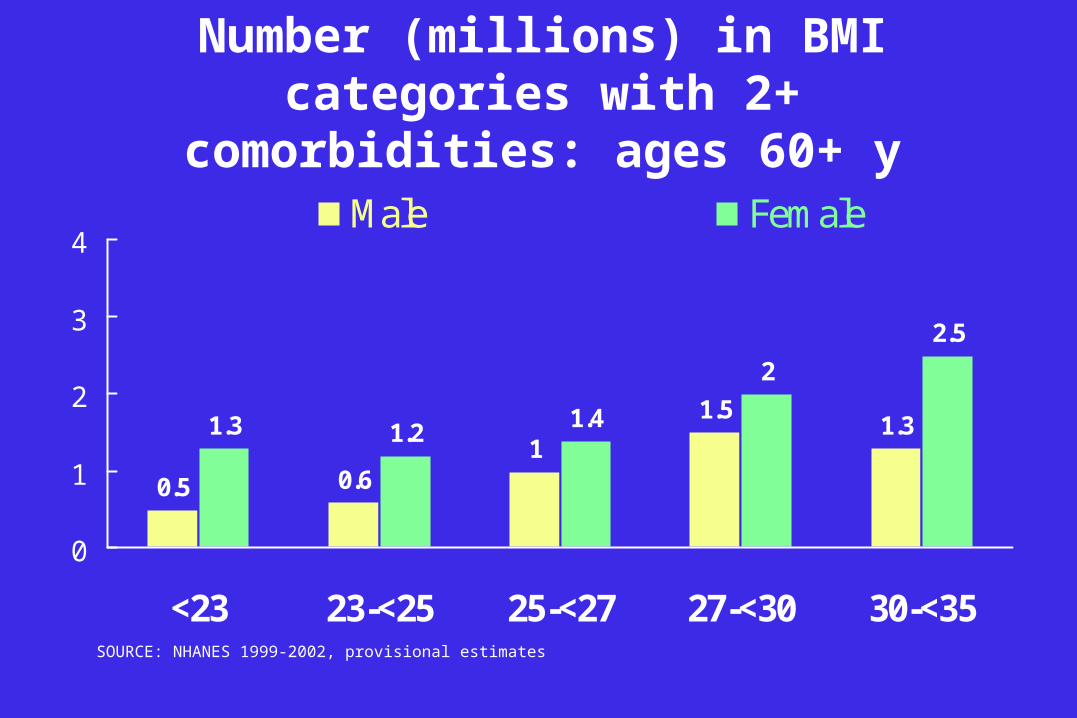
Number (millions) in BMI categories with 2+ comorbidities: ages 60+ y
0.5 0.61
1.51.31.3 1.2
1.4
2
2.5
0
1
2
3
4
<23 23-<25 25-<27 27-<30 30-<35
Male Female
SOURCE: NHANES 1999-2002, provisional estimates

Number (millions) with 1+, 2+ or 3 comorbidities
0
5
10
15
20
1+ 2+ 3+ 1+ 2+ 3+
20-39 40-59 60-79 80+
SOURCE: NHANES 1999-2002, provisional estimates
0.90.3
12.1
18.2
3.85.7
BMI 25-<27 BMI 27-<29

Weight loss for people with BMI 25-<27
• Little information is available concerning the health benefits of weight loss in this BMI range. Most studies of weight loss include few if any participants with BMI 25-27 and may explicitly exclude them
• Many studies of the benefits of weight loss in the control of conditions such as hypertension or hyperlipidemias include few if any participants with BMI 25-27 and may explicitly exclude them

NHLBI Clinical Guidelines for Obesity
All overweight and obese adults with a BMI of 25 are considered at risk for developing associated morbidities or diseases such as hypertension, high blood cholesterol, type 2 diabetes, coronary heart disease, and other diseases. … Treatment of overweight [BMI 25-29.9] is recommended only when patients have two or more risk factors or a high waist circumference.

Weight loss for people with BMI 25-<27
• Many studies have demonstrated that short-term weight loss has beneficial effects on risk factors such as high blood pressure and cholesterol.
• Many studies suggest a monotonic relation between body weight and risk factors with no threshold. This would suggest that weight loss might improve blood pressure and other risk factors almost regardless of baseline weight.
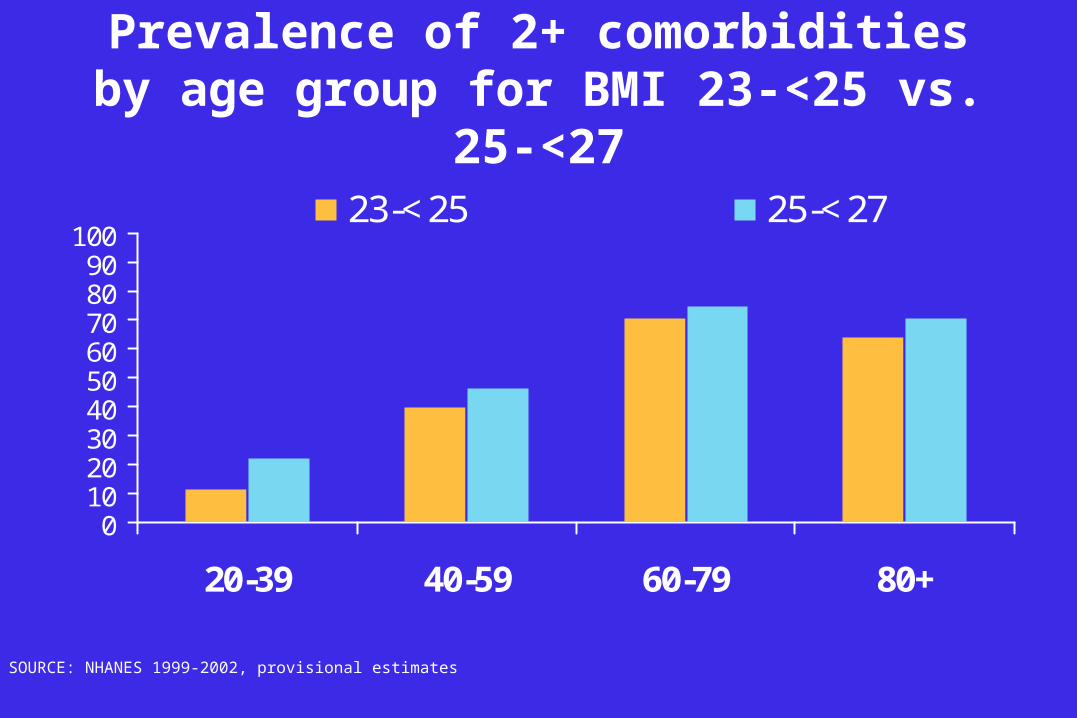
Prevalence of 2+ comorbidities by age group for BMI 23-<25 vs. 25-<27
0102030405060708090
100
20-39 40-59 60-79 80+
23-<25 25-<27
SOURCE: NHANES 1999-2002, provisional estimates

Weight loss for people with BMI 25-<27: therapeutic role
•Therapeutic lifestyle changes, including weight loss, physical activity and healthful eating habits are an important part of the treatment of diabetes and cardiovascular risk factors. Drug treatment is also often used in the management of these conditions.
•The relative contribution of weight loss to treatment is not well-established.

Some concerns: Increased not decreased mortality with weight loss?
• Many studies have demonstrated that short-term weight loss has beneficial effects on risk factors such as high blood pressure and cholesterol. However, observational studies have raised concerns about negative effects of weight loss ... Some of these studies suggest increased, not decreased, mortality;.
• In 1997, a workshop was convened by NIH and CDC ... participants concluded that only a randomized clinical trial of intentional weight loss could provide needed guidance on the risks and benefits of weight loss to inform rational clinical and public health policy.
Look AHEAD, www.niddk.nih.gov/patient/SHOW/lookahead.htm

Some concerns: Adverse effects of weight loss on bone health in the elderly?
“Even voluntary weight loss in overweight women with a BMI of 25.9 kg/m2 (median) or greater increased the risk of hip fracture (multivariate hazard ratio 2.48, 95% CI 1.33–4.62). CONCLUSION: Older women who experience weight loss in later years have increased rates of hip-bone loss and a two-fold greater risk of subsequent hip fracture, irrespective of current weight or intention to lose weight. These findings indicate that even voluntary weight loss in overweight elderly women increases hip fracture risk.”
Ensrud et al J Am Geriatr Soc 51:1740–1747, 2003.

Summary-1
• Definitions of overweight have varied considerably, and epidemiologically useful consensus definitions do not necessarily reflect physiological differences.
• The prevalence of selected comorbidities rises with BMI without clear inflection points.
• There are ~ 12 million adults with BMI 25-27 and at least 1 selected comorbidity and ~ 4 million with at least two

Summary-2
• Half or more of adults with BMI 25-27 and selected comorbidities are ages 60 y and above
• Weight loss, lifestyle changes and drugs are all used to manage these and other comorbidities
• Weight loss has been associated with some possible adverse consequences in observational studies
• The benefits and risks of weight loss for people with BMI 25-<27 have not been clearly established.