Embed Size (px)
Citation preview
Symposium From the chemistry of responsi bile environmentalism to environmentally responsible chemistry
The Environmental Chemistry of Trace Atmospheric Gases William C. Trogler University of California, San Diego, La Jolla, CA 92093-0358
Concentrations and Lifetimes of Trace Atmospheric Gases
Excluding water vapor, about 99.93% of the Earth's atmos- phere consists of nitrogen, oxygen, and argon. Human activi- ties, called anthropogenic, do not s d l c a n t l y perturb the con- centrations of these species. The situation is different for trace components ofthe atmosphere. Anthropogenic emissions have noticeably increased theconcentration of several trace gases, which were set a t a steadv state bv natural formation-dest~c- tion cycles. Air samples ;an be obtained from bubbles trapped in glacial ice from the Antarctica or Greenland. Yearly bands are visible in cores drilled out of the ice, because of the annual surface thawing and refreezing. This provides an atmospheric time record that spans over 150,000 years. Within the past 100 years, the average concentration of methane in the atmos- phere has nearly doubled, and that of carbon dioxide has in- creased by about 20% (1). New compounds, such as chlo- rofluorocarbons (CFCs), did not exist 100 years ago but now make up about 3 ppbv (part per billion by volume) of the at- mosphere. For many trace gases, concentrations have in- creased a t unprecedented rates. The effect of such increases on the Earth's climate and ecosystem is an area of active scientific study and political concern.
In studying issues related to the environment, i t is im- portant to separate scientific fact from hypothesis. The chemical composition and changes in the concentrations of atmospheric gases can be measured with high precision. I t is difficult, however, to predict quantitatively how these
changes will alter the climate and ecosystem. In the popn- lar press, environmental debates often intermingle scien- tific facts with hypotheses. This clouds objectivity Facts can also be presented in different ways. For example, one person might argue that a species present a t only 1 ppbv is of little significance. On the other hand, another individual might emphasize that a liter of air you breathe a t sea level contains 27 trillion molecules of a 1 ppbv component. Some key facts about important trace atmospheric constituents appear in Table 1.
Concentrations for atmospheric species are tabulated on a per volume basis in a dimensionless unit, which is called the mixing ratio. For long-lived atmospheric components, the mixine ratio remains constant. even thoueh the ores- - - sure decreases with increasing altitude in the troposphere. The troposphere is the region 0-15 km above the Earth's surface; i t contains about 85% of the atmosphere's mass. Above the troposphere the mixing ratios of gases change, depending on photo-decomposition eff~ciencies, a s the flux of high energy ultraviolet radiation increases. The average atmospheric lifetime (or residence time) given in Table 1 reflects the average time spent in the atmosphere by a n individual molecule. I t can be calculated from the atmos- pheric concentration of a compound divided by its esti- mated rate of supply Atmospheric lifetimes are extremely important because they represent how long i t takes to re- store a perturbed atmospheric concentration.
Volume 72 Number 11 November 1995 973
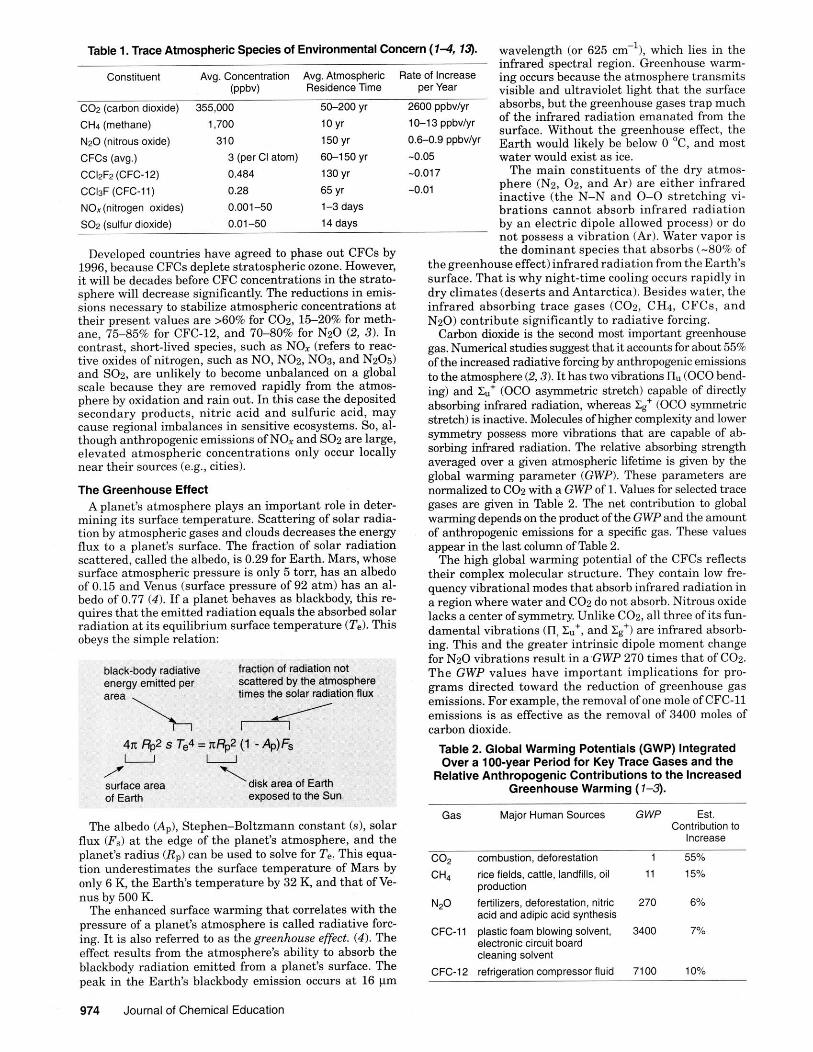
Table 1. Trace Atmospheric Species of Environmental Concern ( 1 4 , 13.
Constituent Avg. Concentration Avg. Atmospheric Rate of increase ( P P ~ V ) Residence Time per Year
COz (carbon dioxide) 355.000 5&2W yr 2600 ppbv/yr
CH4 (methane) 1.700 10 yr 1&13 ppbvlyr N 2 0 (nitrous oxide) 310 150 yr 0.6-0.9 ppbvlyr
CFCs (avg.) 3 (per Ci atom) 6C-150 yr -0.05 CCi2Fz (CFC-12) 0.484 130 yr -0.017 CC13F (CFC-11) 0.28 65 yr -0.01 NO,(nitrogen oxides) 0.001-50 1-3 days SO2 (sulfur dioxide) 0.01-50 14 days
Developed countries have agreed to phase out CFCs by 1996, because CFCs deplete stratospheric ozone. However, i t will be decades before CFC concentrations in the strato- sphere will decrease significantly, The reductions in emis- sions necessary to stabilize atmospheric concentrations a t their present values are >60% for COz, 15-20% for meth- ane, 1 5 8 5 % for CFC-12, and 70-80% for NzO (2, 3). In contrast, short-lived species, such a s NO, (refers to reac- tive oxides of nitrogen, such a s NO, NOz, NOa, and NzOd and SOz, are unlikely to become unbalanced on a global scale because they are removed rapidly from the atmos- phere by oxidation and rain out. In this case the deposited secondary products, nitric acid and sulfuric acid, may cause regional imbalances in sensitive ecosystems. So, al- though anthropogenic emissions of NO, and SOz are large, elevated atmospheric concentrations only occur locally near their sources (e.g., cities).
The Greenhouse Effect A p1ant.t'~ atmosphere plays an important role in deter-
minine its sutiare temperature. Scattermg of solar mdia- - tiou by atmospheric gaHes and clouds decreases the energy flux to a planet's surface. The fraction of solar radiation scattered, called the albedo, is 0.29 for Earth. Mars, whose surface atmospheric pressure is only 5 torr, has a n albedo of 0.15 and Venus (surface pressure of 92 atm) has an al- bedo of 0.77 (4). If a planet behaves a s blackbody, this re- quires thar the emitted ritdiatlon equals the absorbed solar r:tdia~ion at its equilihr~um surface temperatun, rT,]. Thls obeys the simple relation:
black-body radiative fraction of radiation not energy emitted per scattered by the atmosphere area . times the solar radiation flux
4rr Rp2 s Te4 = aRP2 (1 -Ap)Fs u u
f surface area \disk area of Earth of Earth exposed to the Sun
The albedo (Ap), Stephen-Boltzmann constant (s), solar flux (Fa) a t the edge of the la net's atmosphere, and the planet's radius ( R ~ ) can be used to solve for T,, This equa- tion underestimates the surface t em~era tu re of Mars by onlv 6 K, the Earth's temperature by 32 K, and that of vL- nus by 5'00 K.
The enhanced surface warmina that correlates with the - pressure of a planet's atmosphere is called radiative forc- ing. I t is also referred to a s thegreenhouse effect. (4). The effect results from the atmosphere's ability to absorb the blackbody radiation emitted from a planet's surface. The peak in the Earth's blackbody emission occurs a t 16 Fm
wavelength (or 625 em-'), which lies in the infrared spectral region. Greenhouse warm- ing occurs because the atmosphere transmits visible and ultraviolet light that the surface absorbs, but the greenhouse gases trap much of the infrared radiation emanated from the surface. Without the greenhouse effect, the Earth would likely be below 0 OC, and most water would exist as ice.
The main constituents of the dry atmos- phere (Nz, Oz, and Ar) are either infrared inactive (the N-N and 0-0 stretching vi- brations cannot absorb infrared radiation by a n electric dipole allowed process) or do not Dossess a vibration (Ar). Water vapor is the hominant species that absorbs (-8b% of
thegreenhouseeffect)infrared radiation from the Earth's surface. That i s why night-time cooling occurs rapidly in dry climates (deserts and Antarctica). Besides water, the infrared absorbing trace gases (COz, CH4, CFCs, a n d NzO) contribute significantly to radiative forcing.
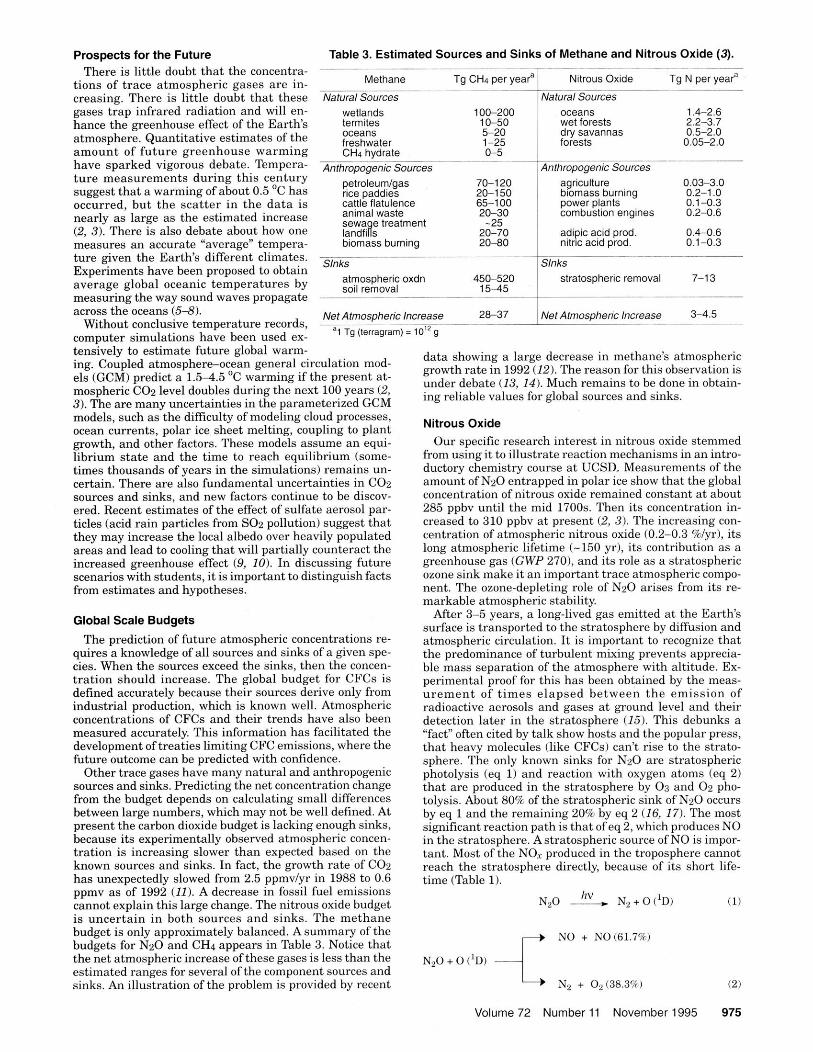
Carbon dioxide is the sewnd most important greenhouse gas. Numerical studies suggest that it accounts for about 55% of the increased radiative forcing by anthropogenic emissions to the atmosphere (2,3). It has two vibrations nu (OCO bend- ing) and &+ (OCO asymmetric stretch) capable of directly absorbing infrared radiatiou, whereas Zg+ (OCO symmetric stretch) is inactive. Molecules of higher complexity and lower symmetry possess more vibrations that are capable of ab- sorbing infrared radiation. The relative absorbing strength averaged over a given atmospheric lifetime is given by the global warming parameter (GWP). These parameters are normalized to COz with a GWP of 1. Values for selected trace gases are given in Table 2. The net wntribution to global warming depends on the product of the GWP and the amount of anthropogenic emissions for a specific gas. These values appear in the last column of Table 2.
The high global warming potential of the CFCs reflects their complex molecular structure. They contain low fre- quency vibrational modes that absorb infrared radiation in a region where water and COz do not absorb. Nitrous oxide lacks a center of symmetry. Unlike COz, all three of its fun- damental vibrations (n, &+, and Xgt) are infrared absorb- ing. This and the greater intrinsic dipole moment change for N20 vibrations result in a.GWP 270 times that of COz. The GWP values have important implications for pro- grams directed toward the reduction of greenhouse gas emissions. For example, the removal of one mole of CFC-11 emissions is as effective a s the removal of 3400 moles of carbon dioxide.
Table 2. Global Warming Potentials (GWP) Integrated Over a 100-year Period for Key Trace Gases and the
Relative Anthropogenic Contributions to the Increased Greenhouse Warming (1-3).
Gas Major Human Sources GWP Est. Contribution to
Increase
Con combustion, deforestation 1 55% CH, rice fields, cattle, landfills, oil 11 15%
production N 2 0 fertilizers, deforestation, nitric 270 6%
acid and adipic acid synthesis CFC-11 plastic foam blowing solvent, 3400 7%
electronic circuit board cleaning solvent
CFC-12 refrigeration compressor fluid 7100 10%
974 Journal of Chemical Education
Prospects for the Future There is little douht that the concentra-
tions of trace atmospheric gases are in- creasing. There is little douht that these gases trap infrared radiation and will en- hance the greenhouse effect of the Earth's atmosphere. Quantitative estimates of the amount of future greenhouse warming have sparked vigorous debate. Tempera- ture measurements during this century suggest that a warming of about 0.5 OC has occurred, but the scatter in the data is nearly as large as the estimated increase (2, 3). There is also debate about how one measures a n accurate "average" tempera- ture given the Earth's different climates. Experiments have been proposed to obtain average global oceanic temperatures by measuring the way sound waves propagate across the oceans (5-8).
Without conclusive temperature records, computer simulations have been used ex- tensively to estimate future global warm-
Table 3. Estimated Sources and Sinks of Methane and Nitrous Oxide (3). -~ ~~~~ - -- -
Methane T4 CH4 per y e T ~ i t r & s Oxide Tq N per yea? I -. - -- --
Natural Sources I Natural Sources
oceans freshwater CHn hvdrate -- - - - -. --
Anthrooooen~c Sources / Anthrooosen~c Sources
atmospheric oxdn 450-520 stratospheric removal 7-13 so11 removal 1545 1 - - - - -
. - petroleum/gas 70-120 rlce paddies 20-150 cattle flatulence 65-100 animal waste 20-30 sewa e treatment -25 landfifs 20-70 biomass burning 20-80
Net Atmospheric Increase - 28-37 1 Net Atmospheric Increase 3-4.5 .- -
"1 Tg (termgram) = 10'' g
. - agriculture 0.03-3.0 blomass burning 0.2-1 .O power plants 0.1-0.3 combustion engines 0.2-0.6
adipic acid prod. 0.4-0.6 nitrlc acid prod. 0.1-0.3
iug. coupled atmosphere-ocean general circulation mod- els (GCM) predict a 1.5-4.5 OC warming if the present at- mospheric COz level doubles during the next 100 years (2, 3). The are many uncertainties in the parameterized GCM models, such a s the diff~culty of modeling cloud processes, ocean currents, polar ice sheet melting, coupling to plant growth, and other factors. These models assume a n equi- librium state and the time to reach equilibrium (some- times thousands of years in the simulations) remains un- certain. There are also fundamental uncertainties in COz sources and sinks, and new factors continue to he discov- ered. Recent estimates of the effect of sulfate aerosol par- ticles (acid rain particles from SOz pollution) suggest that they may increase the local albedo over heavily populated areas and lead to cooling that will partially counteract the increased greenhouse effect (9, 10). In discussing future scenarios with students, i t is important to distinguish facts from estimates and hypotheses.
Global Scale Budgets
The prediction of future atmospheric concentrations re- quires a knowledge of all sources and sinks of a given spe- cies. When the sources exceed the sinks, then the concen- tration should increase. The global budget for CFCs is defined accurately because their sources derive only from industrial production, which is known well. Atmospheric concentrations of CFCs and their trends have also been measured accurately. This information has facilitated the development of treaties limiting CFC emissions, where the future outcome can be predicted with confidence.
Other trace eases have manv natural and anthropogenic sources and sinks. Predicting [he net concrntrdtior;rl;Age from the hudmt d e ~ e n d s on calculating m a l l dtfltrencrs between largenumbers, which may notbe well defined. At present the carbon dioxide budget is lacking enough sinks, because its experimentally observed atmospheric concen- tration is increasing slower than expected based on the known sources and sinks. In fact, the growth rate'of COz has unexpectedly slowed from 2.5 ppmvlyr in 1988 to 0.6 ppmv a s of 1992 (11). A decrease in fossil fuel emissions cannot explain this large change. The nitrous oxide budget i s uncertain in both sources and sinks. The methane budget is only approximately balanced. A summary of the budgets for NzO and CH4 appears in Tahle 3. Notice that the net atmospheric increase of these gases is less than the estimated ranges for several of the component sources and sinks. An illustration of the problem is provided by recent
data shwmng a large decrease in methane's atmosphsric growth rate in 1992 t 12 I. 'l'hv reason for thts obser\mion is &der debate (13, 14). Much remains to be done in obtain- ing reliable values for global sources and sinks.
Nitrous Oxide Our specific research interest in nitrous oxide stemmed
from using i t to illustrate reaction mechanisms in a n intro- ductory chemistry course a t UCSD. Measurements of the amount of NzO entrapped in polar ice show that the global concentration of nitrous oxide remained constant a t about 285 ppbv until the mid 1700s. Then its concentration in- creased to 310 pphv a t present (2, 3). The increasing con- centration of atmospheric nitrous oxide (0.2-0.3 %/yr), its long atmo;iphcrtc lifetime 1- 150 yr,, its conrrihution ds :I
~ ~ t v m h ~ , u i e gas tG117'270 ,and its rda as a it~;itosphcric ozone sink make i t a n important trace atmospheric compo- nent. The ozone-depleting role of NzO arises from its re- markable atmosnheric stahilitv.
After 3-5 yea& a long-liveri gas emitted a t the Earth's surface is t rans~orted to the s t ra tos~here bv diffusion and atmospheric circulation. I t i s important to recognize that the predominance of turbulent mixing prevents apprecia- ble mass separation of the atmosphere with altitude. Ex- perimental proof for this has been obtained by the meas- u rement of t imes elapsed between t h e emission of radioactive aerosols and gases a t ground level and their detection later in the stratosphere (15). This debunks a "fact" often cited by talk show hosts and the popular press, that heavy molecules (like CFCs) can't rise to the strato- sphere. The only known sinks for NzO are stratospheric photolysis (eq 1) and reaction with oxygen atoms (eq 2) that are produced in the stratosphere by 0 3 and Oz pho- tolysis. About 80% of the stratospheric sink of NzO occurs by eq 1 and the remaining 20% by eq 2 (16, 17). The most significant reaction path is that of eq 2, which produces NO in the stratosphere. Astratospheric source of NO is impor- tant. Most of the NO, produced in the troposphere cannot reach the stratosphere directly, because of its short life- time (Tahle 1).
Volume 72 Number 11 November 1995 975
Nitric oxide is a free radical that catalyzes stratospheric ozone destruction bv a radical chain mechanism (eqs 3-51 analogous to one of the cycles by which chlorine radicals (produced by photolysis of CFCs in the stratosphere) de- plete ozone (1,2, 4, 15, 18-20),
0 3 + N O + 0 2 + N 0 2 0 3 + C 1 + 0 2 + C 1 0 ( 3 )
N O , + O + N 0 + 0 2 C 1 0 + 0 + C 1 + 0 2 (4)
net 03+ 0 + 202 O 3 + O - t 2 O 2 ( 5 )
Natural sources of NzO primarily arise as byproducts of biological nitrification (oxidation of NH4') and denitrifica- tion (reduction of N03-) (19, 21-23). Since about 1982, the sequence of eqs 3-5 was thought to be the main sink (-60%) for removal of 0 8 in the lower stratosphere (4).
Recent in situ spectroscopic measurements suggest a lesser role for NO in the lower stratosphere (-20% of the ozone sink), and a more important role for the peroxy radi- cal HOO (24). The reduced role of NO is due in part to the mitigating effect that NO and NOz have on the ozone de- pleting potential of HOO and C10. Nitric oxide intercepts the peroxy radical by eq 6.
H02 + NO -t OH + NO, (6 )
This short circuits its ozone depleting mechanism (eqs 7-91,
O , + O H + H 0 2 + 0 2 (7)
H 0 2 + 0 3 + O H + 2 0 2 (8)
net 20, + 30, (9)
In the halogen loss cycles for ozone (e.g., eqs 3-51, NOz can intercept the key intermediate C10 to form stable ClONOz (chlorine nitrate). This removes chlorine from the radical forms necessary to cause ozone loss. The coupling of NO and NOz to the ozone loss mechanisms for oxygen and chlorine radicals can even lead to an inverse depend- ence of ozone loss on the NOx concentration a t low concen- trations. Such behavior contributes to formation of the Antarctic ozone hole. Here the conversion of ClONOz and NO2 to HN03 is catalyzed by the surfaces of polar strato- spheric cloud aerosol particles. This enhances the contri- bution of stratos~heric chlorine to ozone depletion, as i t htwmes conven&l into reactive forms, whilethe nitrogen oxides are conver~ed into Icis reactive HNO3.
Identification of an Industrial Source of Nitrous Oxide The estimated excess NzO emissions of -1 Tg Nlyr in the
Northern Hemisphere suggested possible industrial sources, since more industrialized cities lie in the North- ern Hemisphere (23). This was puzzling because nitrous oxide's uses as a dental anesthetic (laughing gas) and as a propellant in canned whipping cream were too small to be significant. In 1990, we became aware that NzO is pro- duced as a byproduct from the manufacture of adipic acid. Large amounts of adipic acid are synthesized yearly, pri- marily as a component of 6,6-nylon. The imbalance be- tween the estimated atmospheric emissions of NzO in the two hemispheres, and its role as a greenhouse gas and ozone depletion agent, led us to study the stoichiometry of the overall reaction (25). The oxidation of cyclohexanoWcy- clohexanone mixtures with 50% nitric acid charged with VOs-, Cu2+ catalysts evolved about 1 mole of NzO gas for each mole of adipic acid isolated. The gas was collected quantitatively by Toepler pumping, analyzed by infrared spectroscopy and mass spectrometry, and separated from NO and COz byproducts. The yearly production of adipic acid requires that 0.4-0.6 Tg Nlyr are produced by this process. Since nitrous oxide is a relatively nontoxic natural atmospheric component, there were no restrictions on its
emissions. We estimated that most NzO produced by manufacturing adipic acid escaped to the atmosphere. These emissions can account for about half the difference seen in NzO emission rates from the Northern and South- ern Hemispheres. Publication of the first large industrial source of NzO received media coverage. Within two months worldwide nylon producers voluntarily committed to a five-year phase out of NzO emissions. The EPAC'Green Ny- lon" program will meet 10% of the target US. greenhouse gas emission reduction goals by placing controls on adipic acid manufacturing facilities. I t is much more effective to control NzO emissions (GWP = 270) than COz (GWP = 1).
Summary The atmospheric chemistry of trace gases illustrates fun-
damental principles in kinetics, bonding, reaction mecha- nisms, photochemistry, spectroscopy, and geochemical cy- cling. Selected topics are useful in introductory chemistry, analytical chemistry, physical chemistry, and spectroscopy courses. The rapidly developing aspect of the science can be used to show how new experiments may contradict ear- lier ones. The corresponding evolution of hypotheses pro- vides insight into how the scientific process works. Per- haps most important, this approach relates fundamental chemical facts and concepts to environmental issues of widespread interest. Students readily participate in class debates about what should be done (if anything) about the increasing atmospheric concentrations of trace gases.
Acknowledgment I thank the undergraduate students in introductory
chemistry at UCSD, whose lack pf enthusiasm for kinetics motivated me to make the topic more appealing with an atmospheric approach. The National Science Foundation is acknowledged for supporting research in my group re- lated to inorganic atmospheric problems.
Literature Cited 1. Graedel, T E.; Crutzen. P JAtmospharic Change: on Earth System Perspecliue; W.
H. Freeman: New Ymk. 1993. 2. Houghton, J. T.; Jenkins, G. J.: Ephraums. J. J.; Intergovernmental Panel on Cli-
mate Chanee. Climore Chows: The IPCC Scicnlv7c Assessment; Cambridze Ur& uersity: Cambridge, England. 1990.
3. Houghton, J. T.; Callander B. A,: Varney. S. K Climate Change 1992: The Supple- mentory Repon lo the IPCC Scientific&sessmni: Cambridge University: Csm- bridge England. 1992.
4. Wayne. R. P. Chemistry o,fAlmosphens, 2nd ed.: Oxford University: Oxford. 1991. 5. Munk. W. H.;Farbes.A. M. G. J. Phya. Oc~nnogmphy 1989.19.1765-1778. 6. Munk, W. H.; Watkins. J. Marine Techno1 Soc. J. 1991.25.52-51. 7. Munk. W. Sciences-New York 1993.33.21-26. 8. Baggeroer, A; Munk, W Physics Today 1992.45(9). 22. 9. Charlson, R. J . ; Wigley. T M. L. Sei. Amer 1994,270(8), 48.
10. Charlaon,R. J.; Schwsrtz. S. E.: Hales, J. M.; Cese, R. D.;Coakley, J . A.;Han~en, J. E.: Hafmann. D. J. Science 1992,255,423428.
11. Conway.T. J.;Tans, P. P: Waterrnan,L. S.;Thoning,K W: Kitri8.D. R.;Maserie,K A.:Zhang.N. J. Oaaphys. Rrs. Aim. 1994.99.22831-22855.
12. D1ugokeneky.E. J.;Masarie,KA.;Lang,P. M.:Tans.PP.;Steele, L. P.;NisM, E. G. &whys ROS. Ld l . 1994,21,2447-2448.
n H O . . ~ K R ~ a r n s e . R. C. ~ e o d v s ROS. LOU 1994.21.2445-2446. ~~~ , . . . . 14. Dlugakencky, E. J.: Sfee1e.L. P : Lang, P. M.; Maasrie. K A,: JGeophya. Res. Afm.
1994.99, 17021-17043. 15. Buteher, S. 3.: Charban. R. J.; Orians. G. H.: Wolfe, G., V. Global Biograchemied
Cydes. Acodemie Press: London, 1992. 16. Cantrell, C. A : Shetter, R. E.: Calvert. J. G. J. Ceophys. Res. Atm. 1884.99. 3739-
976 Journal of Chemical Education
![High-resolution spectroscopy and analysis of the ν3/2ν4 …gases among the longest-lived atmospheric trace gases. CF 4 has an estimated lifetime of more than 50,000 years [1,2] and,](https://img.pdfslide.us/doc/110x75/60db54abbb84795ab9586c66/high-resolution-spectroscopy-and-analysis-of-the-324-gases-among-the-longest-lived.jpg)