Embed Size (px)
Citation preview

THE ENTREPRENEURIAL ECOSYSTEM OF SOUTH AFRICA: A STRATEGY FOR GLOBAL LEADERSHIP 2017This report was commiss ioned and funded by SAB Foundat ion and Al lan Gray Orbis Foundat ion, in partnership with the The Global Entrepreneurship and Development Inst i tute, The Global Entrepreneurship Network South Afr ica and SEA Afr ica.
The entrepreneurial ecosystem of South Africa: A strategy for global leadershipSouth Africa is an entrepreneurial leader in sub-Saharan Africa. The country has made
significant progress to overcome structural factors and produce some of the most innovative
and successful enterprises on the continent. The country provides the institutional support
necessary for high-growth businesses to emerge and thrive, while government policies work to
close historical gaps. With the addition of targeted, coordinated policies to address remaining
bottlenecks, the country is poised to achieve greater growth through entrepreneurship.
Contents
Introduction ....................................................................................................................................... 4
1. Literature review.................................................................................................................................... 8
1.1 Structural context of the South African economy ................................................................................ 8
1.2 Context of entrepreneurship data for africa ......................................................................................... 9
2. TEA vs GEI: contrasting pictures of the entrepreneurial ecosystems ................................................... 10
3. Analysis of the entrepreneurial ecosystem of South Africa ................................................................. 14
3.1 The building blocks of the ecosystem ............................................................................................... 14
3.2 A unique position: South Africa’s leadership in aspirations and examples from the ecosystem ...... 16
3.2 South Africa in the context of sub-Saharan Africa ............................................................................ 16
3.3 Strengths of the South African entrepreneurial ecosystem ............................................................. 17
3.4 South Africa in the global entrepreneurial ecosystem ..................................................................... 19
4. Causal map of the South African entrepreneurship ecosystem ........................................................... 22
4.1 Ecosystem bottlenecks ..................................................................................................................... 22
Figure 14: Survey validation with GEI data: ........................................................................................... 25
4.3 Structural causes of bottlenecks ....................................................................................................... 24
4.4 Impact of bottlenecks ....................................................................................................................... 26
5. Policy recommendations ....................................................................................................................... 28
5.1 Improving startup skills .................................................................................................................... 28
5.2 Banking and finance for all ............................................................................................................... 30
5.3 Technology absorption ..................................................................................................................... 30
6. Conclusion .............................................................................................................................................. 32
Appendix A: GEDI methodology .............................................................................................................. 33
4 5
To develop a strategy for action in the entrepreneurship ecosystem of South Africa (EESA), this analysis begins with an in-depth examination of the ecosystem data for South Africa. Next, we examine new survey data from key ecosystem actors from both the private and public sectors to identify insights from within the ecosystem on what issues are present in the ecosystem, and the causes and effects of ecosystem bottlenecks. These insights are synthesised in tandem with supplementary data to produce detailed feedback on the health of 14 different ecosystem components. Based on the results of this analysis, we present a prioritised strategy for action that assists investors, stakeholders, and policy actors in directing their resources towards
generating the greatest impact for entrepreneurs in the country.
Entrepreneurship is a key driver of economic growth. South Africa is in a unique position in sub-Saharan Africa, with stronger supporting institutions than much of the rest of the continent and a resulting strong entrepreneurial ecosystem foundation. Since the 1990s, the South African government has been actively engaged in incorporating more of the South African population into the formal economy, whether into wage employment or entrepreneurship. To further strengthen the potential of entrepreneurship and innovation, South Africa does not necessarily need more entrepreneurs, it needs better, innovative
and growth-oriented entrepreneurs that are motivated to grow and prosper within the South African environment and through engagement with the global economy. To facilitate this goal, South Africa needs a national entrepreneurship policy framework based on the strengths and weaknesses and causal factors that define the entrepreneurship ecosystem. This report will offer that framework.
Entrepreneurship ecosystems are complex: they comprise numerous different stakeholders and are shaped by laws, regulations and formal and informal institutions. A national entrepreneurship ecosystem policy needs to look at the ecosystem as a whole, and it needs to understand the ecosystem dynamic.
Introduction
6 7
Our recommendations based on the GEDI model and GEDI policy tool are:
(1) continue to build on the work already underway towards eliminating the dual economy by increasing startup skills, improving education and training for all
South Africans. Remove most regulations that hinder the starting of a business;
(2) improve the financing of SME and entrepreneurs by engaging in bank reform, mobile banking and crowd funding for all South Africans.
(3) build global brands and further integrate South Africa into the digital revolution by making digital access available to all.
1. The Global Entrepreneurship and Development Institute (The GEDI Institute) is a research organization that advances knowledge on links
between entrepreneurship, economic development and prosperity. The institute was founded by world-leading entrepreneurship scholars from
the LSE, George Mason University, University of Pécs and Imperial College London. The main contribution of The GEDI Institute is the Global
Entrepreneurship Index, a breakthrough advance in measuring the quality and dynamics of entrepreneurship ecosystems at a national, regional
and local level. The GEI methodology, has been validated in rigorous academic peer reviews and has been widely reported in media, including in
The Economist, The Wall Street Journal, Financial Times and Forbes. The methodology has also been endorsed by the European Commission and
has been used to inform the allocation of EU Structural and Cohesion Funds. The theoretical approach of The GEDI Institute has also influenced
entrepreneurship policy thinking in trans-national organizations such as United Nations Conference on Trade and Development.
2. The Global Entrepreneurship Index sources data from Transparency International (Corruption Perception Index), UNESCO (tertiary education
enrollment, GERD), World Economic Forum (domestic market size, business sophistication, technology absorption and technology transfer
capability, staff training, market dominance), International Telecommunication Union (Internet usage), The Heritage Foundation and World Bank
(Economic freedom), United Nations (Urbanization index), KOF Swiss Economic Institute (Economic globalization), Coface (Business climate risk),
Groh et al (2012) (Depth of capital market), and the Global Entrepreneurship Monitor (individual-level data). A detailed description of the GEI
methodology is provided as an appendix.
3. (Economic globalization), Coface (Business climate risk), Groh et al (2012) (Depth of capital market), and the Global Entrepreneurship Monitor
(individual-level data). A detailed description of the GEI methodology is provided as an appendix.
Proposed central themes for the survey include the following questions:
1. Name the top five factors that are holding back the entrepreneurship ecosystem in South Africa.
2. In your opinion, what is the cause of each of these bottleneck factors?
3. What would keep entrepreneurs from leaving South Africa?
4. What would bring back entrepreneurs that have already left the ecosystem?
1. What research has already been done on the South African entrepreneurship ecosystem? We take a macro view of research on the ecosystem, examining factors that influence the health of the entrepreneurial ecosystem in South Africa – primarily the interaction of individual entrepreneurial motivation and institutional support in sub-Saharan Africa and the rest of the world.
2. What analytical tools are available for understanding the South African entrepreneurship ecosystem? In this section we examine various analytical approaches that have been taken to understand entrepreneurship on a global level, along with the results they produce and the implications for the South African ecosystem.
3. What path is South Africa on in its entrepreneurship development? Why? In this section we take a deep dive into the South African entrepreneurship ecosystem, with an analysis of South Africa’s GEI performance at the variable level over the past ten years. This analysis produces a list of key bottlenecks to entrepreneurship development based directly on the story in the GEI data.
4. Are there opportunities to use leverage points to produce more benefit with less effort? Using survey data we formulate a causal map of the South African entrepreneurial ecosystem using input we gather from a survey of stakeholders3 – entrepreneurs and policy makers from within the ecosystem. This map will link elements of the system and reveal significant bottlenecks and causal chains. Using this causal map, we’ll identify leverage points where addressing a particular bottleneck may affect multiple links in the chain of entrepreneurship development
5. How can South Africa prioritise actions that produce the largest impact? This concluding section identifies policy recommendations based on evidence from research for strategies to improve the entrepreneurial ecosystem in South Africa. We synthesise the previous sections to produce a cohesive strategy that addresses key bottlenecks in the South African ecosystem with concrete policy actions.
Only by taking an ecosystem-wide perspective and by identifying strengths and bottlenecks at the eco-system level, it is possible to design policy actions that systematically address and correct ecosystem bottlenecks, thereby paving the way for a higher-quality entrepreneurial dynamic in the economy.
To address this challenge, this report applies the GEDI1 methodology, now
in its 9th year of refinement, to analyse the South African entrepreneurship ecosystem and pinpoint policies that target bottlenecks and build upon recent efforts and progress. This methodology draws on extensive data from the Global Entrepreneurship Index2 to provide an overall, internationally benchmarked look into the South African ecosystem and identify bottlenecks that hold back its performance. The report then draws
on stakeholder input via a survey of key ecosystem actors to add insight that is not captured in codified data. Combining “hard” data and “soft” experience-based insights, we then identify priority actions to address the bottlenecks identified through this combined data. The research report has five parts, each centered on a question:
8 9
1.1 Structural context of the South African economy
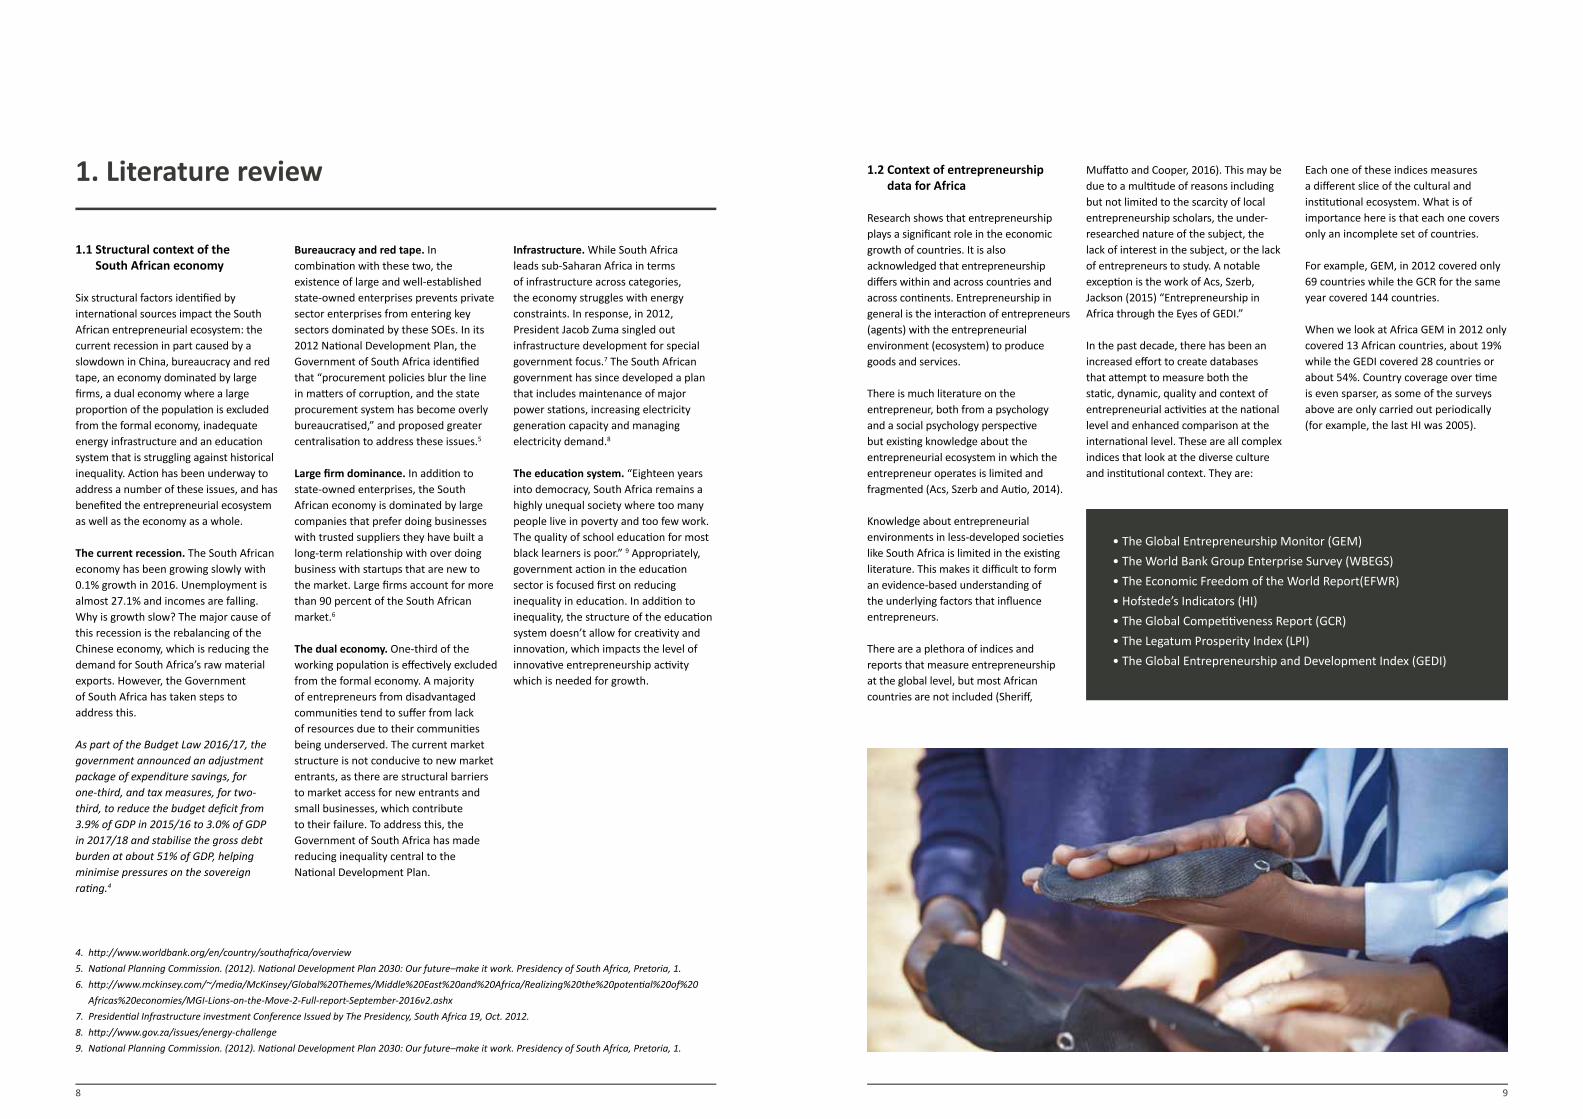
Six structural factors identified by international sources impact the South African entrepreneurial ecosystem: the current recession in part caused by a slowdown in China, bureaucracy and red tape, an economy dominated by large firms, a dual economy where a large proportion of the population is excluded from the formal economy, inadequate energy infrastructure and an education system that is struggling against historical inequality. Action has been underway to address a number of these issues, and has benefited the entrepreneurial ecosystem as well as the economy as a whole.
The current recession. The South African economy has been growing slowly with 0.1% growth in 2016. Unemployment is almost 27.1% and incomes are falling. Why is growth slow? The major cause of this recession is the rebalancing of the Chinese economy, which is reducing the demand for South Africa’s raw material exports. However, the Government of South Africa has taken steps to address this.
As part of the Budget Law 2016/17, the government announced an adjustment package of expenditure savings, for one-third, and tax measures, for two-third, to reduce the budget deficit from 3.9% of GDP in 2015/16 to 3.0% of GDP in 2017/18 and stabilise the gross debt burden at about 51% of GDP, helping minimise pressures on the sovereign rating.4
Bureaucracy and red tape. In combination with these two, the existence of large and well-established state-owned enterprises prevents private sector enterprises from entering key sectors dominated by these SOEs. In its 2012 National Development Plan, the Government of South Africa identified that “procurement policies blur the line in matters of corruption, and the state procurement system has become overly bureaucratised,” and proposed greater centralisation to address these issues.5
Large firm dominance. In addition to state-owned enterprises, the South African economy is dominated by large companies that prefer doing businesses with trusted suppliers they have built a long-term relationship with over doing business with startups that are new to the market. Large firms account for more than 90 percent of the South African market.6
The dual economy. One-third of the working population is effectively excluded from the formal economy. A majority of entrepreneurs from disadvantaged communities tend to suffer from lack of resources due to their communities being underserved. The current market structure is not conducive to new market entrants, as there are structural barriers to market access for new entrants and small businesses, which contribute to their failure. To address this, the Government of South Africa has made reducing inequality central to the National Development Plan.
Infrastructure. While South Africa leads sub-Saharan Africa in terms of infrastructure across categories, the economy struggles with energy constraints. In response, in 2012, President Jacob Zuma singled out infrastructure development for special government focus.7 The South African government has since developed a plan that includes maintenance of major power stations, increasing electricity generation capacity and managing electricity demand.8
The education system. “Eighteen years into democracy, South Africa remains a highly unequal society where too many people live in poverty and too few work. The quality of school education for most black learners is poor.” 9 Appropriately, government action in the education sector is focused first on reducing inequality in education. In addition to inequality, the structure of the education system doesn’t allow for creativity and innovation, which impacts the level of innovative entrepreneurship activity which is needed for growth.
4. http://www.worldbank.org/en/country/southafrica/overview
5. National Planning Commission. (2012). National Development Plan 2030: Our future–make it work. Presidency of South Africa, Pretoria, 1.
6. http://www.mckinsey.com/~/media/McKinsey/Global%20Themes/Middle%20East%20and%20Africa/Realizing%20the%20potential%20of%20
Africas%20economies/MGI-Lions-on-the-Move-2-Full-report-September-2016v2.ashx
7. Presidential Infrastructure investment Conference Issued by The Presidency, South Africa 19, Oct. 2012.
8. http://www.gov.za/issues/energy-challenge
9. National Planning Commission. (2012). National Development Plan 2030: Our future–make it work. Presidency of South Africa, Pretoria, 1.
1. Literature review 1.2 Context of entrepreneurship data for Africa
Research shows that entrepreneurship plays a significant role in the economic growth of countries. It is also acknowledged that entrepreneurship differs within and across countries and across continents. Entrepreneurship in general is the interaction of entrepreneurs (agents) with the entrepreneurial environment (ecosystem) to produce goods and services.
There is much literature on the entrepreneur, both from a psychology and a social psychology perspective but existing knowledge about the entrepreneurial ecosystem in which the entrepreneur operates is limited and fragmented (Acs, Szerb and Autio, 2014).
Knowledge about entrepreneurial environments in less-developed societies like South Africa is limited in the existing literature. This makes it difficult to form an evidence-based understanding of the underlying factors that influence entrepreneurs.
There are a plethora of indices and reports that measure entrepreneurship at the global level, but most African countries are not included (Sheriff,
Muffatto and Cooper, 2016). This may be due to a multitude of reasons including but not limited to the scarcity of local entrepreneurship scholars, the under-researched nature of the subject, the lack of interest in the subject, or the lack of entrepreneurs to study. A notable exception is the work of Acs, Szerb, Jackson (2015) “Entrepreneurship in Africa through the Eyes of GEDI.”
In the past decade, there has been an increased effort to create databases that attempt to measure both the static, dynamic, quality and context of entrepreneurial activities at the national level and enhanced comparison at the international level. These are all complex indices that look at the diverse culture and institutional context. They are:
Each one of these indices measures a different slice of the cultural and institutional ecosystem. What is of importance here is that each one covers only an incomplete set of countries.
For example, GEM, in 2012 covered only 69 countries while the GCR for the same year covered 144 countries.
When we look at Africa GEM in 2012 only covered 13 African countries, about 19% while the GEDI covered 28 countries or about 54%. Country coverage over time is even sparser, as some of the surveys above are only carried out periodically (for example, the last HI was 2005).
• The Global Entrepreneurship Monitor (GEM)• The World Bank Group Enterprise Survey (WBEGS) • The Economic Freedom of the World Report(EFWR)• Hofstede’s Indicators (HI)• The Global Competitiveness Report (GCR)• The Legatum Prosperity Index (LPI)• The Global Entrepreneurship and Development Index (GEDI)
10 11
This next section compares two of the measures mentioned above, the Global Entrepreneurship Monitor (GEM) data and the Global Entrepreneurship and Development Institute (GEDI) data. As countries develop, more and more people leave self-employment and join organisations. This is true in every country over the centuries. For example, the level of self-employment in the United States declined from 80 percent in 1800 to less than 10 percent today. In most countries that are developed we see the same trend today. They shift from quantity to quality as entrepreneurs become more innovative.
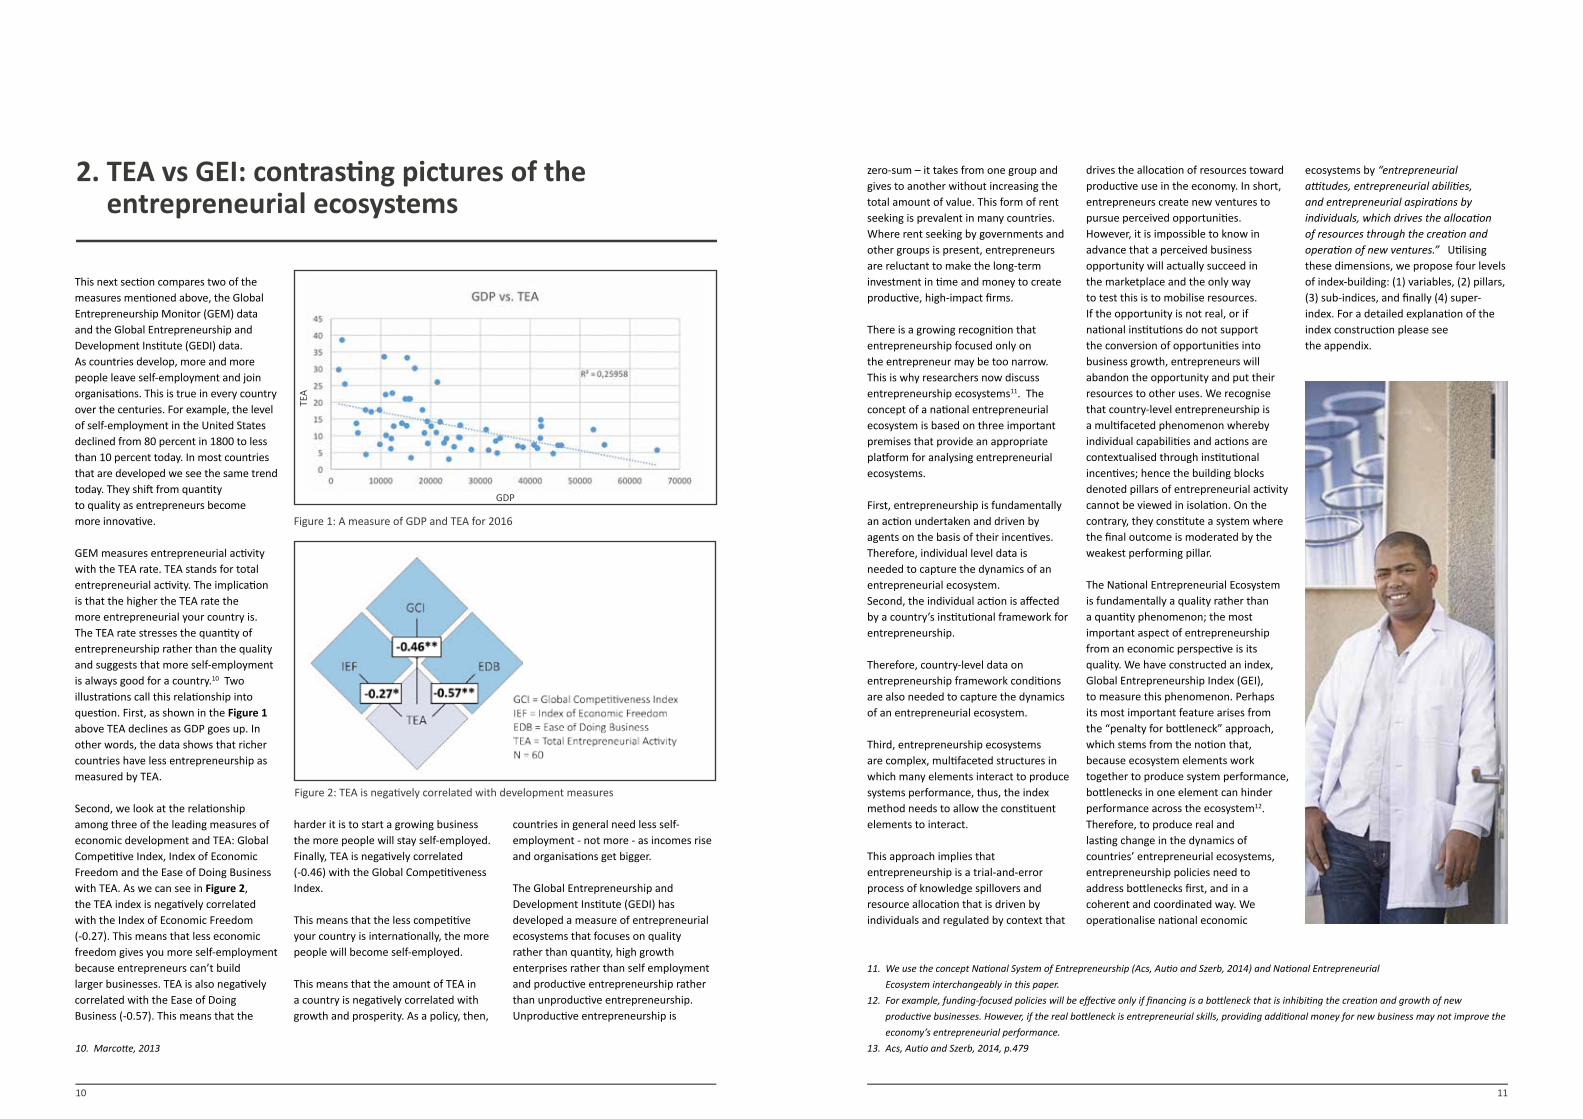
GEM measures entrepreneurial activity with the TEA rate. TEA stands for total entrepreneurial activity. The implication is that the higher the TEA rate the more entrepreneurial your country is. The TEA rate stresses the quantity of entrepreneurship rather than the quality and suggests that more self-employment is always good for a country.10 Two illustrations call this relationship into question. First, as shown in the Figure 1 above TEA declines as GDP goes up. In other words, the data shows that richer countries have less entrepreneurship as measured by TEA.
Second, we look at the relationship among three of the leading measures of economic development and TEA: Global Competitive Index, Index of Economic Freedom and the Ease of Doing Business with TEA. As we can see in Figure 2, the TEA index is negatively correlated with the Index of Economic Freedom (-0.27). This means that less economic freedom gives you more self-employment because entrepreneurs can’t build larger businesses. TEA is also negatively correlated with the Ease of Doing Business (-0.57). This means that the
harder it is to start a growing business the more people will stay self-employed. Finally, TEA is negatively correlated (-0.46) with the Global Competitiveness Index.
This means that the less competitive your country is internationally, the more people will become self-employed.
This means that the amount of TEA in a country is negatively correlated with growth and prosperity. As a policy, then,
countries in general need less self-employment - not more - as incomes rise and organisations get bigger.
The Global Entrepreneurship and Development Institute (GEDI) has developed a measure of entrepreneurial ecosystems that focuses on quality rather than quantity, high growth enterprises rather than self employment and productive entrepreneurship rather than unproductive entrepreneurship. Unproductive entrepreneurship is
10. Marcotte, 2013
2. TEA vs GEI: contrasting pictures of the entrepreneurial ecosystems
Figure 1: A measure of GDP and TEA for 2016
GDP
TEA
Figure 2: TEA is negatively correlated with development measures
zero-sum – it takes from one group and gives to another without increasing the total amount of value. This form of rent seeking is prevalent in many countries. Where rent seeking by governments and other groups is present, entrepreneurs are reluctant to make the long-term investment in time and money to create productive, high-impact firms.
There is a growing recognition that entrepreneurship focused only on the entrepreneur may be too narrow. This is why researchers now discuss entrepreneurship ecosystems11. The concept of a national entrepreneurial ecosystem is based on three important premises that provide an appropriate platform for analysing entrepreneurial ecosystems.
First, entrepreneurship is fundamentally an action undertaken and driven by agents on the basis of their incentives. Therefore, individual level data is needed to capture the dynamics of an entrepreneurial ecosystem. Second, the individual action is affected by a country’s institutional framework for entrepreneurship.
Therefore, country-level data on entrepreneurship framework conditions are also needed to capture the dynamics of an entrepreneurial ecosystem.
Third, entrepreneurship ecosystems are complex, multifaceted structures in which many elements interact to produce systems performance, thus, the index method needs to allow the constituent elements to interact.
This approach implies that entrepreneurship is a trial-and-error process of knowledge spillovers and resource allocation that is driven by individuals and regulated by context that
drives the allocation of resources toward productive use in the economy. In short, entrepreneurs create new ventures to pursue perceived opportunities. However, it is impossible to know in advance that a perceived business opportunity will actually succeed in the marketplace and the only way to test this is to mobilise resources. If the opportunity is not real, or if national institutions do not support the conversion of opportunities into business growth, entrepreneurs will abandon the opportunity and put their resources to other uses. We recognise that country-level entrepreneurship is a multifaceted phenomenon whereby individual capabilities and actions are contextualised through institutional incentives; hence the building blocks denoted pillars of entrepreneurial activity cannot be viewed in isolation. On the contrary, they constitute a system where the final outcome is moderated by the weakest performing pillar.
The National Entrepreneurial Ecosystem is fundamentally a quality rather than a quantity phenomenon; the most important aspect of entrepreneurship from an economic perspective is its quality. We have constructed an index, Global Entrepreneurship Index (GEI), to measure this phenomenon. Perhaps its most important feature arises from the “penalty for bottleneck” approach, which stems from the notion that, because ecosystem elements work together to produce system performance, bottlenecks in one element can hinder performance across the ecosystem12. Therefore, to produce real and lasting change in the dynamics of countries’ entrepreneurial ecosystems, entrepreneurship policies need to address bottlenecks first, and in a coherent and coordinated way. We operationalise national economic
ecosystems by “entrepreneurial attitudes, entrepreneurial abilities, and entrepreneurial aspirations by individuals, which drives the allocation of resources through the creation and operation of new ventures.” Utilising these dimensions, we propose four levels of index-building: (1) variables, (2) pillars, (3) sub-indices, and finally (4) super-index. For a detailed explanation of the index construction please see the appendix.
11. We use the concept National System of Entrepreneurship (Acs, Autio and Szerb, 2014) and National Entrepreneurial
Ecosystem interchangeably in this paper.
12. For example, funding-focused policies will be effective only if financing is a bottleneck that is inhibiting the creation and growth of new
productive businesses. However, if the real bottleneck is entrepreneurial skills, providing additional money for new business may not improve the
economy’s entrepreneurial performance.
13. Acs, Autio and Szerb, 2014, p.479
12 13
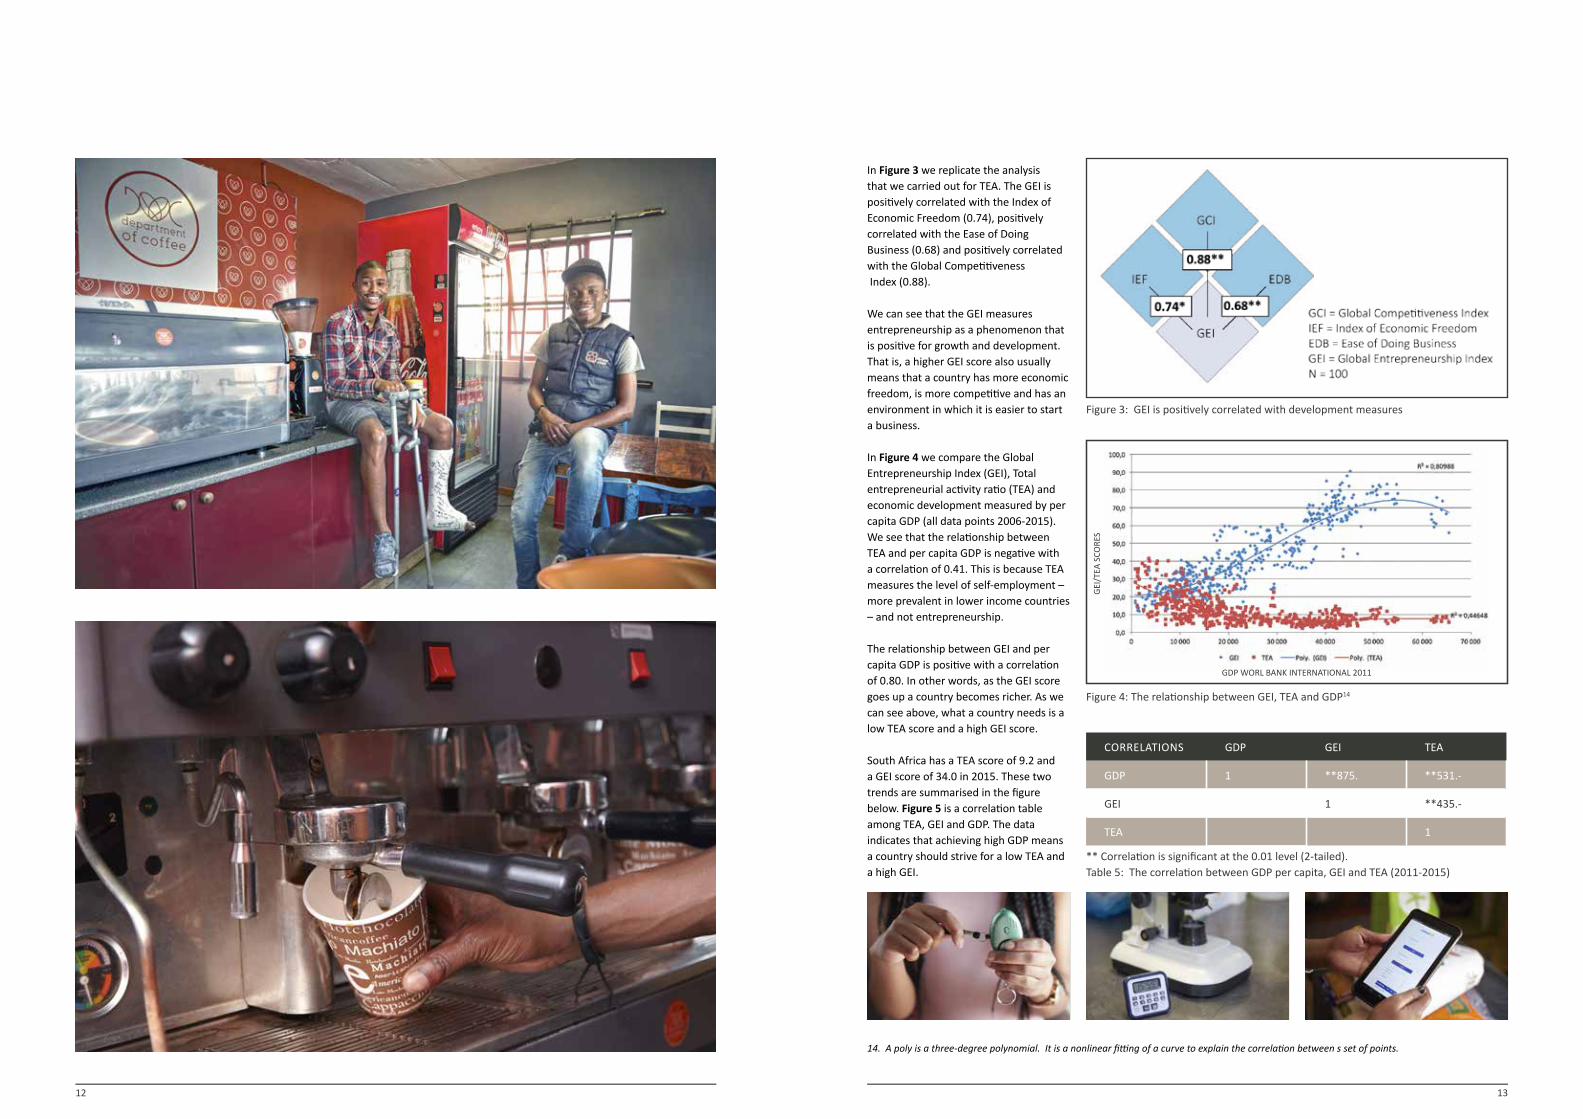
In Figure 3 we replicate the analysis that we carried out for TEA. The GEI is positively correlated with the Index of Economic Freedom (0.74), positively correlated with the Ease of Doing Business (0.68) and positively correlated with the Global Competitiveness Index (0.88).
We can see that the GEI measures entrepreneurship as a phenomenon that is positive for growth and development. That is, a higher GEI score also usually means that a country has more economic freedom, is more competitive and has an environment in which it is easier to start a business.
In Figure 4 we compare the Global Entrepreneurship Index (GEI), Total entrepreneurial activity ratio (TEA) and economic development measured by per capita GDP (all data points 2006-2015). We see that the relationship between TEA and per capita GDP is negative with a correlation of 0.41. This is because TEA measures the level of self-employment – more prevalent in lower income countries – and not entrepreneurship.
The relationship between GEI and per capita GDP is positive with a correlation of 0.80. In other words, as the GEI score goes up a country becomes richer. As we can see above, what a country needs is a low TEA score and a high GEI score.
South Africa has a TEA score of 9.2 and a GEI score of 34.0 in 2015. These two trends are summarised in the figure below. Figure 5 is a correlation table among TEA, GEI and GDP. The data indicates that achieving high GDP means a country should strive for a low TEA and a high GEI.
Figure 3: GEI is positively correlated with development measures
Figure 4: The relationship between GEI, TEA and GDP14
CORRELATIONS GDP GEI TEA
GDP 1 **875. **531.-
GEI 1 **435.-
TEA 1
** Correlation is significant at the 0.01 level (2-tailed).Table 5: The correlation between GDP per capita, GEI and TEA (2011-2015)
14. A poly is a three-degree polynomial. It is a nonlinear fitting of a curve to explain the correlation between s set of points.
GDP WORL BANK INTERNATIONAL 2011
GEI/
TEA
SCO
RES
14 15
One measure of aspirations leadership is whether a country is able to produce unicorns - private, venture-backed companies valued at a billion dollars or more.16 In sub-Saharan Africa only two countries have produced a unicorn: South Africa and Nigeria. South Africa’s Promasidor Holdings, valued at $1.58 billion17 is in the food and beverage industry and Nigeria’s African Internet Group, valued at $1.1 dollars is in the internet provider business. Other noteworthy startups in South Africa are:18
Looking beyond unicorns, Crunchbase’s top ten South African companies all rank in the top 15,000 companies globally20, out of more than 100,000 companies catalogued. MTN, Dimension Data and Yoko rank in the top 5,000 globally, and all three are in the top ten in Africa.
These rankings, as well as the companies detailed below, further demonstrate that South Africa is and has been producing high-growth, high-tech, globally competitive startups.
Naspers: Founded in 1915, Naspers is a $60bn global media and internet group with investments and operations in more than 130 markets. The company is active both in the venture capital space and in conventional operations - funding, acquiring and building more than 100 companies. Notable Naspers investments include Tencent in China and Flipkart in India.21 The company ranked #683 globally in terms on Forbes’ list of the world’s 2000 biggest companies in 2016.22 Its market capitalisation is $74 billion.23
MTN Group: Founded in 1994, MTN is a JSE-listed multinational company that offers voice and data, mobile financial, enterprise, and digital services to clients ranging from individuals to corporate and public sector organisations. The company
has operations in 21 countries across the Middle East and Africa.24 The company is valued at $224 billion in terms of market cap25 and ranked #523 on Forbes’ 2000 biggest companies.26 In addition to these large companies, smaller, high-tech startups are disrupting traditional models with mobile technology and reaching previously underserved markets.
Yoco: Founded in 2012, Yoko is a mobile credit card payment processing platform used primarily by small businesses.27
The company raised $1.65 million in funding in 2014, and launched publicly in 2015. More than 5000 users rely on the platform to process payments.
Travelstart: Founded in 1999 in Sweden, Travelstart provides cheap flights, car hire, hotels and holiday packages to destinations in South Africa and abroad.28 Since 2010 the company has been headquartered in South Africa, and has operations in 16 countries throughout the Middle East and Africa.29 In 2016, the company raised $40 million in venture funding. It is one of Africa’s largest online travel-booking websites.Companies like the above both enable growth, and, as Africa’s middle class expands, reap the benefits of customers that growth creates.
3. Analysis of the entrepreneurial ecosystem of South Africa
This section lays out the strengths of the entrepreneurial ecosystem of South Africa (EESA) based on data from the Global Entrepreneurship Index. The first section presents the building blocks of the ecosystem. The second section looks at EESA in the context of sub-Saharan Africa. The third section looks at the strengths of the EESA. Section four looks at the global standing of the EESA and its strengths as a global leader in entrepreneurship and innovation.
3.1 The building blocks of the ecosystem
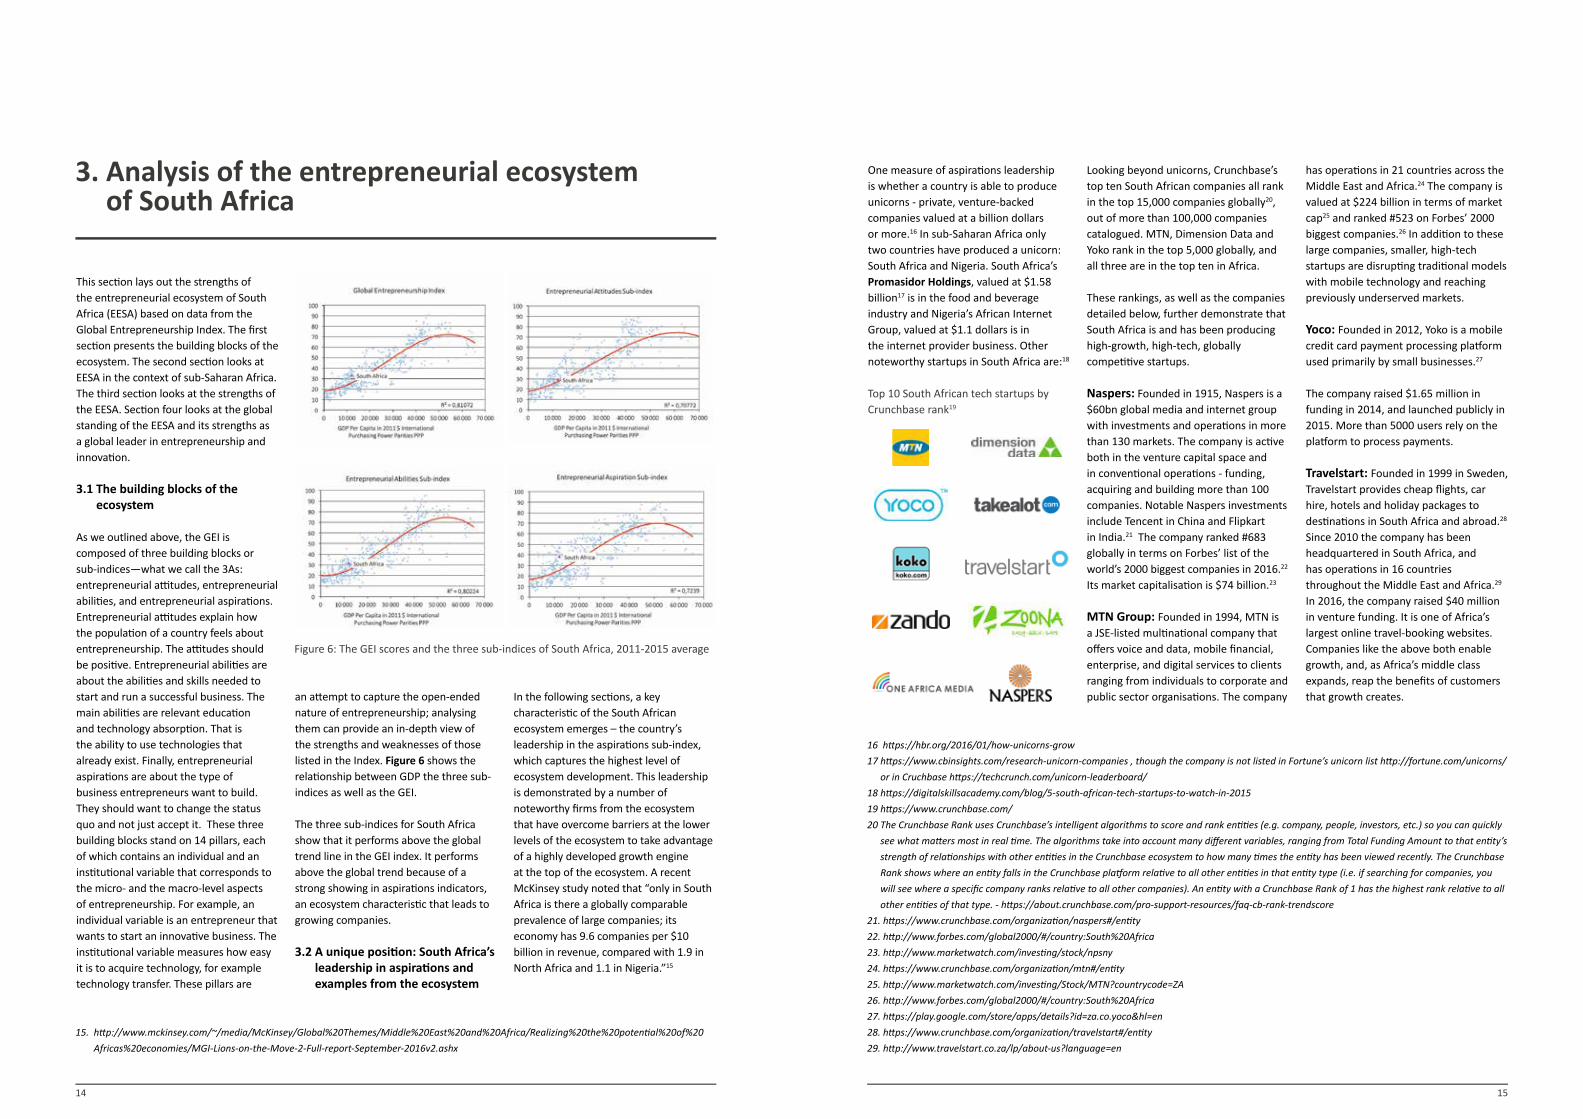
As we outlined above, the GEI is composed of three building blocks or sub-indices—what we call the 3As: entrepreneurial attitudes, entrepreneurial abilities, and entrepreneurial aspirations. Entrepreneurial attitudes explain how the population of a country feels about entrepreneurship. The attitudes should be positive. Entrepreneurial abilities are about the abilities and skills needed to start and run a successful business. The main abilities are relevant education and technology absorption. That is the ability to use technologies that already exist. Finally, entrepreneurial aspirations are about the type of business entrepreneurs want to build. They should want to change the status quo and not just accept it. These three building blocks stand on 14 pillars, each of which contains an individual and an institutional variable that corresponds to the micro- and the macro-level aspects of entrepreneurship. For example, an individual variable is an entrepreneur that wants to start an innovative business. The institutional variable measures how easy it is to acquire technology, for example technology transfer. These pillars are
an attempt to capture the open-ended nature of entrepreneurship; analysing them can provide an in-depth view of the strengths and weaknesses of those listed in the Index. Figure 6 shows the relationship between GDP the three sub-indices as well as the GEI.
The three sub-indices for South Africa show that it performs above the global trend line in the GEI index. It performs above the global trend because of a strong showing in aspirations indicators, an ecosystem characteristic that leads to growing companies.
3.2 A unique position: South Africa’s leadership in aspirations and examples from the ecosystem
In the following sections, a key characteristic of the South African ecosystem emerges – the country’s leadership in the aspirations sub-index, which captures the highest level of ecosystem development. This leadership is demonstrated by a number of noteworthy firms from the ecosystem that have overcome barriers at the lower levels of the ecosystem to take advantage of a highly developed growth engine at the top of the ecosystem. A recent McKinsey study noted that “only in South Africa is there a globally comparable prevalence of large companies; its economy has 9.6 companies per $10 billion in revenue, compared with 1.9 in North Africa and 1.1 in Nigeria.”15
15. http://www.mckinsey.com/~/media/McKinsey/Global%20Themes/Middle%20East%20and%20Africa/Realizing%20the%20potential%20of%20
Africas%20economies/MGI-Lions-on-the-Move-2-Full-report-September-2016v2.ashx
16 https://hbr.org/2016/01/how-unicorns-grow
17 https://www.cbinsights.com/research-unicorn-companies , though the company is not listed in Fortune’s unicorn list http://fortune.com/unicorns/
or in Cruchbase https://techcrunch.com/unicorn-leaderboard/
18 https://digitalskillsacademy.com/blog/5-south-african-tech-startups-to-watch-in-2015
19 https://www.crunchbase.com/
20 The Crunchbase Rank uses Crunchbase’s intelligent algorithms to score and rank entities (e.g. company, people, investors, etc.) so you can quickly
see what matters most in real time. The algorithms take into account many different variables, ranging from Total Funding Amount to that entity’s
strength of relationships with other entities in the Crunchbase ecosystem to how many times the entity has been viewed recently. The Crunchbase
Rank shows where an entity falls in the Crunchbase platform relative to all other entities in that entity type (i.e. if searching for companies, you
will see where a specific company ranks relative to all other companies). An entity with a Crunchbase Rank of 1 has the highest rank relative to all
other entities of that type. - https://about.crunchbase.com/pro-support-resources/faq-cb-rank-trendscore
21. https://www.crunchbase.com/organization/naspers#/entity
22. http://www.forbes.com/global2000/#/country:South%20Africa
23. http://www.marketwatch.com/investing/stock/npsny
24. https://www.crunchbase.com/organization/mtn#/entity
25. http://www.marketwatch.com/investing/Stock/MTN?countrycode=ZA
26. http://www.forbes.com/global2000/#/country:South%20Africa
27. https://play.google.com/store/apps/details?id=za.co.yoco&hl=en
28. https://www.crunchbase.com/organization/travelstart#/entity
29. http://www.travelstart.co.za/lp/about-us?language=en
Figure 6: The GEI scores and the three sub-indices of South Africa, 2011-2015 average
Top 10 South African tech startups by Crunchbase rank19
16 17
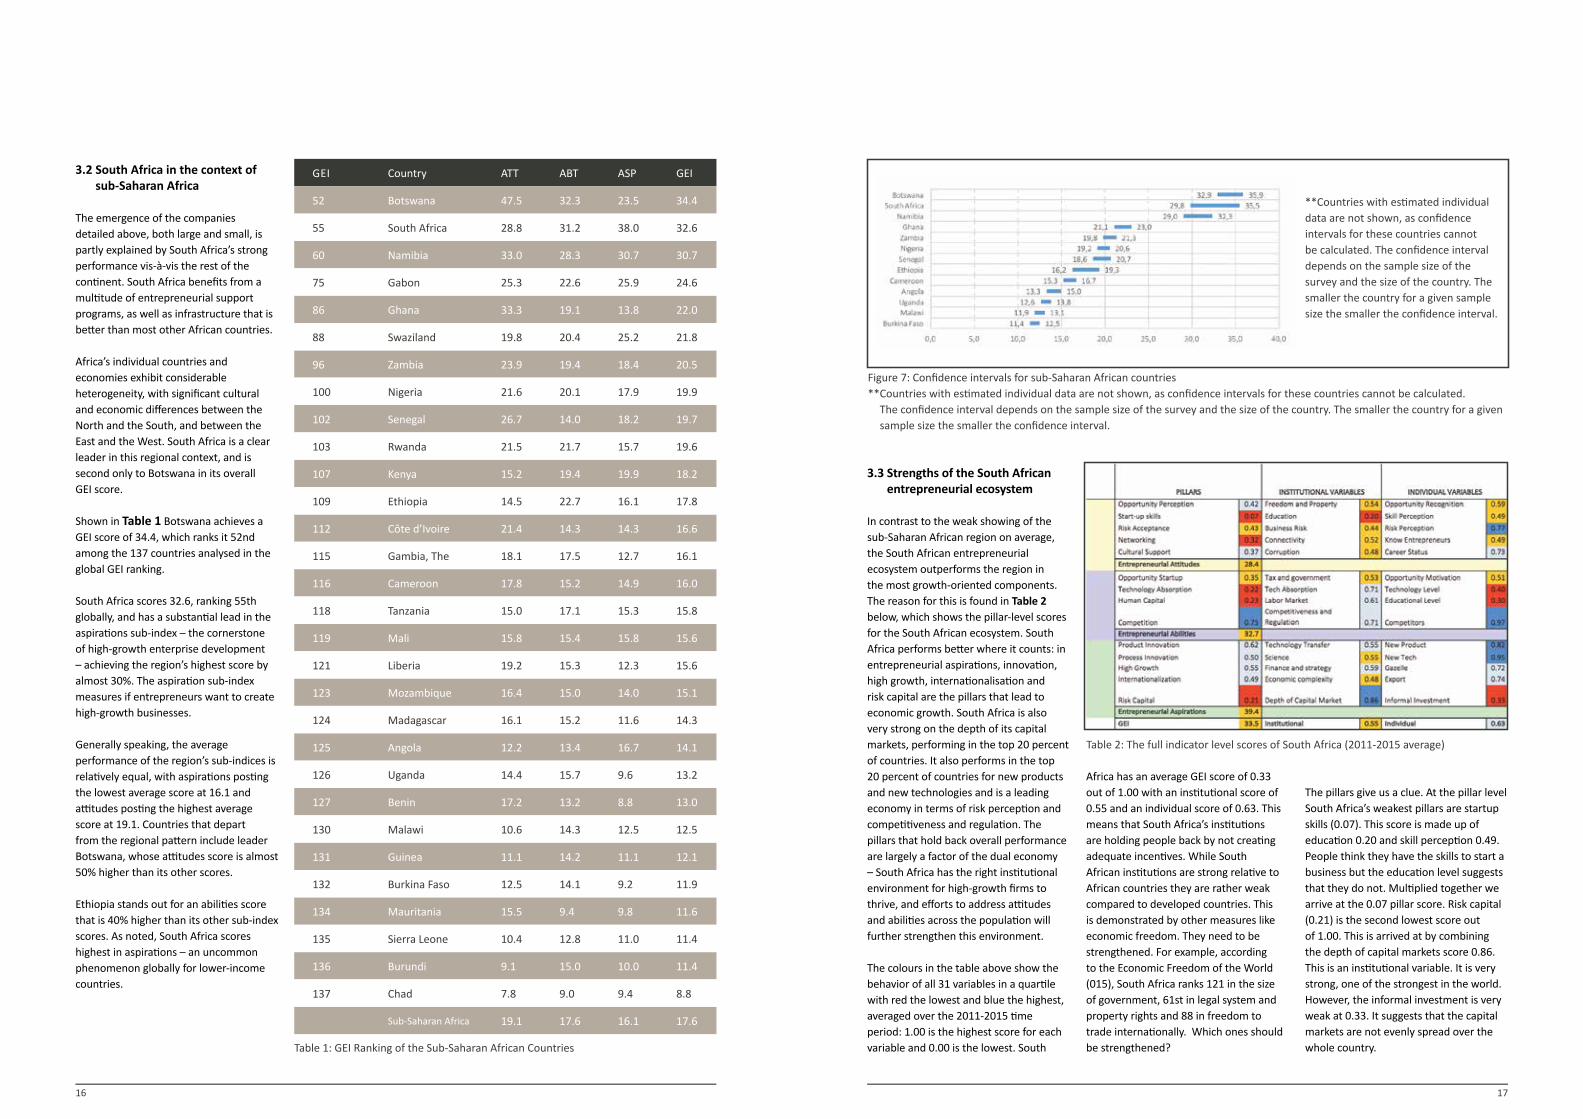
3.2 South Africa in the context of sub-Saharan Africa
The emergence of the companies detailed above, both large and small, is partly explained by South Africa’s strong performance vis-à-vis the rest of the continent. South Africa benefits from a multitude of entrepreneurial support programs, as well as infrastructure that is better than most other African countries.
Africa’s individual countries and economies exhibit considerable heterogeneity, with significant cultural and economic differences between the North and the South, and between the East and the West. South Africa is a clear leader in this regional context, and is second only to Botswana in its overall GEI score.
Shown in Table 1 Botswana achieves a GEI score of 34.4, which ranks it 52nd among the 137 countries analysed in the global GEI ranking.
South Africa scores 32.6, ranking 55th globally, and has a substantial lead in the aspirations sub-index – the cornerstone of high-growth enterprise development – achieving the region’s highest score by almost 30%. The aspiration sub-index measures if entrepreneurs want to create high-growth businesses.
Generally speaking, the average performance of the region’s sub-indices is relatively equal, with aspirations posting the lowest average score at 16.1 and attitudes posting the highest average score at 19.1. Countries that depart from the regional pattern include leader Botswana, whose attitudes score is almost 50% higher than its other scores.
Ethiopia stands out for an abilities score that is 40% higher than its other sub-index scores. As noted, South Africa scores highest in aspirations – an uncommon phenomenon globally for lower-income countries.
3.3 Strengths of the South African entrepreneurial ecosystem
In contrast to the weak showing of the sub-Saharan African region on average, the South African entrepreneurial ecosystem outperforms the region in the most growth-oriented components. The reason for this is found in Table 2 below, which shows the pillar-level scores for the South African ecosystem. South Africa performs better where it counts: in entrepreneurial aspirations, innovation, high growth, internationalisation and risk capital are the pillars that lead to economic growth. South Africa is also very strong on the depth of its capital markets, performing in the top 20 percent of countries. It also performs in the top 20 percent of countries for new products and new technologies and is a leading economy in terms of risk perception and competitiveness and regulation. The pillars that hold back overall performance are largely a factor of the dual economy – South Africa has the right institutional environment for high-growth firms to thrive, and efforts to address attitudes and abilities across the population will further strengthen this environment.
The colours in the table above show the behavior of all 31 variables in a quartile with red the lowest and blue the highest, averaged over the 2011-2015 time period: 1.00 is the highest score for each variable and 0.00 is the lowest. South
Africa has an average GEI score of 0.33 out of 1.00 with an institutional score of 0.55 and an individual score of 0.63. This means that South Africa’s institutions are holding people back by not creating adequate incentives. While South African institutions are strong relative to African countries they are rather weak compared to developed countries. This is demonstrated by other measures like economic freedom. They need to be strengthened. For example, according to the Economic Freedom of the World (015), South Africa ranks 121 in the size of government, 61st in legal system and property rights and 88 in freedom to trade internationally. Which ones should be strengthened?
The pillars give us a clue. At the pillar level South Africa’s weakest pillars are startup skills (0.07). This score is made up of education 0.20 and skill perception 0.49. People think they have the skills to start a business but the education level suggests that they do not. Multiplied together we arrive at the 0.07 pillar score. Risk capital (0.21) is the second lowest score out of 1.00. This is arrived at by combining the depth of capital markets score 0.86. This is an institutional variable. It is very strong, one of the strongest in the world. However, the informal investment is very weak at 0.33. It suggests that the capital markets are not evenly spread over the whole country.
GEI Country ATT ABT ASP GEI
52 Botswana 47.5 32.3 23.5 34.4
55 South Africa 28.8 31.2 38.0 32.6
60 Namibia 33.0 28.3 30.7 30.7
75 Gabon 25.3 22.6 25.9 24.6
86 Ghana 33.3 19.1 13.8 22.0
88 Swaziland 19.8 20.4 25.2 21.8
96 Zambia 23.9 19.4 18.4 20.5
100 Nigeria 21.6 20.1 17.9 19.9
102 Senegal 26.7 14.0 18.2 19.7
103 Rwanda 21.5 21.7 15.7 19.6
107 Kenya 15.2 19.4 19.9 18.2
109 Ethiopia 14.5 22.7 16.1 17.8
112 Côte d’Ivoire 21.4 14.3 14.3 16.6
115 Gambia, The 18.1 17.5 12.7 16.1
116 Cameroon 17.8 15.2 14.9 16.0
118 Tanzania 15.0 17.1 15.3 15.8
119 Mali 15.8 15.4 15.8 15.6
121 Liberia 19.2 15.3 12.3 15.6
123 Mozambique 16.4 15.0 14.0 15.1
124 Madagascar 16.1 15.2 11.6 14.3
125 Angola 12.2 13.4 16.7 14.1
126 Uganda 14.4 15.7 9.6 13.2
127 Benin 17.2 13.2 8.8 13.0
130 Malawi 10.6 14.3 12.5 12.5
131 Guinea 11.1 14.2 11.1 12.1
132 Burkina Faso 12.5 14.1 9.2 11.9
134 Mauritania 15.5 9.4 9.8 11.6
135 Sierra Leone 10.4 12.8 11.0 11.4
136 Burundi 9.1 15.0 10.0 11.4
137 Chad 7.8 9.0 9.4 8.8
Sub-Saharan Africa 19.1 17.6 16.1 17.6
Table 1: GEI Ranking of the Sub-Saharan African Countries
Figure 7: Confidence intervals for sub-Saharan African countries** Countries with estimated individual data are not shown, as confidence intervals for these countries cannot be calculated.
The confidence interval depends on the sample size of the survey and the size of the country. The smaller the country for a given sample size the smaller the confidence interval.
**Countries with estimated individual data are not shown, as confidence intervals for these countries cannot be calculated. The confidence interval depends on the sample size of the survey and the size of the country. The smaller the country for a given sample size the smaller the confidence interval.
Table 2: The full indicator level scores of South Africa (2011-2015 average)
18 19
The third weakest pillar is human capital (0.23). It is another way of trying to understand if entrepreneurs have the skills and education to start a business. It is a combination of the flexibility of labour markets, an institutional variable and staff training, an individual variable. What is weak here is staff training.
The final weak pillar is technology absorption (0.22) out of 1.00. This suggests that South Africa is not very good at absorbing technology from the rest of the world. The weakness is more at the individual level 0.40 and not the institutional level 0.70. This implies that training and technical education are needed.
At the pillar level South Africa is strong on competition (0.75) followed by product innovation (0.62), high-growth firms (0.55) and process innovation (0.50). The aspiration scores are very strong in the second quartile.
South Africa is able to innovate and create high-growth businesses. If we dig down a little deeper we see that startup skills are
weak because of the education system (0.20). It is the weakest institutional pillar for the country as a whole by a factor of at least two. The highest score is for the depth of capital markets (0.86). A look at the individual variables reveals that the weakest variable is the education level of entrepreneurs (0.30) and the level of informal investment (0.33) followed by the level of technology (0.40).
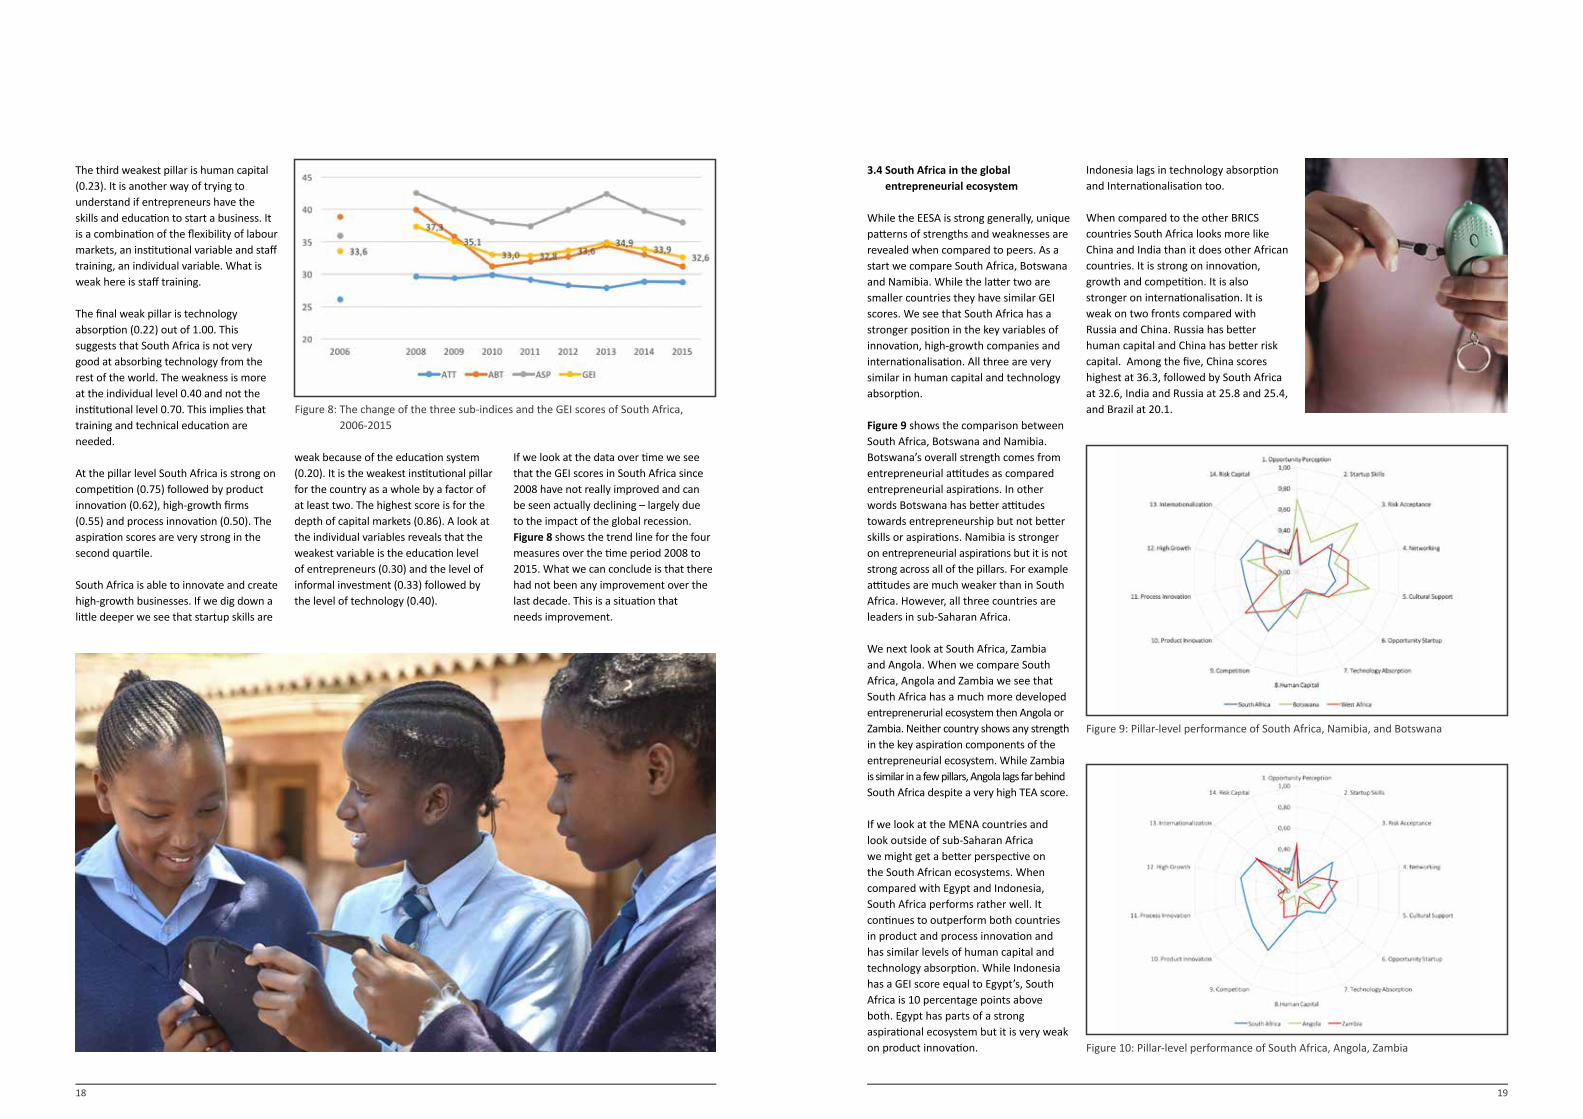
If we look at the data over time we see that the GEI scores in South Africa since 2008 have not really improved and can be seen actually declining – largely due to the impact of the global recession. Figure 8 shows the trend line for the four measures over the time period 2008 to 2015. What we can conclude is that there had not been any improvement over the last decade. This is a situation that needs improvement.
Figure 8: The change of the three sub-indices and the GEI scores of South Africa, 2006-2015
3.4 South Africa in the global entrepreneurial ecosystem
While the EESA is strong generally, unique patterns of strengths and weaknesses are revealed when compared to peers. As a start we compare South Africa, Botswana and Namibia. While the latter two are smaller countries they have similar GEI scores. We see that South Africa has a stronger position in the key variables of innovation, high-growth companies and internationalisation. All three are very similar in human capital and technology absorption.
Figure 9 shows the comparison between South Africa, Botswana and Namibia. Botswana’s overall strength comes from entrepreneurial attitudes as compared entrepreneurial aspirations. In other words Botswana has better attitudes towards entrepreneurship but not better skills or aspirations. Namibia is stronger on entrepreneurial aspirations but it is not strong across all of the pillars. For example attitudes are much weaker than in South Africa. However, all three countries are leaders in sub-Saharan Africa.
We next look at South Africa, Zambia and Angola. When we compare South Africa, Angola and Zambia we see that South Africa has a much more developed entreprenerurial ecosystem then Angola or Zambia. Neither country shows any strength in the key aspiration components of the entrepreneurial ecosystem. While Zambia is similar in a few pillars, Angola lags far behind South Africa despite a very high TEA score.
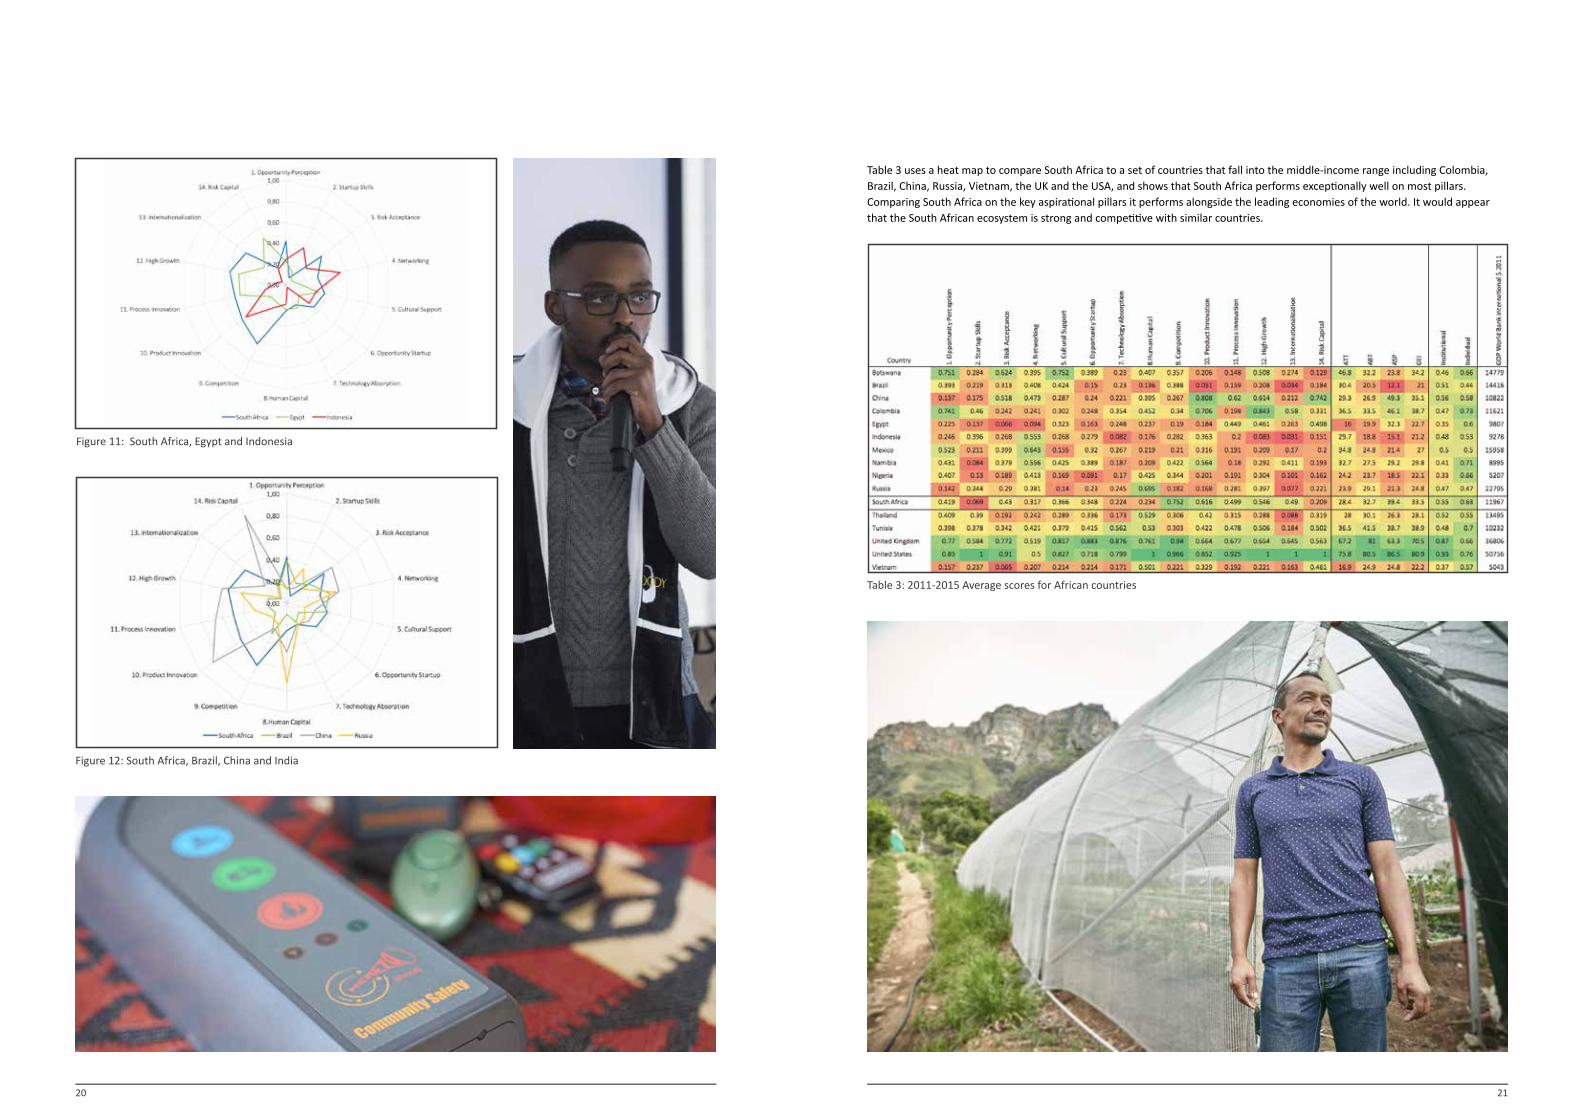
If we look at the MENA countries and look outside of sub-Saharan Africa we might get a better perspective on the South African ecosystems. When compared with Egypt and Indonesia, South Africa performs rather well. It continues to outperform both countries in product and process innovation and has similar levels of human capital and technology absorption. While Indonesia has a GEI score equal to Egypt’s, South Africa is 10 percentage points above both. Egypt has parts of a strong aspirational ecosystem but it is very weak on product innovation.
Indonesia lags in technology absorption and Internationalisation too.
When compared to the other BRICS countries South Africa looks more like China and India than it does other African countries. It is strong on innovation, growth and competition. It is also stronger on internationalisation. It is weak on two fronts compared with Russia and China. Russia has better human capital and China has better risk capital. Among the five, China scores highest at 36.3, followed by South Africa at 32.6, India and Russia at 25.8 and 25.4, and Brazil at 20.1.
Figure 9: Pillar-level performance of South Africa, Namibia, and Botswana
Figure 10: Pillar-level performance of South Africa, Angola, Zambia
20 21
Table 3 uses a heat map to compare South Africa to a set of countries that fall into the middle-income range including Colombia, Brazil, China, Russia, Vietnam, the UK and the USA, and shows that South Africa performs exceptionally well on most pillars. Comparing South Africa on the key aspirational pillars it performs alongside the leading economies of the world. It would appear that the South African ecosystem is strong and competitive with similar countries.
Figure 12: South Africa, Brazil, China and India
Figure 11: South Africa, Egypt and Indonesia
Table 3: 2011-2015 Average scores for African countries
22 23
4. Causal map of the South African entrepreneurship ecosystem
To further develop our understanding of the South African entrepreneurship ecosystem we interviewed 79 individuals that represent entrepreneurs, investors, policy-makers and academics on the specific causes and impacts of ecosystem bottlenecks. The purpose was to develop a matrix of linked causes and effects based on inputs from individuals operating within the South African ecosystem. The free-response structure of the survey allows us to collect qualitative data. We asked three questions. First, what are the top-five factors that are holding back the entrepreneurship ecosystem in South Africa? Second, what is the cause of each of these bottleneck factors? Third, what additional impacts do each of these factors have?
4.1 Ecosystem bottlenecks
The results of the survey give us a clearer picture of the South African ecosystem,
and point towards key issues that, if addressed, will have a disproportionate positive impact on the overall ecosystem. The factors holding back the South African ecosystem can be narrowed down to six areas. They are: Finance of new and growing firms, access to markets for firms both domestic and international, skills, education, networks and culture, and regulation.
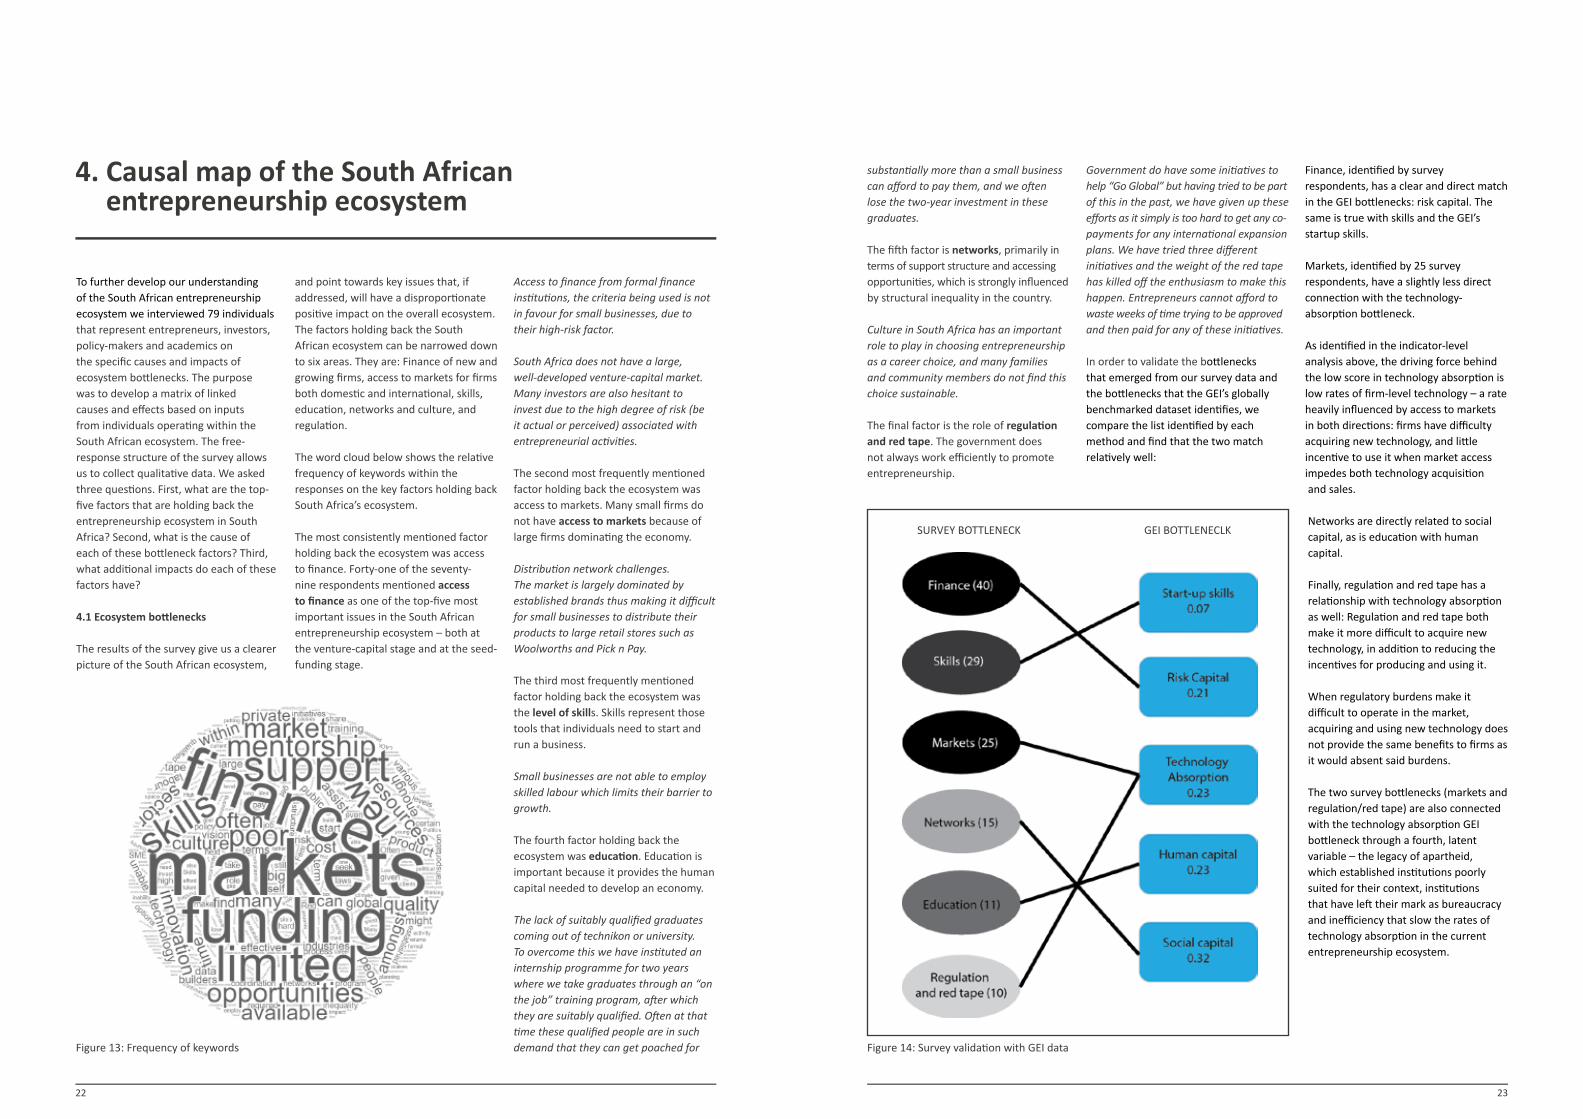
The word cloud below shows the relative frequency of keywords within the responses on the key factors holding back South Africa’s ecosystem.
The most consistently mentioned factor holding back the ecosystem was access to finance. Forty-one of the seventy-nine respondents mentioned access to finance as one of the top-five most important issues in the South African entrepreneurship ecosystem – both at the venture-capital stage and at the seed-funding stage.
Access to finance from formal finance institutions, the criteria being used is not in favour for small businesses, due to their high-risk factor.
South Africa does not have a large, well-developed venture-capital market. Many investors are also hesitant to invest due to the high degree of risk (be it actual or perceived) associated with entrepreneurial activities.
The second most frequently mentioned factor holding back the ecosystem was access to markets. Many small firms do not have access to markets because of large firms dominating the economy.
Distribution network challenges. The market is largely dominated by established brands thus making it difficult for small businesses to distribute their products to large retail stores such as Woolworths and Pick n Pay.
The third most frequently mentioned factor holding back the ecosystem was the level of skills. Skills represent those tools that individuals need to start and run a business.
Small businesses are not able to employ skilled labour which limits their barrier to growth.
The fourth factor holding back the ecosystem was education. Education is important because it provides the human capital needed to develop an economy.
The lack of suitably qualified graduates coming out of technikon or university. To overcome this we have instituted an internship programme for two years where we take graduates through an “on the job” training program, after which they are suitably qualified. Often at that time these qualified people are in such demand that they can get poached for Figure 13: Frequency of keywords
substantially more than a small business can afford to pay them, and we often lose the two-year investment in these graduates.
The fifth factor is networks, primarily in terms of support structure and accessing opportunities, which is strongly influenced by structural inequality in the country.
Culture in South Africa has an important role to play in choosing entrepreneurship as a career choice, and many families and community members do not find this choice sustainable.
The final factor is the role of regulation and red tape. The government does not always work efficiently to promote entrepreneurship.
Government do have some initiatives to help “Go Global” but having tried to be part of this in the past, we have given up these efforts as it simply is too hard to get any co-payments for any international expansion plans. We have tried three different initiatives and the weight of the red tape has killed off the enthusiasm to make this happen. Entrepreneurs cannot afford to waste weeks of time trying to be approved and then paid for any of these initiatives.
In order to validate the bottlenecks that emerged from our survey data and the bottlenecks that the GEI’s globally benchmarked dataset identifies, we compare the list identified by each method and find that the two match relatively well:
Finance, identified by survey respondents, has a clear and direct match in the GEI bottlenecks: risk capital. The same is true with skills and the GEI’s startup skills.
Markets, identified by 25 survey respondents, have a slightly less direct connection with the technology-absorption bottleneck.
As identified in the indicator-level analysis above, the driving force behind the low score in technology absorption is low rates of firm-level technology – a rate heavily influenced by access to markets in both directions: firms have difficulty acquiring new technology, and little incentive to use it when market access impedes both technology acquisition and sales.
Networks are directly related to social capital, as is education with human capital.
Finally, regulation and red tape has a relationship with technology absorption as well: Regulation and red tape both make it more difficult to acquire new technology, in addition to reducing the incentives for producing and using it.
When regulatory burdens make it difficult to operate in the market, acquiring and using new technology does not provide the same benefits to firms as it would absent said burdens.
The two survey bottlenecks (markets and regulation/red tape) are also connected with the technology absorption GEI bottleneck through a fourth, latent variable – the legacy of apartheid, which established institutions poorly suited for their context, institutions that have left their mark as bureaucracy and inefficiency that slow the rates of technology absorption in the current entrepreneurship ecosystem.
Figure 14: Survey validation with GEI data
SURVEY BOTTLENECK GEI BOTTLENECLK
24 25
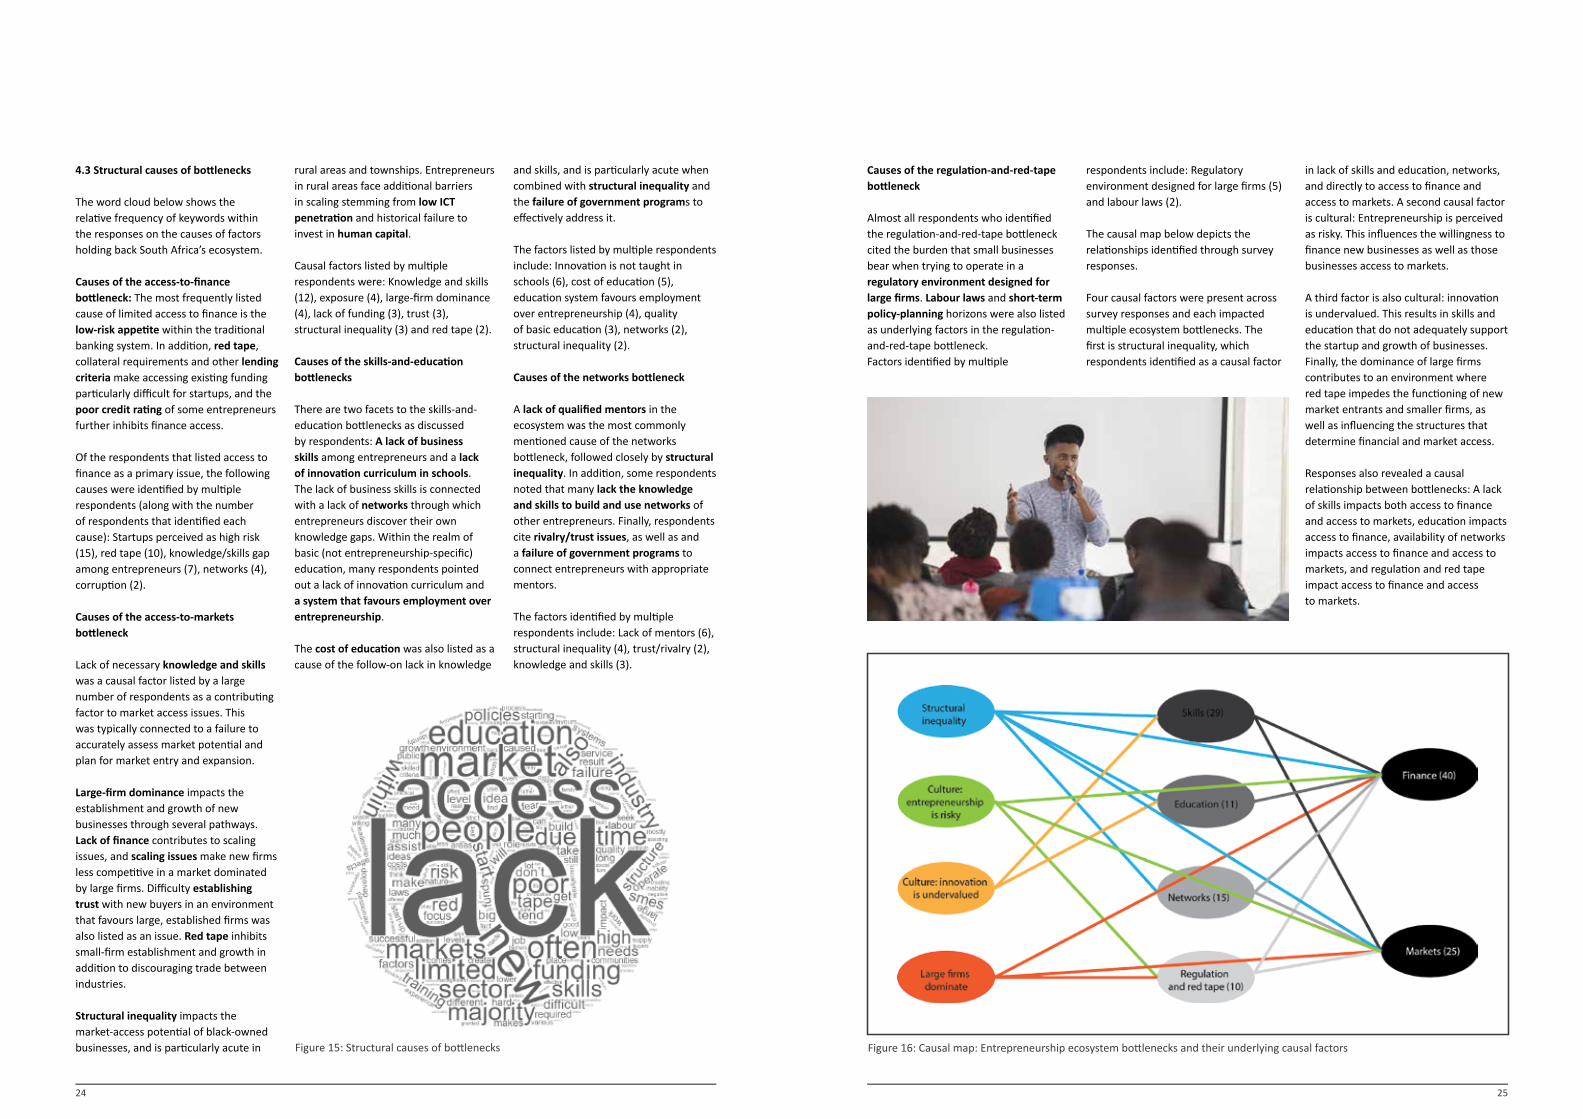
4.3 Structural causes of bottlenecks
The word cloud below shows the relative frequency of keywords within the responses on the causes of factors holding back South Africa’s ecosystem. Causes of the access-to-finance bottleneck: The most frequently listed cause of limited access to finance is the low-risk appetite within the traditional banking system. In addition, red tape, collateral requirements and other lending criteria make accessing existing funding particularly difficult for startups, and the poor credit rating of some entrepreneurs further inhibits finance access.
Of the respondents that listed access to finance as a primary issue, the following causes were identified by multiple respondents (along with the number of respondents that identified each cause): Startups perceived as high risk (15), red tape (10), knowledge/skills gap among entrepreneurs (7), networks (4), corruption (2).
Causes of the access-to-markets bottleneck
Lack of necessary knowledge and skills was a causal factor listed by a large number of respondents as a contributing factor to market access issues. This was typically connected to a failure to accurately assess market potential and plan for market entry and expansion.
Large-firm dominance impacts the establishment and growth of new businesses through several pathways. Lack of finance contributes to scaling issues, and scaling issues make new firms less competitive in a market dominated by large firms. Difficulty establishing trust with new buyers in an environment that favours large, established firms was also listed as an issue. Red tape inhibits small-firm establishment and growth in addition to discouraging trade between industries.
Structural inequality impacts the market-access potential of black-owned businesses, and is particularly acute in
rural areas and townships. Entrepreneurs in rural areas face additional barriers in scaling stemming from low ICT penetration and historical failure to invest in human capital.
Causal factors listed by multiple respondents were: Knowledge and skills (12), exposure (4), large-firm dominance (4), lack of funding (3), trust (3), structural inequality (3) and red tape (2).
Causes of the skills-and-education bottlenecks
There are two facets to the skills-and-education bottlenecks as discussed by respondents: A lack of business skills among entrepreneurs and a lack of innovation curriculum in schools. The lack of business skills is connected with a lack of networks through which entrepreneurs discover their own knowledge gaps. Within the realm of basic (not entrepreneurship-specific) education, many respondents pointed out a lack of innovation curriculum and a system that favours employment over entrepreneurship.
The cost of education was also listed as a cause of the follow-on lack in knowledge
and skills, and is particularly acute when combined with structural inequality and the failure of government programs to effectively address it.
The factors listed by multiple respondents include: Innovation is not taught in schools (6), cost of education (5), education system favours employment over entrepreneurship (4), quality of basic education (3), networks (2), structural inequality (2).
Causes of the networks bottleneck
A lack of qualified mentors in the ecosystem was the most commonly mentioned cause of the networks bottleneck, followed closely by structural inequality. In addition, some respondents noted that many lack the knowledge and skills to build and use networks of other entrepreneurs. Finally, respondents cite rivalry/trust issues, as well as and a failure of government programs to connect entrepreneurs with appropriate mentors.
The factors identified by multiple respondents include: Lack of mentors (6), structural inequality (4), trust/rivalry (2), knowledge and skills (3).
Figure 15: Structural causes of bottlenecks
Causes of the regulation-and-red-tape bottleneck
Almost all respondents who identified the regulation-and-red-tape bottleneck cited the burden that small businesses bear when trying to operate in a regulatory environment designed for large firms. Labour laws and short-term policy-planning horizons were also listed as underlying factors in the regulation-and-red-tape bottleneck.Factors identified by multiple
respondents include: Regulatory environment designed for large firms (5) and labour laws (2).
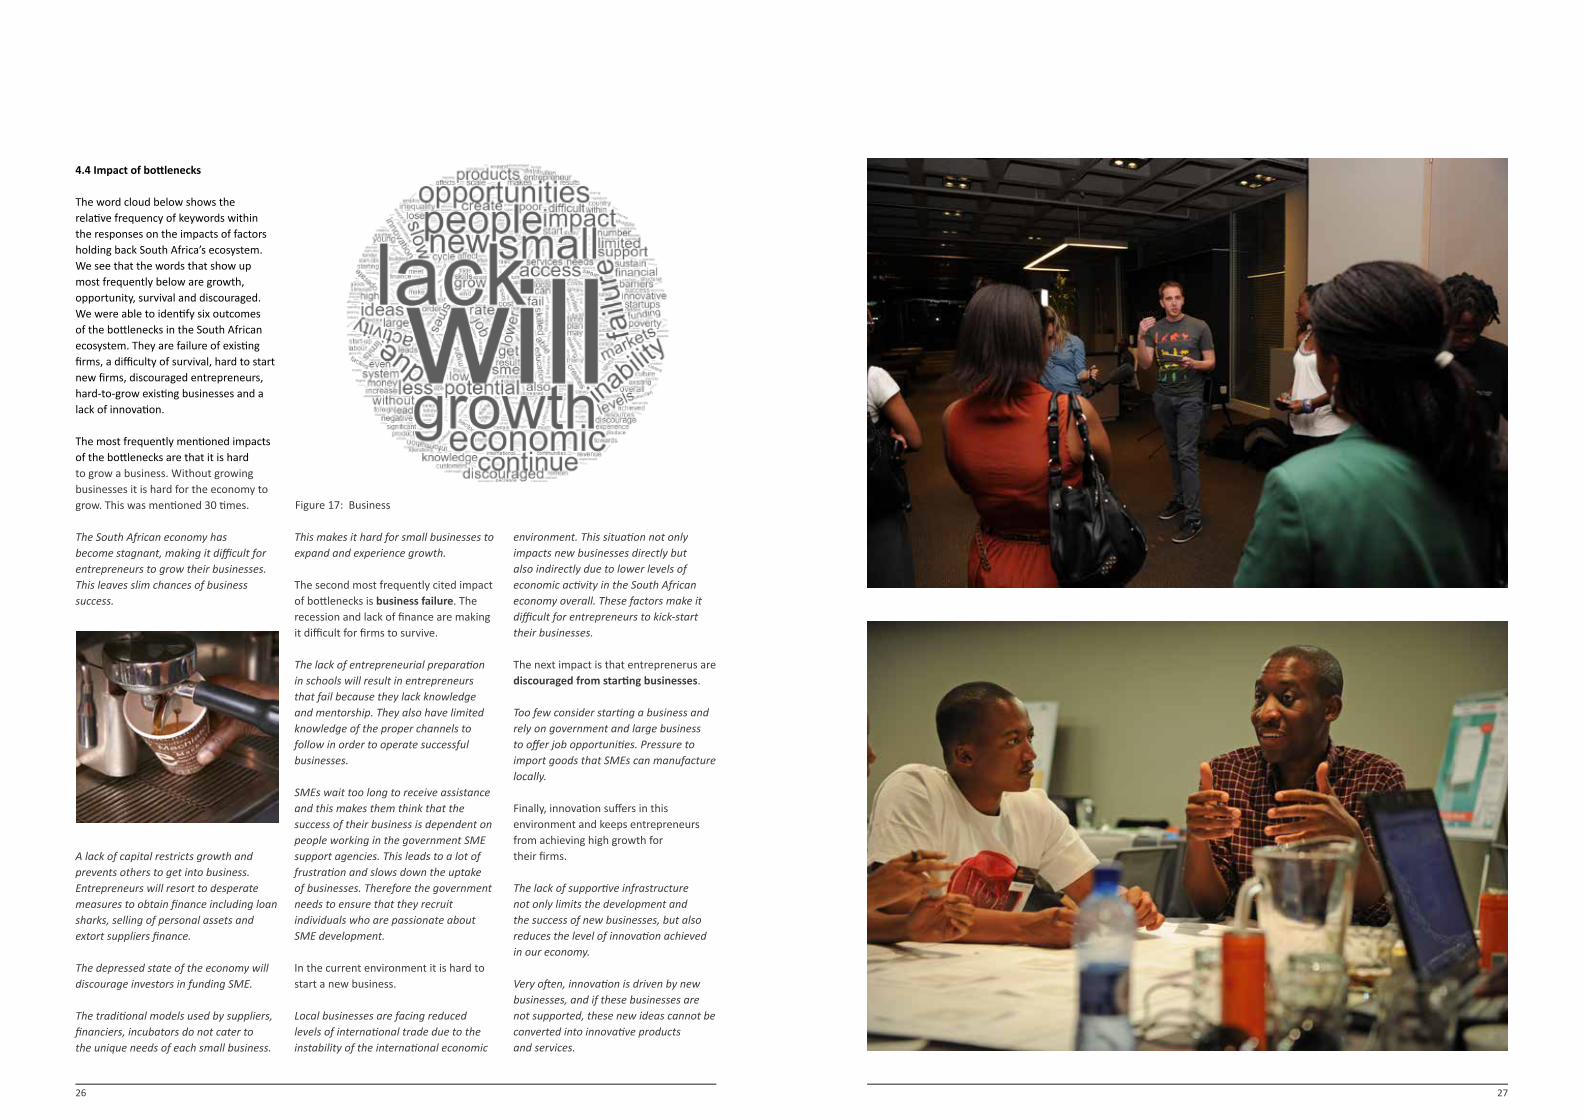
The causal map below depicts the relationships identified through survey responses.
Four causal factors were present across survey responses and each impacted multiple ecosystem bottlenecks. The first is structural inequality, which respondents identified as a causal factor
in lack of skills and education, networks, and directly to access to finance and access to markets. A second causal factor is cultural: Entrepreneurship is perceived as risky. This influences the willingness to finance new businesses as well as those businesses access to markets.
A third factor is also cultural: innovation is undervalued. This results in skills and education that do not adequately support the startup and growth of businesses. Finally, the dominance of large firms contributes to an environment where red tape impedes the functioning of new market entrants and smaller firms, as well as influencing the structures that determine financial and market access.
Responses also revealed a causal relationship between bottlenecks: A lack of skills impacts both access to finance and access to markets, education impacts access to finance, availability of networks impacts access to finance and access to markets, and regulation and red tape impact access to finance and access to markets.
Figure 16: Causal map: Entrepreneurship ecosystem bottlenecks and their underlying causal factors
26 27
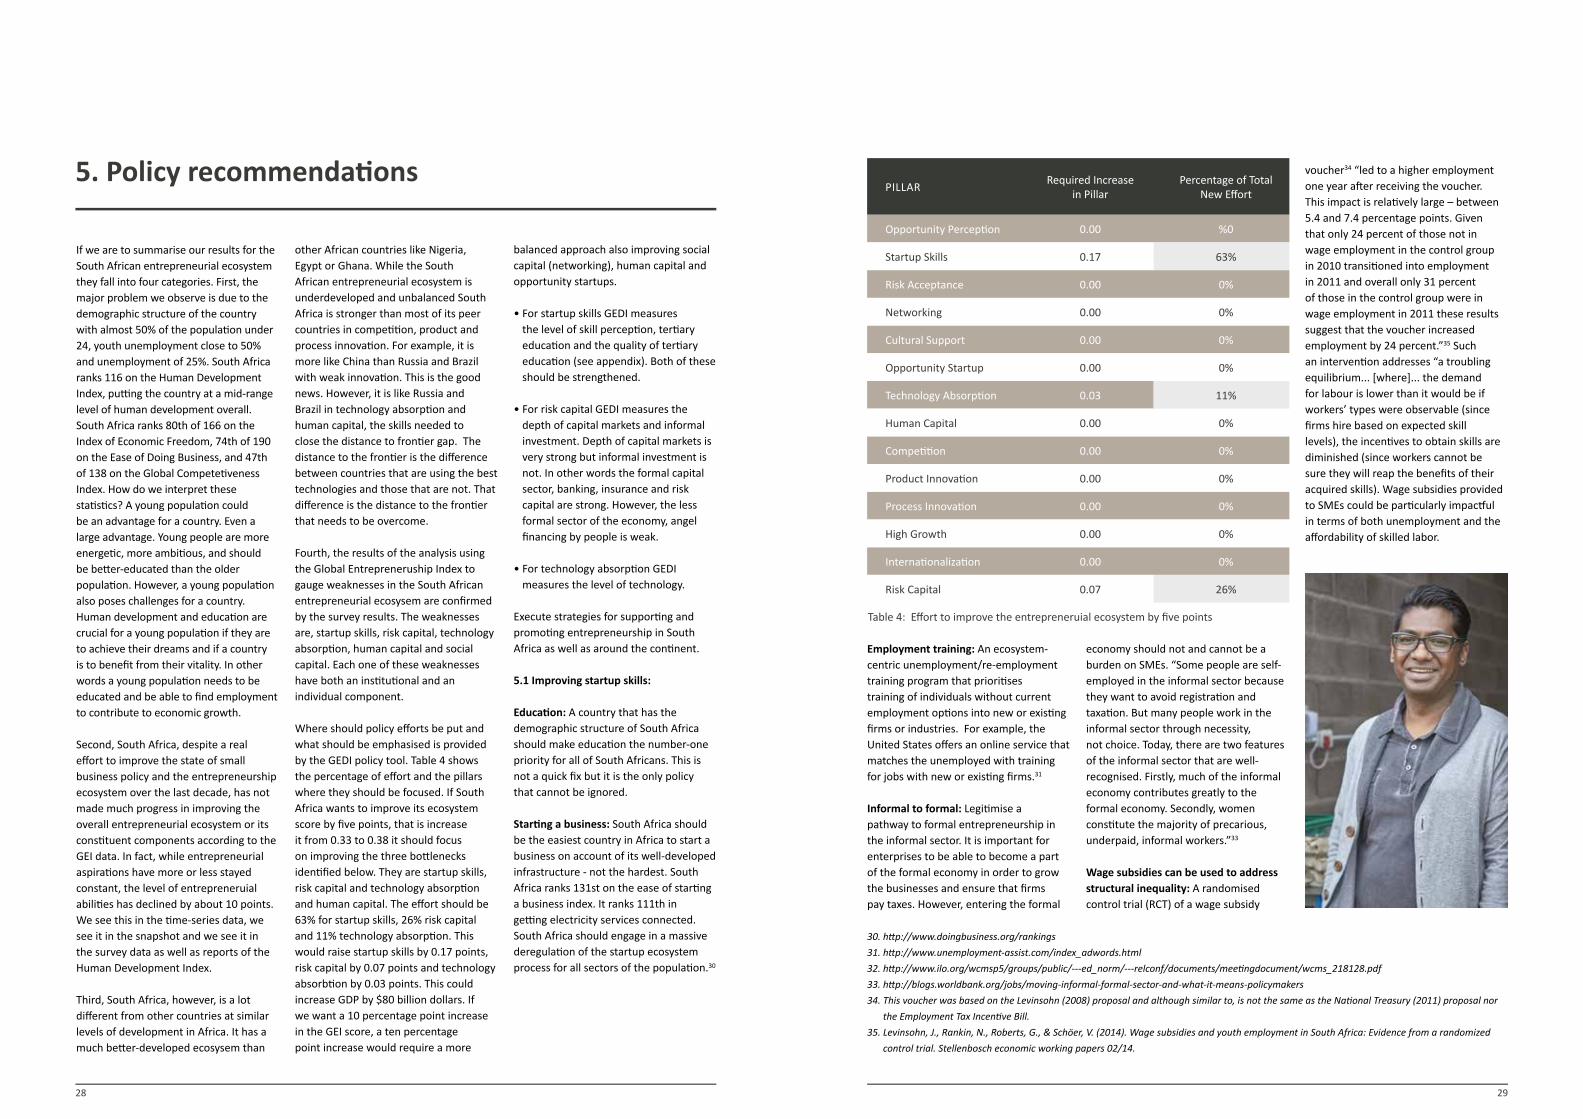
4.4 Impact of bottlenecks
The word cloud below shows the relative frequency of keywords within the responses on the impacts of factors holding back South Africa’s ecosystem. We see that the words that show up most frequently below are growth, opportunity, survival and discouraged. We were able to identify six outcomes of the bottlenecks in the South African ecosystem. They are failure of existing firms, a difficulty of survival, hard to start new firms, discouraged entrepreneurs, hard-to-grow existing businesses and a lack of innovation.
The most frequently mentioned impacts of the bottlenecks are that it is hard to grow a business. Without growing businesses it is hard for the economy to grow. This was mentioned 30 times.
The South African economy has become stagnant, making it difficult for entrepreneurs to grow their businesses. This leaves slim chances of business success.
A lack of capital restricts growth and prevents others to get into business. Entrepreneurs will resort to desperate measures to obtain finance including loan sharks, selling of personal assets and extort suppliers finance.
The depressed state of the economy will discourage investors in funding SME.
The traditional models used by suppliers, financiers, incubators do not cater to the unique needs of each small business.
This makes it hard for small businesses to expand and experience growth.
The second most frequently cited impact of bottlenecks is business failure. The recession and lack of finance are making it difficult for firms to survive.
The lack of entrepreneurial preparation in schools will result in entrepreneurs that fail because they lack knowledge and mentorship. They also have limited knowledge of the proper channels to follow in order to operate successful businesses.
SMEs wait too long to receive assistance and this makes them think that the success of their business is dependent on people working in the government SME support agencies. This leads to a lot of frustration and slows down the uptake of businesses. Therefore the government needs to ensure that they recruit individuals who are passionate about SME development.
In the current environment it is hard to start a new business.
Local businesses are facing reduced levels of international trade due to the instability of the international economic
environment. This situation not only impacts new businesses directly but also indirectly due to lower levels of economic activity in the South African economy overall. These factors make it difficult for entrepreneurs to kick-start their businesses.
The next impact is that entreprenerus are discouraged from starting businesses.
Too few consider starting a business and rely on government and large business to offer job opportunities. Pressure to import goods that SMEs can manufacture locally.
Finally, innovation suffers in this environment and keeps entrepreneurs from achieving high growth for their firms.
The lack of supportive infrastructure not only limits the development and the success of new businesses, but also reduces the level of innovation achieved in our economy.
Very often, innovation is driven by new businesses, and if these businesses are not supported, these new ideas cannot be converted into innovative products and services.
Figure 17: Business
28 29
5. Policy recommendations
If we are to summarise our results for the South African entrepreneurial ecosystem they fall into four categories. First, the major problem we observe is due to the demographic structure of the country with almost 50% of the population under 24, youth unemployment close to 50% and unemployment of 25%. South Africa ranks 116 on the Human Development Index, putting the country at a mid-range level of human development overall. South Africa ranks 80th of 166 on the Index of Economic Freedom, 74th of 190 on the Ease of Doing Business, and 47th of 138 on the Global Competetiveness Index. How do we interpret these statistics? A young population could be an advantage for a country. Even a large advantage. Young people are more energetic, more ambitious, and should be better-educated than the older population. However, a young population also poses challenges for a country. Human development and education are crucial for a young population if they are to achieve their dreams and if a country is to benefit from their vitality. In other words a young population needs to be educated and be able to find employment to contribute to economic growth.
Second, South Africa, despite a real effort to improve the state of small business policy and the entrepreneurship ecosystem over the last decade, has not made much progress in improving the overall entrepreneurial ecosystem or its constituent components according to the GEI data. In fact, while entrepreneurial aspirations have more or less stayed constant, the level of entrepreneruial abilities has declined by about 10 points. We see this in the time-series data, we see it in the snapshot and we see it in the survey data as well as reports of the Human Development Index.
Third, South Africa, however, is a lot different from other countries at similar levels of development in Africa. It has a much better-developed ecosysem than
other African countries like Nigeria, Egypt or Ghana. While the South African entrepreneurial ecosystem is underdeveloped and unbalanced South Africa is stronger than most of its peer countries in competition, product and process innovation. For example, it is more like China than Russia and Brazil with weak innovation. This is the good news. However, it is like Russia and Brazil in technology absorption and human capital, the skills needed to close the distance to frontier gap. The distance to the frontier is the difference between countries that are using the best technologies and those that are not. That difference is the distance to the frontier that needs to be overcome.
Fourth, the results of the analysis using the Global Entrepreneruship Index to gauge weaknesses in the South African entrepreneurial ecosysem are confirmed by the survey results. The weaknesses are, startup skills, risk capital, technology absorption, human capital and social capital. Each one of these weaknesses have both an institutional and an individual component.
Where should policy efforts be put and what should be emphasised is provided by the GEDI policy tool. Table 4 shows the percentage of effort and the pillars where they should be focused. If South Africa wants to improve its ecosystem score by five points, that is increase it from 0.33 to 0.38 it should focus on improving the three bottlenecks identified below. They are startup skills, risk capital and technology absorption and human capital. The effort should be 63% for startup skills, 26% risk capital and 11% technology absorption. This would raise startup skills by 0.17 points, risk capital by 0.07 points and technology absorbtion by 0.03 points. This could increase GDP by $80 billion dollars. If we want a 10 percentage point increase in the GEI score, a ten percentage point increase would require a more
balanced approach also improving social capital (networking), human capital and opportunity startups.
• For startup skills GEDI measures the level of skill perception, tertiary education and the quality of tertiary education (see appendix). Both of these should be strengthened.
• For risk capital GEDI measures the depth of capital markets and informal investment. Depth of capital markets is very strong but informal investment is not. In other words the formal capital sector, banking, insurance and risk capital are strong. However, the less formal sector of the economy, angel financing by people is weak.
• For technology absorption GEDI measures the level of technology.
Execute strategies for supporting and promoting entrepreneurship in South Africa as well as around the continent.
5.1 Improving startup skills:
Education: A country that has the demographic structure of South Africa should make education the number-one priority for all of South Africans. This is not a quick fix but it is the only policy that cannot be ignored.
Starting a business: South Africa should be the easiest country in Africa to start a business on account of its well-developed infrastructure - not the hardest. South Africa ranks 131st on the ease of starting a business index. It ranks 111th in getting electricity services connected. South Africa should engage in a massive deregulation of the startup ecosystem process for all sectors of the population.30
Employment training: An ecosystem-centric unemployment/re-employment training program that prioritises training of individuals without current employment options into new or existing firms or industries. For example, the United States offers an online service that matches the unemployed with training for jobs with new or existing firms.31
Informal to formal: Legitimise a pathway to formal entrepreneurship in the informal sector. It is important for enterprises to be able to become a part of the formal economy in order to grow the businesses and ensure that firms pay taxes. However, entering the formal
economy should not and cannot be a burden on SMEs. “Some people are self-employed in the informal sector because they want to avoid registration and taxation. But many people work in the informal sector through necessity, not choice. Today, there are two features of the informal sector that are well-recognised. Firstly, much of the informal economy contributes greatly to the formal economy. Secondly, women constitute the majority of precarious, underpaid, informal workers.”33
Wage subsidies can be used to address structural inequality: A randomised control trial (RCT) of a wage subsidy
voucher34 “led to a higher employment one year after receiving the voucher. This impact is relatively large – between 5.4 and 7.4 percentage points. Given that only 24 percent of those not in wage employment in the control group in 2010 transitioned into employment in 2011 and overall only 31 percent of those in the control group were in wage employment in 2011 these results suggest that the voucher increased employment by 24 percent.”35 Such an intervention addresses “a troubling equilibrium... [where]... the demand for labour is lower than it would be if workers’ types were observable (since firms hire based on expected skill levels), the incentives to obtain skills are diminished (since workers cannot be sure they will reap the benefits of their acquired skills). Wage subsidies provided to SMEs could be particularly impactful in terms of both unemployment and the affordability of skilled labor.
30. http://www.doingbusiness.org/rankings
31. http://www.unemployment-assist.com/index_adwords.html
32. http://www.ilo.org/wcmsp5/groups/public/---ed_norm/---relconf/documents/meetingdocument/wcms_218128.pdf
33. http://blogs.worldbank.org/jobs/moving-informal-formal-sector-and-what-it-means-policymakers
34. This voucher was based on the Levinsohn (2008) proposal and although similar to, is not the same as the National Treasury (2011) proposal nor
the Employment Tax Incentive Bill.
35. Levinsohn, J., Rankin, N., Roberts, G., & Schöer, V. (2014). Wage subsidies and youth employment in South Africa: Evidence from a randomized
control trial. Stellenbosch economic working papers 02/14.
PILLAR Required Increase in Pillar
Percentage of TotalNew Effort
Opportunity Perception 0.00 %0
Startup Skills 0.17 63%
Risk Acceptance 0.00 0%
Networking 0.00 0%
Cultural Support 0.00 0%
Opportunity Startup 0.00 0%
Technology Absorption 0.03 11%
Human Capital 0.00 0%
Competition 0.00 0%
Product Innovation 0.00 0%
Process Innovation 0.00 0%
High Growth 0.00 0%
Internationalization 0.00 0%
Risk Capital 0.07 26%
Table 4: Effort to improve the entrepreneruial ecosystem by five points
30 31
5.2 Banking and finance for all:
Mobile banking: While South Africa has a very well-developed banking system, it has a weakness that is easy to address. First, most of the country does not have access to formal banking while other African countries made a serious effort to introduce mobile banking. In 2004 in Kenya, one of the poorest countries in the world, people traveled about 200 kilometres to deliver or pick up cash, or relied on friends or family to make the journey. Less than ten years later, in 2014, more than 84 percent of Kenyan mobile-phone users, including many of the very poor, were able to use their mobile phones to transfer money to each other, to pay their bills, and to pay at stores. A company figured out how to ignite a multi-sided platform in trying circumstances, to massively reduced important market frictions (Evan and Schmalensee, 162.) Research shows that “m-banking services are valued by poor people in South Africa and, for the WIZZIT users surveyed, are more affordable than traditional banking.”36 Mobile banking took off in Côte d’Ivoire, Ghana, Kenya, Rwanda, Somaliland, Uganda, Tanzania, and Zimbabwe. South Africa is now catching up but this should be accelerated.37
Crowd funding: The second modern approach to entrepreneurial finance is crowd funding. However, this depends not only on banking but also on being connected to the internet. While this report will not go into the details for crowd funding South Africa should take the lead of the United Kingdom and
adopt a hands-off regulatory approach to all crowd-funding donation, debt, equity. Once the system is up and running regulation can always be introduced afterwards.38
Reduce lending risk among SME borrowers: Evidence from India shows that “SME borrowers, who are regularly called either by a single assigned relationship manager, or by one manager randomly selected from a small team of managers, show much better repayment behaviour and greater satisfaction with the bank services than borrowers who either receive no follow up or only receive follow up calls from the bank when they are delinquent.”39
The use of credit scores can reduce lending friction for SMEs: Evidence from Colombia shows that “Credit scores improved the productivity of credit committees, reduced managerial involvement in the loan-approval process, and increased the profitability of lending to SMEs.”40 This could be particularly important in reducing structural inequality through removing some subjectivity from lending processes.
5.3 Technology absorption:
Improve digital technologies: We live in a digital age. Any country that does not embrace the digital age will fall behind the technological frontier and will not be able to compete in the global economy. South Africa ranks 65th globally in information technologies according to the World Economic Forum.
Although the country is perceived by South African business executives to be performing relatively well in terms of its regulatory and political environment, its innovation and business environment is rated significantly worse and, in addition, shows strong signs of deterioration—especially regarding technology and venture capital availability, government procurement of the latest technologies, and days as well as procedures to start a business… South Africa’s digital transformation is mostly business-driven, as the country notably performs best in business usage (32nd), followed by individual usage (77th), followed by government usage (105th),” said the World Economic Forum in its note on South Africa.41
Increase digital inclusion: South Africa must reverse this trend and make digital technologies, broadband, smartphones, mobile phones available to the whole population and make it available quickly, cheaply and easy to use. The 2014 UK Digital Inclusion Strategy states that “helping more people to go online can also help tackle wider social issues, support economic growth and close equality gaps.”42
Research has identified four key processes in the institutionalisation of digital inclusion projects: “getting symbolic acceptance by the community; stimulating valuable social activity in relevant social groups; generating linkage to viable revenue streams; and enrolling government support. The paper concludes with some theoretical, methodological and policy implications.”43
36. Gautam Ivatury and Mark Pickens (2006) “Mobile-Phone Banking and Low-Income Customers Evidence from South Africa.” Consultative Group to
Assist the Poor, The World Bank and United Nations Foundation https://www.cgap.org/sites/default/files/CGAP-Mobile-Phone-Banking-and-Low-
Income-Customers-Evidence-from-South-Africa-Jan-2006.pdf
37. ttp://www.howwemadeitinafrica.com/mobile-banking-catching-on-in-south-africa/
38. http://southafrica.smetoolkit.org/sa/en/content/en/56582/What-is-crowdfunding-
39. Antoinette Schoar, “The Personal Side of Relationship Banking.” Working Paper
40. Paravisini, Daniel, and Antoinette Schoar. “The Incentive Effect of IT: Randomized Evidence from Credit Committees.” NBER Working Paper No.
19303, August 2013.
41. http://reports.weforum.org/global-information-technology-report-2016/country-and-regional-trends-from-the-nri/
42. GOV.UK., Policy Paper: Government Digital Inclusion Strategy. https://www.gov.uk/government/publications/government-digital-inclusion-
strategy/government-digital-inclusion-strategy, 2014.
43. Madon, S., Reinhard, N., Roode, D., & Walsham, G. (2009). Digital inclusion projects in developing countries: Processes of institutionalization.
Information Technology for Development, 15(2), 95-107.
44. Etoundi, R. A., Onana, F. S. M., Olle, G. D. O., & Eteme, A. A. (2016). Development of the Digital Economy in Cameroon: Challenges and
Perspectives. The Electronic Journal of Information Systems in Developing Countries. https://144.214.55.140/Ojs2/index.php/ejisdc/article/
viewFile/1774/656
45. Choudary, S. P., Van Alstyne, M. W., & Parker, G. G. (2016). Platform revolution: How networked markets are transforming the economy--and how
to make them work for you. WW Norton & Company.
Encourage digital entrepreneurs: South Africa must enable digital entrepreneurship at all levels of society.
Empower digital users: It must become easier for South Africans to use digital technologies in their daily lives.As part of a strategic implementation for the digital economy in Cameroon, researchers suggest the following government actions, which apply both to digital entrepreneurs and to digital users:
• Accelerate ICT network investment by changing tax policies to stimulate investment across all geographic areas and technologies.
• Continue to rely on market forces to develop and expand broadband networks and facilities.
• Ensure that broadband access initiatives in rural areas where market forces are insufficient by working with non-profits and public organisations.
• Promote digital literacy as an essential aspect of skills development.
• Harness the private sector to increase e-business adoption among SMEs.
• Reduce regulatory barriers to ensure efficient, secure and productive use of digital technologies by companies.44
Build digital platforms: South Africa is in a unique position to become a leader in the platform revolution.45 South Africa’s inequality presents an opportunity to create and harness disruptive platforms that provide needed products and services to large underserved populations. This is possible by applying resources from well-developed portions of the ecosystem efficiently through digital platforms that disrupt traditional product and service providers.
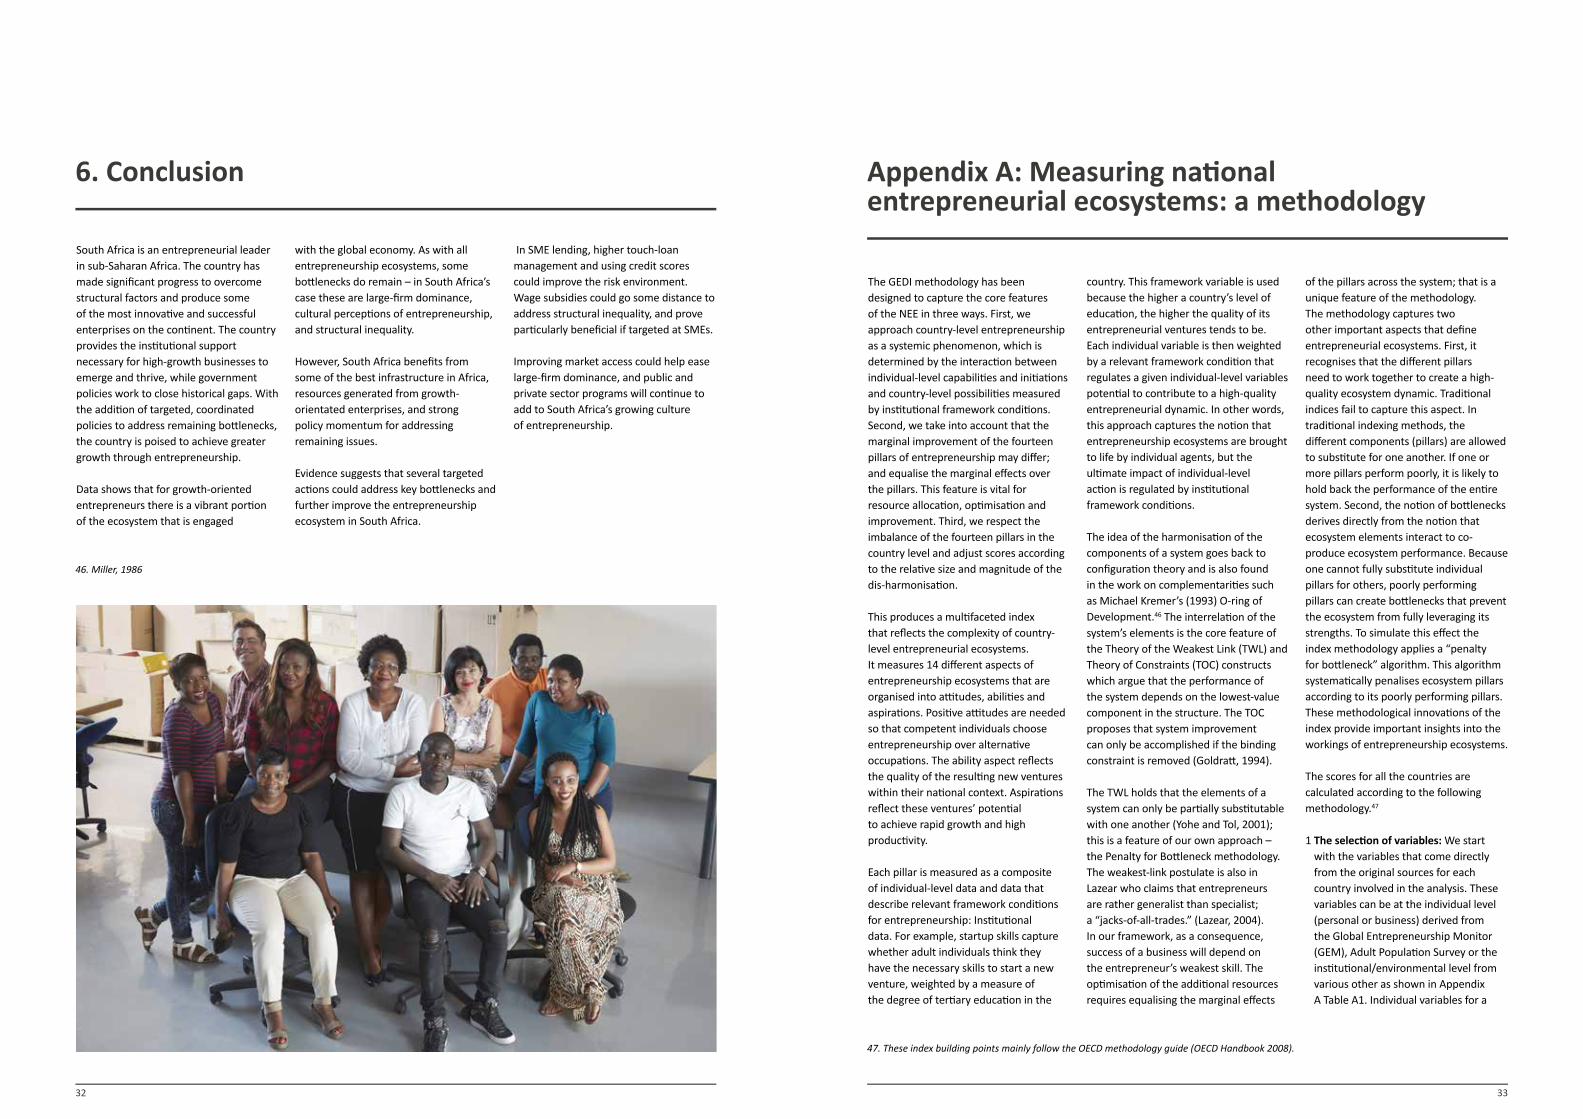
32 33
6. Conclusion
The GEDI methodology has been designed to capture the core features of the NEE in three ways. First, we approach country-level entrepreneurship as a systemic phenomenon, which is determined by the interaction between individual-level capabilities and initiations and country-level possibilities measured by institutional framework conditions. Second, we take into account that the marginal improvement of the fourteen pillars of entrepreneurship may differ; and equalise the marginal effects over the pillars. This feature is vital for resource allocation, optimisation and improvement. Third, we respect the imbalance of the fourteen pillars in the country level and adjust scores according to the relative size and magnitude of the dis-harmonisation.
This produces a multifaceted index that reflects the complexity of country-level entrepreneurial ecosystems. It measures 14 different aspects of entrepreneurship ecosystems that are organised into attitudes, abilities and aspirations. Positive attitudes are needed so that competent individuals choose entrepreneurship over alternative occupations. The ability aspect reflects the quality of the resulting new ventures within their national context. Aspirations reflect these ventures’ potential to achieve rapid growth and high productivity.
Each pillar is measured as a composite of individual-level data and data that describe relevant framework conditions for entrepreneurship: Institutional data. For example, startup skills capture whether adult individuals think they have the necessary skills to start a new venture, weighted by a measure of the degree of tertiary education in the
country. This framework variable is used because the higher a country’s level of education, the higher the quality of its entrepreneurial ventures tends to be. Each individual variable is then weighted by a relevant framework condition that regulates a given individual-level variables potential to contribute to a high-quality entrepreneurial dynamic. In other words, this approach captures the notion that entrepreneurship ecosystems are brought to life by individual agents, but the ultimate impact of individual-level action is regulated by institutional framework conditions.
The idea of the harmonisation of the components of a system goes back to configuration theory and is also found in the work on complementarities such as Michael Kremer’s (1993) O-ring of Development.46 The interrelation of the system’s elements is the core feature of the Theory of the Weakest Link (TWL) and Theory of Constraints (TOC) constructs which argue that the performance of the system depends on the lowest-value component in the structure. The TOC proposes that system improvement can only be accomplished if the binding constraint is removed (Goldratt, 1994).
The TWL holds that the elements of a system can only be partially substitutable with one another (Yohe and Tol, 2001); this is a feature of our own approach – the Penalty for Bottleneck methodology. The weakest-link postulate is also in Lazear who claims that entrepreneurs are rather generalist than specialist; a “jacks-of-all-trades.” (Lazear, 2004). In our framework, as a consequence, success of a business will depend on the entrepreneur’s weakest skill. The optimisation of the additional resources requires equalising the marginal effects
of the pillars across the system; that is a unique feature of the methodology.The methodology captures two other important aspects that define entrepreneurial ecosystems. First, it recognises that the different pillars need to work together to create a high-quality ecosystem dynamic. Traditional indices fail to capture this aspect. In traditional indexing methods, the different components (pillars) are allowed to substitute for one another. If one or more pillars perform poorly, it is likely to hold back the performance of the entire system. Second, the notion of bottlenecks derives directly from the notion that ecosystem elements interact to co-produce ecosystem performance. Because one cannot fully substitute individual pillars for others, poorly performing pillars can create bottlenecks that prevent the ecosystem from fully leveraging its strengths. To simulate this effect the index methodology applies a “penalty for bottleneck” algorithm. This algorithm systematically penalises ecosystem pillars according to its poorly performing pillars. These methodological innovations of the index provide important insights into the workings of entrepreneurship ecosystems.
The scores for all the countries are calculated according to the following methodology.47
1 The selection of variables: We start with the variables that come directly from the original sources for each country involved in the analysis. These variables can be at the individual level (personal or business) derived from the Global Entrepreneurship Monitor (GEM), Adult Population Survey or the institutional/environmental level from various other as shown in Appendix A Table A1. Individual variables for a
46. Miller, 1986
47. These index building points mainly follow the OECD methodology guide (OECD Handbook 2008).
South Africa is an entrepreneurial leader in sub-Saharan Africa. The country has made significant progress to overcome structural factors and produce some of the most innovative and successful enterprises on the continent. The country provides the institutional support necessary for high-growth businesses to emerge and thrive, while government policies work to close historical gaps. With the addition of targeted, coordinated policies to address remaining bottlenecks, the country is poised to achieve greater growth through entrepreneurship.
Data shows that for growth-oriented entrepreneurs there is a vibrant portion of the ecosystem that is engaged
with the global economy. As with all entrepreneurship ecosystems, some bottlenecks do remain – in South Africa’s case these are large-firm dominance, cultural perceptions of entrepreneurship, and structural inequality.
However, South Africa benefits from some of the best infrastructure in Africa, resources generated from growth-orientated enterprises, and strong policy momentum for addressing remaining issues.
Evidence suggests that several targeted actions could address key bottlenecks and further improve the entrepreneurship ecosystem in South Africa.
In SME lending, higher touch-loan management and using credit scores could improve the risk environment. Wage subsidies could go some distance to address structural inequality, and prove particularly beneficial if targeted at SMEs.
Improving market access could help ease large-firm dominance, and public and private sector programs will continue to add to South Africa’s growing culture of entrepreneurship.
Appendix A: Measuring national entrepreneurial ecosystems: a methodology
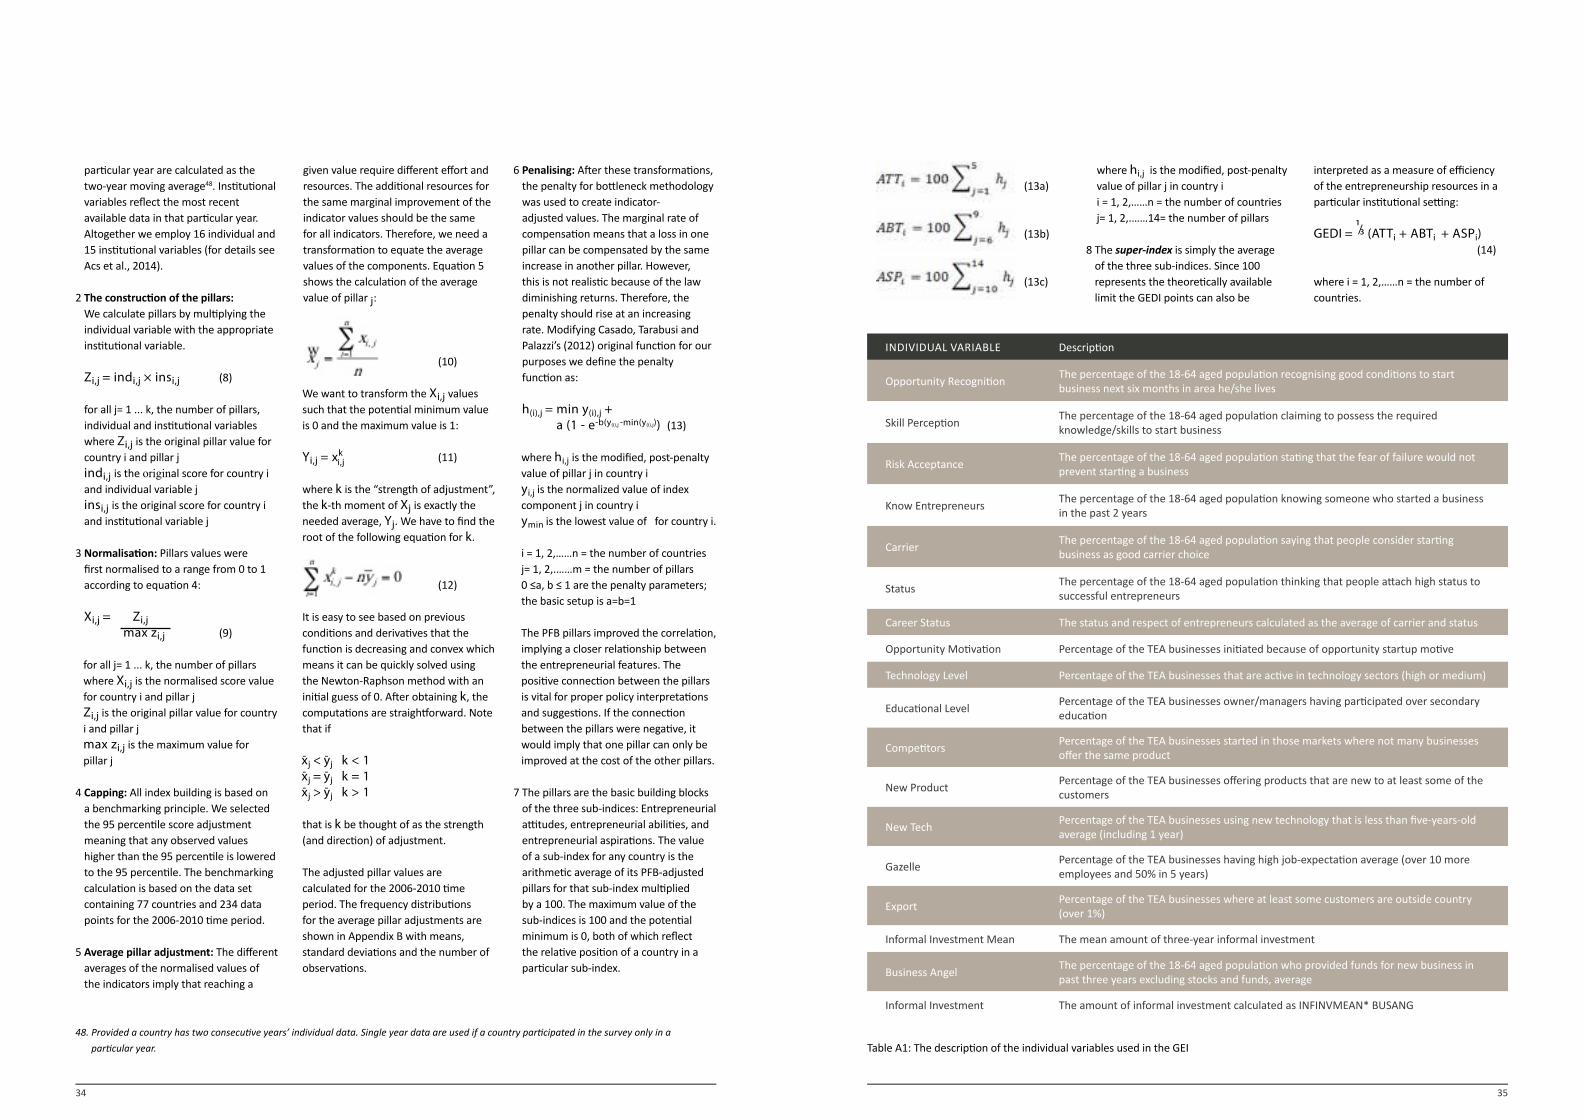
34 35
(13a)
(13b)
(13c)
where hi,j is the modified, post-penalty value of pillar j in country i i = 1, 2,……n = the number of countries j= 1, 2,.……14= the number of pillars
8 The super-index is simply the average of the three sub-indices. Since 100 represents the theoretically available limit the GEDI points can also be
interpreted as a measure of efficiency of the entrepreneurship resources in a particular institutional setting: GEDI = ¹/³ (ATTi + ABTi + ASPi) (14) where i = 1, 2,……n = the number of countries.
INDIVIDUAL VARIABLE Description
Opportunity Recognition The percentage of the 18-64 aged population recognising good conditions to start business next six months in area he/she lives
Skill Perception The percentage of the 18-64 aged population claiming to possess the required knowledge/skills to start business
Risk Acceptance The percentage of the 18-64 aged population stating that the fear of failure would not prevent starting a business
Know Entrepreneurs The percentage of the 18-64 aged population knowing someone who started a business in the past 2 years
Carrier The percentage of the 18-64 aged population saying that people consider starting business as good carrier choice
Status The percentage of the 18-64 aged population thinking that people attach high status to successful entrepreneurs
Career Status The status and respect of entrepreneurs calculated as the average of carrier and status
Opportunity Motivation Percentage of the TEA businesses initiated because of opportunity startup motive
Technology Level Percentage of the TEA businesses that are active in technology sectors (high or medium)
Educational Level Percentage of the TEA businesses owner/managers having participated over secondary education
Competitors Percentage of the TEA businesses started in those markets where not many businesses offer the same product
New Product Percentage of the TEA businesses offering products that are new to at least some of the customers
New Tech Percentage of the TEA businesses using new technology that is less than five-years-old average (including 1 year)
Gazelle Percentage of the TEA businesses having high job-expectation average (over 10 more employees and 50% in 5 years)
Export Percentage of the TEA businesses where at least some customers are outside country (over 1%)
Informal Investment Mean The mean amount of three-year informal investment
Business Angel The percentage of the 18-64 aged population who provided funds for new business in past three years excluding stocks and funds, average
Informal Investment The amount of informal investment calculated as INFINVMEAN* BUSANG
Table A1: The description of the individual variables used in the GEI
particular year are calculated as the two-year moving average48. Institutional variables reflect the most recent available data in that particular year. Altogether we employ 16 individual and 15 institutional variables (for details see Acs et al., 2014).
2 The construction of the pillars: We calculate pillars by multiplying the individual variable with the appropriate institutional variable. Zi,j = indi,j × insi,j (8) for all j= 1 ... k, the number of pillars, individual and institutional variables where Zi,j is the original pillar value for country i and pillar j indi,j is the original score for country i and individual variable j insi,j is the original score for country i and institutional variable j
3 Normalisation: Pillars values were first normalised to a range from 0 to 1 according to equation 4: Xi,j = Zi,j
max zi,j (9) for all j= 1 ... k, the number of pillars
where Xi,j is the normalised score value for country i and pillar j Zi,j is the original pillar value for country i and pillar j max zi,j is the maximum value for pillar j
4 Capping: All index building is based on a benchmarking principle. We selected the 95 percentile score adjustment meaning that any observed values higher than the 95 percentile is lowered to the 95 percentile. The benchmarking calculation is based on the data set containing 77 countries and 234 data points for the 2006-2010 time period.
5 Average pillar adjustment: The different averages of the normalised values of the indicators imply that reaching a
given value require different effort and resources. The additional resources for the same marginal improvement of the indicator values should be the same for all indicators. Therefore, we need a transformation to equate the average values of the components. Equation 5 shows the calculation of the average value of pillar j:
(10) We want to transform the Xi,j values
such that the potential minimum value is 0 and the maximum value is 1: Yi,j = xk
i,j (11) where k is the “strength of adjustment”, the k-th moment of Xj is exactly the needed average, Yj. We have to find the root of the following equation for k.
(12)
It is easy to see based on previous conditions and derivatives that the function is decreasing and convex which means it can be quickly solved using the Newton-Raphson method with an initial guess of 0. After obtaining k, the computations are straightforward. Note that if xj < yj k < 1 xj = yj k = 1 xj > yj k > 1 that is k be thought of as the strength (and direction) of adjustment. The adjusted pillar values are calculated for the 2006-2010 time period. The frequency distributions for the average pillar adjustments are shown in Appendix B with means, standard deviations and the number of observations.
6 Penalising: After these transformations, the penalty for bottleneck methodology was used to create indicator-adjusted values. The marginal rate of compensation means that a loss in one pillar can be compensated by the same increase in another pillar. However, this is not realistic because of the law diminishing returns. Therefore, the penalty should rise at an increasing rate. Modifying Casado, Tarabusi and Palazzi’s (2012) original function for our purposes we define the penalty function as: h(i),j = min y(i),j +
a (1 - e-b(y(i),j -min(y(i),j)) (13)
where hi,j is the modified, post-penalty value of pillar j in country i yi,j is the normalized value of index component j in country i ymin is the lowest value of for country i.
i = 1, 2,……n = the number of countries j= 1, 2,.……m = the number of pillars 0 ≤a, b ≤ 1 are the penalty parameters; the basic setup is a=b=1 The PFB pillars improved the correlation, implying a closer relationship between the entrepreneurial features. The positive connection between the pillars is vital for proper policy interpretations and suggestions. If the connection between the pillars were negative, it would imply that one pillar can only be improved at the cost of the other pillars.
7 The pillars are the basic building blocks of the three sub-indices: Entrepreneurial attitudes, entrepreneurial abilities, and entrepreneurial aspirations. The value of a sub-index for any country is the arithmetic average of its PFB-adjusted pillars for that sub-index multiplied by a 100. The maximum value of the sub-indices is 100 and the potential minimum is 0, both of which reflect the relative position of a country in a particular sub-index.
48. Provided a country has two consecutive years’ individual data. Single year data are used if a country participated in the survey only in a
particular year.
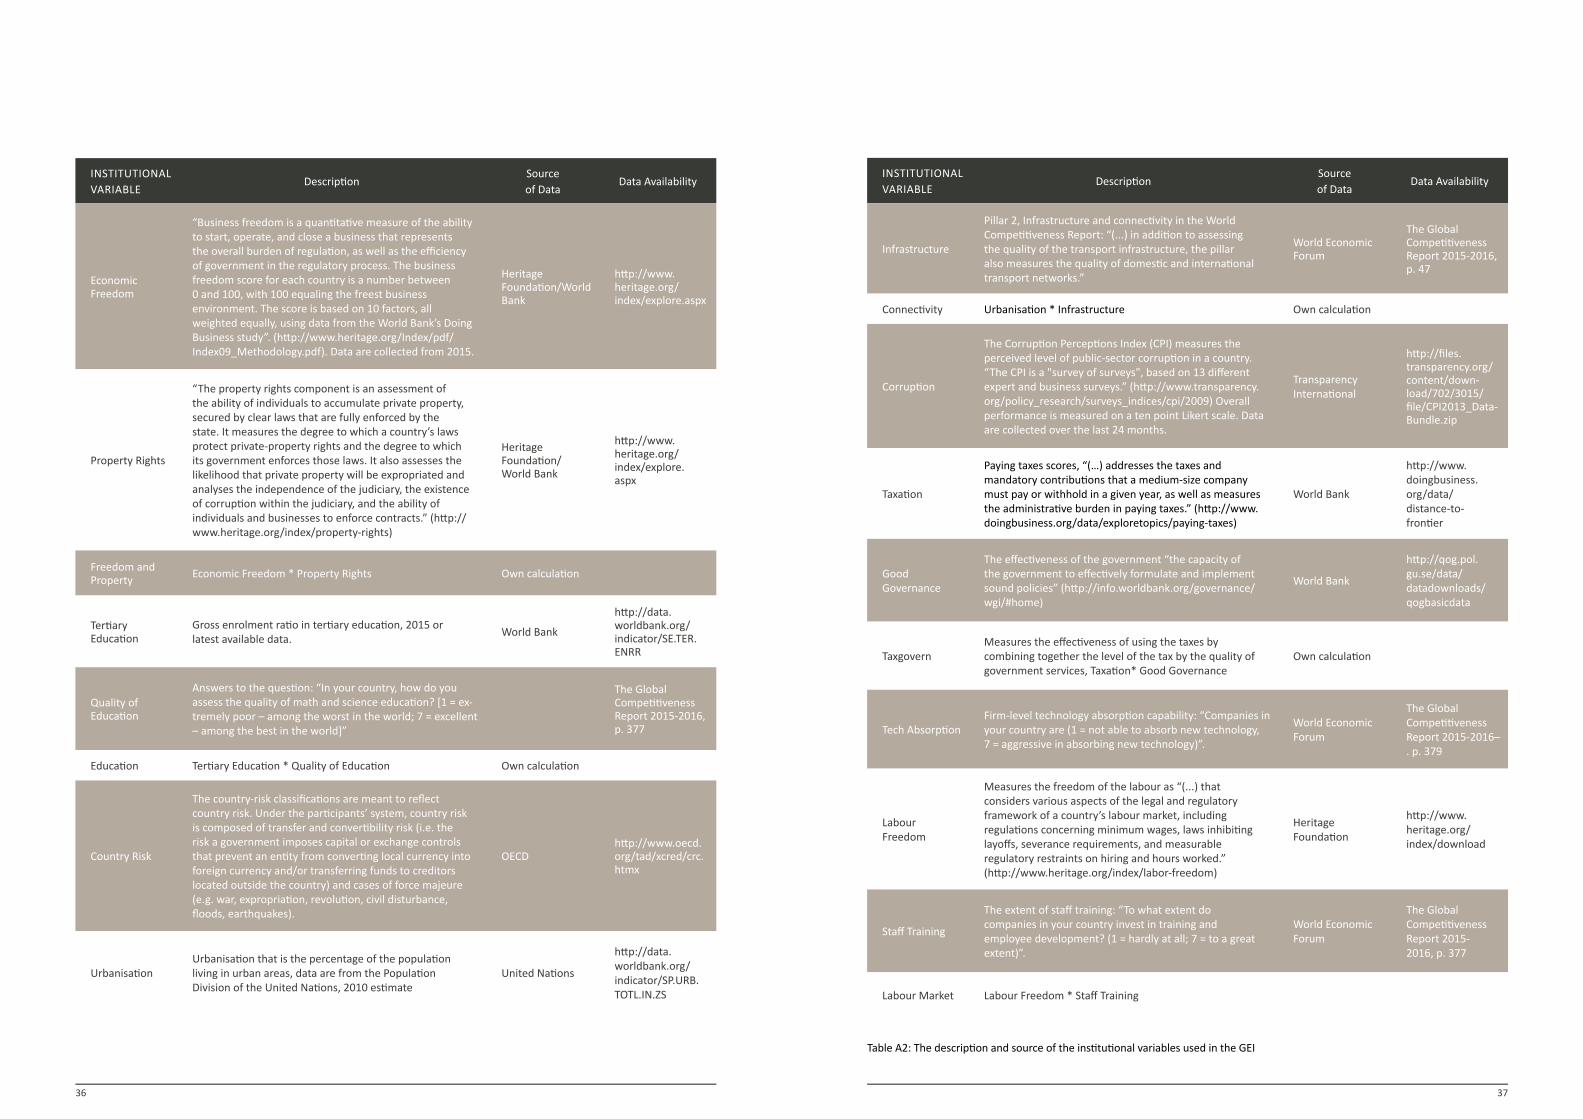
36 37
INSTITUTIONALVARIABLE
DescriptionSourceof Data
Data Availability
EconomicFreedom
“Business freedom is a quantitative measure of the ability to start, operate, and close a business that represents the overall burden of regulation, as well as the efficiency of government in the regulatory process. The business freedom score for each country is a number between 0 and 100, with 100 equaling the freest business environment. The score is based on 10 factors, all weighted equally, using data from the World Bank’s Doing Business study”. (http://www.heritage.org/Index/pdf/Index09_Methodology.pdf). Data are collected from 2015.
Heritage Foundation/World Bank
http://www.heritage.org/index/explore.aspx
Property Rights
“The property rights component is an assessment of the ability of individuals to accumulate private property, secured by clear laws that are fully enforced by the state. It measures the degree to which a country’s laws protect private-property rights and the degree to which its government enforces those laws. It also assesses the likelihood that private property will be expropriated and analyses the independence of the judiciary, the existence of corruption within the judiciary, and the ability of individuals and businesses to enforce contracts.” (http://www.heritage.org/index/property-rights)
Heritage Foundation/World Bank
http://www.heritage.org/index/explore.aspx
Freedom andProperty Economic Freedom * Property Rights Own calculation
TertiaryEducation
Gross enrolment ratio in tertiary education, 2015 or latest available data. World Bank
http://data.worldbank.org/indicator/SE.TER.ENRR
Quality ofEducation
Answers to the question: “In your country, how do you assess the quality of math and science education? [1 = ex-tremely poor – among the worst in the world; 7 = excellent – among the best in the world]”
The Global Competitiveness Report 2015-2016, p. 377
Education Tertiary Education * Quality of Education Own calculation
Country Risk
The country-risk classifications are meant to reflect country risk. Under the participants’ system, country risk is composed of transfer and convertibility risk (i.e. the risk a government imposes capital or exchange controls that prevent an entity from converting local currency into foreign currency and/or transferring funds to creditors located outside the country) and cases of force majeure (e.g. war, expropriation, revolution, civil disturbance, floods, earthquakes).
OECDhttp://www.oecd.org/tad/xcred/crc.htmx
UrbanisationUrbanisation that is the percentage of the population living in urban areas, data are from the Population Division of the United Nations, 2010 estimate
United Nations
http://data.worldbank.org/indicator/SP.URB.TOTL.IN.ZS
Table A2: The description and source of the institutional variables used in the GEI
INSTITUTIONALVARIABLE
DescriptionSourceof Data
Data Availability
Infrastructure
Pillar 2, Infrastructure and connectivity in the World Competitiveness Report: “(...) in addition to assessing the quality of the transport infrastructure, the pillar also measures the quality of domestic and international transport networks.”
World Economic Forum
The Global Competitiveness Report 2015-2016, p. 47
Connectivity Urbanisation * Infrastructure Own calculation
Corruption
The Corruption Perceptions Index (CPI) measures the perceived level of public-sector corruption in a country. “The CPI is a "survey of surveys", based on 13 different expert and business surveys.” (http://www.transparency.org/policy_research/surveys_indices/cpi/2009) Overall performance is measured on a ten point Likert scale. Data are collected over the last 24 months.
Transparency International
http://files.transparency.org/content/down-load/702/3015/file/CPI2013_Data-Bundle.zip
Taxation
Paying taxes scores, “(…) addresses the taxes and mandatory contributions that a medium-size company must pay or withhold in a given year, as well as measures the administrative burden in paying taxes.” (http://www.doingbusiness.org/data/exploretopics/paying-taxes)
World Bank
http://www.doingbusiness.org/data/distance-to-frontier
GoodGovernance
The effectiveness of the government “the capacity of the government to effectively formulate and implement sound policies” (http://info.worldbank.org/governance/wgi/#home)
World Bank
http://qog.pol.gu.se/data/datadownloads/qogbasicdata
TaxgovernMeasures the effectiveness of using the taxes by combining together the level of the tax by the quality of government services, Taxation* Good Governance
Own calculation
Tech AbsorptionFirm-level technology absorption capability: “Companies in your country are (1 = not able to absorb new technology, 7 = aggressive in absorbing new technology)”.
World Economic Forum
The Global Competitiveness Report 2015-2016–. p. 379
LabourFreedom
Measures the freedom of the labour as “(...) that considers various aspects of the legal and regulatory framework of a country’s labour market, including regulations concerning minimum wages, laws inhibiting layoffs, severance requirements, and measurable regulatory restraints on hiring and hours worked.” (http://www.heritage.org/index/labor-freedom)
Heritage Foundation
http://www.heritage.org/index/download
Staff Training
The extent of staff training: “To what extent do companies in your country invest in training and employee development? (1 = hardly at all; 7 = to a great extent)”.
World Economic Forum
The Global Competitiveness Report 2015-2016, p. 377
Labour Market Labour Freedom * Staff Training
38 39
INSTITUTIONALVARIABLE
DescriptionSourceof Data
Data Availability
Regulation
Effectiveness of anti-monopoly policy, answering to the question: “In your country, how effective are anti-monopoly policies at ensuring fair competition? [1 = not effective at all; 7 = extremely effective] “
World Economic Forum
The Global Competitiveness Report 2015-2016, p. 395
MarketDominance
Extent of market dominance: “Corporate activity in your country is (1 = dominated by a few business groups, 7 = spread among many firms)”.
World Economic Forum
The Global Competitiveness Report 2015-2016, p. 471
Compregulation Regulation * Market Dominance
TechnologyTransfer
These are the innovation index points from GCI: a complex measure of innovation including investment in research and development (R&D) by the private sector, the presence of high-quality scientific research institutions and the collaboration in research between universities and industry, and the protection of intellectual property.
World Economic Forum
The Global Competitiveness Report 2015-2016, p. 22
GERD
Gross domestic expenditure on Research & Development (GERD) as a percentage of GDP, year 2014 or latest availa-ble data Puerto Rico, Dominican Republic, and United Arab Emirates are estimated.
UNESCO
http://stats.uis.unesco.org/une-sco/TableViewer/tableView.aspx?Re-portId=2656
ScientificInstitutions
Quality of scientific research institutions. Answering to the question: “In your country, how do you assess the quality of scientific research institutions? [1 = extremely poor – among the worst in the world; 7 = extremely good – among the best in the world]”
World Economic Forum
The Global Competitiveness Report 2015-2016, p. 381
Availability ofScientist
Availability of scientists and engineers. Answering to the question: “In your country, to what extent are scientists and engineers available? [1 = not at all; 7 = widely available]”
World Economic Forum
The Global Competitiveness Report 2015-2016, p. 381
Science GERD* Average of Scientific Institutions and Availability of Scientist Own calculation
Venture Capital
Venture-capital availability. Answering to the question: “In your country, how easy is it for startup entrepreneurs with innovative but risky projects to obtain equity funding? [1 = extremely difficult; 7 = extremely easy]”
World Economic Forum
The Global Competitiveness Report 2015-2016, p. 379
Business Strategy
Refers to the ability of companies to pursue distinctive strategies, which involves differentiated positioning and innovative means of production and service delivery.
World Economic Forum
The Global Competitiveness Report 2015-2016, p. 22
Finance andStrategy Venture Capital Business Strategy Own calculation
INSTITUTIONALVARIABLE
DescriptionSourceof Data
Data Availability
Economiccomplexity
“The complexity of an economy is related to the multiplicity of useful knowledge embedded in it. Because individuals are limited in what they know, the only way societies can expand their knowledge base is by facilitating the interaction of individuals in increasingly complex networks in order to make products. We can measure economic complexity by the mix of these products that countries are able to make.” (http://atlas.media.mit.edu/en/resources/economic_complexity/)
Observatory of Economic Complexity
http://atlas.media.mit.edu/en/resources/data/
Depth of Capital Market*
The Depth of Capital Market is one of the six sub-indices of the Venture Capital and Private Equity index. This variable is a complex measure of the size and liquidity of the stock market, level of IPO, M&A and debt and credit market activity. Note that there were some methodolog-ical changes over the 2006–2015 time period so previous years comparison is not perfect.
EMLYON Business School France and IESE Business School, Barcelona, Spain
http://blog.iese.edu/vcpeindex/