Embed Size (px)
Citation preview

The Energy‐Water Nexus:A Case Study of Tampa Bay Water
Emerging Energy Issues and Topics In‐Service TrainingUniversity of Florida, PREC
September 29, 2011
Jennison Kipp | University of Florida, GainesvilleDave Bracciano | Tampa Bay Water
Eleanor Foerste | University of Florida, Osceola CountyPierce Jones | University of Florida, Gainesville

UF PREC | Emerging Energy Issues and Topics IST | 09.29.11
Presentation Objectives
*Unless otherwise noted, all images courtesy of Dave Bracciano, Tampa Bay Water
Desalination RO Membranes
• Share details of a Florida case study that exemplifies the energy‐water nexus from a local water supply perspective
• Improve understanding of the complexity and various costs associated with operating a large, regional alternative water supply system
• Convey the values/benefits of water conservation and efficiency as means to reduce energy consumption and associated greenhouse gas emissions
• Discuss practical applications for Extension programming

UF PREC | Emerging Energy Issues and Topics IST | 09.29.11
Motivation
Program for Resource Efficient Communities (PREC) Mission:• To promote the adoption of best design, construction and management practices that measurably reduce energy and water consumption and environmental degradation in residential communities.
• http://buildgreen.ufl.edu Model Home in Madera: a low impact development community(Image courtesy Glenn Acomb, PREC)

UF PREC | Emerging Energy Issues and Topics IST | 09.29.11
Global Change Energy, Water, and Land
Natural Systems
Human Systems
Policy, Management,
Design, Engineering
LID, Smart Growth, Green
Infrastructure, Sustainability
Motivation
Systems Approaches – Interdisciplinary Solutions

UF PREC | Emerging Energy Issues and Topics IST | 09.29.11
Water‐Energy Nexus: National Scope
• Water embedded in energy: ~2/5 of U.S. freshwater withdrawals used for electricity production (DOE, 2006)
• Energy embedded in water: ~1/8 of U.S. electricity production used for water supply (pumping, treating and heating water) (River Network, 2009)
• Climate change bothaffecting and affectedby water and energyuse and managementdecisions

UF PREC | Emerging Energy Issues and Topics IST | 09.29.11
Water‐Energy Nexus: National Scope
100 Most Water‐Vulnerable Coal‐Fired Power PlantsSource: DOE NETL, 2010, http://www.netl.doe.gov/technologies/coalpower/ewr/water/pdfs/DOENETL‐2010‐1429%20WaterVulnerabilities.pdf

UF PREC | Emerging Energy Issues and Topics IST | 09.29.11
Water‐Energy Nexus: Regional Scope
“Water and Watts” in the Southeast (WRI/SEEA/Southface, 2009)
• ~2/3 of regional freshwater withdrawals (40 billion gallons daily) used for thermoelectric power plant cooling needs
• Energy for water and wastewater treatment ~1/3 of municipal energy costs
• Typical home spends about $250 per year on energy for hot water

UF PREC | Emerging Energy Issues and Topics IST | 09.29.11
Water‐Energy Nexus: Florida

UF PREC | Emerging Energy Issues and Topics IST | 09.29.11
Water‐Energy Nexus: Florida

UF PREC | Emerging Energy Issues and Topics IST | 09.29.11
Water‐Energy Nexus: Florida
Florida climate legislation• Executive Orders (2007)
– 07‐127: “Immediate Actions to Reduce Greenhouse Gas Emissions in Florida”
– GHG Emissions Targets for 2017, 2025, and 2050
• House Bill 697 (2008)– Building code standards– Local government comprehensive planning and accountability measures addressing energy efficiency
“Greenhouse Gas Reduction and Energy Conservation: Development Impacts Under Florida’s HB 697“(Image courtesy Pierce Jones, PREC)
UF PREC | Emerging Energy Issues and Topics IST | 09.29.11
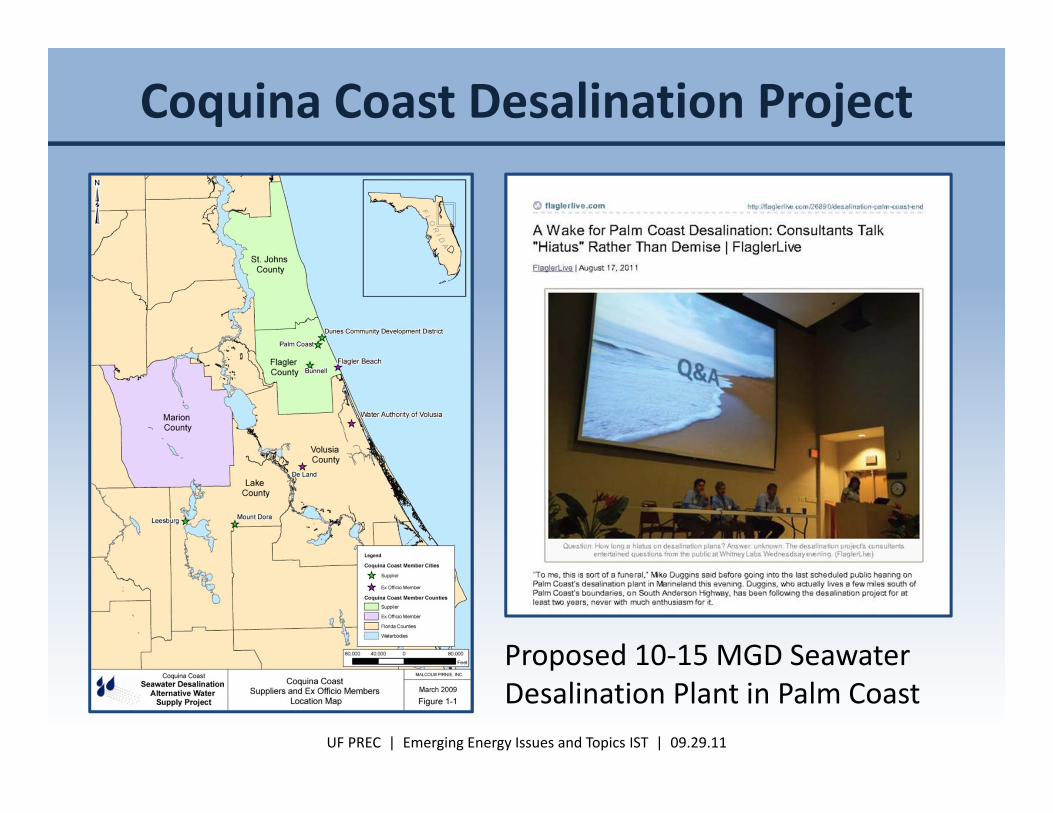
Coquina Coast Desalination Project
Proposed 10‐15 MGD Seawater Desalination Plant in Palm Coast

UF PREC | Emerging Energy Issues and Topics IST | 09.29.11
Coquina Coast Desalination ProjectFlaglerLive.com – August 17, 2011:
A Wake for Palm Coast Desalination: Consultants Talk “Hiatus” Rather Than Demise“Palm Coast itself is not running out of water by any means.”“Consultants found out from Florida Power and Light that there is capacity to generate the 7 to 40 megawatts needed to run the plant without need for – as one individual wondered – nuclear power. But it is less clear whether the existing grid can support a [desalination] plant located in Palm Coast.”http://flaglerlive.com/26890/desalination‐palm‐coast‐end
UF PREC | Emerging Energy Issues and Topics IST | 09.29.11
Research GoalEnergy‐for‐water analysis

UF PREC | Emerging Energy Issues and Topics IST | 09.29.11
Research GoalEnergy‐for‐water/embedded energy analysis: Estimate and compare the annual carbon footprints and carbon intensities associated with producing potable water…

UF PREC | Emerging Energy Issues and Topics IST | 09.29.11
Research GoalEnergy‐for‐water/embedded energy analysis: Estimate and compare the annual carbon footprints and carbon intensities associated with producing potable water from traditional (groundwater) and alternative (surface water and desalinated seawater) sources in Tampa Bay Water’s system.

UF PREC | Emerging Energy Issues and Topics IST | 09.29.11
• Collection• Treatment• Delivery
Tampa Bay
Water
• Treatment • Distribution
Member Govern‐ments
• Treatment• Heating
End Users
• Treatment• Discharge or Reuse
WWTP
Research GoalConservative in scope: We evaluate only the electricity use of Tampa Bay Water’s production facilities for water collection, treatment, and delivery to member governments (their wholesale customers). Excludes energy and carbon costs of distribution to end users, end use consumption, and wastewater treatment.

UF PREC | Emerging Energy Issues and Topics IST | 09.29.11
Pasco Co.
New Port Richey
Hillsborough Co.
Tampa
St Petersburg
Pinellas Co.
Context
• Over 2.4 million customers served
• Member demand forecasts:– 2010: 236 MGD– 2025: 271 MGD
• Tampa Bay Water supplies > 150 MGD– Supplemented by the City of Tampa

UF PREC | Emerging Energy Issues and Topics IST | 09.29.11
ContextTampa Bay Water Regional Facilities• Groundwater
– Consolidated water use permit– 90 MGD 12‐month running average

UF PREC | Emerging Energy Issues and Topics IST | 09.29.11
ContextTampa Bay Water Regional Facilities• Groundwater
– Consolidated water use permit– 90 MGD 12‐month running average
• Surface water– Hillsborough River, Alafia River– Regional surface water treatment plant– 120 MGD treatment capacity

UF PREC | Emerging Energy Issues and Topics IST | 09.29.11
ContextTampa Bay Water Regional Facilities• Groundwater
– Consolidated water use permit– 90 MGD 12‐month running average
• Surface water– Hillsborough River, Alafia River– Regional surface water treatment plant– 120 MGD treatment capacity
• Desalination treatment plant– Seawater intake via TECO Big Bend
facility– 25 MGD treatment capacity– Largest desal plant in North America
• Regional reservoir– 15.5 billion gallon storage capacity

UF PREC | Emerging Energy Issues and Topics IST | 09.29.11
Data & AnalysisTampa Bay Water
– 37 collection, treatment, and delivery facilities– Water Years (WY) 2006‐2009 water pumped and produced, electricity used, electricity cost, electric provider
U.S. EPA’s eGRIDweb– Year 2005 greenhouse gas emissions for 6 power plants– http://cfpub.epa.gov/egridweb/view.cfm

UF PREC | Emerging Energy Issues and Topics IST | 09.29.11
Data & AnalysisPower Plant GHG Emissions Factors
TECO Generation Fuel Mix CO2e lbs/kWh
Big Bend 97% Coal / 3% Oil 2.40
H.L. Culbreath 100% Natural Gas 0.90
Weighted Emissions Factor 1.69
Progress Energy
P.L. Bartow 97% Oil / 3% Natural Gas 2.00
Anclote 99% Oil / 1% Natural Gas 2.01
Weighted Emissions Factor 2.01
WREC
Seminole 74% Coal / 26% Oil 2.07
Hardee 98% Natural Gas / 2% Oil 1.03
Weighted Emissions Factor 2.04

UF PREC | Emerging Energy Issues and Topics IST | 09.29.11
Results
Tampa Bay Water Production Blend(2006‐2009 averages, by supply type)
127 MGD (70%)
41 MGD (23%)
14 MGD (7%)
GroundwaterSurface WaterDesalinated

UF PREC | Emerging Energy Issues and Topics IST | 09.29.11
Results (2006‐2009)Annual Production by Supply Type (Average 178 MGD)
137 130113
128
4643
4233
519 17
0
25
50
75
100
125
150
175
200
2006 2007 2008 2009
DesalinatedSurface WaterGroundwater
MGD

UF PREC | Emerging Energy Issues and Topics IST | 09.29.11
0
50
100
150
200
250
300
350
400
450
2006 2007 2008 2009
MGD
Results (2006‐2009)
Annual Production
‐ 6 MGD = 3% Decrease

UF PREC | Emerging Energy Issues and Topics IST | 09.29.11
0
50
100
150
200
250
300
350
400
450
2006 2007 2008 2009
MGD
Results (2006‐2009)
Annual Production
‐ 6 MGD = 3% Decrease
UF PREC | Emerging Energy Issues and Topics IST | 09.29.11
0
20
40
60
80
100
120
140
160
180
200
0
50
100
150
200
250
300
350
400
450
2006 2007 2008 2009
GWh
MGD
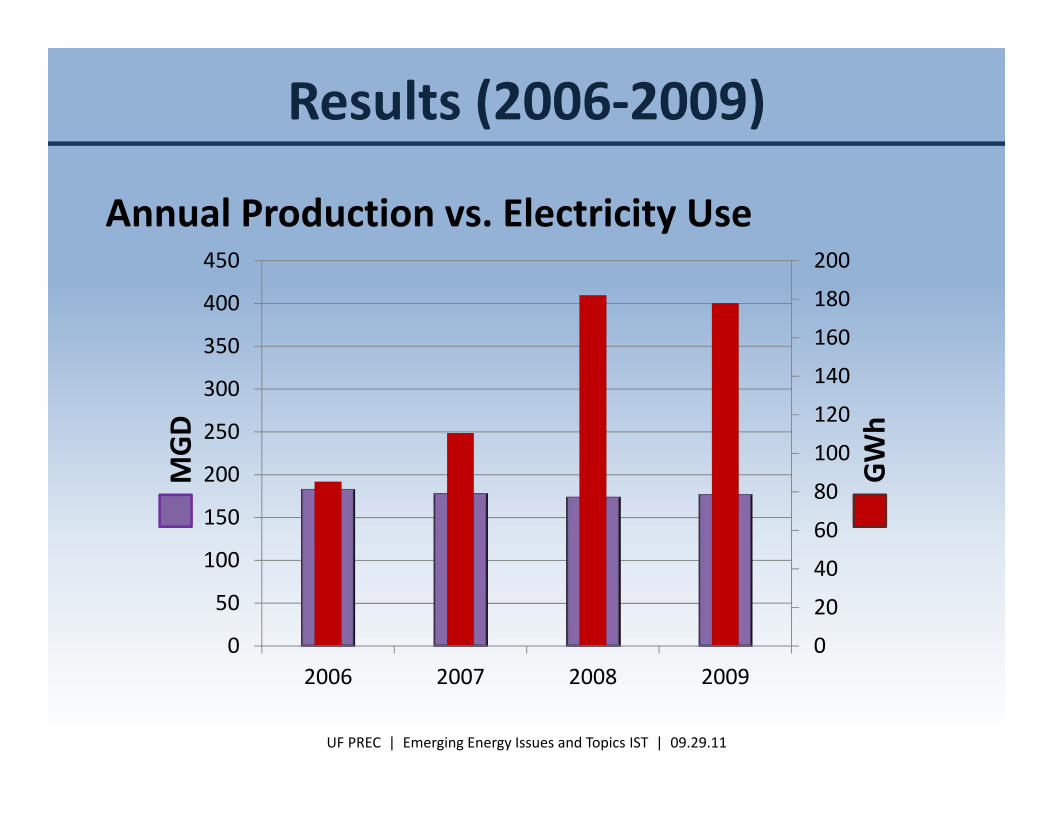
Results (2006‐2009)
Annual Production vs. Electricity Use

UF PREC | Emerging Energy Issues and Topics IST | 09.29.11
0
20
40
60
80
100
120
140
160
180
200
0
50
100
150
200
250
300
350
400
450
2006 2007 2008 2009
GWh
MGD
Results (2006‐2009)
Annual Production vs. Electricity Use
+ 93 GWh = 109% Increase

UF PREC | Emerging Energy Issues and Topics IST | 09.29.11
0
2
4
6
8
10
12
14
16
18
0
50
100
150
200
250
300
350
400
450
2006 2007 2008 2009
$ Million
MGD
Results (2006‐2009)
Annual Production vs. Electricity Costs

UF PREC | Emerging Energy Issues and Topics IST | 09.29.11
0
2
4
6
8
10
12
14
16
18
0
50
100
150
200
250
300
350
400
450
2006 2007 2008 2009
$ Million
MGD
Results (2006‐2009)
Annual Production vs. Electricity Costs
+ $9.9 Million = 138% Increase

UF PREC | Emerging Energy Issues and Topics IST | 09.29.11
0
20
40
60
80
100
120
140
160
180
0
50
100
150
200
250
300
350
400
450
2006 2007 2008 2009
Metric
Ton
s CO
2e(Tho
usan
ds)
MGD
Results (2006‐2009)
Annual Production vs. Carbon Footprints

UF PREC | Emerging Energy Issues and Topics IST | 09.29.11
0
20
40
60
80
100
120
140
160
180
0
50
100
150
200
250
300
350
400
450
2006 2007 2008 2009
Metric
Ton
s CO
2e(Tho
usan
ds)
MGD
Results (2006‐2009)
Annual Production vs. Carbon Footprints
+ 74,000 m.t. CO2e = 95% Increase

UF PREC | Emerging Energy Issues and Topics IST | 09.29.11
0
20
40
60
80
100
120
140
160
180
0
50
100
150
200
250
300
350
400
450
2006 2007 2008 2009
Metric
Ton
s CO
2e(Tho
usan
ds)
MGD
Results (2006‐2009)
Annual Production vs. Carbon Footprints
> 9,000 homes’ electricity for 1 yr.

UF PREC | Emerging Energy Issues and Topics IST | 09.29.11
31 30 26 29
16 14 14 16
22
76 71
0
20
40
60
80
100
120
2006 2007 2008 2009
Metric
Tons. CO2e
(Tho
usands)
DesalinatedSurface WaterGroundwater
Results (2006‐2009)
Carbon Footprints by Supply Type

UF PREC | Emerging Energy Issues and Topics IST | 09.29.11
31 30 26 29
16 14 14 16
22
76 71
0
20
40
60
80
100
120
2006 2007 2008 2009
Metric
Tons. CO2e
(Tho
usands)
DesalinatedSurface WaterGroundwater
Results (2006‐2009)
Carbon Footprints by Supply Type
Desal = <10% of Supply and >50% of Carbon Footprint

UF PREC | Emerging Energy Issues and Topics IST | 09.29.11
Results (2006‐2009)
Carbon Intensities by Supply Type
0
2
4
6
8
10
12
14
2006 2007 2008 2009
Metric
Ton
s CO
2e/M
G
Prod
uced Groundwater
Surface WaterDesalinatedBlended Product
UF PREC | Emerging Energy Issues and Topics IST | 09.29.11
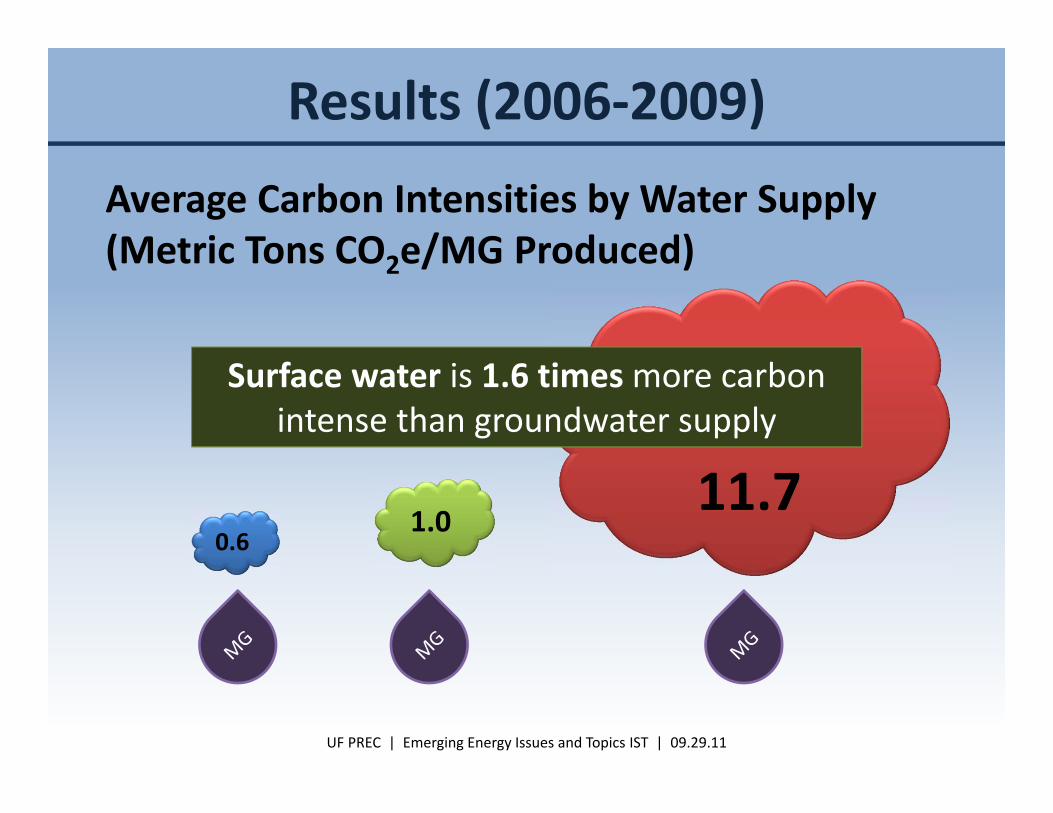
11.7
Results (2006‐2009)
Average Carbon Intensities by Water Supply(Metric Tons CO2e/MG Produced)
0.61.0
Surface water is 1.6 times more carbon intense than groundwater supply

UF PREC | Emerging Energy Issues and Topics IST | 09.29.11
11.7
Results (2006‐2009)
Average Carbon Intensities by Water Supply(Metric Tons CO2e/MG Produced)
0.61.0
Desalination is 18 timesmore carbon intense than groundwater supply

UF PREC | Emerging Energy Issues and Topics IST | 09.29.11
$1343
Average Unit Cost by Water Supply(Electricity Costs/MG Produced)
Results (2006‐2009)
$70 $135
Surface water is 1.9 times more expensive than groundwater supply

UF PREC | Emerging Energy Issues and Topics IST | 09.29.11
$1343
Average Unit Cost by Water Supply(Electricity Costs/MG Produced)
Results (2006‐2009)
$70 $135
Desalination is 19 timesmore expensive than groundwater supply

UF PREC | Emerging Energy Issues and Topics IST | 09.29.11
$4020
Average cost for desalinated water, including other fixed and variable costs ($/MG Produced)
Results (2006‐2009)

UF PREC | Emerging Energy Issues and Topics IST | 09.29.11
Applications: ConservationTampa Bay Water Member Governments’ Water Conservation BMPs• Non‐potable irrigation source
replacement or rebates• Water‐efficient landscapes and
irrigation evaluations and rebates• High‐efficiency clothes washer
retrofits• Ultra low flush toilet retrofits• High efficiency toilets• Urinal rebates• Non‐residential water use
evaluations/implementation
UF PREC | Emerging Energy Issues and Topics IST | 09.29.11
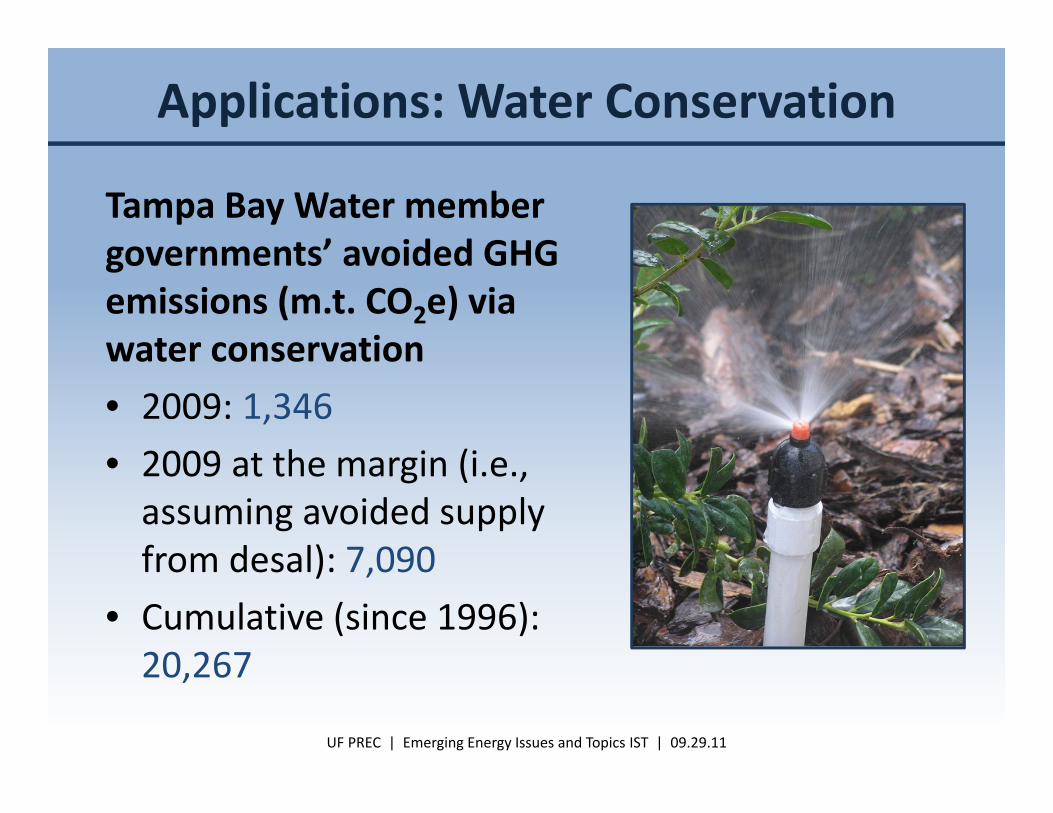
Applications: Water Conservation
Tampa Bay Water member governments’ avoided GHG emissions (m.t. CO2e) via water conservation• 2009: 1,346• 2009 at the margin (i.e., assuming avoided supply from desal): 7,090
• Cumulative (since 1996): 20,267

UF PREC | Emerging Energy Issues and Topics IST | 09.29.11
Applications: Water Conservation
Opportunity Costs of Water Consumption / Benefits of Water Conservation• 2009: 1,346 m.t. CO2e
= 163 homes’ electricity for one year
• 2009 at the margin: 7,090 m.t. CO2e= 1,390 passenger vehicles’ fuel for one year
• Cumulative (since 1996): 20,267 m.t. CO2e= 47,133 barrels of oil

UF PREC | Emerging Energy Issues and Topics IST | 09.29.11
Applications: Landscape Management
79 lbs CO2e per 1000 ft2landscaped area
Irrigation: 34 (43%)
Fertilizer: 29 (37%)
Mowing: 15 (19%)
Pesticides: 1 (1%)
Groundwater Supply(Image credits: UF/IFAS)

UF PREC | Emerging Energy Issues and Topics IST | 09.29.11
Applications: Landscape Management
Blended Supply
Irrigation 120 (73%)
Fertilizers 29 (17%)
Mowing 15 (9%) Pesticides
1 (1%)
165 lbs CO2e per 1000 ft2landscaped area
(Image credits: Pierce Jones (top) and UF/IFAS (bottom))

UF PREC | Emerging Energy Issues and Topics IST | 09.29.11
Bottom Line – True Costs
• When we flip the switch, we also turn on the tap; when we turn on the tap, we also flip the switch
• At the margin with existing systems, and to an even greater extent with those yet to be constructed, energy‐intensive water supplies are costly economically, ecologically, and socially
• Conservation and efficiency are often the most cost‐effective “alternative supplies”
• Demonstrated value/benefits of DSM programs, and land use planning for resource efficiency

UF PREC | Emerging Energy Issues and Topics IST | 09.29.11
Bottom Line ‐ Opportunities
Consumers
Researchers & Educators
Utilities
Planners & Policy‐makers
DEMAND
UF PREC | Emerging Energy Issues and Topics IST | 09.29.11
Water‐Energy‐Land Ethic

UF PREC | Emerging Energy Issues and Topics IST | 09.29.11
Water‐Energy‐Land Ethic
1. Transportation

UF PREC | Emerging Energy Issues and Topics IST | 09.29.11
Water‐Energy‐Land Ethic
1. Transportation2. Housing

UF PREC | Emerging Energy Issues and Topics IST | 09.29.11
Water‐Energy‐Land Ethic
1. Transportation2. Housing3. Food

UF PREC | Emerging Energy Issues and Topics IST | 09.29.11
Water‐Energy‐Land Ethic
1. Transportation2. Housing3. Food4. Conservation and
sufficiency

UF PREC | Emerging Energy Issues and Topics IST | 09.29.11
Water‐Energy‐Land Ethic
1. Transportation2. Housing3. Food4. Conservation and
sufficiency5. “WE”
• Systems approachesand interdisciplinary collaboration

UF PREC | Emerging Energy Issues and Topics IST | 09.29.11
Moving Forward
• Alliance for Water Efficiency, American Council for an Energy‐Efficient Economy (May 2011)
• Identifies eight thematic elements and specific strategies to address the energy‐water nexus and collaboratively promote energy and water efficiency
http://www.aceee.org/white‐paper/addressing‐the‐energy‐water‐nexus

UF PREC | Emerging Energy Issues and Topics IST | 09.29.11
Water‐Energy Nexus Blueprint for Action
1. Increase the level of collaboration between the water and energy communities in planning and implementing programs.
2. Achieve a deeper understanding of the energy embedded in water and the water embedded in energy.
3. Learn from and replicate best practice integrated energy‐water efficiency programs.
4. Integrate water into energy research efforts and vice versa.

UF PREC | Emerging Energy Issues and Topics IST | 09.29.11
Water‐Energy Nexus Blueprint for Action
5. Separate water utility revenues from unit sales, and consider regulatory structures that provide an incentive for investing in end‐use water and energy efficiency.
6. Leverage existing and upcoming voluntary standards that address the energy‐water nexus.
7. Implement codes and mandatory standards that address the energy‐water nexus.
8. Pursue education and awareness opportunities for various audiences and stakeholders.

UF PREC | Emerging Energy Issues and Topics IST | 09.29.11
Emerging Issues / Tough Questions
• We are facing real and increasing constraints on water, energy, and land that directly affect human quality of life and ecosystem health.
• Extension can play an important role in finding solutions to address these constraints, but there is no silver bullet.
• What are the practical applications of this type of research for Extension programming?
• What should Extension’s “energy‐water nexus” role be?• What information and technical resources will help advance our sustainability programming?

UF PREC | Emerging Energy Issues and Topics IST | 09.29.11
Thank YouQuestions?
Jennison Kipp, [email protected] Bracciano, [email protected]