Embed Size (px)
Citation preview
O X F O R D S U S T A I N A B L E F I N A N C E P R O G R A M M E , S M I T H S C H O O L O F E N T E R P R I S E A N D T H E E N V I R O N M E N T, U N I V E R S I T Y O F O X F O R D
A P R I L 2021
The energy transition and changing financing costsX I A O YA N Z H O U , C H R I S T I A N W I L S O N , B E N C A L D E C O T T
Oxford Sustainable Finance Programme
Authors
2
Authors
Acknowledgements
D R X I A O YA N Z H O ULead,SustainableFinancePerformance,OxfordSustainableFinanceProgramme
Dr Xiaoyan Zhou leads the Sustainable Finance Performance theme at the Oxford Sustainable Finance Programme. Her research interests focus on Sustainable Investment,
Transition Risk and Institutional Shareholder Engagement. She publishes in journals such as the Journals of Business Ethics (FT 50) and serves as reviewer for various journals including Nature Climate Change. She won the PRI 2019 Best Quantitative Paper Award.
C H R I S T I A N W I L S O N
DPhilstudentandResearchAssistant,OxfordSustainableFinanceProgramme
Alongside his work at Oxford, Christian is a Policy Advisor at the Department for Business, Energy and Industrial Strategy (BEIS), focusing on Green Finance within the Clean Growth
Directorate. Previously, he worked at ShareAction, the University of Cambridge, and Janus Henderson Investors.
D R B E N C A L D E C O T TDirector,OxfordSustainableFinanceProgrammeandLombardOdierAssociateProfessorandSeniorResearchFellow
Dr Ben Caldecott is the founding Director of the Oxford Sustainable Finance Programme at the University of Oxford Smith School of Enterprise and the Environment. At the University of Oxford, he is the inaugural Lombard Odier Associate Professor and Senior Research Fellow of Sustainable Finance, the first ever endowed professorship of sustainable finance, and a Supernumerary Fellow at Oriel College. Ben is also the founding Director and Principal Investigator of the UK Centre for Greening Finance & Investment (CGFI), established by UK Research and Innovation in 2021 as the national centre to accelerate the adoption and use of climate and environmental data and analytics by financial institutions internationally. Since 2019, he has also been seconded to the UK Cabinet Office as the COP26 Strategy Advisor for Finance.
We are particularly grateful to Dr Rahmat Poudineh and Dr Bassam Fattouh from Oxford Institute for Energy Studies (OIES) for early advice. We would also like to thank the external reviewers, in particular Professor Andreas Hoepner (University College Dublin) and Dr Rui Zhong (University of Western Australia), for their feedback.
Oxford Sustainable Finance Programme
Aboutus
3
The Oxford Sustainable Finance Programme (OxSFP) at the University of Oxford Smith School of Enterprise and the Environment was established in 2012. OxSFP is a multidisciplinary research centre working to be the world’s best place for research and teaching on sustainable finance and investment. We work globally across asset classes, finance professions, and with different parts of the financial system.
We are uniquely placed by virtue of our scale, scope, networks, and leadership to understand the key challenges and opportunities in different contexts, and to work with partners to ambitiously shape the future of sustainable finance.
We are based in one of the world’s great universities and the oldest university in the English-speaking world. We work with leading practitioners from across the investment chain (including actuaries, asset owners, asset managers, accountants, banks, data providers, investment consultants, lawyers, ratings agencies, stock exchanges), with firms and their management, and with experts from a wide range of related subject areas (including finance, economics, management, geography, data science, anthropology, climate science, law, area studies, psychology) within the University of Oxford and beyond.
The Global Sustainable Finance Advisory Council that guides our work contains many of the key individuals and organisations working on sustainable finance. The Oxford Sustainable Finance Programme’s founding Director is Dr Ben Caldecott.
Oxford Sustainable Finance Programme
Since our foundation we have made significant and sustained contributions to the field, including in some of the following areas:
•Developingtheconceptof“strandedassets”,nowacoreelementofthetheoryandpracticeofsustainablefinance.
•Contributionstothetheoryandpracticeofmeasuringenvironmentalrisksandimpactsvianewformsofgeospatialdataandanalysis,includingintroducingtheideaandimportanceof“spatialfinance”and“asset-leveldata”.
•ShapingthetheoryandpracticeofsupervisionasitrelatestosustainabilitybyworkingwiththeBankofEngland,thecentralbanks’andsupervisors’NetworkforGreeningtheFinancialSystem(NGFS),andtheUSCommodityFuturesTradingCommission(CFTC),amongothers.
•Workingwithpolicymakerstodesignandimplementpoliciestosupportsustainablefinance,includingthroughtheUKGreenFinanceTaskforce,UKGreenFinanceStrategy,andtheforthcomingUKPresidencyofCOP26.
•Nurturingtheexpansionofarigorousacademiccommunityinternationallybyconceiving,founding,andco-chairingtheGlobalResearchAllianceforSustainableFinanceandInvestment(GRASFI),anallianceof27globalresearchuniversitiespromotingrigorousandimpactfulacademicresearchonsustainablefinance.
For more information please visit: www.smithschool.ox.ac.uk/research/sustainable-finance
Oxford Sustainable Finance Programme
ExecutiveSummary
4
The cost of capital is a key lever in the real economy, due to its ability to influence capital flows and investment decisions. This report seeks to understand how financing costs across different energy technologies and markets has changed over the last twenty years. It forms the first output of the Energy Transition Risk and Cost of Capital Project (ETRC) initiated by the Oxford Sustainable Finance Programme.
In addition to tracking changes in the cost of capital across the energy sector, over multiple years ETRC will seek to understand what is driving changes in the cost of capital, for example, between fossil fuels and renewable energy; what is impeding or enabling the pricing of energy transition risk, for example, data availability and regulation; and how the changing cost of capital will impact companies and providers of finance and investment, for example, through changing the economic and financial returns available across the energy sector. Research in these areas is essential for, among other things, identifying transformational interventions that can shift capital flows towards clean energy and away from dirty energy. It will also provide insights for shifting capital flows in other sectors of the global economy as part of the net zero carbon transition.
In our first report, we track how the cost of debt for fossil fuels and renewables have changed internationally over the past 20 years. We examine financing costs by analysing syndicated bank loan spreads taken from LPC DealScan. The sample from LPC DealScan includes loan information on 12,072 loan deals between 2000 and 2020, involving 5,033 borrowers across 118 countries in the energy and electric utilities sectors as identified by The Refinitiv Business Classification (TRBC)1
Executive Summary“This repor t seeks to understand how the f inancing costs across dif ferent energy technologies and markets has changed over the last twenty years .”
sector classification. The TRBC classifications are widely used by both academics and market practitioners.
While climate-related transition risks in the energy sector are sometimes viewed as distant, long-term risks, the impacts of which will not be felt for decades to come, we find this does not reflect reality. A summary of our key findings is detailed below.
1 TRBC was originally developed by the Reuters Group and has been owned by Refinitive since 2018. It is the basis for Refinitive Indices. Following the TRBC sector classification, the energy production sector is defined as the production of both fossil fuels, as well as the production of renewable fuels, such as biofuels, and the supply of renewable energy equipment. For the electric utilities, we grouped them into two types of electric utilities: power generation and other electric utilities. Within power generation category, we manually identify renewable (solar PV and CSP, offshore and onshore wind, biopower, and hydropower) and fossil fuels (coal-fired and gas-fired) power generation plants.
C O A L M I N I N G
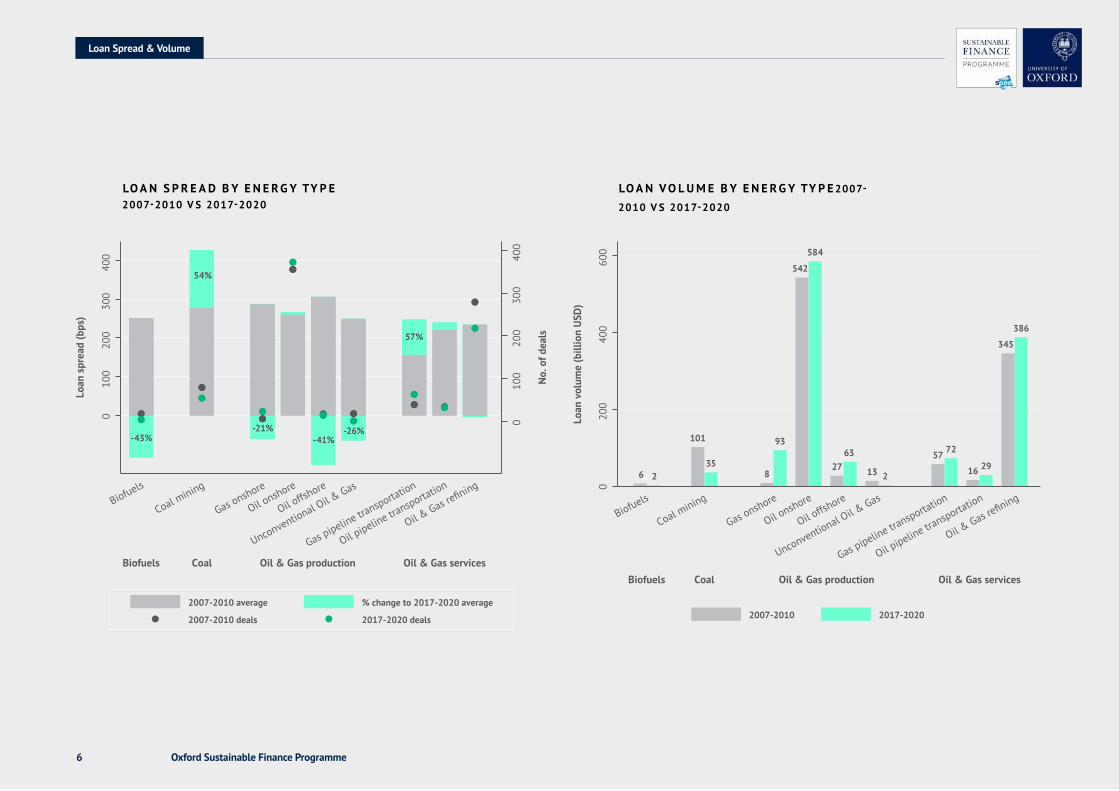
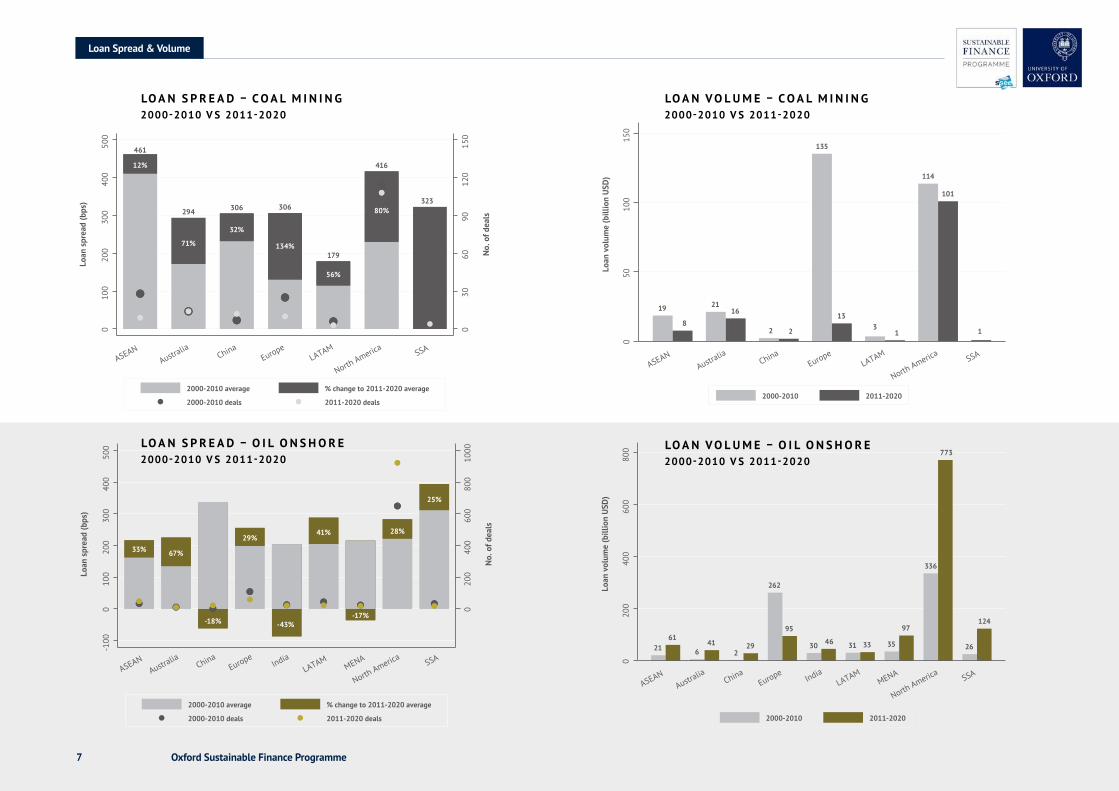
• Loan spreads for coal mining have increased dramatically, rising 54% over the last decade, comparing 2007-2010 and 2017-2020. This clear increase in loan spreads supports the findings of Fattouh et al. (2019), who show that investors perceive coal as significantly higher risk than other energy projects.
• Comparing 2000-2010 and 2011-2020, the average loan spread for coal mining has grown faster in developed markets such as Europe, North America and Australia, at 134%, 80% and 71% respectively, relative to emerging markets such as Latin America, China, and Southeast Asia, at 56%, 32% and 12% respectively.
• Along with the sharp increase in loan spreads, loan volumes2 have reduced significantly by 90% in Europe over this time period. However, they have decreased by much less in North America and Australia, by 11% and 23% respectively.
O I L & G A S P R O D U C T I O N
• Although loan spreads have risen since 2000, in the past decade loan spreads in oil & gas have remained largely stable, increasing by only 3% (comparing 2007-2010 and 2017-2020). This suggests that financial constraints on oil & gas companies have not materialised in the same manner as coal.
• Comparing 2000-2010 and 2011-2020, the cost of debt associated with onshore oil production has decreased in India, China and the
Middle East and North Africa by 43%, 18% and 17% respectively, while it has increased in other regions and countries. Over this time period, the sum of onshore oil production loan volumes has more than doubled in North America.
• Comparing the 2000-2010 and 2011-2020 average, the average loan spreads for offshore oil production have decreased by 30% in Europe.
O I L & G A S P I P E L I N E S
• Comparing 2000-2010 and 2011-2020, the cost of debt for gas pipelines has increased in Europe, North America and India by 80%, 52% and 67% respectively. The sum of loan volumes for gas pipelines has doubled in North America, from $84 billion to $166 billion, with the vast majority of loans issued to North American firms.
• The cost of debt for oil pipelines has risen in most regions over this time period, but loans for oil pipelines have almost doubled in North America, from $35 billion to $63 billion. Since 2000, the vast majority of loans have been issued to North American firms.
O I L & G A S R E F I N I N G
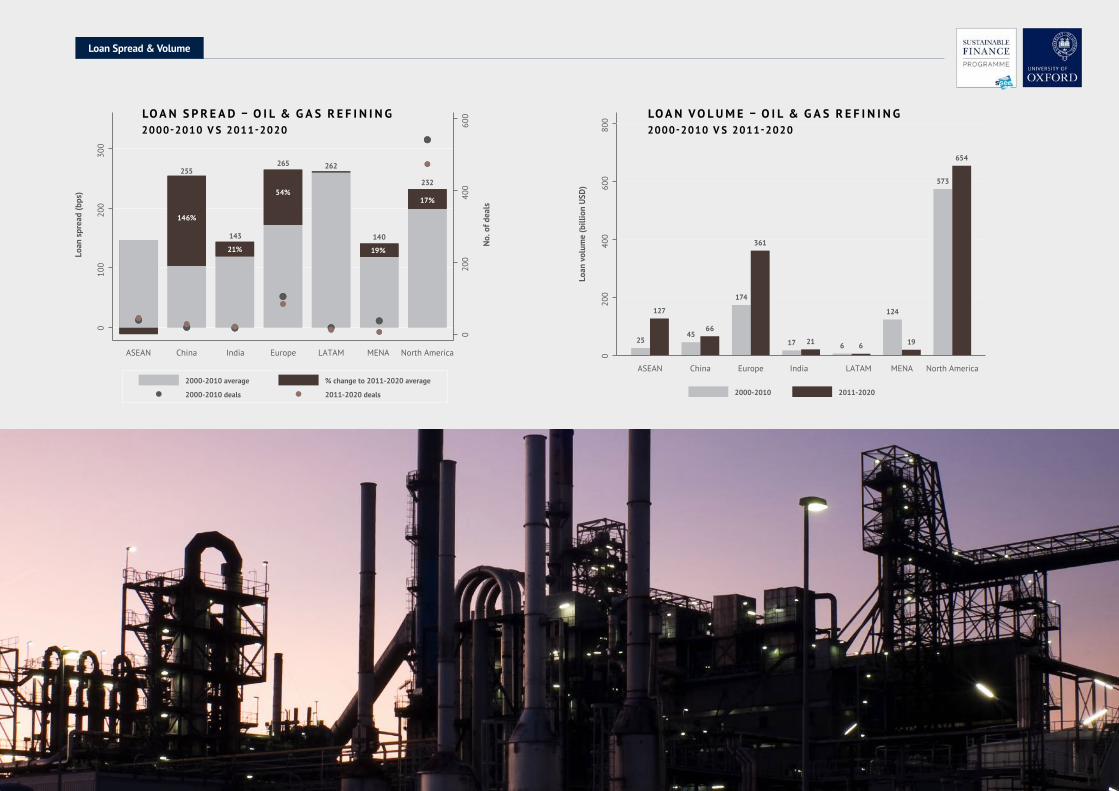
• In Europe, between 2000-2010 and 2011-2020, the average loan spread for oil & gas refining increased by 54%, with the sum of loan volumes more than doubling, from $174 billion to $361 billion.
• In North America, over this time period, the cost of debt has risen 17%. Meanwhile, the sum of loan volume has increased by 14% since 2011.
Energy production
5 Oxford Sustainable Finance Programme
EnergyProduction
2 When measuring changes in loan volume, only transactions where loan spread data is available are used. Therefore, not all loans are necessarily captured. This applies to all analysis in this study.
6 Oxford Sustainable Finance Programme
LoanSpread&Volume
LO A N S P R E A D B Y E N E R G Y TY P E 2007-2010V S 2017-2020
2007-2010 average % change to 2017-2020 average
2007-2010 deals 2017-2020 deals
Biofuels
Coal mining
Gas onshore
Oil onshore
Oil offsh
ore
Unconventional Oil & Gas
Gas pipeline transportation
Oil pipeline tra
nsportation
Oil & Gas re
fining
Biofuels Coal Oil & Gas production Oil & Gas services
-43%
54%
-21%-41%
-26%
57%
010
020
030
040
0
No.
of d
eals
Loan
spr
ead
(bps
)
010
020
030
040
0
LO A N V O L U M E B Y E N E R G Y TY P E2007-
2010V S 2017-2020
2007-2010 2017-2020
Loan
vol
ume
(bill
ion
USD
)
6 2
101
358
93
542
584
2763
13 2
57 72
16 29
345
386
020
040
060
0
Biofuels
Coal mining
Gas onshore
Oil onshore
Oil offsh
ore
Unconventional Oil & Gas
Gas pipeline transportation
Oil pipeline tra
nsportation
Oil & Gas re
fining
Biofuels Coal Oil & Gas production Oil & Gas services
7
LoanSpread&Volume
LO A N S P R E A D – C O A L M I N I N G2000-2010 V S 2011-2020
LO A N V O L U M E – C O A L M I N I N G2000-2010 V S 2011-2020
2000-2010 average % change to 2011-2020 average
2000-2010 deals 2011-2020 deals
12%
461
71%
294
32%
306
134%
306
179
56%
80%
416
323
030
6090
120
150
010
020
030
040
050
0
No.
of d
eals
Loan
spr
ead
(bps
)
ASEANAustra
liaChina
EuropeLATAM
North America SSA
2000-2010 average % change to 2011-2020 average
2000-2010 deals 2011-2020 deals
12%
461
71%
294
32%
306
134%
306
179
56%
80%
416
323
030
6090
120
150
010
020
030
040
050
0
No.
of d
eals
Loan
spr
ead
(bps
)
ASEANAustra
liaChina
EuropeLATAM
North America SSA
2000-2010 2011-2020
Loan
vol
ume
(bill
ion
USD
)
19
8
2116
2 2
135
133
1
114
101
1
050
100
150
ASEANAustra
liaChina
EuropeLATAM
North America SSA
2000-2010 2011-2020
Loan
vol
ume
(bill
ion
USD
)
19
8
2116
2 2
135
133
1
114
101
1
050
100
150
ASEANAustra
liaChina
EuropeLATAM
North America SSA
2000-2010 2011-2020
Loan
vol
ume
(bill
ion
USD
)
2161
641
229
262
95
30 46 31 33 35
97
336
773
26
1240
200
400
600
800
ASEANAustra
liaChina
EuropeIndia
LATAMMENA
North America SSA
2000-2010 2011-2020
Loan
vol
ume
(bill
ion
USD
)21
61
641
229
262
95
30 46 31 33 35
97
336
773
26
124
020
040
060
080
0ASEAN
Australia
ChinaEurope
IndiaLATAM
MENA
North America SSA
Oxford Sustainable Finance Programme
LO A N V O L U M E – O I L O N S H O R E2000-2010 V S 2011-2020
2000-2010 average % change to 2011-2020 average
2000-2010 deals 2011-2020 deals
No.
of d
eals
Loan
spr
ead
(bps
)
33% 67%
-18%
29%
-43%
41%
-17%
28%
25%
020
040
060
080
010
00
-100
010
020
030
040
050
0
ASEANAustra
liaChina
EuropeIndia
LATAMMENA
North America SSA
2000-2010 average % change to 2011-2020 average
2000-2010 deals 2011-2020 deals
No.
of d
eals
Loan
spr
ead
(bps
)
33% 67%
-18%
29%
-43%
41%
-17%
28%
25%0
200
400
600
800
1000
-100
010
020
030
040
050
0
ASEANAustra
liaChina
EuropeIndia
LATAMMENA
North America SSA
LO A N S P R E A D – O I L O N S H O R E 2000-2010 V S 2011-2020
Oxford Sustainable Finance Programme8
2000-2010 average % change to 2011-2020 average
2000-2010 deals 2011-2020 deals
#A3E3FFAAA
#BBC5F6AAA
#E2CAF2AAA
#F3B595AAA
#DBDBDBAAA
#DED3D3AAA
#E2DA9CAAA
#B8FBFFAAA
No.
of d
eals
Loan
spr
ead
(bps
)
255
146%
21%
143
54%
265 262
140
19%
17%
232
020
040
060
0
010
020
030
0
ASEAN China India Europe LATAM MENA North America
#1ABAFF#A3E3FFAAA
#8C9CF2#BBC5F6AAA
#D0ADEB#E2CAF2AAA
#EF986C#F3B595AAA
#BDBDBD#DBDBDBAAA
#C5AFAF#DED3D3AAA
#D4C868#E2DA9CAAA
#8AF9FF#B8FBFFAAA
2000-2010 2011-2020
25
127
4566
174
361
17 21 6 6
124
19
573
654
020
040
060
080
0
ASEAN China Europe India LATAM MENA North America
Loan
vol
ume
(bill
ion
USD
)
LO A N S P R E A D – O I L & G A S R E F I N I N G2000-2010 V S 2011-2020
LO A N V O L U M E – O I L & G A S R E F I N I N G2000-2010 V S 2011-2020
LoanSpread&Volume
Oxford Sustainable Finance Programme9
Powergeneration
C O A L P O W E R
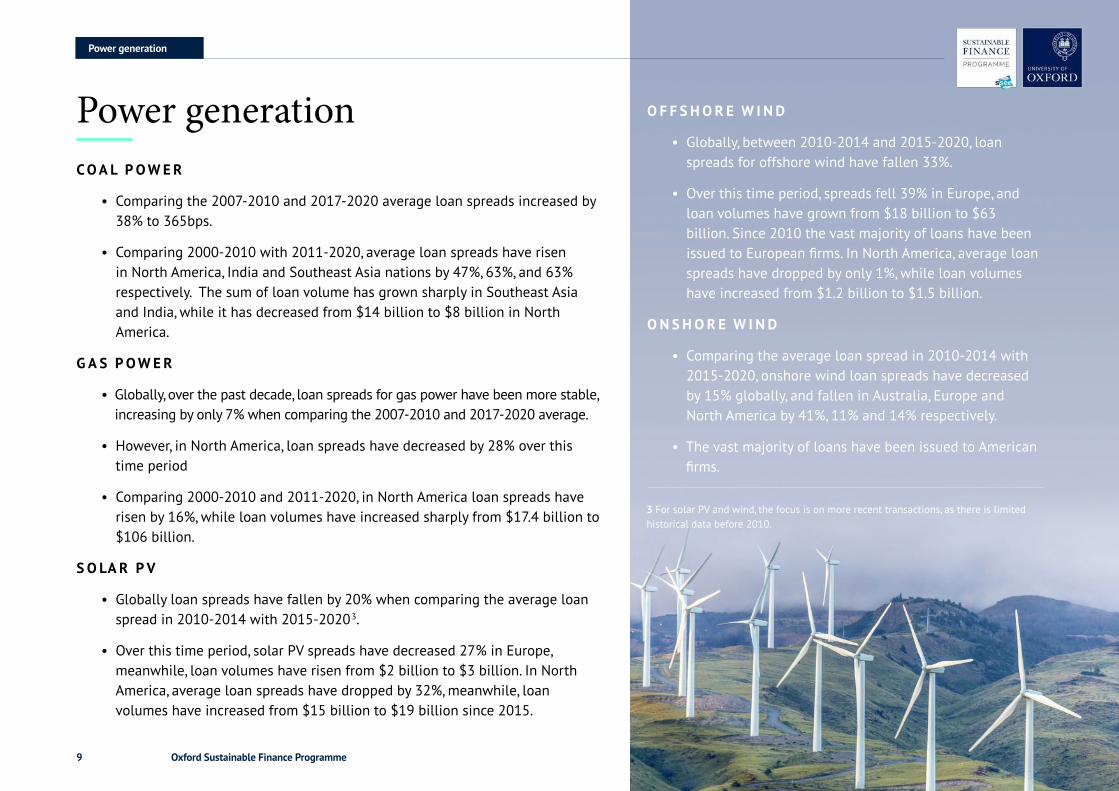
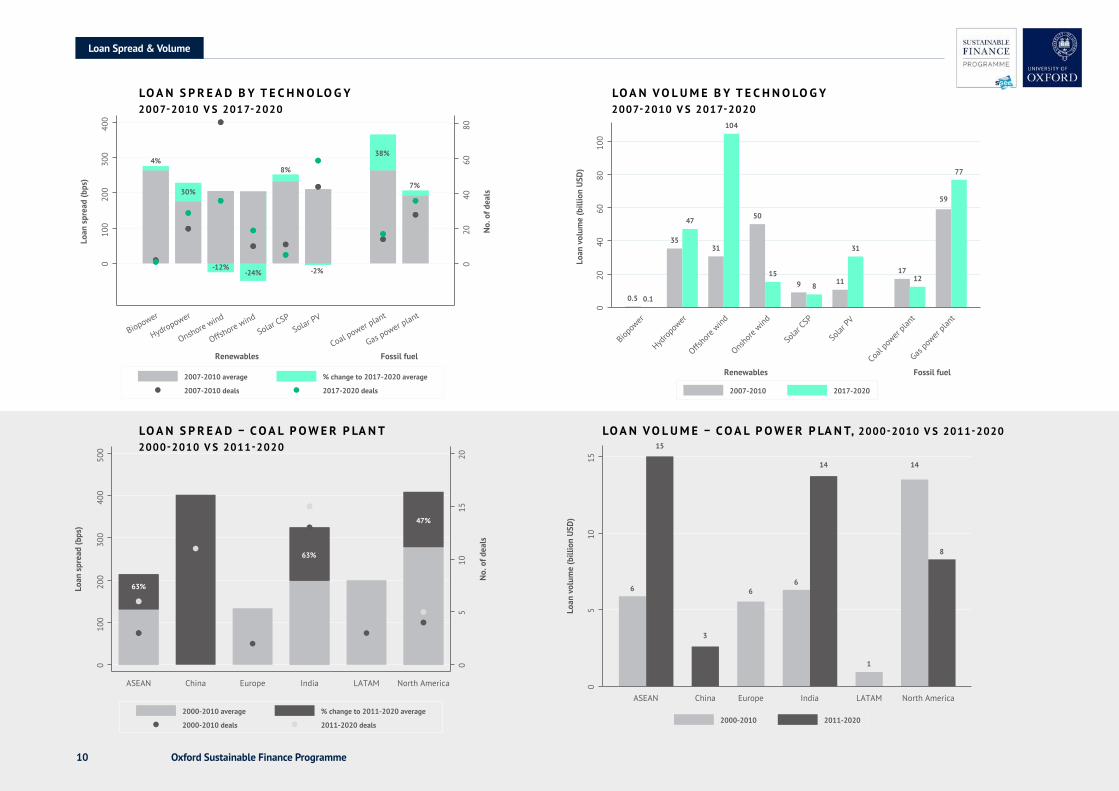
• Comparing the 2007-2010 and 2017-2020 average loan spreads increased by 38% to 365bps.
• Comparing 2000-2010 with 2011-2020, average loan spreads have risen in North America, India and Southeast Asia nations by 47%, 63%, and 63% respectively. The sum of loan volume has grown sharply in Southeast Asia and India, while it has decreased from $14 billion to $8 billion in North America.
G A S P O W E R
• Globally, over the past decade, loan spreads for gas power have been more stable, increasing by only 7% when comparing the 2007-2010 and 2017-2020 average.
• However, in North America, loan spreads have decreased by 28% over this time period
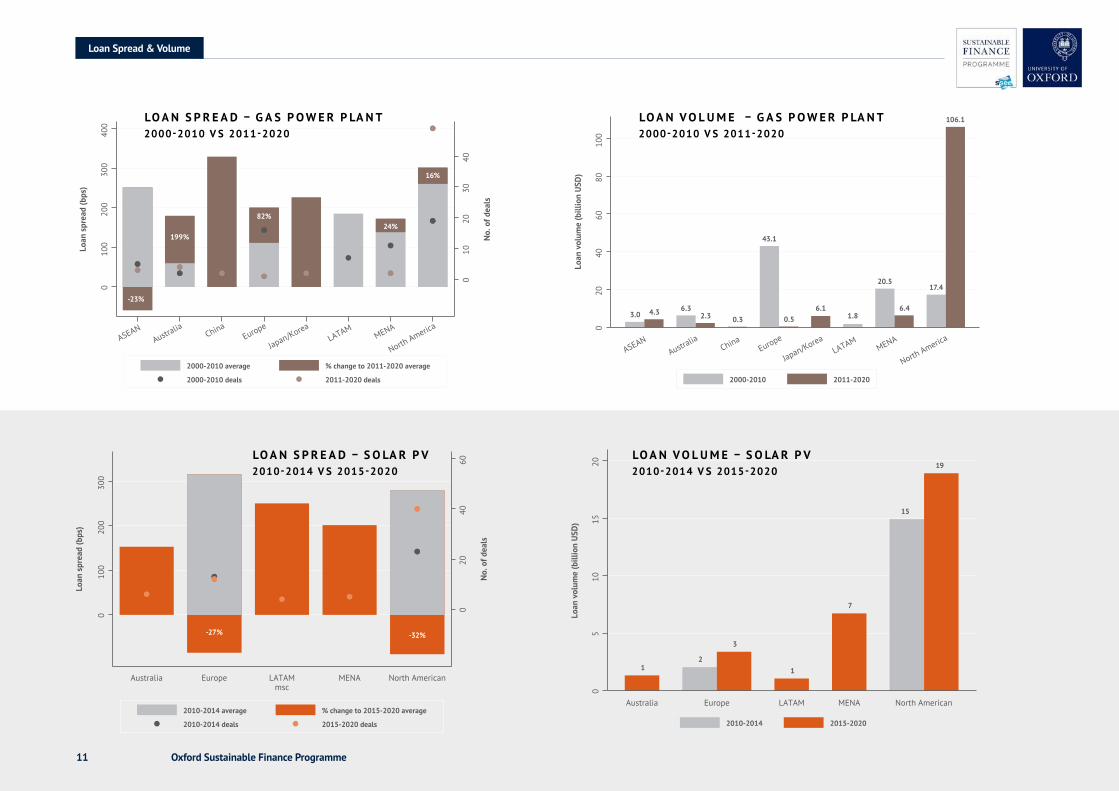
• Comparing 2000-2010 and 2011-2020, in North America loan spreads have risen by 16%, while loan volumes have increased sharply from $17.4 billion to $106 billion.
S O LA R P V
• Globally loan spreads have fallen by 20% when comparing the average loan spread in 2010-2014 with 2015-20203.
• Over this time period, solar PV spreads have decreased 27% in Europe, meanwhile, loan volumes have risen from $2 billion to $3 billion. In North America, average loan spreads have dropped by 32%, meanwhile, loan volumes have increased from $15 billion to $19 billion since 2015.
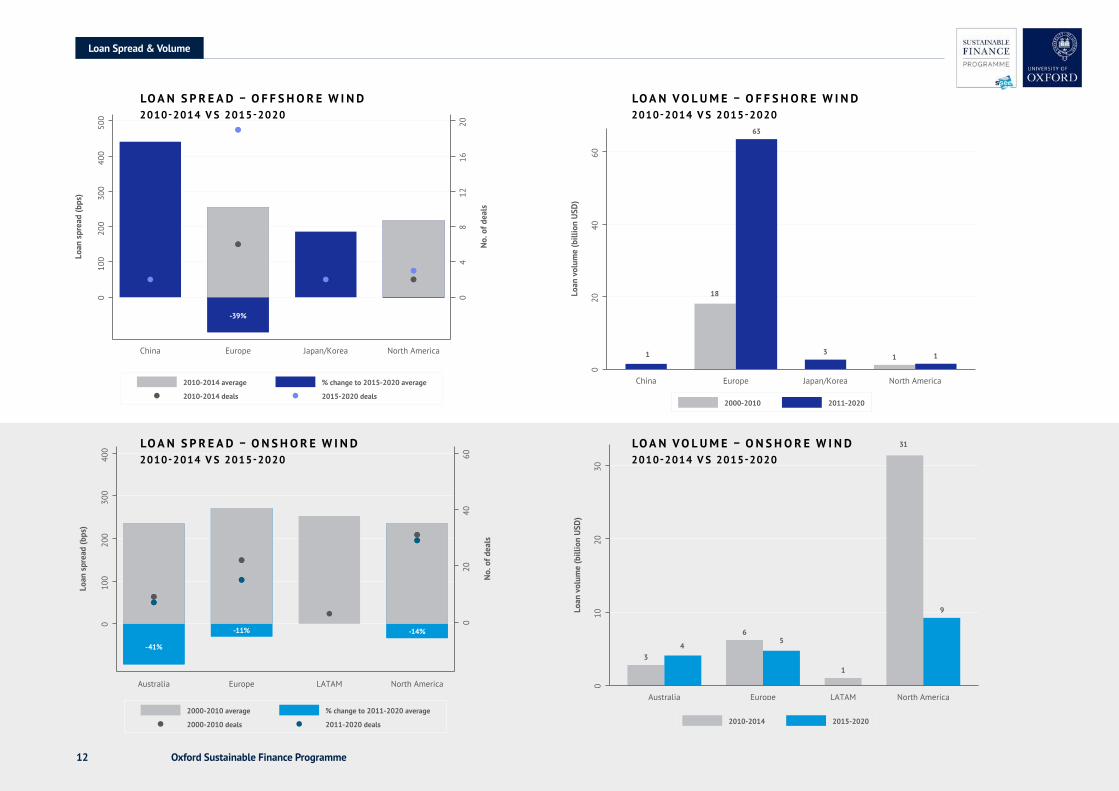
O F F S H O R E W I N D
• Globally, between 2010-2014 and 2015-2020, loan spreads for offshore wind have fallen 33%.
• Over this time period, spreads fell 39% in Europe, and loan volumes have grown from $18 billion to $63 billion. Since 2010 the vast majority of loans have been issued to European firms. In North America, average loan spreads have dropped by only 1%, while loan volumes have increased from $1.2 billion to $1.5 billion.
O N S H O R E W I N D
• Comparing the average loan spread in 2010-2014 with 2015-2020, onshore wind loan spreads have decreased by 15% globally, and fallen in Australia, Europe and North America by 41%, 11% and 14% respectively.
• The vast majority of loans have been issued to American firms.
Power generation
3 For solar PV and wind, the focus is on more recent transactions, as there is limited historical data before 2010.
Oxford Sustainable Finance Programme102000-2010 average % change to 2011-2020 average
2000-2010 deals 2011-2020 deals
63%
47%
63%
05
1015
20
No.
of d
eals
Loan
spr
ead
(bps
)
010
020
030
040
050
0
ASEAN China Europe India LATAM North America
2000-2010 average % change to 2011-2020 average
2000-2010 deals 2011-2020 deals
63%
47%
63%
05
1015
20
No.
of d
eals
Loan
spr
ead
(bps
)
010
020
030
040
050
0
ASEAN China Europe India LATAM North America
2000-2010 2011-2020
6
15
3
66
14
1
14
8
Loan
vol
ume
(bill
ion
USD
)
05
1015
ASEAN China Europe India LATAM North America
2000-2010 2011-2020
6
15
3
66
14
1
14
8
Loan
vol
ume
(bill
ion
USD
)
05
1015
ASEAN China Europe India LATAM North America
LoanSpread&Volume
LO A N V O L U M E B Y T E C H N O LO G Y 2007-2010V S 2017-2020
2007-2010 average % change to 2017-2020 average
2007-2010 deals 2017-2020 deals
No.
of d
eals
Loan
spr
ead
(bps
)
4%
30%
-12%-24%
8%
-2%
38%
7%
020
4060
80
010
020
030
040
0
Biopower
Hydropower
Onshore wind
Offshore wind
Solar CSPSolar PV
Coal power plant
Gas power plant
Renewables Fossil fuel
2007-2010 average % change to 2017-2020 average
2007-2010 deals 2017-2020 deals
No.
of d
eals
Loan
spr
ead
(bps
)
4%
30%
-12%-24%
8%
-2%
38%
7%
020
4060
80
010
020
030
040
0
Biopower
Hydropower
Onshore wind
Offshore wind
Solar CSPSolar PV
Coal power plant
Gas power plant
Renewables Fossil fuel
2007-2010 2017-2020
Loan
vol
ume
(bill
ion
USD
)
Renewables Fossil fuel
Biopow
er
Hydrop
ower
Offsho
re wind
Onsho
re wind
Solar
CSP
Solar
PV
Coal p
ower
plant
Gas po
wer pla
nt
0.5 0.1
35
47
31
104
50
159 8 11
31
1712
59
77
020
4060
8010
0
2007-2010 2017-2020
Loan
vol
ume
(bill
ion
USD
)
Renewables Fossil fuel
Biopow
er
Hydrop
ower
Offsho
re wind
Onsho
re wind
Solar
CSP
Solar
PV
Coal p
ower
plant
Gas po
wer pla
nt
0.5 0.1
35
47
31
104
50
159 8 11
31
1712
59
77
020
4060
8010
0
LO A N S P R E A D B Y T E C H N O LO G Y 2007-2010V S 2017-2020
LO A N V O L U M E – C O A L P O W E R P LA N T, 2000-2010 V S 2011-2020LO A N S P R E A D – C O A L P O W E R P LA N T 2000-2010 V S 2011-2020
Oxford Sustainable Finance Programme11 2010-2014 average % change to 2015-2020 average
2010-2014 deals 2015-2020 deals
-27% -32%
020
4060
No.
of d
eals
Loan
spr
ead
(bps
)
010
020
030
0
Australia Europe LATAM MENA North Americanmsc
2010-2014 average % change to 2015-2020 average
2010-2014 deals 2015-2020 deals
-27% -32%
020
4060
No.
of d
eals
Loan
spr
ead
(bps
)
010
020
030
0
Australia Europe LATAM MENA North Americanmsc
2010-2014 2015-2020
Loan
vol
ume
(bill
ion
USD
)
12
3
1
7
15
19
05
1015
20
Australia Europe LATAM MENA North American
2010-2014 2015-2020
Loan
vol
ume
(bill
ion
USD
)
12
3
1
7
15
19
05
1015
20
Australia Europe LATAM MENA North American
LoanSpread&Volume
LO A N V O L U M E – S O LA R P V2010-2014 V S 2015-2020
2000-2010 average % change to 2011-2020 average
2000-2010 deals 2011-2020 deals
-23%
199%
82%24%
16%
010
2030
40
No.
of d
eals
Loan
spr
ead
(bps
)
010
020
030
040
0
ASEANAustra
liaChina
Europe
Japan/KoreaLATAM
MENA
North America
2000-2010 average % change to 2011-2020 average
2000-2010 deals 2011-2020 deals
-23%
199%
82%24%
16%
010
2030
40
No.
of d
eals
Loan
spr
ead
(bps
)
010
020
030
040
0
ASEANAustra
liaChina
Europe
Japan/KoreaLATAM
MENA
North America
2000-2010 2011-2020
3.0 4.3 6.32.3 0.3
43.1
0.56.1
1.8
20.5
6.4
17.4
106.1
Loan
vol
ume
(bill
ion
USD
)
020
4060
8010
0
ASEANAustra
liaChina
Europe
Japan/KoreaLATAM
MENA
North America
2000-2010 2011-2020
2000-2010 2011-2020
3.0 4.3 6.32.3 0.3
43.1
0.56.1
1.8
20.5
6.4
17.4
106.1
Loan
vol
ume
(bill
ion
USD
)
020
4060
8010
0
ASEANAustra
liaChina
Europe
Japan/KoreaLATAM
MENA
North America
2000-2010 2011-2020
LO A N V O L U M E – G A S P O W E R P LA N T2000-2010 V S 2011-2020
LO A N S P R E A D – G A S P O W E R P LA N T2000-2010 V S 2011-2020
LO A N S P R E A D – S O LA R P V2010-2014 V S 2015-2020
Oxford Sustainable Finance Programme12
LoanSpread&Volume
2000-2010 average % change to 2011-2020 average
2000-2010 deals 2011-2020 deals
-41%
-11% -14%
020
4060
No.
of d
eals
Loan
spr
ead
(bps
)
010
020
030
040
0
Australia Europe LATAM North America
2000-2010 average % change to 2011-2020 average
2000-2010 deals 2011-2020 deals
-41%
-11% -14%
020
4060
No.
of d
eals
Loan
spr
ead
(bps
)
010
020
030
040
0
Australia Europe LATAM North America
2010-2014 2015-2020
34
65
1
31
9Loan
vol
ume
(bill
ion
USD
)
010
2030
Australia Europe LATAM North America
2010-2014 2015-2020
34
65
1
31
9Loan
vol
ume
(bill
ion
USD
)
010
2030
Australia Europe LATAM North America
LO A N V O L U M E – O F F S H O R E W I N D2010-2014 V S 2015-2020
2010-2014 average % change to 2015-2020 average
2010-2014 deals 2015-2020 deals
-39%
04
812
1620
No.
of d
eals
Loan
spr
ead
(bps
)
010
020
030
040
050
0
China Europe Japan/Korea North America
2010-2014 average % change to 2015-2020 average
2010-2014 deals 2015-2020 deals
-39%
04
812
1620
No.
of d
eals
Loan
spr
ead
(bps
)
010
020
030
040
050
0
China Europe Japan/Korea North America
2000-2010 2011-2020
1
18
63
31 1
Loan
vol
ume
(bill
ion
USD
)
020
4060
China Europe Japan/Korea North America
2000-2010 2011-2020
1
18
63
31 1
Loan
vol
ume
(bill
ion
USD
)
020
4060
China Europe Japan/Korea North America
LO A N S P R E A D – O F F S H O R E W I N D2010-2014 V S 2015-2020
LO A N V O L U M E – O N S H O R E W I N D2010-2014 V S 2015-2020
LO A N S P R E A D – O N S H O R E W I N D 2010-2014 V S 2015-2020
Oxford Sustainable Finance Programme13
1 I N T R O D U C T I O N 15
2 L I T E R AT U R E R E V I E W 16
2.1C L I M AT E -R E LAT E DT RAN S I T I O N R I S K S 16
2.1.1 Policy Risk 17
2.1.2 Technology Risk 19
2.1.3 Legal Risk 21
2.1.4 Climate Risk and The Cost of Capital 22
2.2T H E CO S TO F CA P I TA LA NDT H E R E A L E CONOMY 23
2.2.1 Corporate Finance Theory 23
2.2.2 Investor risk preferences and investment decisions 25
2.2.3 Electric Power and the Cost of Capital 26
2.2.4 Oil & Gas and the Cost of Capital 27
2.2.5 Estimating the cost of capital 28
3 C H A N G E S I N T H E C O S T O F C A P I TA L 30
3.1 Cost of Debt in the Loan Market 30
4 C O N C L U S I O N 51
Table of Contents
Contents
F I G U R E L I S T
F I G U R E 1 Achieving net-zero in the UK – additional investment and operating cost savings by year 15
F I G U R E 2 NGFS Scenarios 17
F I G U R E 3 Unsubsised cost of electricity generation by technology type 20
F I G U R E 4 Numbers of cases against Carbon Majors, Jan 2005-May 2020 21
F I G U R E 5 Transition Risk and the Cost of Capital 23
F I G U R E 6 Uses of the Cost of capital 24
F I G U R E 7 Valuation
F I G U R E 8 Relationship between the asset and liability cost of capital 24
F I G U R E 9 Capital allocation with a uniform cost of capital 26
F I G U R E 10 Cost composition and levelised electricity costs with varying WACC 26
F I G U R E 11 Hurdle rate of return for energy projects from investor survey 31
F I G U R E 12 Loan spread, 2000-2010 vs 2011-2020 31
F I G U R E 13 Loan volume, 2000-2010 vs 2011-2020 31
24
Oxford Sustainable Finance Programme14
Contents
F I G U R E L I S T
F I G U R E 14 Loan spread, 2007-2010 vs 2017-2020 31
F I G U R E 15 Loan volume, 2007-2010 vs 2017-2020 32
F I G U R E 16 Loan spread by energy type, 2000-2010 vs 2011-2020 33
F I G U R E 17 Loan volume by energy type, 2000-2010 vs 2011-2020 33
F I G U R E 18 Loan spread by energy type, 2007-2010 vs 2017-2020 33
F I G U R E 19 Loan volume by energy type, 2007-2010 vs 2017-2020 33
F I G U R E 20 Loan spread and loan volume by country/region and energy type, 2000-2010 vs 2011-2020 34-38
F I G U R E 21 Power Generation, Loan spread, 2000-2010 vs 2011-2020 42
F I G U R E 22 Loan volume, 2000-2010 vs 2011-2020 42
F I G U R E 23 Loan spread, 2007-2010 vs 2017-2020 42
F I G U R E 24 Loan volume, 2007-2010 vs 2017-2020 42
F I G U R E 25 Loan spread by technology, 2000-2010 vs 2011-2020 43
F I G U R E 26 Loan volume by technology, 2000-2010 vs 2011-2020 43
F I G U R E 27 Loan spread by technology, 2007-2010 vs 2017-2020 44
F I G U R E 28 Loan volume by technology, 2007-2010 vs 2017-2020 44
F I G U R E 29 Loan spread and loan volume by country/region and power generation technology 45-48
Oxford Sustainable Finance Programme15
Introduction
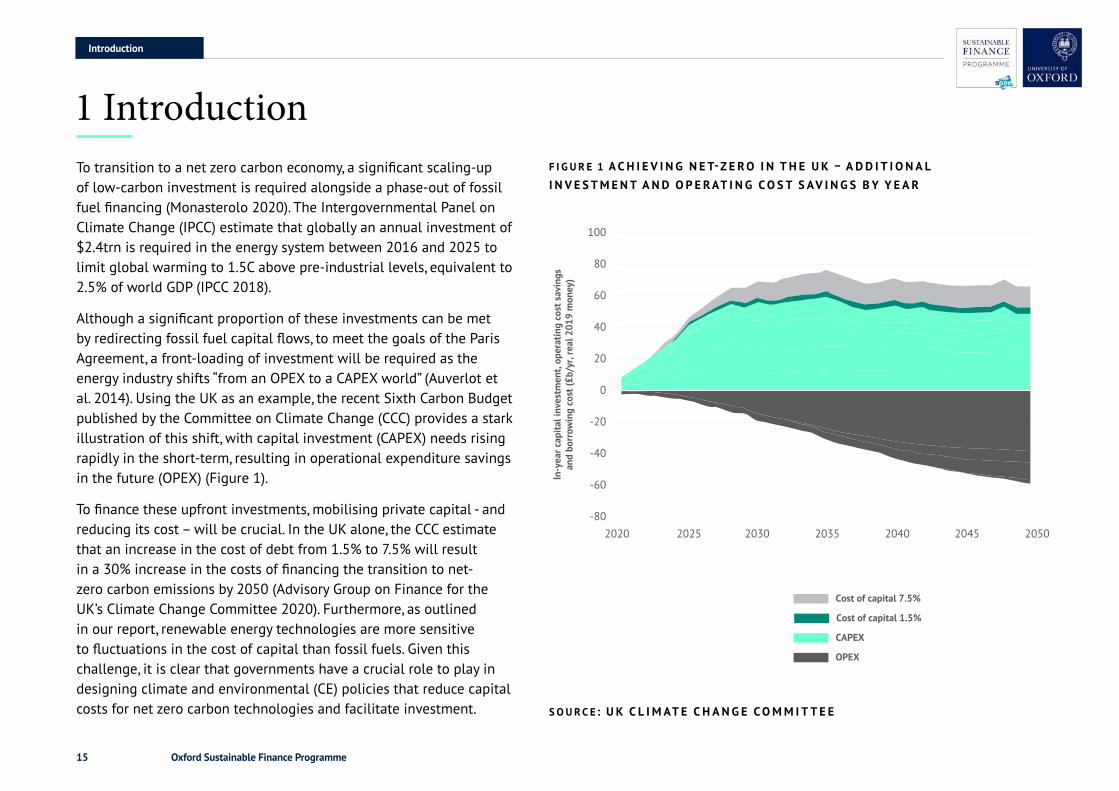
To transition to a net zero carbon economy, a significant scaling-up of low-carbon investment is required alongside a phase-out of fossil fuel financing (Monasterolo 2020). The Intergovernmental Panel on Climate Change (IPCC) estimate that globally an annual investment of $2.4trn is required in the energy system between 2016 and 2025 to limit global warming to 1.5C above pre-industrial levels, equivalent to 2.5% of world GDP (IPCC 2018).
Although a significant proportion of these investments can be met by redirecting fossil fuel capital flows, to meet the goals of the Paris Agreement, a front-loading of investment will be required as the energy industry shifts “from an OPEX to a CAPEX world” (Auverlot et al. 2014). Using the UK as an example, the recent Sixth Carbon Budget published by the Committee on Climate Change (CCC) provides a stark illustration of this shift, with capital investment (CAPEX) needs rising rapidly in the short-term, resulting in operational expenditure savings in the future (OPEX) (Figure 1).
To finance these upfront investments, mobilising private capital - and reducing its cost – will be crucial. In the UK alone, the CCC estimate that an increase in the cost of debt from 1.5% to 7.5% will result in a 30% increase in the costs of financing the transition to net-zero carbon emissions by 2050 (Advisory Group on Finance for the UK’s Climate Change Committee 2020). Furthermore, as outlined in our report, renewable energy technologies are more sensitive to fluctuations in the cost of capital than fossil fuels. Given this challenge, it is clear that governments have a crucial role to play in designing climate and environmental (CE) policies that reduce capital costs for net zero carbon technologies and facilitate investment.
1 Introduction
S O U R C E : U KC L I M AT E C H ANG E COMM I T T E E
40
20
Cost of capital 1.5%
OPEX
CAPEX
Cost of capital 7.5%
100
80
60
-20
-40
-60
-802020 2025 2030 2035 2040 2045 2050
In-y
ear c
apita
l inv
estm
ent,
oper
atin
g co
st s
avin
gsan
d bo
rrow
ing
cost
(£b/
yr, r
eal 2
019
mon
ey)
0
F I G U R E 1 A C H I E V I N G N E T-Z E RO I N T H E U K– A D D I T I O N A L I N V E S T M E N T A N D O P E R AT I N G C O S T S AV I N G S B Y Y E A R
Oxford Sustainable Finance Programme16
TransitionRisks
2.1C L I M AT E -R E LAT E DT RAN S I T I O N R I S K S
A transition to a net zero carbon economy must occur for the goals of the Paris Agreement to be met. This transition can be defined as a structural economic change, in which “sunrise” industries displace incumbent “sunset” industries, with the transformation driven by policy, technology and changing preferences (Semieniuk et al. 2020). Within this transition, to ensure that the global “carbon budget” in line with the Paris goals is not exceeded, a significant proportion of global fossil fuel reserves must stay in the ground (Friedlingstein et al. 2014; Raupach et al. 2014). For example, in a 2°C scenario without carbon capture storage (CCS), McGlade and Ekins (2015) estimate that 82% of coal reserves, 33% of oil reserves, and 49% of gas reserves must not be extracted.
The alignment of the global economy with the goals of the Paris Agreement will, therefore, have consequences for the assets, companies, and investors dependent on these fossil fuel reserves. These natural and physical assets are at risk of becoming “stranded”, defined as “assets that have suffered from unanticipated or premature write-downs, devaluations, or conversion to liabilities” (Caldecott et al. 2013). Under a scenario with strong climate policy, Linquiti and Cogswell (2016) estimate that 63% of global fossil fuel reserves in monetary terms could be stranded. There are also implications for downstream physical assets. Pfeiffer et al. (2016) estimate that to limit global temperature rises to 2°C, the compatible stock of electricity generation assets would be reached in 2017, with non-renewable infrastructure built after this date at risk of stranding. In developing markets, where the majority of new fossil fuel infrastructure is being built, this risk is particularly acute (Caldecott et al. 2015). Farfan and
2 Literature review
Breyer (2016) estimate that 59% and 22% of all coal power plants at risk of stranding are in China and India respectively.
In developed markets such as the EU, stranded asset risks have arguably already materialised, with asset write-downs increasing six-fold since 2008 among the largest 14 coal utilities (Caldecott et al. 2017). While in the oil & gas sector, the growth of undeveloped reserves on firms balance sheets is shown to reduce firm value, especially when extraction costs are high (Atanasova & Schwartz 2019). These risks can be material for financial institutions holding real assets or equity and corporate bonds. In a climate stress-test of the financial system Battiston et al. (2017) calculate that the direct equity exposure of investors to the fossil fuel sector is 4-13%, with indirect exposure to climate-relevant sectors of 36-48%.
The Bank of England (2015) and Carney (2015) identify three types of climate-related financial risk: physical risk, transition risk, and liability risk. In Batten et al. (2017), transition risk is defined as “the risks of economic dislocation and financial losses associated with the transition to a lower-carbon economy”. There are many different types of transition risk: policy risk, legal risk, technology risk, market risk, and reputational risk (TCFD, 2017). The following section discusses policy risk in more detail along with technology and legal risk. We also review the literature on the relationship between climate-related risks and the cost of capital, and detail how the cost of capital plays an important role in corporate finance decisions, focusing on electric power and oil & gas. Finally, we outline different approaches to estimating the cost of capital.
Oxford Sustainable Finance Programme17
Policyrisk
2.1.1 PO L I CYR I S K
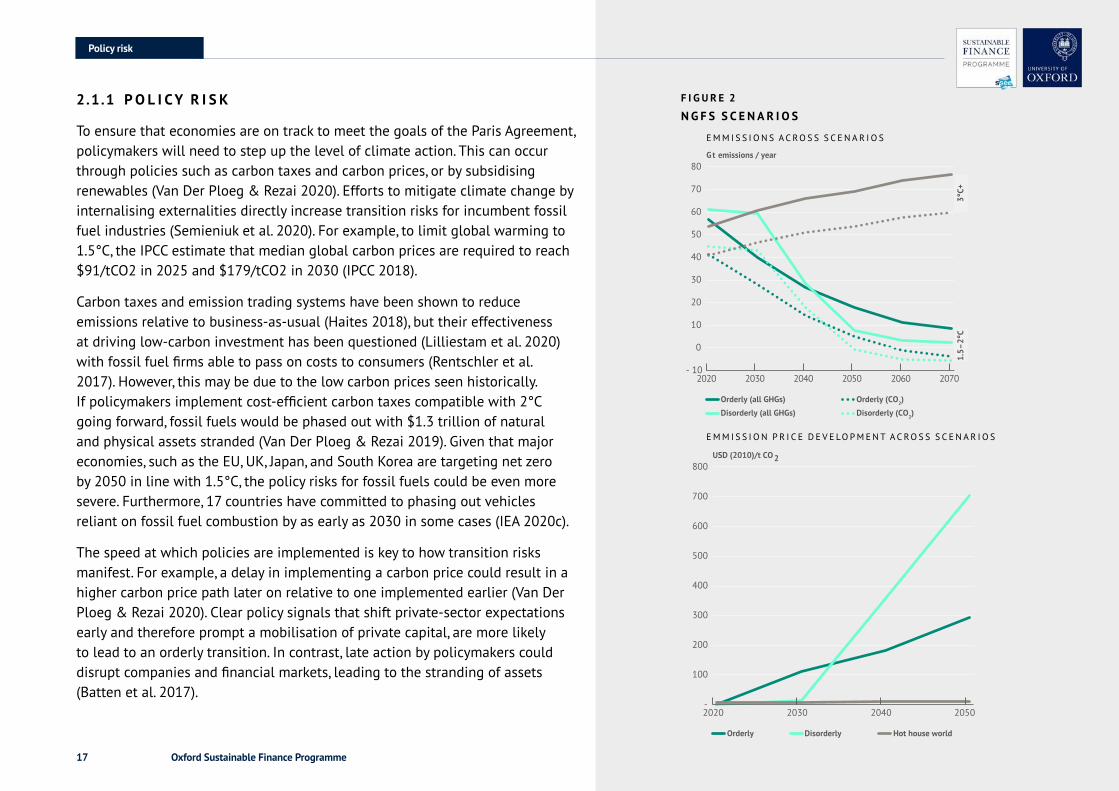
To ensure that economies are on track to meet the goals of the Paris Agreement, policymakers will need to step up the level of climate action. This can occur through policies such as carbon taxes and carbon prices, or by subsidising renewables (Van Der Ploeg & Rezai 2020). Efforts to mitigate climate change by internalising externalities directly increase transition risks for incumbent fossil fuel industries (Semieniuk et al. 2020). For example, to limit global warming to 1.5°C, the IPCC estimate that median global carbon prices are required to reach $91/tCO2 in 2025 and $179/tCO2 in 2030 (IPCC 2018).
Carbon taxes and emission trading systems have been shown to reduce emissions relative to business-as-usual (Haites 2018), but their effectiveness at driving low-carbon investment has been questioned (Lilliestam et al. 2020) with fossil fuel firms able to pass on costs to consumers (Rentschler et al. 2017). However, this may be due to the low carbon prices seen historically. If policymakers implement cost-efficient carbon taxes compatible with 2°C going forward, fossil fuels would be phased out with $1.3 trillion of natural and physical assets stranded (Van Der Ploeg & Rezai 2019). Given that major economies, such as the EU, UK, Japan, and South Korea are targeting net zero by 2050 in line with 1.5°C, the policy risks for fossil fuels could be even more severe. Furthermore, 17 countries have committed to phasing out vehicles reliant on fossil fuel combustion by as early as 2030 in some cases (IEA 2020c).
The speed at which policies are implemented is key to how transition risks manifest. For example, a delay in implementing a carbon price could result in a higher carbon price path later on relative to one implemented earlier (Van Der Ploeg & Rezai 2020). Clear policy signals that shift private-sector expectations early and therefore prompt a mobilisation of private capital, are more likely to lead to an orderly transition. In contrast, late action by policymakers could disrupt companies and financial markets, leading to the stranding of assets (Batten et al. 2017).
- 10
0
10
20
30
40
50
60
70
80
2020 2030 2040 2050 2060 2070
Gt emissions / year
Orderly (all GHGs) Orderly (CO2)
Disorderly (all GHGs) Disorderly (CO2)
3°C+
1.5–
2°C
Orderly Disorderly Hot house world
-
100
200
300
400
500
600
700
800
2020 2030 2040 2050
USD (2010)/t CO2
- 10
0
10
20
30
40
50
60
70
80
2020 2030 2040 2050 2060 2070
Gt emissions / year
Orderly (all GHGs) Orderly (CO2)
Disorderly (all GHGs) Disorderly (CO2)
3°C+
1.5–
2°C
Orderly Disorderly Hot house world
-
100
200
300
400
500
600
700
800
2020 2030 2040 2050
USD (2010)/t CO2
F I G U R E 2
N G F S S C E N A R I O S
E M M I S S I O N S A C R O S S S C E N A R I O S
E M M I S S I O N P R I C E D E V E LO P M E N T A C R O S S S C E N A R I O S
Oxford Sustainable Finance Programme18
Policyrisk
This dynamic is reflected in the climate stress test scenarios developed by the Network for Greening the Financial System (NGFS), a group of central banks and supervisors. As shown in Figure 2, the NGFS provide an “orderly” scenario with optimal carbon pricing introduced immediately, and a “disorderly” scenario with optimal carbon pricing introduced in 2030 (NGFS 2020). In the “disorderly” scenario, one could see “markets potentially repricing sharply, and the provision of financial services perhaps disrupted” (NGFS 2020). Whereas in an orderly transition, investors predict climate policy and incorporate it into risk management and asset allocation, shifting portfolios towards low-carbon assets overtime (Monasterolo 2020). Similarly, when banks anticipate changes in climate policy, this could reduce risks to financial stability and accelerate green investments (Dunz et al. 2020).
Policies such as carbon pricing can alter the cost competitiveness of fossil fuels relative to renewables (Polzin et al. 2019). However, over 80% of high to middle-income countries have also adopted policies that support renewables directly, such as feed-in tariffs and power purchase agreements (IRENA, IEA, & REN21 2018). The success of these policies, which can have a strong enabling effect on investment (Polzin et al. 2019), depends on a stable policy environment. Policy risk is, therefore, not exclusive to fossil fuels but can also affect renewables (Karneyeva & Wüstenhagen 2017). Retroactive changes to the policy environment can occur (Dio et al. 2015) with negative impacts on renewables profitability (De et al. 2016).
As well as stability, policy design is important. With renewables cost-competitive in many jurisdictions with fossil fuels, a transition towards market-based policies, such as wholesale price or premium auctions, will increase the exposure of renewables to price volatility (Egli 2020) and increase risk margins (Pahle & Schweizerhof 2016). This move from policy risk to market risk is expected, as technological advancements reduce
reliance on policy support. In fact, Egli (2020) find that the importance of policy risk in determining renewables investment risk has fallen relative to other risk factors between 2009 and 2017, while price has become the most important risk factor.
Pol ic ies such as carbon pric ing can alter the cost competit iveness of fossi l fuel relat ive to renewables
Oxford Sustainable Finance Programme19
Technologyrisk
2.1.2 T E C HNO LOGYR I S K
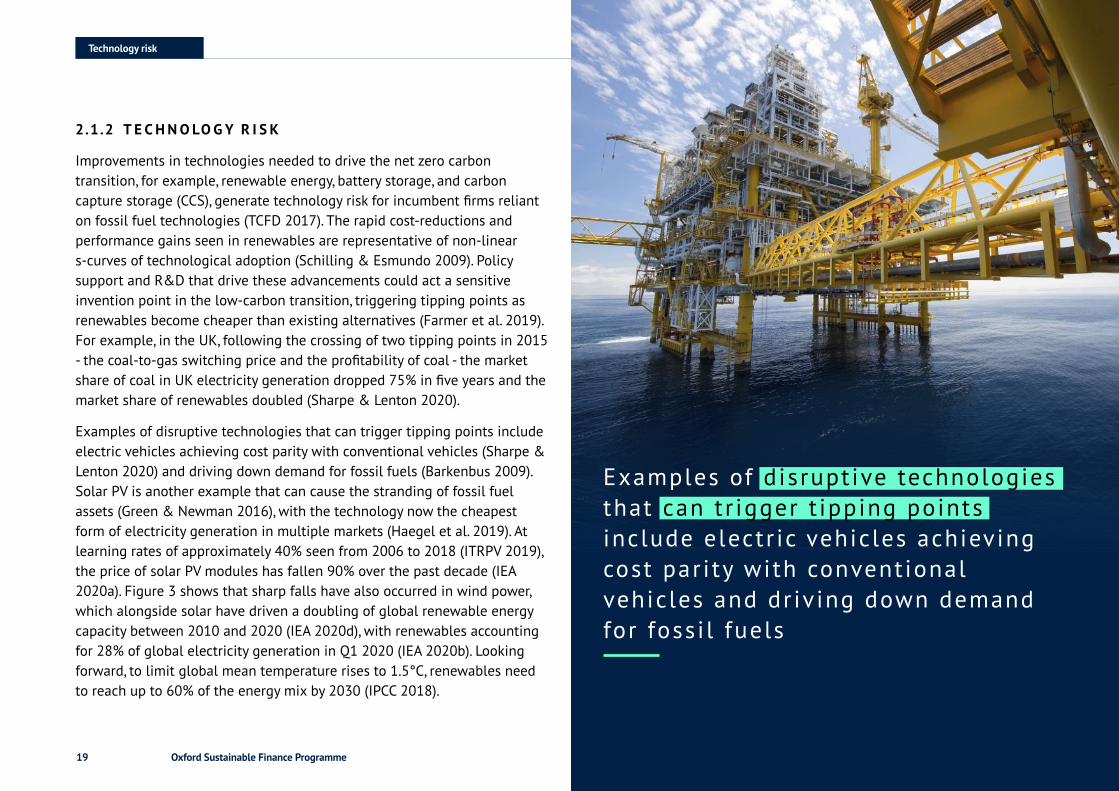
Improvements in technologies needed to drive the net zero carbon transition, for example, renewable energy, battery storage, and carbon capture storage (CCS), generate technology risk for incumbent firms reliant on fossil fuel technologies (TCFD 2017). The rapid cost-reductions and performance gains seen in renewables are representative of non-linear s-curves of technological adoption (Schilling & Esmundo 2009). Policy support and R&D that drive these advancements could act a sensitive invention point in the low-carbon transition, triggering tipping points as renewables become cheaper than existing alternatives (Farmer et al. 2019). For example, in the UK, following the crossing of two tipping points in 2015 - the coal-to-gas switching price and the profitability of coal - the market share of coal in UK electricity generation dropped 75% in five years and the market share of renewables doubled (Sharpe & Lenton 2020).
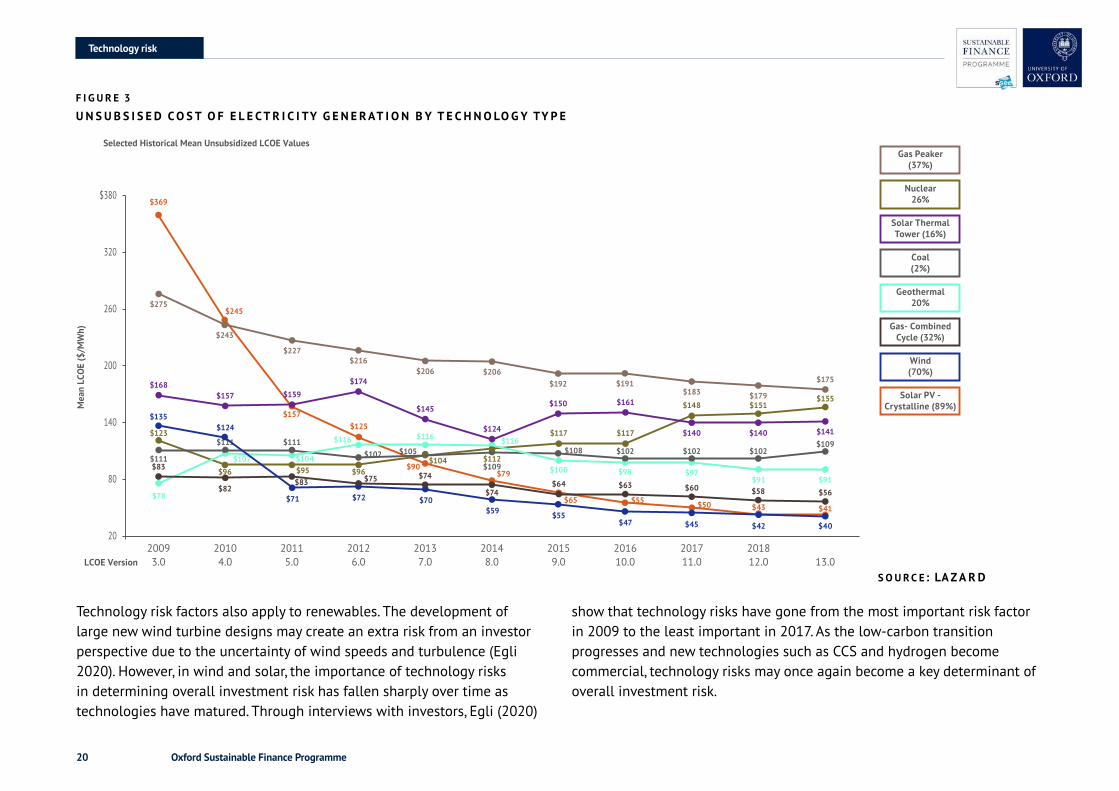
Examples of disruptive technologies that can trigger tipping points include electric vehicles achieving cost parity with conventional vehicles (Sharpe & Lenton 2020) and driving down demand for fossil fuels (Barkenbus 2009). Solar PV is another example that can cause the stranding of fossil fuel assets (Green & Newman 2016), with the technology now the cheapest form of electricity generation in multiple markets (Haegel et al. 2019). At learning rates of approximately 40% seen from 2006 to 2018 (ITRPV 2019), the price of solar PV modules has fallen 90% over the past decade (IEA 2020a). Figure 3 shows that sharp falls have also occurred in wind power, which alongside solar have driven a doubling of global renewable energy capacity between 2010 and 2020 (IEA 2020d), with renewables accounting for 28% of global electricity generation in Q1 2020 (IEA 2020b). Looking forward, to limit global mean temperature rises to 1.5°C, renewables need to reach up to 60% of the energy mix by 2030 (IPCC 2018).
Examples of disruptive technologies that can tr igger t ipping points include electr ic vehicles achieving cost parity with conventional vehicles and driving down demand for fossi l fuels
Oxford Sustainable Finance Programme20
Technology risk factors also apply to renewables. The development of large new wind turbine designs may create an extra risk from an investor perspective due to the uncertainty of wind speeds and turbulence (Egli 2020). However, in wind and solar, the importance of technology risks in determining overall investment risk has fallen sharply over time as technologies have matured. Through interviews with investors, Egli (2020)
show that technology risks have gone from the most important risk factor in 2009 to the least important in 2017. As the low-carbon transition progresses and new technologies such as CCS and hydrogen become commercial, technology risks may once again become a key determinant of overall investment risk.
F I G U R E 3
U N S U B S I S E D C O S T O F E L E C T R I C I TY G E N E R AT I O N B Y T E C H N O LO G Y TY P E
Technologyrisk
$380
320
260
200
140
80
2020093.0
20104.0
20115.0
20126.0
20137.0
20148.0
20159.0
201610.0
201711.0
201812.0 13.0
Selected Historical Mean Unsubsidized LCOE Values
Mea
n LC
OE
($/M
Wh)
LCOE Version
$275
$123
$111
$96
Gas Peaker(37%)
Nuclear26%
Solar ThermalTower (16%)
Coal(2%)
Geothermal20%
Gas- CombinedCycle (32%)
Wind(70%)
Solar PV -Crystalline (89%)
$168
$111 $111$102 $105
$109
$108 $102
$97$98$100
$116$116$116
$104$107
$78
$102 $102$109
$91$56
$40
$41$43$50$55$65
$79$90
$125$157
$245
$369
$42$45$47$55$59
$70$72$71
$124$135
$58$60$63$64$74
$74 $91
$157 $159
$174
$145
$124
$150 $161
$140 $140 $141
$96$104 $112
$117 $117
$148 $151$155
$95
$243
$227$216
$206 $206$192 $191
$183 $179
$175
$75$83
$83
$82
S O U R C E : LA Z A R D
Oxford Sustainable Finance Programme21
Legalrisk
2.1.3 L E G A LR I S K
Another key risk for companies and their investors is legal. Litigation against companies can occur due to insufficient action to tackle carbon emissions, breaches of environmental laws and regulations, and a failure to disclose climate-related risks. As the damages from climate change grow, climate change litigation is likely to accelerate (TCFD 2017).
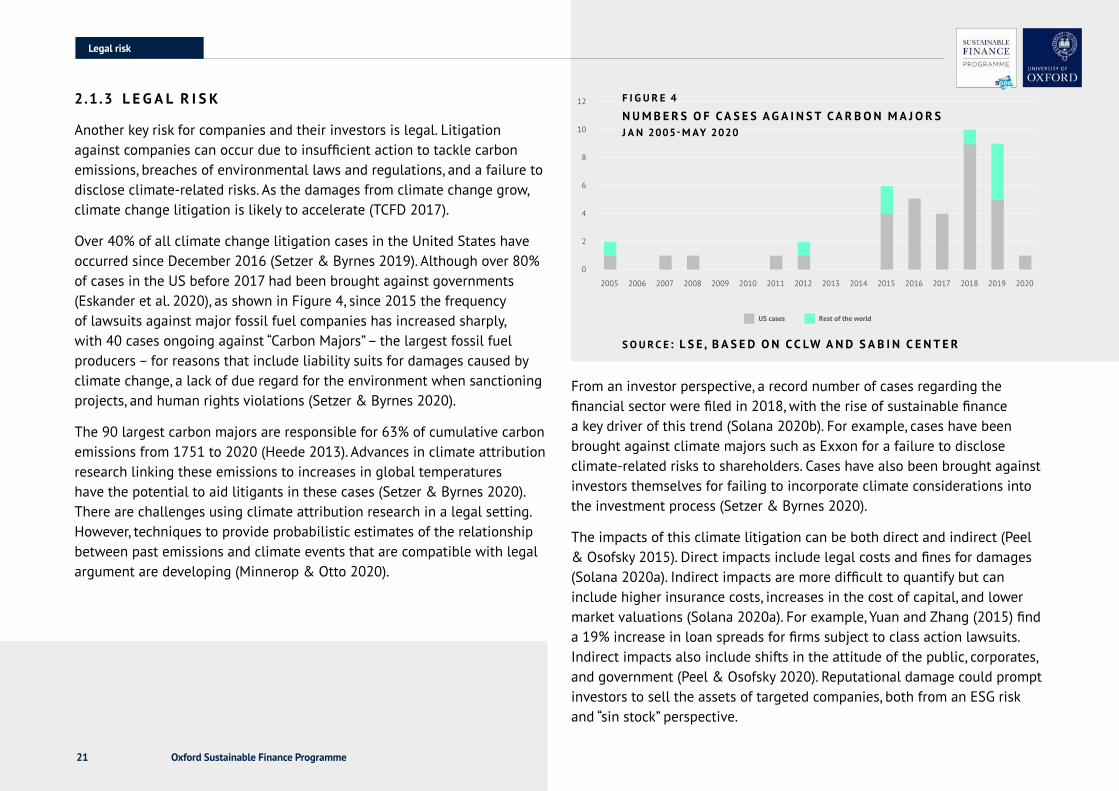
Over 40% of all climate change litigation cases in the United States have occurred since December 2016 (Setzer & Byrnes 2019). Although over 80% of cases in the US before 2017 had been brought against governments (Eskander et al. 2020), as shown in Figure 4, since 2015 the frequency of lawsuits against major fossil fuel companies has increased sharply, with 40 cases ongoing against “Carbon Majors” – the largest fossil fuel producers – for reasons that include liability suits for damages caused by climate change, a lack of due regard for the environment when sanctioning projects, and human rights violations (Setzer & Byrnes 2020).
The 90 largest carbon majors are responsible for 63% of cumulative carbon emissions from 1751 to 2020 (Heede 2013). Advances in climate attribution research linking these emissions to increases in global temperatures have the potential to aid litigants in these cases (Setzer & Byrnes 2020). There are challenges using climate attribution research in a legal setting. However, techniques to provide probabilistic estimates of the relationship between past emissions and climate events that are compatible with legal argument are developing (Minnerop & Otto 2020).
From an investor perspective, a record number of cases regarding the financial sector were filed in 2018, with the rise of sustainable finance a key driver of this trend (Solana 2020b). For example, cases have been brought against climate majors such as Exxon for a failure to disclose climate-related risks to shareholders. Cases have also been brought against investors themselves for failing to incorporate climate considerations into the investment process (Setzer & Byrnes 2020).
The impacts of this climate litigation can be both direct and indirect (Peel & Osofsky 2015). Direct impacts include legal costs and fines for damages (Solana 2020a). Indirect impacts are more difficult to quantify but can include higher insurance costs, increases in the cost of capital, and lower market valuations (Solana 2020a). For example, Yuan and Zhang (2015) find a 19% increase in loan spreads for firms subject to class action lawsuits. Indirect impacts also include shifts in the attitude of the public, corporates, and government (Peel & Osofsky 2020). Reputational damage could prompt investors to sell the assets of targeted companies, both from an ESG risk and “sin stock” perspective.
US cases Rest of the world
12
10
8
6
4
2
0
2005 2006 2007 2008 2009 2010 2011 2012 2013 2014 2015 2016 2017 2018 2019 2020
F I G U R E 4
N U M B E R S O F C A S E S A G A I N S T C A R B O N M A J O R S J A N 2005-M AY 2020
S O U R C E : L S E , B A S E D O N C C LW A N D S A B I N C E N T E R
Oxford Sustainable Finance Programme22
Climaterisk
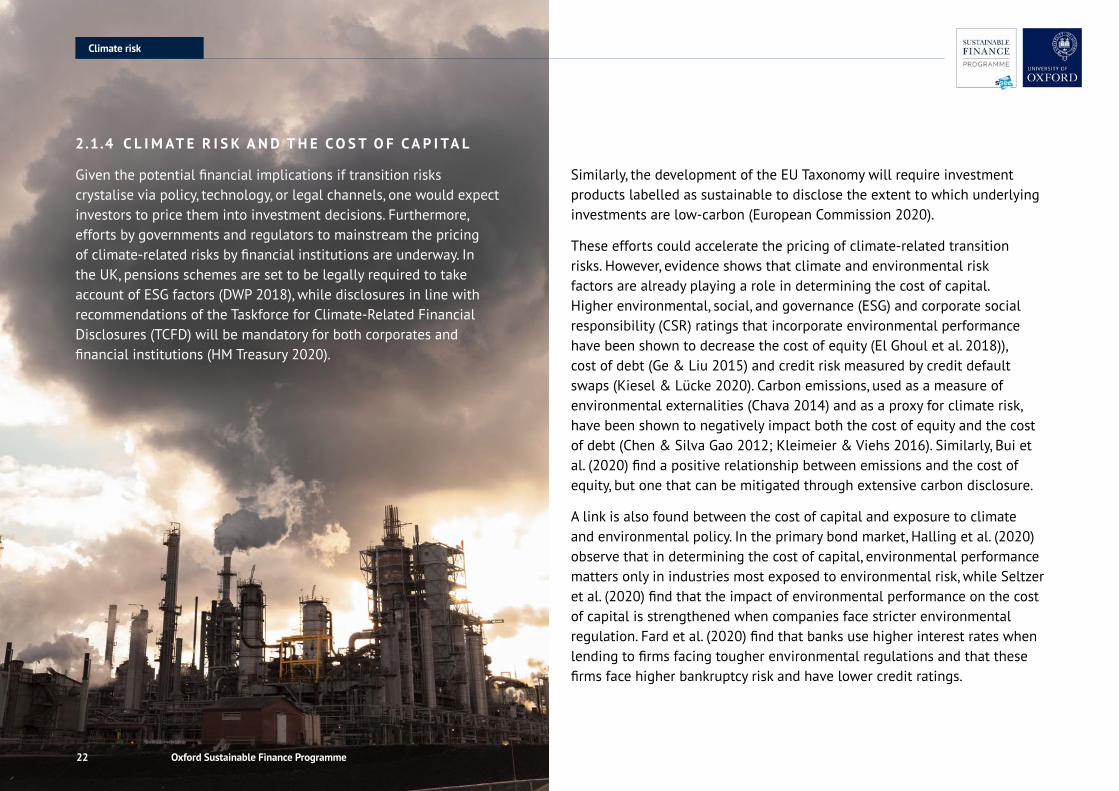
2.1.4 C L I M AT E R I S KA NDT H E CO S TO F CA P I TA L
Given the potential financial implications if transition risks crystalise via policy, technology, or legal channels, one would expect investors to price them into investment decisions. Furthermore, efforts by governments and regulators to mainstream the pricing of climate-related risks by financial institutions are underway. In the UK, pensions schemes are set to be legally required to take account of ESG factors (DWP 2018), while disclosures in line with recommendations of the Taskforce for Climate-Related Financial Disclosures (TCFD) will be mandatory for both corporates and financial institutions (HM Treasury 2020).
Similarly, the development of the EU Taxonomy will require investment products labelled as sustainable to disclose the extent to which underlying investments are low-carbon (European Commission 2020).
These efforts could accelerate the pricing of climate-related transition risks. However, evidence shows that climate and environmental risk factors are already playing a role in determining the cost of capital. Higher environmental, social, and governance (ESG) and corporate social responsibility (CSR) ratings that incorporate environmental performance have been shown to decrease the cost of equity (El Ghoul et al. 2018)), cost of debt (Ge & Liu 2015) and credit risk measured by credit default swaps (Kiesel & Lücke 2020). Carbon emissions, used as a measure of environmental externalities (Chava 2014) and as a proxy for climate risk, have been shown to negatively impact both the cost of equity and the cost of debt (Chen & Silva Gao 2012; Kleimeier & Viehs 2016). Similarly, Bui et al. (2020) find a positive relationship between emissions and the cost of equity, but one that can be mitigated through extensive carbon disclosure.
A link is also found between the cost of capital and exposure to climate and environmental policy. In the primary bond market, Halling et al. (2020) observe that in determining the cost of capital, environmental performance matters only in industries most exposed to environmental risk, while Seltzer et al. (2020) find that the impact of environmental performance on the cost of capital is strengthened when companies face stricter environmental regulation. Fard et al. (2020) find that banks use higher interest rates when lending to firms facing tougher environmental regulations and that these firms face higher bankruptcy risk and have lower credit ratings.
Oxford Sustainable Finance Programme23
Thecostofcapital
The literature shows that action taken by policymakers in accordance with the goals of the Paris Agreement has the potential to severely disrupt fossil fuels industries. Furthermore, evidence shows that environmental and climate risk factors already play a role in determining the cost of capital. In this section, we explore the link between the cost of capital and the investment decisions of energy firms in the real economy, with a focus on the implications for electric utilities and oil & gas.
2.2.1 CO R PORAT E F I N AN C E T H EORY
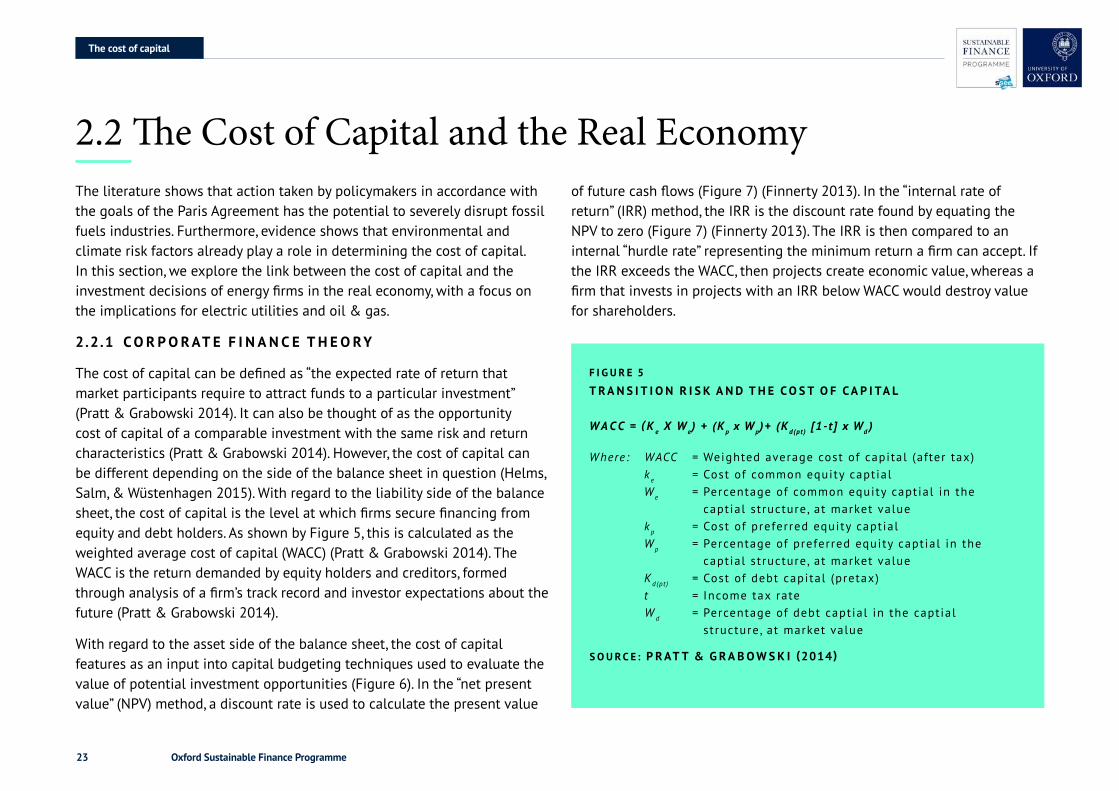
The cost of capital can be defined as “the expected rate of return that market participants require to attract funds to a particular investment” (Pratt & Grabowski 2014). It can also be thought of as the opportunity cost of capital of a comparable investment with the same risk and return characteristics (Pratt & Grabowski 2014). However, the cost of capital can be different depending on the side of the balance sheet in question (Helms, Salm, & Wüstenhagen 2015). With regard to the liability side of the balance sheet, the cost of capital is the level at which firms secure financing from equity and debt holders. As shown by Figure 5, this is calculated as the weighted average cost of capital (WACC) (Pratt & Grabowski 2014). The WACC is the return demanded by equity holders and creditors, formed through analysis of a firm’s track record and investor expectations about the future (Pratt & Grabowski 2014).
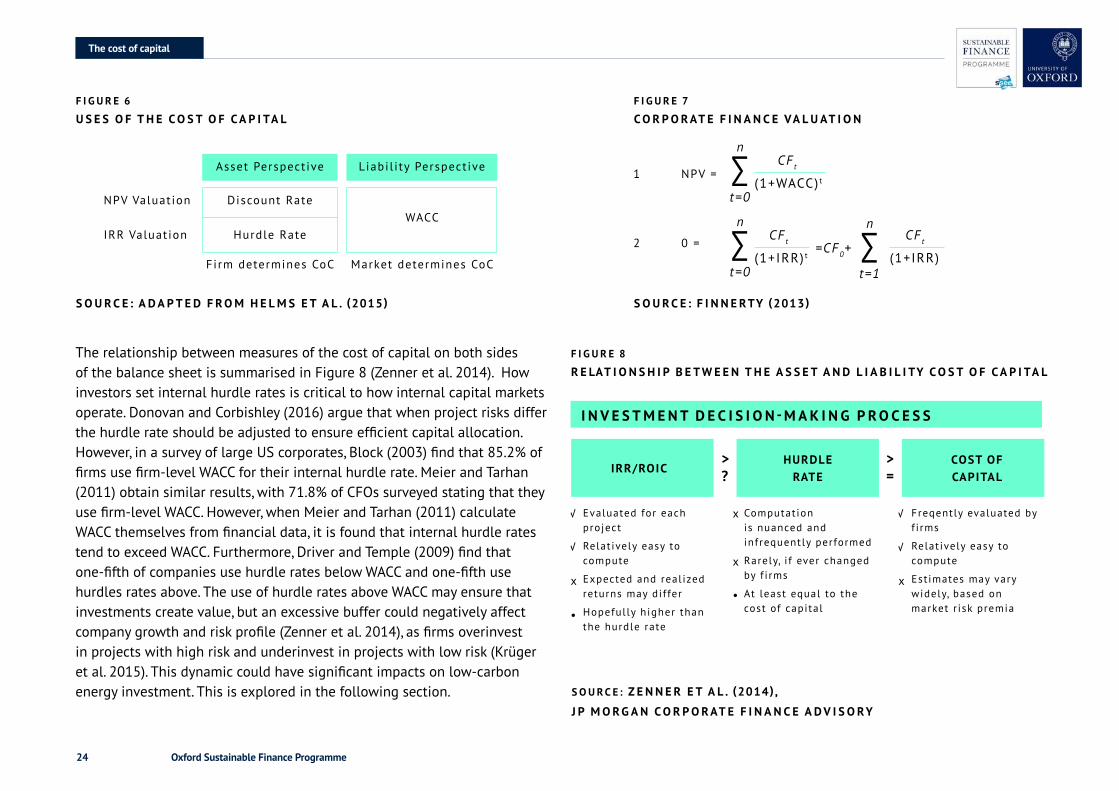
With regard to the asset side of the balance sheet, the cost of capital features as an input into capital budgeting techniques used to evaluate the value of potential investment opportunities (Figure 6). In the “net present value” (NPV) method, a discount rate is used to calculate the present value
2.2 The Cost of Capital and the Real Economyof future cash flows (Figure 7) (Finnerty 2013). In the “internal rate of return” (IRR) method, the IRR is the discount rate found by equating the NPV to zero (Figure 7) (Finnerty 2013). The IRR is then compared to an internal “hurdle rate” representing the minimum return a firm can accept. If the IRR exceeds the WACC, then projects create economic value, whereas a firm that invests in projects with an IRR below WACC would destroy value for shareholders.
F I G U R E 5
T RAN S I T I O N R I S KA NDT H E CO S TO F CA P I TA L
W A C C = ( K e X We) + (Kp x Wp)+ (Kd(pt) [1-t ] x Wd )
Where: WACC = Weighted average cost of capital (after tax)ke = Cost of common equity captialWe = Percentage of common equity captial in the
captial structure , at market valuekp = Cost of preferred equity captialWp = Percentage of preferred equity captial in the
captial structure , at market valueKd(pt) = Cost of debt capital (pretax)t = Income tax rateW d = Percentage of debt captial in the captial
structure , at market value
S O U R C E : P RAT T&G RA BOWSK I (2014 )
Electric Utilities
Oxford Sustainable Finance Programme24
F I G U R E 7 C O R P O R AT E F I N A N C E VA L U AT I O N
SOURC E : A DA P T E DF ROMH E LM S E TA L .(2015 ) S O U R C E : F I N N E R TY (2013 )
The relationship between measures of the cost of capital on both sides of the balance sheet is summarised in Figure 8 (Zenner et al. 2014). How investors set internal hurdle rates is critical to how internal capital markets operate. Donovan and Corbishley (2016) argue that when project risks differ the hurdle rate should be adjusted to ensure efficient capital allocation. However, in a survey of large US corporates, Block (2003) find that 85.2% of firms use firm-level WACC for their internal hurdle rate. Meier and Tarhan (2011) obtain similar results, with 71.8% of CFOs surveyed stating that they use firm-level WACC. However, when Meier and Tarhan (2011) calculate WACC themselves from financial data, it is found that internal hurdle rates tend to exceed WACC. Furthermore, Driver and Temple (2009) find that one-fifth of companies use hurdle rates below WACC and one-fifth use hurdles rates above. The use of hurdle rates above WACC may ensure that investments create value, but an excessive buffer could negatively affect company growth and risk profile (Zenner et al. 2014), as firms overinvest in projects with high risk and underinvest in projects with low risk (Krüger et al. 2015). This dynamic could have significant impacts on low-carbon energy investment. This is explored in the following section.
F I G U R E 8 R E LAT I O N S H I P B E T W E E N T H E A S S E T A N D L I A B I L I TY C O S T O F C A P I TA L
S O U R C E : Z E NN E R E TA L . (2014 ) ,
J P M O R G A N C O R P O R AT E F I N A N C E A D V I S O RY
F I G U R E 6 U S E S O F T H E C O S T O F C A P I TA L
NPV Valuation
IRR Valuation
Evaluated for each project
Relat ively easy to compute
Expected and real ized returns may dif fer
Hopefully higher than the hurdle rate
Computation is nuanced and infrequently performed
Rarely, i f ever changed by f i rms
At least equal to the cost of capital
Freqently evaluated by f i rms
Relat ively easy to compute
Estimates may vary widely, based on market r isk premia
x
x
x
x
•
•
Firm determines CoC Market determines CoC
Discount Rate
Hurdle RateWACC
Asset Perspective
IRR/ROICHURDLE
RATECOST OF CAPITAL
Liabil i ty Perspective 1 NPV =
2 0 =
∑
∑ ∑
n
n n
CFt
CF t CF t=CF0+
(1+WACC) t
(1+IRR) t (1+IRR)
t=0
t=0 t=1
I N V E S T M E N T D E C I S I O N -M AK I N G P RO C E S S
>?
>=
Thecostofcapital
Oxford Sustainable Finance Programme25
Investorrisk
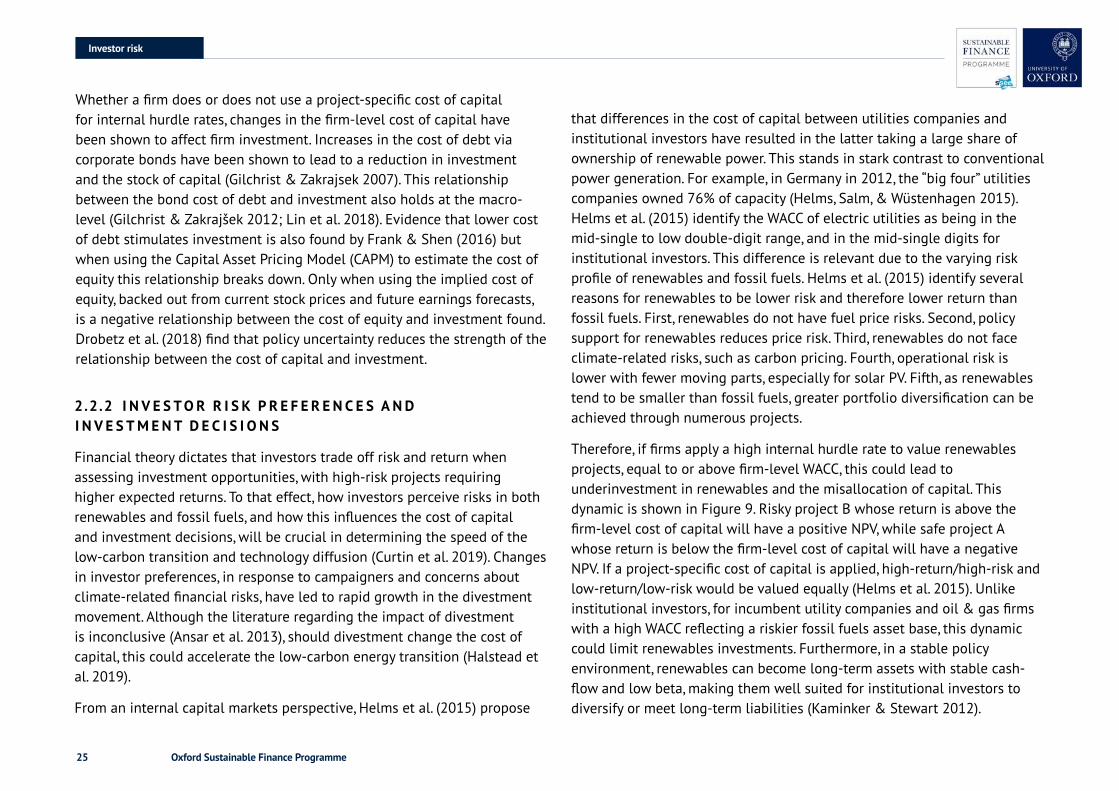
Whether a firm does or does not use a project-specific cost of capital for internal hurdle rates, changes in the firm-level cost of capital have been shown to affect firm investment. Increases in the cost of debt via corporate bonds have been shown to lead to a reduction in investment and the stock of capital (Gilchrist & Zakrajsek 2007). This relationship between the bond cost of debt and investment also holds at the macro-level (Gilchrist & Zakrajšek 2012; Lin et al. 2018). Evidence that lower cost of debt stimulates investment is also found by Frank & Shen (2016) but when using the Capital Asset Pricing Model (CAPM) to estimate the cost of equity this relationship breaks down. Only when using the implied cost of equity, backed out from current stock prices and future earnings forecasts, is a negative relationship between the cost of equity and investment found. Drobetz et al. (2018) find that policy uncertainty reduces the strength of the relationship between the cost of capital and investment.
2.2.2 I N V E S TOR R I S KP R E F E R E N C E S A ND I N V E S T M E N T D E C I S I O N S
Financial theory dictates that investors trade off risk and return when assessing investment opportunities, with high-risk projects requiring higher expected returns. To that effect, how investors perceive risks in both renewables and fossil fuels, and how this influences the cost of capital and investment decisions, will be crucial in determining the speed of the low-carbon transition and technology diffusion (Curtin et al. 2019). Changes in investor preferences, in response to campaigners and concerns about climate-related financial risks, have led to rapid growth in the divestment movement. Although the literature regarding the impact of divestment is inconclusive (Ansar et al. 2013), should divestment change the cost of capital, this could accelerate the low-carbon energy transition (Halstead et al. 2019).
From an internal capital markets perspective, Helms et al. (2015) propose
that differences in the cost of capital between utilities companies and institutional investors have resulted in the latter taking a large share of ownership of renewable power. This stands in stark contrast to conventional power generation. For example, in Germany in 2012, the “big four” utilities companies owned 76% of capacity (Helms, Salm, & Wüstenhagen 2015). Helms et al. (2015) identify the WACC of electric utilities as being in the mid-single to low double-digit range, and in the mid-single digits for institutional investors. This difference is relevant due to the varying risk profile of renewables and fossil fuels. Helms et al. (2015) identify several reasons for renewables to be lower risk and therefore lower return than fossil fuels. First, renewables do not have fuel price risks. Second, policy support for renewables reduces price risk. Third, renewables do not face climate-related risks, such as carbon pricing. Fourth, operational risk is lower with fewer moving parts, especially for solar PV. Fifth, as renewables tend to be smaller than fossil fuels, greater portfolio diversification can be achieved through numerous projects.
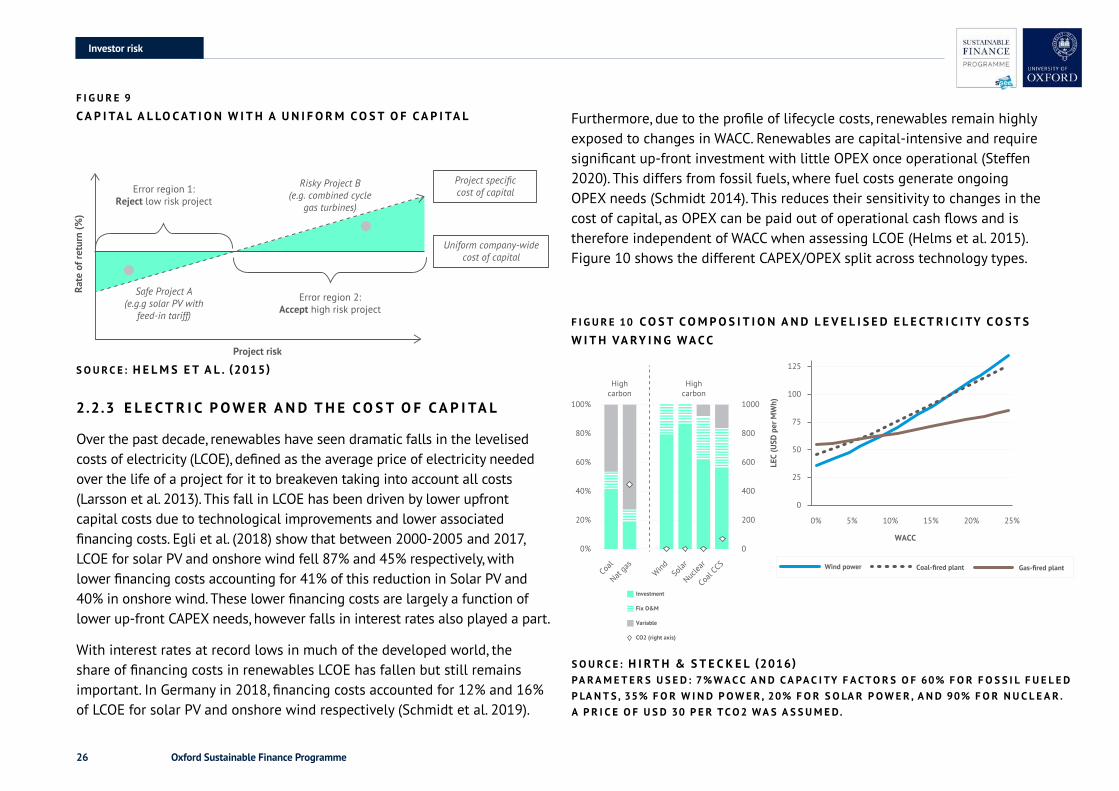
Therefore, if firms apply a high internal hurdle rate to value renewables projects, equal to or above firm-level WACC, this could lead to underinvestment in renewables and the misallocation of capital. This dynamic is shown in Figure 9. Risky project B whose return is above the firm-level cost of capital will have a positive NPV, while safe project A whose return is below the firm-level cost of capital will have a negative NPV. If a project-specific cost of capital is applied, high-return/high-risk and low-return/low-risk would be valued equally (Helms et al. 2015). Unlike institutional investors, for incumbent utility companies and oil & gas firms with a high WACC reflecting a riskier fossil fuels asset base, this dynamic could limit renewables investments. Furthermore, in a stable policy environment, renewables can become long-term assets with stable cash-flow and low beta, making them well suited for institutional investors to diversify or meet long-term liabilities (Kaminker & Stewart 2012).
Oxford Sustainable Finance Programme26
F I G U R E 9
C A P I TA L A L LO C AT I O N W I T H A U N I F O R M C O S T O F C A P I TA L
2.2.3 E L E CT R I CPOWER A NDT H E CO S TO F CA P I TA L
Over the past decade, renewables have seen dramatic falls in the levelised costs of electricity (LCOE), defined as the average price of electricity needed over the life of a project for it to breakeven taking into account all costs (Larsson et al. 2013). This fall in LCOE has been driven by lower upfront capital costs due to technological improvements and lower associated financing costs. Egli et al. (2018) show that between 2000-2005 and 2017, LCOE for solar PV and onshore wind fell 87% and 45% respectively, with lower financing costs accounting for 41% of this reduction in Solar PV and 40% in onshore wind. These lower financing costs are largely a function of lower up-front CAPEX needs, however falls in interest rates also played a part.
With interest rates at record lows in much of the developed world, the share of financing costs in renewables LCOE has fallen but still remains important. In Germany in 2018, financing costs accounted for 12% and 16% of LCOE for solar PV and onshore wind respectively (Schmidt et al. 2019).
Furthermore, due to the profile of lifecycle costs, renewables remain highly exposed to changes in WACC. Renewables are capital-intensive and require significant up-front investment with little OPEX once operational (Steffen 2020). This differs from fossil fuels, where fuel costs generate ongoing OPEX needs (Schmidt 2014). This reduces their sensitivity to changes in the cost of capital, as OPEX can be paid out of operational cash flows and is therefore independent of WACC when assessing LCOE (Helms et al. 2015). Figure 10 shows the different CAPEX/OPEX split across technology types.
F I G U R E 10 C O S T C O M P O S I T I O N A N D L E V E L I S E D E L E C T R I C I TY C O S T S W I T H VA RY I N G W A C C
S O U R C E : H I RT H &S T E C K E L(2016)PA RAME T E R S U S E D :7%WACCA NDCA PAC I TY F ACTOR S O F 60%F O R F O S S I L F U E L E DP LAN T S ,35%F O R W I NDPOWER ,20%F O R S O LA R POWER ,A ND90%F O R N U C L E A R .A P R I C E O F U S D 30P E R TCO2WA S A S S UMED.
Investorrisk
100%
80%
60%
40%
20%
0%
1000
800
600
400
200
0
Highcarbon
Coal
Nat ga
sWind So
lar
Nuclea
r
Coal C
CS
Highcarbon
Investment
Fix O&M
Variable
CO2 (right axis)
LEC
(USD
per
MW
h)
WACC
125
100
75
50
25
0
0% 5% 10% 15% 20% 25%
Gas-fired plantCoal-fired plantWind power
100%
80%
60%
40%
20%
0%
1000
800
600
400
200
0
Highcarbon
Coal
Nat ga
sWind So
lar
Nuclea
r
Coal C
CS
Highcarbon
Investment
Fix O&M
Variable
CO2 (right axis)
LEC
(USD
per
MW
h)
WACC
125
100
75
50
25
0
0% 5% 10% 15% 20% 25%
Gas-fired plantCoal-fired plantWind power
100%
80%
60%
40%
20%
0%
1000
800
600
400
200
0
Highcarbon
Coal
Nat ga
sWind So
lar
Nuclea
r
Coal C
CS
Highcarbon
Investment
Fix O&M
Variable
CO2 (right axis)
LEC
(USD
per
MW
h)
WACC
125
100
75
50
25
0
0% 5% 10% 15% 20% 25%
Gas-fired plantCoal-fired plantWind power
Rate
of r
etur
n (%
)
Project risk
Risky Project B(e.g. combined cycle
gas turbines)
Project specificcost of capital
Safe Project A(e.g.g solar PV with
feed-in tariff)
Error region 1:Reject low risk project
Error region 2:Accept high risk project
Uniform company-widecost of capital
S O U R C E : H E LM S E TA L .(2015 )
Oxford Sustainable Finance Programme27
Costofcapital
Upfront costs require financing, and therefore cost of capital is the single biggest determinate of renewables LCOE compared to CAPEX, OPEX, and technology learnings rates (Vartiainen et al. 2020). This can have significant implications for the competitiveness of renewables relative to fossil fuels if the cost of capital changes (Ondraczek et al. 2015; Schmidt 2014). This is demonstrated by Hirth and Steckel (2016) in Figure 10, with wind the lowest-cost source of power at a WACC below 8%. However, Schmidt et al., (2019) show that if interest rates increase to pre-financial-crisis levels over the next five years, this could slow renewables deployment, with onshore wind LCOE increasing by 25%. Policymakers should therefore pay close attention to changes to macroeconomic conditions, as well as technology-specific financing conditions.
Policymakers should also be aware that high capital costs can limit the effectiveness of policies designed to accelerate renewables deployment (Hirth & Steckel, 2016). Carbon pricing is an example of a policy that can trigger tipping points by altering the competitiveness of competing technologies (Sharpe & Lenton 2020). At a carbon price of $50 per ton and a WACC of 3%, the cost-optimal share of renewables in the energy mix is 40%, but at 15% WACC the share of renewables is zero (Hirth & Steckel 2016). In developed countries with low country risk, WACC is likely to be low enough for effective carbon pricing, but in developing markets with high country risk (Egli et al. 2019), the effectiveness of carbon pricing may be limited by higher capital costs.
2.2.4 O I L&G A S A NDT H E CO S TO F CA P I TA L
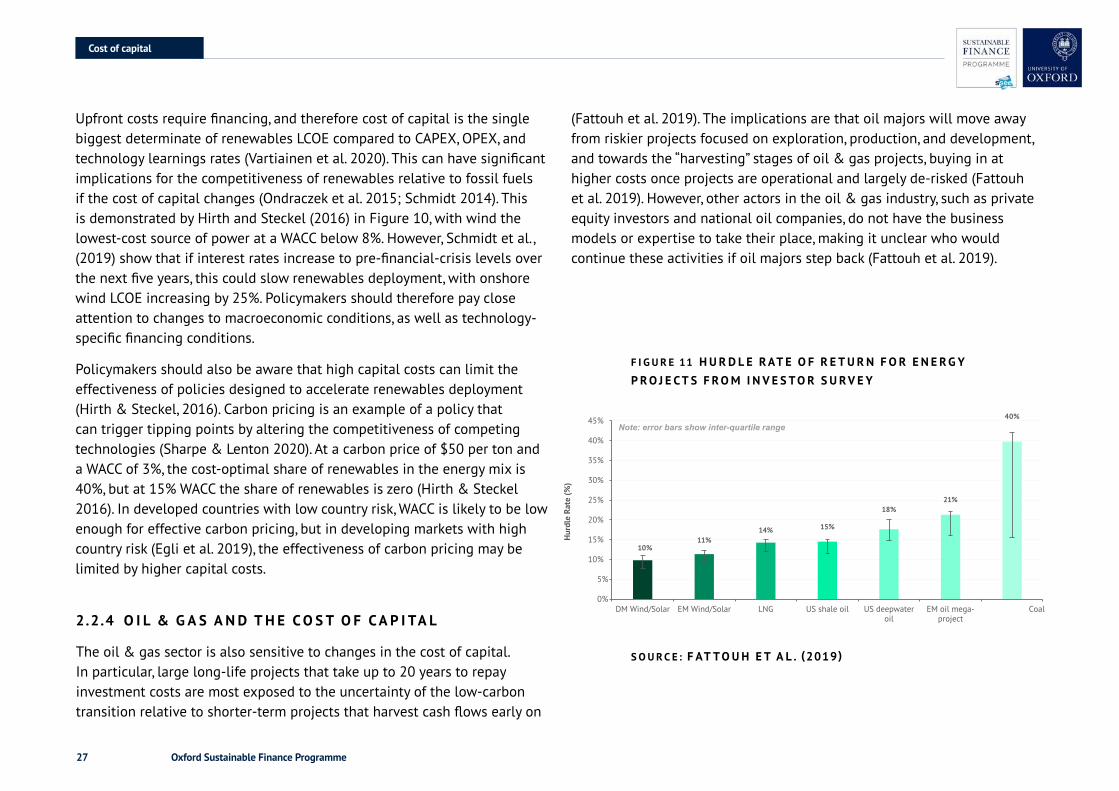
The oil & gas sector is also sensitive to changes in the cost of capital. In particular, large long-life projects that take up to 20 years to repay investment costs are most exposed to the uncertainty of the low-carbon transition relative to shorter-term projects that harvest cash flows early on
F I G U R E 11 H U R D L E R AT E O F R E T U R N F O R E N E R G Y P R O J E C T S F R O M I N V E S T O R S U R V E Y
(Fattouh et al. 2019). The implications are that oil majors will move away from riskier projects focused on exploration, production, and development, and towards the “harvesting” stages of oil & gas projects, buying in at higher costs once projects are operational and largely de-risked (Fattouh et al. 2019). However, other actors in the oil & gas industry, such as private equity investors and national oil companies, do not have the business models or expertise to take their place, making it unclear who would continue these activities if oil majors step back (Fattouh et al. 2019).
S O U R C E : F AT TOUH E TA L . (2019 )
10%11%
14% 15%
18%21%
40%
0%
5%
10%
15%
20%
25%
30%
35%
40%
45%
DM Wind/Solar EM Wind/Solar LNG US shale oil US deepwateroil
EM oil mega-project
Coal
Hur
dle
Rate
(%)
Note: error bars show inter-quartile range
Oxford Sustainable Finance Programme28
Furthermore, Fattouh et al. (2019) find that investor risk preferences in the energy sector are already shifting. Through a survey, institutional investors are shown to demand significantly higher hurdle rates for long-life oil projects and coal projects (Figure 11). In recent years, hurdle rates for wind, solar, and LNG projects have seen little change, while deep-water oil, long cycle mega oil projects, and new coal projects have seen large upticks in the hurdle rates expected by investors. At a 10% hurdle rate, the average oil & gas project requires an oil price of $40/bbl for net present values (NPVs) to be neutral, while at a hurdle rate of around 20%, $70/bbl is needed for positive NPVs (Fattouh et al. 2019). Going forward, the potential removal of fossil fuel subsidies in line with government commitments could also push project IRRs below hurdle rates. When analysing undeveloped US oil fields, Erickson et al. (2017) find that the phase-out of fossil fuels subsidies will render almost half of yet to be developed oil fields unprofitable at a discount rate of 10% and an oil price of $50/bbl, with this figure reaching 80% at a discount rate of 15%.
However, as previously discussed, the link between WACC and internal hurdle rates is not clear cut. In the oil & gas sector, integrated companies tend to have a lower cost of capital due to greater diversification. This is reflected in NYU Stern Data (2020) with integrated companies having a lower beta than upstream oil & gas exploration. Likewise, the UK Oil and Gas Authority estimate a WACC of 6.9-8.3% for exploration and production companies and 5-6.5% for integrated oil & gas companies (OGA 2018). In terms of how WACC feeds through to internal hurdle rates in oil & gas, Jafarizadeh and Bratvold (2019) find that in the upstream oil & gas sector, companies often use internal hurdle rates above their WACC to account for extra uncertainty, while Kemp & Stephen (2018) state that although WACC plays a part in determining internal hurdle rates used by oil & gas companies, project-specific operating conditions are also key.
Yet, regardless of how project-specific internal hurdle rates are calculated,
2.2.5 E S T IMAT I N G T H E CO S TO F CA P I TA L
As outlined in this report, the cost of capital will play a key role in determining how the energy sector transitions. An accurate measure of the cost of capital is therefore critical for policymakers seeking to track renewables competitiveness and to accurately model system-wide costs of decarbonisation. The cost of capital is also a key parameter in energy economic models used to assess whether carbon emission targets can be reached and to value policy interventions (Steffen 2020). At the global level, the cost of capital plays a critical role in the construction of long-term climate scenarios that then frame policy debates, for example, the IEA and IPCC scenarios (Creutzig et al. 2017). These models often take the cost of capital as fixed across sectors and geographies. While this may be appropriate for modelling global systems, Egli et al. (2019) argue that at the national level, this can lead to misguided policy recommendations. For example, when country-level risk is accounted for, the LCOE of renewables falls by 7-30% in industrialised countries and increases by up to 170% in developing countries (Egli et al. 2019).
Here we summarise different approaches in the literature to calculating the cost of capital. Financing for energy projects can occur either as corporate finance, where the risk of the project remains on the balance sheet of the borrowing entity, or as project finance, where a special purpose
Costofcapital
if firm-level WACC is consistently above the return on invested capital (ROIC) this will lead to value destruction. This occurs when the return on a company’s projects is lower than the cost of funding them. This ROIC-WACC spread has turned negative in the oil & gas sector in recent years, driven by an increasing cost of equity (IEA 2019; Deloitte 2018). Higher capital costs and shocks to demand, such as Covid-19, could further constrain oil & gas investment.
Oxford Sustainable Finance Programme29
vehicle (SPV) is often used by the project sponsor to secure bilateral or syndicated financing (Krupa & Harvey 2017). In the utilities sector, fossil fuel power projects have often been financed through corporate finance, while for renewables projects, project finance has driven growth (Steffen 2018). In the oil & gas sector, large companies with strong balance sheets (oil majors) tend to use on-balance-sheet financing mechanisms such as traditional equity, debt, and bank loans as their large size and diversification allow them to obtain a low cost of capital (Duff & Phelps 2018). On the other hand, smaller to medium companies with weaker balance-sheets and less EBITDA often use project finance/asset-based lending for upstream exploration and development (Duff & Phelps 2018).
In project finance, the availability of data is often limited, especially in developing markets. Therefore, the use of surveys and expert interviews can be appropriate for estimating the cost of capital (Steffen 2020). Interviews with market participants and experts can also be used in combination with other techniques. For example, a calculated estimate of the cost of capital can be used as a starting point in interviews (Angelopoulos et al. 2016; 2017). Alternative methods include using competitive public-private auction (PPA) data to back out the cost of capital using an LCOE model (Dobrotkova et al. 2018).
Financial market data can also be used to estimate the project-specific cost of capital using financial market proxies for off-balance-sheet SPVs. For example, Werner and Scholtens (2016) use a broad measure of industry beta to calculate the cost of equity using CAPM. Another method for project-specific cost of equity is to take unleveraged beta of a comparable firm and then re-leverage to the appropriate debt levels. For example, in Klessmann et al. (2013) a capital structure of 70% debt and 30% equity is assumed. For the cost of debt, financial market data can also be used, for example taking corporate bonds with a similar risk distribution to energy projects (Werner & Scholtens 2016). Using a different approach, Angelopoulos et al. (2017)
add a renewable energy spread to a country risk factor (CDS spread of Greek debt) and a risk-free rate (German government bonds) to calculate the cost of debt.
For corporate financing, estimating the cost of capital is generally more straightforward, especially when financial market data can be used to directly obtain the cost of capital. If a company’s equity is traded, the cost of equity can be obtained via the CAPM model using historical estimates of beta. The implied cost of equity (ICC) can also be calculated from valuation models such as the Gordon growth model to back out the cost of equity from stock prices and future earnings expectations (Frank & Shen 2016). Similarly, if a company has traded debt, the cost of capital can be obtained from market prices. For companies without traded securities, the cost of debt can be obtained by analysing financial accounts, looking at interest expense relative to outstanding debt on the balance sheet (Frank & Shen 2016).
Costofcapital
Oxford Sustainable Finance Programme30
In this section of the report, we outline key trends in the cost of debt (loan spread) over time.
3.1CO S TO F D E BT I N T H E LOAN MARK E T
To outline key trends in the cost of debt, syndicated bank loan data is taken from LPC DealScan. The loan spread represents the loan yield over and above a floating rate, such as LIBOR. Where the deal contains multiple tranches with different loan spreads, an average is taken. The basic unit of observation in DealScan is a loan facility or a tranche which are then grouped into deals. The sample from LPC DealScan includes loan information on 12,072 loan deals between 2000 and 2020, involving 5,033 borrowers across 118 countries. The transactions in the energy and electric utilities sectors identified by The Refinitiv Business Classification (TRBC) classification are based on the primary business activity of an organisation. Where organisations have multiple business segments, the classification is selected according to the largest revenue contribution4. For energy production, we focus on four industry groups: renewable energy (biofuels and renewable energy services), oil & gas production, oil & gas-related equipment and services, and coal mining. For electric utilities, we grouped into two types: power generation and other electric utilities. Within power generation, we manually identify renewable (solar PV and CSP, offshore and onshore wind, biopower, and hydropower) and fossil fuel (coal-fired and gas-fired) power generation plants5. Appendix 1 presents the summary of loan deals and borrowers by energy type and power generation technology. Loan spreads data are winsorized at 1% and 99% to handle outliers.
3 Changes in the Cost of Capital
4 Companies are assigned to an Activity, at the lowest level. The Industry, Industry Group, Business Sector and Economic Sector assignments are derived from the classification hierarchy. Each organisation is represented by one primary TRBC Activity and organisations cannot have multiple primary assignments. A 60% of total revenue threshold is used to assign an industry to organisations with two business segments. A 51% of total revenue threshold is used to assign an industry to organisations with three or more segments.
5 Renewable power plants includes solar PV and CSP, offshore and onshore wind, biopower, hydropower and geothermal power plant. Fossil fuels power plants include coal-fired, gas-fired and oil-fired power plants. Because the number of deals in geothermal and heavy-oil fired power plants is very limited, less than 10, we exclude them in the analysis by technology.
Costofcapital
For energy production, we focus on four industry groups: renewable energy (biofuels and renewable energy services) , oi l & gas production, oi l & gas-related equipment and services , and coal mining
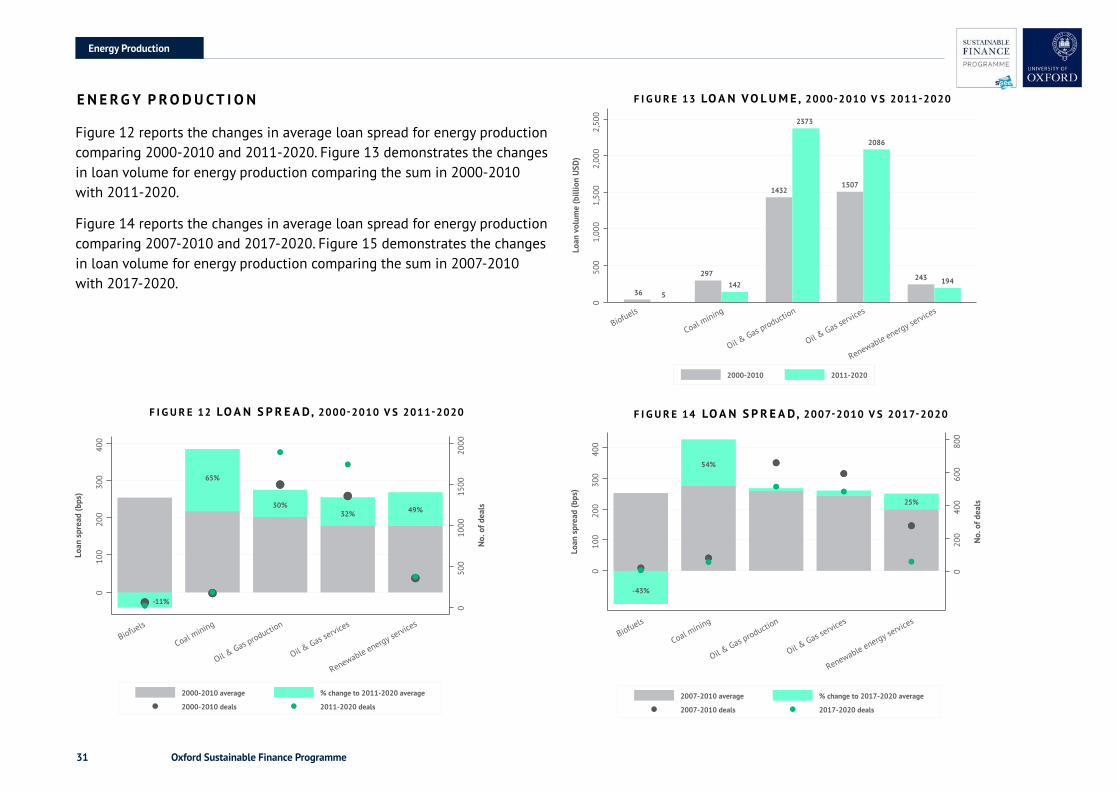
Oxford Sustainable Finance Programme31
E N E R G Y P R O D U C T I O N
F I G U R E 12 LO A N S P R E A D, 2000-2010 V S 2011-2020
2000-2010 average % change to 2011-2020 average
2000-2010 deals 2011-2020 deals
-11%
65%
30%32% 49%
050
010
0015
0020
00
No.
of d
eals
Loan
spr
ead
(bps
)
010
020
030
040
0
Biofuels
Coal mining
Oil & Gas productio
n
Oil & Gas se
rvices
Renewable energy services
2000-2010 average % change to 2011-2020 average
2000-2010 deals 2011-2020 deals
-11%
65%
30%32% 49%
050
010
0015
0020
00
No.
of d
eals
Loan
spr
ead
(bps
)
010
020
030
040
0
Biofuels
Coal mining
Oil & Gas productio
n
Oil & Gas se
rvices
Renewable energy services
2007-2010 average % change to 2017-2020 average
2007-2010 deals 2017-2020 deals
-43%
54%
25%
020
040
060
080
0
No.
of d
eals
Loan
spr
ead
(bps
)
010
020
030
040
0
Biofuels
Coal mining
Oil & Gas productio
n
Oil & Gas se
rvices
Renewable energy services
2007-2010 average % change to 2017-2020 average
2007-2010 deals 2017-2020 deals
-43%
54%
25%
020
040
060
080
0
No.
of d
eals
Loan
spr
ead
(bps
)
010
020
030
040
0
Biofuels
Coal mining
Oil & Gas productio
n
Oil & Gas se
rvices
Renewable energy services
F I G U R E 14 LO A N S P R E A D, 2007-2010V S 2017-2020
Figure 12 reports the changes in average loan spread for energy production comparing 2000-2010 and 2011-2020. Figure 13 demonstrates the changes in loan volume for energy production comparing the sum in 2000-2010 with 2011-2020.
Figure 14 reports the changes in average loan spread for energy production comparing 2007-2010 and 2017-2020. Figure 15 demonstrates the changes in loan volume for energy production comparing the sum in 2007-2010 with 2017-2020.
2000-2010 2011-2020
36 5
297142
1432
2373
1507
2086
243 194
050
01,
000
1,50
02,
000
2,50
0
Biofuels
Coal mining
Oil & Gas productio
n
Oil & Gas se
rvices
Renewable energy services
Loan
vol
ume
(bill
ion
USD
)
2000-2010 2011-2020
36 5
297142
1432
2373
1507
2086
243 194
050
01,
000
1,50
02,
000
2,50
0
Biofuels
Coal mining
Oil & Gas productio
n
Oil & Gas se
rvices
Renewable energy services
Loan
vol
ume
(bill
ion
USD
)
EnergyProduction
F I G U R E 13 LO A N V O L U M E , 2000-2010 V S 2011-2020
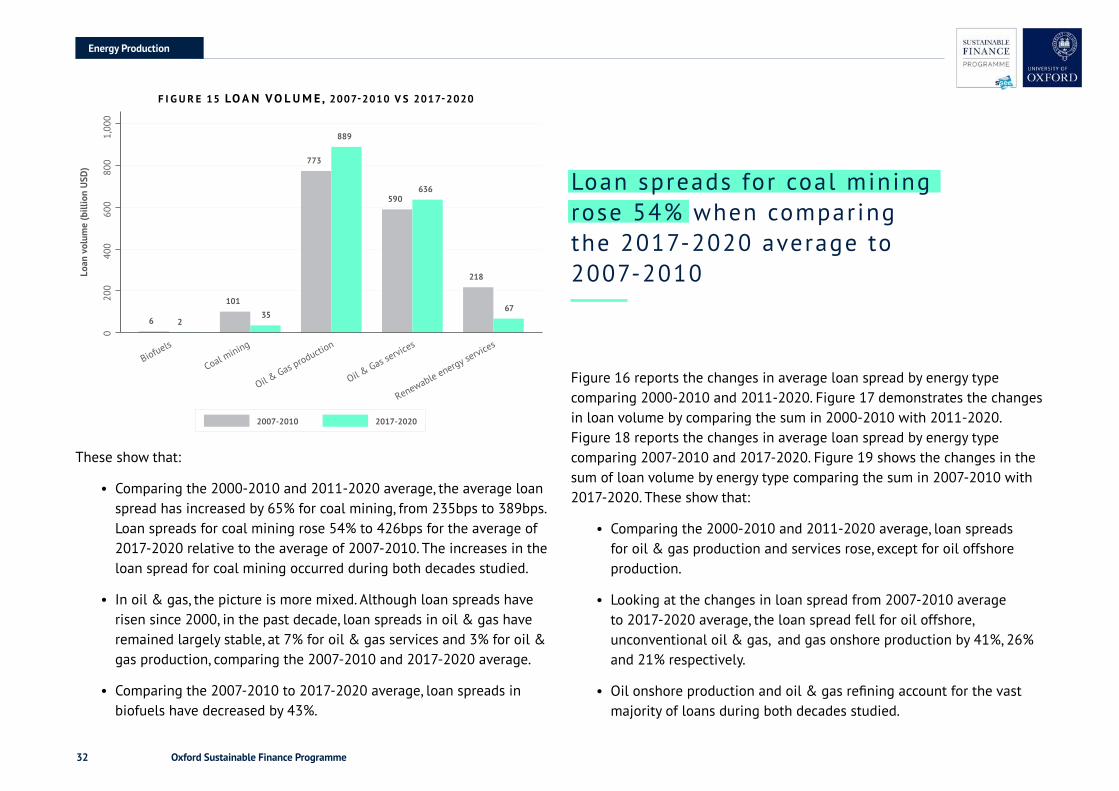
Oxford Sustainable Finance Programme32
F I G U R E 15 LO A N V O L U M E , 2007-2010V S 2017-2020
2007-2010 2017-2020
6 2
101
35
773
889
590636
218
67
Loan
vol
ume
(bill
ion
USD
)
020
040
060
080
01,
000
Biofuels
Coal mining
Oil & Gas productio
n
Oil & Gas se
rvices
Renewable energy services
2007-2010 2017-2020
6 2
101
35
773
889
590636
218
67
Loan
vol
ume
(bill
ion
USD
)
020
040
060
080
01,
000
Biofuels
Coal mining
Oil & Gas productio
n
Oil & Gas se
rvices
Renewable energy services
These show that:
• Comparing the 2000-2010 and 2011-2020 average, the average loan spread has increased by 65% for coal mining, from 235bps to 389bps. Loan spreads for coal mining rose 54% to 426bps for the average of 2017-2020 relative to the average of 2007-2010. The increases in the loan spread for coal mining occurred during both decades studied.
• In oil & gas, the picture is more mixed. Although loan spreads have risen since 2000, in the past decade, loan spreads in oil & gas have remained largely stable, at 7% for oil & gas services and 3% for oil & gas production, comparing the 2007-2010 and 2017-2020 average.
• Comparing the 2007-2010 to 2017-2020 average, loan spreads in biofuels have decreased by 43%.
Figure 16 reports the changes in average loan spread by energy type comparing 2000-2010 and 2011-2020. Figure 17 demonstrates the changes in loan volume by comparing the sum in 2000-2010 with 2011-2020. Figure 18 reports the changes in average loan spread by energy type comparing 2007-2010 and 2017-2020. Figure 19 shows the changes in the sum of loan volume by energy type comparing the sum in 2007-2010 with 2017-2020. These show that:
• Comparing the 2000-2010 and 2011-2020 average, loan spreads for oil & gas production and services rose, except for oil offshore production.
• Looking at the changes in loan spread from 2007-2010 average to 2017-2020 average, the loan spread fell for oil offshore, unconventional oil & gas, and gas onshore production by 41%, 26% and 21% respectively.
• Oil onshore production and oil & gas refining account for the vast majority of loans during both decades studied.
Loan spreads for coal mining rose 54% when comparing the 2017-2020 average to 2007-2010
EnergyProduction
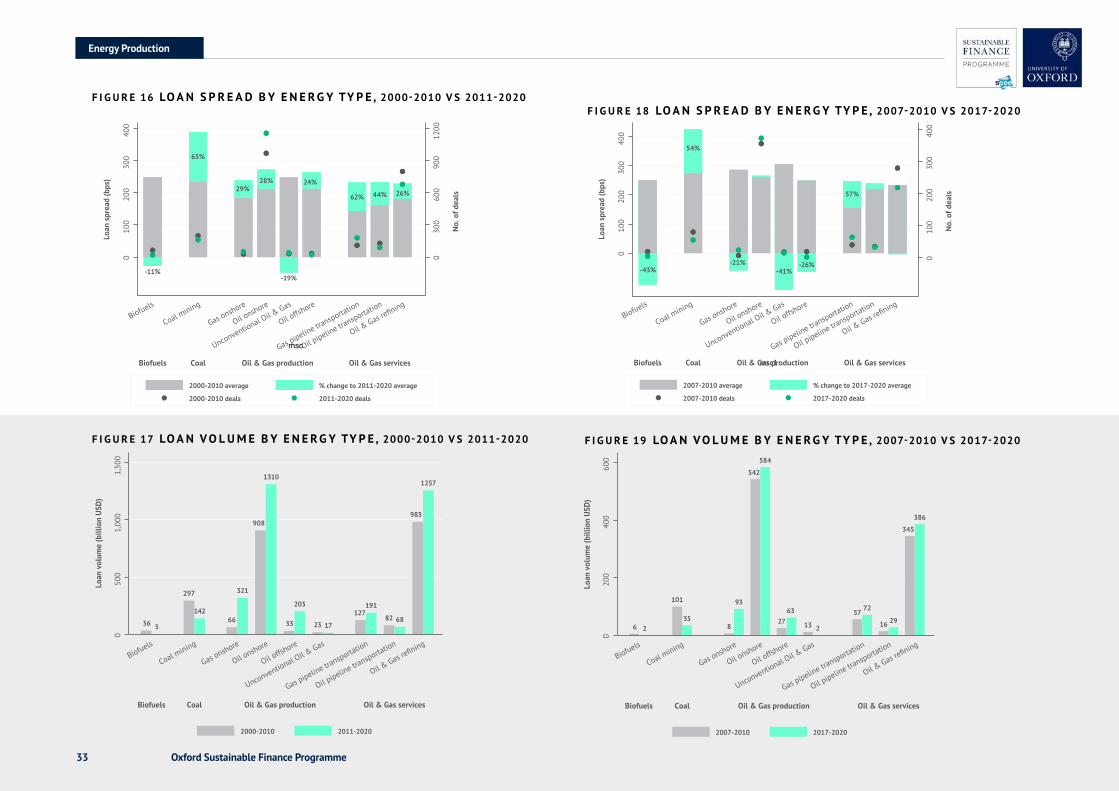
Oxford Sustainable Finance Programme33
F I G U R E 18 LO A N S P R E A D B Y E N E R G Y TY P E , 2007-2010V S 2017-2020
F I G U R E 19 LO A N V O L U M E B Y E N E R G Y TY P E , 2007-2010V S 2017-2020
F I G U R E 16 LO A N S P R E A D B Y E N E R G Y TY P E , 2000-2010 V S 2011-2020
2000-2010 average % change to 2011-2020 average
2000-2010 deals 2011-2020 deals
No.
of d
eals
Loan
spr
ead
(bps
)
-11%
65%
29%28%
-19%
24%
62% 44% 26%
030
060
090
012
00
010
020
030
040
0
Biofuels
Coal mining
Gas onshore
Oil onshore
Oil offsh
ore
Unconventional Oil & Gas
Gas pipeline transportation
Oil pipeline tra
nsportation
Oil & Gas re
fining
msc
Biofuels Coal Oil & Gas production Oil & Gas services
2000-2010 2011-2020
Loan
vol
ume
(bill
ion
USD
)
36 5
297
14266
321
908
1310
33
203
23 17
127191
82 68
983
1257
050
01,
000
1,50
0
Biofuels Coal Oil & Gas production Oil & Gas services
Biofuels
Coal mining
Gas onshore
Oil onshore
Oil offsh
ore
Unconventional Oil & Gas
Gas pipeline transportation
Oil pipeline tra
nsportation
Oil & Gas re
fining
2007-2010 average % change to 2017-2020 average
2007-2010 deals 2017-2020 deals
No.
of d
eals
Loan
spr
ead
(bps
)
-43%
54%
-21%-41%
-26%
57%
010
020
030
040
0
010
020
030
040
0
Biofuels
Coal mining
Gas onshore
Oil onshore
Oil offsh
ore
Unconventional Oil & Gas
Gas pipeline transportation
Oil pipeline tra
nsportation
Oil & Gas re
fining
msc1Biofuels Coal Oil & Gas production Oil & Gas services
2007-2010 2017-2020
Loan
vol
ume
(bill
ion
USD
)
6 2
101
358
93
542
584
2763
13 2
57 72
16 29
345
386
020
040
060
0
Biofuels
Coal mining
Gas onshore
Oil onshore
Oil offsh
ore
Unconventional Oil & Gas
Gas pipeline transportation
Oil pipeline tra
nsportation
Oil & Gas re
fining
Biofuels Coal Oil & Gas production Oil & Gas services
F I G U R E 17 LO A N V O L U M E B Y E N E R G Y TY P E , 2000-2010 V S 2011-2020
EnergyProduction
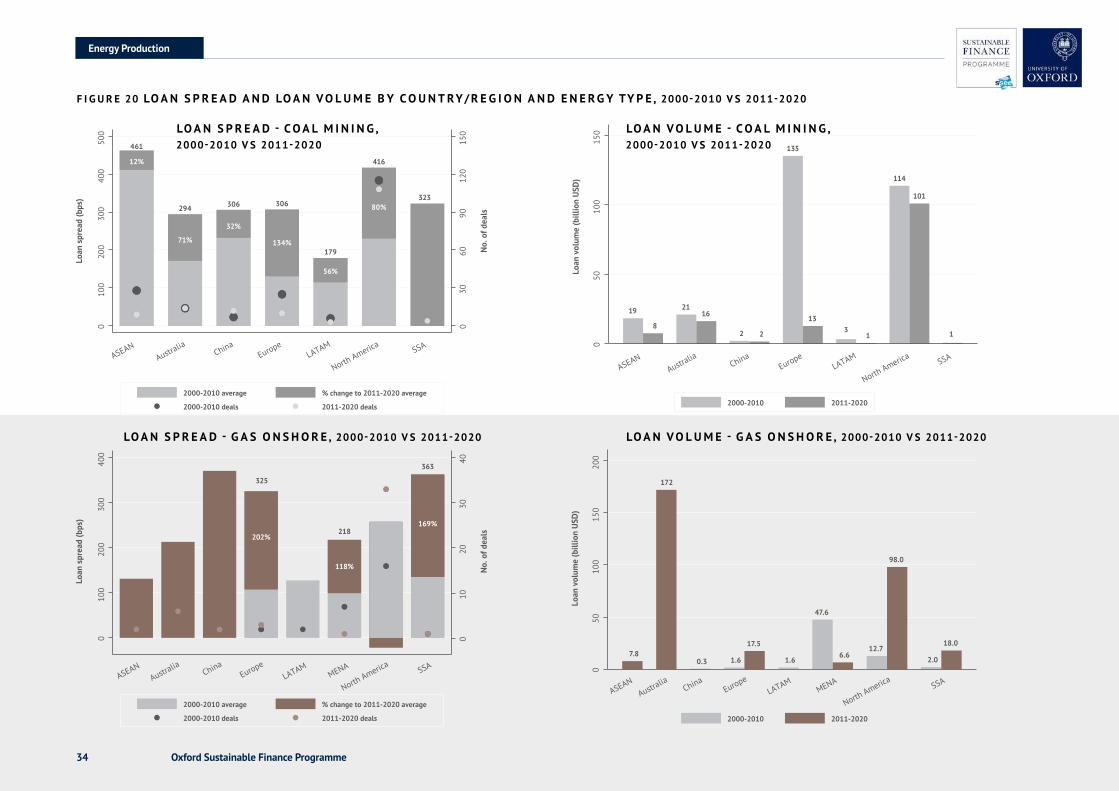
Oxford Sustainable Finance Programme34
F I G U R E 20 LO A N S P R E A D A N D LO A N V O L U M E B Y C O U N T RY / R E G I O N A N D E N E R G Y TY P E , 2000-2010 V S 2011-2020
2000-2010 average % change to 2011-2020 average
2000-2010 deals 2011-2020 deals
12%
461
71%
294
32%
306
134%
306
179
56%
80%
416
323
030
6090
120
150
010
020
030
040
050
0
No.
of d
eals
Loan
spr
ead
(bps
)
ASEANAustra
liaChina
EuropeLATAM
North America SSA
2000-2010 2011-2020
Loan
vol
ume
(bill
ion
USD
)
19
8
2116
2 2
135
133
1
114
101
1
050
100
150
ASEANAustra
liaChina
EuropeLATAM
North America SSA
2000-2010 average % change to 2011-2020 average
2000-2010 deals 2011-2020 deals
No.
of d
eals
Loan
spr
ead
(bps
)
202%
325
118%
218169%
3630
1020
3040
010
020
030
040
0
ASEANAustra
liaChina
EuropeLATAM
MENA
North America SSA
2000-2010 average % change to 2011-2020 average
2000-2010 deals 2011-2020 deals
No.
of d
eals
Loan
spr
ead
(bps
)
202%
325
118%
218169%
363
010
2030
40
010
020
030
040
0
ASEANAustra
liaChina
EuropeLATAM
MENA
North America SSA
2000-2010 2011-2020
Loan
vol
ume
(bill
ion
USD
)
7.8
172
0.3 1.6
17.5
1.6
47.6
6.612.7
98.0
2.0
18.0
050
100
150
200
ASEANAustra
liaChina
EuropeLATAM
MENA
North America SSA
2000-2010 2011-2020
Loan
vol
ume
(bill
ion
USD
)
7.8
172
0.3 1.6
17.5
1.6
47.6
6.612.7
98.0
2.0
18.00
5010
015
020
0
ASEANAustra
liaChina
EuropeLATAM
MENA
North America SSA
LO A N S P R E A D - G A S O N S H O R E , 2000-2010 V S 2011-2020 LO A N V O L U M E - G A S O N S H O R E , 2000-2010 V S 2011-2020
EnergyProduction
LO A N S P R E A D - C O A L M I N I N G , 2000-2010 V S 2011-2020
LO A N V O L U M E - C O A L M I N I N G , 2000-2010 V S 2011-2020
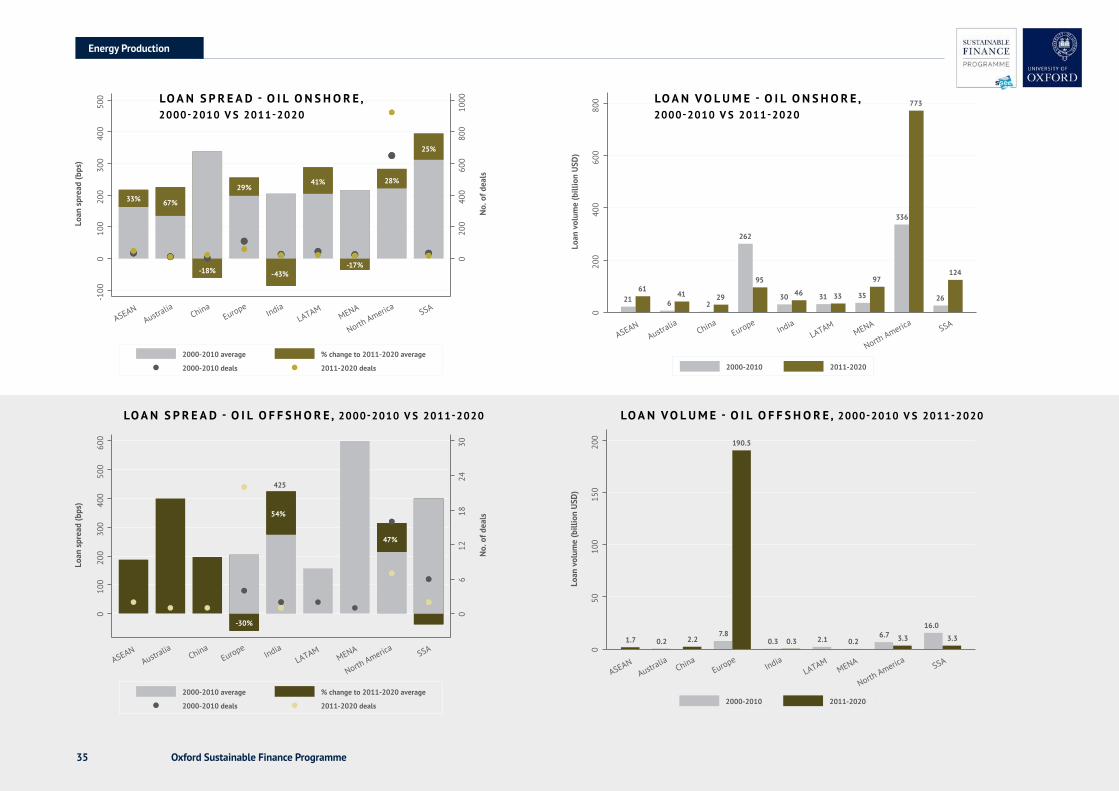
Oxford Sustainable Finance Programme35
LO A N S P R E A D - O I L O F F S H O R E , 2000-2010 V S 2011-2020
2000-2010 average % change to 2011-2020 average
2000-2010 deals 2011-2020 deals
No.
of d
eals
Loan
spr
ead
(bps
)
33% 67%
-18%
29%
-43%
41%
-17%
28%
25%
020
040
060
080
010
00
-100
010
020
030
040
050
0
ASEANAustra
liaChina
EuropeIndia
LATAMMENA
North America SSA
2000-2010 average % change to 2011-2020 average
2000-2010 deals 2011-2020 deals
No.
of d
eals
Loan
spr
ead
(bps
)
33% 67%
-18%
29%
-43%
41%
-17%
28%
25%
020
040
060
080
010
00
-100
010
020
030
040
050
0
ASEANAustra
liaChina
EuropeIndia
LATAMMENA
North America SSA
2000-2010 2011-2020
Loan
vol
ume
(bill
ion
USD
)
2161
641
229
262
95
30 46 31 33 35
97
336
773
26
124
020
040
060
080
0
ASEANAustra
liaChina
EuropeIndia
LATAMMENA
North America SSA
2000-2010 2011-2020
Loan
vol
ume
(bill
ion
USD
)
2161
641
229
262
95
30 46 31 33 35
97
336
773
26
124
020
040
060
080
0
ASEANAustra
liaChina
EuropeIndia
LATAMMENA
North America SSA
2000-2010 average % change to 2011-2020 average
2000-2010 deals 2011-2020 deals
No.
of d
eals
Loan
spr
ead
(bps
)
ASEANAustra
liaChina
EuropeIndia
LATAMMENA
North America SSA
-30%
54%
47%
425
06
1218
2430
010
020
030
040
050
060
0
2000-2010 average % change to 2011-2020 average
2000-2010 deals 2011-2020 deals
No.
of d
eals
Loan
spr
ead
(bps
)
ASEANAustra
liaChina
EuropeIndia
LATAMMENA
North America SSA
-30%
54%
47%
425
06
1218
2430
010
020
030
040
050
060
0
2000-2010 2011-2020
Loan
vol
ume
(bill
ion
USD
)
ASEANAustra
liaChina
EuropeIndia
LATAMMENA
North America SSA
1.7 0.2 2.27.8
190.5
0.3 0.3 2.1 0.26.7 3.3
16.0
3.3
050
100
150
200
2000-2010 2011-2020
Loan
vol
ume
(bill
ion
USD
)
ASEANAustra
liaChina
EuropeIndia
LATAMMENA
North America SSA
1.7 0.2 2.27.8
190.5
0.3 0.3 2.1 0.26.7 3.3
16.0
3.30
5010
015
020
0
LO A N V O L U M E - O I L O F F S H O R E , 2000-2010 V S 2011-2020
EnergyProduction
LO A N V O L U M E - O I L O N S H O R E , 2000-2010 V S 2011-2020
LO A N S P R E A D - O I L O N S H O R E , 2000-2010 V S 2011-2020
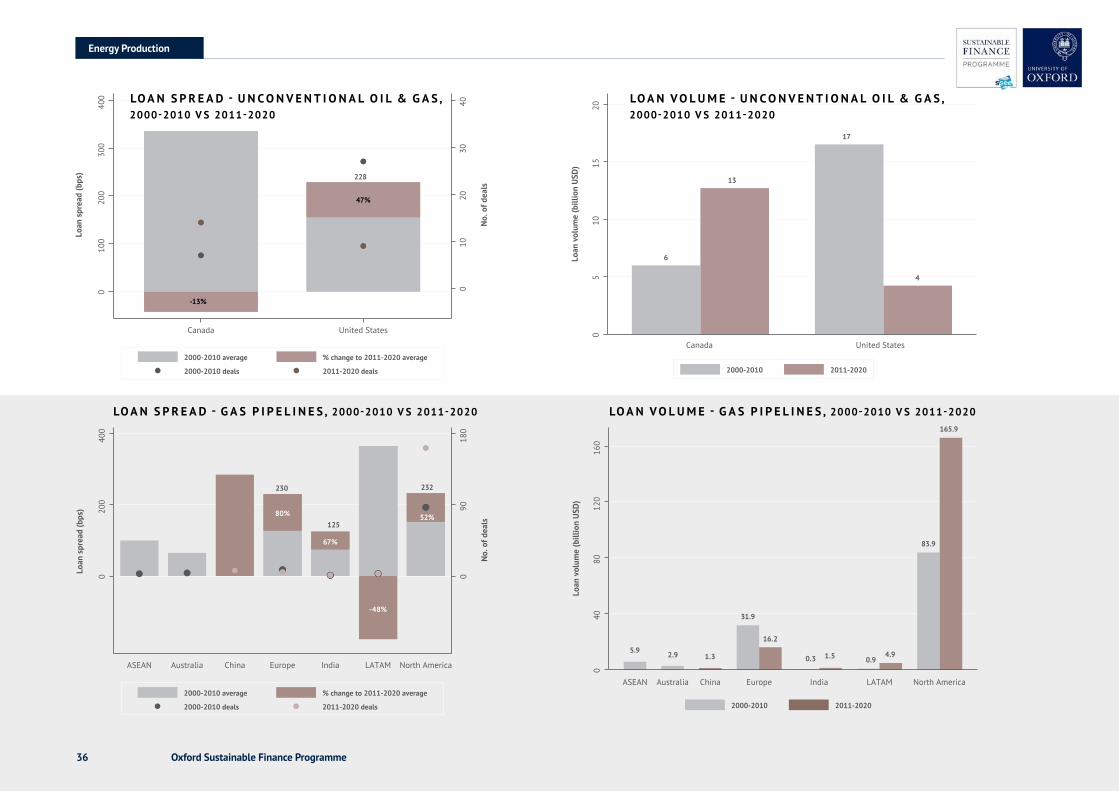
Oxford Sustainable Finance Programme36
2000-2010 average % change to 2011-2020 average
2000-2010 deals 2011-2020 deals
No.
of d
eals
Loan
spr
ead
(bps
)
-13%
47%
228
010
2030
40
010
020
030
040
0
Canada United States
2000-2010 average % change to 2011-2020 average
2000-2010 deals 2011-2020 deals
No.
of d
eals
Loan
spr
ead
(bps
)
-13%
47%
228
010
2030
40
010
020
030
040
0
Canada United States
2000-2010 2011-2020
Loan
vol
ume
(bill
ion
USD
)
6
13
17
4
05
1015
20
Canada United States
2000-2010 2011-2020
Loan
vol
ume
(bill
ion
USD
)
6
13
17
4
05
1015
20
Canada United States
LO A N S P R E A D - U N C O N V E N T I O N A L O I L & G A S , 2000-2010 V S 2011-2020
2000-2010 average % change to 2011-2020 average
2000-2010 deals 2011-2020 deals
No.
of d
eals
Loan
spr
ead
(bps
)
-48%
80%
67%
52%
230
125
232
090
180
020
040
0
ASEAN Australia China Europe India LATAM North America
2000-2010 average % change to 2011-2020 average
2000-2010 deals 2011-2020 deals
No.
of d
eals
Loan
spr
ead
(bps
)
-48%
80%
67%
52%
230
125
232
090
180
020
040
0
ASEAN Australia China Europe India LATAM North America
2000-2010 2011-2020
Loan
vol
ume
(bill
ion
USD
)
5.9 2.9 1.3
31.9
16.2
0.3 1.5 0.94.9
83.9
165.9
040
8012
016
0
ASEAN Australia China Europe India LATAM North America
2000-2010 2011-2020
Loan
vol
ume
(bill
ion
USD
)5.9 2.9 1.3
31.9
16.2
0.3 1.5 0.94.9
83.9
165.9
040
8012
016
0
ASEAN Australia China Europe India LATAM North America
LO A N V O L U M E - G A S P I P E L I N E S , 2000-2010 V S 2011-2020
LO A N V O L U M E - U N C O N V E N T I O N A L O I L & G A S , 2000-2010 V S 2011-2020
LO A N S P R E A D - G A S P I P E L I N E S , 2000-2010 V S 2011-2020
EnergyProduction
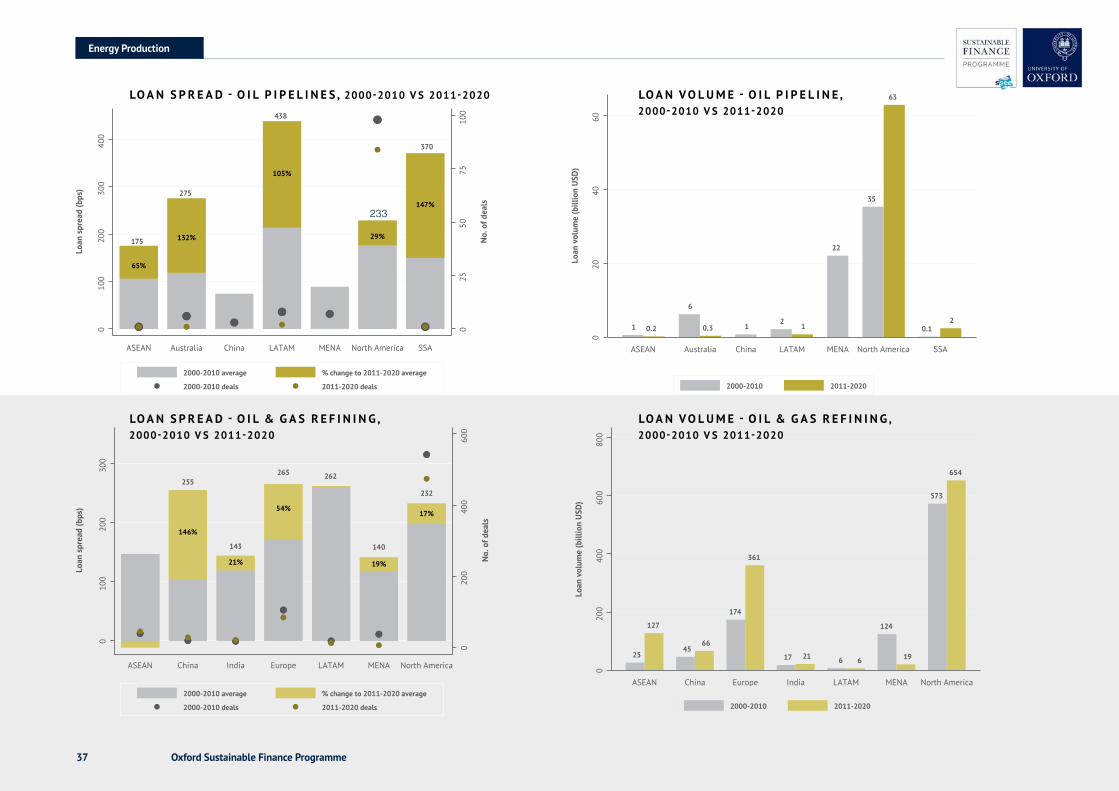
Oxford Sustainable Finance Programme37
LO A N S P R E A D - O I L P I P E L I N E S , 2000-2010 V S 2011-2020
2000-2010 average % change to 2011-2020 average
2000-2010 deals 2011-2020 deals
No.
of d
eals
Loan
spr
ead
(bps
)
65%
175 132%
275
105%
438
29%
233147%
370
025
5075
100
010
020
030
040
0
ASEAN Australia China LATAM MENA North America SSA
2000-2010 average % change to 2011-2020 average
2000-2010 deals 2011-2020 deals
No.
of d
eals
Loan
spr
ead
(bps
)
65%
175 132%
275
105%
438
29%
233147%
370
025
5075
100
010
020
030
040
0
ASEAN Australia China LATAM MENA North America SSA
2000-2010 2011-2020
Loan
vol
ume
(bill
ion
USD
)
1 0.2
6
0.3 12
1
22
35
63
0.12
020
4060
ASEAN Australia China LATAM MENA North America SSA
2000-2010 2011-2020
Loan
vol
ume
(bill
ion
USD
)
1 0.2
6
0.3 12
1
22
35
63
0.12
020
4060
ASEAN Australia China LATAM MENA North America SSA
2000-2010 average % change to 2011-2020 average
2000-2010 deals 2011-2020 deals
No.
of d
eals
Loan
spr
ead
(bps
)
255
146%
21%
143
54%
265 262
140
19%
17%
232
020
040
060
0
010
020
030
0
ASEAN China India Europe LATAM MENA North America
2000-2010 average % change to 2011-2020 average
2000-2010 deals 2011-2020 deals
No.
of d
eals
Loan
spr
ead
(bps
)
255
146%
21%
143
54%
265 262
140
19%
17%
232
020
040
060
0
010
020
030
0
ASEAN China India Europe LATAM MENA North America
2000-2010 2011-2020
Loan
vol
ume
(bill
ion
USD
)
25
127
4566
174
361
17 21 6 6
124
19
573
654
020
040
060
080
0
ASEAN China Europe India LATAM MENA North America
2000-2010 2011-2020
Loan
vol
ume
(bill
ion
USD
)25
127
4566
174
361
17 21 6 6
124
19
573
654
020
040
060
080
0
ASEAN China Europe India LATAM MENA North America
LO A N S P R E A D - O I L & G A S R E F I N I N G , 2000-2010 V S 2011-2020
LO A N V O L U M E - O I L & G A S R E F I N I N G , 2000-2010 V S 2011-2020
EnergyProduction
LO A N V O L U M E - O I L P I P E L I N E , 2000-2010 V S 2011-2020
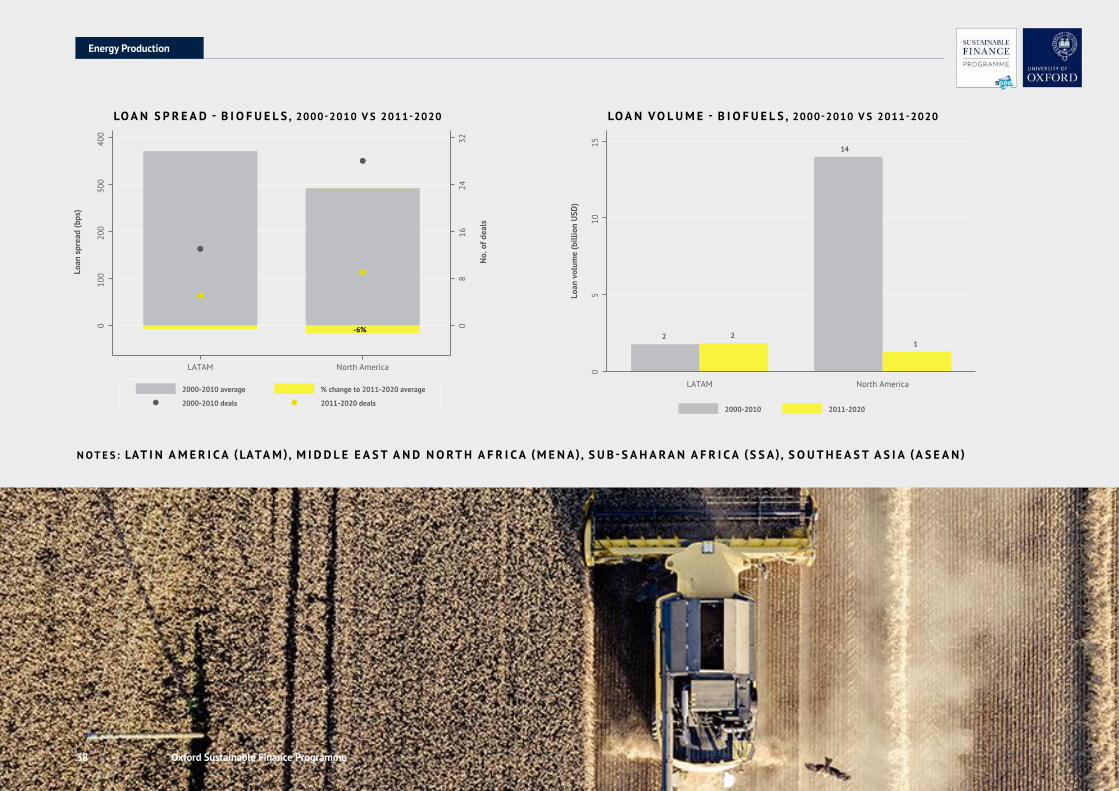
Oxford Sustainable Finance Programme38
LO A N S P R E A D - B I O F U E L S , 2000-2010 V S 2011-2020 LO A N V O L U M E - B I O F U E L S , 2000-2010 V S 2011-2020
2000-2010 average % change to 2011-2020 average
2000-2010 deals 2011-2020 deals
No.
of d
eals
Loan
spr
ead
(bps
)
-6% 08
1624
32
010
020
030
040
0
LATAM North America
2000-2010 average % change to 2011-2020 average
2000-2010 deals 2011-2020 deals
No.
of d
eals
Loan
spr
ead
(bps
)
-6% 08
1624
32
010
020
030
040
0
LATAM North America
2000-2010 2011-2020
Loan
vol
ume
(bill
ion
USD
)
2 2
14
1
05
1015
LATAM North America
2000-2010 2011-2020
Loan
vol
ume
(bill
ion
USD
)
2 2
14
1
05
1015
LATAM North America
EnergyProduction
N O T E S : LAT I N A M E R I C A (LATA M ) , M I D D L E E A S T A N D N O R T H A F R I C A (M E N A ) , S U B -S A H A R A N A F R I C A (S S A ) , S O U T H E A S T A S I A (A S E A N )
Oxford Sustainable Finance Programme39
Figure 20 reports the average loan spread and the sum of loan volume by country/region for different energy types, 2000-2010 vs 2011-2020. The changes in loan volume are for transactions where loan spread data is available in the LPC DealScan database. The charts show that:
C O A L M I N I N G
• The average loan spread for coal mining has grown faster in developed markets such as Europe, North America and Australia, at 134%, 80% and 71% respectively, while it has risen slower in emerging markets such as Latin America, China and Southeast Asia, at 56%, 32% and 12% respectively.
• Along with the sharp increase in loan spread, the sum of loan volume has significantly reduced by 90% in Europe. However, it has only marginally decreased in North America and Australia by 11% and 23%.
• For the past two decades, the highest loan spread region is Southeast Asia. It has risen by 12%, from 411bps to 461bps, comparing 2000-2010 and 2011-2020.
G A S O N S H O R E
• Onshore gas production loan spreads have decreased by 8% in North America. Meanwhile, loans in gas onshore production have grown quickly in North America, from $12.7 billion to $98 billion.
• The loan spread has increased in the Middle East and North Africa, Europe and Sub-Saharan Africa by 118%, 202% and 169% respectively.
O I L O N S H O R E P R O D U C T I O N
• The cost of debt associated with onshore oil production has decreased in India, China and Middle East and North Africa by 43%, 18% and 17% respectively, while it has increased in other regions/countries.
• Comparing the sum of loan volume in 2000-2010 with 2011-2020, it has more than doubled in North America.
O I L O F F S H O R E P R O D U C T I O N
• In Europe, the average loan spreads for offshore oil production have decreased by 30%. Meanwhile, loans have risen sharply from $7.8 billion to $190.5 billion.
• In North America, offshore oil loan spread has increased by 47%, and loan deals and volume have fallen by half.
EnergyProduction
The average loan spread for coal mining has grown faster in developed markets such as Europe, Nor th America and Austral ia
Oxford Sustainable Finance Programme40
U N C O N V E N T I O N A L O I L & G A S
• In the United States, the average loan spread for unconventional oil & gas has increased by 47%, and loan volume has declined from $17 billion to $4 billion.
• In contrast, loan spreads for unconventional oil & gas have decreased by 13% in Canada, and the loan volume has risen from $6 billion to $13 billion.
G A S P I P E L I N E S
• The cost of debt for gas pipelines has increased in Europe, North America and India by 80%, 52% and 67% respectively.
• The sum of loan volume for gas pipelines has doubled in North America, from $84 billion to $166 billion.
• The vast majority of loans has been issued to North American firms since 2000.
O I L P I P E L I N E S
• The cost of debt for oil pipelines has risen in most regions. Loans for oil pipelines has almost doubled in North America, from $35 billion to $63 billion.The vast majority of loans has been issued to North American firms since 2000.
O I L & G A S R E F I N I N G
• In Europe, the average loan spread for oil & gas refining has increased 54%. Meanwhile, over the past decade, loans in oil & gas refining have more than doubled, from $174 billion to $361 billion.
• In North America, the cost of debt has risen 17%. Meanwhile, the sum of loan volume has increased by 14% since 2011.
B I O F U E L S
• The average loan spread for biofuels has fallen in North America and LATAM by 6% and 2% respectively.
• Loans for biofuels have declined dramatically in the United States.
EnergyProductionl
361 billionLO A N S I N O I L & G A S R E F I N I N G H AV E M O R E T H A N DOUB L E D, F ROM174B I L L I O N U S D TO 361B I L L I O N U S D
Oxford Sustainable Finance Programme41
Summary
• There is a clear increase in loan spreads for coal mining across the entire period and over the past decade, increasing 54% from 2007-2010 to 2017-2020. This supports the findings of Fattouh et al. (2019), who show that investors perceive coal as significantly higher risk than other fossil fuel or renewable energy projects.
• However, in oil & gas, the picture is more mixed. Although loan spreads have risen since 2000, in the past decade loan spreads in oil & gas services and oil & gas production have remained largely stable, at +3% and +7% respectively. This suggestes that financial constraints on oil & gas companies have not materialised in the same manner as coal.
• This difference between coal mining and oil & gas reflects that lenders are potentially more ambivalent towards the latter when it comes to transition risk. Although these risks are present in oil & gas, lenders may view these as less material in the short-term, with loan maturities averaging 4 years.
• Overall, loan spreads in emerging markets remain higher than developed markets for oil & gas. However, in coal mining, the largest increases in loan spreads occurred in developed markets. In North America, loan spreads have increased to levels comparable with Southeast Asia and above China.
Summary
54%+3% & +7%I N T H E PA S T D E C A D E LO A N S P R E A D S I N O I L & G A S S E R V I C E S A N D O I L & G A S P R O D U C T I O N H AV E R E M A I N E D LA R G E LY S TA B L E ,AT+3%A ND+7%R E S P E CT I V E LY
This dif ference between coal mining and oi l & gas ref lects that lenders are potential ly more ambivalent towards the latter when it comes to transit ion r isk
T H E R E I S A C L E A R I N C R E A S E I N LO A N S P R E A D S F O R C O A L M I N I N G A C R O S S T H E E N T I R E P E R I O D A N D O V E R T H E PA S TD E CAD E , I N C R E A S I N G 54%
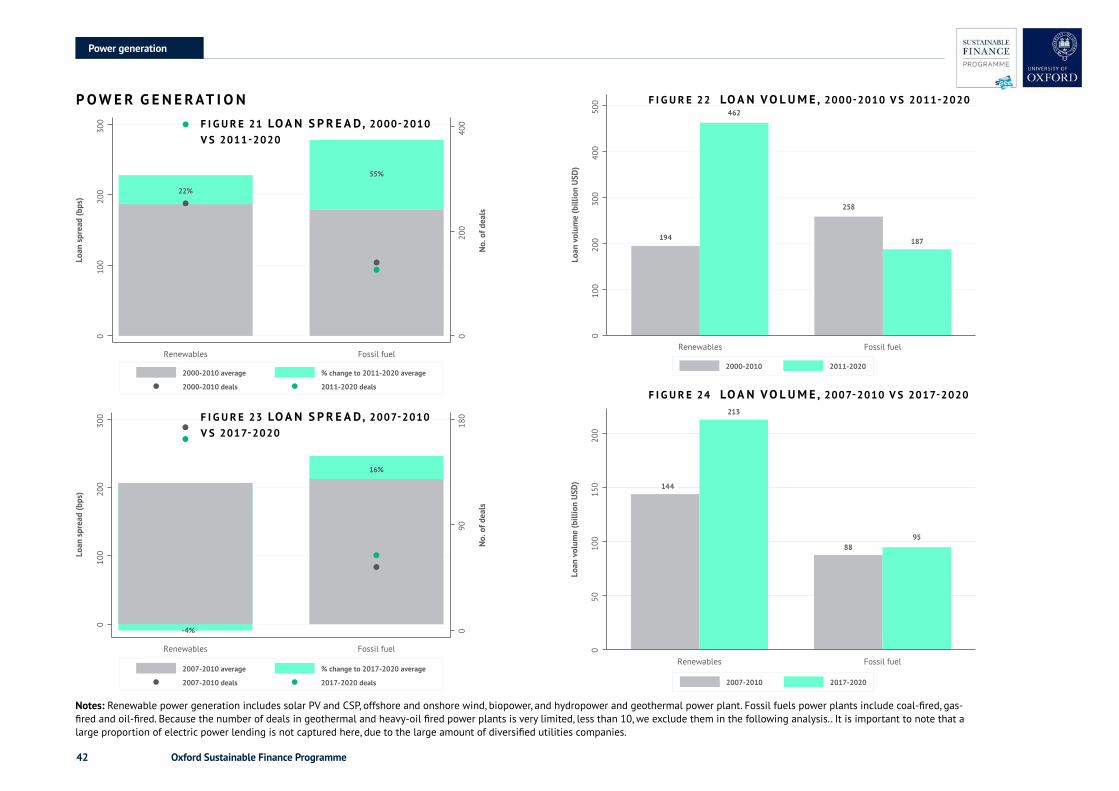
Oxford Sustainable Finance Programme42
Powergeneration
P O W E R G E N E R AT I O N
No.
of d
eals
Loan
spr
ead
(bps
)
55%
22%
020
040
0
010
020
030
0
Renewables Fossil fuel
2000-2010 average % change to 2011-2020 average
2000-2010 deals 2011-2020 deals
No.
of d
eals
Loan
spr
ead
(bps
)
55%
22%
020
040
0
010
020
030
0
Renewables Fossil fuel
2000-2010 average % change to 2011-2020 average
2000-2010 deals 2011-2020 deals
Loan
vol
ume
(bill
ion
USD
)
194
462
258
187
010
020
030
040
050
0
Renewables Fossil fuel
2000-2010 2011-2020
Loan
vol
ume
(bill
ion
USD
)
194
462
258
187
010
020
030
040
050
0
Renewables Fossil fuel
2000-2010 2011-2020
2007-2010 average % change to 2017-2020 average
2007-2010 deals 2017-2020 deals
No.
of d
eals
Loan
spr
ead
(bps
)
-4%
16%0
9018
0
010
020
030
0
Renewables Fossil fuel
2007-2010 average % change to 2017-2020 average
2007-2010 deals 2017-2020 deals
No.
of d
eals
Loan
spr
ead
(bps
)
-4%
16%0
9018
0
010
020
030
0
Renewables Fossil fuel
2007-2010 2017-2020
Loan
vol
ume
(bill
ion
USD
) 144
213
8895
050
100
150
200
Renewables Fossil fuel
2007-2010 2017-2020
Loan
vol
ume
(bill
ion
USD
) 144
213
8895
050
100
150
200
Renewables Fossil fuel
F I G U R E 23 LO A N S P R E A D, 2007-2010 V S 2017-2020
F I G U R E 22 LO A N V O L U M E , 2000-2010 V S 2011-2020
Notes: Renewable power generation includes solar PV and CSP, offshore and onshore wind, biopower, and hydropower and geothermal power plant. Fossil fuels power plants include coal-fired, gas-fired and oil-fired. Because the number of deals in geothermal and heavy-oil fired power plants is very limited, less than 10, we exclude them in the following analysis.. It is important to note that a large proportion of electric power lending is not captured here, due to the large amount of diversified utilities companies.
F I G U R E 21 LO A N S P R E A D, 2000-2010 V S 2011-2020
F I G U R E 24 LO A N V O L U M E , 2007-2010V S 2017-2020
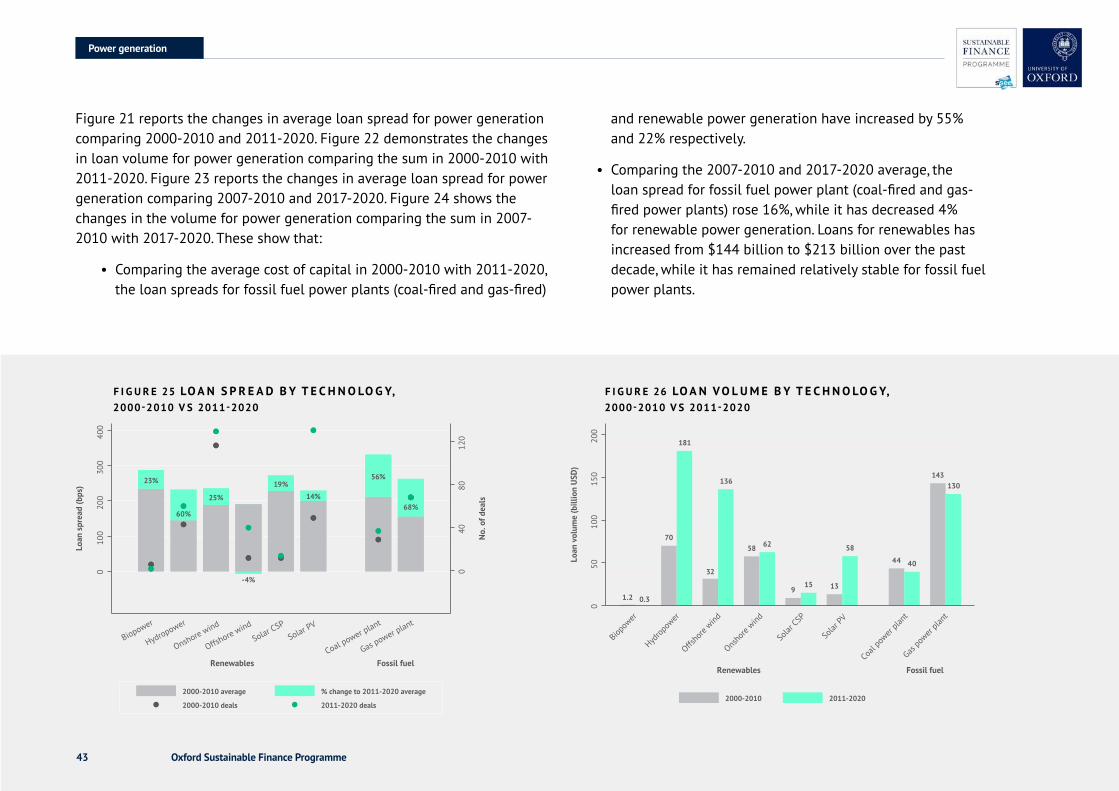
Oxford Sustainable Finance Programme43
Figure 21 reports the changes in average loan spread for power generation comparing 2000-2010 and 2011-2020. Figure 22 demonstrates the changes in loan volume for power generation comparing the sum in 2000-2010 with 2011-2020. Figure 23 reports the changes in average loan spread for power generation comparing 2007-2010 and 2017-2020. Figure 24 shows the changes in the volume for power generation comparing the sum in 2007-2010 with 2017-2020. These show that:
• Comparing the average cost of capital in 2000-2010 with 2011-2020, the loan spreads for fossil fuel power plants (coal-fired and gas-fired)
F I G U R E 25 LO A N S P R E A D B Y T E C H N O LO G Y, 2000-2010 V S 2011-2020
F I G U R E 26 LO A N V O L U M E B Y T E C H N O LO G Y, 2000-2010 V S 2011-2020
and renewable power generation have increased by 55% and 22% respectively.
• Comparing the 2007-2010 and 2017-2020 average, the loan spread for fossil fuel power plant (coal-fired and gas-fired power plants) rose 16%, while it has decreased 4% for renewable power generation. Loans for renewables has increased from $144 billion to $213 billion over the past decade, while it has remained relatively stable for fossil fuel power plants.
2000-2010 average % change to 2011-2020 average
2000-2010 deals 2011-2020 deals
No.
of d
eals
Loan
spr
ead
(bps
)
23% 56%
68%60%
25%
19%
14%
-4%
040
8012
0
010
020
030
040
0
Biopower
Hydropower
Onshore wind
Offshore wind
Solar CSPSolar PV
Coal power plant
Gas power plant
Renewables Fossil fuel
2000-2010 2011-2020
Loan
vol
ume
(bill
ion
USD
)
1.2 0.3
70
181
32
136
58 62
915 13
58
44 40
143130
050
100
150
200
Renewables Fossil fuel
Biopow
er
Hydrop
ower
Offsho
re wind
Onsho
re wind
Solar
CSP
Solar
PV
Coal p
ower
plant
Gas po
wer pla
nt
Powergeneration
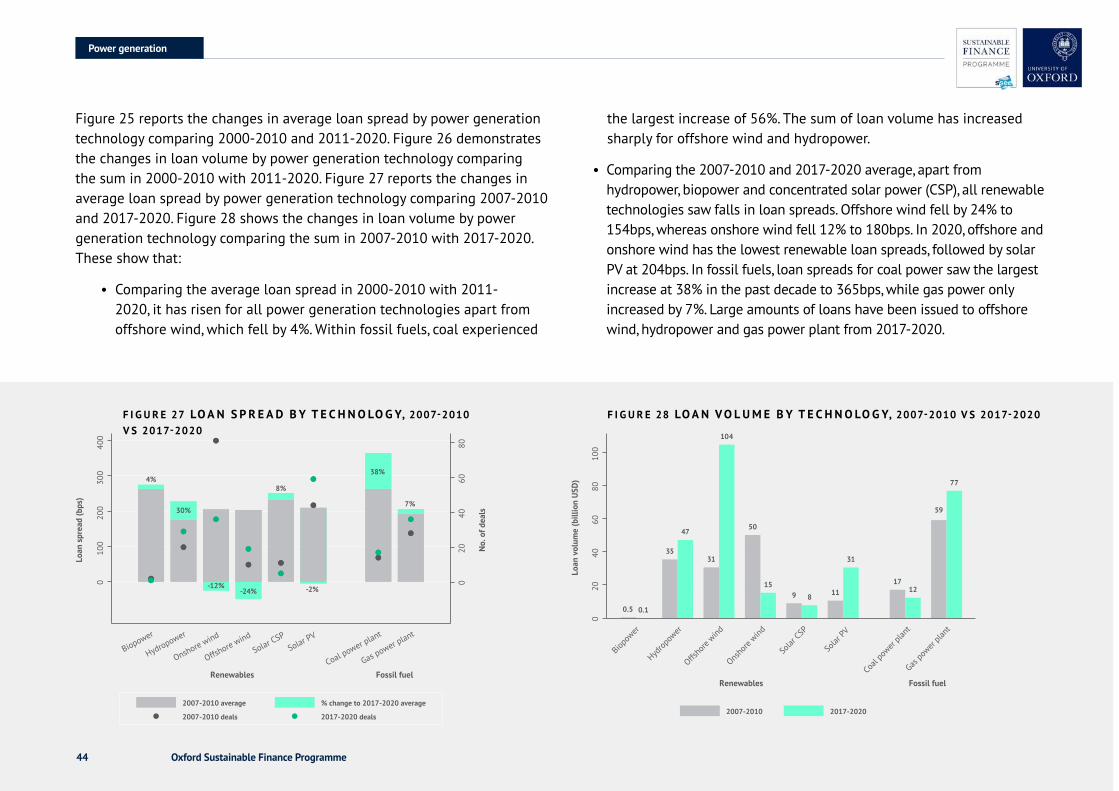
Oxford Sustainable Finance Programme44
F I G U R E 27 LO A N S P R E A D B Y T E C H N O LO G Y, 2007-2010 V S 2017-2020
F I G U R E 28 LO A N V O L U M E B Y T E C H N O LO G Y, 2007-2010V S 2017-2020
Figure 25 reports the changes in average loan spread by power generation technology comparing 2000-2010 and 2011-2020. Figure 26 demonstrates the changes in loan volume by power generation technology comparing the sum in 2000-2010 with 2011-2020. Figure 27 reports the changes in average loan spread by power generation technology comparing 2007-2010 and 2017-2020. Figure 28 shows the changes in loan volume by power generation technology comparing the sum in 2007-2010 with 2017-2020. These show that:
• Comparing the average loan spread in 2000-2010 with 2011-2020, it has risen for all power generation technologies apart from offshore wind, which fell by 4%. Within fossil fuels, coal experienced
the largest increase of 56%. The sum of loan volume has increased sharply for offshore wind and hydropower.
• Comparing the 2007-2010 and 2017-2020 average, apart from hydropower, biopower and concentrated solar power (CSP), all renewable technologies saw falls in loan spreads. Offshore wind fell by 24% to 154bps, whereas onshore wind fell 12% to 180bps. In 2020, offshore and onshore wind has the lowest renewable loan spreads, followed by solar PV at 204bps. In fossil fuels, loan spreads for coal power saw the largest increase at 38% in the past decade to 365bps, while gas power only increased by 7%. Large amounts of loans have been issued to offshore wind, hydropower and gas power plant from 2017-2020.
2007-2010 average % change to 2017-2020 average
2007-2010 deals 2017-2020 deals
No.
of d
eals
Loan
spr
ead
(bps
)
4%
30%
-12%-24%
8%
-2%
38%
7%
020
4060
80
010
020
030
040
0
Biopower
Hydropower
Onshore wind
Offshore wind
Solar CSPSolar PV
Coal power plant
Gas power plant
Renewables Fossil fuel
2007-2010 2017-2020
Loan
vol
ume
(bill
ion
USD
)
Renewables Fossil fuel
Biopow
er
Hydrop
ower
Offsho
re wind
Onsho
re wind
Solar
CSP
Solar
PV
Coal p
ower
plant
Gas po
wer pla
nt
0.5 0.1
35
47
31
104
50
159 8 11
31
1712
59
77
020
4060
8010
0
Powergeneration
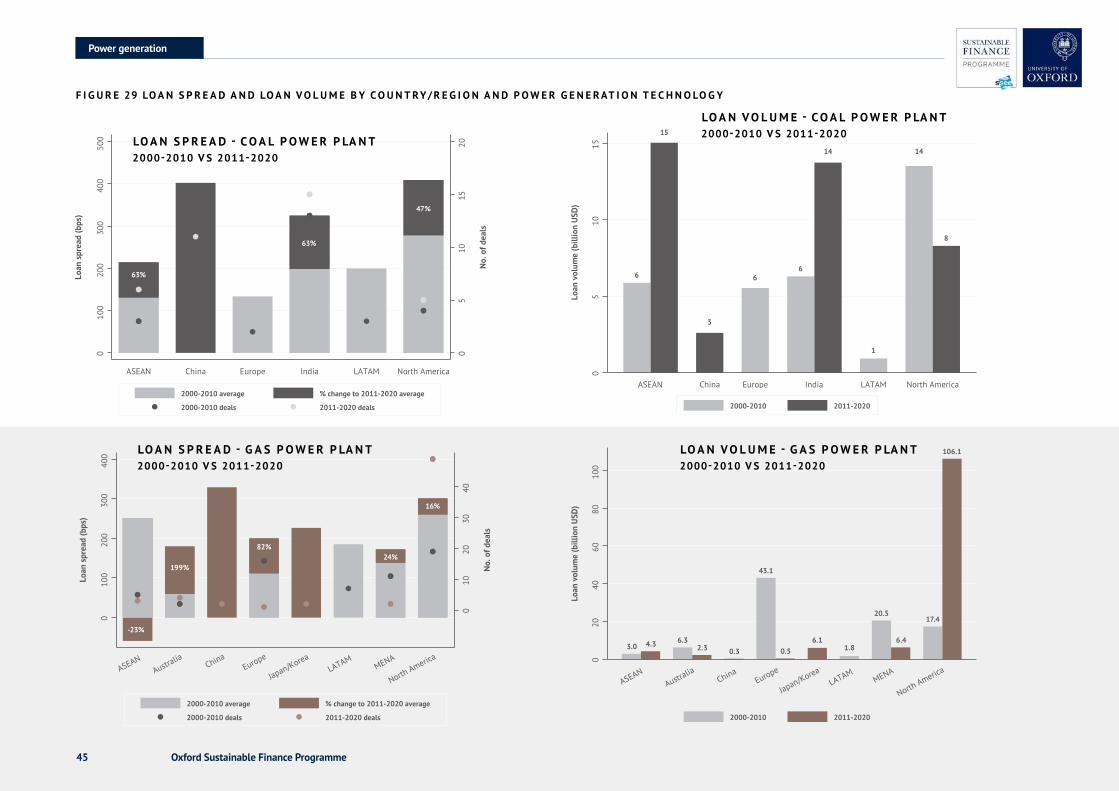
Oxford Sustainable Finance Programme45
F I G U R E 29 LO A N S P R E A D A N D LO A N V O L U M E B Y C O U N T RY / R E G I O N A N D P O W E R G E N E R AT I O N T E C H N O LO G Y
2000-2010 average % change to 2011-2020 average
2000-2010 deals 2011-2020 deals
63%
47%
63%
05
1015
20
No.
of d
eals
Loan
spr
ead
(bps
)
010
020
030
040
050
0
ASEAN China Europe India LATAM North America
2000-2010 average % change to 2011-2020 average
2000-2010 deals 2011-2020 deals
63%
47%
63%
05
1015
20
No.
of d
eals
Loan
spr
ead
(bps
)
010
020
030
040
050
0
ASEAN China Europe India LATAM North America
2000-2010 average % change to 2011-2020 average
2000-2010 deals 2011-2020 deals
-23%
199%
82%24%
16%
010
2030
40
No.
of d
eals
Loan
spr
ead
(bps
)
010
020
030
040
0
ASEANAustra
liaChina
Europe
Japan/KoreaLATAM
MENA
North America
2000-2010 average % change to 2011-2020 average
2000-2010 deals 2011-2020 deals
-23%
199%
82%24%
16%0
1020
3040
No.
of d
eals
Loan
spr
ead
(bps
)
010
020
030
040
0
ASEANAustra
liaChina
Europe
Japan/KoreaLATAM
MENA
North America
2000-2010 2011-2020
6
15
3
66
14
1
14
8
Loan
vol
ume
(bill
ion
USD
)
05
1015
ASEAN China Europe India LATAM North America
2000-2010 2011-2020
6
15
3
66
14
1
14
8
Loan
vol
ume
(bill
ion
USD
)
05
1015
ASEAN China Europe India LATAM North America
2000-2010 2011-2020
3.0 4.3 6.32.3 0.3
43.1
0.56.1
1.8
20.5
6.4
17.4
106.1
Loan
vol
ume
(bill
ion
USD
)
020
4060
8010
0
ASEANAustra
liaChina
Europe
Japan/KoreaLATAM
MENA
North America
2000-2010 2011-2020
2000-2010 2011-2020
3.0 4.3 6.32.3 0.3
43.1
0.56.1
1.8
20.5
6.4
17.4
106.1
Loan
vol
ume
(bill
ion
USD
)
020
4060
8010
0
ASEANAustra
liaChina
Europe
Japan/KoreaLATAM
MENA
North America
2000-2010 2011-2020
LO A N S P R E A D - G A S P O W E R P LA N T 2000-2010 V S 2011-2020
LO A N V O L U M E - C O A L P O W E R P LA N T 2000-2010 V S 2011-2020
LO A N V O L U M E - G A S P O W E R P LA N T2000-2010 V S 2011-2020
LO A N S P R E A D - C O A L P O W E R P LA N T 2000-2010 V S 2011-2020
Powergeneration
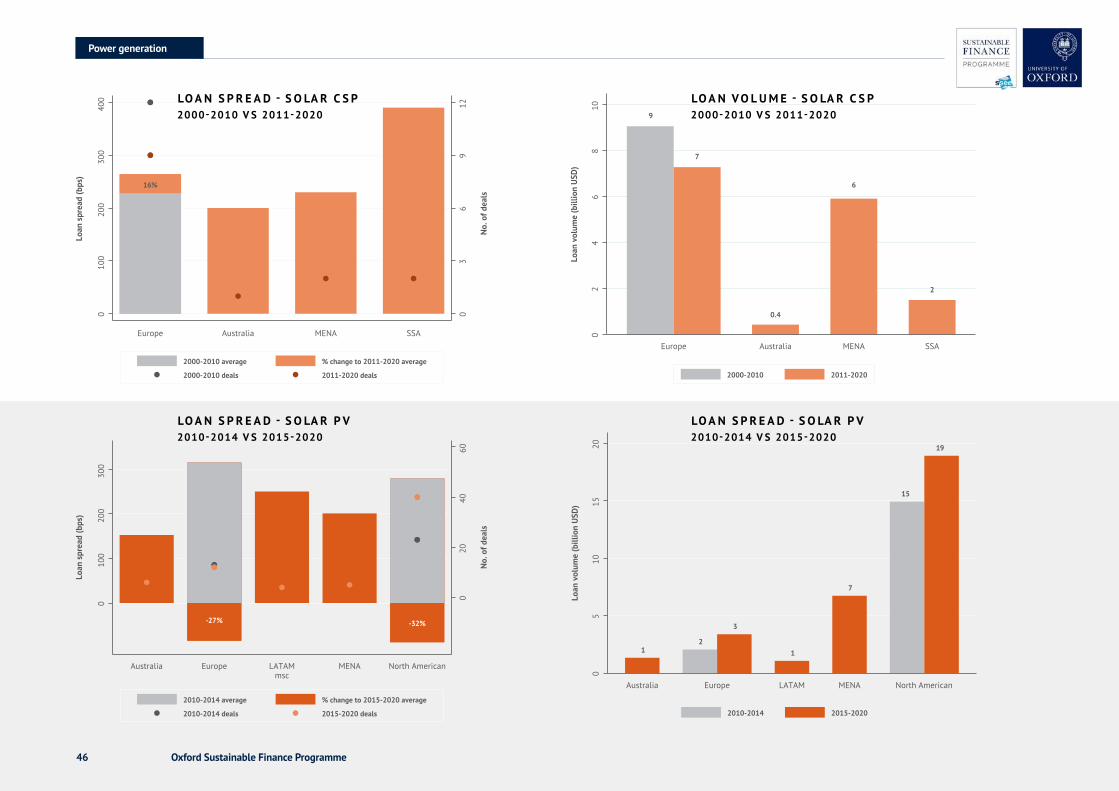
Oxford Sustainable Finance Programme462010-2014 average % change to 2015-2020 average
2010-2014 deals 2015-2020 deals
-27% -32%
020
4060
No.
of d
eals
Loan
spr
ead
(bps
)
010
020
030
0
Australia Europe LATAM MENA North Americanmsc
2010-2014 average % change to 2015-2020 average
2010-2014 deals 2015-2020 deals
-27% -32%
020
4060
No.
of d
eals
Loan
spr
ead
(bps
)
010
020
030
0
Australia Europe LATAM MENA North Americanmsc
2010-2014 2015-2020
Loan
vol
ume
(bill
ion
USD
)
12
3
1
7
15
19
05
1015
20
Australia Europe LATAM MENA North American
2010-2014 2015-2020
Loan
vol
ume
(bill
ion
USD
)1
2
3
1
7
15
19
05
1015
20
Australia Europe LATAM MENA North American
No.
of d
eals
Loan
spr
ead
(bps
)
16%
03
69
12
010
020
030
040
0
Europe Australia MENA SSA
2000-2010 average % change to 2011-2020 average
2000-2010 deals 2011-2020 deals
Loan
vol
ume
(bill
ion
USD
)
9
7
0.4
6
2
02
46
810
Europe Australia MENA SSA
2000-2010 2011-2020
LO A N V O L U M E - S O LA R C S P2000-2010 V S 2011-2020
LO A N S P R E A D - S O LA R C S P2000-2010 V S 2011-2020
LO A N S P R E A D - S O LA R P V 2010-2014 V S 2015-2020
LO A N S P R E A D - S O LA R P V 2010-2014 V S 2015-2020
Powergeneration
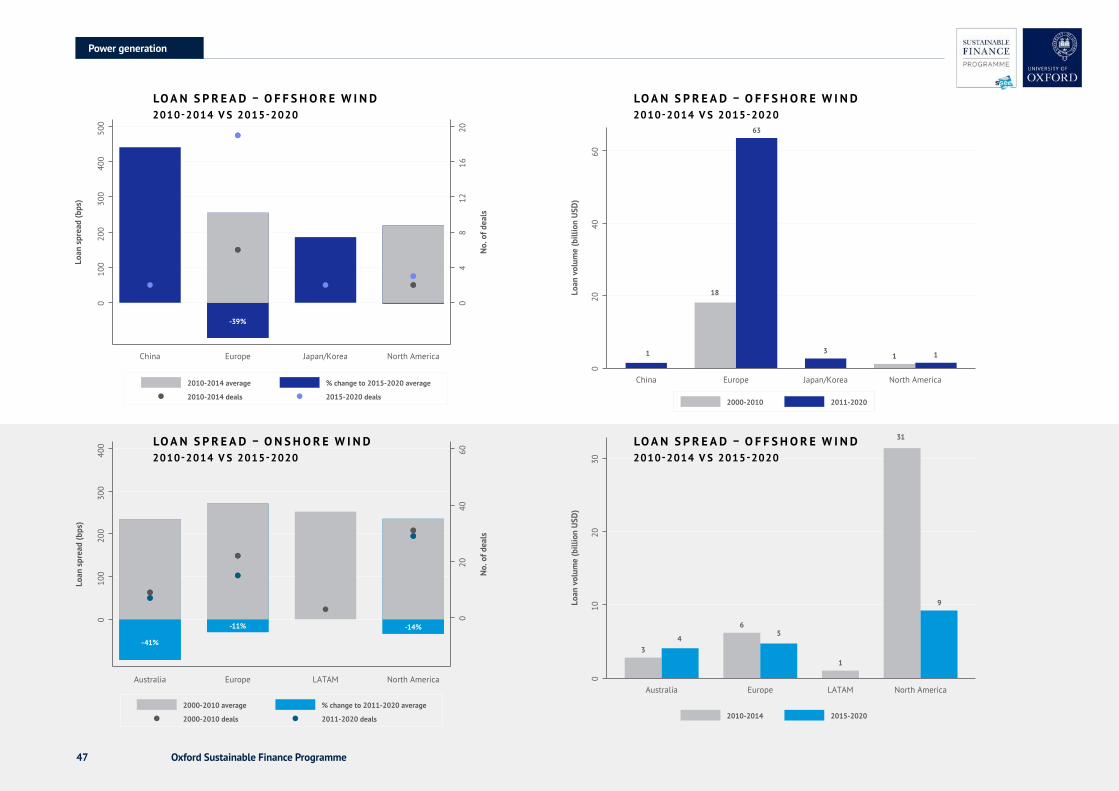
Oxford Sustainable Finance Programme47
2010-2014 average % change to 2015-2020 average
2010-2014 deals 2015-2020 deals
-39%
04
812
1620
No.
of d
eals
Loan
spr
ead
(bps
)
010
020
030
040
050
0
China Europe Japan/Korea North America
2010-2014 average % change to 2015-2020 average
2010-2014 deals 2015-2020 deals
-39%
04
812
1620
No.
of d
eals
Loan
spr
ead
(bps
)
010
020
030
040
050
0
China Europe Japan/Korea North America
2000-2010 average % change to 2011-2020 average
2000-2010 deals 2011-2020 deals
-41%
-11% -14%
020
4060
No.
of d
eals
Loan
spr
ead
(bps
)
010
020
030
040
0
Australia Europe LATAM North America
2000-2010 average % change to 2011-2020 average
2000-2010 deals 2011-2020 deals
-41%
-11% -14%
020
4060
No.
of d
eals
Loan
spr
ead
(bps
)
010
020
030
040
0
Australia Europe LATAM North America
2000-2010 2011-2020
1
18
63
31 1
Loan
vol
ume
(bill
ion
USD
)
020
4060
China Europe Japan/Korea North America
2000-2010 2011-2020
1
18
63
31 1
Loan
vol
ume
(bill
ion
USD
)
020
4060
China Europe Japan/Korea North America
2010-2014 2015-2020
34
65
1
31
9Loan
vol
ume
(bill
ion
USD
)
010
2030
Australia Europe LATAM North America
2010-2014 2015-2020
34
65
1
31
9Loan
vol
ume
(bill
ion
USD
)
010
2030
Australia Europe LATAM North America
LO A N S P R E A D – O F F S H O R E W I N D2010-2014 V S 2015-2020
LO A N S P R E A D – O F F S H O R E W I N D2010-2014 V S 2015-2020
LO A N S P R E A D – O N S H O R E W I N D2010-2014 V S 2015-2020
LO A N S P R E A D – O F F S H O R E W I N D2010-2014 V S 2015-2020
Powergeneration
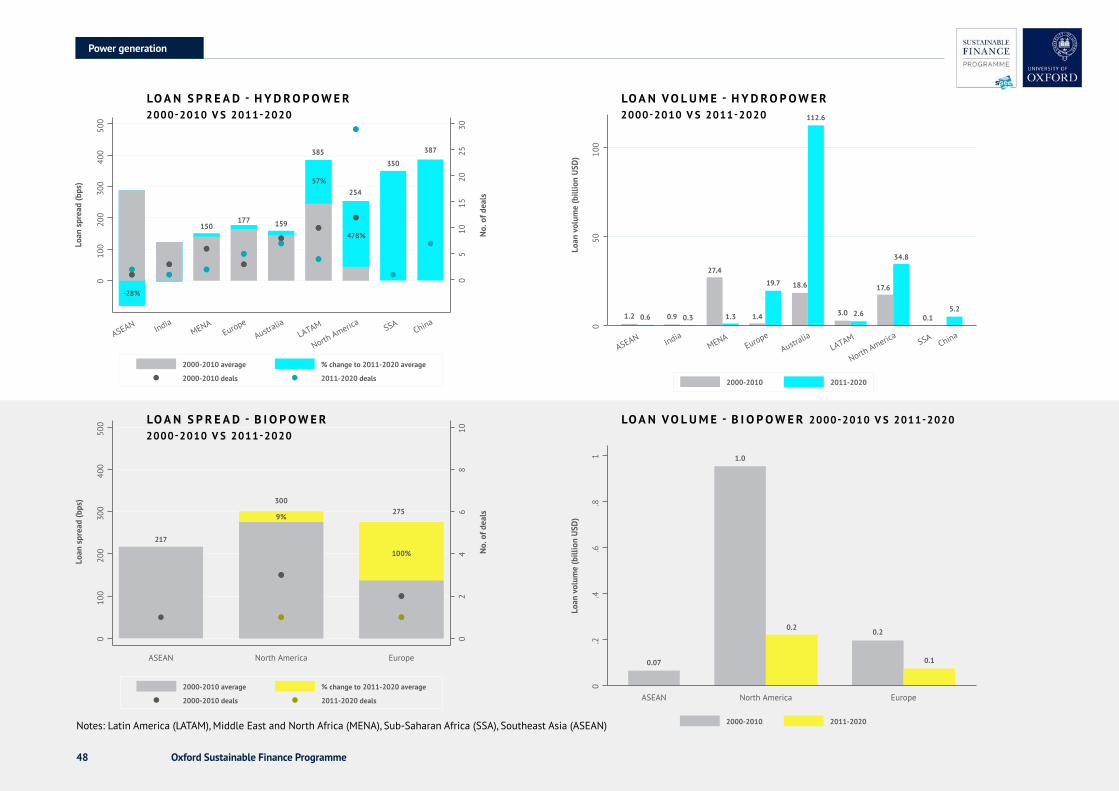
Oxford Sustainable Finance Programme48
Notes: Latin America (LATAM), Middle East and North Africa (MENA), Sub-Saharan Africa (SSA), Southeast Asia (ASEAN)
2000-2010 average % change to 2011-2020 average
2000-2010 deals 2011-2020 deals
No.
of d
eals
Loan
spr
ead
(bps
) 300
9%275
100%
217
02
46
810
010
020
030
040
050
0
ASEAN North America Europe
No.
of d
eals
Loan
spr
ead
(bps
)
150177 159
385
57%
478%
254
350
387
-28%
05
1015
2025
30
010
020
030
040
050
0
ASEAN IndiaMENA
Europe
Australia
LATAM
North America SSAChina
2000-2010 average % change to 2011-2020 average
2000-2010 deals 2011-2020 deals
No.
of d
eals
Loan
spr
ead
(bps
)
150177 159
385
57%
478%
254
350
387
-28%
05
1015
2025
30
010
020
030
040
050
0
ASEAN IndiaMENA
Europe
Australia
LATAM
North America SSAChina
2000-2010 average % change to 2011-2020 average
2000-2010 deals 2011-2020 deals
Loan
vol
ume
(bill
ion
USD
)
0.07
1.0
0.20.2
0.1
0.2
.4.6
.81
ASEAN North America Europe
2000-2010 2011-2020
Loan
vol
ume
(bill
ion
USD
)
0.07
1.0
0.20.2
0.1
0.2
.4.6
.81
ASEAN North America Europe
2000-2010 2011-2020
Loan
vol
ume
(bill
ion
USD
)
1.2 0.6 0.9 0.3
27.4
1.3 1.4
19.7 18.6
112.6
3.0 2.6
17.6
34.8
0.15.2
050
100
ASEAN IndiaMENA
Europe
Australia
LATAM
North America SSAChina
2000-2010 2011-2020
Loan
vol
ume
(bill
ion
USD
)
1.2 0.6 0.9 0.3
27.4
1.3 1.4
19.7 18.6
112.6
3.0 2.6
17.6
34.8
0.15.2
050
100
ASEAN IndiaMENA
Europe
Australia
LATAM
North America SSAChina
2000-2010 2011-2020
LO A N S P R E A D - H Y D R O P O W E R2000-2010 V S 2011-2020
LO A N S P R E A D - B I O P O W E R2000-2010 V S 2011-2020
LO A N V O L U M E - H Y D R O P O W E R2000-2010 V S 2011-2020
LO A N V O L U M E - B I O P O W E R 2000-2010 V S 2011-2020
Powergeneration
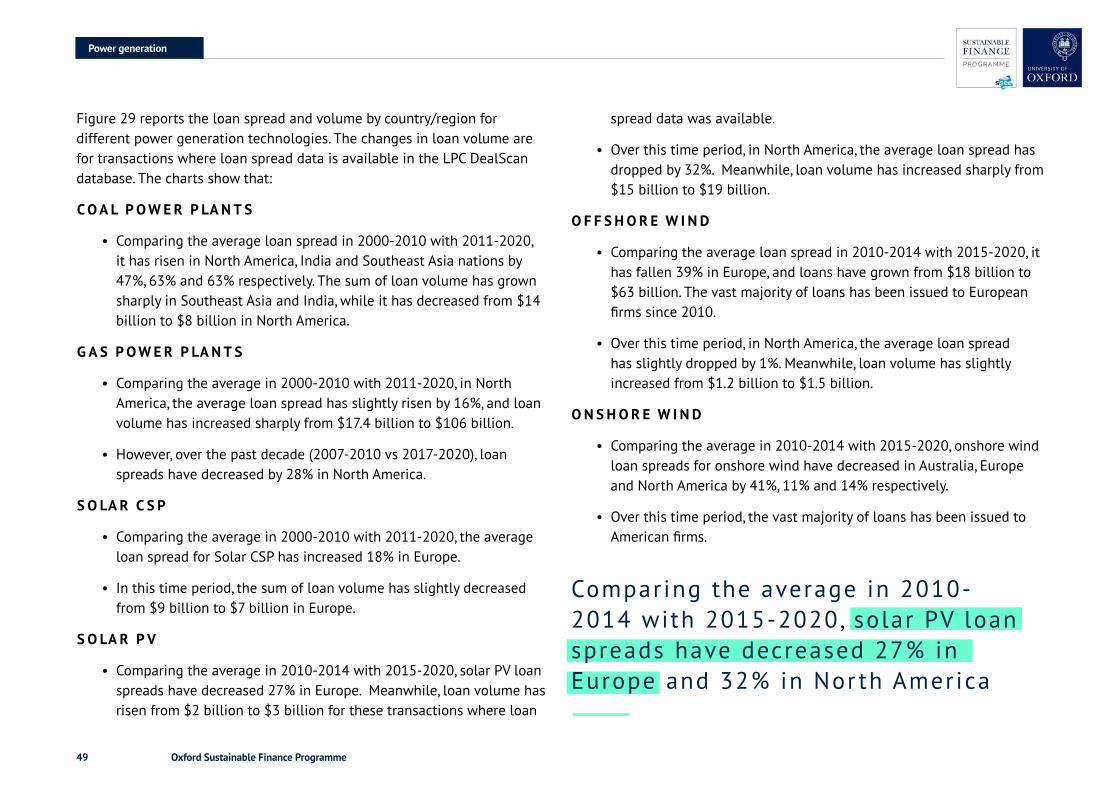
Oxford Sustainable Finance Programme49
Figure 29 reports the loan spread and volume by country/region for different power generation technologies. The changes in loan volume are for transactions where loan spread data is available in the LPC DealScan database. The charts show that:
C O A L P O W E R P LA N T S
• Comparing the average loan spread in 2000-2010 with 2011-2020, it has risen in North America, India and Southeast Asia nations by 47%, 63% and 63% respectively. The sum of loan volume has grown sharply in Southeast Asia and India, while it has decreased from $14 billion to $8 billion in North America.
G A S P O W E R P LA N T S
• Comparing the average in 2000-2010 with 2011-2020, in North America, the average loan spread has slightly risen by 16%, and loan volume has increased sharply from $17.4 billion to $106 billion.
• However, over the past decade (2007-2010 vs 2017-2020), loan spreads have decreased by 28% in North America.
S O LA R C S P
• Comparing the average in 2000-2010 with 2011-2020, the average loan spread for Solar CSP has increased 18% in Europe.
• In this time period, the sum of loan volume has slightly decreased from $9 billion to $7 billion in Europe.
S O LA R P V
• Comparing the average in 2010-2014 with 2015-2020, solar PV loan spreads have decreased 27% in Europe. Meanwhile, loan volume has risen from $2 billion to $3 billion for these transactions where loan
spread data was available.
• Over this time period, in North America, the average loan spread has dropped by 32%. Meanwhile, loan volume has increased sharply from $15 billion to $19 billion.
O F F S H O R E W I N D
• Comparing the average loan spread in 2010-2014 with 2015-2020, it has fallen 39% in Europe, and loans have grown from $18 billion to $63 billion. The vast majority of loans has been issued to European firms since 2010.
• Over this time period, in North America, the average loan spread has slightly dropped by 1%. Meanwhile, loan volume has slightly increased from $1.2 billion to $1.5 billion.
O N S H O R E W I N D
• Comparing the average in 2010-2014 with 2015-2020, onshore wind loan spreads for onshore wind have decreased in Australia, Europe and North America by 41%, 11% and 14% respectively.
• Over this time period, the vast majority of loans has been issued to American firms.
Powergeneration
Comparing the average in 2010-2014 with 2015-2020, solar PV loan spreads have decreased 27% in Europe and 32% in Nor th America
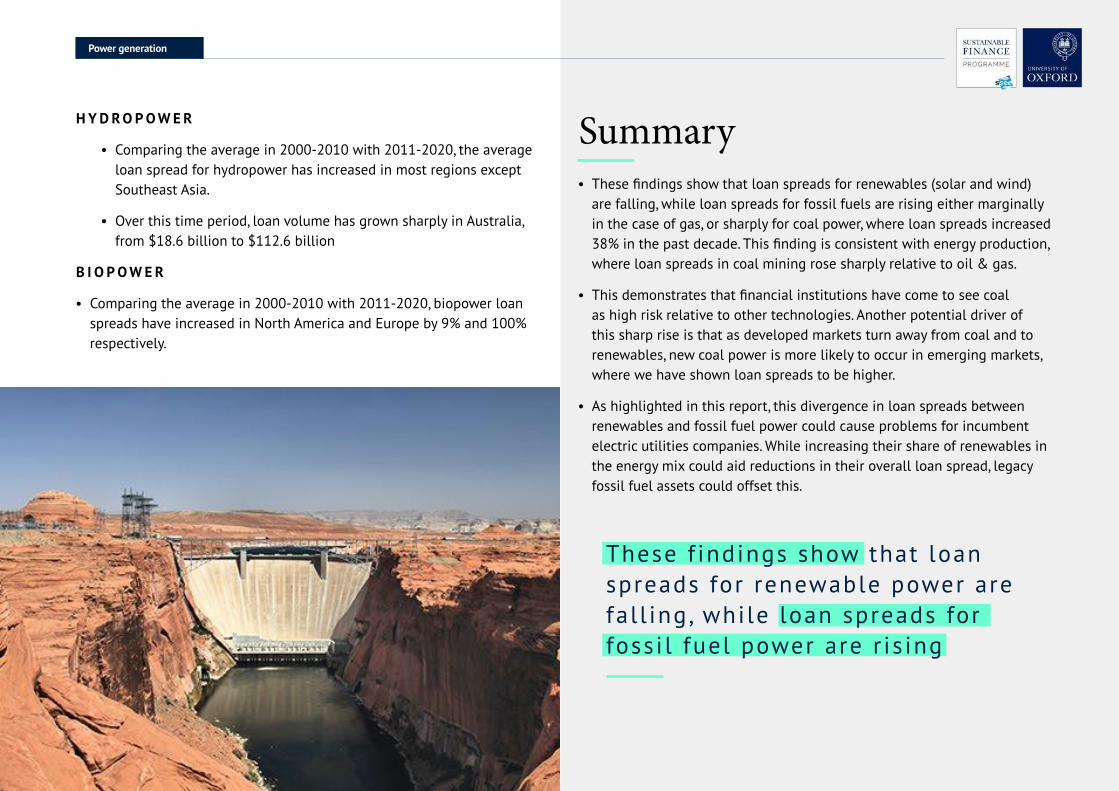
Oxford Sustainable Finance Programme50
H Y D R O P O W E R
• Comparing the average in 2000-2010 with 2011-2020, the average loan spread for hydropower has increased in most regions except Southeast Asia.
• Over this time period, loan volume has grown sharply in Australia, from $18.6 billion to $112.6 billion
B I O P O W E R
• Comparing the average in 2000-2010 with 2011-2020, biopower loan spreads have increased in North America and Europe by 9% and 100% respectively.
• These findings show that loan spreads for renewables (solar and wind) are falling, while loan spreads for fossil fuels are rising either marginally in the case of gas, or sharply for coal power, where loan spreads increased 38% in the past decade. This finding is consistent with energy production, where loan spreads in coal mining rose sharply relative to oil & gas.
• This demonstrates that financial institutions have come to see coal as high risk relative to other technologies. Another potential driver of this sharp rise is that as developed markets turn away from coal and to renewables, new coal power is more likely to occur in emerging markets, where we have shown loan spreads to be higher.
• As highlighted in this report, this divergence in loan spreads between renewables and fossil fuel power could cause problems for incumbent electric utilities companies. While increasing their share of renewables in the energy mix could aid reductions in their overall loan spread, legacy fossil fuel assets could offset this.
Summary
These f indings show that loan spreads for renewable power are fal l ing, while loan spreads for fossi l fuel power are r is ing
Powergeneration
Oxford Sustainable Finance Programme51
Conclusion
In our first report as part of the Energy Transition Risk and Cost of Capital Project (ETRC), we track how financing costs for fossil fuels and renewables have changed internationally over the past 20 years. While climate-related transition risks in the energy sector are sometimes viewed as distant, long-term risks, the impacts of which will not be felt for decades to come, we find this does not reflect reality.
In energy production, we find that there is a clear increase in loan spreads for coal mining across the entire period and over the past decade, increasing 54% from 2007-2010 to 2017-2020. This supports the findings of Fattouh et al. (2019), who show that investors perceive coal as significantly higher risk than other fossil fuel or renewable energy projects.
However, in oil & gas, the picture is more mixed. Although loan spreads have risen since 2000, in the past decade loan spreads in oil & gas services and oil & gas production have remained largely stable, at +3% and +7% respectively. This suggestes that financial constraints on oil & gas companies have not materialised in the same manner as coal.
This difference between coal mining and oil & gas reflects that lenders are potentially more ambivalent towards the latter when it comes to transition risk. Although these risks are present in oil & gas, lenders may view these as less material in the short-term, with loan maturities averaging 4 years.
Overall, loan spreads in emerging markets remain higher than developed markets for oil & gas. However, in coal mining, the largest increases in loan spreads occurred in developed markets. In North America, loan spreads have increased to levels comparable with Southeast Asia and above China.
4 Conclusion
In power generation, we find that loan spreads for renewables are falling, while loan spreads for fossil fuels are rising either marginally in the case of gas, or sharply for coal power, where loan spreads increased 38% in the past decade. This finding is consistent with energy production, where loan spreads in coal mining rose sharply relative to oil & gas.
This demonstrates that financial institutions have come to see coal as high risk relative to other technologies. Another potential driver of this sharp rise is that as developed markets turn away from coal and to renewables, new coal power is more likely to occur in emerging markets, where we have shown loan spreads to be higher.
As highlighted in this report, this divergence in loan spreads between renewables and fossil fuel power could cause problems for incumbent electric utilities companies. While increasing their share of renewables in the energy mix could aid reductions in their overall loan spread, legacy fossil fuel assets could offset this.
As highl ighted in this repor t , this divergence in loan spreads between renewables and fossi l fuel power could cause problems for incumbent electr ic ut i l i t ies companies .
Oxford Sustainable Finance Programme52
In this report we have focused on tracking changes in the cost of debt. The ETRC project will seek to do this regularly for financing costs, and in future work we will also extend this to the equity market, including the cost of equity and WACC estimated using the capital asset pricing model and analyst’s earnings forecasts models. In addition to further efforts to effectively track changes in the cost of capital across the energy sector, ETRC will seek to understand what is driving changes in the cost of capital, what is impeding or enabling the pricing of risk, and how the changing cost of capital will impact companies and providers of finance and investment. Research in these areas is essential for, among other things, identifying transformational interventions that can shift capital flows towards clean energy and away from dirty energy. It will also provide insights for shifting capital flows in other sectors of the global economy.
Conclusion
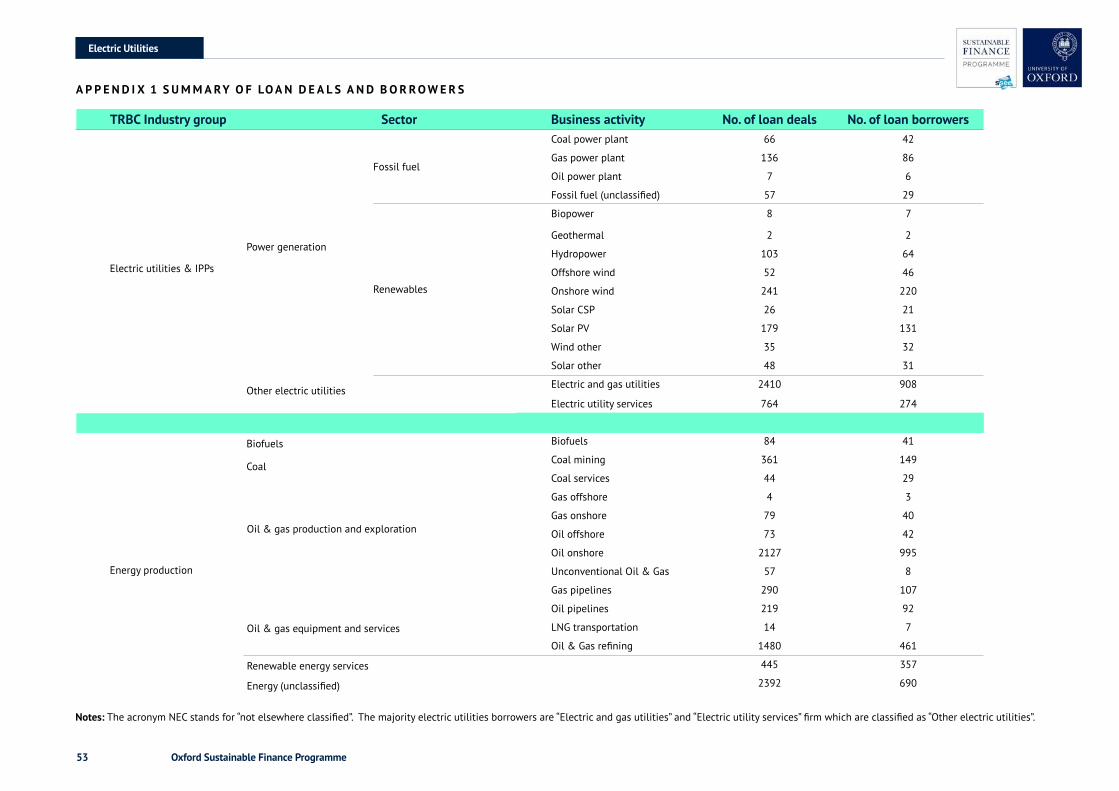
Electric Utilities
Oxford Sustainable Finance Programme53
Businessactivity No.ofloandeals No.ofloanborrowersCoal power plant 66 42
Gas power plant 136 86
Oil power plant 7 6
Fossil fuel (unclassified) 57 29
Biopower 8 7
Geothermal 2 2
Hydropower 103 64
Offshore wind 52 46
Onshore wind 241 220
Solar CSP 26 21
Solar PV 179 131
Wind other 35 32
Solar other 48 31
Electric and gas utilities 2410 908
Electric utility services 764 274
Biofuels 84 41
Coal mining 361 149
Coal services 44 29
Gas offshore 4 3
Gas onshore 79 40
Oil offshore 73 42
Oil onshore 2127 995
Unconventional Oil & Gas 57 8
Gas pipelines 290 107
Oil pipelines 219 92
LNG transportation 14 7
Oil & Gas refining 1480 461
445 357
2392 690
TRBCIndustrygroup Sector
Fossil fuel
Power generation
Renewables
Other electric utilities
Electric utilities & IPPs
Energy production
Biofuels
Coal
Oil & gas equipment and services
Oil & gas production and exploration
Renewable energy services
Energy (unclassified)
A P P E N D I X 1 S U M M A RY O F LO A N D E A L S A N D B O R R O W E R S
Notes: The acronym NEC stands for “not elsewhere classified”. The majority electric utilities borrowers are “Electric and gas utilities” and “Electric utility services” firm which are classified as “Other electric utilities”.
Oxford Sustainable Finance Programme54
References
References
Advis ory Group on Finance for the UK’s Climate Change Committee. 2020. “The Road to Net-Zero Finance.”
Ange lopoulos, Dimitrios, Robert Brückmann, Filip Jirouš, Inga Konstantinavičiute, Paul Noothout, John Psarras, Lucie Tesnière, and Barbara Breitschopf. 2016. “Risks and Cost of Capital for Onshore Wind Energy Investments in EU Countries.” Energy and Environment 27 (1): 82–104. https://doi.org/10.1177/0958305X16638573.
Ange lopoulos, Dimitrios, Haris Doukas, John Psarras, and Giorgos Stamtsis. 2017. “Risk-Based Analysis and Policy Implications for Renewable Energy Investments in Greece.” Energy Policy 105 (March): 512–23. https://doi.org/10.1016/j.enpol.2017.02.048.
Ansa r, Atif, Ben Caldecott, and James Tilbury. 2013. “Stranded Assets and the Fossil Fuel Divestment Campaign: What Does Divestment Mean for the Valuation of Fossil Fuel Assets?” Stranded Assets Programme, Smith School of Enterprise and the Environment, University of Oxford.
Atan asova, Christina, and Eduardo S. Schwartz. 2019. “Stranded Fossil Fuel Reserves and Firm Value.” NBER Working Paper Series.
Auve rlot, Dominique, Beeker Étienne, Hossie Gaëlle, Louise Oriol, Aude Rigard-Cerison, Marc Oliver Bettzüge, Dieter Helm, and Fabien Roques. 2014. “The Crisis of the European Electricity System - Diagnosis and Possible Ways Forward.” http://www.strategie.gouv.fr/blog/wp-content/uploads/2014/01/CGSP_Report_European_Electricity_System_030220141.pdf.
Bank of England. 2015. “The Impact of Climate Change on the UK Insurance Sector A Climate Change Adaptation Report by the Prudential Regulation Authority.”
Barke nbus, Jack. 2009. “Our Electric Automotive Future: CO2 Savings through a Disruptive Technology.” Policy and Society 27 (4): 399–410. https://doi.org/10.1016/j.polsoc.2009.01.005.
Batte n, Sandra, Rhiannon Sowerbutts, and Misa Tanaka. 2017. “Let’s Talk About the Weather: The Impact of Climate Change on Central Banks.” SSRN Electronic Journal, no. 603. https://doi.org/10.2139/ssrn.2783753.
Battis ton, Stefano, Antoine Mandel, Irene Monasterolo, Franziska Schütze, and Gabriele Visentin. 2017. “A Climate Stress-Test of the Financial System.” Nature Climate Change 7 (4): 283–88. https://doi.org/10.1038/nclimate3255.
Block, Stanley. 2003. “Divisional Cost of Capital: A Study of Its Use by Major U.S. Firms.” Engineering Economist 48 (4): 345–62. https://doi.org/10.1080/00137910309408773.
Bui, B inh, Olayinka Moses, and Muhammad N. Houqe. 2020. “Carbon Disclosure, Emission Intensity and Cost of Equity Capital: Multi-Country Evidence.” Accounting and Finance 60 (1): 47–71. https://doi.org/10.1111/acfi.12492.
Calde cott, Ben, Gerard Dericks, and James Mitchell. 2015. Stranded Assets and Subcritical Coal The Risk to Companies and Investors.
Calde cott, Ben, Nicholas Howarth, and Patrick McSharry. 2013. “Stranded Assets in Agriculture: Protecting Value from Environment-Related Risks.” Stranded Assets Programme, SSEE, University of Oxford.
Calde cott, Daniel J. Tulloch, Geraldine Bouveret, Alexander Pfeiffer, Lucas Kruitwagen, Jeremy McDaniels, and Gerard Dericks. 2017. “The Fate of European Coal-Fired Power Stations Planned in the Mid-2000s.” Sustainable Finance Programme, no. August. http://www.smithschool.ox.ac.uk/research/sustainable-finance/publications/The-fate-of-European-coal-fired-power-stations-planned-in-the-mid-2000s-Working-Paper.pdf.
Carne y, Mark. 2015. “Breaking the Tragedy of the Horizon – Climate Change and Financial Stability - Speech given by Mark Carney at Lloyd’s of London.” www.bankofengland.co.uk/publications/Pages/speeches/default.aspx.
Chava , Sudheer. 2014. “Environmental Externalities and Cost of Capital.” Management Science 60 (9): 2223–47. https://doi.org/10.1287/mnsc.2013.1863.
Chen, Linda H., and Lucia Silva Gao. 2012. “The Pricing of Climate Risk.” Accounting and Finance Faculty Publication Series. 5. https://doi.org/10.2139/ssrn.1940727.
Oxford Sustainable Finance Programme55
Creutz ig, Felix, Peter Agoston, Jan Christoph Goldschmidt, Gunnar Luderer, Gregory Nemet, and Robert C Pietzcker. 2017. “The Underestimated Potential of Solar Energy to Mitigate Climate Change,” no. August. https://doi.org/10.1038/nenergy.2017.140.
Curti n, J., C. McInerney, B. Ó Gallachóir, C. Hickey, P. Deane, and P. Deeney. 2019. “Quantifying Stranding Risk for Fossil Fuel Assets and Implications for Renewable Energy Investment: A Review of the Literature.” Renewable and Sustainable Energy Reviews. Elsevier Ltd. https://doi.org/10.1016/j.rser.2019.109402.
De, J ordi, Helena Martín, Jaume Miret, Miguel Castilla, Ramon Guzman, and Royal Decree-law. 2016. “Evaluating the 2014 Retroactive Regulatory Framework Applied to the Grid Connected PV Systems in Spain.” Applied Energy 170: 329–44. https://doi.org/10.1016/j.apenergy.2016.02.092.
Delo itte. 2018. “Back to Basics: Solving the Capital Conundrum of US Midstream Companies.” On Strategy. https://onstrategyhq.com/resources/back-to-basics-solving-the-swot-riddle-part-1/.
Depa rtment for Work & Pensions. 2018. “Government Response: Clarifying and Strengthening Trustees’ Investment Duties.”
Dio, V Di, S Favuzza, D La Cascia, F Massaro, and G Zizzo. 2015. “Critical Assessment of Support for the Evolution of Photovoltaics and Feed-in Tariff ( s ) in Italy.” SUSTAINABLE ENERGY TECHNOLOGIES AND ASSESSMENTS 9: 95–104. https://doi.org/10.1016/j.seta.2014.12.004.
Dobro tkova, Zuzana, Kavita Surana, and Pierre Audinet. 2018. “The Price of Solar Energy : Comparing Competitive
Auctions for Utility-Scale Solar PV in Developing Countries ” Energy Policy 118 (June 2017): 133–48. https://doi.org/10.1016/j.enpol.2018.03.036.
Donov an, Charles, and Christopher Corbishley. 2016. “The Cost of Capital and How It Affects Climate Change Mitigation Investment.”
Driver, Ciaran, and Paul Temple. 2009. “Why Do Hurdle Rates Differ from the Cost of Capital?” Cambridge Journal of Economics 34 (3): 501–23. https://doi.org/10.1093/cje/bep013.
Drobe tz, Wolfgang, Sadok El Ghoul, Omrane Guedhami, and Malte Janzen. 2018. “Policy Uncertainty, Investment, and the Cost of Capital.” Journal of Financial Stability 39: 28–45. https://doi.org/10.1016/j.jfs.2018.08.005.
Duff & Phelps. 2018. “Oil & Gas Intelligence Report: Financing Instruments in the Upstream Sector,” no. April: 1–17. http://info.drillinginfo.com/.
Dunz , Nepomuk, Asjad Naqvi, and Irene Monasterolo. 2020. “Climate Transition Risk, Climate Sentiments, and Financial Stability in a Stock-Flow Consistent Approach.” SSRN Electronic Journal. https://doi.org/10.2139/ssrn.3520764.
Egli, Florian. 2020. “Renewable Energy Investment Risk: An Investigation of Changes over Time and the Underlying Drivers.” Energy Policy 140 (April 2019): 111428. https://doi.org/10.1016/j.enpol.2020.111428.
Egli, Florian, Bjarne Steffen, and Tobias S. Schmidt. 2018. “A Dynamic Analysis of Financing Conditions for Renewable Energy Technologies.” Nature Energy 3 (12): 1084–92. https://doi.org/10.1038/s41560-018-0277-y.
——— . 2019. “Bias in Energy System Models with Uniform
Cost of Capital Assumption.” Nature Communications 10 (1): 1–3. https://doi.org/10.1038/s41467-019-12468-z.
El, Sa dok, Ghoul Omrane, Guedhami Hakkon, and Kim Kwangwoo. 2018. “Corporate Environmental Responsibility and the Cost of Capital : International Evidence.” Journal of Business Ethics 149 (2): 335–61. https://doi.org/10.1007/s10551-015-3005-6.
Erick son, Peter, Adrian Down, Michael Lazarus, and Doug Koplow. 2017. “Effect of Subsidies to Fossil Fuel Companies on United States Crude Oil Production.” Nature Energy 2 (11): 891–98. https://doi.org/10.1038/s41560-017-0009-8.
Eska nder, Shaikh M, Sam Fankhauser, and Joana Setzer. 2020. “Global Lessons from Climate Change Legislation and Litigation,” 1–44. http://www.nber.org/papers/w27365.
Euro pean Commission. 2020. “Taxonomy : Final Report of the Technical Expert Group.”
Fard, Amirhossein, Siamak Javadi, and Incheol Kim. 2020. “Environmental Regulation and the Cost of Bank Loans: International Evidence.” Journal of Financial Stability 51 (956). https://doi.org/10.1016/j.jfs.2020.100797.
Farfa n, Javier, and Christian Breyer. 2016. “Structural Changes of Global Power Generation Capacity towards Sustainability and the Risk of Stranded Investments Supported by a Sustainability Indicator.” https://doi.org/10.1016/j.jclepro.2016.09.068.
Farm er, J D, C Hepburn, M C Ives, T Hale, T Wetzer, P Mealy, R Rafaty, S Srivastav, and R Way. 2019. “Sensitive Intervention Points in the Post-Carbon Transition.” Science 364 (6436): 132 LP – 134. https://doi.org/10.1126/science.aaw7287.
References
Oxford Sustainable Finance Programme56
Fatto uh, Bassam, Poudineh Rahmatallah, and Rob West. 2019. “Energy Transition Uncertainty And-the Implications of Change in the Risk Preferences of Fossil Fuel Investors Insight.”
Finne rty, John D. 2013. Project Financing : Asset-Based Financial Engineering. 3rd ed. Wiley Finance Ser. Oxford.
Frank , Murray Z., and Tao Shen. 2016. “Investment and the Weighted Average Cost of Capital.” Journal of Financial Economics 119 (2): 300–315. https://doi.org/10.1016/j.jfineco.2015.09.001.
———.
Friedl ingstein, P, R M Andrew, J Rogelj, G P Peters, J G Canadell, R Knutti, G Luderer, et al. 2014. “Persistent Growth of CO 2 Emissions and Implications for Reaching Climate Targets.” Nature Geoscience| 7. https://doi.org/10.1038/NGEO2248.
Ge, W enxia, and Mingzhi Liu. 2015. “Corporate Social Responsibility and the Cost of Corporate Bonds.” Journal of Accounting and Public Policy 34 (6): 597–624. https://doi.org/10.1016/j.jaccpubpol.2015.05.008.
Gilch rist, Simon, and Egon Zakrajsek. 2007. “Investment and the Cost of Capital: New Evidence from the Corporate Bond Market.” NBER Working Paper.
Gilch rist, Simon, and Egon Zakrajšek. 2012. “Credit Spreads and Business Cycle Fluctuations.” American Economic Review 102 (4): 1692–1720. https://doi.org/10.1257/aer.102.4.1692.
Gree n, Jemma, and Peter Newman. 2016. “Journal of Sustainable Finance & Investment Disruptive Innovation, Stranded Assets and Forecasting: The Rise
and Rise of Renewable Energy,” no. 2: 169–87. https://doi.org/10.1080/20430795.2016.1265410.
Haeg el, Nancy M., Harry Atwater, Teresa Barnes, Christian Breyer, Anthony Burrell, Yet-Ming Chiang, Stefaan De Wolf, et al. 2019. “Terawatt-Scale Photovoltaics: Transform Global Energy.” Science. https://doi.org/10.1126/science.aaw1845.
Haite s, Erik. 2018. “Climate Policy Carbon Taxes and Greenhouse Gas Emissions Trading Systems: What Have We Learned? Carbon Taxes and Greenhouse Gas Emissions Trading Systems: What Have We Learned?” https://doi.org/10.1080/14693062.2018.1492897.
Halli ng, Michael, Jin Yu, and Josef Zechner. 2020. “Primary Corporate Bond Markets and Social Responsibility.” SSRN Electronic Journal. https://doi.org/10.2139/ssrn.3681666.
Hals t ead, Matthew, Jasper Donker, Francesco Dalla Longa, and Bob Van Der. 2019. “The Importance of Fossil Fuel Divestment and Competitive Procurement for Financing Europe ’ s Energy Transition” 0795. https://doi.org/10.1080/20430795.2019.1619339.
Hee d e, Richard. 2013. “Tracing Anthropogenic Carbon Dioxide and Methane Emissions to Fossil Fuel and Cement Producers, 1854-2010.” Climatic Change. https://doi.org/10.1007/s10584-013-0986-y.
Hel m s, Thorsten, Sarah Salm, and Rolf Wüstenhagen. 2015. “Investor-Specific Cost of Capital and Renewable Energy Investment Decisions.” In Charles W Donovan (Ed.),RENEWABLE ENERGY FINANCE Funding the Future of Energy, Chapter 5, pages 85-111.
Hirth , Lion, and Jan Christoph Steckel. 2016. “The Role of Capital Costs in Decarbonizing the Electricity Sector.” Environmental Research Letters 11 (11). https://doi.org/10.1088/1748-9326/11/11/114010.
HM T reasury. 2020. “A Roadmap towards Mandatory Climate-Related Disclosures.” https://www.gov.uk/government/publications/uk-joint-regulator-and-government-tcfd-taskforce-interim-report-and-roadmap.
IEA. 2 019. “World Energy Investment 2019.” World Energy Investment 2019. https://doi.org/10.1787/4f4f25b4-en.
——— . 2020a. “Evolution of Solar PV Module Cost by Data Source, 1970-2020.” 2020. https://www.iea.org/data-and-statistics/charts/evolution-of-solar-pv-module-cost-by-data-source-1970-2020.
——— . 2020b. “Global Energy Review 2020.” IEA. https://www.iea.org/reports/global-energy-review-2020.
——— . 2020c. “Global EV Outlook 2020.” Global EV Outlook 2020. https://doi.org/10.1787/d394399e-en.
———. 2020d. “Renewables 2020 Data Explorer.” https://www.iea.org/reports/renewables-2020.
IPCC. 2018. “IPCC Special Report 1.5 - Summary for Policymakers.” IPCC.
IREN A, IEA, and REN21. 2018. Renewable Energy Policies in a Time of Transition. https://www.irena.org/-/media/Files/IRENA/Agency/Publication/2018/Apr/IRENA_IEA_REN21_Policies_2018.pdf.
References
Oxford Sustainable Finance Programme57
ITRP V. 2019. “International Technology Roadmap for Photovoltaic (ITRPV): Results 2018.” Itrpv, no. March. http://www.itrpv.net/.cm4all/iproc.php/ITRPV Seventh Edition including maturity report 20161026.pdf?cdp=a.
Jafar izadeh, Babak, and Reidar B. Bratvold. 2019. “Exploration Economics: Taking Opportunities and the Risk of Double-Counting Risk.” Mineral Economics 32 (3): 323–35. https://doi.org/10.1007/s13563-019-00188-1.
Kamin ker, Christopher, and Fiona Stewart. 2012. The Role of Institutional Investors in Financing Clean Energy. OECD Publishing. https://doi.org/10.1787/5k9312v21l6f-en.
Karne yeva, Yuliya, and Rolf Wüstenhagen. 2017. “Solar Feed-in Tari Ff s in a Post-Grid Parity World : The Role of Risk , Investor Diversity and Business Models.” Energy Policy 106 (September 2016): 445–56. https://doi.org/10.1016/j.enpol.2017.04.005.
Kemp , Alexander G, and Linda Stephen. 2018. “Investment Hurdles in the UKCS and Their Effects: A Response to the OGA Consultation on the Approach to ‘Satisfactory Expected Commercial Return’ in the MER UK Strategy Aberdeen Centre for Research in Energy Economics and Finance (ACREEF).” Aberdeen Centre for Research in Energy Economics and Finance, no. 142.
Kiese l, Florian, and Felix Lücke. 2020. “ESG in Credit Ratings and the Impact on Financial Markets.” Financial Markets, Institutions & Instruments 28 (3): 293–290. https://doi.org/10.1111/fmii.12114.
Klei m eier, Stefanie, and Michael Viehs. 2016. “Carbon Disclosure, Emission Levels, and the Cost of Debt.”
SSRN Electronic Journal, 1–42. https://doi.org/10.2139/ssrn.2719665.
Kless mann, Corinna, Max Rathmann, David de Jager, Alexis Gazzo, Gustav Resch, Sebastian Busch, and Mario Ragwitz. 2013. “Policy Options for Reducing the Costs of Reaching the European Renewables Target.” Renewable Energy 57 (September): 390–403. https://doi.org/10.1016/j.renene.2013.01.041.
Krüge r, Philipp, Augustin Landier, and David Thesmar. 2015. “The WACC Fallacy: The Real Effects of Using a Unique Discount Rate.” Journal of Finance 70 (3): 1253–85. https://doi.org/10.1111/jofi.12250.
Krupa , Joel, and L D Danny Harvey. 2017. “Renewable Electricity Fi Nance in the United States : A State-of-the-Art Review.” Energy 135: 913–29. https://doi.org/10.1016/j.energy.2017.05.190.
Larss on, Simon, Dean Fantazzini, Simon Davidsson, Sven Kullander, and Mikael Höök. 2013. “Reviewing Electricity Production Cost Assessments.” https://doi.org/10.1016/j.rser.2013.09.028.
Lillie stam, Johan, Anthony Patt, and Germán Bersalli. 2020. “The Effect of Carbon Pricing on Technological Change for Full Energy Decarbonization: A Review of Empirical Ex-Post Evidence.” Wiley Interdisciplinary Reviews: Climate Change, no. May 2020: 1–21. https://doi.org/10.1002/wcc.681.
Lin, X iaoji, Chong Wang, Neng Wang, and Jinqiang Yang. 2018. “Investment, Tobin’s q, and Interest Rates.” Journal of Financial Economics 130 (3): 620–40.
https://doi.org/10.1016/j.jfineco.2017.05.013.
Linqu iti, Peter, and Nathan Cogswell. 2016. “The Carbon Ask: Effects of Climate Policy on the Value of Fossil Fuel Resources and the Implications for Technological Innovation.” https://doi.org/10.1007/s13412-016-0397-2.
McGla de, Christophe, and Paul Ekins. 2015. “The Geographical Distribution of Fossil Fuels Unused When Limiting Global Warming to 2 [Deg]C.” Nature 517 (7533): 187–90. http://dx.doi.org/10.1038/nature14016.
Meier , Iwan, and Vefa Tarhan. 2011. “Corporate Investment Decision Practices and the Hurdle Rate Premium Puzzle.” SSRN Electronic Journal. h ttps://doi.org/10.2139/ssrn.960161.
Minn erop, Petra, and Friederike Otto. 2020. “Climate Change and Causation. Joining Law and Climate Science on the Basis of Formal Logic.” SSRN Electronic Journal, 1–48. https://doi.org/10.2139/ssrn.3522519.
Mona sterolo, Irene. 2020. “Climate Change and the Financial System.” Annual Review of Resource Economics 12: 299–320. https://doi.org/10.1146/annurev-resource-110119-031134.
NGFS . 2020. “Guide to Climate Scenario Analysis for Central Banks and Supervisors,” no. June. https://www.ngfs.net/sites/default/files/medias/documents/ngfs_guide_scenario_analysis_final.pdf.
OGA. 2018. “Consulation on the Approach to ‘Satisfactory Expected Commercial Return’ in the MER UK Strategy.”
References
Oxford Sustainable Finance Programme58
Ondr aczek, Janosch, Nadejda Komendantova, and Anthony Patt. 2015. “WACC the Dog : The Effect of Fi Nancing Costs on the Levelized Cost of Solar PV Power.” Renewable Energy 75: 888–98. https://doi.org/10.1016/j.renene.2014.10.053.
Pahl e, M., and H. Schweizerhof. 2016. “Time for Tough Love: Towards Gradual Risk Transfer to Renewables in Germany.” Economics of Energy and Environmental Policy 5 (2): 117–34. https://doi.org/10.5547/2160-5890.5.2.mpah.
Peel , Jacqueline, and Hari M. Osofsky. 2015. Climate Change Litigation. Cambridge: Cambridge University Press. https://doi.org/10.1017/CBO9781139565851.
Peel, Jacqueline, and Hari M Osofsky. 2020. “Climate Change Litigation.” Annual Review of Law and Social Science. https://doi.org/10.1146/annurev-lawsocsci-022420.
Pfeif fer, Alexander, Richard Millar, Cameron Hepburn, and Eric Beinhocker. 2016. “The ‘2°C Capital Stock’ for Electricity Generation: Committed Cumulative Carbon Emissions from the Electricity Generation Sector and the Transition to a Green Economy.” https://doi.org/10.1016/j.apenergy.2016.02.093.
Ploe g, Frederick Van Der, and Armon Rezai. 2019. “The Risk of Policy Tipping and Stranded Carbon Assets *.” https://doi.org/10.1016/j.jeem.2019.102258.
—— —. 2020. “Stranded Assets in the Transition to a Carbon-Free Economy.” Article 12: 281–98. https://doi.org/10.1146/annurev-resource-110519-040938.
Polz in, Friedemann, Florian Egli, Bjarne Steffen, and Tobias S Schmidt. 2019. “How Do Policies Mobilize Private
Finance for Renewable Energy ?— A Systematic Review with an Investor Perspective.” Applied Energy 236 (May 2018): 1249–68. https://doi.org/10.1016/j.apenergy.2018.11.098.
Prat t, Shannon P., and Roger J. Grabowski. 2014. Cost of Capital : Applications and Examples. Fifth edition. Ebook Central. Hoboken, New Jersey.
Rau pach, Michael R., Steven J. Davis, Glen P. Peters, Robbie M. Andrew, Josep G. Canadell, Philippe Ciais, Pierre Friedlingstein, Frank Jotzo, Detlef P. Van Vuuren, and Corinne Le Quéré. 2014. “Sharing a Quota on Cumulative Carbon Emissions.” Nature Climate Change 4 (10): 873–79. https://doi.org/10.1038/nclimate2384.
Ren ts chler, Jun, Martin Kornejew, and Morgan Bazilian. 2017. “Fossil Fuel Subsidy Reforms and Their Impacts on Firms.” Energy Policy 108 (November 2016): 617–23. https://doi.org/10.1016/j.enpol.2017.06.036.
Sch ill ing, Melissa A, and Melissa Esmundo. 2009. “Technology S-Curves in Renewable Energy Alternatives: Analysis and Implications for Industry and Government.” https://doi.org/10.1016/j.enpol.2009.01.004.
Sch m idt, Tobias S. 2014. “Low-Carbon Investment Risks and de-Risking” 4 (April): 237–39.
Schm idt, Tobias S, Bjarne Steffen, Florian Egli, Michael Pahle, and Oliver Tietjen. 2019. “Adverse Effects of Rising Interest Rates on Sustainable Energy Transitions.” Nature Sustainability 2 (September): 879–85. https://doi.org/10.1038/s41893-019-0375-2.
Seltz er, Lee, Laura T. Starks, and Qifei Zhu. 2020. “Climate Regulatory Risks and Corporate Bonds.” SSRN Electronic
Journal. https://doi.org/10.2139/ssrn.3563271.
Semi eniuk, Gregor, Emanuele Campiglio Jean-francois Mercure, Ulrich Volz, and Neil R Edwards. 2020. “Low-Carbon Transition Risks for Finance,” no. December 2019: 1–24. https://doi.org/10.1002/wcc.678.
Setze r, Joana, and Rebecca Byrnes. 2019. “Global Trends in Climate Change Litigation: 2019 Snapshot,” no. July: 14. https://www.lse.ac.uk/granthaminstitute/wp-content/uploads/2020/07/Global-trends-in-climate-change-litigation_2020-snapshot.pdf.
——— . 2020. “Global Trends in Climate Change Litigation: 2020 Snapshot,” no. July: 14. https://www.lse.ac.uk/granthaminstitute/wp-content/uploads/2020/07/Global-trends-in-climate-change-litigation_2020-snapshot.pdf.
Sharp e, S, and Timothy M Lenton. 2020. “Upward-Scaling Tipping Cascades to Meet Climate Goals – Plausible Grounds for Hope,” 1–13.
Solan a, Javier. 2020a. “Climate Change Litigation as Financial Risk.” Green Finance 2 (4): 344–72. https://doi.org/10.3934/gf.2020019.
——— . 2020b. “Climate Litigation in Financial Markets: A Typology.” Transnational Environmental Law 1: 103–35. https://doi.org/10.1017/S2047102519000244.
Steffe n, Bjarne. 2018. “The Importance of Project Fi Nance for Renewable Energy Projects.” Energy Economics 69: 280–94. https://doi.org/10.1016/j.eneco.2017.11.006.
———. 2020. “Estimating the Cost of Capital for Renewable Energy Projects.” Energy Economics 88: 104783. https://doi.org/10.1016/j.eneco.2020.104783.
References
Oxford Sustainable Finance Programme59
Task F orce on Climate-related Fiancial Disclosures. 2017. “Recommendations of the Task Force on Climate-Related Financial Disclosures.” https://www.fsb-tcfd.org/wp-content/uploads/2017/06/FINAL-2017-TCFD-Report-11052018.pdf.
Vartia inen, Eero, Christian Breyer, David Moser, and Eduardo Román Medina. 2020. “Impact of Weighted Average Cost of Capital , Capital Expenditure , and Other Parameters on Future Utility - Scale PV Levelised Cost of Electricity,” no. July 2019: 439–53. https://doi.org/10.1002/pip.3189.
Werne r, Lone, and Bert Scholtens. 2016. “Firm Type , Feed-in Tariff , and Wind Energy Investment in Germany An Investigation of Decision Making Factors of Energy Producers Regarding Investing in Wind Energy Capacity” 21 (2). https://doi.org/10.1111/jiec.12443.
Yuan, Qingbo, and Yunyan Zhang. 2015. “Do Banks Price Litigation Risk in Debt Contracting? Evidence from Class Action Lawsuits.” Journal of Business Finance and Accounting 42 (9–10): 1310–40. https://doi.org/10.1111/jbfa.12164.
Zenne r, Marc, Evan Junek, and Ram Chivukula. 2014. “Bridging the Gap between Interest Rates and Investments.” Journal of Applied Corporate Finance 17: 7–18. https://doi.org/10.1007/978-1-4614-9173-6.
References

ISBN 978-0-9927618-3-7