Embed Size (px)
Citation preview

10th Grade
The Energy Highs of a Roller Coaster
Overview & Purpose: Students will use a simple roller coaster simulation to gather data based off of potential and kinetic energy to make calculations and draw conclusions.
Objectives: Students will…• Explain how positional energy is related to potential energy
• Calculate potential and kinetic energy values
• Apply these principles to real life situations
Background Information: This simulation is designed to enhance student’s understanding of the relationship between energy and position. This activity is intended to be used to assess students knowledge on potential and kinetic energy and how they relate to one another both quantitatively and qualitatively.
Performance Expectations Students who demonstrate understanding can:
HS-PS3-2. Develop and use models to illustrate that energy at the macroscopic scale can be accounted for as a combination of energy associated with themotions of particles (objects) and energy associated with the relative position of particles (objects).*
[Clarification Statement :Examples of phenomena at the macroscopic scale could include the conversion of kinetic energy to thermal energy, the energy stored due to position of an object above the earth, and the energy stored between two electrically-charged plates. Examples of models could include diagrams, draw ings, descriptions, and computer simulations.]
Chemistry - Physics 1
Prepared By: Dennis Migut
Energy
Chemistry - Physics

Lesson 1
2 Energy
The Energy Highs of a Roller Coaster
Classroom Activities/Procedures & Timeline
Students will read introductory paragraph on roller coasters. Then students will pull up the pbs roller coaster simulation and observe the changes in energy as the roller coaster proceeds across the tracks.Next students will have roller coaster go from step to step. Students will take data on the velocity and PE vs KE for the roller coaster at the various steps. Students will then analyze their data to answer the discussion questions.
Assessments: (e.g., lab, quiz, test, oral presentation, survey, rubric, etc.)
Calculations and analysis questions from the lab.
Bell ringer the next day with the following questions :
• How can you throw a ball and have its energy change from kinetic to potential and back to kinetic without touching the ball once it relases from your hand? (Answer: Throw it straight up in the air.)Calculating: Have students practice problems solving for potential energy and kinetic energy:
• If a mass that weighs 8 kg is held at a height of 10 m, what is its potential energy? (Answer: PE = (8 kg) * (9.8 m/s2) * (10 m) = 784 kg * m2/s2 = 784 J)Now consider an object with a kinetic energy of 800 J and a mass of 12 kg. What is its velocity? (Answer: v = sqrt(2 * KE/m) = sqrt((2 * 800 J)/12 kg) = 11.55 m/s)
Extensions/Homework: Have students use an online simulation to design a roller coaster http://www.learner.org/interactives/parkphysics/coaster/
References: http://illinois.pbslearningmedia.org/resource/hew06.sci.phys.maf.rollercoaster/energy-in-a-roller-coaster-ride/
Personal Comments/Notes: This would be an introductory lesson to distinguish the relationship between PE and KE
Equipment/Materials/Technology Needed:
• Computer, ipad, or tablet to access internet
• Internet connection worksheet
Teacher Resources:(e.g., readings, set-up instructions, lecture files, data files, etc.):Simulation can be found at :http://www.pbslearningmedia.org/asset/mck05_int_rollercoaster/
Student Resources:(e.g., handouts, worksheets, data, etc.):
See attached handout.
Accommodations & Safety Concerns:None.

Rubric Grade 9 - 10
Chemistry - Physics 3
Activity Sheet Grade 10
Potential vs Kinetic Energy in a Roller Coaster Simulation
Roller coasters are paradise for many thrill seekers. Roller coasters rely on conservation of energy. Whether you are riding a modern roller coaster or a roller coaster from generations ago, the basic design principles remain the same.
On a Roller coaster energy changes from potential to kinetic and back again many times over the course of a ride. The law of conservation of energy tells us that energy cannot be created or destroyed, it can only change form.
Potential energy is stored energy that has not yet been released. Gravitational potential energy is potential energy that results from an object’s position in a gravitational field, and is equal to the object’s weight multiplied by its height. For example, a trophy placed on a shelf possesses gravitational potential energy because of Earth’s gravity. If the trophy were moved to a higher shelf, it would gain potential energy.
The first hill in a roller coaster is typically the highest because it determines the total amount of energy that is available for the rest of the ride. As the car goes up and down the hills the energy is continually being converted between potential and kinetic. During the conversion, some energy is given away as heat due to friction, therefore the first hill needs to be the biggest.
PURPOSE: In this activity you will use a simulated roller coaster to compare the relationship between potential and kinetic energy throughout the ride.
PROCEDURE:
Go to the following web page :
http://www.pbslearningmedia.org/asset/mck05_int_rollercoaster/
1 Familiarize yourself with the simulation by clicking the green play button in the upper left hand corner.
2 Observe the roller coaster multiple times by repeating the process. Take note of the energy graphic, the velocity, and the path of the coaster.
3 Click the step button. There will be 6 steps in the simulation. At each step fill out the data table on the next page before proceeding to the next step.
4 To proceed to the next step you will need to click the step button. Continue to fill out the data table.

Lesson 1 The Energy Highs of a Roller Coaster
DATA TABLE * create a color key for PE vs KE
STEP VELOCITYm/s Graph representing Potential energy vs kinetic energy
#1
#2
#3
#4
#5
#6
4 Energy

Rubric Grade 9 - 10Activity Sheet Grade 10
EQUATIONS :
Analysis
Refer to your data table and the equations above when answering the following questions.
1 Which steps contain more potential energy compared to kinetic energy ?
2 Assume the roller coaster cart has a mass of 800 kg and g= 32 m/s
If the height of hill at step 1 is 80m : (show your work)
a Calculate the PE :
b Calculate KE:
3 Calculate the KE at :
a Step #2 :
b Step #5
4 If Step #2 and Step #5 are both 100% KE, is the law of conservation of energy being violated ? _________________
Why or why not ?
Chemistry - Physics 5

Lesson 1
6 Energy
The Energy Highs of a Roller Coaster
5 Compare the velocities at Step #2 vs Step #5 and explain why they are different.
6 Is it possible for the hill at Step #6 to be as high as the hill at Step #1 ? _______
7 Why or why not ?
8 Imagine you are making an animation of a roller coaster with a pie chart representing the total amount of potential and kinetic energy in the system. What are the cars doing as the section representing kinetic energy increases in size?
9 The roller coaster in this interactive is a model. In real life, not all of the potential energy of the coaster cars is converted to kinetic energy and back again; some mechanical energy is converted to thermal energy. Describe how mechanical energy gets converted to thermal energy along the track.
10 How does this conversion affect the potential energy and kinetic energy during the ride?
11 Think of an example from everyday life where potential energy is transformed into kinetic energy, or vice versa. Draw a diagram that illustrates the transformation, using the interactive activity as an example. Then describe the transformation. For example: When I carry a sled to the top of a snowy hill, the potential energy of the sled increases. As I stand with my sled at the top of the hill, the kinetic energy is zero and the potential energy is at its maximum. As I slide down the hill, the potential energy of the sled decreases and its kinetic energy increases.

10th Grade
The 2nd Pendulum Challenge
Overview & Purpose: Students utilize their knowledge on positional potential energy and energy transfer to design a pendulum that has a period of two seconds.
Objectives: Students will…• Explain how positional energy is related to potential energy
• Apply the engineering design process
• Modify the pendulum • Improve their system based on testing results
Background Information: This lab is designed to enhance student understanding of the relationship between energy and position. This activity is intended to be used to assess student knowledge on potential and kinetic energy and how this can be applied to engineer a solution.
Performance Expectations Students who demonstrate understanding can:
HS-PS3-2. Develop and use models to illustrate that energy at the macroscopic scale can be accounted for as a combination of energy associated with themotions of particles (objects) and energy associated with the relative position of particles (objects).*
[Clarification Statement :Examples of phenomena at the macroscopic scale could include the conversion of kinetic energy to thermal energy, the energy stored due to position of an object above the earth, and the energy stored between two electrically-charged plates. Examples of models could include diagrams, draw ings, descriptions, and computer simulations.]
Chemistry/Physics 7
Energy
Chemistry/Physics
Prepared By: Dennis Migut

Lesson 1
8 Energy
The 2nd Pendulum Challenge
Classroom Activities/Procedures & Timeline
Students will use what they have learned regarding potential and kinetic energy to create a pendulum. The challenge they face is to manipulate the variable(s) of their pendulum to create a period of 2 seconds.
Assessments: (e.g., lab, quiz, test, oral presentation, survey, rubric, etc.)
Journaling is a valuable tool for engineers as they prepare and test designs to solve complex problems and meet challenges. Students should record their brainstorming session ideas, labeled and annotated sketches of their prototype designs, test results, modifications to their designs with sketches, photos, and group solutions that allow them to meet the challenge in a journal. They should also record any science, math, engineering, or technology content that is connected to their work or that they used to meet the challenge.
The journal should be used as a formative and summative assessment tool.In their personal science journal, have the students complete the following:1. Draw and describe the pendulums motion? Label areas of potential and kinetic
energy.2. Explain what variable you changed first to try to achieve a 2 second period.3. How does this relate to potential energy stored in the system? Describe at which
point the store potential energy is the highest. 4. Did you change another variable? What variable? Was this more successful?
If they do not have a personal science journal, have them share with a partner and write a reflection.
Extensions/Homework: Students can try to create a 5 second pendulum or any other time you feel would challenge them.There is a PhET simulation that can be used to gather data regarding pendulums that can be found at: http://phet.colorado.edu/en/contributions/view/3591
References: Student worksheet taken from :http://www.engr.sc.edu/centers/cece/lessonplans/Pendulum.pdf
Personal Comments/Notes: This is open-ended and students record sketches, results, etc. in their science notebook /journal. You can adapt it to have a worksheet if you don’t use science notebook/journals.
Equipment/Materials/Technology Needed:
• Stopwatch• Meter stick • String• Masking tape• Aluminum foil• Small cup• Marbles (approximately 20 per group)• Graph paper
Teacher Resources:(e.g., readings, set-up instructions, lecture files, data files, etc.):How a pendulum clock works video :http://electronics.howstuffworks.com/gadgets/clocks-watches/clock.htm
Student Resources:(e.g., handouts, worksheets, data, etc.):
See attached worksheet taken fromhttp://www.engr.sc.edu/centers/cece/lessonplans/Pendulum.pdf
Science Journals or reflection sheet.
Accommodations & Safety Concerns:Students need to be aware of swinging cups filled with marbles.

Activity Sheet Grade 10
Chemistry/Physics 9
The 2 Second Pendulum
Step 1: Each group should be given the following materials: stopwatch, ruler or measuring tape, pipe cleaner, string, masking tape, foil, graph paper, and a small cup with about 20 marbles.
Step 2: Poke a hole in each side of the cup using a paper clip. Use a pipe cleaner to tie a handle on the cup, as shown below. Now tie a longer piece of string to the handle.
Step 3: Tie or tape the long piece of string to something like a desk, doorframe or ring stand. If this is not available you can tape it to something similar. Just make sure you have enough room to swing the pendulum back and forth.
Step 4: Fill the cup with some marbles to give it some weight and cover the opening with foil or masking tape. You are now ready for experimentation.

Lesson 1 The 2nd Pendulum Challenge
10 Energy
Step 5: Here comes the challenge! Now see if you can get the pendulum to swing back and forth in 2 seconds. What will you need to change? The weight? The length of the string? Have the students discuss in their groups what data should be recorded. An example table is shown. Students will most likely need more than 10 trials; this is just shown as an example. For each trial the data recorder should record the length of the string, number of marbles or magnets, and the time it takes for the pendulum to swing back and forth.
Trial # Length of String (cm) Number of Marbles Period (seconds)
1
2
3
4
5
6
7
8
9
10
Step 6: What can you conclude from the results? Find a good way to represent your data that illustrates your findings.

10th Grade
Can You Zip an Egg?
Overview & Purpose: Students design a harness for an egg that attaches to a zip line that the students will also design. Students will have to deliver the egg uncracked in a set amount of time. This is an engineering design utilizing students knowledge on potential energy due to position.
Objectives: Students will…• Explain how positional energy is related to potential energy
• Apply the engineering design process
• Modify the harness to carry an uncracked egg down a zip line
• Improve their system based on testing results
Background Information: This lab is designed to enhance student’s understanding of the relationship between energy and position. This activity is intended to be used to assess students knowledge on potential and kinetic energy and how this can be applied to engineer a solution.
Performance Expectations Students who demonstrate understanding can:
HS-PS3-2. Develop and use models to illustrate that energy at the macroscopic scale can be accounted for as a combination of energy associated with themotions of particles (objects) and energy associated with the relative position of particles (objects).*
[Clarification Statement :Examples of phenomena at the macroscopic scale could include the conversion of kinetic energy to thermal energy, the energy stored due to position of an object above the earth, and the energy stored between two electrically-charged plates. Examples of models could include diagrams, draw ings, descriptions, and computer simulations.]
Chemistry/Physics 11
Energy
Chemistry/Physics
Prepared By: Dennis Migut
Classroom Activities/Procedures & TimelineOVERVIEW : LESSON ACTIVITIES Introduce the challenge: Tell kids a zip line will be built to bring in tourists.Brainstorm and design: Students should be working in cooperative groups to develop a group design and using individual journals to record their decisions, design sketches, test results, etc. Build, test, evaluate, and redesign: Test data, solutions, modifications, etc., should all be recorded in their journals individually. Discuss what happened: Ask the students to show each other their modified haness and/or zip lines and talk about how they solved any problems that came up. Evaluation: Using the students’ journaling, assess their mastery of content, skills, and the engineering design process.
Equipment/Materials/Technology Needed:
• two hard-boiled eggs (or plastic egg filled with clay)
• materials for building an egg holder: cardboard, paper, tape, tissues, soda bottles cut in half
• string • fishing line or mono-filament wire • thin, elastic rubber bands • foam or paper cups

Lesson 1 Can You Zip an Egg?
12 Energy
Step 1 : Build harnessDesign a safety egg harness. Your harness should hold and protect your egg and connect to a rubber band that attaches with a paper clip to the zip line. Using the materials made available by your teacher, describe your design with a drawing and words. Your text description should include: • Your materials • How the harness you designed protects the egg • How the harness will connect to the zip lineExplain your design to your teacher and ask him or her to approve it. With your teacher’s approval, build your harness. Step 2: The Zip Line Challenge Here are the rules for your design: 1. The egg must not break or crack. 2. The egg must go the length of the zip line with just one push. 3. The egg must complete the length of the zipline in the alloted time. ( this time will depend on the length of the zipline. I use 3 seconds )Step 3: Complete the task Obtain a two-meter long piece of fishing line from your teacher. This will be your zip line. Decide on the height of your zipline, attach the zipline securely with tape on both ends. Hang the harness. Give it one small push while another student times the egg as it travels the complete length of the zipline.
Assessments: (e.g., lab, quiz, test, oral presentation, survey, rubric, etc.)
Journaling is a valuable tool for engineers as they prepare and test designs to solve complex problems and meet challenges. Students should record their brainstorming session ideas, labeled and annotated sketches of their prototype designs, test results, modifications to their designs with sketches, photos, and group solutions that allow them to meet the challenge in a journal. They should also record any science, math, engineering, or technology content that is connected to their work or that they used to meet the challenge.
The journal should be used as a formative and summative assessment tool.In their personal science journal, have the students complete the following:1. Draw and describe the pendulums motion? Label areas of potential and kinetic energy.2. Explain what variable you changed first to try to achieve a 2 second period.3. How does this relate to potential energy stored in the system? Describe at which
point the store potential energy is the highest. 4. Did you change another variable? What variable? Was this more successful?If they do not have a personal science journal, have them share with a partner and write a reflection.
Extensions/Homework: If you have motion sensor probes you may want to add appropriate data to graph . See this reference: http://concord.org/stem-resources/building-zip-line
References:http://concord.org/ngss/http://www.nasa.gov/pdf/544862main_E2_OnTarget_C2.pdf
• plastic baggies • scissors • a paper clip• meter stick • stopwatch
Teacher Resources:(e.g., readings, set-up instructions, lecture files, data files, etc.):ABC news clip on longest zip line in the world videohttp://abcnews.go.com/GMA/video/good-morning-america-extreme-17018571Building a real zip line youtube videohttps://www.youtube.com/watch?v=Sa4ZcMIw6m4similiar lesson via NASAhttp://www.nasa.gov/pdf/544862main_E2_OnTarget_C2.pdf
Student Resources:(e.g., handouts, worksheets, data, etc.):
Science Journals or reflection sheet.
Accommodations & Safety Concerns:Use caution when cutting line and attaching line.
Personal Comments/Notes: This is open-ended and students record sketches, results, etc in their science notebook /journal. You can adapt it to have a worksheet if you don’t use science notebook/journals.

10th Grade
Hot Water and Dancing Molecules
Overview & Purpose: Students will create a heating curve for water and relate the change in kinetic energy to molecular motion.
Objectives: Students will…• Analyze the relationship between energy and temperature.
• Graph experimental data to determine the boiling point of a substance.
• Infer the relationship between energy and phase changes.
• Diagram energy transfer on the molecular level.
Background Information: This lab is designed to enhance student’s understanding of the relationship between energy and Temperature. Students will also predict how this affects molecular motion. Lab intends to address common misconceptions that increase in heat always leads to increase in temperature, during a Phase change the temperature changes, and heat is measured by temperature.
Performance Expectations Students who demonstrate understanding can:
HS-PS3-2. Develop and use models to illustrate that energy at the macroscopic scale can be accounted for as a combination of energy associated with themotions of particles (objects) and energy associated with the relative position of particles (objects).*
[Clarification Statement :Examples of phenomena at the macroscopic scale could include the conversion of kinetic energy to thermal energy, the energy stored due to position of an object above the earth, and the energy stored between two electrically-charged plates. Examples of models could include diagrams, draw ings, descriptions, and computer simulations.]
Chemistry 13
Thermodynamics
Chemistry
Prepared By: Dennis Migut

Lesson 1
14 Thermodynamics
Hot Water and Dancing Molecules
Classroom Activities/Procedures & Timeline
Students will measure out 200 mL of water in a graduated cylinder and transfer it to a beaker.At time zero students will take the initial temperature of the water. Turn the hot plate to high. Record the temperature and any qualitative observations every 30 seconds. Last reading will be taken 5 minutes after boiling starts.Students will then graph their data regarding temperature vs time.
Assessments: (e.g., lab, quiz, test, oral presentation, survey, rubric, etc.)
• How Based off the graph identify which time frame represents increasing kinetic energy.
• Explain why those time frames are chosen.
• Diagram particles on the molecular level during time frames of increasing kinetic energy.
Extensions/Homework: Predict what the heating curves will look like for other substances.Design a story, brochure, or advertisement from the perspective of a water molecule as to how they are effected by being heated and what trials and tribulations they will undergo during phase changes
References: • http://library.marist.edu/sotm/pdf/C2Phase.PDF
• http://www.soe.vt.edu/ncate/program_review/science/student%20portfolios/Catherine/lps/HCLab.PDF
Personal Comments/Notes: This would be an introductory lesson to distinguish the relationship between PE and KE
Equipment/Materials/Technology Needed:
• 250mL beaker• graduated cylinder• hot plate• thermometer• timing device• water• graph paper
Teacher Resources:(e.g., readings, set-up instructions, lecture files, data files, etc.):
Student Resources:(e.g., handouts, worksheets, data, etc.):
Student instructions and data sheet and graph paper provided.
Accommodations & Safety Concerns:Use caution when using the hot plates.

Rubric Grade 9 - 10Activity Sheet Grade 10
Chemistry 15
Heating Curve for Water
Background:The first law of thermodynamics basically states that energy can be transformed (changed from one form to another), but cannot be created or destroyed. This leads into the concept of how different substances can change from one phase to another by absorbing or releasing energy. When the system is heated, energy is transferred into it. In response to the energy it receives, the system changes, for example by increasing its temperature. A plot of the temperature versus time is called the heating curve.
Water is a common substance. Ice is the stable phase below 0oC. Both solids and liquids coexist at 0oC. When heat is put into the system, more solid will melt. Thus, the temperature does not change. The normal boiling point is 100oC. As heat is absorbed, some water will boil off but the temperature is kept at 100oC. This change in temperature may be observed and measured against time in an effort to visualize the heat curve for water.
Materials:
• safety glasses• stopwatch or timer• hot plate• beaker• ice• thermometer• plastic thermometer clamp• graph paper
Procedure:
1 Put on safety goggles .
2 Use the data chart provided to record time and temperature. The time column starts with 0. The temperature column is blank. You will record the temperatures in the temperature column during the investigation.
3 Fill the small beaker with ice. Insert the thermometer. Wait 2 minutes. Observe and record the starting temperature (0 time) in the data table.
4 Place the beaker of ice on the hot plate. Position the thermometer in the clamp so that the bulb of the thermometer does not touch the bottom of the beaker.
5 Turn the hot plate on high and start the timer. After 30 seconds, record the thermometer reading without removing the thermometer from the beaker. (DO NOT TOUCH THE HOT PLATE !!!!!!)
6 Continue to record the temperature on the chart every 30 seconds.
7 Make a note when the ice has melted and when the water begins boiling.

Lesson 1
16 Thermodynamics
Hot Water and Dancing Molecules
Analysis:
Write your data in the following table:
Time Temperature
Prepare a graph from your data that includes the following information:
1 Label the x-axis with the time (in minutes). This is your independent variable. Label the y-axis as temperature (in degrees Celsius). This is your dependent variable.
2 Plot your points using your recorded data.
3 Label the 5 areas on your graph: solid (S), liquid (L), gas (G), freezing point/melting point FP/MP and condensation/boiling point (CP/BP).
4 Trace, with colored pencils, the following parts of the line on your graph: slowest molecular motion (in red), fastest molecular motion (in green).
5 DON’T FORGET TO TITLE YOUR GRAPH!
6 You graph should look like stair steps not a straight line.

Chemistry 17
Activity Sheet Grade 10
Conclusions
1 Explain what is happening to the water molecules in the flat areas of the line on your graph during the phase changes from solid to liquid and liquid to gas.
2 When the ice is melting is it releasing heat or absorbing heat? Explain your answer.
3 If you put the liquid water into the freezer and recorded its temperature as it refroze, would it be absorbing heat or releasing heat? Explain your answer.

Lesson 1 Hot Water and Dancing Molecules
18 Thermodynamics
4 Diagram particles on the molecular level during time frames of increasing kinetic energy (Use the space below)
Chemistry 19
10th Grade
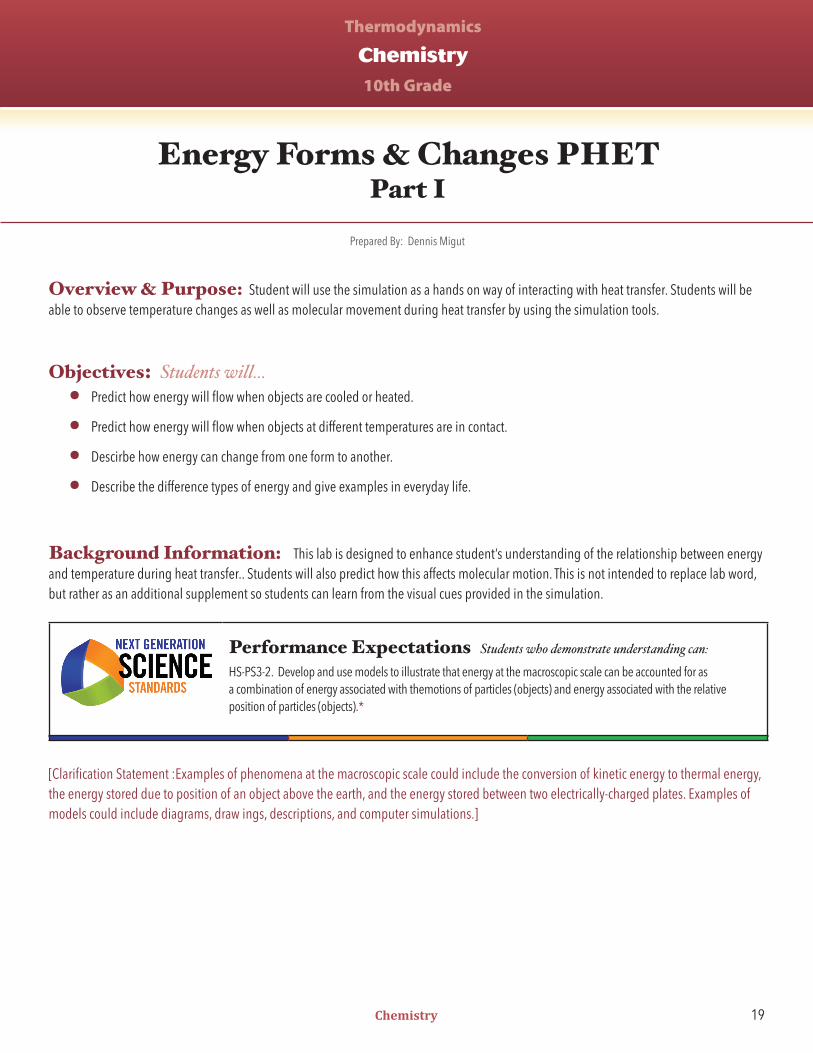
Energy Forms & Changes PHETPart I
Overview & Purpose: Student will use the simulation as a hands on way of interacting with heat transfer. Students will be able to observe temperature changes as well as molecular movement during heat transfer by using the simulation tools.
Objectives: Students will…• Predict how energy will flow when objects are cooled or heated.
• Predict how energy will flow when objects at different temperatures are in contact.
• Descirbe how energy can change from one form to another.
• Describe the difference types of energy and give examples in everyday life.
Background Information: This lab is designed to enhance student’s understanding of the relationship between energy and temperature during heat transfer.. Students will also predict how this affects molecular motion. This is not intended to replace lab word, but rather as an additional supplement so students can learn from the visual cues provided in the simulation.
Performance Expectations Students who demonstrate understanding can:
HS-PS3-2. Develop and use models to illustrate that energy at the macroscopic scale can be accounted for as a combination of energy associated with themotions of particles (objects) and energy associated with the relative position of particles (objects).*
[Clarification Statement :Examples of phenomena at the macroscopic scale could include the conversion of kinetic energy to thermal energy, the energy stored due to position of an object above the earth, and the energy stored between two electrically-charged plates. Examples of models could include diagrams, draw ings, descriptions, and computer simulations.]
Thermodynamics
Chemistry
Prepared By: Dennis Migut

20 Thermodynamics
Lesson 1 Energy Forms & Changes PHET - Part 1
Classroom Activities/Procedures & Timeline
Students will need computers and internet access to run a thermal heat transfer simulation. Students will predict how energy will flow when objects are heated and cooled.Students will predict how energy will flow when objects at different temperatures come into contact.Students will “run” and “interact” the simulation to gather evidence of heat transfer and compare the results to their predictions.Students will use the evidence they collect to create a model. The model will include a diagram demonstrating how the energy as heat flows.
Assessments: (e.g., lab, quiz, test, oral presentation, survey, rubric, etc.)
• Student worksheet to be used during the phet simulation
• Diagram to show energy flow based on evidence collected in the simulation.
Extensions/Homework: In terms of energy transfer, design an experiment to determine if you can fry an egg on a sidewalk.
Personal Comments/Notes: Any phet simulation requires Java.
Equipment/Materials/Technology Needed:
• Computer that is java enabled• Internet connection• paper
Teacher Resources:(e.g., readings, set-up instructions, lecture files, data files, etc.):
• http://phet.colorado.edu/en/simulation/energy-forms-and-changes
• http://phet.colorado.edu/files/teachers-guide/energy-forms-and-changes-guide.pdf
Student Resources:(e.g., handouts, worksheets, data, etc.):
• Student instructions and data sheet and graph
• Paper provided and can also be downloaded from phet site. Worksheet was created by another teacher and shared to the phet website for public use.
• Students should also draw diagrams representing energy flow.
.
Accommodations & Safety Concerns:

Chemistry 21
Activity Sheet Grade 10
PHET Simulation Activity
Energy Forms and Changes Name: ______________________________________________________
Intro: Thermal Energy
• Go to the Intro tab on the simulation • Drag and attach thermometers to the iron block, brick, and water—attach on
the right hand side.
Part 1: Heating
1 Place the iron block on a stand.
2 Drag the temperature slider underneath to heat the block. Heat the block to its maximum temperature based on the thermometer reading.
3 Drag and place the iron block into the water.
4 Observe and describe how this affects the temperature of:
a the iron block
______________________________________________________________________________________
b the water.
______________________________________________________________________________________
5 Drag the iron block back to the stand.
6 Drag the temperature underneath to cool the block. Cool the block to its maximum temperature based on the thermometer reading.
7 Drag and place the iron block into the water again.

22 Thermodynamics
Lesson 1 Energy Forms & Changes PHET - Part 1
8 Observe and describe how this affects the temperature of:
a the iron block
______________________________________________________________________________________
b the water.
______________________________________________________________________________________
9 Turn on the energy symbols tab: and repeat the process above.
10 Observe and describe what is happening to the energy symbols as the iron block is heated, and then placed into the water:
______________________________________________________________________________________
______________________________________________________________________________________
______________________________________________________________________________________
______________________________________________________________________________________
11 Repeat this same process above, but this time use the brick.
12 When the heated brick is placed into the water, how does this affect the temperature of :
a the brick.
______________________________________________________________________________________
b the water.
______________________________________________________________________________________
13 When the cooled brick is placed into the water, how does this affect the temperature of:
a the brick.
______________________________________________________________________________________
b the water.
______________________________________________________________________________________
Chemistry 23
Activity Sheet Grade 10
14 Describe any similarities and differences that you observed for the iron block and the brick during this process.
15 What thermal process is being simulated here? Explain.
Part 2: Cooling
1 Repeat this process for both the iron block and brick, but this time cool each to its maximum low temperature and place into the water. Do this by dragging the tab of the bin under the stands to create ice.
2 Describe what you observe happening to the objects and the water when combined:
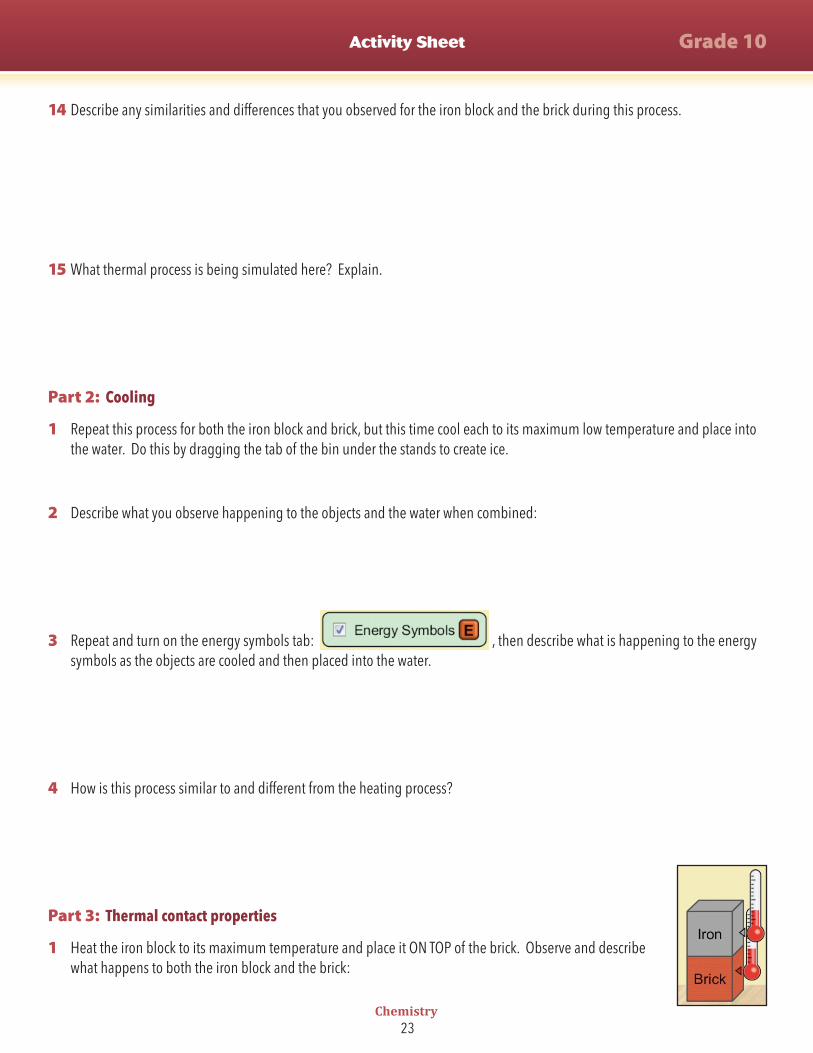
3 Repeat and turn on the energy symbols tab: , then describe what is happening to the energy symbols as the objects are cooled and then placed into the water.
4 How is this process similar to and different from the heating process?
Part 3: Thermal contact properties
1 Heat the iron block to its maximum temperature and place it ON TOP of the brick. Observe and describe what happens to both the iron block and the brick:

24 Thermodynamics
Lesson 1 Velocity and Kinetic EnergyEnergy Forms & Changes PHET - Part 1
2 Heat the brick to its maximum temperature and place it ON TOP of the iron block. Observe and describe any similarities and differences from what you observed in #1.
3 Heat the water to maximum and place it ON TOP of the iron block and the brick.
Record the results below:
a Water on Iron block:
______________________________________________________________________________________
b Water on Brick:
______________________________________________________________________________________
4 Repeat the processes above, but this time COOL the iron block and the brick. Note any differences in this process below:
5 What thermal process is being simulated here? Explain.
6 How is this process different from Parts 1 and 2? Explain.
7 Investigate: How could you heat/cool and arrange the objects here to show BOTH of the properties mentioned above? Explain: (Hint: Can you stack up all of these objects or put one inside the other one?

Chemistry 25
10th Grade
Energy Forms & Changes PHETPart 2
Overview & Purpose: Student will use the simulation as a hands on way of interacting with energy systems. Students will be able to manipulate varioius starting sources of molecular movement to understand how the movement of molecules can lead to energy transfer.
Objectives: Students will…
• Design a system with energy sources, changers, and users and describe how energy flows and changes one form of energy into another.
• Tell the energy story for real-life systems.
• Describe the difference types of energy and give examples in everyday life.
Background Information: Students should have completed the intro part of this phet simulation to gain an understanding on how energy flows. This will take them to the next step to interact with ways transferring energy can create electricity, etc.
Performance Expectations Students who demonstrate understanding can:
HS-PS3-2. Develop and use models to illustrate that energy at the macroscopic scale can be accounted for as a combination of energy associated with themotions of particles (objects) and energy associated with the relative position of particles (objects).*
[Clarification Statement :Examples of phenomena at the macroscopic scale could include the conversion of kinetic energy to thermal energy, the energy stored due to position of an object above the earth, and the energy stored between two electrically-charged plates. Examples of models could include diagrams, draw ings, descriptions, and computer simulations.]
Thermodynamics
Chemistry
Prepared By: Dennis Migut
26 Thermodynamics
Lesson 1 Energy Forms & Changes PHET - Part 2
Classroom Activities/Procedures & Timeline
Students should use the “energy system” tab for this lesson.Students will need computers and internet access to run various energy system simulation. Students will predict how energy will flow to create electricity.Students will “run” and “interact” the simulation to gather evidence of successful energy systems and compare the results to their predictions.Students will use the evidence they collect to create a model. The model will include a diagram demonstrating how the energy flows to light the bulb or boil the water.
Assessments: (e.g., lab, quiz, test, oral presentation, survey, rubric, etc.)
• IN STUDENT SCIENCE NOTEBOOKS:
• Draw 3 successful energy systems you created
• For each diagram describe the flow of energy and the energy changes that took place.
• Draw 1 unsuccessful energy diagram and explain why it didn’t work.
• How does this apply to the electricity that powers your house ?
Extensions/Homework: Students can reaserch various forms of energy (renewable and non renewable) and diagram and describe how they produce electricity. Assigning the students different energy sources can lead to a poster session or some sort of equivalent chance for students to defend their energy source.
Personal Comments/Notes: Any phet simulation requires Java.
Equipment/Materials/Technology Needed:
• Computer that is java enabled• Internet connection• paper
Teacher Resources:(e.g., readings, set-up instructions, lecture files, data files, etc.):
• http://phet.colorado.edu/en/simulation/energy-forms-and-changes
• http://phet.colorado.edu/files/teachers-guide/energy-forms-and-changes-guide.pdf
Student Resources:(e.g., handouts, worksheets, data, etc.):
I have students do the assessment given in their science notebooks as they “play” with the phet simulation.HOWEVER:If a worksheet is desired, the phet site has ready made teacher worksheets to go along with the simulation. You can modify these or use them as is. Worksheets were created by another teacher and shared to the phet website for public use.http://phet.colorado.edu/en/simulation/energy-forms-and-changes
Accommodations & Safety Concerns:

Chemistry 27
Activity Sheet Grade 10
Name ___________________________________________________ Period __________ Date ______________
Energy Forms & Changes Simulation
http://phet.colorado.edu/en/simulation/energy-forms-and-changes
In this simulation, you will be able to “see” several different forms of energy and the changes (transfers) that can occur between them. You are also able to work with a system where you can manipulate the energy input, observe the process of electrical energy generation and manipulate the output. Click on the “Energy Systems” tab. We will do all of our work here. Be sure to click the “Energy Symbols” box so the different types of energy will be visible throughout the process.
Getting Familiar with the Options
Please experiment with the different source, generation and output options – there are many combinations to play with — then complete the questions below.
1 Which energy sources (input) can cause the turbine (wooden wheel) to spin and generate electrical energy?
2 Which energy sources (input) cause the solar panels to generate electrical energy?
3 Which energy output objects work with the turbine?
4 Which energy output objects work with the solar panels?
5 What happens to the amount of electrical energy that is generated when the:
a Faucet is on high? _____________________
b Faucet is on low? _____________________
c There are no clouds? _____________________
d There are lots of clouds? _____________________
e Low heat on the kettle? _____________________
f High Heat on the kettle? _____________________
g The girl pedals slowly? _____________________
h The girl pedals quickly? _____________________
6 Explain why the cyclist must be fed in order to continue to pedal?

28 Thermodynamics
Lesson 1 Energy Forms & Changes PHET - Part 2
7 The Law of Conservation of Energy states that:
_______________________________________________________________________________________
_______________________________________________________________________________________
Exploring Energy Transfer
Set up your system as shown in the picture. Let it run for a while and then complete the sentences using the energy symbols to help you “see” the flow of the energy within each system.
8 Turbine Moved by Medium Water Flow from Faucet With A Water Heater System
In this system, ___________________ energy from the moving water of the faucet turns the turbine. The ___________________ energy of the spinning turbine generates ___________________ energy which is transformed into ___________________ energy that causes the temperature of the water to increase. The water then becomes steam and gives off more ___________________ energy into the atmosphere.
9 Solar Panel in Medium Cloud Cover With A Regular Light Bulb System

Chemistry 29
Activity Sheet Grade 10
In this system, ___________________ energy from the sunlight causes the solar panel to create _________________ energy which flows into the incandescent light bulb. In the light bulb, the ___________________ energy is transformed into two different types of energy: ___________________ energy and ___________________ energy.
10 Turbine Moved by Steam from Medium Heat Kettle With A Water Heater System
In this system, ___________________ energy from the flames of the fire transfer energy to the kettle causing the liquid to become steam. The ___________________ energy of the moving steam spins the turbine which generates ___________________ energy that is used to increase the temperature of the water. The ___________________ energy of the steam is transferred to the atmosphere.
*Note* Another form of energy is released from the kettle. What is it? ______________.

30 Thermodynamics
Lesson 1 Energy Forms & Changes PHET - Part 2
11 Turbine Moved by Cyclist Pedaling at Medium Speed With A Fluorescent Light Bulb System
In this system, ___________________ energy from the cyclist is converted to a lot of ___________________ energy and a little bit of ___________________ energy. The ___________________ energy from the turning bicycle wheel spins the turbine which generates ___________________ energy. The fluorescent light bulb converts this energy into two new forms: a lot of ___________________ energy and very little ___________________ energy.
12 Switch out the fluorescent bulb with the regular bulb and observe the energy output. What do you notice about the difference in the energy and output of these two bulbs?
In your opinion, which light bulb is more efficient? ______________________________
Explain how you know this. ________________________________________________
13 What common form of energy (not including kinetic or potential) is not included in the “Energy Symbols” key that would normally be present in these examples?
14 Look carefully at each of the four systems shown above. Knowing what we have discussed about energy conversions, identify (list) at least three different places where this form of energy (sound) should be “produced”.

Chemistry 31
Activity Sheet Grade 10
15 In the space below, explain why this simulation is a good way to illustrate the Law of Conservation of Energy. Use specific examples to support your answer.