Embed Size (px)
Citation preview
The End of ‘Lowest-Low’ Fertility?
Joshua R. Goldstein, Tomáš Sobotka*, and Aiva Jasilioniene
Max Planck Institute for Demographic Research, Rostock * Vienna Institute of Demography, Vienna
Abstract Period fertility rates fell to previously unseen low levels in a large number of countries beginning in the early 1990s. The persistence of Total Fertility Rates under 1.3 raised the possibility of dramatic, rapid population aging as well as population decline. In an analysis of recent trends, we find, however, a widespread turn-around in so-called “lowest-low” fertility countries. The reversal has been particularly vigorous in Europe. The number of countries with period total fertility rates less than 1.3 fell from 21 in 2003 to five in 2008, of which four (Hong Kong, Korea, Singapore and Taiwan) are in East Asia. Moreover, the upturn in the period TFR was not confined to lowest-fertility countries, but affected the whole developed world. We explore the demographic explanations for the recent rise in fertility stemming from fertility timing effects as well as economic, policy, and social factors. Although the current economic crisis may push down fertility in the short-run, we conclude that formerly lowest-low fertility countries should continue to see further increase in fertility as the transitory effects of shifts to later motherhood become less and less important.
1
1. Introduction In the 1990s, period total fertility rates (TFR) fell below 1.3 in Eastern and Southern Europe and East Asian countries. It looked as if a new era of extremely low birth rates had taken hold. While below-replacement fertility has appeared in various forms on and off since the 1930s, the fertility rates seen in the 1990s were so low that, if continued, could lead to rapid depopulation, or as Chesnais (2001) termed it ‘population implosion‘. These new lows in fertility inspired a large literature, notably Bongaarts and Feeney’s (1998) work on tempo-adjusted fertility, Kohler, Billari, and Ortega’s (2002 and 2006) exploration of the patterns and causes of ‘lowest-low fertility’ and Lutz et al.’s (2005, 2006) notion of a low-fertility trap in which falls in fertility could be self-reinforcing. Some official forecasts also shifted to the idea that fertility would stay low and do not predict any substantial increase. For example, in Japan official forecasts are for the TFR to stay below 1.3 until at least 2050 (Kaneko et al. 2008). Kohler, Billari, and Ortega (2002 and 2006) and Billari and Kohler (2004) invented the label ‘lowest-low fertility’, a level that they arbitrarily set for a period TFR below 1.3. The term does not refer to the lower limit of fertility, but rather to new lows in observed period fertility rates.1 They concluded that countries with such low fertility displayed a systematic pattern “characterized by a rapid shift to delayed childbearing, a low probability of progression after the first child (but not particularly low levels of first-birth childbearing), a ‘falling behind’ in cohort fertility at relatively late ages (in Southern Europe), and a reversal in the relative ranking of lowest-low fertility countries in a European comparison of total fertility levels.” (Kohler, Billari, and Ortega 2006: 99). They expected that ‘lowest-low fertility’ would be a persistent pattern for several decades, especially in Eastern Europe, and present a considerable challenge for many developed countries. They also predicted the phenomenon of ‘lowest-low’ fertility was likely to spread, particularly in the German-speaking world (Kohler, Billari, and Ortega 2002 and 2006). The prospect of prolonged periods of very low fertility has frightened and fascinated generations of demographers, journalists, and general public in Europe and in the United States over the last century. The interest in extreme low fertility lies in its hypothetical consequences for long-term population trends, involving both accelerated rate of population ageing and population decline. In the literature demography most commonly creeps in through the “twin horrors of population decline and population excess” (Shriver 2003: 153) and the first of these ‘horrors,’ coupled with the notion that the human species (or Europe, ‘Western civilization’, etc.) may fail to reproduce themselves, was commonly evoked in the 1920s-1930s and, more recently, since the 1970s onwards (see Teitelbaum and Winter 1985). Even in the United States, which 1 The term ‘lowest-low fertility’ introduced by Kohler et al. has been subject to criticism. Early readers of this paper objected to us re-using the term. It is clear that there is no natural lower limit to fertility, and so the term does not refer to the lowest fertility that can be attained. Further, if the term is used only to designate the set of fertility rates seen among the lowest of the low fertility countries, then it has a shifting meaning that does not correspond to an absolute cut-off below 1.3. However, we feel that the designation of populations with period fertility less than 1.3 is a meaningful one that does capture a phenomenon of period fertility that is far below replacement. One might wish that Kohler et al. had used a different term but it is difficult to invent a better one: ‘extremely low fertility’, ‘far below-replacement fertility’, ‘sub-sub replacement fertility’ and ‘ultra-low fertility’ may all convey the same meaning but are not clearly better, and certainly none has the same catchiness.
2
record the highest fertility among industrialized countries and experience sustained population growth, books like The Empty Cradle by Philip Longman (2004) warn of population decline, loss of economic prosperity and innovativeness. In Europe, Pope Benedict XVI proposed in 20062 that its problem seems to be that “it no longer wants to have children” and it “seems to be wishing to take its leave from history.”3 A specific area of concern is how low fertility can decline (Golini 1998) and whether there might be a downward spiral in fertility rates in the future (Lutz, Skirbekk, and Testa 2006). It comes as news therefore that period fertility in most low and ‘lowest-low’ fertility countries has been steadily rising after 2000. Countries as diverse as Spain, Italy, Russia, and Japan all appear to have their lowest fertility rates behind them, even if slightly. Now there are only a handful of countries with TFRs below 1.3, compared to 21 in 2003 and only one European country, Moldova, remains in this category according to the official estimates for 2008. Period TFR has clearly risen from its lowest levels in Central and Eastern Europe. In Bulgaria, the Czech Republic, Latvia, Ukraine and East Germany—where fertility below the lowest-low level persisted for 10 to 13 years—TFRs reached 1.4 or above by 2008. East Germany whose TFR was as low as 0.77 in 1994 had 1.40 in 2008. In Southern Europe, period TFRs have risen over 1.4 for Italy, Spain, and Greece. In East Asia, the record is mixed. Japan’s TFR has risen above 1.3, whereas in Taiwan, the TFR fell to an all-time low of 1.05 in 2008 (see Figure 1).
<Figure 1 around here> In this paper we provide a demographic analysis of this apparent reversal in lowest-low fertility and explore a variety of factors that help explaining the observed changes. While we also pay attention to the notable rise in the period TFR in the more developed countries that never experienced lowest-low fertility, our predominant focus is on the diverse group of countries that have registered at least a brief TFR decline below 1.3 after 1990. The TFR threshold of 1.3 is arbitrary, but we consider it an important and useful marker of extreme low fertility for both practical and theoretical reasons. On the practical side, we argue that such an extreme low fertility is unlikely to persist and is unlikely to be achieved by any birth cohort of women. On the theoretical side, the long-term continuation of the TFR below 1.3 may be seen as ‘unsustainable.’ In terms of population halving times, the difference between relatively close levels of low fertility is dramatic. Stable populations with no migration and with a TFR of 1.3 take about 45 years to halve, whereas those with a TFR of 1.6 take nearly 90 years. Arguably, TFR levels of 1.5 or 1.6 can be much more easily accommodated with a combination of moderate immigration and continuing reforms of labor market and social security systems. At the same time, it is important to keep in mind that there is nothing magical about this frontier. The
2 Christmas Greetings to the Roman Curia, accessed at <http://www.vatican.va/holy_father/benedict_xvi/speeches/2006/december/documents/hf_ben_xvi_spe_20061222_curia-romana_en.html>. 3 A nice example of a similarly dramatic vision is J.J. Spengler’s (1932 [1991: 169]) warning of an imminent decline of Western civilization due to human unwillingness to bear children, brought about by the competition for wealth under capitalism: “Western civilization has altered the psychology of man. It has destroyed the motive which (…) has induced man to procreate its kind.”
3
difference between the TFR slightly under 1.3 and slightly over 1.3 is definitional, and is not a difference in kind.4 Our main contribution is that we are now able to provide a detailed analysis of the path that fertility has taken in almost all of the countries that have or at one time had ‘lowest-low’ levels of the period TFR. This analysis allows us to both describe what has happened and advance the modeling of postponement transitions. In addition to description and tempo-quantum analysis, we also examine the power of economic, policy, and migration-related factors to explain short-term TFR changes among the ‘lowest-low’ and low-fertility countries. We do not analyze long-term factors that have been suggested as possible drivers of fertility increase, such as cultural and value changes making societies more conducive to family formation (Billari 2008, Sobotka 2008b), or the rise in gender equality, in economic opportunities and the division of household tasks.5 The concluding general discussion offers a new look at the idea of ‘tempo transitions’ and discusses the prospects for a resumption of lowest-low fertility as a result of the economic crisis.
2. Explanations of lowest-low fertility A theme running through our analysis is that lowest-low fertility should be thought of as a transitional phenomenon closely linked to the postponement of childbearing from younger to older ages. Much of the sensationalism about extremely low fertility has come as a result of public misunderstanding of the period Total Fertility Rate, which is often simply described as the number of children per woman (e.g., Sobotka and Lutz 2009).6 As has been known among demographers since the works of Hajnal (1947) and especially Ryder (1964), and recently repopularized by Bongaarts and Feeney (1998), delays in the timing of childbirth can have dramatic effects on cross-sectional measure such as the period TFR. When births are postponed to older ages, they reduce the number of births seen in a given period, making the period TFR lower even if cohort fertility remains unchanged. Within the discipline of demography, a broad agreement exists among demographers that the era of lowest-low fertility emerged as a direct consequence of rapid fertility postponement (Kohler et al. 2002, Lutz et al. 2003, Morgan 2003, Sobotka 2004a, Billari 2008). But the questions of how permanent lowest-low fertility would be and whether other factors than postponement can sustain such a low fertility have produced a divided set of predictions and interpretations. Not surprisingly, the proponents of the prominent role of tempo effects tend to argue that lowest-low fertility would end once delays in fertility weaken or come to an end. Bongaarts (2001 4 For simplicity we often refer to the period TFR as ‘period fertility’ or simply as ‘fertility’ although other indicators might be more suitable for its measurement. We avoid, however, a ‘children-per-woman’ interpretation of the period TFR. 5 We did not include such an analysis both because of the difficulty in measuring cultural and value changes on a year-to-year basis and because we suspect that such cultural processes unfold relatively slowly and are not primarily responsible for short terms ups and downs in fertility. 6 The distinction between period and cohort fertility and the potential misinterpretations of the period TFR produced headlines and controversy even in relatively high-fertility France in the debate between Calot and Le Bras (see Keyfitz 1993).
4
and 2002) and Sobotka (2004a) both suggested that lowest-low fertility was a transient phenomenon, which they expected to end soon. The majority of official population projections followed this view, projecting increases in lowest-low fertility from observed levels under 1.3 children per woman to levels above 1.5. The earlier examples of the United States and the Netherlands, where postponement lowered period fertility temporarily, after which fertility rose again were used as examples of short-lived ‘tempo transitions.’ Many researchers, however, offered arguments on why lowest-low fertility might prove persistent.7 These views can be roughly divided into two streams. The first emphasizes the continuation of tempo-induced declines in fertility and their potential later consequences. The second emphasizes the socio-economic and cultural conditions of lowest-low fertility societies. Consistent with the former view, it can be argued that once postponement of childbearing stops and the associated tempo distortion disappears, additional decline in fertility quantum may prevent the TFR from rising above the 1.3 threshold. This argument has been repeatedly pursued without explicitly referring to extreme low fertility threshold (see Lesthaeghe and Willems 1999, Bongaarts 2002). Consequently, the period of lowest-low fertility could become long-lasting or even permanent. Kohler, Billari, and Ortega (2002 and 2006) pointed out that in some countries, especially in Eastern Europe, postponement could continue for many decades: early childbearing during the state-socialist era created much room for prolonged postponement, even without a change in desired family size. Furthermore, they emphasized that underlying levels of cohort fertility quantum were also likely to decline as a result of postponed fertility. Reasons for continuation or even further decline of lowest-low fertility were put forth in the form of the ‘low fertility trap’ (Lutz, Skirbekk, and Testa 2006). This is a hypothesis of negative feedback, in which tempo-induced declines in the birth rate lead to further declines in desired family size and the accelerated population aging creates further economic hardships for young adults. A number of scholars view very low fertility as a long-lasting outcome of socio-economic and cultural conditions that are disadvantageous for childbearing. McDonald (2006: 487) suggested that waiting for tempo effect to disappear “is beginning to look like waiting for Godot” and proposed that there is a “cultural divide” between populations that can maintain period fertility above 1.5 and those that cannot, with the possibility of increasing fertility becoming harder and harder in less child-friendly societies. He repeatedly stressed (McDonald 2000, 2002, 2006) low levels of gender equity in the family and a strong reliance of individuals on their family networks in countries where families are expected to support their own members and where universal welfare system is less developed as reasons for sustained low fertility. Suzuki (2003: 12) argues that “[o]ne way to look at lowest-low fertility is to see it as a normal response to socioeconomic changes in the postmaterial era.” In a twist to McDonald’s arguments about the role of the family as a welfare institution, he proposes that only countries with weak family ties, such as north-western Europe, have developed a sufficient network of non-family care, which 7 Although our paper mostly focuses on the ‘lowest-low fertility,’, we also refer here to the contributions that are concerned about ‘very low fertility’ or ‘extreme low fertility,’ without making explicit reference to the TFR threshold of 1.3.
5
enables women to have more children and mothers to participate easily in the labour force. Reher (2007) and Chesnais (2000) also view extremely low fertility and the concomitant prolonged population decline as irreversible, long-term aspects of the developed world, although for different reasons. Reher sees it essentially as an outcome of demographic transition, while Chesnais stresses the role of social atomisation, individualism and consumerist culture. Although we cannot review here all the other relevant factors that have been put forward to explain extreme low fertility levels we shall selectively outline some of them. Adserà (2004 and 2005) emphasizes the role of labor market institutions, especially of unemployment, in driving fertility to very low levels. In her simulation, the TFR in countries with high and persistent female unemployment was estimated as low as 1.28 (Adserà 2005: 192). Kohler et al. (2006) and Billari (2008: 171) highlight the heterogeneity of lowest-low fertility settings. In Southern Europe, especially in Italy and Spain, lowest-low fertility is associated with the persistence of more traditional family patterns, late home leaving, a shift to a very late first birth timing, relatively low female employment, and also disadvantaged labour market position and high unemployment among young adults (Billari and Kohler 2004, Billari 2008; see also Baizán et al. 2002, Simó Noguera et al. 2005, Dalla Zuanna 2001). Many analogies can be drawn between the more traditional family system in Southern Europe (which has been nevertheless eroding rapidly in the last decade, e.g., Rosina and Fraboni 2004, Billari 2008, Castiglioni and Dalla Zuanna 2009) and East Asia.8 In Central and Eastern Europe, family behaviour has changed faster and earlier than in Southern Europe and Eastern Asia. Especially Central Europe has experienced a remarkable shift to later childbearing, but lowest-low fertility in this region is also frequently perceived as a consequence of a painful economic transition after the collapse of state socialism around 1990 (e.g., Sobotka 2004b, Frejka 2008). This argument is most compelling for the former Soviet Union.9 Furthermore, in analogy to Southern Europe and East Asia, conservative gender roles attitudes combined with a need for female employment also contributed to very low fertility.
The long-lasting view of lowest-low fertility rates has also appeared in official population projections, often as a ‘Low scenario’, but at least in the case of Japan and Hong Kong as the central or ‘Medium scenario’. As a series of projections predicting a recovery of fertility proved repeatedly wrong, the latest version of Japan’s official populating projection, released in 2006, predicts period fertility rates below 1.3 out to
8 In Japan, non-marital fertility remains negligible and stigmatised; at the same time, marriages have been increasingly postponed or foregone (Raymo 1998, Retherford et al. 2001). A combination of declining marriage attractiveness and higher sexual permissiveness has led to a rise of non-cohabiting partnership relations (Iwasawa 2004). Together with a very low normative acceptance of extramarital childbearing this trend constitutes a compelling reason for very low fertility in Japan (e.g., Ogawa 2003). Other analogies between Japan and Southern Europe can be made with respect to disadvantaged labour market position of young adults and mothers, who often get low-paid irregular jobs (OECD 2003, Boling 2008). In addition, Japanese women face an uphill struggle when trying to combine work and motherhood (Boling 2008). Finally, Shirahase (2000) suggests that Japanese society is characterised by “systematically and hierarchically ordered timetable based on age,” which limits individuals’ flexibility in making important life course decision and further depresses the birth rate. 9 In a study on Ukraine, Perelli-Harris (2005) suggested that lowest-low fertility there has been largely driven by the decline in second birth rates as economic factors like poverty and unemployment “make a second child prohibitively expensive for the average family” (p. 68 ).
6
at least 2055 (Kaneko et al. 2008 and 2009; the low variant envisions a TFR below 1.1 between 2009 and 2055). In Hong Kong, the total fertility is projected to decrease to 0.9 children per woman by 2016 and remain at that level through 2036 (Census and Statistics Department 2007: 44). In Germany, official projections include a sustained decline to 1.2 children per woman through 2050 as part of their ‘Low scenario’. (The Medium scenario has a TFR of 1.4). The ‘Low variant’ of the 2008 UN world population projections (UN 2009) shows extreme low TFR levels throughout the whole projection period until 2050, often falling below 1.0 in Eastern Europe and East Asia. For instance, this scenario envisions that in Belarus the TFR would hit a trough of 0.86 in 2020-25, whereas in Hong Kong it would fall as low as to 0.61 in the same period. Also cohort fertility is occasionally projected to fall to 1.3 or below. Frejka and Sardon (2004: 376) suggested that women born in 1975 may reach a completed fertility of 1.2 in Italy, 1.2-1.3 in Austria, Germany and Switzerland, and 1.3-1.4 in Croatia and Slovenia. 3. The spread and the subsequent retreat of ‘lowest-low’ total fertility rate With the exception of wars and extreme events, the lowest-low fertility is a relatively recent phenomenon (e.g., Billari 2008). Among larger countries it first took place in Western Germany (by then Federal Republic of Germany), where the period TFR briefly fell below 1.3 in 1984-1985 (Table 1). At the same time, several European countries including Italy and the Netherlands experienced a TFR falling below 1.5. It was only a decade later that the lowest-low fertility became widespread in many regions of Europe and later also in Armenia and in East Asia. Excluding countries with population below one million and countries with unreliable population statistics (most notably, Bosnia and Herzegovina), the number of countries with the lowest-low fertility increased rapidly from two in 1991-92 (East Germany and Hong Kong) to 21 in 2003 (Figure 2, we consider East and West Germany as separate regions in this analysis). By then, Italy, Spain, most post-communist countries of Central and Eastern Europe, as well as Japan, Korea, Singapore and Taiwan joined this group. In total, 479 million people lived in countries with the lowest-low period fertility level (Figure 3); in Europe more than half of the total population lived in these countries in 2001 (Sobotka 2004a).10 Starting in 2003, the number of European countries with lowest-low fertility began to fall steadily, from 16 in 2002 to one in 2008 (Moldova, with a population of 4 million and sizeable emigration is the only remaining country in the group), whereas in East Asia, four out of five countries ever experiencing lowest-low fertility still retained it in 2008 (Hong Kong, Singapore, (South) Korea, and Taiwan, whereas Japan has recorded higher fertility rates since 2007.
<Figures 2 and 3 around here> A listing of countries experiencing ‘lowest-low fertility’ during the period 1984-2008 is shown in Table 1. In this table, we also include countries that have seen the TFR below 1.4 in order to see better the pervasiveness of the recent increase in fertility.
10 Total population of all countries that have experienced a spell of lowest-low fertility after 1980 amounts to 715 million in 2008.
7
This is a mixed group of middle-sized countries from different parts of Europe, but it also includes Georgia and the lowest-fertility country of the Americas, Cuba, where the TFR fell to 1.39 in 2006 (ONE 2008).11 Among these countries, Denmark stands out for both an early fall in the TFR to very low levels (the TFR fell to 1.38 in 1983) and its steady subsequent recovery to 1.89 in 2008, which brought Denmark into the group of countries with the highest period TFR in Europe.12 Finally, the table shows selected ‘higher-fertility’ developed countries that also experienced notable recovery in the period TFR during the last decade or two. Clearly, the trend of increasing period TFR has not been limited to the countries with extreme low fertility, but took place across the whole developed world. Consequently, eight developed countries currently record the TFR above 1.9, with New Zealand (2.18) and the United States (2.12) achieving above-replacement fertility. The United States is also peculiar in having experienced its lowest TFR level as early as in 1976.
<Table 1 around here> The phenomenon of the lowest-low fertility differed widely between countries in duration as well as in the lowest level of the period TFR reached. Some countries encountered a very brief period of the TFR below 1.3, while ten countries including Italy, Russia, Spain and Ukraine experienced ten or more years of such low TFR level (Table 1). Some countries have seen the period TFR temporarily plummeting below 1.0, with Eastern Germany going down to 0.77 in 1993-94, shortly after German unification (Witte and Wagner 1995, Conrad et al. 1996). Russia, with a population of 142 million was the most populous country experiencing a spell of the lowest-low fertility; Japan with a population of 128 million briefly experienced lowest-low fertility in 2003-2005, as did five countries with population of 38-48 million (Italy, Korea, Poland, Spain, and Ukraine). By 2008, however, the global population living in countries with lowest-low fertility shrank to less than one fifth of its peak value in 2002, to 88 million, out of which only 4 million resided in Europe (Figure 3). Although we focus mostly on individual countries, regional-level variation should also be highlighted. China as a whole has a sub-replacement fertility level at least since the 1990s, but the levels of the TFR are highly uncertain as serious underreporting of births occurs in vital statistics (Morgan et al. 2009).13 Our estimate, based on the 2000 population Census data and the analysis published by National Bureau of Statistics and East-West Center (NBS 2007) is presented in Appendix 2 (Table S1). Using different thresholds of the reported TFR, we arrive at the estimate of six to twelve provinces with 12 to 37 percent of China population having lowest-low fertility in 2000, with the main variant estimate of eight provinces with almost one fifth of China population (245 million). All these provinces except Hubei are situated alongside the Eastern coast and include the capital city of Beijing and the
11 Our list of very low fertility countries would not change much if we included all the countries that have experienced a TFR decline below 1.5, seen by McDonald (2006) as marking a divide between countries with ‘very low fertility’ and ‘moderately high fertility’. 12 Denmark also constitutes an exception in cohort fertility trends as it is probably the only industrialized country where women born in the 1960s actually experienced a slight increase in their completed fertility (e.g., Frejka and Sobotka 2008). 13 Different estimates of the TFR in China around 2000—when population census was conducted—range from 1.22 to 2.3 (Lutz et al. 2007), with a number of experts converging at 1.4 to 1.6 (e.g., Retherford et al. 2005; Zhang and Zhao 2006, Morgan et al. 2009).
8
most populous city, Shanghai.14 Adding China provinces to the countries with lowest-low fertility, and assuming that the findings for China for the year 2000 pertain also to the subsequent period, the global population of countries and regions with the TFR below 1.3 can be estimated in its peak period around 2002 at 700-900 million, i.e. 11-14 percent of global population. Quebec, Canada’s second most populous province is also notable for its low levels of the period TFR, which reached a low of 1.37 in 1987 but has since risen, reaching 1.67 in 1992, later declining and rising again (INSPQ 2008). While Italy and Spain can be counted among the ‘trend-setters’ of lowest-low fertility, some of their regions recorded a particularly early onset and long spells of lowest-low fertility and, subsequently, a remarkable and rather unexpected recovery (see also Billari 2008). Northern Italy, which has a long history of low fertility, experienced 23 years of the TFR below 1.3, starting in 1981 as compared with 12 years for Italy as such. North Italian province of Emilia-Romagna, which used to be a showcase of very low fertility throughout the post-WW II period, recorded 25 years of the TFR below 1.3 between 1979 and 2003 (Figure 4). A recent reversal, when the TFR in the North of Italy as well as in the province of Emilia-Romagna got slightly ahead of the Italian TFR, is remarkable. In these regions, the estimated TFR for 2008 was 1.45 as compared with 1.41 for Italy, up from 1.04 reached in the North in 1994 and 0.94 reached in Emilia already in 1987 (ISTAT 2009a and 2009b; see also Caltabiano 2008). In Spain, many regions first experienced lowest-low fertility in the second half of the 1980s and by 1990 ten out of the 17 autonomous communities had a TFR below 1.3, with Asturia and the Basque country falling below 1.0. In five of these regions fertility recovered above 1.3 as of 2007 (INE 2009c), increasing by 0.3-0.4 from the lowest level reached around then mid-1990s.
<Figure 4 around here> As widespread as the turnaround in fertility has been, the magnitude of increase from ‘lowest-low’ levels has been often small (Figure 5a). .However, in many countries the TFR showed a strong reversal: Spain and nine former communist countries, including Russia and Ukraine, experienced a TFR increase of 0.30-0.45; in Eastern Germany the TFR increased by 0.63 to 1.40 in 2008 (Table 1). This trend as well as the regional analysis above clearly show that there is nothing inevitable about the lowest-low fertility and that many countries experiencing spells of extreme low TFR may later see a vigorous recovery of period fertility to moderately low fertility levels. Interestingly, some of the ‘higher-fertility’ countries, including France, Sweden, and the United Kingdom, have seen a strong TFR increase of 0.3-0.4, i.e., larger than that recorded in most of the ‘ever lowest-low fertility’ countries (Table 1, Figure 5b). As a result, considerable regional diversity in fertility levels has not diminished in Europe (e.g., Frejka and Sobotka 2008).
<Figures 5a and 5b around here>
14 In Shanghai, and plausibly also in other large cities of China, the originally coercive one-child policy has become widely internalised and led to the spread of one-child family preferences (see Nie and Wyman 2005 for an example of Shanghai).
9
4. The role of tempo effects in explaining the TFR increase A trend towards later timing of childbearing constitutes the most prominent explanation of the TFR decline to very low levels. It negatively affects conventional period fertility indicators pushing them well below the eventually achieved completed fertility during the whole period when childbearing takes place at progressively later ages (e.g., Bongaarts 2002). Such a negative distortion, frequently labeled ‘tempo effect’ can last three decades or even longer, as has been the case in many European countries and Japan (Sobotka 2004b). Kohler, Billari and Ortega (2002) proposed that developed countries are undergoing a distinct ‘postponement transition’ from an early to a late timing of motherhood. The end of fertility postponement should eventually lead to an elimination of the tempo effect and a subsequent increase in the period TFR, provided that the underlying fertility level (net of tempo effect) remains stable (Bongaarts 2002: 437-8, see also below). Sobotka’s (2004a) analysis suggested that all the lowest-low fertility countries of Europe were affected by negative tempo effect in the second half of the 1990s and none of them would experience a TFR below 1.4 without fertility postponement. We analyze the role that diminishing tempo effect has had in the recent turnaround in the period TFR in two ways. First, we estimate Bongaarts and Feeney’s (1998) tempo-adjusted measures of the period TFR. Second, we estimate the role that the first-birth-order TFR, which is especially susceptible to tempo effects, has had in the recent increase. The Bongaarts-Feeney approach has the advantage of allowing us decompose the change in the TFR to quantum and tempo effects. The approach, however, requires fairly strong assumptions to be made about the nature of postponement, in particular that in a given period, all age groups postpone births by exactly the same amount. In practice, the method is trusted the most when its estimates are averaged over several years, and as is discussed later on, some caution should be used when interpreting short-term variations in the tempo-adjusted TFR. The first-birth TFR analysis is less dependent on any particular assumptions, instead relying on the fact that when there is postponement, the effect on first births tends to be particularly strong. Together the two types of analysis add confidence to inferences made about the role of postponement in depressing the levels of period birth rates.
4.1 Changes in tempo-adjusted TFR: did tempo effects decline in importance? Our investigation of tempo effects is based on our calculations of the tempo-adjusted TFR using Bongaarts and Feeney's (1998 and 2000) method (see Appendix 1 for details concerning the computation of the tempo-adjusted TFR and the provisional nature of recent estimates.) The tempo-adjusted TFR tries to measure the intensity of fertility that a period would have seen if there had been no postponement. As such, it aims to be a pure measure of period quantum. One can attribute an increase in the observed TFR to changes in tempo if the tempo-adjusted TFR remains flat while the observed TFR rises. On the other hand, if the observed and tempo-adjusted TFR rise in unison, then quantum changes can be held responsible.
10
The observed TFR and the mean age at childbearing for a range of countries are shown in Figure 6, along with our tempo-adjusted estimates of the TFR. Spain is an example in which the tempo-adjusted and observed TFR have converged in recent years, suggesting that a decline in the tempo effect—driven by the slowdown of postponement visible in the mean age of birth—is responsible for the recent increase in the TFR. At the other extreme, Bulgaria has seen little slowdown in the rate of postponement over the course of the recent fertility increase, and so the tempo-adjusted TFR rises as fast or faster as the observed TFR.
<Figure 6 around here> The share of TFR increase attributable to quantum and tempo is shown in Figures 7a and 7b. In the vast majority of cases there was some increase in fertility due to diminishing tempo effect. In some cases, for example, Spain, Romania, and Slovenia, slowdowns in postponement appear to have been nearly entirely responsible for recent TFR increases. In a few other cases, such as Bulgaria, Lithuania, or Japan, however, the estimated effect of tempo changes is actually negative, with apparent increases in quantum being responsible for any rise in the TFR.
<Figures 7a and 7b around here> The analysis of the TFR rise in selected countries that never experienced lowest-low fertility shows that declining tempo effects largely contributed to this increase (Figure 7b). Declining tempo effect had a dominant role in the TFR increase in the United States, the Netherlands, Norway and Austria, roughly the same role as quantum increase in Sweden and a minor but important role (explaining about 40% of the TFR rise) in Denmark and Finland. Further investigation of trends in the tempo-adjusted TFR provides two key insights. First, tempo effect still remained an important force pushing the period TFR in 2006 downwards by 0.15 (Greece) to 0.44 (the Czech Republic) in all the analyzed countries where the TFR has bounced back above the 1.3 threshold, except Spain.15 Second, it is surprising that the tempo-adjusted TFR in a majority of analyzed countries increased after the year when the lowest TFR was reached. This observation was unexpected in that the ‘classic’ argument about the potential increase in the TFR level envisioned that the TFR may eventually increase to its adjusted level once the tempo distortion stops. Bongaarts (2002: 437, Figure 8b) also offered an illustration of an alternative scenario, where the fertility quantum declines over time and reduces thus the potential scope for the TFR decline linked to the ending of fertility postponement. Thus, the finding that both the TFR and the adjTFR actually increased, raising thus the potential scope for a further TFR recovery, gives a new perspective to our hypotheses about the future fertility trends.16 15 The analysed data for 15 countries are shown in Table S3 in Appendix 3. It is likely that the adjusted and the observed TFR have also converged in Italy, for which we do not dispose with recent data to perform this analysis. In the past three decades, trends in fertility tempo and quantum in Italy and Spain were remarkably similar. 16 An example of Denmark provides a good illustration of this point: in 1983, when the TFR reached a low of 1.38, the adjTFR was 1.75. Thus, an analyst expecting that fertility quantum, as measured by the adjTFR, would not decline further, might have predicted a recovery in the TFR up to that level. Twenty
11
There are two competing explanations for the observed increases in quantum as lowest-low fertility reverses. The first is to take the results of the Bongaarts-Feeney tempo-adjusted period fertility rate literally as evidence that the intensity of childbearing really did increase over time. This increase in fertility could have resulted from a wide range of economic and social changes. Similarly, one might also think the quantum measure tells the level to which fertility will return if and when postponement comes to an end. In this sense, the increases in quantum are signals of higher future fertility, and perhaps even of higher cohort fertility. The alternative is to take a more skeptical view of the Bongaarts-Feeney measures. The interpretation of the tempo-adjusted TFR as a pure quantum measure depends on all of the effects of changes in timing being controlled for in the adjustment process. Notably, the assumption of uniform postponement across all ages—a complete absence of cohort effects—can be important (Kohler and Philipov 2001) Today, a likely source of cohort-differentiation can be seen in the extent to which much of the recent TFR increases have come from increasing fertility at older ages. A possible explanation for the concentration of fertility increase in older ages is that we are witnessing the recuperation of births delayed by cohorts when they were younger (Lestaeghe and Willems 1999, Lesthaeghe 2001, Frejka and Sardon 2009). When the postponement transition is driven by cohorts rather than periods, it is possible to see apparent, but misleading, increases in the tempo-adjusted TFR as the postponement transition passes its peak. A simple example illustrating this effect is given in Appendix 6. The distinction between period-based and cohort-based postponements may help explain some differences in ‘recuperation’ observed by Lesthaeghe and Willems (1999). In Northern and Western Europe, the decline in cohort fertility at younger ages was offset by subsequent increases in fertility when postponing cohorts aged. In Southern Europe, there was less recuperation. One can speculate that the reason for this is that in the Northwest, postponement was closer to the cohort-based examples given here, with impetus for postponement coming from changes in the female life-course, particularly increases in schooling and pre-motherhood work experience. In Southern Europe, where increases in postponement were partly triggered by high rates of unemployment and then eased thereafter, the period-based model might be more appropriate. In Eastern Europe, there might also be a combination of period and cohort-driven shifts as economic hardship of the 1990s produced period postponement but the economic and social transformation of post-communist societies created strong cohort effects. At this point, such hypotheses remain speculative, but worthy of further investigation.
years later, in 2003, the actual TFR did indeed reach this level (1.76), but in the meantime, the tempo-adjusted TFR increased to 2.0, signaling a hypothetical scope for further increase in the TFR. However, some portion of the apparent quantum increase as measured by the adjTFR might be attributable to the fluctuations that are inherent in this indicator and that may reflect a violation of its underlying assumptions.
12
4.2 Transition in first-birth TFR and its contribution to the overall TFR increase At the time when the period TFR reached the lowest level, its first-order component typically fell to 0.6 or even lower (Table S4 in Appendix 4). Nowhere are the distortions in the period TFR and the problems of interpreting such an erratic indicator more clearly visible than in its first-order component (Ryder 1990: 440). If taken at a face value, such low TFR1, especially when prevailing over longer periods of time would imply childlessness exceeding 40%. Such levels contrast with the actual childlessness in Europe and East Asia. Various analyzes and projections indicate that only few of the lowest-low fertility countries are likely to experience childlessness higher than 20% among the late 1960s and the early 1970s cohorts (Sobotka 2005; Frejka and Sardon 2006, Sardon 2006) and only in Germany and Japan childlessness may eventually rise to very high levels of 25-30% (Kreyenfeld and Konietzka 2007, Dorbritz and Ruckdeschel 2007, Iwasawa and Kaneko 2007). Clearly, first-order TFR in lowest-low fertility countries became strongly depressed by fertility postponement in the 1990s and declined well below any plausible levels of cohort first birth rates. This finding suggests that some increase in the period TFR would be expected solely because of a transitory depression and parity-composition distortions in first-order TFR (see also Sobotka and Lutz 2009)17 We propose that the lowest-low TFR has its analogy in its first-order component, where the values below 0.75 can be labeled as lowest-low first birth levels. All the ‘lowest-low fertility’ countries with available data recorded the lowest-low TFR1 at the time of reaching the lowest TFR level. As of 2007, the first-order TFR increased in all of these countries, but only in four of them—Bulgaria, Estonia, Russia, and Spain—did the TFR1 rise above 0.75. This signals that in most countries the first-order component of the period TFR was still negatively affected by tempo and parity composition effects, suggesting a further scope for its rise. In line with our expectations the increase in the first-order TFR was typically more rapid than the overall rise in the TFR for second and higher order births, both in absolute and relative terms (see Appendix 4 for more details). Because first birth rates are usually more affected by childbearing postponement than higher-order birth rates, we propose that the TFR1 follows in most lowest-low fertility countries a distinct trajectory during this process that broadly conforms to the postponement transition framework of Kohler, Billari and Ortega (2002). First, countries start with relatively high TFR1 and an early mean age at first birth. When postponement kicks in, TFR1 falls, often to the lowest-low levels below 0.75 and the mean age at first birth begins its long-term rise. Once this ‘transition’ comes to the end, the mean age at first birth tends to stabilize at a high level (typically, at age 28 or older) and the TFR1 bounces back, although usually not as high as it was at the start of the process (allowing for some decline in fertility levels). Most of the ‘ever lowest-
17 Parity composition distortions in the TFR are attributable to changes in the parity composition of women of childbearing ages. During the course of fertility postponement number of childless women at younger (and later also at older) reproductive ages rises rapidly, affecting the order-specific TFR which does not control for parity distribution. In contrast, parity-specific fertility indicators such as the PATFR index (Rallu and Toulemon 1994) are affected only by tempo distortions, but not by the parity composition effect.
13
low’ fertility countries now appear to be approaching this final stage. We provide a description and a graphical illustration of this process in Supplementary Appendix 4. Having described the fertility increase in detail, we now turn to explanations for increasing fertility, including a changing composition of the population due to immigration, economic change, and policy change.
5. The contribution of immigrant women to rising total fertility rates More affluent parts of Europe have experienced substantial immigration, especially in 2001-2008 when the European Union experienced net migration between 1.3 and 1.9 million annually, representing a net annual population gain of 0.3-0.4% (Eurostat 2006, 2008b, and 2009b). Since immigrant women in most European countries have on average higher fertility rates than the native ones (Sobotka 2008a, Coleman 2006, Haug et al. 2002), it is possible that fertility rates in many European countries have been pushed upwards by a compositional effect of the rising share of higher-fertility immigrants. Although data on immigrants’ fertility remain relatively scarce in Europe, several contributions have discussed this possibility in the case of England and Wales, France, Italy, the Netherlands and Spain (Héran and Pison 2007, Gabrielli et al. 2007, ONS 2008, Sobotka 2008a). In fact, the argument on immigrants’ fertility is relevant only for a small set of lowest-low fertility countries in Southern Europe (Greece, Italy, and Spain) as other countries with such low fertility either experienced very limited immigration (Eastern Asia, south-eastern Europe, Eastern Europe except Russia and some countries of Central Europe), or a large-scale immigration is very recent there (the Czech Republic and Slovenia) or no reliable data on immigrants’ fertility are available (Russia). Therefore we look at the evidence for three Southern European countries and then briefly summarize the findings for several higher-fertility countries of Western and Northern Europe with good-quality data on migrants’ fertility. All the larger countries in Southern Europe collect data on births to foreign mothers, which exclude immigrant women that have received nationality of their country of residence. However, because mass immigration to Southern Europe is relatively recent, occurring mostly after the mid-1990s, most immigrants still retain the citizenship of their country of origin and data on foreign women thus give a good picture of immigrants’ fertility. Only Spanish Statistical Office (INE) provides detailed birth and population data for foreign women covering most of the period of the rising TFR, starting in 1998. Spanish data are particularly interesting, since Spain experienced the largest migration gain in Europe in the period 2000-2008, with estimated net migration of 5.1 million (Eurostat 2009b).18 Using the most recent data for Greece, Italy and Spain Table 2 compares the shares of births to foreign mothers and the TFR for foreign, native and all women in 2005-2007. A relatively large fraction of births, 15-17%, was attributable to foreign women, a huge increase from fewer than 5% in Italy and Spain in 1998. More important for our analysis, the TFR of native women remained slightly below the lowest-low threshold in Greece and Italy and it has hit the 1.3 threshold in Spain. Therefore, without the contribution of foreign women, Greece and Italy would still record the lowest-low TFR in 2005 and 2007, 18 Italian statistical office publishes age structure of foreign residents only since 2004 and Greek statistical office collects vital statistics data by citizenship only since 2005 (Tsimbos 2008).
14
respectively, and the relatively high TFR of foreigners helped to push their TFR just above the lowest-low threshold. At the same time, its absolute boost to the TFR was rather modest, between 0.05 (Spain) and 0.09 (Greece and Italy).
<Table 2 around here> This analysis does not reveal, however, whether immigrant women had a decisive influence on the TFR rise from the lowest recorded levels. We can provide such analysis only for Spain, comparing the TFR for foreign, native and all women in 1998, 2002, and 2006.19 In 1998, Spanish TFR was at the lowest recorded level of 1.16, recovering subsequently to 1.46 in 2007 (Figure 6 and Table 1 above). Spanish TFR increase between 1998 and 2006 was by and large driven by the rise in fertility rates among native women, whose TFR rose by 0.17 (after rounding), just below the overall TFR rise of 0.20. The net impact of foreign women on the TFR in Spain rose only slightly and contributed a very modest 16% to the TFR increase after 1998. This surprisingly small contribution resulted from a rapid fall in foreign-women TFR, from 2.4 in 1998 to 1.7 in 2006. Provided that the data on foreign population can be trusted20, such a fall in migrants’ fertility could be attributed either to the change in the composition of the foreign population (more recent immigrants coming from lower-fertility countries, especially from Eastern and South-eastern Europe) or to the decline in migrants’ fertility with their longer duration of stay, observed in many other countries (e.g., Toulemon 2004, Andersson 2004). If foreign women retained their level of age-specific fertility in 1998, Spanish TFR would increase to 1.44 in 2006 and the contribution of foreign women would be considerably stronger, although still not dominant (Table 3).21
<Table 3 around here> In contrast to Spain, migrant women had a much more important role in pushing the Italian TFR upwards. According to the estimates by Gabrielli et al. 2007, a combination of their increasing fertility and an increasing share in the population between 1996 (when the TFR was close to its lowest point) and 2004 contributed about two-thirds of the Italian TFR rise of 0.11 in that period. This finding corresponds well with the high TFR level recorded among foreign women in Italy in 2007 (Table 2). Also in many Italian and Spanish regions that once experienced extreme low fertility levels, immigrants helped to push fertility close to or above the lowest-low levels.22
19 For detailed and very informative analysis of fertility of immigrants in Spain see Roig Vila and Castro Martín 2007. 20 Gabrielli et al. (2007: Fn 12) discuss the possibility that there may be a mismatch in Spain between birth registration system and municipal registration system of foreign population, especially with respect to illegal and unregistered migrants. Such a mismatch can lead to erroneous estimates of fertility trends and levels among foreign women. 21 Even with their more modest contribution, foreign women have an appreciable influence on age-specific pattern of Spanish fertility. Their young childbearing schedule, peaking at age 22, strongly contrasts with the schedule of Spanish women that peaks at age 32 and pushes fertility rates in Spain markedly upwards at ages 18-27 (more detailed analysis available from T. Sobotka upon request). 22 In the case of the Italian province of Emilia-Romagna, discussed above, native women have contributed most to the recovery of the TFR from the low of 0.94 in 1987, but it was the contribution of immigrants that helped to push the TFR well above the lowest-low threshold: While native Italian
15
The evidence for some other countries in Europe that are comfortably above the lowest-low fertility threshold and that have relatively good statistics on migrant fertility indicates that Italian case is not very typical and that more countries conform to the Spanish case. An analysis of the recent increase in the TFR in England and Wales, Denmark, France, and Sweden shows that it was mostly or fully fuelled by a rise in native women’s fertility, whereas immigrants have contributed by less than one third to this increase (but only 5% in Sweden and negatively in Denmark, Table 4).
<Table 4 around here>
6. The role of improving economic conditions on the end of lowest-low fertility In the past two decades, the lowest fertility levels have often been accompanied by challenging economic conditions. In difficult times, couples appeared to postpone the birth of a next child or stop having children altogether as a way of economizing. In this section, we look at whether the reversal of lowest-low fertility may have come as a result of improving economic conditions. In a number of countries, this appears to have been the case. Interestingly, period TFR in diverse countries like Japan, Poland, and Spain began to rise at about the same time or soon after unemployment began to fall (see Figure S2 in Appendix 5). Economic conditions can be measured using a variety of indicators. In our analysis, we use unemployment as an easily available general indicator.23 Figure 8 shows that bivariate relationship between fertility and unemployment in the nine OECD countries that currently have or have in the past had lowest-low fertility. The unemployment is lagged by one year, so that economic conditions in year t are compared with births in year t+1. We see that higher unemployment is associated with lower fertility in eight of the nine countries considered, with Hungary being the exception. In some cases—Italy, Spain, Greece, and Japan—the relationship is extraordinarily linear. In the Czech Republic, the unemployment rate does not appear to be a good predictor of the fertility rate, whereas in Hungary the relationship runs in the opposite direction than expected (i.e., higher unemployment is associated with higher fertility).
<Figure 8 around here>
The median effect of a change in the logarithm of the unemployment on the total fertility rate in these countries is -0.23. This means a halving of unemployment is associated with an increase of the TFR of about log(1/2)*(-0.23) = 0.16. This estimate is larger than in the literature (Kravdal 2002, Adserà 2004, Ermisch 1990, and other), because unemployment serves as a proxy for a larger set of variables measuring
women living in this province recorded a TFR 1.27 in 2007, fertility of foreign women had a net positive effect of 0.18 on the overall TFR that reached 1.45 (ISTAT 2009c, Table 2.9). 23 This analysis also conforms to the importance of unemployment for depressing fertility rates, stressed by Adserà (2004 and 2005, see Section 2). Using GDP growth as a measure of general economic conditions produces similar results.
16
economic conditions and also perhaps because the influence of economic conditions may be larger for very low fertility countries or has become larger in recent years. Using this estimate of the effect of unemployment on fertility, we can try to answer how much of the increase in fertility in recent years might be due to improving economic conditions. We do this by predicting the increase in TFR that would have occurred solely as a function of improving unemployment. Taking Spain as an example, the lowest level of the TFR was 1.16 in 1996. By 2007, the TFR rose to 1.39, an increase of 0.23. Over this same period, unemployment fell from 22.1% to 8.3%. The predicted change in the TFR is thus log(8.3/22.1)*(-.23) = +0.23. So in the case of Spain, the increase in fertility happens to be exactly what one would have expected from improving economic conditions. The extent to which improving economic conditions have predicted the turn-around in lowest-low fertility can be seen in Figure 9, ordered so that the countries where economic conditions ‘explain’ the largest share of the increase are farthest to the left. We can see in Slovakia, Poland, Spain, and Italy, economic conditions predict fully the turn-around in period TFR. In Japan, Greece and Korea, improving economic conditions provide a partial explanation, accounting for a minor portion of recent fertility increase. In the Czech Republic and Hungary, economic conditions—at least as measured by the unemployment rate—provide no explanation of fertility increase.
<Figure 9 around here>
6.1 The current crisis The analysis of the role of economic conditions is useful not only for understanding the past fall and rise of lowest-low fertility, but also for predicting the future. The current world-wide economic crisis has brought rapid increase in unemployment and job insecurity and in many countries also declining income and huge turbulences on the housing market, a situation which in the past generally correlated with declining period fertility. The OECD (2009: 61) has estimated that unemployment will increase in the OECD area from 5.6% in 2007 to 9.9% in 2010. This increase would—using the same estimate as above—produce a decline in the TFR of about 0.13. We can also make such estimates on a country-by-country basis, using country-specific forecasts of unemployment along with a common estimate the effect of unemployment on fertility. This approach predicts that at least four countries, Hungary, Italy, Japan, and Spain, would all fall back below the threshold of lowest-low fertility, while Slovakia would fall yet deeper below the threshold. Such calculations are clearly speculative. There is great uncertainty both in the forecast of future unemployment and in the effect of its change on fertility in individual countries. This effect will be modified by country-specific institutional factors and, in some cases when parental leave policies or welfare support is generous, the period of economic downturn may actually stimulate more women to take an ‘advantage’ of temporary non-employment and have children. Such an unexpected reaction to economic recession was observed in Finland in the early 1990s (Vikat 2004). Still, if we accept the magnitudes of these two estimates, it would seem reasonable to expect yet another, although temporary, reversal of fertility trends in a
17
number of formerly lowest-low fertility countries, producing an increase in the number of countries that fall again below this arbitrary threshold. The above analysis has been premised on a very simple relationship between economic conditions and the level of fertility. Such a simple relationship may help to explain short-term fluctuations in fertility, but would clearly be less successful in the longer term. More complicated formulations are needed to understand the role of economic conditions when combined with social influence and value changes (Kohler et al. 2002, Billari 2008). Another factor that probably matters is the potential for further tempo effects, which should depend on how much postponement has already occurred. Goldstein (2006) argues that current populations are still far from the upper age limits of fertility. Most of the lowest-low fertility populations still have room for continued postponements, but how much remains an open question. Some of them, namely Italy, Japan, and Spain, are already among the oldest-childbearing populations of the world.
7. Is there any merit of policy in the upturns of fertility? The effect of family policies on fertility remains an unsettled issue; different studies come up with contradictory conclusions on policy effectiveness and the magnitude of its impact (Gauthier and Hatzius 1997, Hantrais 1997, Gauthier 2000, 2002, 2007, Neyer 2003, Castles 2003). The assessment of the influences of family-related policies is methodologically challenging. Their impact on fertility depends on “the type of policies, the levels of benefits, the conditions of eligibility, and the income and opportunity sets of individuals, as well as the norms, stigma, and sanctions associated with the receipt of benefits” (Gauthier 2007: 324). Gauthier’s (2007) analysis of policy effects on fertility in industrialized countries concludes that public policies frequently influence fertility, but their impact is usually small. Policies influence especially the timing of childbearing rather than the completed family size and their effects are frequently short-lived. We do not aim to assess quantitatively the effects of specific policies on the upturns of fertility observed in the lowest-low fertility countries. Instead, by way of examples for several lowest-low fertility countries we explore the stand of governments towards low fertility, discuss new policy initiatives that have taken place in these countries, and hypothesize whether they could have played a part in the fertility reversals. Low fertility has increasingly become a matter of policy concern for the governments of many developed countries as well as for the whole EU (European Commission 2005). Judging from the policy monitoring reports published by the United Nations, the governments of all the countries that experienced lowest-low fertility have eventually embraced the view that fertility in their country is too low and declared that policies should aim to raise its level. By 2007 this was the case in all the 22 lowest-low fertility countries that are listed in the UN publications—almost twice as many as in 1996 or 2000 (Figure 10). Such a unanimous consensus across a broad group of countries is striking, and it indicates a wide acceptance of pronatalism in both East Asia and Europe. If we broaden our analysis and include countries ever reaching the TFR below 1.4 (see Table 1), only two of these countries, Cuba and
18
Denmark, declared in 2007 that their fertility is satisfactory and embraced the ‘no intervention’ policies and, in addition, Switzerland did not have a policy aim to raise its fertility. There appears to be some time gap, however, with which some governments react to very low fertility. In several countries, including Spain, pronatalist views were embraced only at the time when the TFR actually bounced back above the lowest-low level.
<Figure 10 around here>
The newly introduced measures aimed at stimulating higher fertility range from baby bonuses, family allowances, maternal and paternal leave up to subsidized child care, tax incentives, subsidized housing, and flexible work schedules. Our examples below look first at five lowest-low fertility countries of Europe—Spain and three former state-socialist countries, the Czech Republic, Estonia, Russia—and then at two Asian societies, Japan and Singapore.
7.1 Examples of recent policy initiatives in the lowest-low fertility countries In order to encourage families to have more children, Spain launched a financial incentive scheme in 2007, when the parents of each newborn or adopted child became eligible to a bonus of 2,500 Euros. There was no obvious immediate effect on fertility trends and the TFR increased only slightly in 2007 (by 1%), broadly in line with an upward trend established since 1999. Plausibly, the larger TFR increase in 2008 (by 5%), double the rate of increase in Greece, Italy and Portugal, might be partly explained by this new incentive. Although work and family reconciliation policies have received increasing attention in Spain in recent years, important obstacles that make young people postpone family formation (high childcare-related costs, expensive housing, high youth unemployment (Simó Noguera et al. 2005, Delgado et al. 2008)) remain unresolved. Baby bonuses of similar type as in Spain were also introduced in Australia, Singapore, and Russia, and it seems that they had some—although probably temporary—effect. For example, in Australia a baby bonus ($3,000) was introduced in 2004 and an upturn in fertility rates was observed thereafter: the TFR increased from 1.75 to 1.93 between 2003 and 2007 (Australian Bureau of Statistics 2008). However, the largest rise in the TFR took place only in 2007 and the baby bonus probably played a minor role in this increase, since “it was only one element of a package of other measures whose generosity has also increased substantially” (Lattimore and Pobke 2008). Estonia experienced one of the largest TFR increases among the analyzed countries, from 1.28 to 1.66 between 1998 and 2008. It is plausible that newly adopted policies contributed to this rise in fertility. Estonia repeatedly modified its family benefits schemes in terms of their levels and eligibility criteria. An important turn in Estonian family policy took place in 2004 when the parental benefit compensating for the income lost by the parent staying at home with children (sometimes called “mother’s
19
salary”) was introduced.24 It was a great improvement for the parents compared to the previous small flat-rate benefit. There was a concurrent noticeable rise in the TFR observed in 2004 (by 0.09 as compared to 2003), which took place at all birth orders, and the upward trend persisted into later years as well (see Figure 6). In the Czech Republic, a shift in the development of family policy occurred with the coming of the new government after the 1998 election, which placed a stronger focus on family issues. It was the time when the TFR dropped to its all-time low of 1.13. Since then the promotion of family-friendly policies started playing a significant role in the political competition for votes of the electorate. In 2005, shortly before the parliamentary elections, the parliament agreed to double the birth allowance as well as the parental leave benefit. Apart from these changes, in 1995 the paid parental leave was extended until the child reaches four years of age (Sobotka et al. 2008). However, no clear relationship between family policies and fertility swings can be established: the TFR in the Czech Republic started rising steadily after 2003, i.e., before the more generous system of birth allowances and parental leave benefits came into effect in 2007. Russia has a rather long history of pronatalist policy measures. A most comprehensive package, broadening childcare opportunities for working mothers, was introduced in the early 1980s (see Zakharov 2006 and 2008). These policies had a strong, but temporary effect on period fertility (Avdeev and Monnier 1995, Zakharov 2006 and 2008). No major changes in family policy were implemented until 2007 when in response to President Putin’s urgent demand to counteract the fertility decline a new package of policies was prepared. The implemented changes involved significant increases in the levels of various types of benefits as well as the introduction of so-called ‘maternal capital’. The ‘maternal capital’ is transferred to women who have given birth to (or adopted) a second child as well as to women who have a third or higher-order child and who have never received this payment before.25 The very preliminary reading of the data for 2007 suggests that the new policies have accelerated the ongoing shift towards later childbearing and their main effect was on the second and higher-order birth rates among women at older childbearing ages (see also Zakharov 2008a). The TFR, which was on a slowly rising trajectory before 2007, jumped from 1.30 to 1.51 between 2006 and 2008. However, at least part of this rise may be attributable to the effects of (by then) positive economic situation, as the TFR in the same period rose rapidly also in the neighboring Belarus and Ukraine that did not implement so vigorous pronatalist measures. To reverse the decline in fertility rates, Japan enacted numerous pronatalist policies and programs supporting childcare and parental leave starting from the early 1990s (e.g., Ogawa 2003). Through introducing parental leave, expanding childcare services and similar measures, the government aimed to facilitate childbearing among working married women (Retherford and Ogawa 2006). As a result, Japan improved its international ranking in family policies, especially with respect to childcare
24 The parental benefit amounts to 100% of previous salary, it is subject to income tax and is paid for a 455-day period, starting after the end of maternity leave (UNICEF 2006). 25 The so-called ‘maternal capital’ is equal to 250,000 roubles (5,560 Euros as of March 2009). It is paid once in mother’s lifetime, and she can start making use of the money three years after the childbirth. It can be spent for a limited range of purposes, which include paying for children’s education, purchasing housing, investing for retirement and the like (Zakharov 2008).
20
expenditures (Boling 2008). Nevertheless, for quite a while, Japan along with Singapore has been referred to as an example of the policy failure (McDonald 2006). Among the usually noted reasons are inconsistencies in the family support scheme, the failure to target all women irrespective of their income and education, and to achieve higher family-friendliness in workplaces. Singapore started introducing openly pronatalist policies in the 1980s. The objective of these policies was not only to raise fertility, but also to reduce fertility differentiation by education. The government was concerned about too low fertility among highly educated women and much higher fertility among those with low education. Incentives were introduced to encourage better-educated women to have at least three children and, at the same time, to discourage low-income and low-educated women to have larger families through sterilization bonuses (Yap 2002). This selectively pronatalist approach did not work well; there was a small effect on fertility only shortly after the introduction of new policies. In addition, the government launched baby bonuses for the second and third child, but these incentives do not really seem to give any appreciable results so far. Much more research is needed to examine all aspects of newly introduced policies and to disentangle the policy effects from other determinants of fertility. Our tentative findings suggest that (i) there are instances where policies seem to be plausibly related to the rise in fertility (Estonia and also Russia as far as the launch of ‘maternal capital’ in 2007 is concerned), (ii) there were fertility rises where there were no major policy changes (Spain before the introduction of the baby bonus in 2007, Russia in 2000-2004), (iii) there were policies that came after the rise in fertility started and thus have no obvious role in facilitating it (the Czech Republic), and (iv) there were policies which do not seem to have had any palpable influence on fertility (Singapore, Japan, at least until recent years). Similarly contrasting evidence pertains to the ‘higher-fertility’ developed countries. At least in some of them, including Australia and the United Kingdom, new policies were enacted before a significant rise in the TFR began26 Policy change and economic change both follow a time path. For policy, a problem is discovered, reactions to it are considered, and some time passes by the time that any new policies are in place, let alone influence behavior. For economics, each downturn is—so far—eventually followed by an upturn. The postponement of fertility also appears to have a rhythm; the pace of postponement starts slowly, accelerates, and then decelerates as a new equilibrium is reached. An obstacle to making inferences about the effect of economic and policy change is that the timing of these changes may coincide with the progression of the tempo transition. In this final section, we consider the postponement transition itself.
8. Modeling postponement transitions The idea of a postponement transition from young to older ages of childbearing emphasizes the role of social interaction effects on fertility behavior (Kohler, Billari
26 Since 1997 the UK government has launched initiatives aimed at improving childcare availability, maternity leave, and increasing welfare support to families with children (Sigle-Rushton 2008).
21
and Ortega 2002, Bratti and Tatsiramos 2008). According to the theory, individuals do not only optimize their own behavior in isolation, but rather receive utility by doing what is socially normative. In other words, the desirability of actions is linked to how close they are to those of others. Applying this theory to fertility timing is appealing both because age-norms about when it is appropriate to have children are known to be powerful and because the appeal of childbearing or remaining childless may depend on what one’s peers are doing. Here we further develop the idea of a postponement transition. Taking the logistic model as the parametric form of the transition, we estimate the pace of postponement transitions based on data for the lowest-low fertility countries through 2007. This helps us to understand why postponement can occur over many decades, but lowest-low fertility usually last only about 10 years. We also briefly address the issue of whether fertility postponement is primarily a ‘period’ or ‘cohort’ driven process and point out that a cohort-driven postponement may explain some of the apparent increase in fertility quantum associated with the end of lowest-low-fertility.
8.1 How long does lowest low fertility last? We can use the combined experience of populations with lowest-low fertility to obtain a generalized and stylized description of the ‘postponement transition.’ Figure 11 shows the relationship between the rate of postponement of first births and the mean age at first birth. The inverted U-shape means that postponement is slowest when first births occur quite early or quite late and fastest when ages of first birth are intermediate. The typical trajectory of a postponement transition can be obtained by fitting a line to the scatter plot. In the case of Figure 11, we fit a quadratic curve.27 The ages at which the curve crosses zero can be thought of as corresponding to the equilibrium of early and late childbearing.
<Figure 11 around here> The estimate of the typical relationship between age at first birth and postponement also permits us to estimate the intensity of the postponement transition with respect to calendar time. The coefficients of the quadratic curve shown in the figure provide constants for a logistic differential equation.28 Solving this differential equation transforms the relationship between mean age and pace of postponement into statements about how the mean age and pace of postponement vary over time. The
27 The line shown here is for the pooled sample, but adding separate effects for each country produces nearly the same result. 28 The solution to this quadratic differential equation is the S-shaped logistic growth curve. Writing our
differential equation as , and letting cbmamm ++=′ 2 acbr 42 −= , then the solution is
tr
tr
eraC
ea
rbtm−
++−
=2
)( , where C is determined by the initial condition for the differential
equation
arbmr
aC
2)0(
1+−
−+= , where is given. )0(m
22
next two panels of the figure show this relationship: first, the S-shaped transition from low to high ages at first birth, and second, the rise and fall in the pace of postponement. We can now characterize the duration of the postponement transition. If we mark the beginning of the postponement transition at the time when the increase in the mean age at first birth surpassed one tenth of a year per calendar year, and the end of the transition similarly, we can see that the entire transition lasts on the order of three to four decades. This is in line with the view of a long transition by Kohler, Billari, and Ortega (2002) or Goldstein (2006). Importantly, however, the rise and the fall in the pace of postponement means that the duration of high levels of postponement—say above 0.2 years of age per year of time—will be only a fraction of the entire transition. When cohort fertility is averaging 1.6, then rates of postponement above 0.2 are needed in order to drive observed period fertility to lowest-low levels below 1.3. In the case of the typical transition, such high levels of postponement are seen only for 16 years. This corresponds well with the observed duration of lowest-low fertility levels, which are typically on the order of 10 years. An important observation is that the end-of-lowest low fertility does not mark the end of the postponement transition. During the two decades following the end of lowest-low fertility the period TFR rises by another 0.3 in our model example. Our model, as stylized as it is, allows us to distill what seem to be the essential features of the tempo transition. First, a shift from a low to high equilibrium level of the timing of first birth. Second, an acceleration and deceleration of postponement over the course of the transition. And third, a relatively short period of postponement that is rapid enough to create lowest-low fertility in many low-fertility countries. We have only focused on first births and described the typical case here, from which the experience of individual populations can vary.29 More work needs to be done in order to give us the ability to distinguish empirically between cohort and period shifts in timing. Most probably, there is a combination of period and cohort postponement. The result, we argue, can be a misinterpretation of the ups and downs in fertility levels in the Bongaarts-Feeney model over the course of the postponement transition (see also Schoen 2004). Our preliminary work, discussed in Supplementary Appendix 6, is supportive of Kohler and Philipov's (2001) earlier results that differential period postponement by age can have a potentially large impact on the Bongaarts-Feeney measure.30 9. Conclusions We asked at the beginning of this paper if the era of lowest-low fertility has ended. Our answer, to sum up, is “yes”: it appears that the widespread decline in period 29 An area for future research is to study this variation across populations and regions in the pace of postponement and in equilibrium timing of birth. This will be possible when more countries have gone through the entire transition. 30 Our findings differ from those of Yi and Land (2001), who found that the Bongaarts-Feeney method was quite robust to violations of the constant-shape assumption. See Kohler and Philipov (2001) for a discussion.
23
fertility to extreme low levels that began in many parts of Europe and in East Asia in the early 1990s is nearly over, at least in Europe. The clear message coming from our analysis confirms what Morgan (2003: 599) proposed in his PAA presidential address: “lowest-low fertility is not our inevitable destination and demise.” In Europe, from the Atlantic to the Urals, there was only one lowest-low fertility country left—Moldova—as of 2008.31 In Eastern Asia, Hong Kong, Korea and Taiwan still recorded fertility rates below 1.2 in 2008, but Japan’s TFR has risen above the 1.3 threshold. Many parts of China, most of them well above the size of an average European country, probably retain sustained lowest-low fertility, but reliable data are unavailable and lowest-low fertility there is largely ‘dictated’ by strict government policies promoting one-child families. The increases in fertility between the year when the TFR dropped to the lowest point and 2008 have ranged from slight to substantial (0.63 in East Germany, 0.35-0.45 in Bulgaria, the Czech Republic, Estonia, Latvia, Russia, and Ukraine). The average fertility in formerly lowest-low countries is now slightly above 1.4. This is still a very low fertility level, however, and it suggests neither an end of sub-replacement fertility across most of the developed world nor a disappearance of considerable regional variation in low fertility. If anything, the cross-country differences have actually broadened as many of the ‘higher-fertility’ developed countries have also seen substantial increases in the period TFR since the late 1990s. This is a new and rather unexpected situation; for the first time since the baby-boom period of the 1960s there has been a parallel increase in the period TFR across the whole developed world. A few industrialized countries, including the United States, achieved the TFR levels around the replacement threshold, last recorded in the 1970s. This evidence even lays some ground for an upbeat interpretation of the future fertility in the most developed countries: Myrskylä et al. (2009) proposed that in these countries further development may stimulate a modest increase in their fertility. For most of the formerly lowest-low countries, the era of sub-1.30 TFR is behind them because the ‘postponement transition’ has begun to run its course and, for the time being, the fear of an accelerated downward spiral of fertility seems unsubstantiated. In many former communist countries of Eastern Europe, especially those of the former Soviet Union, a rapid fall and a subsequent steady increase in the TFR could also be associated with the effects of the serious economic and social crises of the 1990s and their later partial recovery from these crises. Postponement still continues in almost all developed countries but at a decelerating pace. The importance of tempo effect for explaining lowest-low fertility, illustrated also by exceptionally low levels of first-order total fertility, has three important implications. First, an extended re-emergence of lowest-low fertility is likely to require a new acceleration, not just a continuation, of postponement. Second, lowest-low fertility countries still have room for fertility to increase as postponement continues to slow and eventually, some day, to stop. Completed cohort fertility rates of younger women in lowest-low countries will not be known for some time, but the fertility of cohorts born about 1970 tends to be above 1.5 children per women in nearly every case. We expect nearly all lowest-low countries to have completed cohort fertility rates in the 1.5 to 1.8 range. Third, although lowest-low fertility countries have many features 31 Moldova has experienced massive emigration in the last 15 years and it is estimated that up to one quarter of its population has lived, at least temporarily, abroad (IOM (2008) cites an estimate of the number of emigrants of 16.% for 2005). Therefore, the official fertility data should be taken with caution. It is well possible that Moldova’s lowest-low fertility is an artefact of computing fertility rates on the basis of ‘inflated’ population data which do not properly account for emigration.
24
contributing to their low fertility, distinguishing them from their neighbors that never recorded such low total fertility rates, none of them would had experienced longer spells of lowest-low fertility without a decisive downward push provided by tempo effects. The period of lowest-low fertility typically lasted less than a dozen years. The rather short-lived nature of lowest-low fertility is consistent with what we would expect from a ‘postponement transition’ from early to late childbearing, and the accompanying depression in period fertility that comes from tempo effects. Moreover, the postponement transition appears to consist of an acceleration and deceleration of postponement over its course. Judging from cross-national observations, the amount of time that a population with cohort fertility of 1.6 would have a period TFR less than 1.3 is between one and two decades. Although postponement can last for three or four decades, perhaps even five, the period of rapid postponement is much shorter. What would it take for fertility rates to fall once again? With the world experiencing a wide-spread economic crisis, birth rates could fall again in many of the formerly lowest-low fertility countries. For countries that are still close to the threshold of the TFR of 1.3, this could mean another fall below this level. We expect, however, this fall in fertility, if it occurs, to be temporary, lasting as long as the crisis permits but not inducing the resurgence of long-term fertility postponement in the form of a ‘second postponement transition’. Indeed, since the end of lowest-low fertility corresponds not to an end in postponement but rather to a reduction in the pace of postponement, almost all of the formerly lowest-low countries continue to have tempo-adjusted fertility rates that are higher than observed fertility. Unless these are due to artifacts in the measurement of tempo-adjusted fertility, there is still plenty of room for fertility to rise in of these countries even after they cross the 1.30 TFR line. We saw that economic conditions, as captured by declining unemployment rates, correlated with an end of lowest-low fertility. Pronatalist policy perhaps has played a role in some cases of recent TFR recovery as well, although its influence cannot be easily quantified. A clear result of lowest-low fertility is a change in the attitude of governments, with an almost universal concern that national fertility was ‘too low’ emerging among lowest-low countries. In some countries, recent fertility increase is plausibly linked to specific government policies, while in others the turnaround in fertility occurred only after repeated and rather fruitless rounds of pronatalist benefits and urgings. The role of migration—highlighted by Billari (2008) in the case of Italy—was to us a plausible factor in the increase of fertility in Greece, Italy, and Spain. However, our analysis suggests that although migration played the expected effect of increasing fertility in these countries, this effect was not large, although it helped to push Greek and Italian TFR slightly above the lowest-low threshold around 2005. In Spain, the one country where we were able to look at trends in the fertility of the native-born, we saw that fertility was also increasing among the native born. Migration of higher-fertility migrants was clearly not a universal factor in the end of lowest-low fertility, as made clear from the many Eastern European and East Asian countries with negligible migration. Even in the Mediterranean countries, the end of lowest-low fertility looks as if it would have eventually occurred even among the native
25
population, but migrants can help sustaining higher fertility there and in other parts of Europe in the coming decades Our brief analyses of the TFR rise in the ‘higher-fertility’ developed countries shows broad similarities with the group of ‘lowest-low fertility’ countries in the underlying factors of increasing fertility. In all the ‘higher-fertility’ countries that we analyzed, disappearing tempo effects were a major factor in the increase of the TFR.. In some—but not all—of them, other of our analyzed explanations are important as well. Obviously, the rise in fertility all over the Europe, in Eastern Asia, in North America as well as in Australia and New Zealand resulted from the mutual effect of a whole set of factors, including economic growth, pronatalist and family-related policies, declining tempo distortions in fertility, higher immigrants’ fertility in some cases, and also other factors that are not analyzed here. We analyzed these factors in separation and cannot easily separate one from another. The major difference between the ‘ever lowest-low” and ‘never lowest-low’ fertility countries was either in the underlying lower fertility level (net of tempo effect) in the former group (especially in Southern Europe, Eastern Europe and East Asia), or the more intensive postponement of childbearing and stronger tempo effects in the former group (especially Central Europe), or a combination of both factors (especially during the period of lowest-low fertility). The end of wide-spread levels of extremely low fertility does not mean an end to the need to research fertility trends in the developed world. Here we list some of the topics we feel need more study. First, we have seen here that in many countries there appears to have been a strong relationship between economic trends and fertility. This is not generally what has been found for earlier periods (Ermisch 1990). More needs to be known about the relationship between economic conditions and fertility, including whether births are postponed during difficult economic times or foregone altogether. A further issue here is whether fertility policies such as generous paid-parental leave for employed mothers may strengthen the pro-cyclical nature of fertility, depending on the ease or difficulty of obtaining full-benefit employment (Adserà 2004). Second, more demographic modeling work needs to be done on the issue of cohort postponement and recuperation and the measurement of tempo effects. The recent increase in the TFR can be largely interpreted as a cohort-driven process: while younger cohorts of women born in the late 1970s and the early 1980s gradually ceased postponing childbearing to ever-later ages, somewhat older cohorts born in the early and mid-1970s continued showing signs of a recuperation of their previously postponed fertility. This combination of a stabilization of fertility rates among women below age 28 and a continuous increase in fertility rates among women past age 28 has produced much of the observed rise in the TFR (Frejka and Sardon 2009 (see this paper for a detailed discussion of recent cohort fertility trends)). Cohort postponement even with constant completed cohort fertility can produce the illusion of large fluctuations in period quantum as measured by the Bongaarts-Feeney tempo-adjusted TFR. This ‘recuperation’ process needs to be studied formally in more detail, and the BF period-postponement framework needs to be expanded to include the possibility of cohort postponement. Ideally, demographers would figure out ways to distinguish between these two kinds of postponement empirically.
26

Third, more research should be conducted on alternative period fertility indicators that can complement and even substitute the total fertility rate which is so strongly affected by tempo distortion and therefore can give very misleading signals about fertility levels, trends and cross-country differences (Ní Bhrolcháin 1992, Sobotka and Lutz 2009). Fourth, the consequences of the era of lowest-low fertility need to be studied. In terms of the number of births during these years the question of how much of the decline was due to tempo is largely irrelevant. The reality is that generations of small cohorts were born in a large number of countries around the world. What will be the consequences of smaller generation size for education, labor markets, partnership, and parenthood, and also for the size of future generations resulting from somewhat higher fertility rates? Some final words of caution are also in order. First, there is a chance that the current study of low-fertility which includes data through 2008 may prove to have been a temporary high-water mark and that the current economic crisis will be large enough to restart the trend toward low period fertility. We would be surprised by this, but it is still possible. Second, we have largely emphasized the role of postponement in creating extremely low period fertility rates and setting ground for the recent fertility increase. But the reader should also keep in mind that the long-term determinant of fertility levels will be changes in fertility quantum, namely cohort fertility. We are confident that cohort fertility levels in the analyzed countries will be substantially higher than lowest-low period fertility rates. However, cohort fertility of women born in the 1970s will be lower than in the past, and it is not impossible that it will continue to decline in many countries. With these caveats in mind, we feel that the bulk of evidence to date points to a recovery of period fertility well above lowest-low levels. The mainstream forecasting agencies such as the United Nations and Eurostat are likely to be right in their prediction that the TFR levels in most countries will rise close to 1.5 or even above in the decades ahead. Fears of population implosion based on a continuation of fertility rates from the 1990s are not justified.
Acknowledgements This paper has been presented at the 2009 Annual Meeting of the Population Association of America in Detroit, 30 April – 2 May 2009 and at the XXVI IUSSP International Population Conference of the IUSSP in Marrakech, Morocco, 27 September-2 October 2009. We are thankful to session organizers, Hans-Peter Kohler and Francesco Billari, as well as to session participants for their valuable comments and suggestions. Many thanks are also due to many colleagues who have read and commented on this paper with a degree of enthusiasm, especially John Bongaarts, Ron Lesthaeghe, Wolfgang Lutz, Tomas Frejka, and Kryštof Zeman. Finally, the editors of the Population and Development Review provided many useful suggestions that made this paper publishable and also more readable.
27
REFERENCES Adserà, A. 2004. Changing fertility rates in developed countries. The impact of labor market
institutions. Journal of Population Economics 17: 17-43. Adserà, A. 2005. Vanishing children: From high unemployment to low fertility in developed
countries. American Economic Review, Papers and Proceedings, 95(2): 189-193. Andersson, G. 2004. “Childbearing after migration: fertility patterns of foreign-born women
in Sweden.” International Migration Review 38(2): 747–775. Australian Bureau of Statistics. 2008. Births, Australia, 2007. Retrieved on 24-02-2009 from
http://www.abs.gov.au/AUSSTATS/[email protected]/DetailsPage/3301.0 2007?OpenDocument
Avdeev A., Monnier A. 1995. A Survey of Modern Russian Fertility. Population: An English Selection 7: 1-38.
Baizán, P., F. Michielin, and F.C. Billari. 2002. “Political economy and life course patterns: The heterogeneity of occupational, family, and household trajectories of young Spaniards”. Demographic Research 6, Article 8: 191-240. [www.demographic-research.org].
Barkalov, N. B. 2005. “Changes in the quantum of Russian fertility during the 1980s and early 1990s.” Population and Development Review 31(3): 545-556.
Boling, P. 2008. “Demography, culture and policy: Understanding Japan’s low fertility.” Population and Development Review 34(2): 307-326.
Bongaarts, J. 2001. “Fertility and reproductive preferences in post-transitional societies”. In.: R. A. Bulatao, J. B. Casterline (eds.) Global fertility transition. Supplement to Population and Development Review 27, New York, Population Council, pp. 260-281.
Billari, F.C. 2008. Lowest-low fertility in Europe: Exploring the causes and finding some surprises. Japanese Journal of Population 6(1): 2-18.
Billari, F. C. and H.-P. Kohler. 2004. “Patterns of low and very low fertility in Europe”. Population Studies 58 (2): 161-176.
Bongaarts, J. 2002. “The end of the fertility transition in the developed world”. Population and Development Review 28 (3): 419-443.
Bongaarts, J. and G. Feeney. 1998. “On the quantum and tempo of fertility”. Population and Development Review 24 (2): 271-291.
Bongaarts, J. and G. Feeney. 2000. “On the quantum and tempo of fertility: Reply”. Population and Development Review 26 (3): 560-564.
Bratti, M. and K. Tatsiramos, K. 2008. “Explaining how delayed motherhood affects fertility dynamics in Europe.” IZA DP No. 3907, Institute for the Study of Labour, Bonn.
Caltabiano, M. 2008. “Has the fertility decline come to an end in the different regions of Italy? New Insights from a cohort approach.” Population-E 63(1): 157-172.
Castiglioni, M. and G. Dalla Zuanna. 2009. “Marital and reproductive behavior in Italy after 1995: Bridging the gap with Western Europe?” European Journal of Population 25(1): 1-26.
Castles, F.G. 2003. “The world turned upside down: below replacement fertility, changing preferences and family-friendly public policy in 21 OECD countries.” Journal of European Social Policy, 13 (3): 209–227.
Census and Statistics Department. 2007. Hong Kong Population Projections 2007-2036. Hong Kong. Accessed in June 2009 at
[http://www.statistics.gov.hk/publication/stat_report/population/B1120015032007XXXXB0200.pdf]
Chesnais, J.-C. 2001. “Comment: A march toward population recession”. In.: R. A. Bulatao and J. B. Casterline (eds.) Global Fertility Transition, supplement to Population and Development Review 27: 255-259.
Coleman, D. 2006. “Immigration and ethnic change in low-fertility countries: a third demographic transition?” Population and Development Review 32(3): 401–446.
28
Conrad C., M. Lechner, and W. Werner. 1996. “East German fertility after unification: Crisis or adaptation?” Population and Development Review 22 (2): 331-358.
Dalla Zuanna, G. 2001. “The banquet of Aeolus: A familistic interpretation of Italy’s lowest-low fertility”. Demographic Research 4, Article 5: 133-161. [www.demographic-research.org].
Delgado, M., Meil, G., and López, F.Z. 2008. “Spain: Short on children and short on family policies. Demographic Research, Special Collection 7, 19(27): 1059–1104. [http://www.demographic-research.org/volumes/vol19/27/19-27.pdf].
Dorbritz, J. and K. Ruckdeschel. 2007. “Kinderlosigkeit in Deutschland – Ein europäischer Sonderweg? Daten, Trends, un Gründe.“ In: D. Konietzka and M. Kreyenfeld (Eds.) Ein Leben Ohne Kinder. Kinderlosigkeit in Deutschland, pp. 45-81.
Ermisch, J. 1990. “European women's employment and fertility again.” Journal of Population Economics 3-18.
European Commission. 2005. Green Paper “Confronting demographic change: a new solidarity between the generations.” Brussels, Commission of the European Communities. [http://ec.europa.eu/employment_social/news/2005/mar/comm2005-94_en.pdf].
Eurostat. 2006. Population statistics. 2006 edition. Luxembourg: Office for official Publications of the European Communities.
Eurostat. 2008b. “Population in Europe 2007. First results.” Statistics in Focus, Population and Social Conditions, 81/2008, Luxembourg: European Communities.
Eurostat. 2009a. Population and Social Conditions. Online database accessed in February and March 2009 at [http://epp.eurostat.ec.europa.eu].
Eurostat. 2009b. The EU-27 population continues to grow. Data in Focus, 31/2009, Eurostat. Accessed at http://epp.eurostat.ec.europa.eu/cache/ITY_OFFPUB/KS-QA-09-031/EN/KS-QA-09-031-EN.PDF
Frejka, T. 2008. “Determinants of family formation and childbearing during the societal transition in Central and Eastern Europe.” Demographic Research 19(7): 139-170.
Frejka, T. and J.-P. Sardon. 2004. Childbearing trends and prospects in low-fertility countries. Volume 13, European Studies of Population, Kluwer Academic Publishers, Dordrecht.
Frejka, T. and J.-P. Sardon. 2006. “First birth trends in developed countries: persistent parenthood postponement.” Demographic Research 15(6): 147-180
Frejka, T. and J.-P. Sardon. 2009. “Contemporary childbearing trends in low-fertility countries.” Paper presented at the XXVI IUSSP International Population Conference of the IUSSP in Marrakech, Morocco, 27 September-2 October 2009.
Frejka, T. and T. Sobotka. 2008. “Fertility in Europe: Diverse, delayed and below replacement.” Overview Chapter 1 in: T. Frejka et al. (eds.) Childbearing trends and policies in Europe. Demographic Research, Special Collection 7, Vol. 19(3): 15-46.
Gabrielli, G., A. Paterno, and S. Strozza. 2007. “Dynamics, characteristics, and demographic behaviour of immigrants in some south-European countries.” Paper presented at an international conference on “Migration and Development,” Moscow 13–15 September 2007.
Gauthier, A.H. 1996. The State and the Family: A Comparative Analysis of Family Policies in Industrialized Countries. Oxford: Clarendon Press, 1996.
Gauthier, A.H. 2000. Public Policies Affecting Fertility and Families in Europe: A Survey of the 15 Member States. Paper prepared for the European Observatory on family Matters; Annual Seminar 2000: “Low Fertility, Families and Public Policies. Sevilla, Spain, 15-16 September 2000.
Gauthier, A.H. 2002. Family Policies in Industrialized Countries: Is There Convergence? Population (English Edition) 57(3): 447-474.
Gauthier, A.H. 2007. The impact of family policies on fertility in industrialized countries: a review of the literature. Population Research and Policy Review 26: 232-346.
29
Gauthier, A.H., Hatzius, J. 1997. Family Benefits and Fertility: An Econometric Analysis. Population Studies 54(3): 295-306.
Goldstein J.R. 2006. “How late can first births be postponed? Some illustrative population-level calculations.” Vienna Yearbook of Population Research 2006, pp. 153-165.
Golini, A. 1998. “How low can fertility be? An empirical exploration.” Population and Development Review 24(1): 59-73.
Gu, B., F. Wang, Z. Guo, and E. Zhang. 2007. “China’s local and national fertility policies at the end of the Twentieth century.” Population and Development Review 33(1): 129-147.
Hajnal, J. 1947. “The analysis of birth statistics in the light of the recent international recovery of the birth-rate”. Population Studies 1 (2): 137–164.
Hantrais, L. 1997. Exploring Relationships between Social Policy and Changing Family Forms within the European Union. European Journal of Population 13: 339-379.
Haug, W., P. Compton, and Y. Courbage (Eds.). 2002. The Demographic Characteristics of Immigrant Populations. Population Studies, No. 38, Strasbourg: Council of Europe Publishing.
Héran, F., and G. Pison. 2007. “Two children per woman in France in 2006: are immigrants to blame?” Population and Societies 432 (March 2007): 1-4.
INE. 2009a. Población (españoles/extranjeros) por edad (año a año), sexo y año (1998-2006) Madrid: Instituto National de Estadística. Downloaded 20 February 2009 at <http://www.ine.es/jaxi/tabla.do?path=/t20/e245/p08/l0/&file=01003.px&type=pcaxis&L=0>
INE. 2009b. Nacimientos. Año 2006 (2002, 1998). Nacimientos de padre o madre extranjera. Madrid: Instituto National de Estadística. Downloaded 20 February 2009 at <http://www.ine.es/jaxi/tabla.do?type=pcaxis&path=/t20/e301/nacim/a2006/l0/&file=05002.px>.
INE. 2009c. Número medio de hijos por mujer. Total nacional y comunidades autónomas, 1975-2007. Downloaded 21 April 2009 at [http://www.ine.es/jaxiBD/tabla.do?per=12&type=db&divi=IDB&idtab=11].
INSPQ. 2008. Data on total fertility rate in Quebec, 1981 to 2006 accessed at <http://www.inspq.qc.ca/Santescope/element.asp?Lg=en&NoEle=205>.
IOM. 2008. Migration in Moldova:A Country Profile. International Organization for Migraton. Accessed at: <http://www.iom.md/materials/moldova_migration_profile_april_2008.pdf>.
ISTAT. 2008. Rilevazione degli iscritti in anagrafe per nascita 2006. Roma: Instituto nazionale di statistica. Accessed at: <http://demo.istat.it/altridati/IscrittiNascita/index.html>.
ISTAT. 2009a. Regional fertility levels in 1952-2004 downloaded at GeoDemo database, accessed 12 March 2009 at [http://demo.istat.it/fecondita/index.html].
ISTAT. 2009b. Indicatori demografici – anno 2008. Table 4 accessed 21 April 2009 at [http://demo.istat.it/altridati/indicatori/2008/Tab_4.pdf].
ISTAT. 2009c. Rilevazione degli iscritti in anagrafe per nascita 2007. Roma: Instituto nazionale di statistica. Accessed 21 April 2009 at: [http://demo.istat.it/altridati/IscrittiNascita/index.html].
Iwasawa, M and R. Kaneko. 2007. “Trends in partnership behaviours in Japan from the cohort perspective.” Paper presented at the joint Eurostat /UNECE Work Session on Demographic Projections, Bucharest, 10-12 October 2007. Accessed at <http://www.unece.org/stats/documents/ece/ces/ge.11/2007/wp.11.e.pdf>.
Kaneko, R., A. Ishikawa, F. Ishii, T. Sasai, M. Iwasawa, F. Mita, and R. Moriizumi. 2008. “Population projections for Japan: 2006-2055. Outline of results, methods, and assumptions.” The Japanese Journal of Population 6(1): 76-114.
Kaneko, R., A. Ishikawa, F. Ishii, T. Sasai, M. Iwasawa, F. Mita, and R. Moriizumi. 2009. “Commentary to population projections for Japan—A supplement to report of the 2006 revision.” The Japanese Journal of Population 7(1): 1-46.
30
Keyfitz, N. 1993. A review of the book by H. Le Brass (Marianne et les lapins: l’obsession démographique). Population and Development Review 19(2): 365-374.
Kohler, H.-P. 2001. Fertility and social interaction: an economic perspective. Oxford: Oxford University Press, 176 p.
Kohler, H.-P., F. C. Billari, and J. A. Ortega. 2002. “The emergence of lowest-low fertility in Europe during the 1990s”. Population and Development Review 28(4): 641-680.
Kohler, H.-P., F. C. Billari, and J. A. Ortega. 2006. “Low fertility in Europe: Causes, implications and policy options.” In F.R. Harris (Ed.) The Baby Bust: Who will do the Work? Who Will Pay the Taxes? Lanham, MD: Rowman & Littlefield Publishers, pp. 48-109.
Kohler H.-P. and Philipov D. 2001. Variance Effects in the Bongaarts-Feeney Formula. Demography 38 (1): 1-16.
Kravdal, Ø. 2002. The impact of individual and aggregate unemployment on fertility in Norway. Demographic Research 6(10): 263-294.
Kreyenfeld, M. and D. Konietzka. 2007. “Kinderlosigkeit in Deutschland – theoretische Probleme und empirische Ergebnisse.“ In: D. Konietzka and M. Kreyenfeld (Eds.) Ein Leben Ohne Kinder. Kinderlosigkeit in Deutschland, pp. 11-41.
Lattimore, R. and Pobke, C. 2008. Recent Trends in Australian Fertility. Productivity Commission Staff Working Paper, Canberra. <http://www.pc.gov.au/research/staffworkingpaper/fertility-trends>.
Lesthaeghe, R. 2001. “Postponement and recuperation: Recent fertility trends and forecasts in six Western European countries.” IPD Working Paper 2001-1, Interface Demography, VUB, Brussels.
Lesthaeghe R. and Willems P. 1999. Is Low Fertility a Temporary Phenomenon in the European Union? Population and Development Review 25(2): 211-228.
Longman, P. 2004. The empty cradle. How falling birthrates threaten world prosperity [and what to do about it]. Basic Books, New York.
Lutz, W., B. C. O’Neill, and S. Scherbov. 2003. “Europe’s population at a turning point”. Science 299: 1991–1992.
Lutz, W., S. Scherbov, G.Y. Cao, and X. Zheng. 2007. “China’s uncertain demographic present and future.” Vienna Yearbook of Population Research 2007: 37-59.
Lutz W. and Skirbekk V. 2005. Policies Addressing the Tempo Effect in Low-Fertility Countries. Population and Development Review 31(4): 703-725.
Lutz W., Skirbekk V., and Testa M.R. 2006. The Low-Fertility Trap Hypothesis: Forces that May Lead to Further Postponement and Fewer Births in Europe. Vienna Yearbook of Population Research 2006: 167-192.
McDonald, P. 2000. “Gender equity, social institutions and the future of fertility”. Journal of Population Research 17 (1): 1-15.
McDonald, P. 2002. “Sustaining fertility through public policy: The range of options”. Population-E 57 (3): 417-446.
McDonald, P. 2006. “Low fertility and the state. The efficacy of policy.” Population and Development Review 32(3): 485-510.
McDonald, P. 2006a. An Assessment of Policies that Support Having Children from the Perspectives of Equity, Efficiency and Efficacy. Vienna Yearbook of Population Research 2006: 213-234.
Morgan, P. S. 2003. “Is low fertility a twenty-first century demographic crisis?” Demography 40(4): 589-603.
Morgan, S.P., G. Zhigang, and S.R. Hayford. 2009. “China’s below-replacement fertility: Recent trends and future prospects.” Population and Development Review 35(3): 605-629.
Myrskylä, M., H.-P. Kohler, and F.C. Billari. 2009. “Advances in development reverse fertility declines.” Nature 460: 741-743.
NBS. 2007. Fertility estimates for provinces of China, 1975-2000. National Bureau of Statistics of China, Beijing and East-West Centre, Honolulu, United States. Accessible
31
at <http://www.eastwestcenter.org/fileadmin/stored/pdfs/popfertilityestimateschina.pdf>.
Neyer, G. 2003. Family Policies and Low Fertility in Western Europe. MPIDR Working Paper WP 2003-021, July 2003.
Ní Bhrolcháin, M. 1992. “Period paramount? A critique of the cohort approach to fertility”. Population and Development Review 18 (4): 599-629.
Nie, Y. And Wyman, R.L. 2005. “The one-child policy in Shanghai: Acceptance and internalization.” Population and Development Review 31(2): 313-336.
OECD. 2003. Babies and bosses. Reconciling work and family life. Vol. 2: Austria, Ireland and Japan. Organisation for Economic Co-operation and Development, Paris.
OECD. 2007. Babies and Bosses: Reconciling Work and Family Life. A Synthesis of Findings for OECD Countries. Paris: OECD.
OECD. 2008. “Impact of the economic crisis on employment and unemployment in the OECD countries.” Online report accessed 21 April 2009 at
OECD. 2009. OECD Interim Economic Outlook, March 2009. Accessed 21 April 2009 at [http://www.oecd.org/dataoecd/18/1/42443150.pdf].
Ogawa, N. 2003. Japan’s Changing Fertility Mechanisms and Its Policy Responses. Journal of Population Research 20(1): 89-106.
ONE. 2008. Anuario Demográfico de Cuba 2007. Chapter 2. Oficina Nacional de Estadistica. Accessed in January 2009 at <http://www.one.cu/ >.
ONS. 2008. “Rise in fertility continues” A brief report published 21 August 2008, Office of National Statistics, London. Available at: <http://www.statistics.gov.uk/cci/nugget.asp?ID=951>.
PDR. 2006. “Vladimir Putin on raising Russia’s birth rate.” Population and Development Review 32(2): 385-389.
Perelli-Harris, B. 2005. ‘The path to lowest-low fertility in Ukraine.” Population Studies 59(1): 55-70.
Philipov, D. and A. Jasilioniene. 2008. “Union formation and fertility in Bulgaria and Russia. A life table description of recent trends” Demographic Research 19(62): 2057-2114.
Raymo, J. 1998. “Later marriages or fewer? Changes in the marital behaviour of Japanese women.” Journal of Marriage and the Family 60(4): 1023-1034
Retherford, R.D., M.K. Choe, L. Xiru, and C. Hongyan. 2005. “How far has fertility in China really declined?” Population and Development Review 31(1): 57-84.
Retherford, R. and N. Ogawa. 2006. “Japan’s baby bust: Causes, implications, and policy responses.” Chapter 1 in: F.R. Harris (ed.) The baby bust. Who will do the work? Who will pay the taxes? Lanham (Maryland): Rowman & Littlefield Publishers, pp. 5-47.
Retherford, R. R., N. Ogawa, R. Matsukura. 2001. “Late marriage and less marriage in Japan.” Population and Development Review 27(1): 65-102.
Reher, D.S. 2007. “Towards long-term population decline: A discussion of relevant issues.” European Journal of Population 23: 189-207.
Roig Vila, M. and T. Castro Martín. 2007. “Childbearing patterns of foreign women in a new immigration country: The case of Spain.” Population-E 62(3): 351-380.
Rosina, A. and R. Fraboni. 2004. “Is marriage losing its centrality in Italy?” Demographic Research 11(6): 149-172.
Rostgaard, T. 2004. Family Support Policy in Central and Eastern Europe - A Decade and a Half of Transition. Early Childhood and Family Policy Series No 8 – 2004. Copenhagen: The Danish National Institute of Social Research.
Ryder, N.B. 1956. Problems of trend determination during a transition in fertility. Milbank Memorial Fund Quarterly 34: 5-2 1.
Ryder, N.B. 1964. The Process of Demographic Translation. Demography 1 (1): 74-82. Ryder, N.B. 1990. “What is going to happen to American fertility?”. Population and
Development Review 16 (3): 433-454. Sardon, J.-P. 2006. “Recent demographic trends in the developed countries.” Population-E
61(3): 197-266.
32
Schoen, R. 2004. “Timing effects and the interpretation of period fertility.” Demography 41(4): 801-819.
Shirahase, S. 2000. “Women’s increased higher education and the declining fertility rate in Japan.” Review of Population and Social Policy 9: 47-63.
Shriver, L. 2003. “Population in literature.” Population and Development Review 29(2): 153-162.
Sigle-Rushton, W. 2008. “England and Wales: Stable fertility and pronounced social status differences.” Demographic Research, “Special Collection 7: Childbearing Trends and Policies in Europe” 19(15): 455-502.
Simó Noguera, C., Castro Martin, T. and Soro Bonmati, A. 2005. The Spanish case. The effects of the globalization process on the transition to adulthood. In Blossfeld, H.-P., Klijzing, E., Mills, M. and Kurz, K. (Eds) Globalization, Uncertainty and Youth in Society. London.
Sleebos, J. 2003. Low fertility rates in OECD countries: Facts and policy responses. OECD social, employment and migration working papers no.15. Paris, France: OECD.
Sobotka, T. 2003. “Tempo-quantum and period-cohort interplay in fertility changes in Europe. Evidence from the Czech Republic, Italy, the Netherlands and Sweden”. Demographic Research 8(6): 151-213.
Sobotka, T. 2004a. “Is lowest-low fertility explained by the postponement of childbearing?” Population and Development Review 30(2): 195-220.
Sobotka, T. 2004b. Postponement of childbearing and low fertility in Europe. PhD Thesis, University of Groningen. Amsterdam: Dutch University Press.
Sobotka, T. 2005. “Childless societies? Trends and projections of childlessness in Europe and the Unites States” Paper presented at the 2005 PAA Annual Meeting Meeting, Philadelphia, 31 March-2 April 2005.
Sobotka, T. 2008a. “The rising importance of migrants for childbearing in Europe.” Overview Chapter 7 in: T. Frejka et al. (eds.) Childbearing trends and policies in Europe. Demographic Research 19(9): 225-248.
Sobotka, T. 2008b. “Does persistent low fertility threaten the future of European populations?” In: J. Surkyn, P. Deboosere and J. van Bavel and (eds.) Demographic challenges for the 21st Century. A state of art in demography. Brussels: VUBPRESS, pp. 27-89.
Sobotka, T. and W. Lutz. 2009. “Misleading policy messages from the TFR. Should we stop using it?” Forthcoming, European Demographic Research Paper, Vienna Institute of Demography.
Sobotka, T., Šťastná, A., Zeman, K., Hamplová, D., Kantorová, V. 2008. “Czech Republic: A rapid transformation of fertility and family behaviour after the collapse of state socialism.” Demographic Research, “Special Collection 7: Childbearing Trends and Policies in Europe” 19(14): 403-454.
Suzuki, T. 2003. “Lowest-low fertility in Korea and Japan.” Journal of Population problems 59(3): 1-16.
Spengler, J.J. (1932). “The birth rate—potential dynamite.” Scribner’s Magazine 92: 6-12. Reprinted in 1991 in Population and Development Review 17(1): 157-169.
Statistics Denmark. 2004. Befolkningens bevægelser 2003. Vital statistics 2003. Copenhagen: Danmarks Statistik.
Statistics Denmark. 2008. Befolkningens udvikling 2007. Vital statistics 2007. Copenhagen: Danmarks Statistik. Accessed at: <http://www.dst.dk/publikation.aspx?cid=12150>.
Statistics Sweden. 2004. Tabeller över Sveriges befolkning 2003. Statistiska centralbyrån Stockholm: Statistics Sweden.
Statistics Sweden. 2008. Tabeller över Sveriges befolkning 2007. Statistiska centralbyrån Stockholm: Statistics Sweden. Accessed at: <http://www.scb.se/Pages/PublishingCalendarViewInfo____259923.aspx?PublObjId=6636>.
Teitelbaum, M. S. and J. M. Winter. 1985. The fear of population decline. London: Academic Press.
33
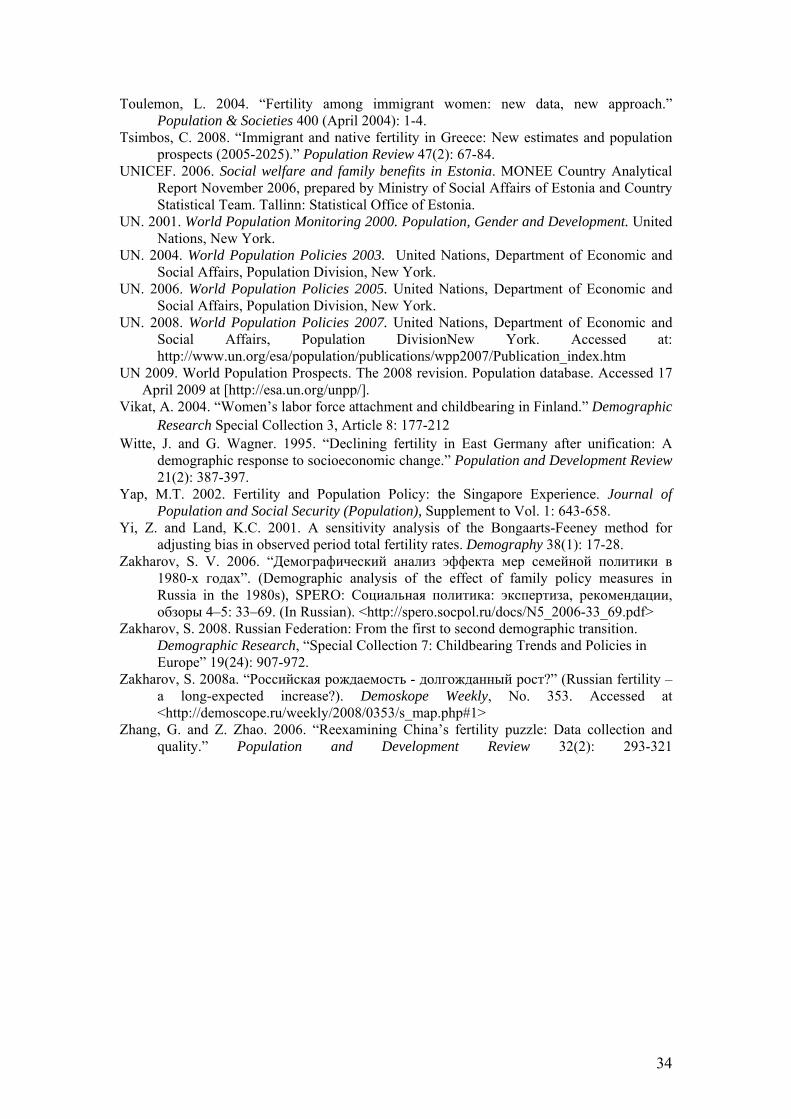
Toulemon, L. 2004. “Fertility among immigrant women: new data, new approach.” Population & Societies 400 (April 2004): 1-4.
Tsimbos, C. 2008. “Immigrant and native fertility in Greece: New estimates and population prospects (2005-2025).” Population Review 47(2): 67-84.
UNICEF. 2006. Social welfare and family benefits in Estonia. MONEE Country Analytical Report November 2006, prepared by Ministry of Social Affairs of Estonia and Country Statistical Team. Tallinn: Statistical Office of Estonia.
UN. 2001. World Population Monitoring 2000. Population, Gender and Development. United Nations, New York.
UN. 2004. World Population Policies 2003. United Nations, Department of Economic and Social Affairs, Population Division, New York.
UN. 2006. World Population Policies 2005. United Nations, Department of Economic and Social Affairs, Population Division, New York.
UN. 2008. World Population Policies 2007. United Nations, Department of Economic and Social Affairs, Population DivisionNew York. Accessed at: http://www.un.org/esa/population/publications/wpp2007/Publication_index.htm
UN 2009. World Population Prospects. The 2008 revision. Population database. Accessed 17 April 2009 at [http://esa.un.org/unpp/].
Vikat, A. 2004. “Women’s labor force attachment and childbearing in Finland.” Demographic Research Special Collection 3, Article 8: 177-212
Witte, J. and G. Wagner. 1995. “Declining fertility in East Germany after unification: A demographic response to socioeconomic change.” Population and Development Review 21(2): 387-397.
Yap, M.T. 2002. Fertility and Population Policy: the Singapore Experience. Journal of Population and Social Security (Population), Supplement to Vol. 1: 643-658.
Yi, Z. and Land, K.C. 2001. A sensitivity analysis of the Bongaarts-Feeney method for adjusting bias in observed period total fertility rates. Demography 38(1): 17-28.
Zakharov, S. V. 2006. “Демографический анализ эффекта мер семейной политики в 1980-х годах”. (Demographic analysis of the effect of family policy measures in Russia in the 1980s), SPERO: Социальная политика: экспертиза, рекомендации, обзоры 4–5: 33–69. (In Russian). <http://spero.socpol.ru/docs/N5_2006-33_69.pdf>
Zakharov, S. 2008. Russian Federation: From the first to second demographic transition. Demographic Research, “Special Collection 7: Childbearing Trends and Policies in Europe” 19(24): 907-972.
Zakharov, S. 2008a. “Российская рождаемость - долгожданный рост?” (Russian fertility – a long-expected increase?). Demoskope Weekly, No. 353. Accessed at <http://demoscope.ru/weekly/2008/0353/s_map.php#1>
Zhang, G. and Z. Zhao. 2006. “Reexamining China’s fertility puzzle: Data collection and quality.” Population and Development Review 32(2): 293-321
34
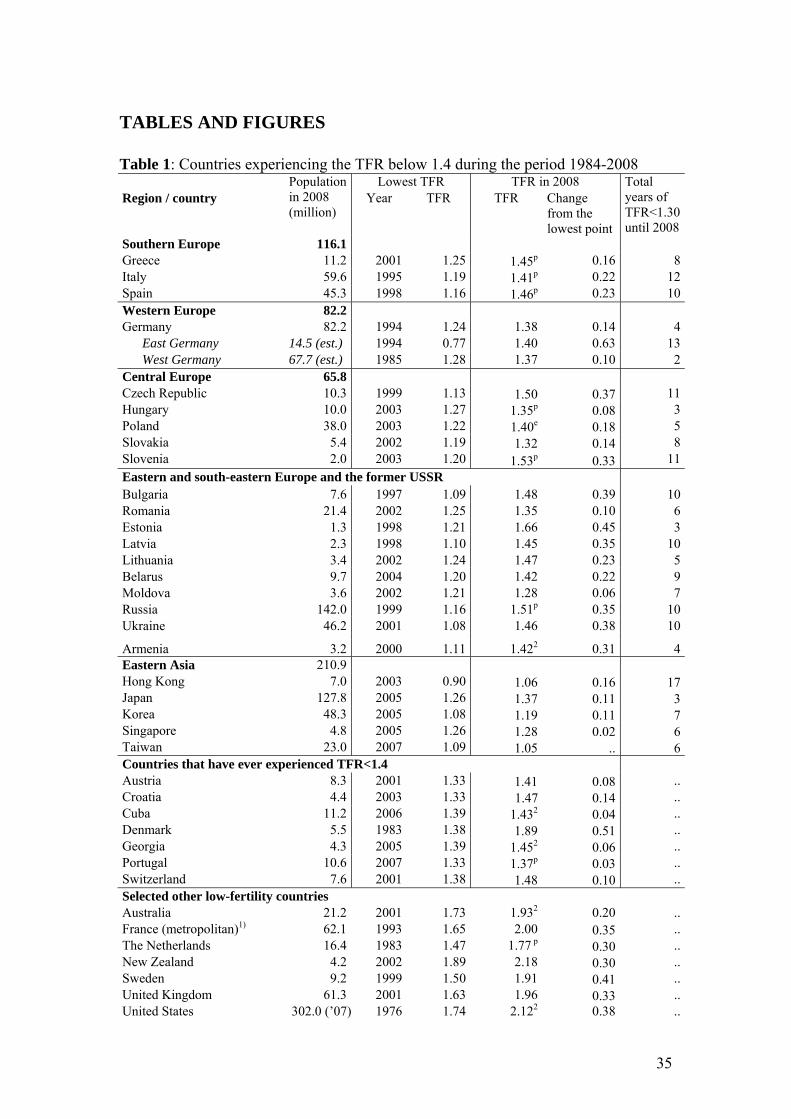
TABLES AND FIGURES Table 1: Countries experiencing the TFR below 1.4 during the period 1984-2008
Lowest TFR TFR in 2008 Region / country
Population in 2008 (million)
Year TFR TFR Change from the lowest point
Total years of TFR<1.30 until 2008
Southern Europe 116.1 Greece 11.2 2001 1.25 1.45p 0.16 8Italy 59.6 1995 1.19 1.41p 0.22 12Spain 45.3 1998 1.16 1.46p 0.23 10Western Europe 82.2 Germany 82.2 1994 1.24 1.38 0.14 4 East Germany 14.5 (est.) 1994 0.77 1.40 0.63 13 West Germany 67.7 (est.) 1985 1.28 1.37 0.10 2Central Europe 65.8 Czech Republic 10.3 1999 1.13 1.50 0.37 11Hungary 10.0 2003 1.27 1.35p 0.08 3Poland 38.0 2003 1.22 1.40e 0.18 5Slovakia 5.4 2002 1.19 1.32 0.14 8Slovenia 2.0 2003 1.20 1.53p 0.33 11Eastern and south-eastern Europe and the former USSR Bulgaria 7.6 1997 1.09 1.48 0.39 10Romania 21.4 2002 1.25 1.35 0.10 6Estonia 1.3 1998 1.21 1.66 0.45 3Latvia 2.3 1998 1.10 1.45 0.35 10Lithuania 3.4 2002 1.24 1.47 0.23 5Belarus 9.7 2004 1.20 1.42 0.22 9Moldova 3.6 2002 1.21 1.28 0.06 7Russia 142.0 1999 1.16 1.51p 0.35 10Ukraine 46.2 2001 1.08 1.46 0.38 10
Armenia 3.2 2000 1.11 1.422 0.31 4Eastern Asia 210.9 Hong Kong 7.0 2003 0.90 1.06 0.16 17Japan 127.8 2005 1.26 1.37 0.11 3Korea 48.3 2005 1.08 1.19 0.11 7Singapore 4.8 2005 1.26 1.28 0.02 6Taiwan 23.0 2007 1.09 1.05 .. 6Countries that have ever experienced TFR<1.4 Austria 8.3 2001 1.33 1.41 0.08 ..Croatia 4.4 2003 1.33 1.47 0.14 ..Cuba 11.2 2006 1.39 1.432 0.04 ..Denmark 5.5 1983 1.38 1.89 0.51 ..Georgia 4.3 2005 1.39 1.452 0.06 ..Portugal 10.6 2007 1.33 1.37p 0.03 ..Switzerland 7.6 2001 1.38 1.48 0.10 ..Selected other low-fertility countries Australia 21.2 2001 1.73 1.932 0.20 ..France (metropolitan)1) 62.1 1993 1.65 2.00 0.35 ..The Netherlands 16.4 1983 1.47 1.77 p 0.30 ..New Zealand 4.2 2002 1.89 2.18 0.30 ..Sweden 9.2 1999 1.50 1.91 0.41 ..United Kingdom 61.3 2001 1.63 1.96 0.33 ..United States 302.0 (’07) 1976 1.74 2.122 0.38 ..
35
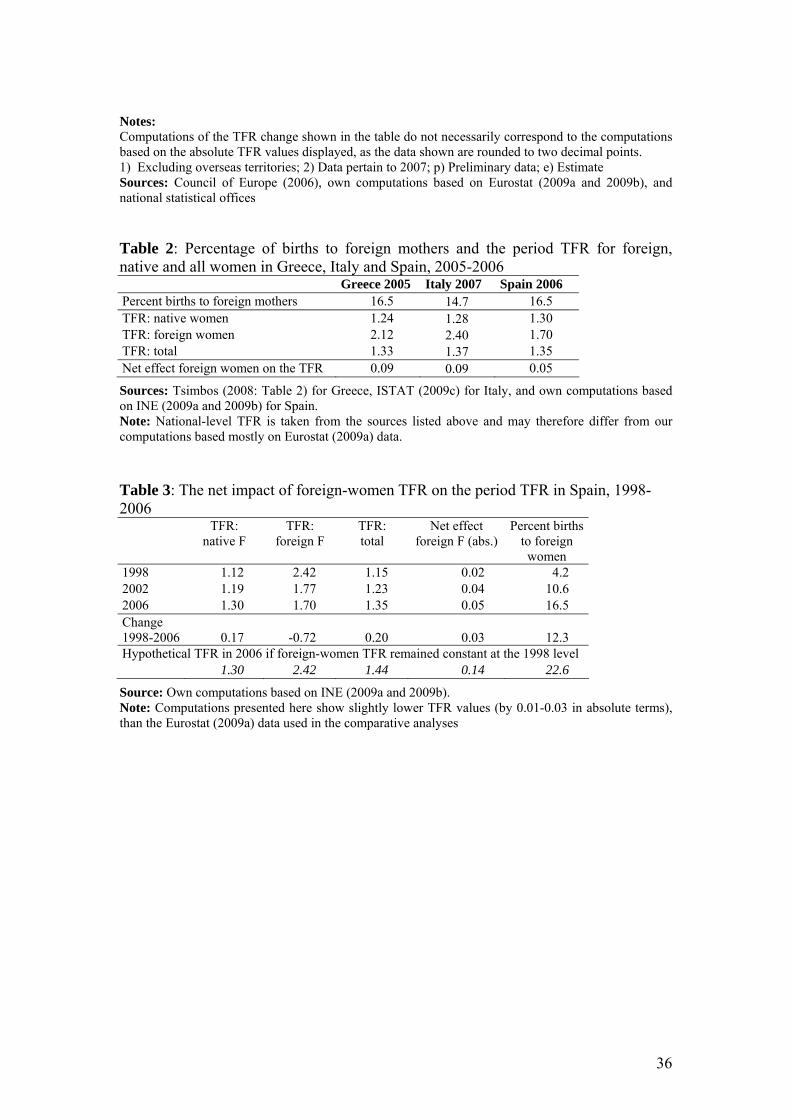
Notes: Computations of the TFR change shown in the table do not necessarily correspond to the computations based on the absolute TFR values displayed, as the data shown are rounded to two decimal points. 1) Excluding overseas territories; 2) Data pertain to 2007; p) Preliminary data; e) Estimate Sources: Council of Europe (2006), own computations based on Eurostat (2009a and 2009b), and national statistical offices Table 2: Percentage of births to foreign mothers and the period TFR for foreign, native and all women in Greece, Italy and Spain, 2005-2006
Greece 2005 Italy 2007 Spain 2006 Percent births to foreign mothers 16.5 14.7 16.5 TFR: native women 1.24 1.28 1.30 TFR: foreign women 2.12 2.40 1.70 TFR: total 1.33 1.37 1.35 Net effect foreign women on the TFR 0.09 0.09 0.05
Sources: Tsimbos (2008: Table 2) for Greece, ISTAT (2009c) for Italy, and own computations based on INE (2009a and 2009b) for Spain. Note: National-level TFR is taken from the sources listed above and may therefore differ from our computations based mostly on Eurostat (2009a) data. Table 3: The net impact of foreign-women TFR on the period TFR in Spain, 1998-2006 TFR:
native F TFR:
foreign F TFR: total
Net effect foreign F (abs.)
Percent births to foreign women
1998 1.12 2.42 1.15 0.02 4.2 2002 1.19 1.77 1.23 0.04 10.6 2006 1.30 1.70 1.35 0.05 16.5 Change 1998-2006
0.17
-0.72
0.20
0.03
12.3
Hypothetical TFR in 2006 if foreign-women TFR remained constant at the 1998 level 1.30 2.42 1.44 0.14 22.6
Source: Own computations based on INE (2009a and 2009b). Note: Computations presented here show slightly lower TFR values (by 0.01-0.03 in absolute terms), than the Eurostat (2009a) data used in the comparative analyses
36
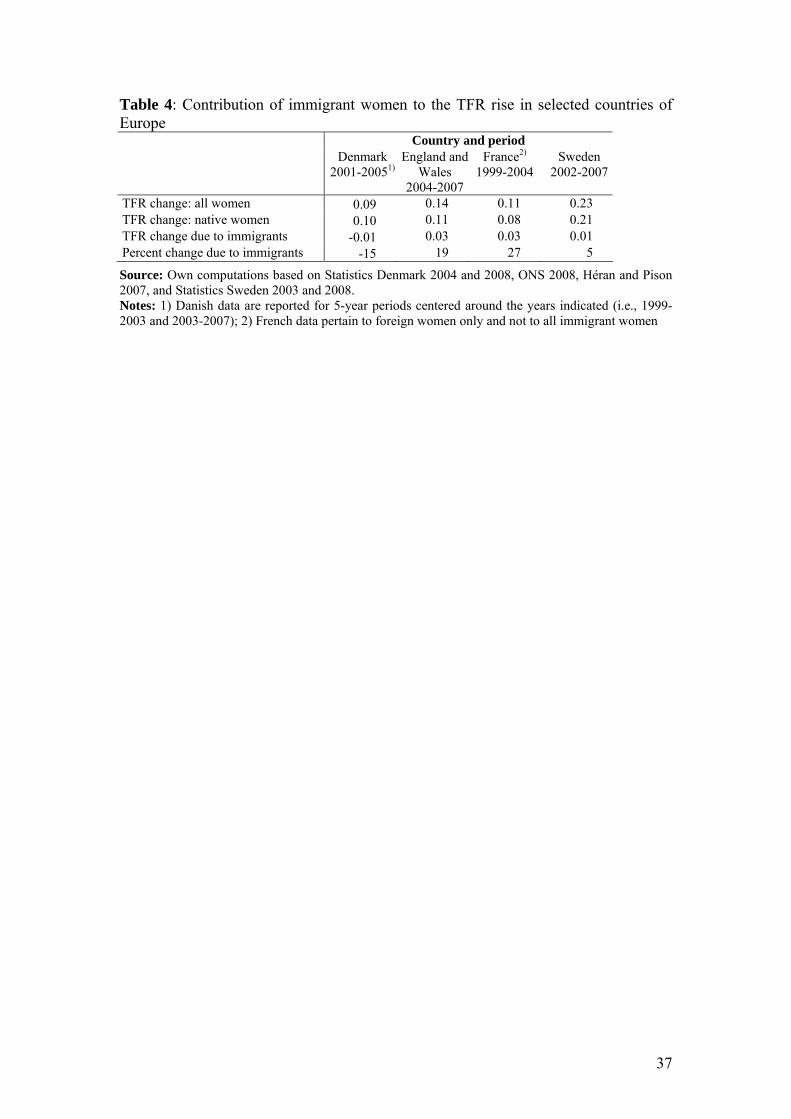
Table 4: Contribution of immigrant women to the TFR rise in selected countries of Europe
Country and period Denmark
2001-20051)England and
Wales 2004-2007
France2) 1999-2004
Sweden 2002-2007
TFR change: all women 0.09 0.14 0.11 0.23 TFR change: native women 0.10 0.11 0.08 0.21 TFR change due to immigrants -0.01 0.03 0.03 0.01 Percent change due to immigrants -15 19 27 5
Source: Own computations based on Statistics Denmark 2004 and 2008, ONS 2008, Héran and Pison 2007, and Statistics Sweden 2003 and 2008. Notes: 1) Danish data are reported for 5-year periods centered around the years indicated (i.e., 1999-2003 and 2003-2007); 2) French data pertain to foreign women only and not to all immigrant women
37
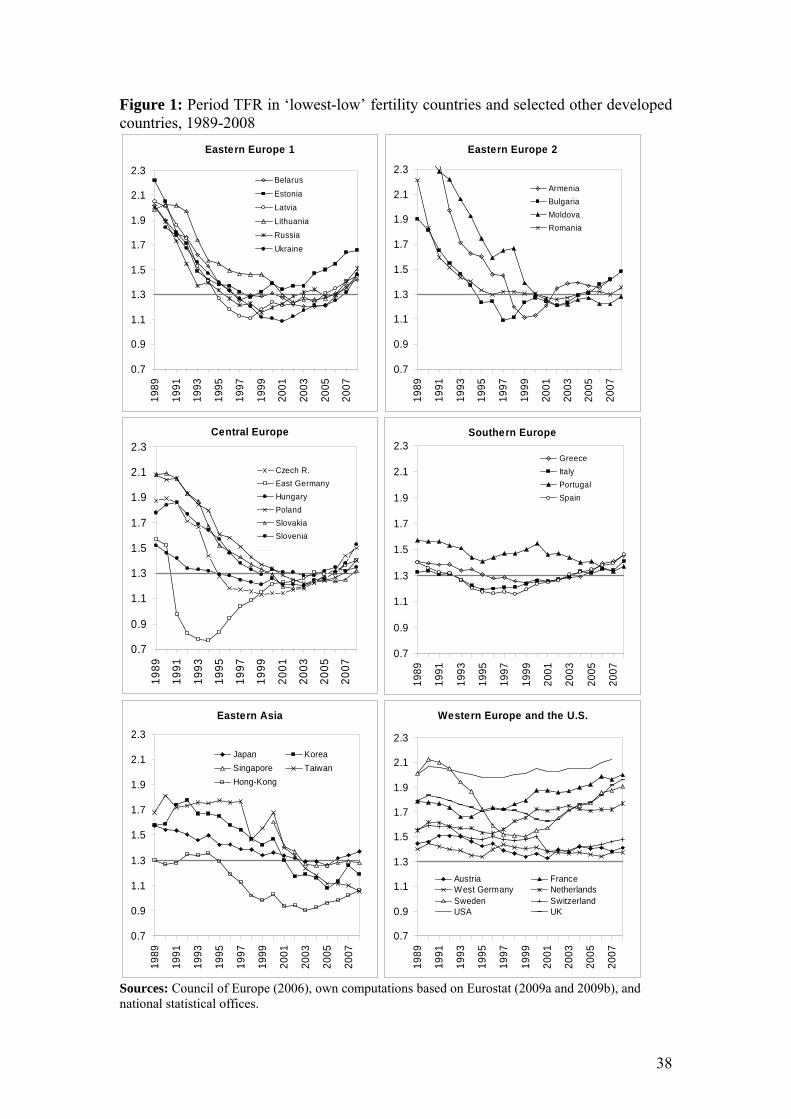
Figure 1: Period TFR in ‘lowest-low’ fertility countries and selected other developed countries, 1989-2008
Central Europe
0.7
0.9
1.1
1.3
1.5
1.7
1.9
2.1
2.3
1989
1991
1993
1995
1997
1999
2001
2003
2005
2007
Czech R.East GermanyHungaryPolandSlovakiaSlovenia
Eastern Europe 1
0.7
0.9
1.1
1.3
1.5
1.7
1.9
2.1
2.319
89
1991
1993
1995
1997
1999
2001
2003
2005
2007
BelarusEstoniaLatviaLithuaniaRussiaUkraine
Eastern Europe 2
0.7
0.9
1.1
1.3
1.5
1.7
1.9
2.1
2.3
1989
1991
1993
1995
1997
1999
2001
2003
2005
2007
ArmeniaBulgariaMoldovaRomania
Southern Europe
0.7
0.9
1.1
1.3
1.5
1.7
1.9
2.1
2.3
1989
1991
1993
1995
1997
1999
2001
2003
2005
2007
GreeceItalyPortugalSpain
Eastern Asia
0.7
0.9
1.1
1.3
1.5
1.7
1.9
2.1
2.3
1989
1991
1993
1995
1997
1999
2001
2003
2005
2007
Japan KoreaSingapore TaiwanHong-Kong
Western Europe and the U.S.
0.7
0.9
1.1
1.3
1.5
1.7
1.9
2.1
2.3
1989
1991
1993
1995
1997
1999
2001
2003
2005
2007
Austria FranceWest Germany NetherlandsSweden SwitzerlandUSA UK
Sources: Council of Europe (2006), own computations based on Eurostat (2009a and 2009b), and national statistical offices.
38
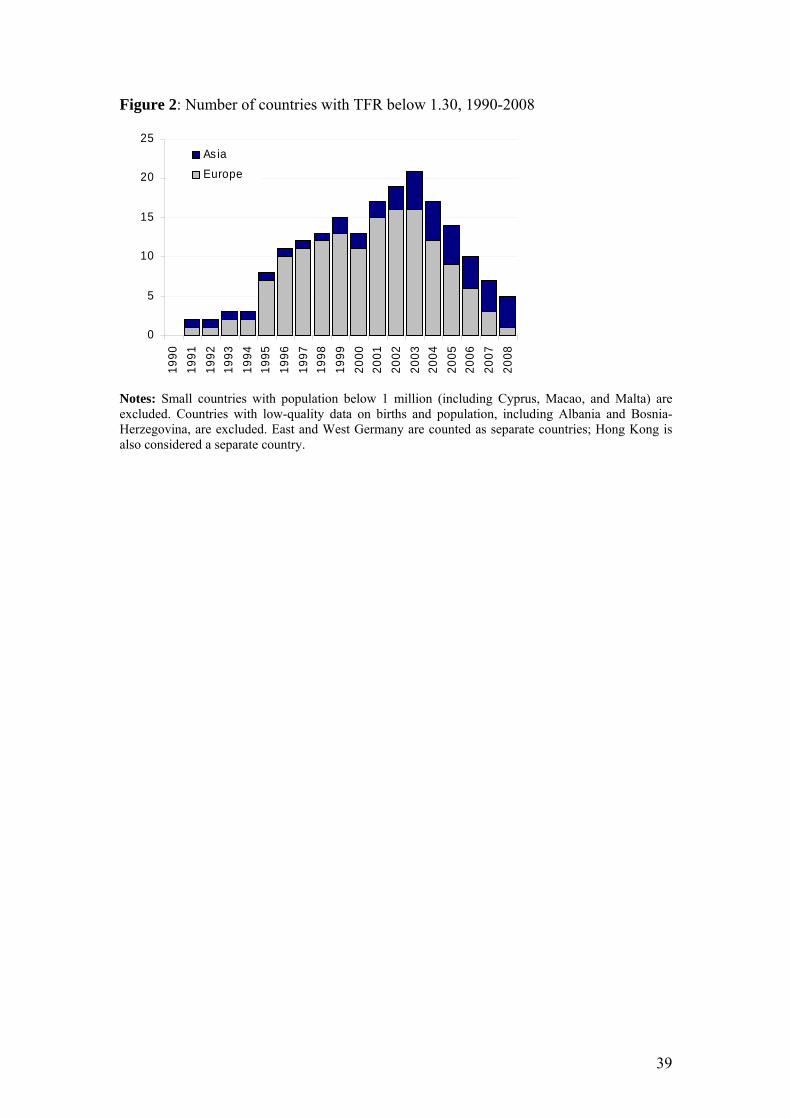
Figure 2: Number of countries with TFR below 1.30, 1990-2008
0
5
10
15
20
25
1990
1991
1992
1993
1994
1995
1996
1997
1998
1999
2000
2001
2002
2003
2004
2005
2006
2007
2008
As ia
Europe
Notes: Small countries with population below 1 million (including Cyprus, Macao, and Malta) are excluded. Countries with low-quality data on births and population, including Albania and Bosnia-Herzegovina, are excluded. East and West Germany are counted as separate countries; Hong Kong is also considered a separate country.
39
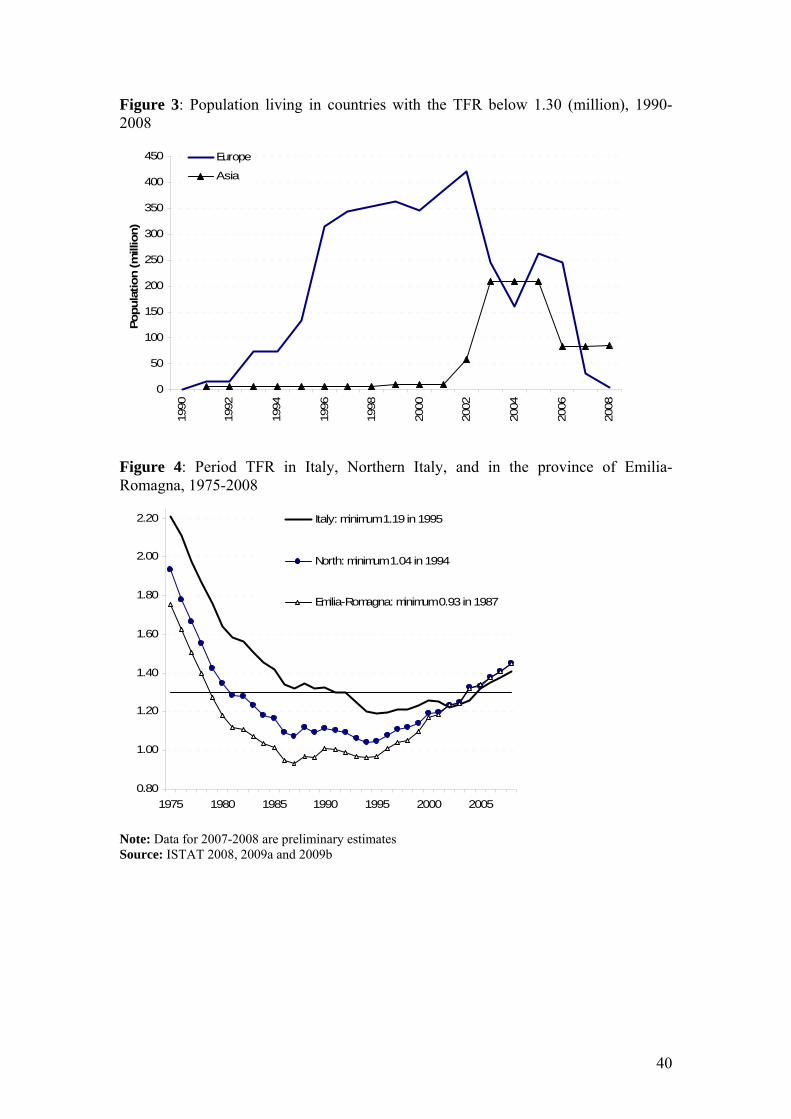
Figure 3: Population living in countries with the TFR below 1.30 (million), 1990-2008
0
50
100
150
200
250
300
350
400
450
1990
1992
1994
1996
1998
2000
2002
2004
2006
2008
Popu
latio
n (m
illio
n)
Europe
Asia
Figure 4: Period TFR in Italy, Northern Italy, and in the province of Emilia-Romagna, 1975-2008
0.80
1.00
1.20
1.40
1.60
1.80
2.00
2.20
1975 1980 1985 1990 1995 2000 2005
Italy: minimum 1.19 in 1995
North: minimum 1.04 in 1994
Emilia-Romagna: minimum 0.93 in 1987
Note: Data for 2007-2008 are preliminary estimates Source: ISTAT 2008, 2009a and 2009b
40
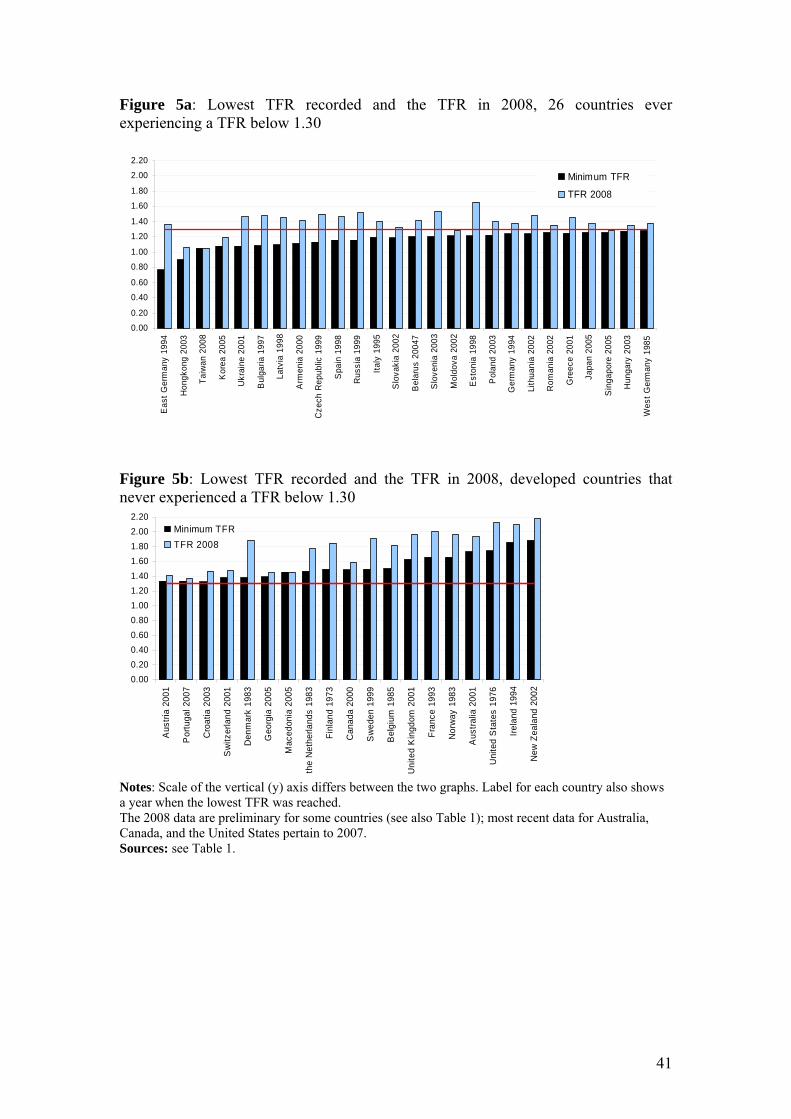
Figure 5a: Lowest TFR recorded and the TFR in 2008, 26 countries ever experiencing a TFR below 1.30
0.00
0.20
0.40
0.60
0.80
1.00
1.20
1.40
1.60
1.80
2.00
2.20E
ast G
erm
any
1994
Hon
gkon
g 20
03
Taiw
an 2
008
Kor
ea 2
005
Ukr
aine
200
1
Bul
garia
199
7
Latv
ia 1
998
Arm
enia
200
0
Cze
ch R
epub
lic 1
999
Spa
in 1
998
Rus
sia
1999
Italy
199
5
Slo
vaki
a 20
02
Bel
arus
200
47
Slo
veni
a 20
03
Mol
dova
200
2
Est
onia
199
8
Pol
and
2003
Ger
man
y 19
94
Lith
uani
a 20
02
Rom
ania
200
2
Gre
ece
2001
Japa
n 20
05
Sin
gapo
re 2
005
Hun
gary
200
3
Wes
t Ger
man
y 19
85
Minimum TFR
TFR 2008
Figure 5b: Lowest TFR recorded and the TFR in 2008, developed countries that never experienced a TFR below 1.30
0.000.200.400.600.801.001.201.401.601.802.002.20
Aus
tria
2001
Por
tuga
l 200
7
Cro
atia
200
3
Sw
itzer
land
200
1
Den
mar
k 19
83
Geo
rgia
200
5
Mac
edon
ia 2
005
the
Net
herla
nds
1983
Finl
and
1973
Can
ada
2000
Sw
eden
199
9
Bel
gium
198
5
Uni
ted
Kin
gdom
200
1
Fran
ce 1
993
Nor
way
198
3
Aus
tralia
200
1
Uni
ted
Sta
tes
1976
Irela
nd 1
994
New
Zea
land
200
2Minimum TFRTFR 2008
Notes: Scale of the vertical (y) axis differs between the two graphs. Label for each country also shows a year when the lowest TFR was reached. The 2008 data are preliminary for some countries (see also Table 1); most recent data for Australia, Canada, and the United States pertain to 2007. Sources: see Table 1.
41
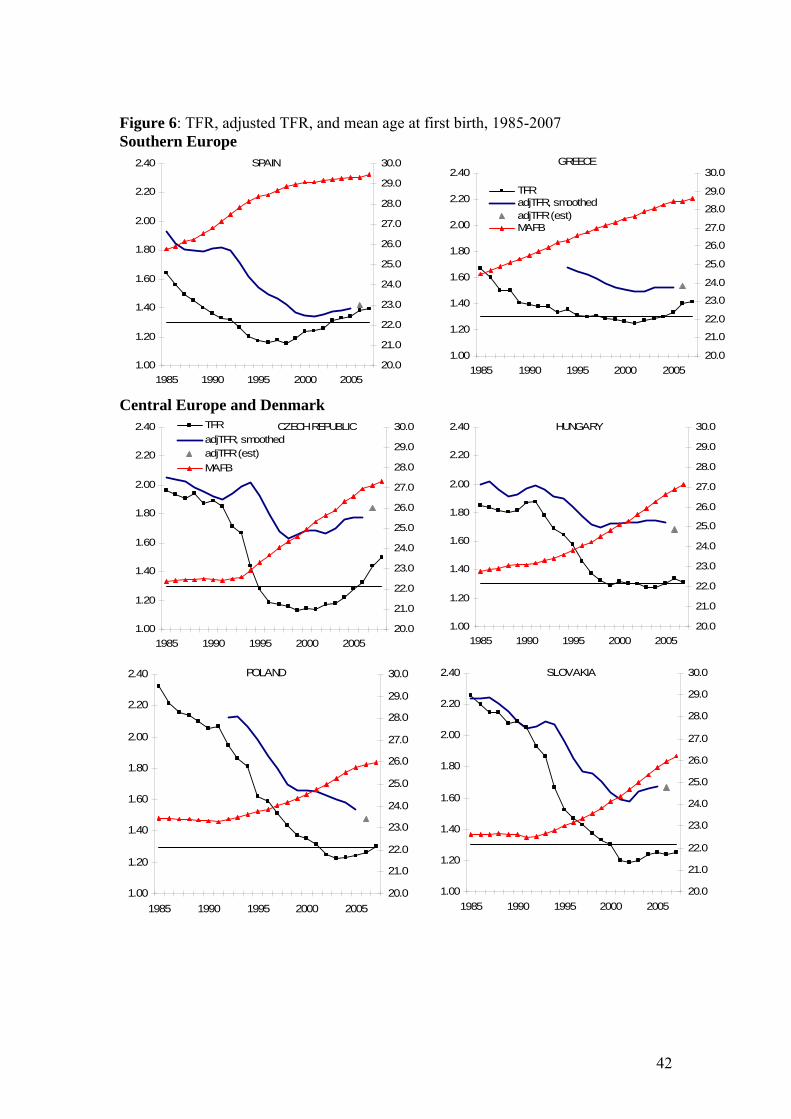
Figure 6: TFR, adjusted TFR, and mean age at first birth, 1985-2007 Southern Europe
1.00
1.20
1.40
1.60
1.80
2.00
2.20
2.40
1985 1990 1995 2000 200520.0
21.0
22.0
23.0
24.0
25.0
26.0
27.0
28.0
29.0
30.0SPAIN
1.00
1.20
1.40
1.60
1.80
2.00
2.20
2.40
1985 1990 1995 2000 200520.0
21.0
22.0
23.0
24.0
25.0
26.0
27.0
28.0
29.0
30.0
TFRadjTFR, smoothedadjTFR (est)MAFB
GREECE
Central Europe and Denmark
1.00
1.20
1.40
1.60
1.80
2.00
2.20
2.40
1985 1990 1995 2000 200520.0
21.0
22.0
23.0
24.0
25.0
26.0
27.0
28.0
29.0
30.0TFRadjTFR, smoothedadjTFR (est)MAFB
CZECH REPUBLIC
1.00
1.20
1.40
1.60
1.80
2.00
2.20
2.40
1985 1990 1995 2000 200520.0
21.0
22.0
23.0
24.0
25.0
26.0
27.0
28.0
29.0
30.0HUNGARY
1.00
1.20
1.40
1.60
1.80
2.00
2.20
2.40
1985 1990 1995 2000 200520.0
21.0
22.0
23.0
24.0
25.0
26.0
27.0
28.0
29.0
30.0POLAND
1.00
1.20
1.40
1.60
1.80
2.00
2.20
2.40
1985 1990 1995 2000 200520.0
21.0
22.0
23.0
24.0
25.0
26.0
27.0
28.0
29.0
30.0SLOVAKIA
42
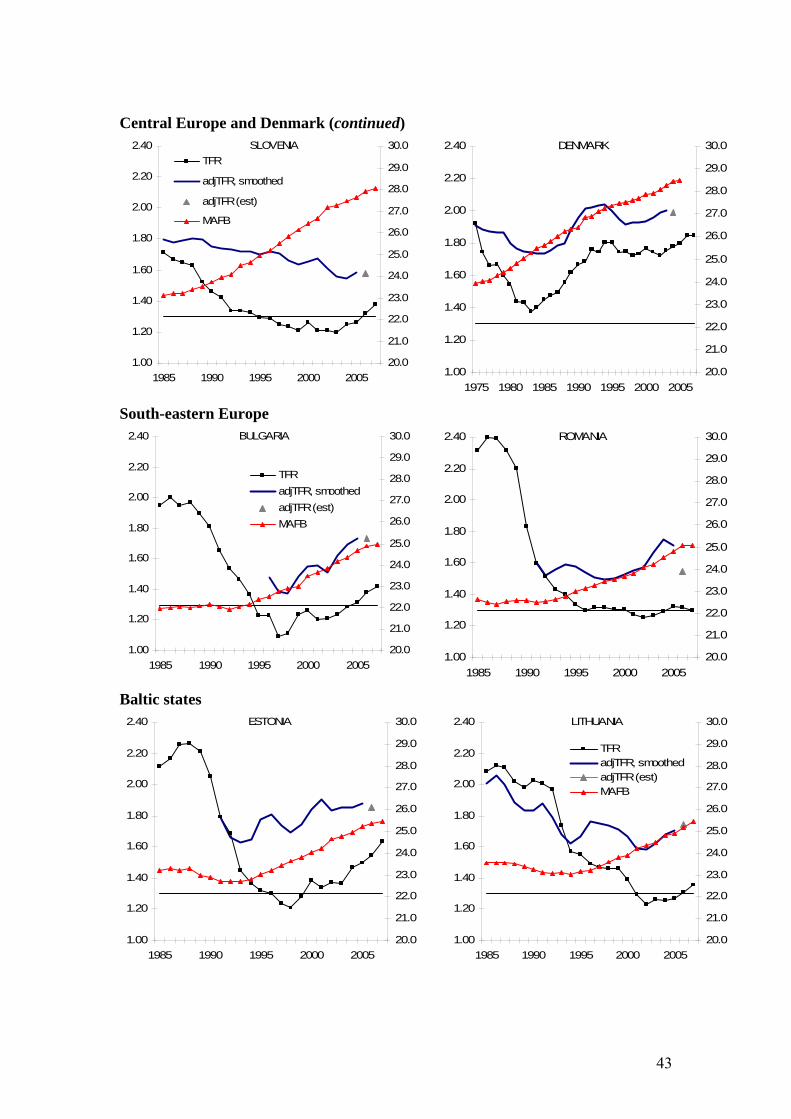
Central Europe and Denmark (continued)
1.00
1.20
1.40
1.60
1.80
2.00
2.20
2.40
1985 1990 1995 2000 200520.0
21.0
22.0
23.0
24.0
25.0
26.0
27.0
28.0
29.0
30.0TFR
adjTFR, smoothed
adjTFR (est)
MAFB
SLOVENIA
1.00
1.20
1.40
1.60
1.80
2.00
2.20
2.40
1975 1980 1985 1990 1995 2000 200520.0
21.0
22.0
23.0
24.0
25.0
26.0
27.0
28.0
29.0
30.0DENMARK
South-eastern Europe
1.00
1.20
1.40
1.60
1.80
2.00
2.20
2.40
1985 1990 1995 2000 200520.0
21.0
22.0
23.0
24.0
25.0
26.0
27.0
28.0
29.0
30.0
TFRadjTFR, smoothedadjTFR (est)MAFB
BULGARIA
1.00
1.20
1.40
1.60
1.80
2.00
2.20
2.40
1985 1990 1995 2000 200520.0
21.0
22.0
23.0
24.0
25.0
26.0
27.0
28.0
29.0
30.0ROMANIA
Baltic states
1.00
1.20
1.40
1.60
1.80
2.00
2.20
2.40
1985 1990 1995 2000 200520.0
21.0
22.0
23.0
24.0
25.0
26.0
27.0
28.0
29.0
30.0ESTONIA
1.00
1.20
1.40
1.60
1.80
2.00
2.20
2.40
1985 1990 1995 2000 200520.0
21.0
22.0
23.0
24.0
25.0
26.0
27.0
28.0
29.0
30.0
TFRadjTFR, smoothedadjTFR (est)MAFB
LITHUANIA
43
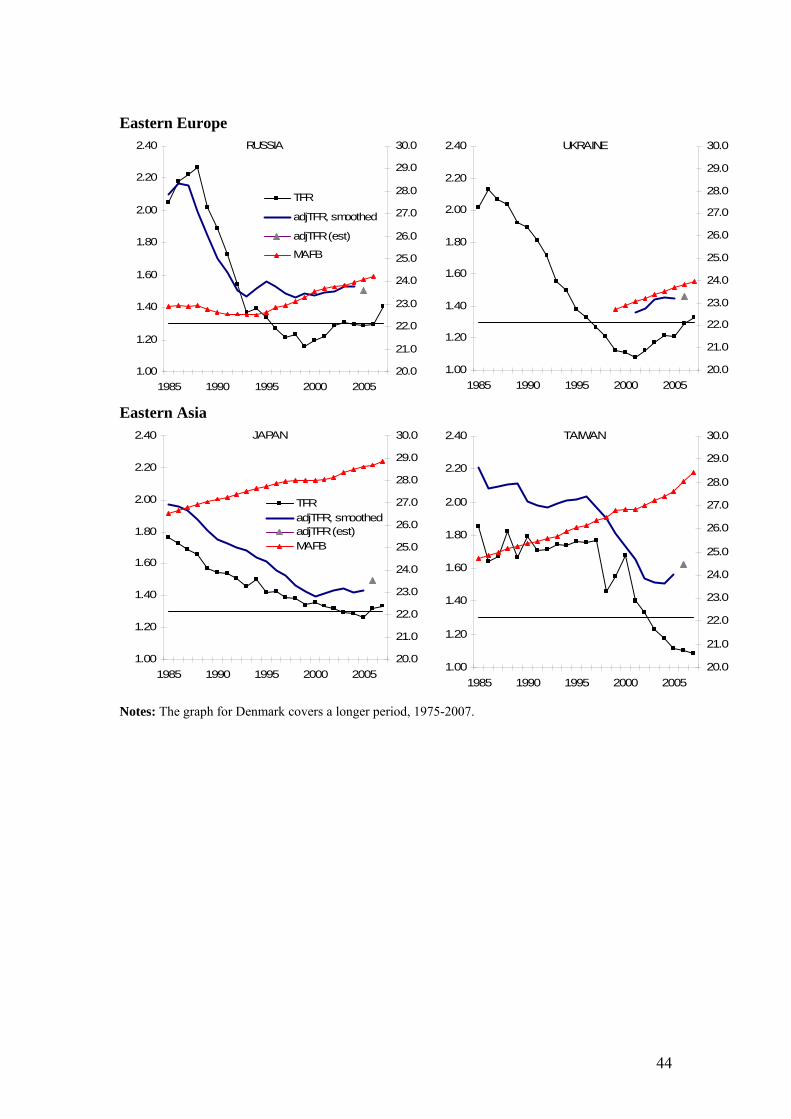
Eastern Europe
1.00
1.20
1.40
1.60
1.80
2.00
2.20
2.40
1985 1990 1995 2000 200520.0
21.0
22.0
23.0
24.0
25.0
26.0
27.0
28.0
29.0
30.0
TFR
adjTFR, smoothed
adjTFR (est)
MAFB
RUSSIA
1.00
1.20
1.40
1.60
1.80
2.00
2.20
2.40
1985 1990 1995 2000 200520.0
21.0
22.0
23.0
24.0
25.0
26.0
27.0
28.0
29.0
30.0UKRAINE
Eastern Asia
1.00
1.20
1.40
1.60
1.80
2.00
2.20
2.40
1985 1990 1995 2000 200520.0
21.0
22.0
23.0
24.0
25.0
26.0
27.0
28.0
29.0
30.0
TFRadjTFR, smoothedadjTFR (est)MAFB
JAPAN
1.00
1.20
1.40
1.60
1.80
2.00
2.20
2.40
1985 1990 1995 2000 200520.0
21.0
22.0
23.0
24.0
25.0
26.0
27.0
28.0
29.0
30.0TAIWAN
Notes: The graph for Denmark covers a longer period, 1975-2007.
44
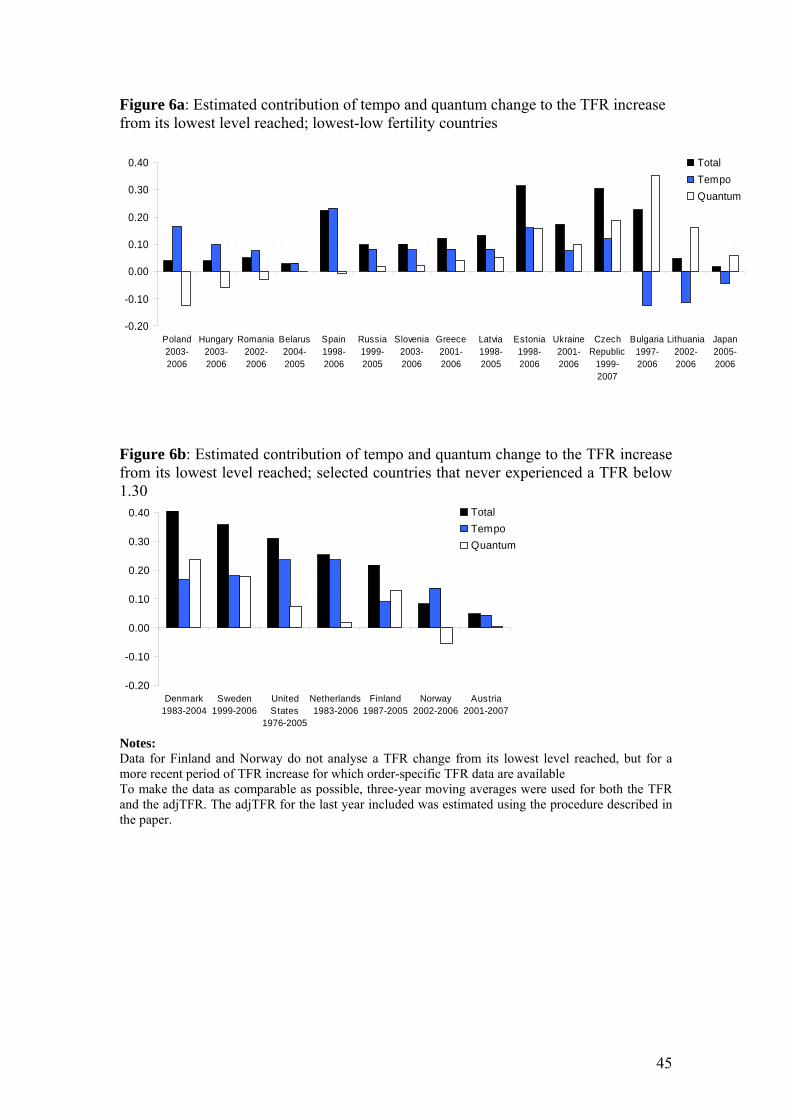
Figure 6a: Estimated contribution of tempo and quantum change to the TFR increase from its lowest level reached; lowest-low fertility countries
-0.20
-0.10
0.00
0.10
0.20
0.30
0.40
Poland2003-2006
Hungary2003-2006
Romania2002-2006
Belarus2004-2005
Spain1998-2006
Russia1999-2005
Slovenia2003-2006
Greece2001-2006
Latvia1998-2005
Estonia1998-2006
Ukraine2001-2006
CzechRepublic
1999-2007
Bulgaria1997-2006
Lithuania2002-2006
Japan2005-2006
TotalTempoQuantum
Figure 6b: Estimated contribution of tempo and quantum change to the TFR increase from its lowest level reached; selected countries that never experienced a TFR below 1.30
-0.20
-0.10
0.00
0.10
0.20
0.30
0.40
Denmark1983-2004
Sweden1999-2006
UnitedStates
1976-2005
Netherlands1983-2006
Finland1987-2005
Norway2002-2006
Austria2001-2007
TotalTempoQuantum
Notes: Data for Finland and Norway do not analyse a TFR change from its lowest level reached, but for a more recent period of TFR increase for which order-specific TFR data are available To make the data as comparable as possible, three-year moving averages were used for both the TFR and the adjTFR. The adjTFR for the last year included was estimated using the procedure described in the paper.
45
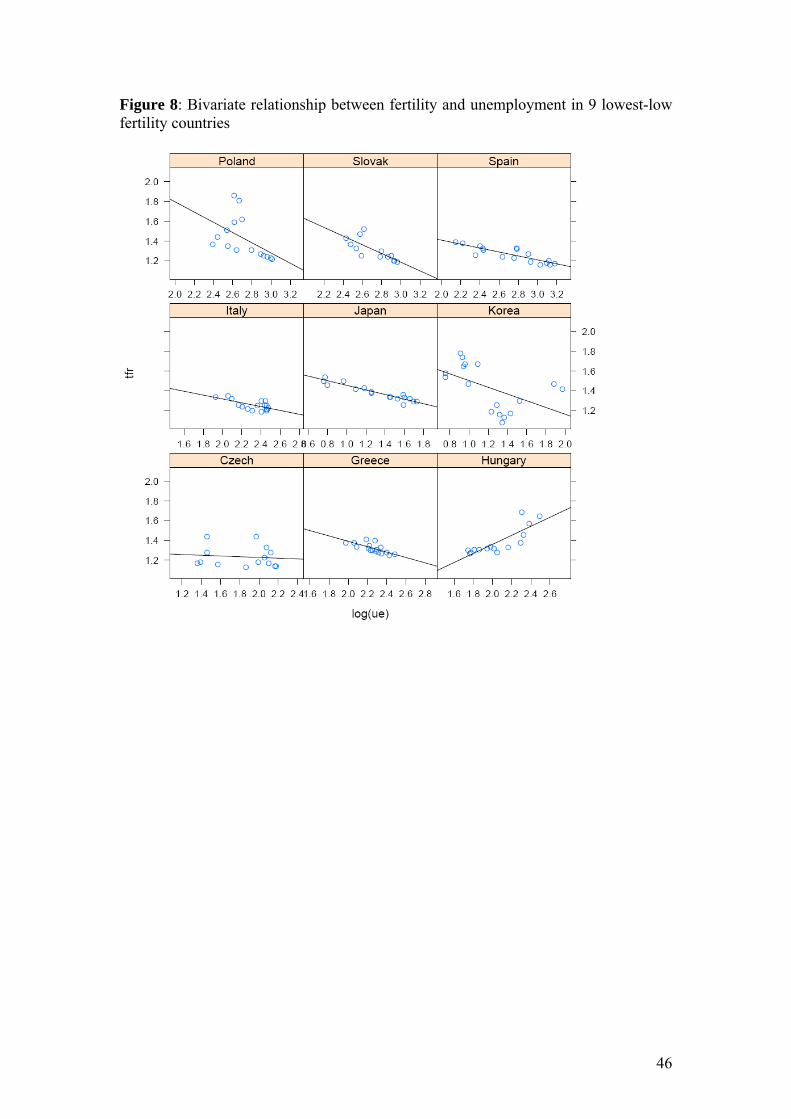
Figure 8: Bivariate relationship between fertility and unemployment in 9 lowest-low fertility countries
46
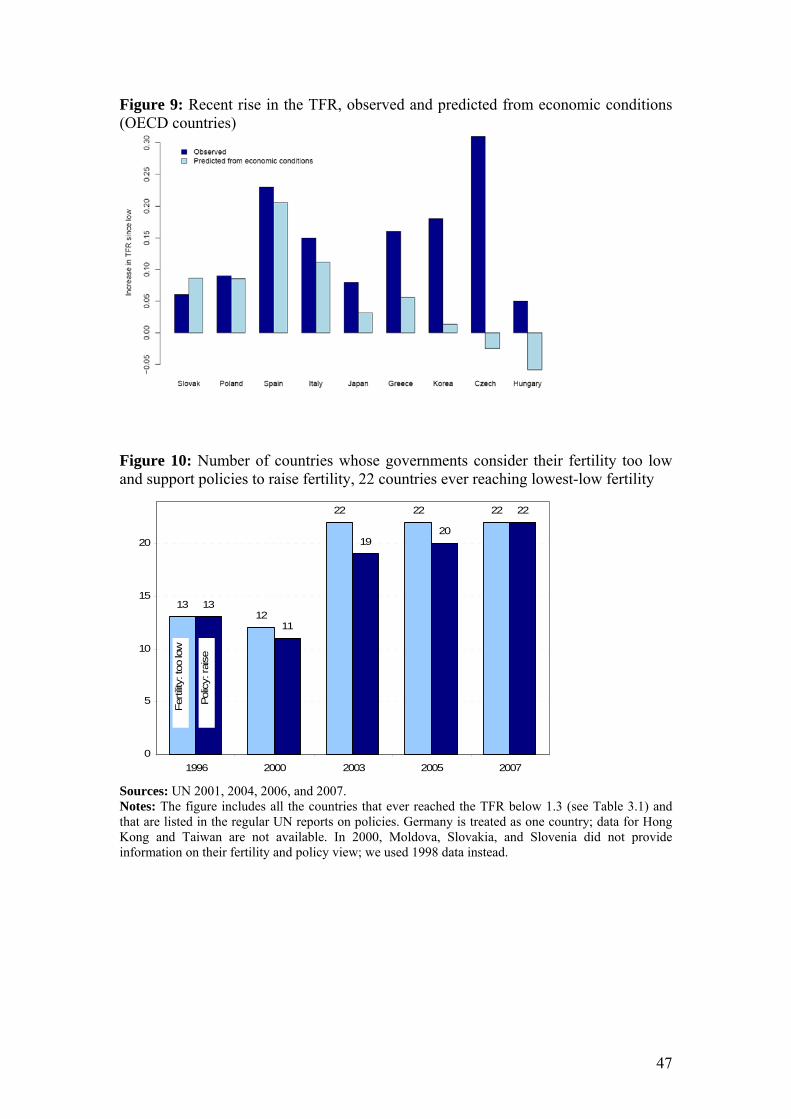
Figure 9: Recent rise in the TFR, observed and predicted from economic conditions (OECD countries)
Figure 10: Number of countries whose governments consider their fertility too low and support policies to raise fertility, 22 countries ever reaching lowest-low fertility
1312
22 22 22
13
11
1920
22
0
5
10
15
20
1996 2000 2003 2005 2007
Ferti
lity: t
oo lo
w
Polic
y: ra
ise
Sources: UN 2001, 2004, 2006, and 2007. Notes: The figure includes all the countries that ever reached the TFR below 1.3 (see Table 3.1) and that are listed in the regular UN reports on policies. Germany is treated as one country; data for Hong Kong and Taiwan are not available. In 2000, Moldova, Slovakia, and Slovenia did not provide information on their fertility and policy view; we used 1998 data instead.
47
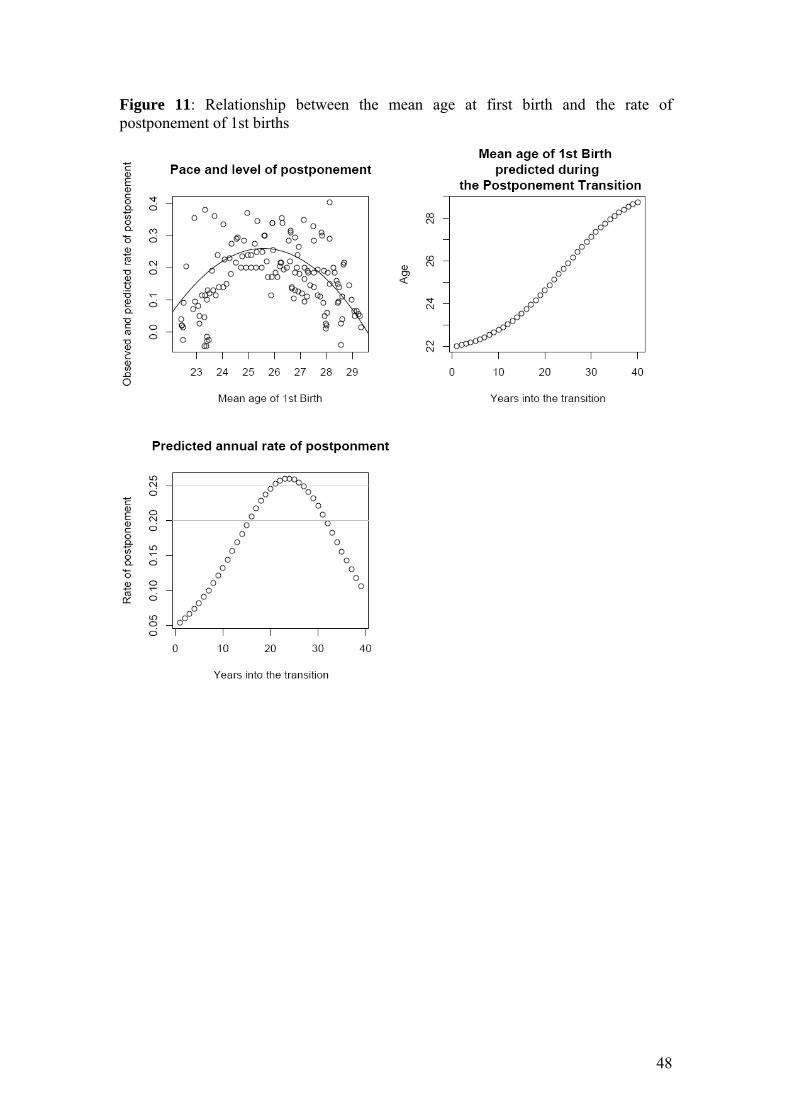
Figure 11: Relationship between the mean age at first birth and the rate of postponement of 1st births
48
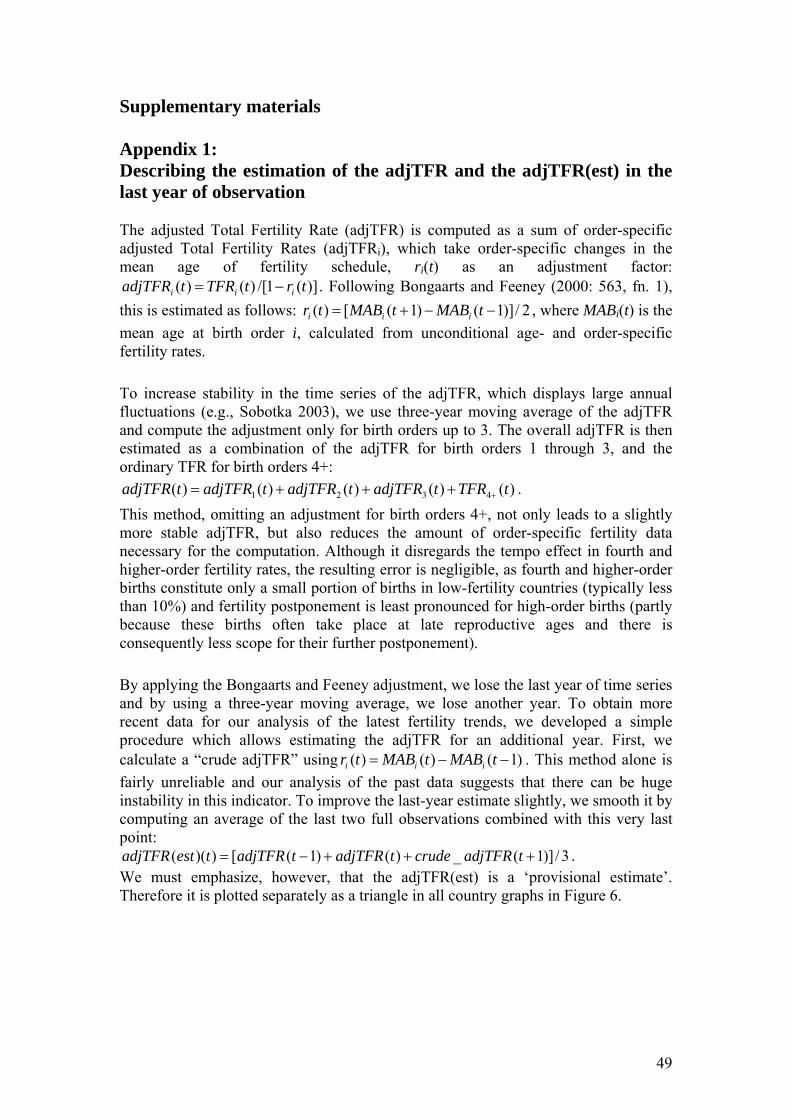
Supplementary materials Appendix 1: Describing the estimation of the adjTFR and the adjTFR(est) in the last year of observation The adjusted Total Fertility Rate (adjTFR) is computed as a sum of order-specific adjusted Total Fertility Rates (adjTFRi), which take order-specific changes in the mean age of fertility schedule, ri(t) as an adjustment factor:
. Following Bongaarts and Feeney (2000: 563, fn. 1), this is estimated as follows:
)](1/[)()( trtTFRtadjTFR iii −=2/)]1()1([)( −−+= tMABtMABtr iii , where MABi(t) is the
mean age at birth order i, calculated from unconditional age- and order-specific fertility rates. To increase stability in the time series of the adjTFR, which displays large annual fluctuations (e.g., Sobotka 2003), we use three-year moving average of the adjTFR and compute the adjustment only for birth orders up to 3. The overall adjTFR is then estimated as a combination of the adjTFR for birth orders 1 through 3, and the ordinary TFR for birth orders 4+:
)()()()()( 4321 tTFRtadjTFRtadjTFRtadjTFRtadjTFR ++++= . This method, omitting an adjustment for birth orders 4+, not only leads to a slightly more stable adjTFR, but also reduces the amount of order-specific fertility data necessary for the computation. Although it disregards the tempo effect in fourth and higher-order fertility rates, the resulting error is negligible, as fourth and higher-order births constitute only a small portion of births in low-fertility countries (typically less than 10%) and fertility postponement is least pronounced for high-order births (partly because these births often take place at late reproductive ages and there is consequently less scope for their further postponement). By applying the Bongaarts and Feeney adjustment, we lose the last year of time series and by using a three-year moving average, we lose another year. To obtain more recent data for our analysis of the latest fertility trends, we developed a simple procedure which allows estimating the adjTFR for an additional year. First, we calculate a “crude adjTFR” using )1()()( −−= tMABtMABtr iii . This method alone is fairly unreliable and our analysis of the past data suggests that there can be huge instability in this indicator. To improve the last-year estimate slightly, we smooth it by computing an average of the last two full observations combined with this very last point:
3/)]1(_)()1([))(( +++−= tadjTFRcrudetadjTFRtadjTFRtestadjTFR . We must emphasize, however, that the adjTFR(est) is a ‘provisional estimate’. Therefore it is plotted separately as a triangle in all country graphs in Figure 6.
49
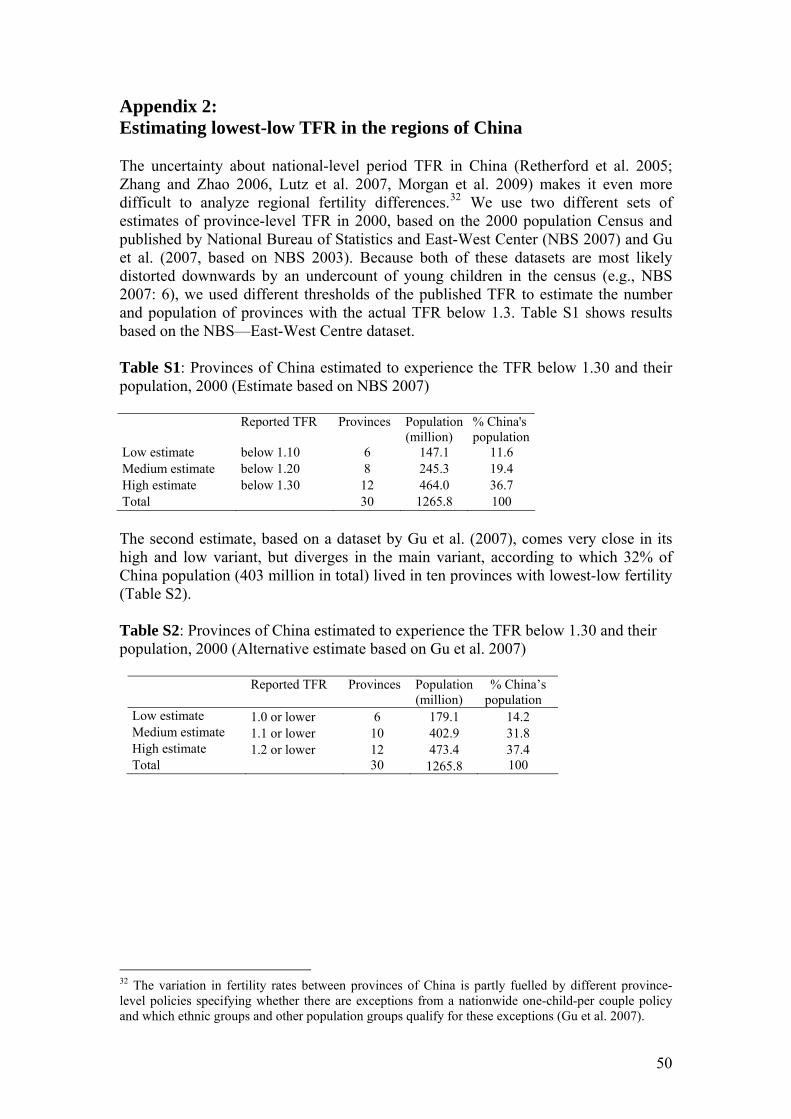
Appendix 2: Estimating lowest-low TFR in the regions of China The uncertainty about national-level period TFR in China (Retherford et al. 2005; Zhang and Zhao 2006, Lutz et al. 2007, Morgan et al. 2009) makes it even more difficult to analyze regional fertility differences.32 We use two different sets of estimates of province-level TFR in 2000, based on the 2000 population Census and published by National Bureau of Statistics and East-West Center (NBS 2007) and Gu et al. (2007, based on NBS 2003). Because both of these datasets are most likely distorted downwards by an undercount of young children in the census (e.g., NBS 2007: 6), we used different thresholds of the published TFR to estimate the number and population of provinces with the actual TFR below 1.3. Table S1 shows results based on the NBS—East-West Centre dataset. Table S1: Provinces of China estimated to experience the TFR below 1.30 and their population, 2000 (Estimate based on NBS 2007)
Reported TFR Provinces Population(million)
% China's population
Low estimate below 1.10 6 147.1 11.6 Medium estimate below 1.20 8 245.3 19.4 High estimate below 1.30 12 464.0 36.7 Total 30 1265.8 100 The second estimate, based on a dataset by Gu et al. (2007), comes very close in its high and low variant, but diverges in the main variant, according to which 32% of China population (403 million in total) lived in ten provinces with lowest-low fertility (Table S2). Table S2: Provinces of China estimated to experience the TFR below 1.30 and their population, 2000 (Alternative estimate based on Gu et al. 2007)
Reported TFR Provinces Population(million)
% China’s population
Low estimate 1.0 or lower 6 179.1 14.2 Medium estimate 1.1 or lower 10 402.9 31.8 High estimate 1.2 or lower 12 473.4 37.4 Total 30 1265.8 100
32 The variation in fertility rates between provinces of China is partly fuelled by different province-level policies specifying whether there are exceptions from a nationwide one-child-per couple policy and which ethnic groups and other population groups qualify for these exceptions (Gu et al. 2007).
50
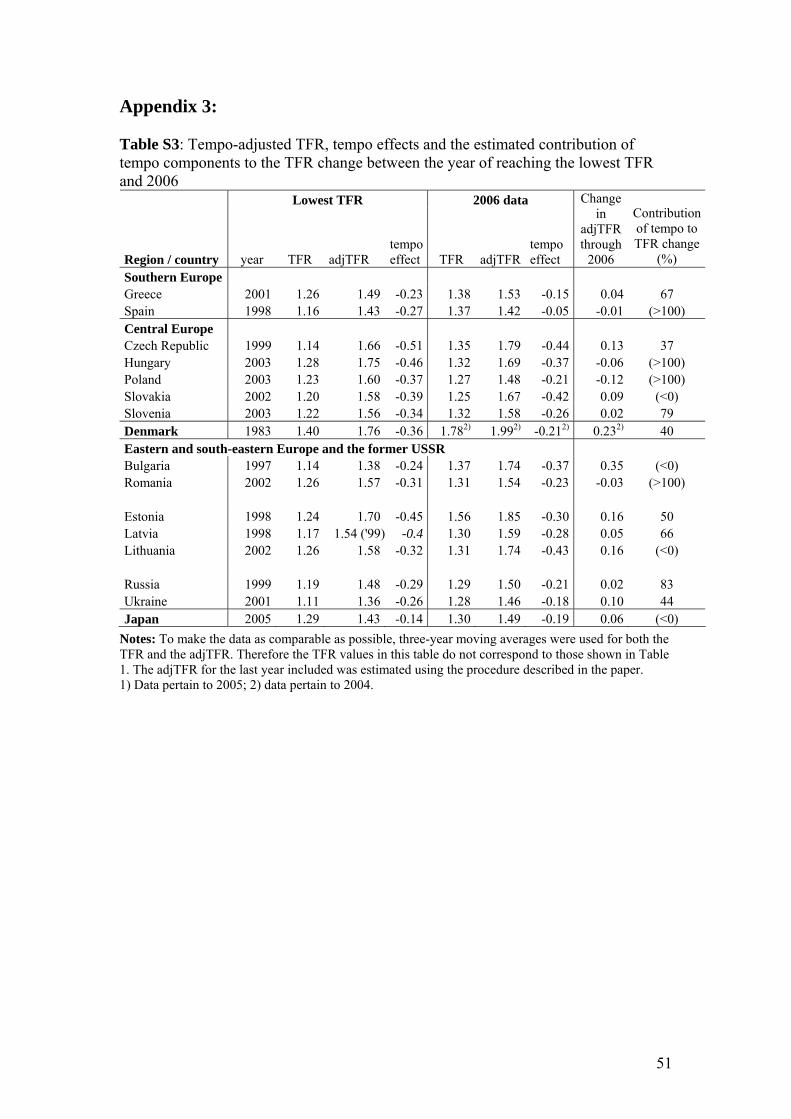
Appendix 3: Table S3: Tempo-adjusted TFR, tempo effects and the estimated contribution of tempo components to the TFR change between the year of reaching the lowest TFR and 2006 Lowest TFR 2006 data
Region / country year TFR adjTFR tempo effect TFR adjTFR
tempo effect
Change in
adjTFR through
2006
Contribution of tempo to TFR change
(%) Southern Europe Greece 2001 1.26 1.49 -0.23 1.38 1.53 -0.15 0.04 67 Spain 1998 1.16 1.43 -0.27 1.37 1.42 -0.05 -0.01 (>100) Central Europe Czech Republic 1999 1.14 1.66 -0.51 1.35 1.79 -0.44 0.13 37 Hungary 2003 1.28 1.75 -0.46 1.32 1.69 -0.37 -0.06 (>100) Poland 2003 1.23 1.60 -0.37 1.27 1.48 -0.21 -0.12 (>100) Slovakia 2002 1.20 1.58 -0.39 1.25 1.67 -0.42 0.09 (<0) Slovenia 2003 1.22 1.56 -0.34 1.32 1.58 -0.26 0.02 79 Denmark 1983 1.40 1.76 -0.36 1.782) 1.992) -0.212) 0.232) 40 Eastern and south-eastern Europe and the former USSR Bulgaria 1997 1.14 1.38 -0.24 1.37 1.74 -0.37 0.35 (<0) Romania 2002 1.26 1.57 -0.31 1.31 1.54 -0.23 -0.03 (>100) Estonia 1998 1.24 1.70 -0.45 1.56 1.85 -0.30 0.16 50 Latvia 1998 1.17 1.54 ('99) -0.4 1.30 1.59 -0.28 0.05 66 Lithuania 2002 1.26 1.58 -0.32 1.31 1.74 -0.43 0.16 (<0) Russia 1999 1.19 1.48 -0.29 1.29 1.50 -0.21 0.02 83 Ukraine 2001 1.11 1.36 -0.26 1.28 1.46 -0.18 0.10 44 Japan 2005 1.29 1.43 -0.14 1.30 1.49 -0.19 0.06 (<0)
Notes: To make the data as comparable as possible, three-year moving averages were used for both the TFR and the adjTFR. Therefore the TFR values in this table do not correspond to those shown in Table 1. The adjTFR for the last year included was estimated using the procedure described in the paper. 1) Data pertain to 2005; 2) data pertain to 2004.
51
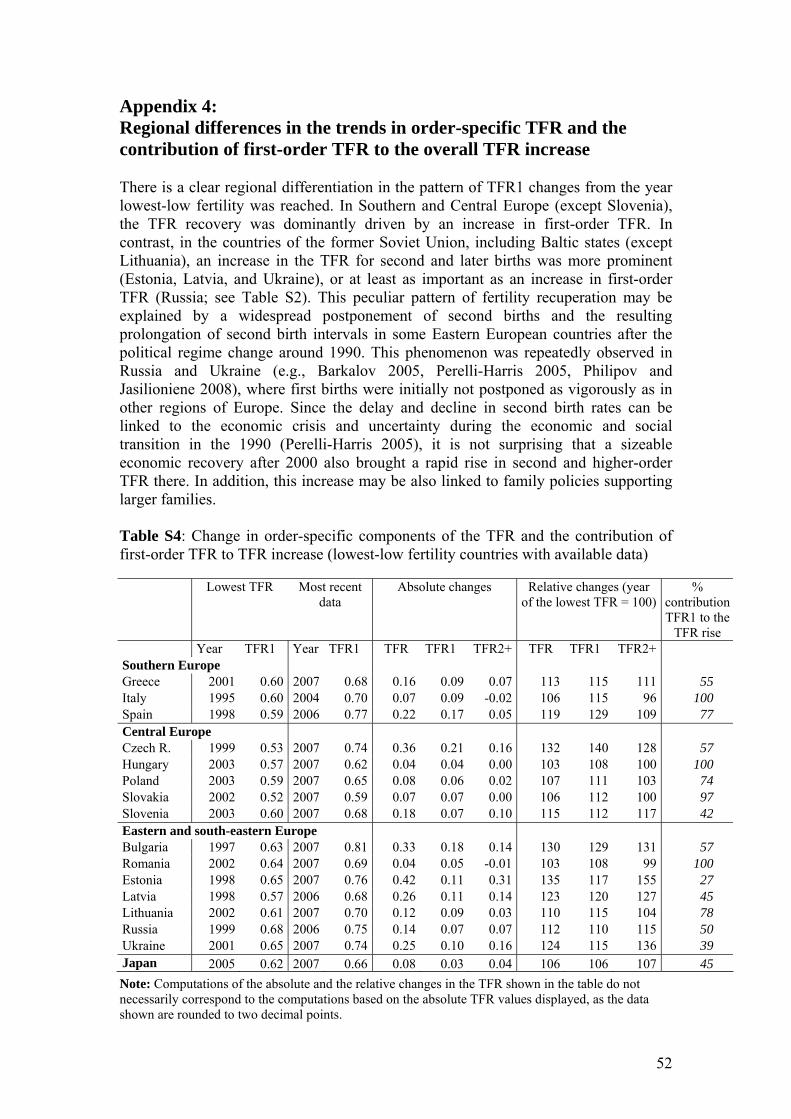
Appendix 4: Regional differences in the trends in order-specific TFR and the contribution of first-order TFR to the overall TFR increase There is a clear regional differentiation in the pattern of TFR1 changes from the year lowest-low fertility was reached. In Southern and Central Europe (except Slovenia), the TFR recovery was dominantly driven by an increase in first-order TFR. In contrast, in the countries of the former Soviet Union, including Baltic states (except Lithuania), an increase in the TFR for second and later births was more prominent (Estonia, Latvia, and Ukraine), or at least as important as an increase in first-order TFR (Russia; see Table S2). This peculiar pattern of fertility recuperation may be explained by a widespread postponement of second births and the resulting prolongation of second birth intervals in some Eastern European countries after the political regime change around 1990. This phenomenon was repeatedly observed in Russia and Ukraine (e.g., Barkalov 2005, Perelli-Harris 2005, Philipov and Jasilioniene 2008), where first births were initially not postponed as vigorously as in other regions of Europe. Since the delay and decline in second birth rates can be linked to the economic crisis and uncertainty during the economic and social transition in the 1990 (Perelli-Harris 2005), it is not surprising that a sizeable economic recovery after 2000 also brought a rapid rise in second and higher-order TFR there. In addition, this increase may be also linked to family policies supporting larger families. Table S4: Change in order-specific components of the TFR and the contribution of first-order TFR to TFR increase (lowest-low fertility countries with available data)
Lowest TFR Most recent data
Absolute changes Relative changes (year of the lowest TFR = 100)
% contribution TFR1 to the
TFR rise Year TFR1 Year TFR1 TFR TFR1 TFR2+ TFR TFR1 TFR2+Southern Europe Greece 2001 0.60 2007 0.68 0.16 0.09 0.07 113 115 111 55 Italy 1995 0.60 2004 0.70 0.07 0.09 -0.02 106 115 96 100 Spain 1998 0.59 2006 0.77 0.22 0.17 0.05 119 129 109 77 Central Europe Czech R. 1999 0.53 2007 0.74 0.36 0.21 0.16 132 140 128 57 Hungary 2003 0.57 2007 0.62 0.04 0.04 0.00 103 108 100 100 Poland 2003 0.59 2007 0.65 0.08 0.06 0.02 107 111 103 74 Slovakia 2002 0.52 2007 0.59 0.07 0.07 0.00 106 112 100 97 Slovenia 2003 0.60 2007 0.68 0.18 0.07 0.10 115 112 117 42 Eastern and south-eastern Europe Bulgaria 1997 0.63 2007 0.81 0.33 0.18 0.14 130 129 131 57 Romania 2002 0.64 2007 0.69 0.04 0.05 -0.01 103 108 99 100 Estonia 1998 0.65 2007 0.76 0.42 0.11 0.31 135 117 155 27 Latvia 1998 0.57 2006 0.68 0.26 0.11 0.14 123 120 127 45 Lithuania 2002 0.61 2007 0.70 0.12 0.09 0.03 110 115 104 78 Russia 1999 0.68 2006 0.75 0.14 0.07 0.07 112 110 115 50 Ukraine 2001 0.65 2007 0.74 0.25 0.10 0.16 124 115 136 39 Japan 2005 0.62 2007 0.66 0.08 0.03 0.04 106 106 107 45 Note: Computations of the absolute and the relative changes in the TFR shown in the table do not necessarily correspond to the computations based on the absolute TFR values displayed, as the data shown are rounded to two decimal points.
52
The trajectories of changes in TFR1 and the mean age of mother at first birth during the ‘postponement transition’ in selected lowest-low fertility countries is graphically displayed for selected countries in Figure S1. The graphs are shown separately for the former communist countries with initially very early first birth pattern, and for Southern European and East Asian countries (see also Sobotka 2004b: 180-182). Denmark and the Netherlands are added for an illustration as well.33 Most of the analyzed countries indeed seem to follow the outlined trajectory quite well, although there are some irregular ups and downs, especially in Russia, Taiwan, and in Denmark. All the analyzed countries except Russia have already moved toward the ‘late’ first birth pattern; however, by 2007, most analyzed countries have not reached the envisioned final stage of the TFR1 recovery above 0.75. The Netherlands constitutes an ‘ideal case’ of the complete pathway, whereas Spain shows a recent upsurge in the TFR1 above the threshold of 0.75. A future completion of this final stage in first birth timing transition is likely to push the TFR further upwards, although in some countries, especially Japan, first birth rates may eventually stabilize at the lowest-low levels.
33 The two graphs have a different dividing line between the ‘early’ and the late’ first birth pattern (at ages 25 and 27, respectively), reflecting differences in the mean age at first birth at the onset of first birth postponement.
53
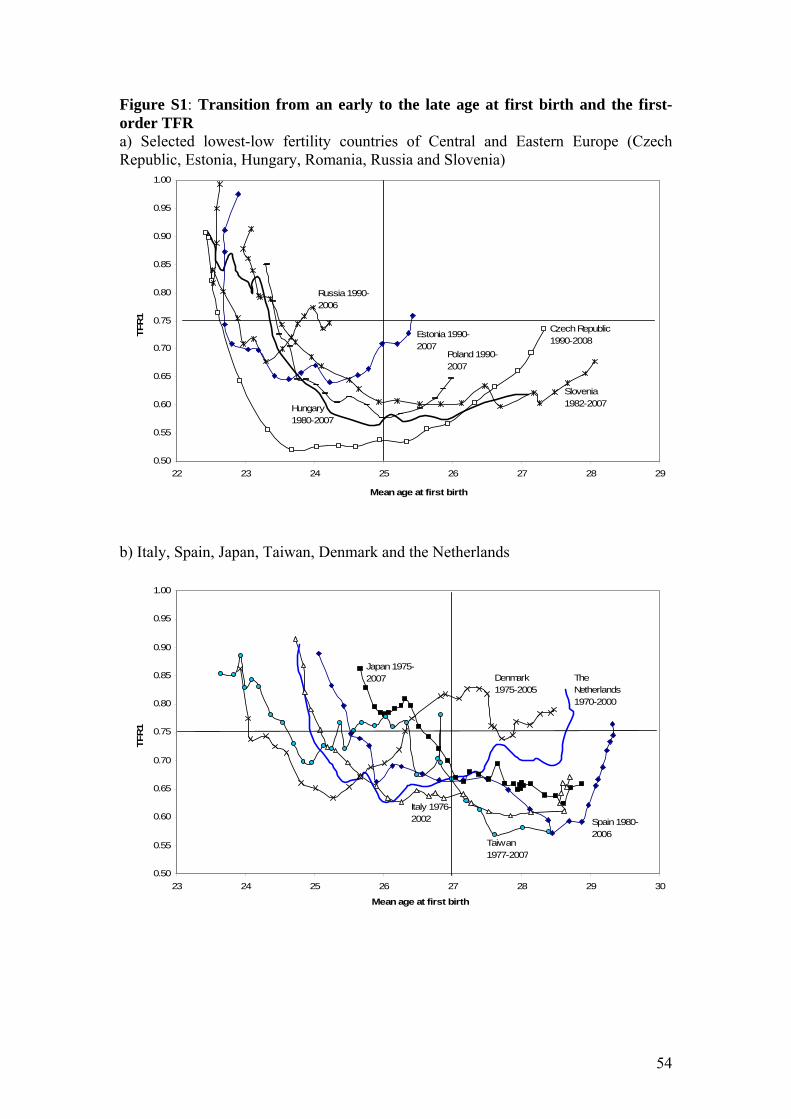
Figure S1: Transition from an early to the late age at first birth and the first-order TFR a) Selected lowest-low fertility countries of Central and Eastern Europe (Czech Republic, Estonia, Hungary, Romania, Russia and Slovenia)
0.50
0.55
0.60
0.65
0.70
0.75
0.80
0.85
0.90
0.95
1.00
22 23 24 25 26 27 28 29
Mean age at first birth
TFR
1
Czech Republic 1990-2008
Estonia 1990-2007
Slovenia 1982-2007
Russia 1990-2006
Poland 1990-2007
Hungary 1980-2007
b) Italy, Spain, Japan, Taiwan, Denmark and the Netherlands
0.50
0.55
0.60
0.65
0.70
0.75
0.80
0.85
0.90
0.95
1.00
23 24 25 26 27 28 29 30
Mean age at first birth
TFR
1
The Netherlands 1970-2000
Denmark 1975-2005
Spain 1980-2006
Japan 1975-2007
Italy 1976-2002
Taiwan 1977-2007
54
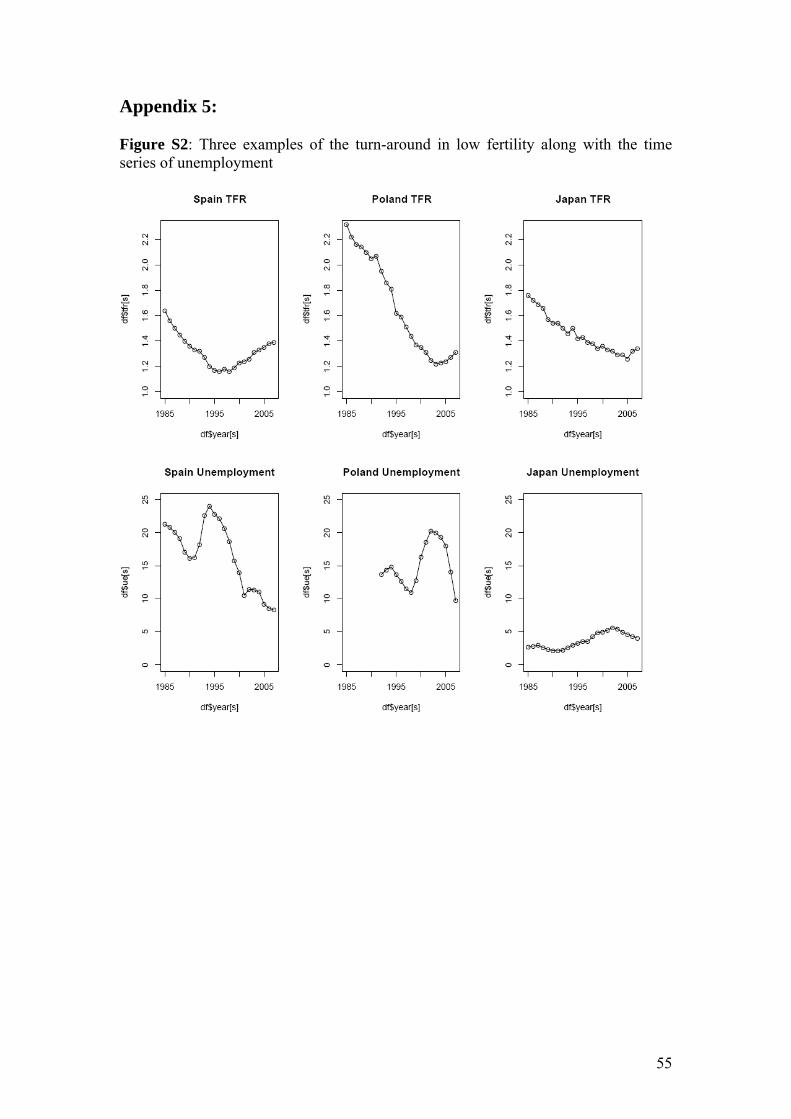
Appendix 5: Figure S2: Three examples of the turn-around in low fertility along with the time series of unemployment
55
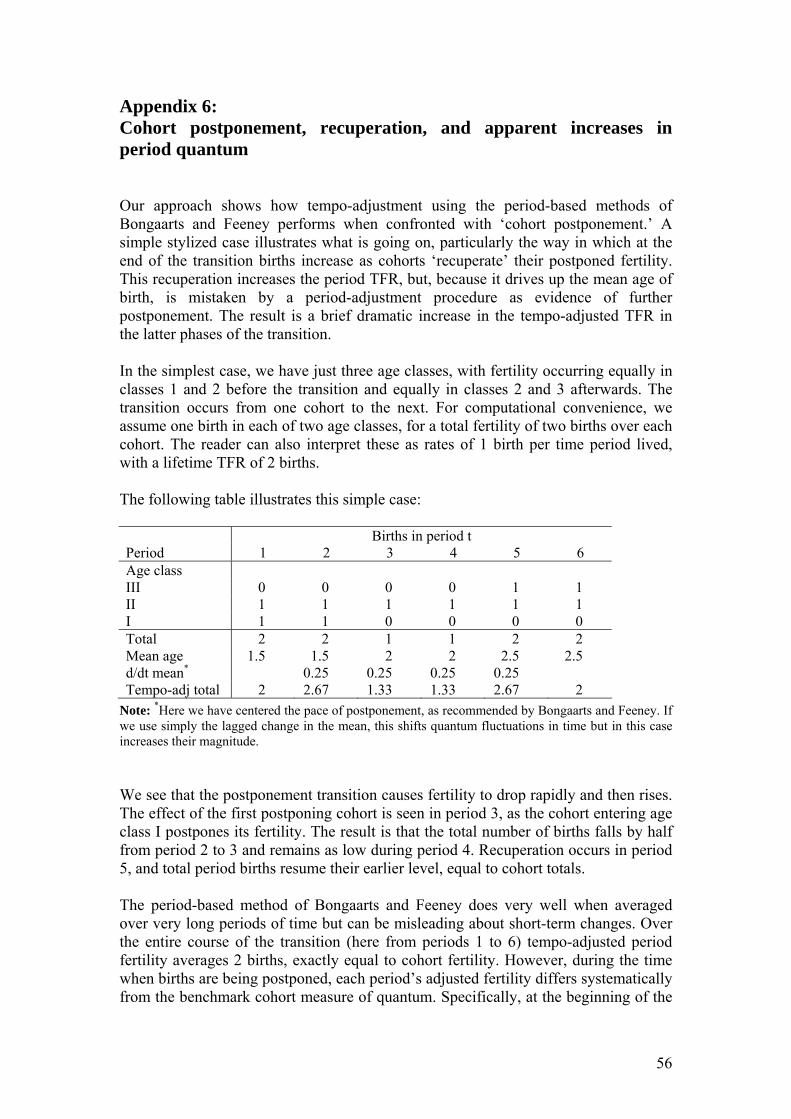
Appendix 6: Cohort postponement, recuperation, and apparent increases in period quantum Our approach shows how tempo-adjustment using the period-based methods of Bongaarts and Feeney performs when confronted with ‘cohort postponement.’ A simple stylized case illustrates what is going on, particularly the way in which at the end of the transition births increase as cohorts ‘recuperate’ their postponed fertility. This recuperation increases the period TFR, but, because it drives up the mean age of birth, is mistaken by a period-adjustment procedure as evidence of further postponement. The result is a brief dramatic increase in the tempo-adjusted TFR in the latter phases of the transition. In the simplest case, we have just three age classes, with fertility occurring equally in classes 1 and 2 before the transition and equally in classes 2 and 3 afterwards. The transition occurs from one cohort to the next. For computational convenience, we assume one birth in each of two age classes, for a total fertility of two births over each cohort. The reader can also interpret these as rates of 1 birth per time period lived, with a lifetime TFR of 2 births. The following table illustrates this simple case: Births in period t Period 1 2 3 4 5 6 Age class III 0 0 0 0 1 1 II 1 1 1 1 1 1 I 1 1 0 0 0 0 Total 2 2 1 1 2 2 Mean age 1.5 1.5 2 2 2.5 2.5 d/dt mean* 0.25 0.25 0.25 0.25 Tempo-adj total 2 2.67 1.33 1.33 2.67 2
Note: *Here we have centered the pace of postponement, as recommended by Bongaarts and Feeney. If we use simply the lagged change in the mean, this shifts quantum fluctuations in time but in this case increases their magnitude. We see that the postponement transition causes fertility to drop rapidly and then rises. The effect of the first postponing cohort is seen in period 3, as the cohort entering age class I postpones its fertility. The result is that the total number of births falls by half from period 2 to 3 and remains as low during period 4. Recuperation occurs in period 5, and total period births resume their earlier level, equal to cohort totals. The period-based method of Bongaarts and Feeney does very well when averaged over very long periods of time but can be misleading about short-term changes. Over the entire course of the transition (here from periods 1 to 6) tempo-adjusted period fertility averages 2 births, exactly equal to cohort fertility. However, during the time when births are being postponed, each period’s adjusted fertility differs systematically from the benchmark cohort measure of quantum. Specifically, at the beginning of the
56
transition (in period 3), the tempo-adjustment to 2.67 is too large, making it look as if the quantum of fertility has increased. During the middle of the transition (in periods 4 and 5), the adjustment to 1.33 is too small, giving the appearance of large declines (33 to 50%!) in the quantum of fertility. Finally, at the end of the transition, the recuperation of fertility makes it appear to the BF method as if there is continued postponement because the mean age increases from periods 4 to 5. This produces an overestimate of quantum for period 5. The combined effect of underestimation of quantum in the midst of the transition and overestimation of quantum toward its end produces the impression of an enormous increase in quantum. This appearance of large quantum swings is attributable to the BF model’s assumption that postponement is happening on a period, not a cohort basis. It thus uses period measures of change in the mean age, an approach which can produce misleading results during the whole course of postponement transition. The above example illustrates what can go wrong when the period-based BF approach is applied to demographic change that is fundamentally of cohort character. To see the potential magnitude of error with realistic fertility schedules and paces of postponement, we performed an additional simulation. In the simulation, we have used an age schedule of fertility based on the schedule of the French cohort of 1945; differently from Section 8.1 above we look at all birth orders combined. Rather than sudden change from one cohort to the next, we assumed that postponement transition happened gradually over 10 cohorts, increasing the cohort mean age at childbearing from about 24 to about 27. This cohort transition produces an increase in the period schedule by the same amount over the course of about 30 years. In order to make the simulation relevant for lowest-low fertility, the cohort quantum of fertility was kept constant at 1.6 children per woman. The first panel of Figure S3 shows the entire Lexis surface during the cohort transition of fertility to older ages. We see that the change happens over a narrow number of cohorts but a wider number of periods. The verisimilitude of the simulation can be seen in the path of the observed TFR shown in the second panel. The period TFR begins at 1.6 and then falls rapidly to lowest-low levels, under 1.3, where it remains for about a decade. Full recovery of period fertility then occurs over an additional two decades. The rise in the mean age of the period schedule is shown in panel 3, along with the pace of postponement in panel 4. The mean rises rapidly as the transition begins because the youngest women are suddenly bearing many fewer children. The pace of postponement slows after ten years, when postponement effectively ends at the younger ages. About 20 years after the first cohort began postponement we see that the pace of period postponement briefly picks up again. This is the result of ‘recuperation’, when the first postponing cohorts reach older ages and fertility rates at old ages thus begin to increase. After about 50 years the transition comes to an end. The Bongaarts-Feeney tempo-adjusted TFR produced by this more realistic cohort-postponement transition is shown by the dashed line in the panel with the TFR (Panel 2). We see qualitatively the same M-shaped pattern in tempo-adjusted fertility that we saw in the simple tabular illustration above: first an overestimate, then an underestimate, and finally again an overestimate of quantum. Our simulation allows
57
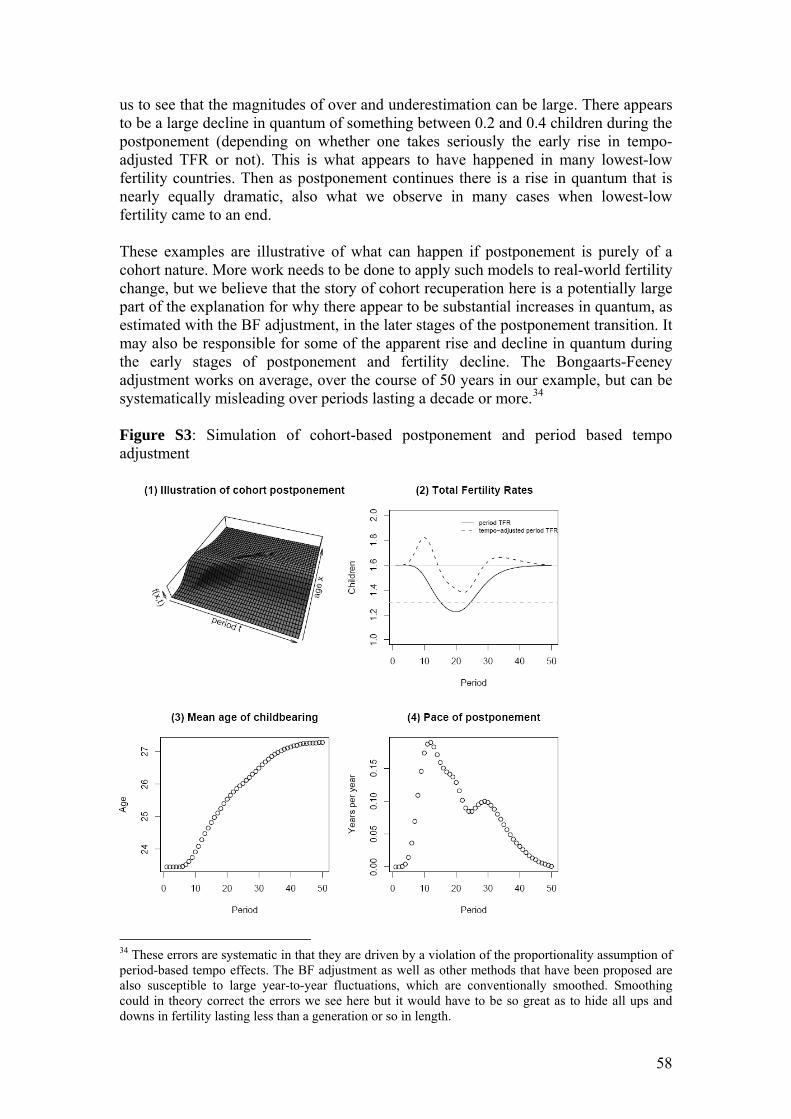
us to see that the magnitudes of over and underestimation can be large. There appears to be a large decline in quantum of something between 0.2 and 0.4 children during the postponement (depending on whether one takes seriously the early rise in tempo-adjusted TFR or not). This is what appears to have happened in many lowest-low fertility countries. Then as postponement continues there is a rise in quantum that is nearly equally dramatic, also what we observe in many cases when lowest-low fertility came to an end. These examples are illustrative of what can happen if postponement is purely of a cohort nature. More work needs to be done to apply such models to real-world fertility change, but we believe that the story of cohort recuperation here is a potentially large part of the explanation for why there appear to be substantial increases in quantum, as estimated with the BF adjustment, in the later stages of the postponement transition. It may also be responsible for some of the apparent rise and decline in quantum during the early stages of postponement and fertility decline. The Bongaarts-Feeney adjustment works on average, over the course of 50 years in our example, but can be systematically misleading over periods lasting a decade or more.34 Figure S3: Simulation of cohort-based postponement and period based tempo adjustment
34 These errors are systematic in that they are driven by a violation of the proportionality assumption of period-based tempo effects. The BF adjustment as well as other methods that have been proposed are also susceptible to large year-to-year fluctuations, which are conventionally smoothed. Smoothing could in theory correct the errors we see here but it would have to be so great as to hide all ups and downs in fertility lasting less than a generation or so in length.
58