Embed Size (px)
Citation preview
The Emperor has no Data! Agricultural Statistics in Sub-Saharan Africa
Calogero Carletto Dean Jolliffe
Raka Banerjee
I. Introduction “He uses statistics like a drunk uses lamp-post, more for support than illumination”
Romano Prodi Few people would contest the assertion that agricultural development is an essential engine of growth in sub-Saharan Africa, where nearly 75 percent of the extreme poor still reside in rural areas, and over 90 percent participate in agriculture. The key lies in the fact that agricultural development results in greater benefits accruing to the poorest segments of the population, with a 1 percent rise in agricultural GDP resulting in a 6 percent rise in income growth for the lowest income decile of the population (Chen and Ravallion, 2007; Ligon and Sadoulet, 2008). Thus, understanding agriculture as an integral part of the complex rural economy must be a critical component of any poverty reduction strategy in sub-Saharan Africa. Because smallholder agriculture is the predominant form of farm organization in Africa, smallholder agricultural productivity growth continues to be heralded as a key driver of poverty reduction in the region and around the world: for every 10 percent increase in farm yields, there has been a 7 percent reduction in poverty in Africa (Irz et al., 2001). And, the pool of smallholders in the continent is enormous: there are 33 million small farms that each holds less than two hectares, representing 80 percent of all farms in the continent (FAO, 2009). If history provides any lessons, leapfrogging productivity growth in the agricultural sector has hardly ever proven a feasible development strategy. However, despite the importance of the agricultural sector in reducing poverty and food insecurity in the region, and the key role played by smallholder agriculture in the sector and in the economy as a whole, serious weaknesses persist in the ways we measure and monitor agricultural outputs and outcomes. As governments and donors alike target agriculture for large-scale investments with grandiose goals of raising agricultural productivity multifold, little is done in ensuring that the right statistics are produced to monitor the health and wealth of the sector. For instance, of the 44 countries in sub-Saharan Africa rated by the Food and Agricultural Organization, only two are considered to have high standards in data collection, while standards in 21 countries remain low (FAO, 2008). The scope of coverage and

completeness also varies widely (see for example, the four-country case studies by Kelly and Donovan, 2008). Knowledge about agriculture and its impact on welfare and equity is limited by the lack of available, high quality, and consistent data on farm households. In their review of agricultural development, rural non-farm activities, and rural poverty, Foster and Rosenzweig (2008) note that “very few studies permit the direct comparison over time using comparable measures…”. Other studies have likewise noted that inconsistencies and other quality issues limit analysis (Tiffen, 2003; Ngendaumana, 2001). Past investments and technical assistance efforts in the area of agricultural statistics have failed to produce sustainable systems, which continue to suffer from poor quality, lack of relevance, and little use in countries’ policy dialogues (Binswanger, 2008). Compounding to the sheer lack of data, methodological improvements in smallholder agricultural statistics have been particularly sluggish over the past three decades and present the typical market failure problem, with clear disincentives for private investments. This has led to serious gaps in knowledge and has hampered the ability to identify and promote effective innovation and sources of sectoral growth. Consequently, while the debate rages on how to best harness the still untapped potential of agriculture to reduce poverty in SSA, in this paper we tackle a more primordial, yet equally important, question: how much do we really know about the state of agriculture in Africa and its contribution to the “wealth of the nations”? As forcefully argued by Jerven (2013), we probably know less that we’d like to think. If that is the case, then a second question is in order: what can be done to reverse the situation? To that end, in this paper we describe a number of initiatives aimed at addressing the problem of quality of agricultural statistics in Africa and highlight selected work in the area of methodological research in agricultural data collection. Compounding the problem of poor agricultural statistics both in terms of availability and quality is the scarce policy relevance of the available data to unpack its contribution to poverty reduction. Abstracting for a moment from the obvious issues of potential endogeneity to unequivocally identify the relationship between productivity growth and poverty, a more basic shortcoming becomes apparent: where are the data to even start asking the question? Surprisingly, very few datasets contain both poverty and detailed agricultural information to rigorously analyze the relationship, particularly on a national scale. Traditionally, farm surveys have focused on the agronomic aspects of farming, with little or no information on the socio-economic dimensions of either agriculture or non-farm activities. Limitations in sampling design of most farm surveys, and their exclusive focus on farming units, also conditions the analysis and the policy-relevance of the findings. An integrated approach is thus needed to go beyond measurement and into understanding agricultural production and its linkages with the non-farm sector as well as with outcomes of interest, being this poverty, nutrition or food security, inter alia. Furthermore, it is only by better connecting information on farm, households and ecosystems that one can hope to gain the right understanding on agricultural productivity and its relationship to key outcomes.

Finally, the institutional setting is conducive of poor coordination and inefficiencies. Traditionally, agricultural statistics have often been collected outside of the National Statistical System, with little or no oversight by the National Statistical Office, responsible for the enforcement of statistical standards and best practices. As a results, agricultural statistics have “fallen between the cracks” in terms of statistical integrity. Further boosting these institutional inefficiencies is the compartmentalized set-up and modus operandi of development partners, focusing on the proverbial tree (agriculture) while missing the forest (the rural space and, more generally, the ecosystem). And the focus on farms exclusively as a production unit, rather than the household as both a production and consumption unit, involved in agriculture as well as in non-farm and/or non-labor activities has also led to an ineffective system of data production. Notwithstanding the pervasiveness of weaknesses over a broad spectrum of agricultural statistics, section II of this paper highlights some of the issues in a selective manner, by focusing on targeted areas of methodological research being carried out under the Living Standards Measurement Study (LSMS) program. Section III discusses some of the key measurement challenges and section IV offers some solutions. Thus, the paper is not meant to be a comprehensive review of issues and solutions but rather a purposive discussion of some of the shortcomings which could feasibly be tackled in the near future through rigorous methodological validation and countries’ buy-in of new protocols.
II. Agricultural statistics in Africa: an irreversible tragedy? By calling it a “tragedy”, Devarajan’s (forthcoming) assessment of statistics in Africa is certainly not an understatement. A couple of simple examples justify this stark assessment and highlight the magnitude of the problem. In Figure 1 we report the annual average maize yields for maize in Tanzania, as reported in FAOStat. The trend, particularly the huge variation in the early 2000s, does raise eyebrows. Even more disturbing is the lack of documentation to be able to ascertain where the actual problems may lie.
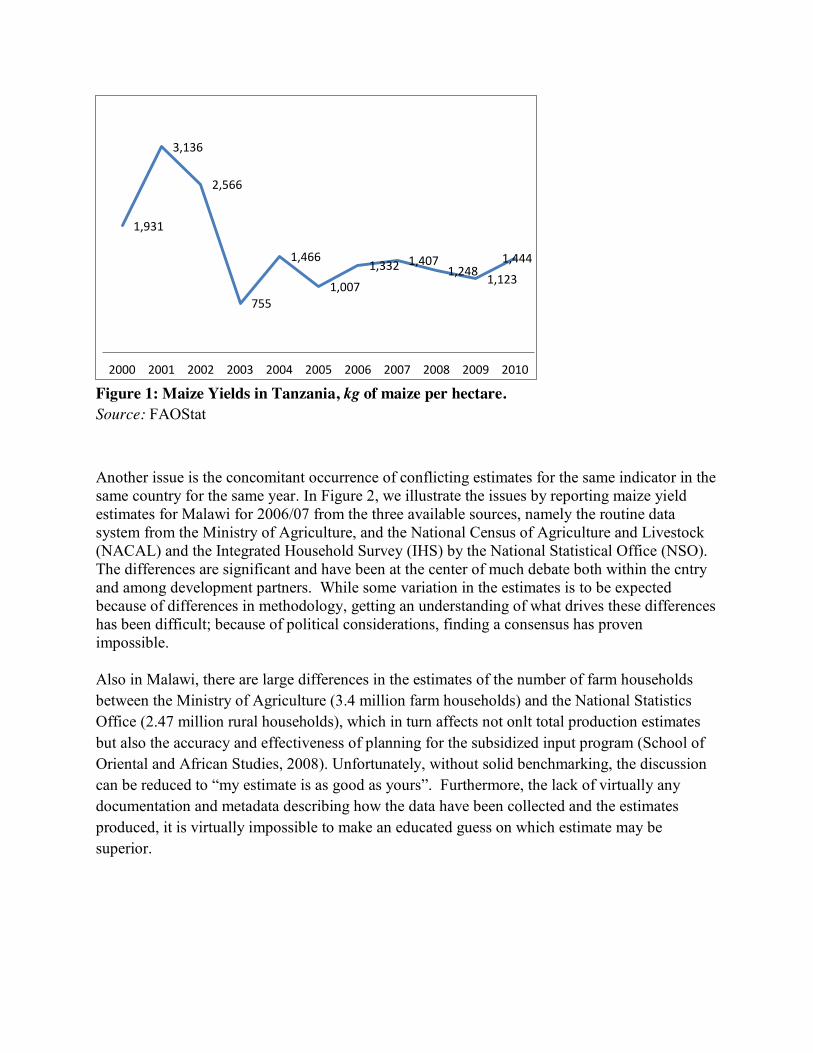
Figure 1: Maize Yields in Tanzania, kg of maize per hectare. Source: FAOStat Another issue is the concomitant occurrence of conflicting estimates for the same indicator in the same country for the same year. In Figure 2, we illustrate the issues by reporting maize yield estimates for Malawi for 2006/07 from the three available sources, namely the routine data system from the Ministry of Agriculture, and the National Census of Agriculture and Livestock (NACAL) and the Integrated Household Survey (IHS) by the National Statistical Office (NSO). The differences are significant and have been at the center of much debate both within the cntry and among development partners. While some variation in the estimates is to be expected because of differences in methodology, getting an understanding of what drives these differences has been difficult; because of political considerations, finding a consensus has proven impossible. Also in Malawi, there are large differences in the estimates of the number of farm households between the Ministry of Agriculture (3.4 million farm households) and the National Statistics Office (2.47 million rural households), which in turn affects not onlt total production estimates but also the accuracy and effectiveness of planning for the subsidized input program (School of Oriental and African Studies, 2008). Unfortunately, without solid benchmarking, the discussion can be reduced to “my estimate is as good as yours”. Furthermore, the lack of virtually any documentation and metadata describing how the data have been collected and the estimates produced, it is virtually impossible to make an educated guess on which estimate may be superior.
1,931
3,136
2,566
755
1,466
1,007
1,332 1,407 1,248
1,123
1,444
2000 2001 2002 2003 2004 2005 2006 2007 2008 2009 2010

Figure 2: 2006/07 Maize yields from Malawi Sources: Ministry of Agriculture, National Statistical Office Also, the ambiguity in the institutional mandate for the collection of agricultural statistics makes the choice even more blurred. Take the example of Ethiopia. Until recently, crop production estimates were produced by both the Ministry of Agriculture and Rural Development (MoARD) and the Central Statistical Agency (CSA). The discrepancy in the estimates has always been striking, with MoARD estimates considerably higher than the already high CSA estimates. Which estimate is closer to the true production? The fact that the two estimates are so different should come to no surprise in light of the radically different methodologies to estimate both area under cultivation and total production. Years of arguments finally led to an institutional “settlement”, with CSA now in charge of producing and reporting annual estimates of production of the main crops based on the Agricultural Sample Survey. But, even those figures continue to be the subject of heated debates. Agricultural data are generally produced from three different sources. Routine data system based on systems of resident or local extension officers exists in virtually all countries. Extension officers collect different type of data on a regular basis at a geographically granular level, including information on land usage, crop forecasting and production. One major drawback of current routine data systems is the high degree of arbitrariness and subjectivity in the data collection protocols. The lack of statistical rigor is likely to lead to systematic biases, while the lack of documentation on the actually data collection procedures often hinders any attempt of comparison and reconciliation with other data sources. A second source of agricultural data is the agricultural census which, based on FAO guidelines, countries are recommended to implement every ten years. However, because of the high costs of full enumeration and the rather limited amount of information collected, agricultural censuses are less and less common, leading many experts to even question the feasibility of a decennial census in African countries.
0.00
0.50
1.00
1.50
2.00
2.50
3.00
Source 1 Source 2 Source 3
kg ,0
00/h
a

Surveys are the third source of data on agriculture. Farm surveys have been, and still are, the backbone of agricultural statistics in Africa, with great variation in terms of content, frequency and quality. While in principle indispensable to get a good depiction of the agricultural sector based on sound statistical principle, there are at least two major drawbacks. One the one hand, the statistical properties of many farm surveys have been repeatedly questioned. On the other hand, by focusing almost exclusively on measuring agriculture, they fail to provide enough information to understand it. In fact, even among the most remote and poorest rural household, agriculture does not exists in a vacuum and diversification in terms of income sources at both the household and individual level is the norm, not the exception (Davis et al, 20__). Shifting the attention from the farm to the household as a unit of analysis, and expanding the thematic coverage of the survey, would partly solve the problem. Integrated household surveys do that, but not without cost. First, the breath of the data collected may result in significant trade-offs in terms of depth. Also, the timing must be adjusted to the agricultural season, and the added requirements of collecting information on highly seasonal and fast changing processes. But sampling is probably the most challenging aspect because of the differences in sampling requirement and optimal domains of inference of the different variables. We return to these points in the latter part of this paper.
III. Measuring agricultural productivity: in search of the holy “method” The case for agricultural-led poverty reduction rests heavily on the ‘productive efficiency of small farms’ (Ashley & Maxwell, 2001). One statistic of special policy relevance in the poverty debate is the measurement of agricultural productivity. Improvement in the measurement of land productivity is identified as priority number one by the Global Strategy to Improve Agricultural and Rural Statistics, a recent multi-agency initiative endorsed by the United Nations Statistical Commission in February 2010. One of the main goals of the Global Strategy is to develop new protocols and best practices for the estimation of a core set of agricultural indicators through the promoting of methodological research and the compilation and dissemination of key findings. There are many ways to measure productivity, whether based on the return to a single factor of production or multiple ones. In this section, we will focus on land productivity, or yields, equivalent to the amount or value of crop harvested (the numerator) over cultivated land (the denominator). In this respect, we will provide s description of the different methods commonly used to estimates crop production as well as land area, and report on the findings some recent research comparing the different methods.
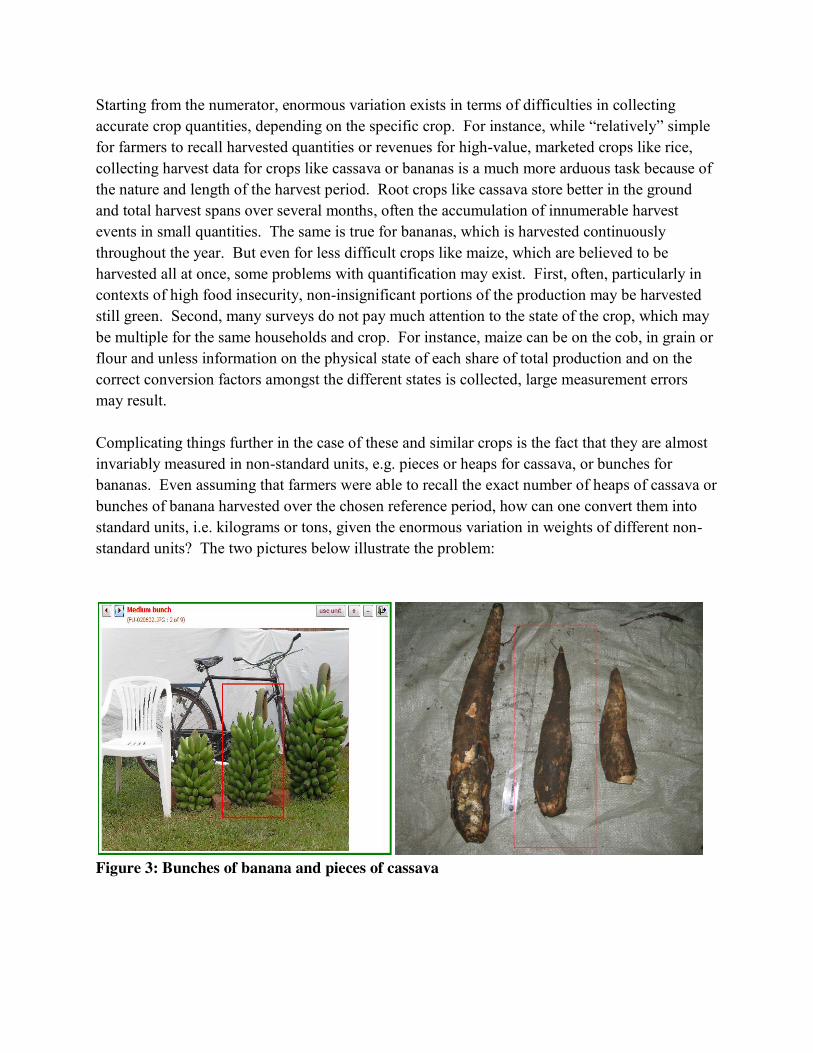
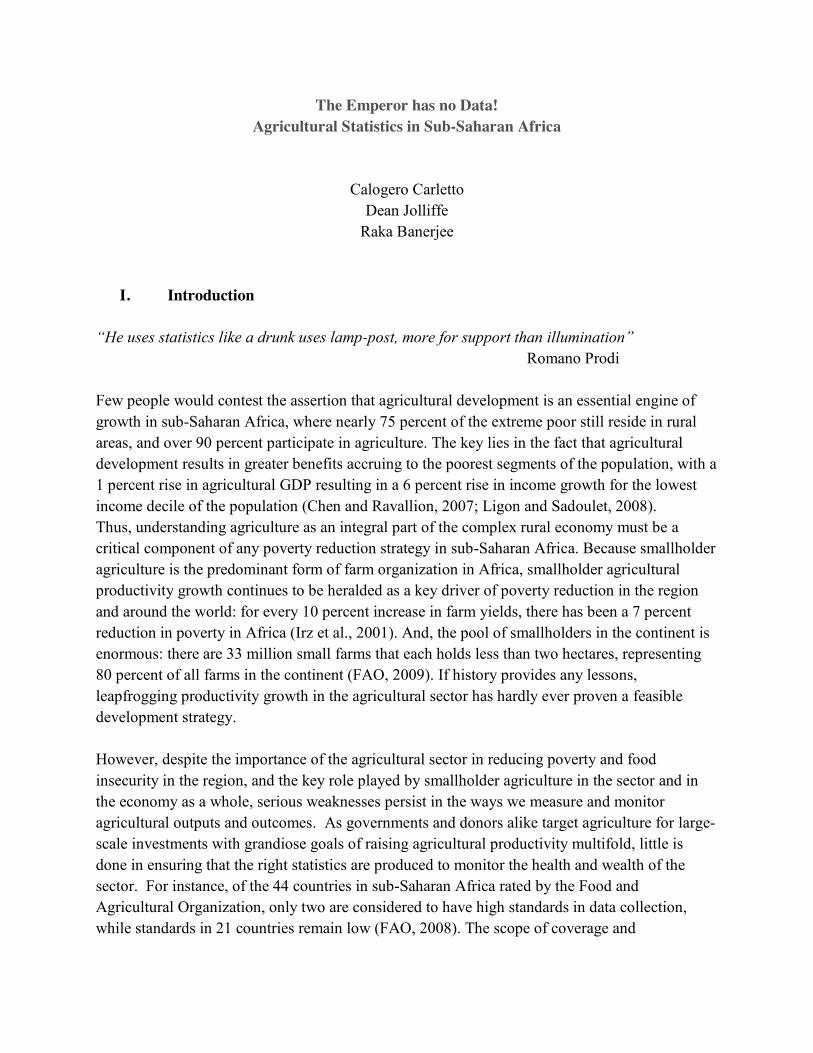
Starting from the numerator, enormous variation exists in terms of difficulties in collecting accurate crop quantities, depending on the specific crop. For instance, while “relatively” simple for farmers to recall harvested quantities or revenues for high-value, marketed crops like rice, collecting harvest data for crops like cassava or bananas is a much more arduous task because of the nature and length of the harvest period. Root crops like cassava store better in the ground and total harvest spans over several months, often the accumulation of innumerable harvest events in small quantities. The same is true for bananas, which is harvested continuously throughout the year. But even for less difficult crops like maize, which are believed to be harvested all at once, some problems with quantification may exist. First, often, particularly in contexts of high food insecurity, non-insignificant portions of the production may be harvested still green. Second, many surveys do not pay much attention to the state of the crop, which may be multiple for the same households and crop. For instance, maize can be on the cob, in grain or flour and unless information on the physical state of each share of total production and on the correct conversion factors amongst the different states is collected, large measurement errors may result. Complicating things further in the case of these and similar crops is the fact that they are almost invariably measured in non-standard units, e.g. pieces or heaps for cassava, or bunches for bananas. Even assuming that farmers were able to recall the exact number of heaps of cassava or bunches of banana harvested over the chosen reference period, how can one convert them into standard units, i.e. kilograms or tons, given the enormous variation in weights of different non-standard units? The two pictures below illustrate the problem:
Figure 3: Bunches of banana and pieces of cassava
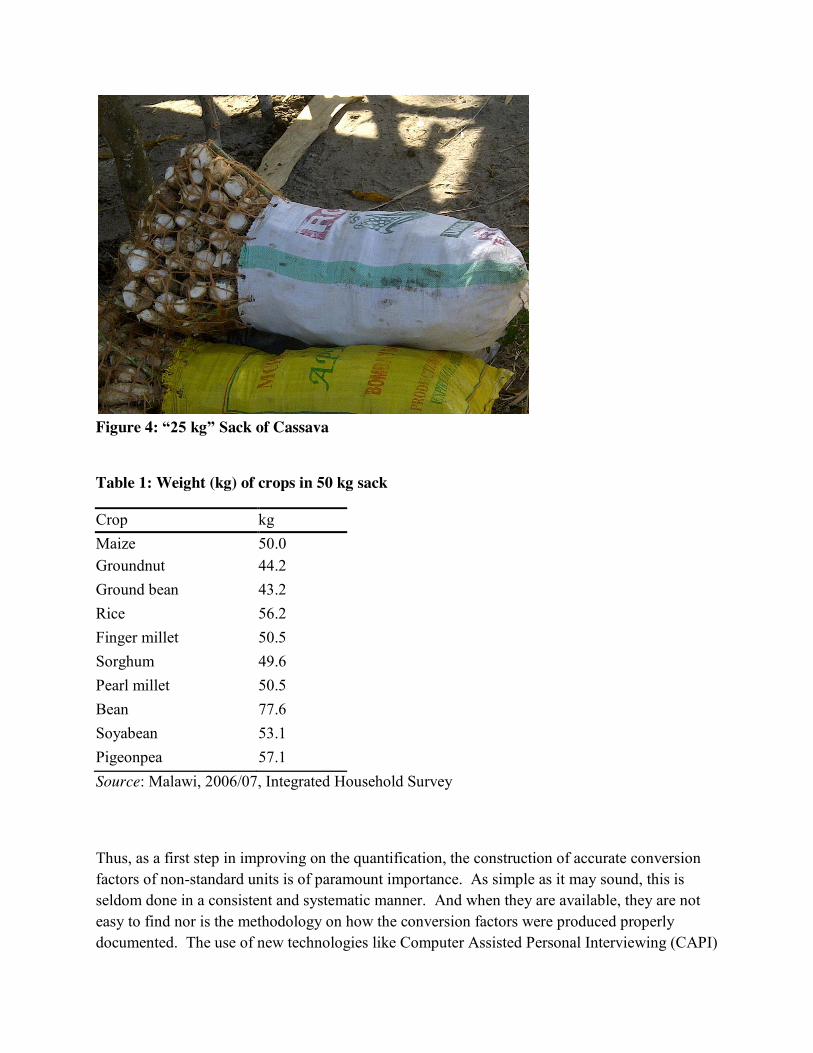
Figure 4: “25 kg” Sack of Cassava
Table 1: Weight (kg) of crops in 50 kg sack
Crop kg Maize 50.0 Groundnut 44.2 Ground bean 43.2 Rice 56.2 Finger millet 50.5 Sorghum 49.6 Pearl millet 50.5 Bean 77.6 Soyabean 53.1 Pigeonpea 57.1 Source: Malawi, 2006/07, Integrated Household Survey
Thus, as a first step in improving on the quantification, the construction of accurate conversion factors of non-standard units is of paramount importance. As simple as it may sound, this is seldom done in a consistent and systematic manner. And when they are available, they are not easy to find nor is the methodology on how the conversion factors were produced properly documented. The use of new technologies like Computer Assisted Personal Interviewing (CAPI)
can be instrumental in supporting the proper conversion of farmers’ responses into standard units by providing a visual interface with the respondents during the interview. However, the construction of comprehensive libraries for all possible non-standard units in each specific region of each country is often a missing input to a fully effective CAPI design. Regardless of CAPI, similar types of visual aid in the form of laminated cards with the pictures have also been applied in PAPI surveys (see, for instance, the most recent Malawi figures). Even with proper conversion factors in hand, there continue to be challenges in measuring crop production quantities and/or values. We have already hinted to the difficulties for farmers to recall events over periods of several weeks or months. One major complication is due to the fact that the most poor smallholders, the largest share of production is consumed, thus never reaching the market. As a result, quantification and valuation of own-production consumed by the household is particularly challenging, in part due to the fact that farm-gate prices are rarely available in these cases. Lacking farm-gate prices, valuation is generally based on either market prices or unit values derived from the survey by computing an average (or median) value over some geographic area of reference. In addition to the fact that these prices do not properly reflect the value of production, other difficulties result from the fact that frequently large variation in prices exist across the year. Another potential source of measurement error in properly valuing unsold own-production results from the fact that the poorest farmers tend to sell low (immediately following the harvest) and buy high (prior to harvest, when stocks have been depleted). Somewhat surprisingly, the lack of adequate price data continue being a hindering factor in the proper estimation of values of production, particularly in relation to the valuation of own production used for consumption. Even for the marketed share of production, smallholders seldom keep records of purchases and sales, and this could result in an inability to correctly recall these transactions. Beegle et al (2011), however, show that, in the context of a few African countries and for specific agricultural inputs and crops, farmers’ responses do not seem to suffer from large recall biases. Instead, respondents tend to recall rather accurately over periods of several months, particularly more salient events like costly fertilizer purchases and the bulk sale of crops, especially cash crops. Despite these positive findings on the low level of recall error for transactions of staple crops such as maize and cash crops like tobacco, it is difficult to imagine how the same findings would apply to root crops like cassava and continuous crops like banana. What are then the options to try to quantify these types of crops which represent a significant share of total African agricultural output? Some recent research by Deininger et al. (2012) validate the use of harvest diaries vis a vis recall methods to estimate crop production. The authors report on the result of a field experiment as part of the 2005/06 Uganda National Household Survey (UNHS), when sampled farmers were asked to keep a diary for the entire duration of the agricultural season. Data from the diaries were compared with the responses
given by the same farmers in the course of bi-annual personal interviews using a structured questionnaire. The findings are striking: in almost all cases, farmers’ responses based on recall tend to underestimate the diary-based estimates both in terms of number of crops reported and quantities produced of each. Despite initial concerns, respondents’ fatigue in filling out the diary did not appear to be a major problem. Despite the encouraging results reported by Deininger et al., is the available empirical evidence ground for considering scaling up the use of diaries for the estimation of agricultural production? Diary has some clear potential advantages. However, the method can be costly and difficult to supervise (which implies concerns about quality). Furthermore, in countries with low literacy and numeracy, keeping diaries may be unfeasible without frequent visits by a local enumerator, thus virtually turning the diary into repeated short recalls. Surprisingly, very little additional empirical evidence beyond the Deininger et al. study exists in this area of agricultural statistics1. In terms of quantification of production, crop cutting is often considered the gold standard, but it is probably more applicable and easier to conduct for cereal crops than say for root crops or banana. Sub-plots of size ranging from 2x2 meters (generally for cereal) to 5x5 meters (for root crops) are randomly selected from (randomly selected) plots of sample households. The procedure is time consuming and costly, requiring multiple visits from planting to harvest. Because of the high costs, it is not common in large farm and household surveys and other times practiced on a selected basis, as in the case of Ethiopia as part of the Agricultural Sample Survey, where estimates for individual crops are generated from five crop cuts in each primary sampling unit (PSU). The five cuts are then averaged at the PSU level and aggregated up to obtain crop estimates for the different domains of inference allowed by the sample design. Other problem in estimating crop production is associated with intercropping, the common practice of cultivating multiple crops in the same plot. One problem with that is that it is not clear how to allocate the different crops to the plot area. Different alternatives are suggested in the literature, and different surveys tend to treat the issue differently and collect different information. Probably the preferred methods, but not the simplest, would be to apply some notion of seeding rate to estimate the actual area under cultivation for that particular crop. Easier alternatives include asking the farmer’s own assessment of the share of the land allocated to that crop or simply do nothing and allocated the entirety of the area to each crop grown on it. Needless to say, different methods result in significant differences in terms of average yields, thus resulting in poor comparability in countries’ estimates. This is why yields are often reported only for pure stand crops, or estimates are presented separately for the different cultivation practices.
1 For some examples on consumption diaries, see Beegle et al (2010), Ahmed et al., 2006; Battistin, 2004; Gibson, 2002 and 1999; Jolliffe, 1995, Gieseman, 1987.
This far we have discussed some of the techniques and issues related to the estimation of crop quantities. Let’s now turn to the denominator of a yield measure, i.e. the estimation of land area. According to FAO, traversing (a.k.a. compass and rope, or compass and tape) is considered the gold standard. However, its implementation is time-consuming and costly. For instance, a study as part of the 2003 pilot of the Uganda Agricultural Census compared land measurement by traversing versus GPS units, and found that the average time use per plot measured was over three hours for traversing, more than three times as much as when the GPS technology was employed (Schoning et al., 2005). Traversing is therefore seldom feasible in the context of large national household surveys. Another option for land area measurement, delineating parcel boundaries on satellite imagery, is a potentially accurate alternative, but at present largely impractical, particularly in tree-dense areas and areas with regular cloud cover (where the ability to make accurate and timely measures is limited). The spatial and temporal extent of national household surveys generally makes the acquisition and processing of such high resolution imagery largely cost prohibitive. Another option, which, surprisingly, appears to be widely used in routine data collection is based on “eye estimates” by extension officers. In addition to the measure of the actual plot being highly subjective, the choice of the plots is also highly arbitrary, thus resulting in highly inaccurate and likely biased estimates. The two options which are most commonly used are probably farmer’s self-reporting and area measurement based on Global Positioning System (GPS). In spite of their widespread use in household and farm surveys, farmers’ reported measured are also believed to be highly imprecise, particularly in land-abundant context. There are a number of reasons why self-reported land areas may be subject to measurement error. First, farmers may knowingly over- or under-state their landholdings for strategic reasons if they perceive information may be used for a certain purpose such as property taxes or access to a program. Second, there are also a number of factors that can increase the likelihood of unintentional error. There is a natural tendency to round off numbers and provide approximations of land areas, which leads to lumping of the data.
Geography, particularly parcel slope, can also change the way farmers interpret the land (Keita and Carfagna, 2009). Slope-related effects on area measurement are rooted in the fact that the actual area should be the horizontal projection of the parcel, as opposed to the parcel area itself since plants and trees grow vertically and not perpendicularly to the slope and thus require for their growth some kind of vertical cylinder of soil (Keita, Carfagna and Mu’Ammar, 2010;; Muwanga-Zake, 1985). The difference between actual area and projection appear to be particularly important for slopes greater than 10 degrees (Fermont and Benson, 2011). Finally, as already seen in the case of the numerator, one additional cause of error is the common use of non standard units, even across different regions within the same country. Table 2 lists different conversion factors for different regions within the country, exemplifies the problem.

Table 2: Zone-specific Conversion Factors into Hectares
Zone
Conversion Factors
Heaps Ridges Stands
1 0.00012 0.00270 0.00006 2 0.00016 0.00400 0.00016 3 0.00011 0.00494 0.00004 4 0.00019 0.00230 0.00004 5 0.00021 0.00230 0.00013 6 0.00012 0.00001 0.00041 Source: Nigeria,
As GPS technology becomes more affordable, accurate and user-friendly, GPS-based area measurement provides a practical alternative to farmer self-reported areas that is increasingly being applied in surveys worldwide. For example, in an assessment of agricultural data collection in Sub-Saharan Africa, Kelly et al. (2008) highlight GPS technology as having the potential to enable land area measurement to become a much less time-intensive and costly exercise. Using field experiments, Keita and Carfagna (2009) indicate that the GPS-based area measurement is a reliable alternative to traversing and that 80 percent of the sample plots were measured with negligible error.
Recent empirical evidence based on the 2005/06 Uganda National Household Survey (UNHS) comparing GPS-based and self-reported measurement of parcel areas also suggest the existence of systematic errors in self-reported parcel areas (Carletto et al., 2013). Specifically, smaller farmers consistently overreport the area of their plots, while the opposite appear to be true for larger holdings. The implications of these discrepancies in measurement for the estimation of productivity can be substantial, with farmers in the lowest land tercile on average underestimating their yield by 28 percent, and farmers in the highest tercile overestimating by about 30 percent (Carletto et al., 2013). It would then seem obvious and inexpensive to simply endow household survey enumerators and extension officer with a GPS unit and properly train them in its use to considerably improve on the current productivity estimates. Unfortunately, it is not that simple, as even GPS has its drawbacks which are yet to be fully resolved.
For instance, GPS-based coordinates are subject to known types of measurement error rooted in satellite position, signal propagation, and receivers. Approximate contributions of these factors to the overall position error range from 0.5 to 4 meters (Hofmann-Wellenhof et al., 2007). On a large plot this may not be substantial, but on a smaller plot, the errors may be significant. The number of satellites, in particular, can cause the distribution of position error to be elliptical,

rather than spherical (Diggelen, 2007). Irrespective of this, from a technical standpoint, GPS measured areas would be expected to create land data with classical measurement error.
Other source of measurement error of GPS may have to do with its topography and canopy cover, as well as with the weather conditions at the time of the measurement (Keita and Carfagna, 2009). But one crucial problem associated with GPS measurement derives from the failure to measure all plots of the sample households, possibly resulting in selectivity biases of GOS estimates. In fact, for a number of reasons associated with lowering both the costs and the duration of the survey, survey fieldwork protocols generally foresee rules leading to the exclusion of a non-random number of plots from GPS measurements. Other plots may not be measured because of other reasons, such as respondent’s refusal, or road conditions not allowing access to all plots at a given time. As a result of these processes, the data on GPS measurements of land, come with a score of missing values. It is not uncommon for as much as a third of the plots in the sample are not measured, possibly resulting in biased estimates, to the point that one could even question whether it is worth collecting such data. On-going research by one of the authors with other colleagues suggests that selectivity bias may be a problem but the careful use of imputation techniques helps overcoming the limitation and making GPS a viable alternative. In summary, the productivity measures and other agricultural statistics are highly sensitive to the method used. The lack of consensus on protocols and standards, partly due to several decades of weak methodological research, results in agricultural statistics which suffer from uncertain quality, poor comparability and low credibility.
IV. Agricultural statistics in the 21st century: reversing the tragedy “You don't have to be strong to survive a bad situation. You simply need a plan.” Shannon L. Alder To chart a new course it’s necessary to first fully understand the problem. There are several key reasons for both the poor quality of agricultural statistics and for the lack of integration of agricultural statistics into well-formed policy. First, the poorest of countries, for whom agriculture is a critical source of livelihood, often have the poorest data (African Development Bank et al, 2004). In spite of the clear need for empirical evidence, these countries lack the financial resources to generate survey or administrative data of sufficient quality and scope to inform policy. In a similar vein, limited finances can also limit the coverage of data collection efforts, often preventing a survey from achieving a nationally representative sample. In order to be able to achieve a better understanding of rural livelihoods across a given country, it is important to have data that is representative of the entire population and not just farmers or a few villages. While smaller-scale data collection projects that focus on a particular community (or a

few) can raise new ideas and allow for the validation of innovative methods of data collection, won’t result in estimates that are valid for the entire population. Without a sample that is nationally representative, it is impossible to draw inferences from the data that are valid for the entire country, thereby making it difficult to create informed nationwide policy.
Moreover, even with sufficient financial resources, they often lack human resources to collect such data in a cost-effective and sustainable manner. Uneven and one-off external support over the years (from donors, for example) can provide a short-term patch by helping to collect nationally representative data; but typically has not succeeded in leaving in place sufficient capacity to continue the data collection work when the support ends. The inconsistency of donor support directly results in an inconsistency in the data collection activities. This has large implications for data quality and for the reputation of national statistical agencies. If the implementation of a survey depends on irregular financing by donors, it becomes extremely difficult to plan for multiple years of survey efforts in advance. This then has negative repercussions for the collection of panel data, which can be a particularly powerful tool to understand how individuals and households cope to the seasonal aspects of agriculture. As a result, much of the existing data is cross-sectional rather than panel, meaning that changes across time with regards to a specific indicator cannot be captured. The data is thus unable to track the dynamics of poverty and welfare as they impact a population over time.
The difficulty of collecting reliable agricultural data is only part of the problem. A better measure of crop production or yields in isolation won’t, and shouldn’t, change social policies. The goal of policies is to improve the wellbeing of the populace; and how agriculture is linked to improved wellbeing comes through a wide-variety of channels. Agriculture comprises only one component of complex household income-generating strategies that involve multiple individuals and activities in different sectors (World Bank, 2008; Davis et al, 2007; Foster and Rosenzweig, 2008). Smallholder diversification into non-farm activities among has evolved to be the norm rather than the exception (Bryceson, 2002; Reardon, 1997; Davis et al, 2007). This diversification takes place both at the household and the individual level (Jolliffe, 2004); by taking advantage of different income sources, the rural poor can achieve higher incomes and lower risk exposure.
During the idle months of the agricultural season, for example, farmers that are able to operate a small family business or take on daily wage labor will be better able to provide for themselves as well as insulate themselves and their families from shocks related to their agricultural output. Given the ubiquity of such diversified income-generating strategies, especially among the rural poor, it is of particular importance to capture a diverse set of information on these households, in order to better understand the linkages between farm and non-farm activities, as well as between agriculture and different aspects of welfare such as nutrition and food security. Understanding the linkages between farm and non-farm activities and overall wellbeing of the households requires and integrated approach to the collection of household-survey data.

Furthermore, while there are a few survey initiatives seeking to collect multi-topic, multi-sectoral information within a single data collection effort, there is very little existing agricultural data that is disaggregated at the individual level in a way that can account for gender differences. Women account for the majority of farmers in sub-Saharan Africa (World Bank, 2008) and various sources assert that the vast majority of food production is attributable to women, thus making them the principal agents of food security and household welfare in rural areas (Ashby et al., 2009). It’s crucial then for survey data to provide more gender-disaggregated data on intra-household allocation of resources and participation in agriculture and other income-generating occupations. The complexity of agricultural data, and the problems associated with collecting reliable statistics, continues on. For instance, the role of livestock is both important for many agricultural households and also difficult to measure. In particular, for nomadic, semi-nomadic and pastoralist populations, livestock serves as the primary source of welfare. Furthermore, even for those who focus primarily on farming, livestock ownership is often a key to increasing their standard of living. Livestock ownership can mean higher animal protein consumption, a protection or buffer against shocks, as well as a regular complementary source of income for large swathes of the population in some countries. A recent analysis of the 2009 Tanzania National Panel Survey found that approximately three out of five rural households reported some income from livestock activities; on average, households earned 22 percent of total household income from the rearing of livestock (Covarrubias et al., 2012).
If a country were able to regularly produce reliable agricultural data that was representative of the population at large, and collected this data in a multi-topic, multi-sectoral instrument that accounted for differences across individuals within the households, this would be a tremendous step forward. But, it isn’t sufficient to ensure that the data will be used to help shape better policy. The creation of the right input doesn’t ensure that it will be properly used if it’s not shared or understood. Regrettably, agricultural data are often collected in institutional isolation, with little coordination across sectors and little analytical value-added beyond the sector. In many countries, the data collected by the ministries of agriculture are not linked or utilized in conjunction with data available from the national statistical offices or other line ministries such as labor, education and health.2 In part, this is another consequence of the longstanding failure to recognize the concept that rural economies are diverse and that this diversification is found within households. This issue was recognized by the Task Team on Food, Agriculture and Rural Statistics (Paris21, 2002), whose key recommendations included re-thinking agricultural surveys by broadening their scope to include both agricultural and non-agricultural activities, as well as by improving the coordination of the various agencies responsible for the production of agricultural statistics. Coordination 2 In Malawi, for example, there are large differences in the estimates of the number of farm households between the Ministry of Agriculture (3.4 million farm households) and the National Statistics Office (2.47 million rural households), which in turn affects the accuracy and effectiveness of planning for the subsidized input program (School of Oriental and African Studies, 2008).
requires communication, and one important form of communication is the ability to share and exchange data. The most effective way for different data files to speak to each other is to have common identifying traits in each file allowing data from different agencies and institutions to be easily merged. Without these standardized identifying variables the data files are isolated; with them, the potential value of the data to inform policy is greatly enhanced. Most countries with well-functioning data infrastructure solve this problem through a series of standard identification for geographic regions,3 or by embedding internationally accepted measures of location such as latitude and longitude degrees. Currently, in most Sub-Saharan African countries, this self-imposed discipline of using standard codes across Ministries is not commonplace and the result is a series of agency-specific data silos rather than an effective, federal data architecture. A final cause of poor data that warrants mention is the lack of analytical capacity in developing countries, which has created a vicious cycle of poor analysis undermining the demand for high-quality data. Poor dissemination of the available data and results has further aggravated the problem. For example, the national and regional reports from the 2003 Agricultural Census Sample Survey (ACSS) in Tanzania were only produced in 2006-2007 (Kaimu and Muñoz, 2007). Although these problems are common to developing countries around the globe, the problem appears to be more acute in sub-Saharan African countries. The 2002 Paris21 Taskforce stressed the importance of strengthening the statistical and analytical capacities of the data producers. It must be emphasized, though, that integration and coordination also come at some costs which, if ignored, may hinder progress. When integrating different sectoral information into a single instrument, breadth is obtained at the cost of depth, in order to keep respondent’s fatigues to a minimum. Also, sampling issues arise, as obtaining representativeness for different domains of inferences (administrative versus agro-ecological zones) and different unit or analysis (household versus farms, individuals versus crops) is a challenge.
In essence, understanding agriculture as an integral part of the complex rural economy, as well as the agricultural links that exist between rural and urban economies and populations, is a critical component of any poverty reduction strategy in Sub-Saharan Africa. However, existing data suffer from inconsistent investment, institutional and sectoral isolation, and weaknesses in methods. This, combined with a lack of in-country analytic capacity, has led to serious gaps in knowledge and has hampered the ability to identify and promote effective innovation and sources of sectoral growth. The present food crisis has sharply highlighted both the importance
3 For example, the United States National Institute of Standards and Technology (NIST) develops and maintains Federal Information Processing Standards (FIPS) to facilitate interoperability across agencies. One function of FIPS is to provide a series of numeric identifying codes for geographic regions at several layers of resolution, and US Law then mandates that all government agencies use these codes when referring to specific geographic areas in their data files.

of sound agricultural policies as well as the weaknesses in agricultural information systems that hinder knowledge generation, innovation and change.

LSMS-ISA: Living Standards Measurement Study – Integrated Surveys on Agriculture
Recognizing that existing agricultural data in Sub-Saharan Africa suffers from inconsistent investment, institutional and sectoral isolation, and methodological weakness, the LSMS-ISA project collaborates with partner national statistics offices to design and implement systems of multi-topic, nationally representative panel household surveys with a strong focus on agriculture. The primary objectives of the project are to improve our understanding of the inter-relationship between agriculture and poverty reduction, to improve the capacity of national statistics offices to collect and use this data to inform policy, and to foster methodological innovation in the measurement of agricultural data.
The LSMS-ISA instrument varies across countries allowing it to be tailored to the specific needs of each country, but there are several important shared traits of the LSMS-ISA.
Nationally representative. A key objective of the LSMS-ISA is to provide an empirical basis for policy makers to form decisions based on nationally representative data. LSMS-ISA sample designs are all probability-based and drawn from national (or all rural) population frames.
Multi-topic instrument. LSMS-ISA surveys are designed with a multi-topic approach in order to improve our understanding of the links between agriculture, environment, socioeconomic status, and non-farm income activities. The integration of agricultural data into a broad, multi-sectoral framework facilitates the production of data necessary to design effective agricultural policies.
Disaggregated data. The LSMS-ISA instrument collects information at many different levels including the household, individual, plot and community, in order to answer complex questions.
Geo-referenced data. LSMS-ISA provides standardized location details of sampled communities allowing the data to be linked to any other geo-referenced data for that country. LSMS-ISA also embeds common geo-spatial measures of access to markets, climate, soil and topography.
Institutional integration. LSMS-ISA is aligned closely with partner countries’ existing National Strategies for Statistical Development (NSDS), and works with countries to ensure that agricultural statistics are integrated appropriately. This allows for the sustainability of the surveys by ensuring country ownership.
Measurement Research. A mandate of LSMS-ISA is the combination of household survey work with methodological research on the process of collecting data in order to continue the process of improving timeliness and quality of the data.
Capacity building. The ultimate goal of LSMS-ISA is to create a sustainable system for the collection of integrated agricultural and related household data. The LSMS-ISA project builds capacity in a number of ways, with a combination of hands-on technical assistance, regional data-focused workshops, and collaboration with local researchers for analysis of the data.
V. Conclusion
Knowledge gaps in the area of agricultural statistics remain endemic and the challenges ahead are daunting. Given the importance of the agricultural sector to promote growth and reduce poverty, improving the availability, quality and policy relevance of agricultural data is of paramount importance for countries in Africa. Initiatives like the Global Strategy to Improve Agriculture and Rural Statistics, and the ensuing plan of action, are a step in the right direction in bringing attention to a painful reality of debilitating proportions.
Countries in Africa are often lacking the most fundamental information to inform the design of effective policies and programs in agriculture and the rural space. Reversing this situation will take a concerted effort by individual countries and stakeholders in developing and implementing standards and best practices in agricultural statistics. Because of the moribund state in which agricultural statistics rests following decades of apathy and inadequate investments, jumpstarting the renewal process has proven rather difficult but, in light of the high stakes, failure is not an option. The window of opportunity made possible by recent events is likely to shut close soon and advancement in our knowledge of the sector and how we measure it must come about now. How we measure basic, core concepts like yields, production or input use does matter and will ultimately condition our ability to measure the impact of interventions and monitor progress in the sector. The digital revolution can certainly help in devising more efficient and cost-effective way to capture the complexity of agriculture and the progress made to date leaves room for optimism. However, embracing the digital revolution by promoting the use of technologies like Global Positioning System (GPS), Computer Assisted Personal Interviewing (CAPI) and mobile phones without paying much attention to the “analog” advances of the past may lead to inefficient allocation of resources and poor results. The rigorous validation of these new methodologies and applicability of these innovative technologies to African realities must precede any full-fledged scaling up.
Better agricultural data are needed, and are needed urgently. But, as in the tale by Hans Christian Andersen, in order not to appear unfit to one’s position, statisticians continue pretending to see (good) data where data do not exist!

REFERENCES African Development Bank et al. 2004. The Marrakech Action Plan for Statistics: Better Data for
Better Results: an Action Plan for Improving Development Statistics. 2nd International Roundtable on Managing for Development Results, Marrakech, Morocco.
Ashby, J., M. Hartl, Y. Lambrou, G. Larson, A. Lubbock, E. Pehu, and C. Ragasa (2009). “Investing in Women as Drivers of Agricultural Growth”. The World Bank, Washington, D.C.
Beegle, K., DeWeerdt, J., Friedman, J. and J. Gibson. “Methods of Household Consumption Measurement through Surveys: Experimental Results from Tanzania.” World Bank Policy Research Working Paper no. 5501. Washington, DC: World Bank, 2010.
Beegle, Kathleen, Carletto, Calogero, Himelein, Kristen. “Reliability of Recall in Agricultural Data.” World Bank Policy Research Working Paper no. 5671. Washington, DC: World Bank, 2011. doi: 10.1596/1813-9450-5671.
Binswanger, H.,( 2008). "Gates Foundation Support to African "Agricultural" Data". Presentation to the Technical Review Meeting on Household Panel Surveys in Africa, World Bank, May 19-20, Washington, DC.
Bryceson, D. F. (2002). "The Scramble in Africa: Reorienting Rural Livelihoods." World Development 30(5): 725-239.
Caeyers, B., Chalmers, N. A. and De Weerdt, J. (2010). “A Comparison of CAPI and PAPI Through a Randomized Field Experiment.” Retrieved on 22-Aug-2012 from http://ssrn.com/abstract=1756224
Covarrubias, K., L. Nsiima, and A. Zezza (2012). “Livestock and livelihoods in rural Tanzania: A descriptive analysis of the 2009 National Panel Survey”. Joint paper of the World Bank, FAO, AU-IBAR, ILRI and the Tanzania Ministry of Livestock and Fisheries. LSMS-ISA Project, Washington, D.C.: The World Bank.
Davis, B., P. Winters, G. Carletto, A. Zezza, K. Covarrubias, E. Quinones, K. Stamoulis, S. DiGiuseppe and G.Bonomi (2007). "Rural Income Generating Activities: A Cross Country Comparison". ESA Working Paper No. 07-16, FAO, Rome.
Deaton, A., and M. Grosh (2000). "Consumption." in Grosh, Margaret and Paul Glewwe, eds. Designing Household Survey Questionnaires for Developing Countries: Lessons from 15 Years of the Living Standards Measurement Study. Washington D.C.: World Bank.
Deaton, A. and Zaidi. (2002). "Guidelines for Constructing Consumption Aggregates for Welfare Analysis." Living Standards Measurement Study Working Paper No. 135. Washington, D.C.: The World Bank.
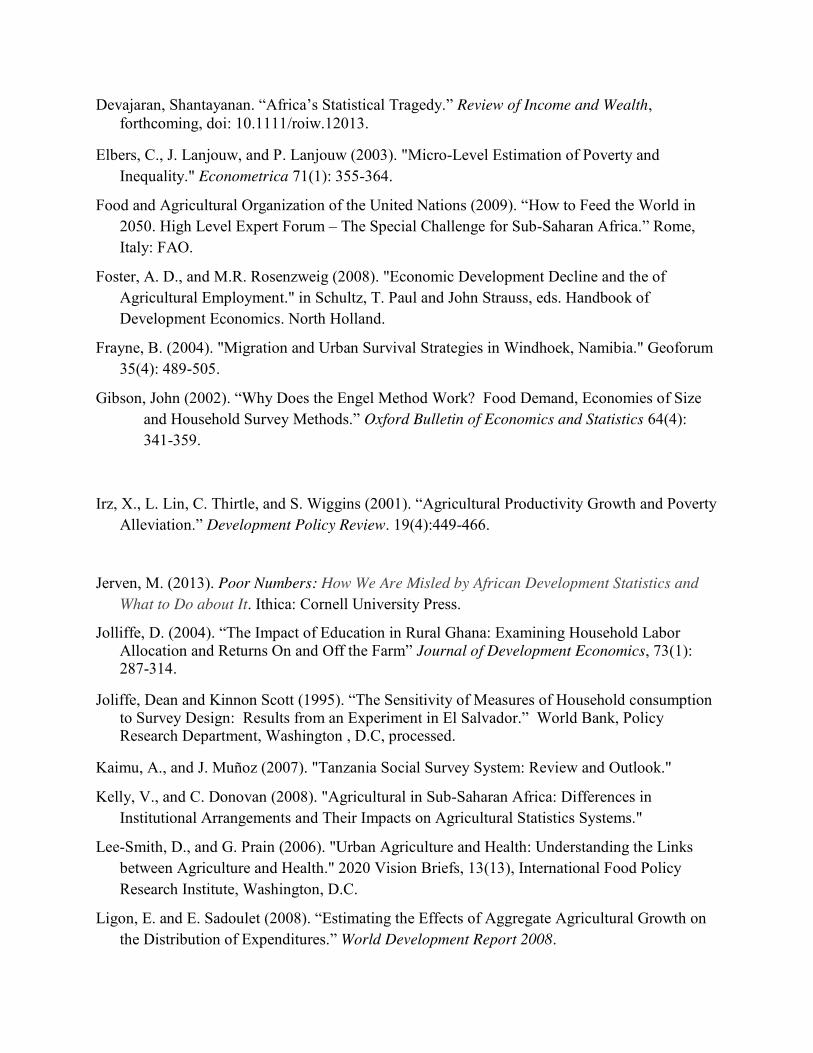
Devajaran, Shantayanan. “Africa’s Statistical Tragedy.” Review of Income and Wealth, forthcoming, doi: 10.1111/roiw.12013.
Elbers, C., J. Lanjouw, and P. Lanjouw (2003). "Micro-Level Estimation of Poverty and Inequality." Econometrica 71(1): 355-364.
Food and Agricultural Organization of the United Nations (2009). “How to Feed the World in 2050. High Level Expert Forum – The Special Challenge for Sub-Saharan Africa.” Rome, Italy: FAO.
Foster, A. D., and M.R. Rosenzweig (2008). "Economic Development Decline and the of Agricultural Employment." in Schultz, T. Paul and John Strauss, eds. Handbook of Development Economics. North Holland.
Frayne, B. (2004). "Migration and Urban Survival Strategies in Windhoek, Namibia." Geoforum 35(4): 489-505.
Gibson, John (2002). “Why Does the Engel Method Work? Food Demand, Economies of Size and Household Survey Methods.” Oxford Bulletin of Economics and Statistics 64(4): 341-359.
Irz, X., L. Lin, C. Thirtle, and S. Wiggins (2001). “Agricultural Productivity Growth and Poverty Alleviation.” Development Policy Review. 19(4):449-466.
Jerven, M. (2013). Poor Numbers: How We Are Misled by African Development Statistics and What to Do about It. Ithica: Cornell University Press.
Jolliffe, D. (2004). “The Impact of Education in Rural Ghana: Examining Household Labor Allocation and Returns On and Off the Farm” Journal of Development Economics, 73(1): 287-314.
Joliffe, Dean and Kinnon Scott (1995). “The Sensitivity of Measures of Household consumption to Survey Design: Results from an Experiment in El Salvador.” World Bank, Policy Research Department, Washington , D.C, processed.
Kaimu, A., and J. Muñoz (2007). "Tanzania Social Survey System: Review and Outlook."
Kelly, V., and C. Donovan (2008). "Agricultural in Sub-Saharan Africa: Differences in Institutional Arrangements and Their Impacts on Agricultural Statistics Systems."
Lee-Smith, D., and G. Prain (2006). "Urban Agriculture and Health: Understanding the Links between Agriculture and Health." 2020 Vision Briefs, 13(13), International Food Policy Research Institute, Washington, D.C.
Ligon, E. and E. Sadoulet (2008). “Estimating the Effects of Aggregate Agricultural Growth on the Distribution of Expenditures.” World Development Report 2008.
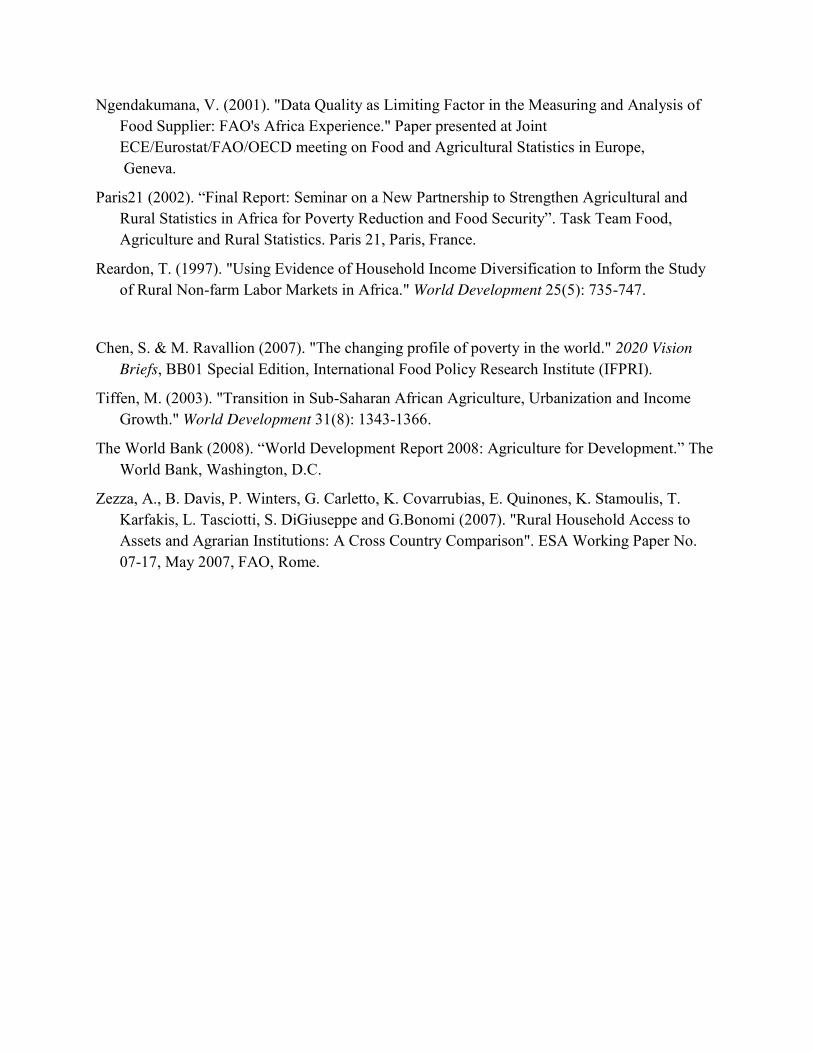
Ngendakumana, V. (2001). "Data Quality as Limiting Factor in the Measuring and Analysis of Food Supplier: FAO's Africa Experience." Paper presented at Joint ECE/Eurostat/FAO/OECD meeting on Food and Agricultural Statistics in Europe, Geneva.
Paris21 (2002). “Final Report: Seminar on a New Partnership to Strengthen Agricultural and Rural Statistics in Africa for Poverty Reduction and Food Security”. Task Team Food, Agriculture and Rural Statistics. Paris 21, Paris, France.
Reardon, T. (1997). "Using Evidence of Household Income Diversification to Inform the Study of Rural Non-farm Labor Markets in Africa." World Development 25(5): 735-747.
Chen, S. & M. Ravallion (2007). "The changing profile of poverty in the world." 2020 Vision Briefs, BB01 Special Edition, International Food Policy Research Institute (IFPRI).
Tiffen, M. (2003). "Transition in Sub-Saharan African Agriculture, Urbanization and Income Growth." World Development 31(8): 1343-1366.
The World Bank (2008). “World Development Report 2008: Agriculture for Development.” The World Bank, Washington, D.C.
Zezza, A., B. Davis, P. Winters, G. Carletto, K. Covarrubias, E. Quinones, K. Stamoulis, T. Karfakis, L. Tasciotti, S. DiGiuseppe and G.Bonomi (2007). "Rural Household Access to Assets and Agrarian Institutions: A Cross Country Comparison". ESA Working Paper No. 07-17, May 2007, FAO, Rome.