Embed Size (px)
Citation preview
1
THE ELEPHANT IN THE ROOM PROVISIONING OF LEASEHOLD LIABILITIES BY FTSE 350 COMPANIES 2013
In association with In association with
A report compiled from research carried out
by the School of Real Estate and Planning,
Henley Business School and CORE Consult
into surplus property leases. The report is
supported by Legacy Portfolio and Surplus
Property Solutions. July 2013
2
THE ELEPHANT IN THE ROOM PROVISIONING OF LEASEHOLD LIABILITIES BY FTSE 350 COMPANIES 2013
In association with In association with
CONTENTS Key findings
Introduction
The Companies Surveyed
Figure 1: FTSE 350 Turnover by Sector (£billions)
Figure 2: FTSE 350 Sector Profit Before Interest & Tax (£billions)
Surplus Leasehold Property
Figure 3: Surplus Property Provision per Sector (£millions)
Figure 4: Surplus Property as a percentage of Profit Before Interest & Tax (PBIT)
Figure 5: Surplus Liability Provision as a percentage of Lease Commitment & Sector PBIT as percentage of Turnover
Figure 6: Drivers for dealing with Surplus Property
Figure 7: Satisfaction with Current Management of Surplus Property Portfolio
Operational Lease Commitments
Figure 8: Average Company Lease Commitments Per Sector
Figure 9: Lease Length Profile Per Sector – Average Expiry Period of Leases Over 5 Years
Figure 10: Time Profile of Commitments of Sectors to Operating Leases
Figure 11: Intentions for change to Revenue, Headcount & UK Property
Methodology & Notes
Appendix – The Team
3
THE ELEPHANT IN THE ROOM PROVISIONING OF LEASEHOLD LIABILITIES BY FTSE 350 COMPANIES 2013
In association with In association with
KEY FINDINGS
• The total surplus property provision for the FTSE 350 is £4.2bn.
• This suggests a gross liability for the FTSE350 of £25.7bn and a liability for UK business of £74bn.
• The largest absolute liabilities are in TMT, Banking & Finance and Retailing, whereas
Health, Utilities, Consumer Goods and Banking & Finance sectors have the lowest provisions for surplus property liabilities against PBIT.
• The key drivers for the removal of surplus lease liabilities are to: improve operational
efficiency; improve cashflow; remove the liability from the balance sheet; and manage risk.
• Of the finance directors interviewed by HBS with onerous leasehold property 29.1% had
made no provision.
• The total operational lease rent commitment for UK business is £382bn. If rates are included this number exceeds £534bn. Rent commitment accounts for 79% of annual PBIT.
• The retail sector’s commitments to leases are equivalent to nearly 6 years’ profit before
interest and tax.
• The time profile of lease expiries shows a skew to leases beyond 5 years.
• Business is intending to expand their revenue in the next few years but only a small increase in the property portfolio is anticipated.
4
THE ELEPHANT IN THE ROOM PROVISIONING OF LEASEHOLD LIABILITIES BY FTSE 350 COMPANIES 2013
In association with In association with
INTRODUCTION This study of the lease liabilities of the FTSE 350 companies is a collaboration of the UK’s leading specialists in advising companies on how to resolve surplus property issues, Surplus Property Solutions Limited and Legacy Portfolio Limited, in association with the School of Real Estate & Planning, Henley Business School (“Henley”) and Corporate Occupier Real Estate Consulting Limited (“CORE Consult”). The research is in two parts: an examination of the published accounts of the companies by CORE Consult and a survey by Henley of the finance director’s perceptions of and attitudes towards their companies’ leasehold obligations. Both research segments excluded property companies, investment vehicles and natural resource companies, all of which have ‘non-standard’ approaches to property. This left a total of 233 companies. Surplus leasehold property liabilities are classed as “onerous contracts” under IAS37 Provisions, Contingent Liabilities and Contingent Assets. They not only constitute an obvious cost in terms of absorbing liquidity and management time, but are also a hidden millstone around the neck of business, which can heavily distort corporate decision-making. This research had three main objectives - to examine the scale of, establish current issues with, and identify trends relating to the surplus leasehold property liabilities held by the top 350 listed companies in the UK’s FTSE index. The timing of this report coincides with the latest joint release of the International Accounting Standards Board (IASB) and US Financial Accounting Standards Board (FASB) of their Exposure Draft on Leases. Further information can be found at: www.ifrs.org. It also coincides with a period of considerable activity around the disposal of surplus property portfolios by occupiers, to remove the issue in one transaction; some £500 million of liabilities have been removed in six transactions in the last few years.
5
THE ELEPHANT IN THE ROOM PROVISIONING OF LEASEHOLD LIABILITIES BY FTSE 350 COMPANIES 2013
In association with In association with
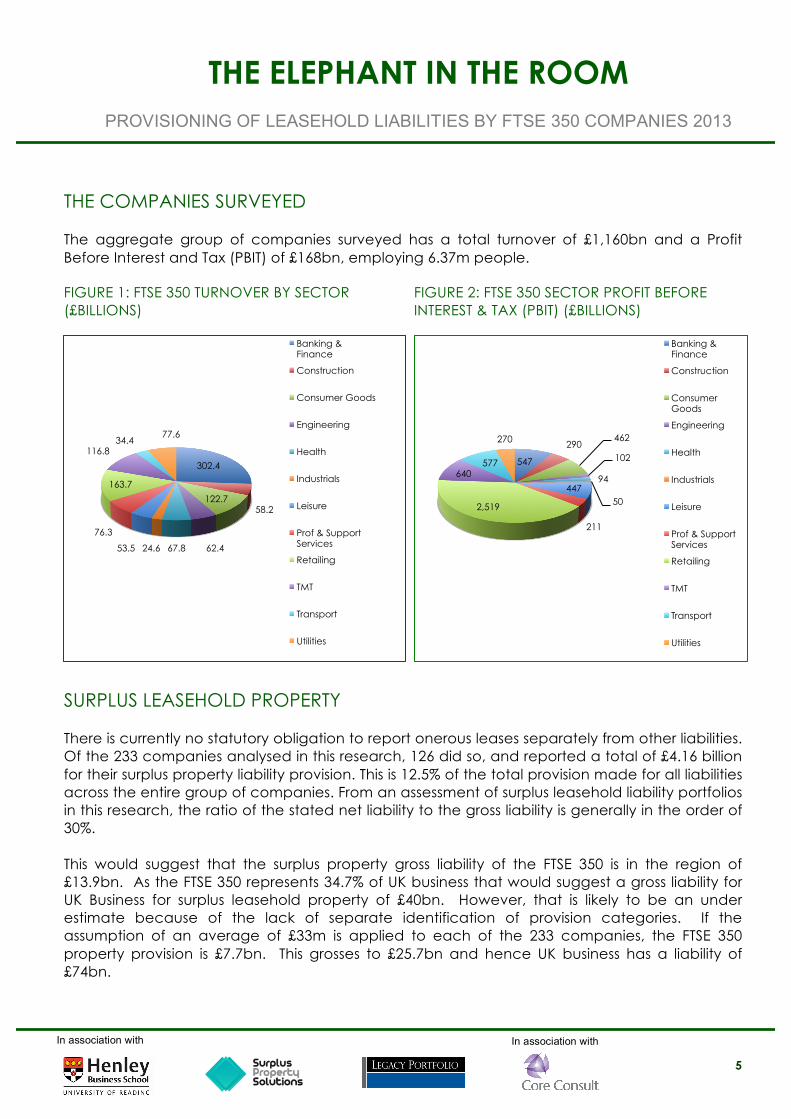
THE COMPANIES SURVEYED The aggregate group of companies surveyed has a total turnover of £1,160bn and a Profit Before Interest and Tax (PBIT) of £168bn, employing 6.37m people. FIGURE 1: FTSE 350 TURNOVER BY SECTOR (£BILLIONS)
FIGURE 2: FTSE 350 SECTOR PROFIT BEFORE INTEREST & TAX (PBIT) (£BILLIONS)
SURPLUS LEASEHOLD PROPERTY There is currently no statutory obligation to report onerous leases separately from other liabilities. Of the 233 companies analysed in this research, 126 did so, and reported a total of £4.16 billion for their surplus property liability provision. This is 12.5% of the total provision made for all liabilities across the entire group of companies. From an assessment of surplus leasehold liability portfolios in this research, the ratio of the stated net liability to the gross liability is generally in the order of 30%. This would suggest that the surplus property gross liability of the FTSE 350 is in the region of £13.9bn. As the FTSE 350 represents 34.7% of UK business that would suggest a gross liability for UK Business for surplus leasehold property of £40bn. However, that is likely to be an under estimate because of the lack of separate identification of provision categories. If the assumption of an average of £33m is applied to each of the 233 companies, the FTSE 350 property provision is £7.7bn. This grosses to £25.7bn and hence UK business has a liability of £74bn.
302.4
58.2 122.7
62.4 67.8 24.6 53.5
76.3
163.7
116.8 34.4
77.6
Banking & Finance
Construction
Consumer Goods
Engineering
Health
Industrials
Leisure
Prof & Support Services
Retailing
TMT
Transport
Utilities
547
290 462
102
94
50 447
211
2,519
640 577
270
Banking & Finance
Construction
Consumer Goods
Engineering
Health
Industrials
Leisure
Prof & Support Services
Retailing
TMT
Transport
Utilities
6
THE ELEPHANT IN THE ROOM PROVISIONING OF LEASEHOLD LIABILITIES BY FTSE 350 COMPANIES 2013
In association with In association with
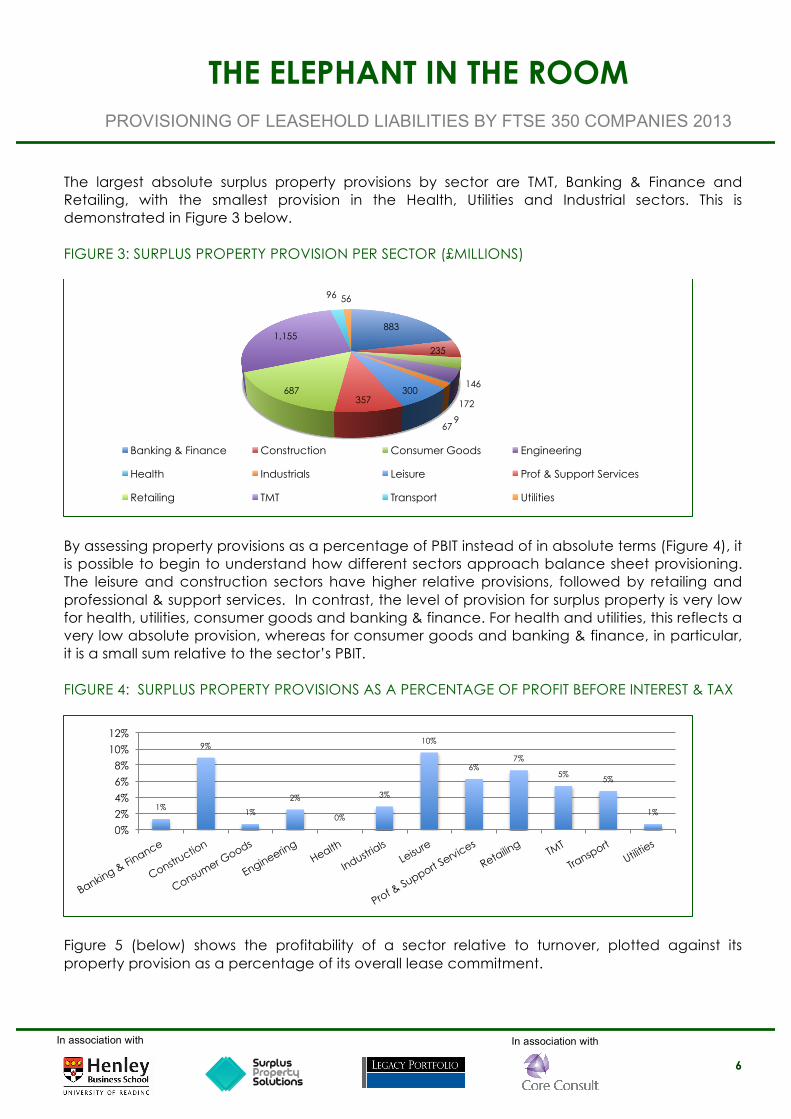
The largest absolute surplus property provisions by sector are TMT, Banking & Finance and Retailing, with the smallest provision in the Health, Utilities and Industrial sectors. This is demonstrated in Figure 3 below. FIGURE 3: SURPLUS PROPERTY PROVISION PER SECTOR (£MILLIONS)
By assessing property provisions as a percentage of PBIT instead of in absolute terms (Figure 4), it is possible to begin to understand how different sectors approach balance sheet provisioning. The leisure and construction sectors have higher relative provisions, followed by retailing and professional & support services. In contrast, the level of provision for surplus property is very low for health, utilities, consumer goods and banking & finance. For health and utilities, this reflects a very low absolute provision, whereas for consumer goods and banking & finance, in particular, it is a small sum relative to the sector’s PBIT. FIGURE 4: SURPLUS PROPERTY PROVISIONS AS A PERCENTAGE OF PROFIT BEFORE INTEREST & TAX
Figure 5 (below) shows the profitability of a sector relative to turnover, plotted against its property provision as a percentage of its overall lease commitment.
883
235
146
172
9 67
300 357
687
1,155
96 56
Banking & Finance Construction Consumer Goods Engineering
Health Industrials Leisure Prof & Support Services
Retailing TMT Transport Utilities
1%
9%
1%
2%
0%
3%
10%
6% 7%
5% 5%
1%
0%
2%
4%
6%
8%
10%
12%
7
THE ELEPHANT IN THE ROOM PROVISIONING OF LEASEHOLD LIABILITIES BY FTSE 350 COMPANIES 2013
In association with In association with
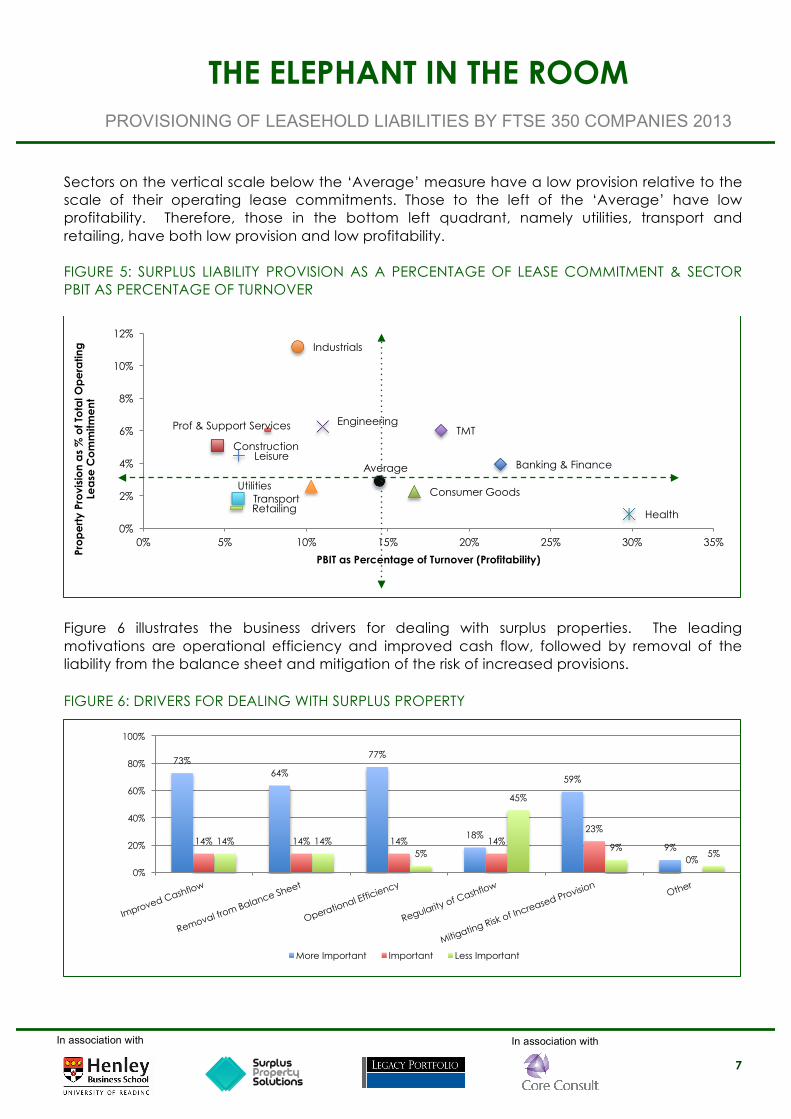
Sectors on the vertical scale below the ‘Average’ measure have a low provision relative to the scale of their operating lease commitments. Those to the left of the ‘Average’ have low profitability. Therefore, those in the bottom left quadrant, namely utilities, transport and retailing, have both low provision and low profitability. FIGURE 5: SURPLUS LIABILITY PROVISION AS A PERCENTAGE OF LEASE COMMITMENT & SECTOR PBIT AS PERCENTAGE OF TURNOVER
Figure 6 illustrates the business drivers for dealing with surplus properties. The leading motivations are operational efficiency and improved cash flow, followed by removal of the liability from the balance sheet and mitigation of the risk of increased provisions. FIGURE 6: DRIVERS FOR DEALING WITH SURPLUS PROPERTY
Banking & Finance
Construction
Consumer Goods
Engineering
Health
Industrials
Leisure
Prof & Support Services
Retailing
TMT
Transport Utilities
Average
0%
2%
4%
6%
8%
10%
12%
0% 5% 10% 15% 20% 25% 30% 35%
Pro
pe
rty
Pro
visi
on
as
% o
f To
tal O
pe
ratin
g
Lea
se C
om
mitm
ent
PBIT as Percentage of Turnover (Profitability)
73% 64%
77%
18%
59%
9% 14% 14% 14% 14%
23%
0%
14% 14% 5%
45%
9% 5%
0%
20%
40%
60%
80%
100%
More Important Important Less Important
8
THE ELEPHANT IN THE ROOM PROVISIONING OF LEASEHOLD LIABILITIES BY FTSE 350 COMPANIES 2013
In association with In association with
Specifying operational efficiency as a driver suggests that finance directors are mindful of how the property team spends its time. Without the millstone of a surplus property portfolio, the property team can focus effectively on the operational portfolio. The desire for improved cash flow is important because, if the business has fully provided for the surplus property portfolio, there will be little impact on cash flow. However, if the provision is not adequate, there will be a continual drain on cash flow in order to deal with surplus property issues. Removing leasehold liabilities from the balance sheet improves the overall position of the company and is often cited as a reason for companies looking to undertake a surplus leasehold property transfer. In particular, it reduces the overall liability for the company and improves financial ratios and mitigates risk - once the surplus portfolio is resolved, the risk of having to make further provisions, e.g. for tenant default or dilapidations claims, is removed. A very high 29.1% of those companies surveyed that indicated that they had surplus leasehold property also stated that they had no provision whatsoever for their surplus property portfolio. FIGURE 7: SATISFACTION WITH CURRENT MANAGEMENT OF SURPLUS PROPERTY PORTFOLIO
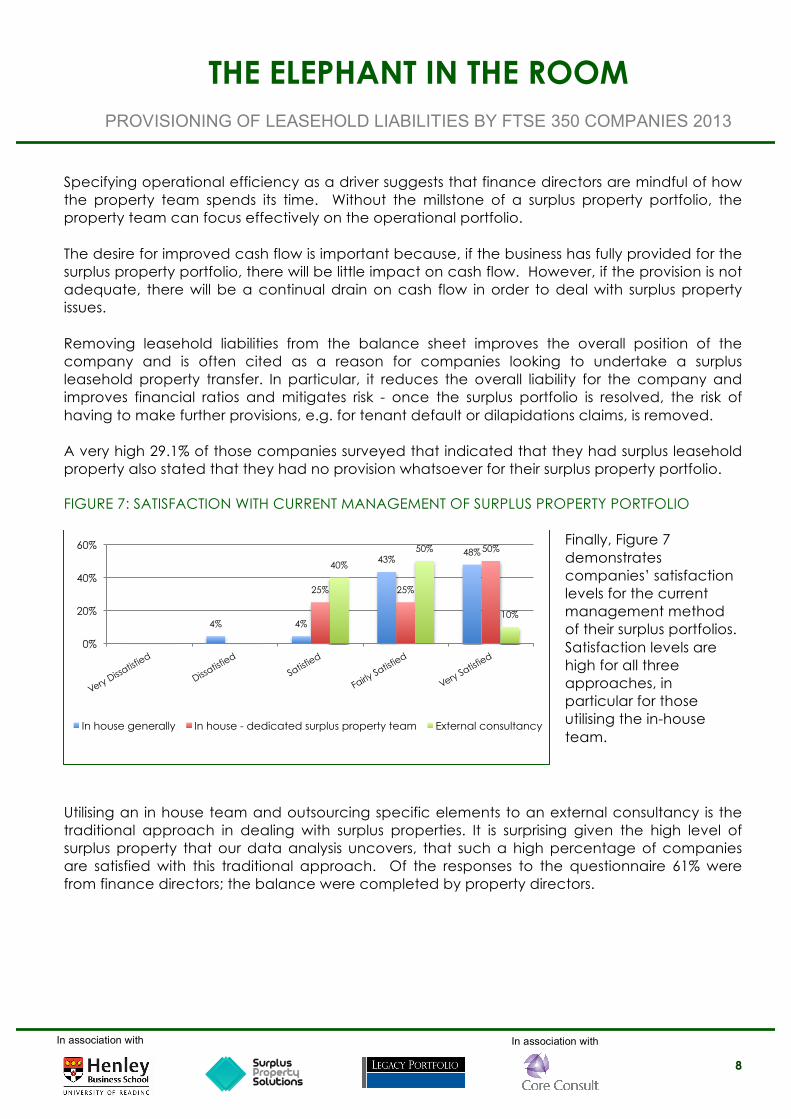
Finally, Figure 7 demonstrates companies’ satisfaction levels for the current management method of their surplus portfolios. Satisfaction levels are high for all three approaches, in particular for those utilising the in-house team.
Utilising an in house team and outsourcing specific elements to an external consultancy is the traditional approach in dealing with surplus properties. It is surprising given the high level of surplus property that our data analysis uncovers, that such a high percentage of companies are satisfied with this traditional approach. Of the responses to the questionnaire 61% were from finance directors; the balance were completed by property directors.
4% 4%
43% 48%
25% 25%
50%
40%
50%
10%
0%
20%
40%
60%
In house generally In house - dedicated surplus property team External consultancy
9
THE ELEPHANT IN THE ROOM PROVISIONING OF LEASEHOLD LIABILITIES BY FTSE 350 COMPANIES 2013
In association with In association with
OPERATIONAL LEASE COMMITMENTS
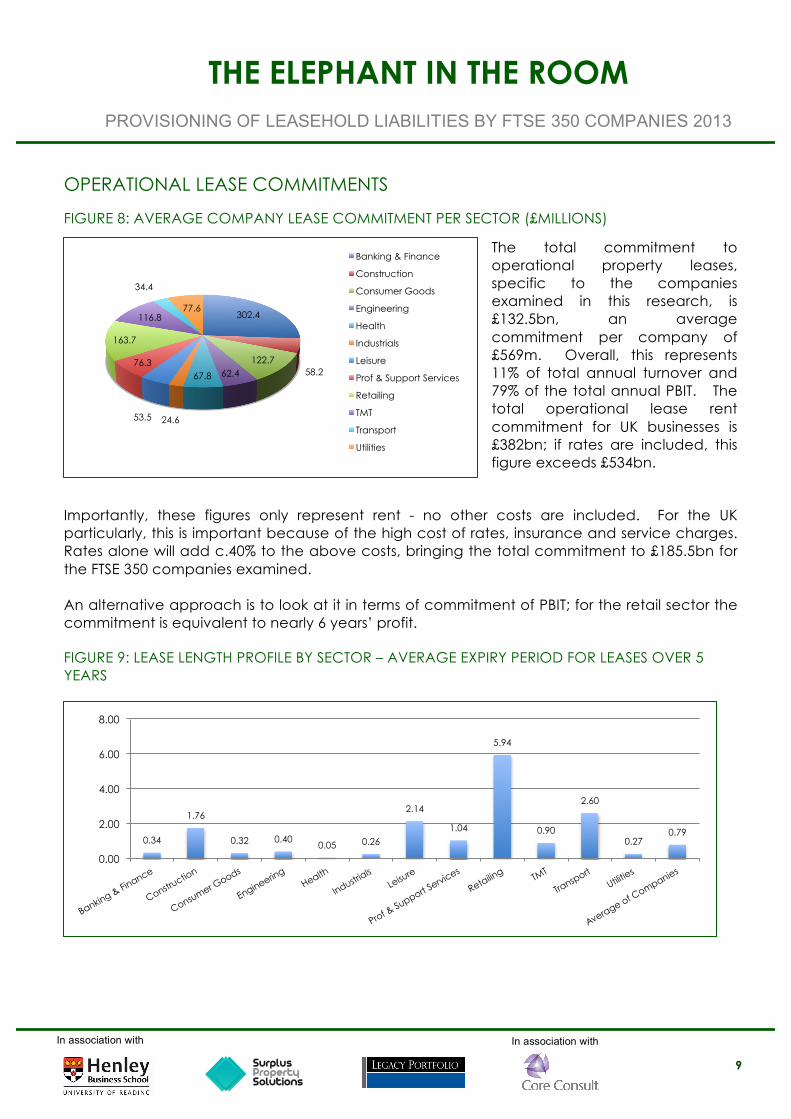
FIGURE 8: AVERAGE COMPANY LEASE COMMITMENT PER SECTOR (£MILLIONS)
The total commitment to operational property leases, specific to the companies examined in this research, is £132.5bn, an average commitment per company of £569m. Overall, this represents 11% of total annual turnover and 79% of the total annual PBIT. The total operational lease rent commitment for UK businesses is £382bn; if rates are included, this figure exceeds £534bn.
Importantly, these figures only represent rent - no other costs are included. For the UK particularly, this is important because of the high cost of rates, insurance and service charges. Rates alone will add c.40% to the above costs, bringing the total commitment to £185.5bn for the FTSE 350 companies examined. An alternative approach is to look at it in terms of commitment of PBIT; for the retail sector the commitment is equivalent to nearly 6 years’ profit. FIGURE 9: LEASE LENGTH PROFILE BY SECTOR – AVERAGE EXPIRY PERIOD FOR LEASES OVER 5 YEARS
302.4
58.2 122.7
62.4 67.8
24.6 53.5
76.3
163.7
116.8
34.4
77.6
Banking & Finance
Construction
Consumer Goods
Engineering
Health
Industrials
Leisure
Prof & Support Services
Retailing
TMT
Transport
Utilities
0.34
1.76
0.32 0.40 0.05 0.26
2.14
1.04
5.94
0.90
2.60
0.27 0.79
0.00
2.00
4.00
6.00
8.00
10
THE ELEPHANT IN THE ROOM PROVISIONING OF LEASEHOLD LIABILITIES BY FTSE 350 COMPANIES 2013
In association with In association with
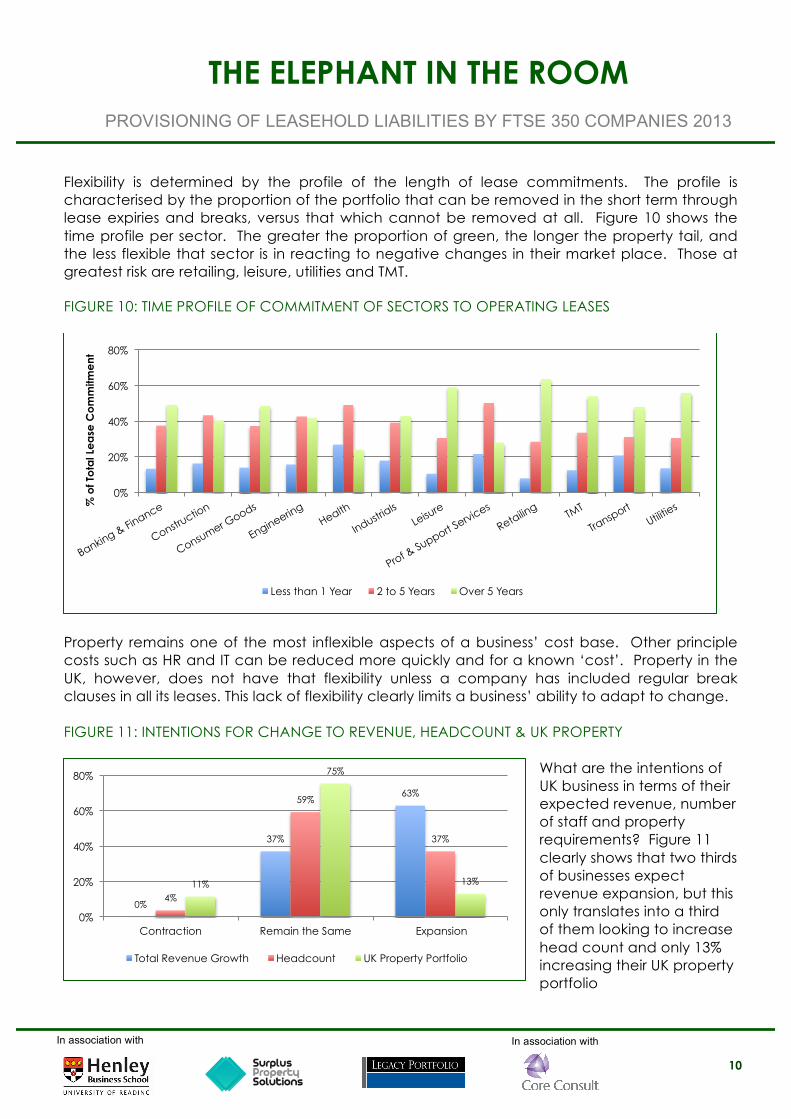
Flexibility is determined by the profile of the length of lease commitments. The profile is characterised by the proportion of the portfolio that can be removed in the short term through lease expiries and breaks, versus that which cannot be removed at all. Figure 10 shows the time profile per sector. The greater the proportion of green, the longer the property tail, and the less flexible that sector is in reacting to negative changes in their market place. Those at greatest risk are retailing, leisure, utilities and TMT. FIGURE 10: TIME PROFILE OF COMMITMENT OF SECTORS TO OPERATING LEASES
Property remains one of the most inflexible aspects of a business’ cost base. Other principle costs such as HR and IT can be reduced more quickly and for a known ‘cost’. Property in the UK, however, does not have that flexibility unless a company has included regular break clauses in all its leases. This lack of flexibility clearly limits a business’ ability to adapt to change.
FIGURE 11: INTENTIONS FOR CHANGE TO REVENUE, HEADCOUNT & UK PROPERTY
What are the intentions of UK business in terms of their expected revenue, number of staff and property requirements? Figure 11 clearly shows that two thirds of businesses expect revenue expansion, but this only translates into a third of them looking to increase head count and only 13% increasing their UK property portfolio
0%
20%
40%
60%
80%
% o
f To
tal L
ea
se C
om
mitm
ent
Less than 1 Year 2 to 5 Years Over 5 Years
0%
37%
63%
4%
59%
37%
11%
75%
13%
0%
20%
40%
60%
80%
Contraction Remain the Same Expansion
Total Revenue Growth Headcount UK Property Portfolio
11
THE ELEPHANT IN THE ROOM PROVISIONING OF LEASEHOLD LIABILITIES BY FTSE 350 COMPANIES 2013
In association with In association with
Whilst revenue is looking to expand 59% are going to keep headcount the same; 75% will keep their UK property portfolio unchanged. This would suggest that there is capacity within corporate occupiers’ property portfolios to accommodate business expansion and head count increases. As a result, demand for new space may continue to be limited.
METHODOLOGY & NOTES CORE Consult analysed the accounts of each of the FTSE 350 companies and used the data from 233, excluding those in property, natural resources and pure investment companies. In conjunction with Henley, a questionnaire was developed and sent to finance directors of the ‘qualifying companies’ in Spring 2013, and the returned data was input into Henley’s analysis programme. There were 28 responses, of which 17 were from finance directors, and the balance from property directors. All individual responses are confidential to the university research team. The accounts used for this report were those published in the 12 months to 31 December 2012. The data excluded those companies that are in the natural resources, investment or property sectors of the FTSE, as these companies’ property requirements and holdings are ‘unusual’. For natural resources and property, there is a very heavy bias towards freehold ownership, whilst investment companies often have no operational property, as they form part of a larger organisation, such as an investment bank.
12
THE ELEPHANT IN THE ROOM PROVISIONING OF LEASEHOLD LIABILITIES BY FTSE 350 COMPANIES 2013
In association with In association with
APPENDIX - THE TEAM
HENLEY BUSINESS SCHOOL:
Henley is a world-renowned international business school based within The University of Reading in the UK. It operates in 17 countries and is ranked among the top schools in Europe. It is one of only 57 business schools in the world to hold triple-accredited status (AMBA. EQUIS, AACSB) Contact Neil Crosby: T: 0118 378 8177 | E: [email protected] | W: www.henley.ac.uk
CORE CONSULT: CORE Consult was established in 2006 to provide occupiers with holistic solutions to their commercial property needs, in particular those needs arising from surplus leasehold property portfolios. Contact Howard Cooke: T: 07768 996705 | E: [email protected] | W: www.core-consult.co.uk
LEGACY PORTFOLIO: Legacy Portfolio specialises in helping businesses to limit the financial and operational risks of surplus leasehold properties that no longer meet their changing needs. Recent UK clients have included Wolseley UK, Virgin Media, Emap, and The Co-operative. Legacy operates in both the UK and USA. Contact Helen Casey: T 0207 440 7404 | E: [email protected] | W: www.legacyportfolio.co.uk
SURPLUS PROPERTY SOLUTIONS Founded in 2005, Surplus Property Solutions (“SPS”) is a leader in acquiring troublesome leasehold liability portfolios. With offices in London and Glasgow, SPS has worked out portfolios for Rentokil Initial, Carillion, Wm Morrison Supermarkets and RBS Equity Finance. Contact Adam Foster: T: 0203 322 8898 | E: [email protected] W: www.surpluspropertysolutions.com