Embed Size (px)
Citation preview

The electromagnetic performance of the RD52 fiber calorimeter
N. Akchurin a, F. Bedeschi b, A. Cardini c, M. Cascella d,e, F. Cei b,f, D. De Pedis g, R. Ferrari h,S. Fracchia h, S. Franchino i, M. Fraternali j, G. Gaudio h, P. Genova j, J. Hauptman k,L. La Rotonda l,m, S. Lee a, M. Livan j, E. Meoni n, A. Moggi b, D. Pinci g, A. Policicchio l,m,J.G. Saraiva o, F. Scuri b, A. Sill a, T. Venturelli l,m, R. Wigmans a,n
a Texas Tech University, Lubbock (TX), USAb INFN Sezione di Pisa, Italyc INFN Sezione di Cagliari, Monserrato (CA), Italyd Dipartimento di Fisica, Università di Salento, Italye INFN Sezione di Lecce, Italyf Dipartimento di Fisica, Università di Pisa, Italyg INFN Sezione di Roma, Italyh INFN Sezione di Pavia, Italyi CERN, Genève, Switzerlandj INFN Sezione di Pavia and Dipartimento di Fisica, Università di Pavia, Italyk Iowa State University, Ames (IA), USAl Dipartimento di Fisica, Università della Calabria, Italym INFN Cosenza, Italyn Tufts University, Medford (MA), USAo LIP, Lisbon, Portugal
a r t i c l e i n f o
Article history:Received 26 June 2013Received in revised form29 August 2013Accepted 10 September 2013Available online 17 September 2013
Keywords:CalorimetryCherenkov lightOptical fibersDual readout method
a b s t r a c t
The RD52 calorimeter is an instrument intended to detect both electromagnetic and hadronic showers, aswell as muons, using the dual-readout principle. Scintillation and Cherenkov light provide the two signalswhich, in combination, allow for superior hadronic performance. In this paper, we report on theelectromagnetic performance of this instrument, and compare this performance with that of other calor-imeters that were constructed with similar goals in mind.
& 2013 Elsevier B.V. All rights reserved.
1. Introduction
In most modern high-energy physics experiments, the precisionwith which the four-vectors of single hadrons and jets can bemeasured is limited by fluctuations in the energy fraction carried bythe electromagnetic (em) shower component, fem [1]. These fluctua-tions can be eliminated by simultaneous measurements of thedeposited energy and the fraction of that energy carried by relat-ivistic charged shower particles. We have experimentally demon-strated that this makes it possible to measure fem event by event [2],using scintillation light and Cherenkov light as signals for the statedpurposes. This method has become known as the Dual REAdoutMethod (DREAM). Since it is possible to eliminate the effects of
fluctuations in fem, this method provides in practice the sameadvantages as intrinsically compensating calorimeters (e=h¼ 1),1
but is not subject to the limitations of the latter devices: samplingfraction, signal integration time and volume, and especially thechoice of absorber material. This has important consequences forthe precision of hadronic shower measurements.
It takes a lot of material to contain the showers initiatedby high-energy hadrons or jets. The RD52 Collaboration is buildingan optical fiber calorimeter designed to be sufficiently large tocontain high-energy hadron showers at a level where leakagefluctuations no longer dominate the calorimeter performance. Thisdetector is modular, and will eventually have an instrumentedmass of about 5 tonnes.
Contents lists available at ScienceDirect
journal homepage: www.elsevier.com/locate/nima
Nuclear Instruments and Methods inPhysics Research A
0168-9002/$ - see front matter & 2013 Elsevier B.V. All rights reserved.http://dx.doi.org/10.1016/j.nima.2013.09.033
n Corresponding author. Tel.: þ1 806 742 3779; fax: þ1 806 742 1182.E-mail addresses: [email protected], [email protected] (R. Wigmans).
1 In an intrinsically compensating calorimeter, the response, i.e., the averagesignal per GeV deposited energy, is equal for the em (e) and non-em (h)components of hadronic shower signals.
Nuclear Instruments and Methods in Physics Research A 735 (2014) 130–144

Recently, a detector consisting of about one third of the finalnumber of modules was exposed to particle beams at the CERNSPS. In this paper, we report on the electromagnetic performanceof this instrument, which was large enough to contain high-energyelectron and photon showers at the 99.9% level.
In Section 2, the instruments and the experimental setupin which the measurements were carried out are described, aswell as the calibration and data analysis methods that were used.Experimental results are presented in Section 3. In the concludingSection 4, we discuss these results and their implications.
2. Equipment and measurements
2.1. Detectors and beam line
The measurements described in this paper were performedin the H8 beam line of the Super Proton Synchrotron at CERN.Beams of high-energy particles were steered into the RD52 fibercalorimeter. A system of auxiliary detectors, described below, wasused to select electrons that entered the calorimeter in a welldefined, small area. The experimental setup is shown in Fig. 1.
The fiber calorimeter is modular. Each module is 2.5 m longð10λintÞ, and has a cross-section of 9.2�9.2 cm2. Each moduleconsists of four towers (4.6�4.6�250 cm3), and each towercontains 1024 plastic optical fibers (diameter 1.0 mm, equalnumbers of scintillating and clear fibers).2 Each tower producestwo signals, a scintillation signal and a Cherenkov signal, whichare detected by separate PMTs.3
The first modules were constructed with lead as absorbermaterial. In the course of 2012, we also managed to constructmodules with copper as absorber material (Fig. 2). The fiducialmass of the latter was � 120 kg, instead of 150 kg for a lead basedmodule. One of these modules was equipped with Cherenkovfibers of which the upstream end was aluminized.4 Fig. 3 showsthe basic structure of the modules for which lead (a) or copper
(b) was used as absorber material. In contrast with the originalDREAM calorimeter [3], each fiber is now separately embeddedin the absorber structure. The sampling fraction for minimumionizing particles, both for the scintillation and for the Cherenkovsampling structure, is 5.3% for the lead-based calorimeter and 4.6%for the copper-based one.
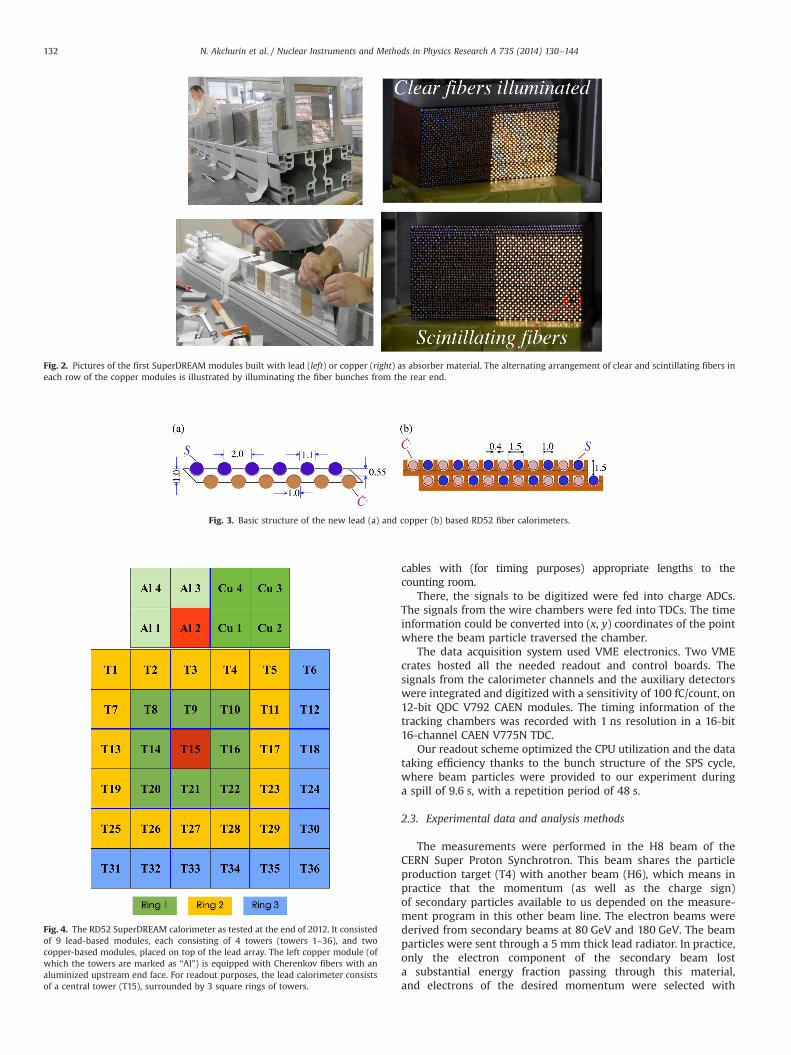
By the end of 2012, nine lead-based modules and two copper-based ones were ready to be tested at CERN, just before the start ofthe two-year shutdown of the accelerator complex. These moduleswere assembled together, as shown in Fig. 4, and tested as such inNovember/December 2012.
Measurements of the radial shower profile showed that theshowers initiated by 60 GeV π� were, on average, contained at thelevel of 93.6% in this structure. For comparison, we mention thatthe average shower leakage in the original DREAM calorimeter5
was about 10% for 80 GeV pions. In order to detect this showerleakage, the calorimeter was surrounded by large slabs of plasticscintillator (50�50�10 cm2, mass 25 kg). Twenty such counterswere used in these tests. They can be seen in Fig. 1 on the top,the bottom and the right hand side of the box containing thecalorimeter.
In this paper, we describe the electromagnetic performanceof these detectors, and shower containment was not an issue ofconcern for these measurements. The showers initiated by elec-trons sent into the center of Tower 15 were contained at the levelof b99%, and fluctuations in shower leakage did not contributesignificantly to the measured performance.
Two small scintillation counters provided the signals that wereused to trigger the data acquisition system. These trigger counterswere 2.5 mm thick, and the area of overlap was 4�4 cm2.A coincidence between the logic signals from these countersprovided the trigger. The trajectories of individual beam particlescould be reconstructed with the information provided by twosmall drift chambers, which were installed upstream and down-stream of the trigger counters. This system made it possible todetermine the location of the impact point of the beam particles atthe calorimeter with a precision of about 1 mm. About 80 cmupstream of the calorimeter, a preshower detector (PSD) providedthe signals needed to remove pions and muons contaminating theelectron beams. This PSD consisted of a 5 mm thick lead plate,followed by a 5 mm thick plastic scintillator. Electrons starteddeveloping showers in this device, while muons and hadronstypically produced a signal characteristic for a minimum ionizingparticle (mip) in the scintillator plate. The system of drift cham-bers, trigger counters and PSD can be seen in the bottom leftcorner of Fig. 1.
Other auxiliary detectors that were used to eliminate the hadronand muon contamination were a tail catcher, a 20�20 cm2 scintil-lator plate placed directly behind the calorimeter, and a 50�50 cm2
scintillator paddle, placed 25 m downstream, behind about 20interaction lengths of material. The latter served as a muon counter,while hadrons typically produced signals in the tail catcher.
2.2. Data acquisition
In order to minimize delays in the DAQ system, we used special15-mm diameter low-loss cables to transport the signals from thetrigger counters to the counting room. The signal speed in thesecables was measured to be 0.78c. The calorimeter signals, as well asthe signals from the auxiliary counters that needed to be digitized(PSD, tail catcher, muon counter) were transported through RG-58
Fig. 1. The new SuperDREAM fiber calorimeter, installed in the H8C beam area. Thesystem of trigger counters and beam defining elements is visible in the left bottompart of the figure.
2 The scintillating fibers were of the type SCSF-78, produced by Kuraray, theCherenkov light was generated in PMMA based SK40 fibers, produced byMitsubishi.
3 Hamamatsu R8900, a 10-stage 1 in.�1 in. PMT. The super bi-alkali photo-cathode covers about 85% of the outside envelope of this very compact tube.
4 This was done at Fermilab, by Eileen Hahn and Erik Ramberg.
5 That calorimeter was, in terms of nuclear interaction lengths, as deep as thepresent one and had a fiducial mass of 1030 kg [2].
N. Akchurin et al. / Nuclear Instruments and Methods in Physics Research A 735 (2014) 130–144 131
cables with (for timing purposes) appropriate lengths to thecounting room.
There, the signals to be digitized were fed into charge ADCs.The signals from the wire chambers were fed into TDCs. The timeinformation could be converted into (x, y) coordinates of the pointwhere the beam particle traversed the chamber.
The data acquisition system used VME electronics. Two VMEcrates hosted all the needed readout and control boards. Thesignals from the calorimeter channels and the auxiliary detectorswere integrated and digitized with a sensitivity of 100 fC/count, on12-bit QDC V792 CAEN modules. The timing information of thetracking chambers was recorded with 1 ns resolution in a 16-bit16-channel CAEN V775N TDC.
Our readout scheme optimized the CPU utilization and the datataking efficiency thanks to the bunch structure of the SPS cycle,where beam particles were provided to our experiment duringa spill of 9.6 s, with a repetition period of 48 s.
2.3. Experimental data and analysis methods
The measurements were performed in the H8 beam of theCERN Super Proton Synchrotron. This beam shares the particleproduction target (T4) with another beam (H6), which means inpractice that the momentum (as well as the charge sign)of secondary particles available to us depended on the measure-ment program in this other beam line. The electron beams werederived from secondary beams at 80 GeV and 180 GeV. The beamparticles were sent through a 5 mm thick lead radiator. In practice,only the electron component of the secondary beam losta substantial energy fraction passing through this material,and electrons of the desired momentum were selected with
Fig. 2. Pictures of the first SuperDREAM modules built with lead (left) or copper (right) as absorber material. The alternating arrangement of clear and scintillating fibers ineach row of the copper modules is illustrated by illuminating the fiber bunches from the rear end.
Fig. 3. Basic structure of the new lead (a) and copper (b) based RD52 fiber calorimeters.
Fig. 4. The RD52 SuperDREAM calorimeter as tested at the end of 2012. It consistedof 9 lead-based modules, each consisting of 4 towers (towers 1–36), and twocopper-based modules, placed on top of the lead array. The left copper module (ofwhich the towers are marked as “Al”) is equipped with Cherenkov fibers with analuminized upstream end face. For readout purposes, the lead calorimeter consistsof a central tower (T15), surrounded by 3 square rings of towers.
N. Akchurin et al. / Nuclear Instruments and Methods in Physics Research A 735 (2014) 130–144132
properly tuned downstream bending magnets. In this way,electron beams of 6, 10, 20, 30, 40 and 60 GeV were derived fromthe 80 GeV secondary beam, while the 180 GeV secondary beamformed the source of electron beams at 60, 80, 100, 125 and150 GeV.
Because of the existing boundary conditions, the high-energyelectrons could only be used to test the 36-tower lead-basedmatrix, while the lower-energy electrons were used to test thecopper modules.
The measurements of the signal linearity and the em energyresolution were performed by steering the electron beams into thecenter of Tower 15 (lead), or in the center of Tower Al2 (copper, seeFig. 4). Typically, for each energy 50 000 events were collected,although that number could either be considerably lower (limitedby the count rate, at the lowest energies) or higher (to overcomesubstantial contamination, at the highest energies). For reasonsexplained in Section 3.6, the calorimeter was oriented at a smallangle with the beam line during these measurements: 1.51 in thehorizontal plane (we will refer to this angle as θ), 1.01 in thevertical plane (this one will be called ϕ).
In each run, 10% randomly triggered events provided pedestalinformation. For each event, the ADC information of all calorimetertowers was recorded, as well as the ADC (and in some cases alsoTDC) data from the auxiliary detectors (muon counter, wirechambers, PSD, tail catcher).
Other measurements were carried out to determine the uni-formity of the calorimeter response. We used 100 GeV electrons tomeasure the uniformity of the lead modules, and 20 GeV electronsfor the copper ones. In these measurements, the calorimeter wasperfectly aligned with the beam line, i.e., the angle between thefibers and the beam particles was 01. The measurements werecarried out by systematically mapping the calorimeter response tothese particles over an extended surface area. In the case of thelead modules, an area of 9�9 cm2 centered on the 4-corners pointof Towers 15, 16, 21 and 22 (see Fig. 4) was studied for thispurpose, with a total of 650 000 beam particles. In the case of thecopper modules, an area of 6�2 cm2 covering the central regionsof Towers Al2 and Al1, as well as the four-corners region, wasexposed to 150 000 electrons of 20 GeV.
Off-line, the beam chamber information could be used to selectevents that entered the calorimeter in a small (typically 10�10 mm2) region located around its geometric center. The electronbeams contained some fraction of muons and hadrons, which couldbe effectively eliminated with the PSD, the tail catcher and thedownstreammuon counter. The hadron contaminationwas largest atthe highest energies, the muon contamination was also important atthe lowest energies.
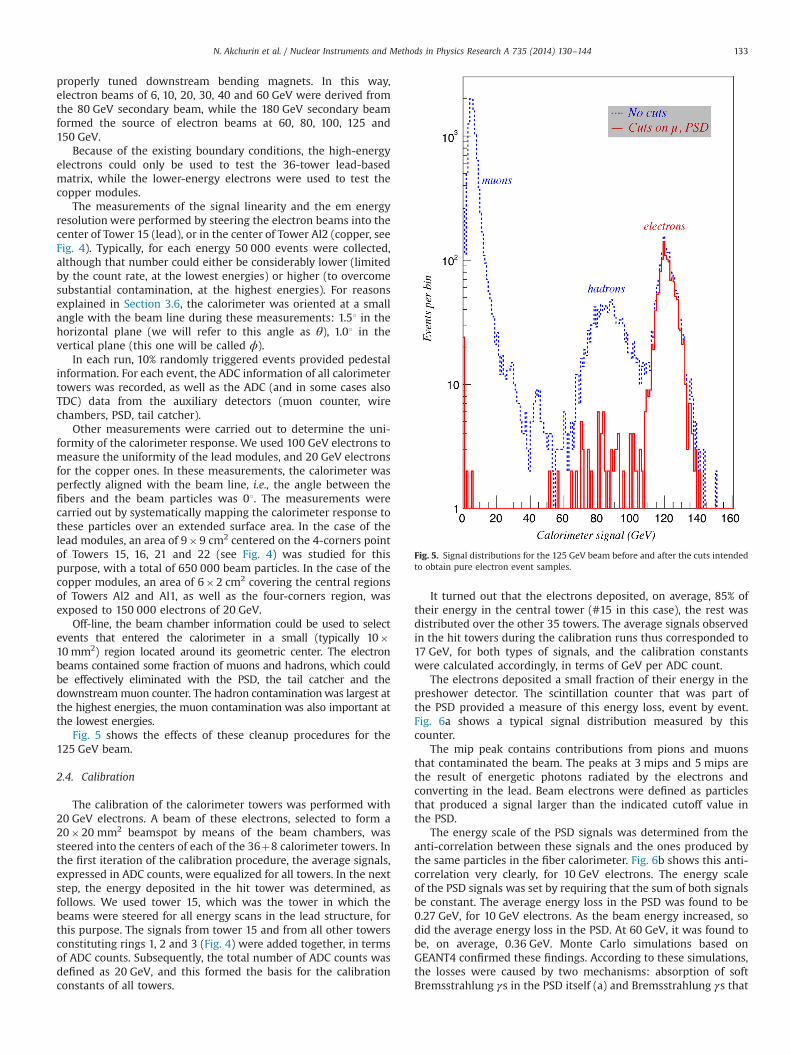
Fig. 5 shows the effects of these cleanup procedures for the125 GeV beam.
2.4. Calibration
The calibration of the calorimeter towers was performed with20 GeV electrons. A beam of these electrons, selected to form a20�20 mm2 beamspot by means of the beam chambers, wassteered into the centers of each of the 36þ8 calorimeter towers. Inthe first iteration of the calibration procedure, the average signals,expressed in ADC counts, were equalized for all towers. In the nextstep, the energy deposited in the hit tower was determined, asfollows. We used tower 15, which was the tower in which thebeams were steered for all energy scans in the lead structure, forthis purpose. The signals from tower 15 and from all other towersconstituting rings 1, 2 and 3 (Fig. 4) were added together, in termsof ADC counts. Subsequently, the total number of ADC counts wasdefined as 20 GeV, and this formed the basis for the calibrationconstants of all towers.
It turned out that the electrons deposited, on average, 85% oftheir energy in the central tower (#15 in this case), the rest wasdistributed over the other 35 towers. The average signals observedin the hit towers during the calibration runs thus corresponded to17 GeV, for both types of signals, and the calibration constantswere calculated accordingly, in terms of GeV per ADC count.
The electrons deposited a small fraction of their energy in thepreshower detector. The scintillation counter that was part ofthe PSD provided a measure of this energy loss, event by event.Fig. 6a shows a typical signal distribution measured by thiscounter.
The mip peak contains contributions from pions and muonsthat contaminated the beam. The peaks at 3 mips and 5 mips arethe result of energetic photons radiated by the electrons andconverting in the lead. Beam electrons were defined as particlesthat produced a signal larger than the indicated cutoff value inthe PSD.
The energy scale of the PSD signals was determined from theanti-correlation between these signals and the ones produced bythe same particles in the fiber calorimeter. Fig. 6b shows this anti-correlation very clearly, for 10 GeV electrons. The energy scaleof the PSD signals was set by requiring that the sum of both signalsbe constant. The average energy loss in the PSD was found to be0.27 GeV, for 10 GeV electrons. As the beam energy increased, sodid the average energy loss in the PSD. At 60 GeV, it was found tobe, on average, 0.36 GeV. Monte Carlo simulations based onGEANT4 confirmed these findings. According to these simulations,the losses were caused by two mechanisms: absorption of softBremsstrahlung γs in the PSD itself (a) and Bremsstrahlung γs that
Fig. 5. Signal distributions for the 125 GeV beam before and after the cuts intendedto obtain pure electron event samples.
N. Akchurin et al. / Nuclear Instruments and Methods in Physics Research A 735 (2014) 130–144 133

exited the PSD at such an angle that they missed the calorimeter(b). Including the measured PSD signals improved both thecalorimeter resolution and the signal linearity somewhat, espe-cially at the lowest energies.
3. Experimental results
3.1. The electromagnetic response function
The electron response was obtained by adding the signals fromall available towers that contributed to it. The signal from eachcontributing tower was converted into energy by means of thecalibration constants, whose values were determined as describedin Section 2.4. In the case of the lead module, the signals from all36 towers were used for this purpose. The beam was steered intothe center of Tower 15. The signal from that tower contributedtypically � 85% to the total energy. Ring 1 (i.e., the 8 towersnumbered T8, 9, 10, 14, 16, 20, 21, 22, see Fig. 4) contributed in total� 12% and the 16 towers constituting Ring 2 (see Fig. 4) con-tributed together � 2:5% to the total calorimeter signal. Finally,the 11 towers from the incomplete ring 3 contributed together� 0:5%. Since the radial profile of em showers is in principleenergy independent [1], these numbers may also be consideredrepresentative for electron showers at other energies.
The total signals thus consisted of the sum of 36 individualcontributions, and since most of these contributions were very small,one might wonder if adding all these tiny contributions fromoutlying towers did more than just adding electronic noise (becauseof pedestal fluctuations) to the total signal. Fig. 7 shows the sum ofthe signals from the 12 towers constituting ring 2. The total energydeposited in these 12 towers was, on average, 0.472 GeV.For comparison, the distribution of the sum of the pedestals fromall 36 towers is shown in the same figure. The energy equivalence ofthe width of this total pedestal distributionwas 0.098 GeV. Therefore,pedestal fluctuations (i.e., electronic noise) contributed only 1.0% tothe resolution at 10 GeV and 0.1% at 100 GeV. Given the fact that thiscontribution is added in quadrature to the contributions of otherfluctuations, it is fair to say that it was in practice negligible.
For the total signal from the copper calorimeter, we only consid-ered the tower into which the electron beam was steered (Tower Al2,see Fig. 4), as well as one ring of towers surrounding this tower. Basedon the numbers mentioned above, this means that typically 97% of thetotal shower energy was deposited in this ensemble. It should bementioned that in this case also the signals from 3 lead-based towers(T2, 3, 4, see Fig. 4) were taken into account. However, since thesetowers typically contributed less than 5% to the total response, this
was not considered an unacceptable contamination of the resultsquoted for “copper”.
We also added the signals from the preshower detector to thetotal calorimeter signal, calibrated as described in Section 2.4. Thesignal distributions obtained in this way were well described byGaussian functions. In the following, we use the mean values andstandard deviations obtained from such fits as the experimentalresults of our studies. As an example, Fig. 8 shows the responsefunctions plus the results of the fits for electrons of 40 GeV in thecopper based fiber calorimeter. The scintillation and Cherenkovsignal distributions are shown separately in Fig. 8a and b, respec-tively. These signals were also summed together for each event.The resulting signal distribution for these summed signals, shown inFig. 8c, is considerably narrower than the individual distributions foreach fiber type. The nearly exact factor of
ffiffiffi2
pbetween the individual
resolutions for the two types of fibers (Fig. 8a and b) and theresolution for their summed signals (Fig. 8c) indicates that we haveachieved statistical independence of each fiber type.
3.2. Signal linearity
Intrinsic signal linearity for em shower detection is a veryfundamental calorimetric property, not only for homogeneous detec-tors, but for all types of calorimeters. This is because the entire em
Fig. 6. Typical signal distribution in the preshower detector (a), and the correlation between the signals in this detector and in the calorimeter (b).
Fig. 7. Distribution of the contribution of the scintillation signals from ring 2 to thetotal signal from 20 GeV electrons steered into the center of Tower 15. Forcomparison, the distribution of the sum of the pedestals in all 36 towerscontributing to the signal is shown as well.
N. Akchurin et al. / Nuclear Instruments and Methods in Physics Research A 735 (2014) 130–144134

shower energy is used to ionize the absorbing medium, in contrastwith hadronic showers where some (variable) fraction of the showerenergy is used to break up atomic nuclei, or escapes detectionaltogether. When deviations from linearity are observed for emcalorimeters, these are invariably caused by instrumental effects,such as saturation effects in the active media or in the readout,incomplete shower containment, upstream absorption effects, inac-tive or inefficient volumes, etc.
Because of the logistics of the data taking procedures (see Section2.3), the signal linearity was studied over two energy ranges: 6–60 GeV and 60–150 GeV, respectively. Fig. 9 shows the calorimeterresponse, defined as the average signal per unit deposited energy,separately for the scintillation signals and for the Cherenkov signals inthese two energy ranges. The response is constant to within 1% (i.e.,the gray area in these figures) in both ranges, with the exception of thelowest energy point (6 GeV), where the response is about 2% lowerthan average. At these low energies, the reconstructed energy is mostsensitive to energy losses upstream. Apart from the PSD, the electronsalso lose some energy in the other upstream detectors (triggercounters, wire chambers), in 10 m of air, beam pipe windows, etc. Inaddition, backscattering of soft photons through the front face of thecalorimeter (so-called albedo effects) are also most important for low-energy showers. And finally, hysteresis effects in the beam magnets,which affect the precise energy of the beam particles, are mostimportant at low energies as well.
In any case, the fiber calorimeter is linear for em showerdetection to within 71%, over the energy range 10–150 GeV, bothfor the scintillation and the Cherenkov signals.
3.3. Radial shower profiles
It is well known that the radial profiles of electromagneticshowers are very narrow, especially in the early phase, before theshower maximum is reached [5]. In that phase, the showerdevelopment is dominated by energetic Bremsstrahlung photonsradiated by the beam particle, and these γs convert into eþ e�
pairs that travel close and parallel to the shower axis. In orderto assess the effects of this on the performance of our calorimeter,we measured this shower profile, in the following way. We used arun in which a wide beam of 100 GeV electrons was steered intothe boundary region of Towers 15 and 16. The beam particlesentered the calorimeter parallel to the direction of the fibers(θ;ϕ¼ 01). We selected events in a 1 mm wide sliver of this beamspot and moved this area in small steps across the boundarybetween the two towers, as illustrated in the insert of Fig. 10.
Fig. 10a shows the signal measured in Tower 16 as a functionof the position of this sliver, separately for the scintillation andCherenkov signals. The very steep increase of the signal near theboundary between towers 15 and 16 is indicative for the verynarrow shower profile. This profile can be extracted from these
Fig. 8. Signal distributions for 40 GeV electrons in the copper-fiber calorimeter. Shown are the distributions measured with the scintillating fibers (a), the Cherenkov fibres(b) and the sum of all fibers (c). The angle of incidence of the beam particles (θ; ϕ) was (1.51, 1.01). The size of the beam spot was 10�10 mm2.
Fig. 9. The linearity of the copper (a) and lead (b) based fiber calorimeters for em shower detection in the scintillation and Cherenkov channels. See text for details.
N. Akchurin et al. / Nuclear Instruments and Methods in Physics Research A 735 (2014) 130–144 135

measurements by taking the derivative of this curve. In Fig. 10b,the differences between the signals measured at neighboringimpact points are plotted. This figure shows that the narrowcentral core of the showers extends over a distance of only a fewmm. The core is somewhat wider for the Cherenkov signals thanfor the scintillation ones.6
Because of the extremely collimated core of the em showers,there is a systematic response difference between particles enter-ing the detector in the absorber material or in the fibers for thistype of calorimeter. The core is more efficiently sampled, and thuscontributes more to the total signal, when it develops in or veryclose to a fiber. By orienting the calorimeter at a small angle withrespect to the beam line, this difference is smeared out andeventually disappears for angles ≳31 [3,4]. Interestingly, this effectis more or less absent for the Cherenkov signals. This is becausethe extremely collimated narrow core that characterizes the earlyphase of em showers does not contribute to the Cherenkov signals,since the Cherenkov light generated in this phase falls outside thenumerical aperture of the fibers [3]. We come back to these effectsin Section 4.
3.4. Response uniformity
Because of the extremely collimated core of the em showers,a large contribution of the signals comes from a very small numberof individual fibers. This means that it is very important that fiber-to-fiber response variations be kept as small as possible.Such variations may be caused by:
� Differences in intrinsic fiber quality (light yield, attenuationcharacteristics).
� Differences in the quality of the polishing of the fiber ends.
� Differences in quantum efficiency of the PMT photocathodeareas illuminated by individual fibers.
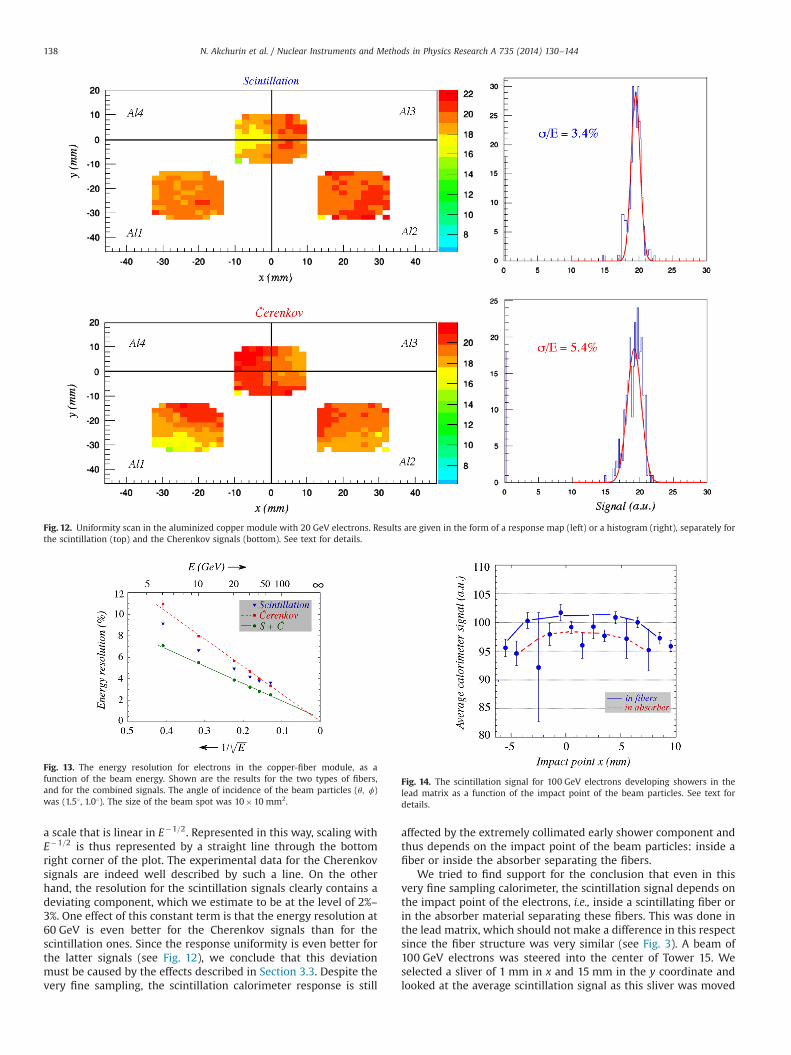
In order to investigate these effects, we performed uniformityscans, in which a relatively large area of the calorimeter surfacewas exposed to a given electron beam. In order to maximize theeffects of non-uniformities, the calorimeter was oriented atθ; ϕ¼ 01, so that the number of fibers contributing to the signalfrom individual showers was made as small as possible.To obtain a fine granularity, a large number of beam particleswere used for this study, which was carried out with 100 GeVelectrons for the lead matrix and with 20 GeV electrons for thecopper modules. The granularity, i.e., the size of the individual cellsinto which the scanned surface area was subdivided, was5�5 mm2 in the case of lead, and 2�2 mm2 for copper.
Results are given in Fig. 11 for the lead matrix and Fig. 12 for thecopper modules. We want to emphasize that the fibers and PMTswere identical for these two scans. Yet, some striking differenceswere observed. In general, the uniformity is worse for the leadmodules than for the copper ones, which may be partly due to thefact that the lead scan included a larger fraction of areas near thetower edges.7 Especially for the scintillation signals in the leadmatrix, there is a substantial difference between the response toparticles that hit a tower in its center and particles that entered thecalorimeter near a tower edge. No such difference was observed forcopper. Also, the Cherenkov response in lead was much moreuniform than the scintillation response (7% vs.12% non-uniformity).This is consistent with the fact, explained in the previous subsec-tion, that the Cherenkov signals are less sensitive to anomalies inone individual fiber, since the early extremely collimated showercomponent does not contribute to these signals.
Fig. 10. The signal from a 1 mm wide beam of 100 GeV electrons measured in Tower 16, as a function of the impact point of the beam (a), and the lateral shower profilesderived from this measurement (b). See text for details.
6 This phenomenon is due to the fact that the early, extremely collimated partof the shower does not contribute to the Cherenkov signal, since the Cherenkovlight generated in this stage falls outside the numerical aperture of the fibers [6].
7 In order to quantify this effect, we also limited the study of the signalvariations in the lead calorimeter to the same areas that were included in thecopper scan. The non-uniformity was measured to be 11% and 6% for thescintillation and the Cherenkov signals, respectively.
N. Akchurin et al. / Nuclear Instruments and Methods in Physics Research A 735 (2014) 130–144136
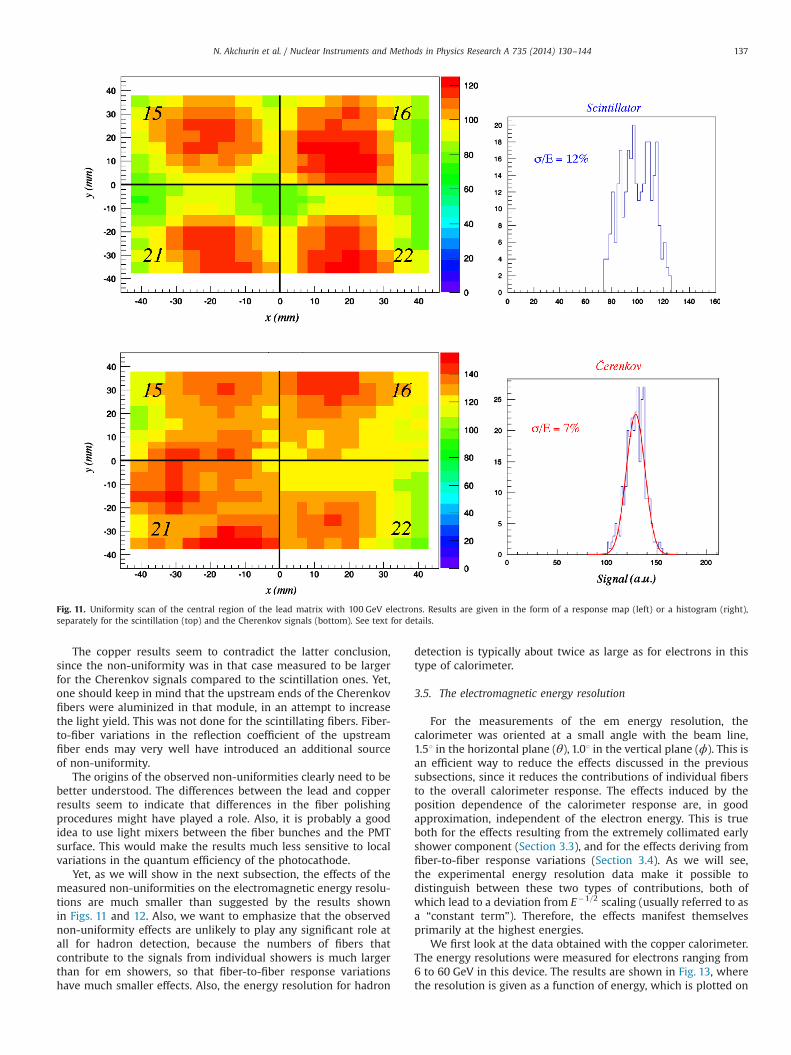
The copper results seem to contradict the latter conclusion,since the non-uniformity was in that case measured to be largerfor the Cherenkov signals compared to the scintillation ones. Yet,one should keep in mind that the upstream ends of the Cherenkovfibers were aluminized in that module, in an attempt to increasethe light yield. This was not done for the scintillating fibers. Fiber-to-fiber variations in the reflection coefficient of the upstreamfiber ends may very well have introduced an additional sourceof non-uniformity.
The origins of the observed non-uniformities clearly need to bebetter understood. The differences between the lead and copperresults seem to indicate that differences in the fiber polishingprocedures might have played a role. Also, it is probably a goodidea to use light mixers between the fiber bunches and the PMTsurface. This would make the results much less sensitive to localvariations in the quantum efficiency of the photocathode.
Yet, as we will show in the next subsection, the effects of themeasured non-uniformities on the electromagnetic energy resolu-tions are much smaller than suggested by the results shownin Figs. 11 and 12. Also, we want to emphasize that the observednon-uniformity effects are unlikely to play any significant role atall for hadron detection, because the numbers of fibers thatcontribute to the signals from individual showers is much largerthan for em showers, so that fiber-to-fiber response variationshave much smaller effects. Also, the energy resolution for hadron
detection is typically about twice as large as for electrons in thistype of calorimeter.
3.5. The electromagnetic energy resolution
For the measurements of the em energy resolution, thecalorimeter was oriented at a small angle with the beam line,1.51 in the horizontal plane (θ), 1.01 in the vertical plane (ϕ). This isan efficient way to reduce the effects discussed in the previoussubsections, since it reduces the contributions of individual fibersto the overall calorimeter response. The effects induced by theposition dependence of the calorimeter response are, in goodapproximation, independent of the electron energy. This is trueboth for the effects resulting from the extremely collimated earlyshower component (Section 3.3), and for the effects deriving fromfiber-to-fiber response variations (Section 3.4). As we will see,the experimental energy resolution data make it possible todistinguish between these two types of contributions, both ofwhich lead to a deviation from E�1=2 scaling (usually referred to asa “constant term”). Therefore, the effects manifest themselvesprimarily at the highest energies.
We first look at the data obtained with the copper calorimeter.The energy resolutions were measured for electrons ranging from6 to 60 GeV in this device. The results are shown in Fig. 13, wherethe resolution is given as a function of energy, which is plotted on
Fig. 11. Uniformity scan of the central region of the lead matrix with 100 GeV electrons. Results are given in the form of a response map (left) or a histogram (right),separately for the scintillation (top) and the Cherenkov signals (bottom). See text for details.
N. Akchurin et al. / Nuclear Instruments and Methods in Physics Research A 735 (2014) 130–144 137
a scale that is linear in E�1=2. Represented in this way, scaling withE�1=2 is thus represented by a straight line through the bottomright corner of the plot. The experimental data for the Cherenkovsignals are indeed well described by such a line. On the otherhand, the resolution for the scintillation signals clearly contains adeviating component, which we estimate to be at the level of 2%–3%. One effect of this constant term is that the energy resolution at60 GeV is even better for the Cherenkov signals than for thescintillation ones. Since the response uniformity is even better forthe latter signals (see Fig. 12), we conclude that this deviationmust be caused by the effects described in Section 3.3. Despite thevery fine sampling, the scintillation calorimeter response is still
affected by the extremely collimated early shower component andthus depends on the impact point of the beam particles: inside afiber or inside the absorber separating the fibers.
We tried to find support for the conclusion that even in thisvery fine sampling calorimeter, the scintillation signal depends onthe impact point of the electrons, i.e., inside a scintillating fiber orin the absorber material separating these fibers. This was done inthe lead matrix, which should not make a difference in this respectsince the fiber structure was very similar (see Fig. 3). A beam of100 GeV electrons was steered into the center of Tower 15. Weselected a sliver of 1 mm in x and 15 mm in the y coordinate andlooked at the average scintillation signal as this sliver was moved
Fig. 12. Uniformity scan in the aluminized copper module with 20 GeV electrons. Results are given in the form of a response map (left) or a histogram (right), separately forthe scintillation (top) and the Cherenkov signals (bottom). See text for details.
Fig. 13. The energy resolution for electrons in the copper-fiber module, as afunction of the beam energy. Shown are the results for the two types of fibers,and for the combined signals. The angle of incidence of the beam particles (θ; ϕ)was (1.51, 1.01). The size of the beam spot was 10�10 mm2.
Fig. 14. The scintillation signal for 100 GeV electrons developing showers in thelead matrix as a function of the impact point of the beam particles. See text fordetails.
N. Akchurin et al. / Nuclear Instruments and Methods in Physics Research A 735 (2014) 130–144138

across the central region of this tower. The results are shownin Fig. 14, which exhibits indeed an oscillating pattern with aperiod of about 2 mm, i.e., the distance between two scintillatingfibers. Over a distance of 14 mm, one can indeed see the expectednumber of maxima and minima (seven). The average differencebetween the maximum and minimum signals is about 4%, i.e.,consistent with a constant term of � 2% in the em energy res-olution.
One advantage of the new fiber pattern used in the RD52calorimeters is the fact that the scintillation and Cherenkov read-out represent completely independent sampling structures. There-fore, by combining the signals from the two types of fibers, asignificant improvement in the energy resolution is obtained. Thiswas not the case for the original DREAM calorimeter [3], where thetwo types of fibers essentially sampled the showers in the sameway. Fig. 13 shows that the energy resolution of the combinedsignal deviates slightly from E�1=2 scaling. The straight line fitthrough the data points suggests a constant term of 1% or less.In any case, the energy resolution is substantially better than foreither of the two individual signals, over the entire energy rangecovered by these measurements.
We now turn to the results of the energy resolution measure-ments in the lead matrix, shown in Fig. 15. These measurementswere carried out with electrons ranging in energy from 60 to150 GeV. The figure shows that the resolution of the scintillationsignals is approximately constant, at � 4%, while the resolutionfor the Cherenkov signals slightly improves with energy, and isdefinitely better than that measured for the scintillating fibers. Yet,the improvement does not scale with E�1=2 and there is thus alsoin this case a contribution from a non-stochastic term.
Since there is no reason why the effects from the collimatedearly shower component should be any different from thatmeasured in the copper structure, we conclude that in this casealso the fiber-to-fiber response variations contribute to the mea-sured energy resolution, for both types of fibers. This conclusionis consistent with the fact that such fluctuations were measured tobe much larger in the lead matrix (Fig. 11).
It is also interesting to note that, in contrast with the copperresults, combining the two signals does not lead to a significantimprovement of the energy resolution for the lead matrix. Thismeans that sampling fluctuations, which contribute to the sto-chastic term, are a minor component of the measured resolution,which is dominated by response non-uniformities. Additionalevidence for this can be derived from Fig. 16a, which shows theenergy resolution for 80 GeV electrons as a function of the size ofthe beam spot. As the beam spot is reduced from the standard sizeof 10�10 mm2, the energy resolution improves significantly, by
� 25%. This means that the resolutions measured for the standardbeam spot size contain a contribution from response non-uniformities in the form of an energy independent term of� 2%. The results shown in Fig. 15 would thus have looked muchbetter if a much smaller beam spot had been used in the dataanalysis. Fig. 16b shows that no such dependence on the size of thebeam spot was observed in the case of the copper measurements.
3.6. Angular dependence of the response
Given the fact that the performance of this calorimeter issensitive to the angle of incidence of the beam particles, onemay wonder what happens if particles enter this calorimeter atlarger angles. It was demonstrated long ago that the response ofa scintillating-fiber calorimeter is independent of the angleof incidence [1], but since the emission of Cherenkov radiation isa directional phenomenon, this may be very different for thiscalorimeter. The fact that the Cherenkov fibers are insensitive tothe early, extremely collimated shower component, is a strongindication in this respect. If the calorimeter would be orientedsuch that the Cherenkov light emitted in this early shower phasewas trapped within the numerical aperture of the Cherenkovfibers, a considerably larger signal might be expected.
We tested this hypothesis in an earlier stage, with measure-ments on an individual (lead based) prototype module of the RD52calorimeter. This module was exposed to a beam of electrons of80 GeV. The response of the eight signals in the four towers wasequalized when the beam entered the calorimeter at θ; ϕ¼ 01,just as in the measurements described earlier in this paper. Nextthe module was rotated in the horizontal plane and the calori-meter signals were measured as a function of the angle ofincidence, θ. For angles larger than 101, the particles entered themodule from the side. The resulting average signals measured inthe scintillation and Cherenkov channels are shown in Fig. 17.Since the module has a transverse width of only 9X0, the signalsdecreased as the angle increased. However, the angular depen-dence of the two types of signals was clearly very different. This isillustrated in more detail in Fig. 18, where the Cherenkov/scintilla-tion signal ratio is plotted as a function of the angle of incidence,separately for the two towers that contributed to the signals (seeFig. 17).
As expected, the signal ratio increases with the angle, to reach amaximum at θ¼ 511, where the acceptance for Cherenkov lightemitted by shower particles traveling parallel to the beam line islargest.8 The increase with respect to the ratio that was establishedwhen calibrating the module was measured to be � 65% for thefirst tower traversed by the particles (T4), and � 50% for thesecond one (T1). This decrease is of course due to the fact that thelatter tower (T1) sees a somewhat less collimated shower than T4.The asymmetry seen in T1 is due to the fact that the showercomponent measured by this tower depends on the angle ofincidence. For example, at θ¼ 201, T1 probes the shower at adepth ranging from 13 to 26X0, at θ¼ 501 from 6 to 12X0 and atθ¼ 701 from 4 to 8X0. Therefore, the large-angle portions of thedata points in Fig. 18a and b are much more similar than the rest,since at large angles both towers probe the early stage, before theshower maximum.
However, despite the angular dependences, the figures alsoshow that the Cherenkov/scintillation signal ratio is approximatelyconstant in the angular range θ¼ 01–101. In a practical
Fig. 15. The energy resolution for electrons in the lead-fiber module, as a functionof the beam energy. Shown are the results for the two types of fibers, and for thecombined signals. The angle of incidence of the beam particles (θ; ϕ) was (1.51,1.01). The size of the beam spot was 10�10 mm2.
8 The Cherenkov fibers used in this prototype module were based onpolystyrene, which has an index of refraction n¼1.59, which corresponds to aCherenkov angle of 511. The modules that constitute the RD52 calorimeter containCherenkov fibers based on PMMA (n¼1.49), which has much better light attenua-tion characteristics in the relevant wavelength region.
N. Akchurin et al. / Nuclear Instruments and Methods in Physics Research A 735 (2014) 130–144 139

experiment, the calorimeters will most likely be constructed insuch a way that the most energetic particles, i.e., the dominatingjet components, enter the detector always in this angular range.9
3.7. The light yield
A very important (and limiting) characteristic of this type ofcalorimeter is the Cherenkov light yield. Together with thesampling fluctuations, fluctuations in the numbers of photoelec-trons (p.e.) determine the stochastic term in the energy resolution.In order to determine the number of photoelectrons produced perunit of deposited shower energy (NGeV), we need to know theabsolute gain of the PMT, for the light spectrum produced by the
fibers in question. Once that gain (G) is known, NGeV can bedetermined from the charge produced in the ADC per unit energydeposited in the calorimeter (QGeVÞ
QGeV ¼ 1:6� 10�19 NGeVG: ð1Þ
We measured the gain of the PMTs using a blue LED as the lightsource. This diode produced light with a wavelength of 481 nm,representative for the light produced by our fibers. The light pulsesproduced by this LED10 were sent through optical fibers to twoseparate PMTs, one of which served as reference to monitor thestability of the source. The light pulses were shaped electronically toresemble those produced by the showers developing in the calori-meter. The intensity of the light pulses could be varied bymeans of thevoltage applied to the diode. Typical light levels chosen for thesemeasurements produced between 20 and 200 photoelectrons perpulse in the PMT. The precise value of the light level was determinedfrom the variance in the PMT signals, which was dominated byphotoelectron statistics.
These measurements were carried out with a digital oscillo-scope, which recorded for each pulse the integrated pulse height(in pV s). Divided by the input impedance of the oscilloscope, thisgave the integrated output charge for each pulse. And since thecharge of the input signal was known from the average number ofphotoelectrons produced, the gain of the PMT was simply deter-mined by
G¼Qout=Q in: ð2Þ
Measurements of the PMT gain and, therefore, of the light yield(NGeV) were carried out for the scintillation and Cherenkov signals oftowers 15, 16 and 21 of the lead matrix and tower Al 2 of the coppermodule (Fig. 4). The light yield was measured to be in the range of100–200 photoelectrons per GeV deposited energy for the scintilla-tion channels, and 20–40 photoelectrons per GeV for the Cherenkovchannels. Differences between the results obtained for individualtowers are mainly attributed to differences in the quantum efficiencyof the PMT which converts the light into electric signals, in thequality of the polishing of the fiber ends and in the optical couplingbetween the fiber bundles and the PMT windows.
Fig. 16. The energy resolution as a function of the size of the beam spot. Shown are the results for the combined scintillation and Cherenkov signals for 80 GeV electrons inthe lead calorimeter (a) and for 40 GeV electrons in the copper module (b).
Fig. 17. The average scintillation and Cherenkov signals as function of the angle ofincidence of the 80 GeV electrons used for this study. The insert shows thegeometry of the exposed module and the direction of incidence of the beamparticles. These measurements were performed with an earlier lead-based proto-type module. See text for details.
9 The angular width of distributions such as the ones shown in Fig. 18 isdetermined by the numerical aperture of the fibers. Reducing the index ofrefraction from 1.59 to 1.49 narrows the angular width of the bump and increasesthe angular range for which the responses of the Cherenkov and scintillationstructures are about equal [7].
10 A 5 mm SiC diode, manufactured by Hewlett Packard. The rise time andFWHM of the pulses were set to 5 ns each.
N. Akchurin et al. / Nuclear Instruments and Methods in Physics Research A 735 (2014) 130–144140

4. Discussion
4.1. Decomposition of the measured energy resolution
In well designed calorimeters, stochastic fluctuations dominatethe em energy resolution. Contributions come from samplingfluctuations and from fluctuations in the numbers of photoelec-trons produced per GeV deposited energy
sE¼ astochffiffiffi
Ep with astoch ¼ asamp � ap:e:: ð3Þ
Sampling fluctuations are determined both by the samplingfraction and the sampling frequency, i.e., both by the fraction of theshower energy deposited in the active calorimeter layers, and bythe dimensions of these individual sampling layers. The followingempirical formula was found to describe sampling fluctuations ina large variety of different sampling calorimeters using non-gaseous active material [8]:
asamp ¼ 0:027ffiffiffiffiffiffiffiffiffiffiffiffiffiffiffiffid=f samp
q; ð4Þ
in which d represents the thickness of individual active samplinglayers (in mm), and f samp the sampling fraction for minimumionizing particles (mips). In our copper module, d¼1.0 mm andf samp ¼ 0:046, so that asamp ¼ 0:127. Based on the measured lightyield, we found for the contributions of fluctuations in thenumbers of photoelectrons for the scintillation and Cherenkovchannels in this module (ap:e: ¼ 1=
ffiffiffiffiffiffiffiffiffiffiffiNGeV
p) values of 0.103 and
0.189, respectively. This leads to expected stochastic termsastoch ¼ 0:227 for the Cherenkov channel and 0.162 for the scintil-lation channel.
These results are graphically depicted in Fig. 19, where the exp-erimental data points are the same ones as in Fig. 13. The contributionsof sampling fluctuations and the total stochastic fluctuations arerepresented by the dashed and solid lines, respectively. Apart fromthe results for the Cherenkov (Fig. 19a) and scintillation signals(Fig. 19b), Fig. 19c shows the results for the combined signals. In thatcase, the sampling fluctuations are reduced by a factor
ffiffiffi2
p, to 8.9%,
while the total stochastic term becomes 13.9%.
Fig. 19 shows that the slopes of the solid lines (describing thetotal stochastic term) are very similar to the slopes of theexperimental data. Deviations from E�1=2 scaling are largestin the case of the scintillation signals, and smallest for theCherenkov ones. These deviations are caused by effects discussedearlier in this paper, in particular signal non-uniformities whichcause the response to depend on the impact point of the particles.Since the beam spot used for the lowest energy particles (6 GeV)was larger than for the other energies, it stands to reason that thedeviation from E�1=2 scaling is somewhat larger than average atthis energy (see also Fig. 16 in this context).
The figure also illustrates to what extent the energy resolutionmight be further improved by increasing the light yield. A furtherincrease, e.g., through light detectors with a larger quantumefficiency might improve the total resolution possibly by as muchas 30%. Additional gains may be obtained by eliminating orreducing the effects of response non-uniformities.
4.2. Comparison with other integrated fiber calorimeters
An important characteristic of the RD52 calorimeter is the factthat, while it is longitudinally unsegmented, it is intended to measureall particles (electrons, gammas, hadrons and jets) with the sameinstrument, calibrated with electrons. Previously, two other fibercalorimeters based on the same idea have been constructed andtested: SPACAL and DREAM. It is therefore interesting to compare theem performance of the RD52 calorimeter with that of these twoinstruments, whose results are described in Refs. [4,3], respectively.
Fig. 20 shows the differences in the sampling structures of thethree calorimeters, on the same scale. The sampling fraction ofSPACAL was dictated by compensation requirements, which didnot play a role for the other two calorimeters, whose structure wasinstead affected by the properties of the PMTs which were used todetect the light signals. In the DREAM calorimeter, which was thefirst one to test the dual-readout principle, the two types of fiberswere housed together in the same hollow copper tubes. The twotypes of fibers were split at the rear end of the module. As a result,they sampled the showers that developed in the calorimeter in thesame way, and the energy resolution did not improve when both
Fig. 18. The Cherenkov/scintillation signal ratio for 80 GeV electrons as a function of the angle of incidence of the beam particles with respect to the fiber direction. Theresults are given for the first (a) and second (b) tower traversed by the particle showers. The setup of these measurements is shown in Fig. 17.
N. Akchurin et al. / Nuclear Instruments and Methods in Physics Research A 735 (2014) 130–144 141

signals were combined. In that sense, the RD52 structure led to abig improvement, as illustrated in Fig. 13.
Because of the extremely collimated core of the em showers, thereis a systematic response difference between particles entering thedetector inside the absorber material or inside the fibers in this type ofcalorimeter. This difference is responsible for a non-Gaussian lineshape of the scintillation signals, which is clearly visible in the DREAMcalorimeter (Fig. 21c). This effect gets rapidly worse when the angle ofincidence of the particles approaches 01. As explained in Section 3.3,this effect is absent for the Cherenkov signals, which are even in the
rather crudely sampling DREAM calorimeter well described by aGaussian function (Fig. 21d).
Because of the very small distance between neighboringsampling layers (fibers), this impact point dependence barelyaffects the lineshape of the RD52 calorimeter.11 This is illustrated
Fig. 20. The structure of the new RD52 calorimeter (copper-based modules), compared to that of two other fiber calorimeters: DREAM [3] and SPACAL [4].
Fig. 19. The em energy resolution measured with the Cherenkov fibers (a), the scintillating fibers (b) and the sum of all fibers (c) in the copper-fiber calorimeter. Also shownare for each case the contributions of sampling fluctuations and the total stochastic fluctuations. The latter are defined as the quadratic sum of sampling fluctuations andPoisson fluctuations in the number of photoelectrons. See text for details.
11 Expressed in Moliere radii (ρM), the distance between neighboring fibers is0:022ρM in RD52, 0:099ρM in DREAM and 0:071ρM in SPACAL.
N. Akchurin et al. / Nuclear Instruments and Methods in Physics Research A 735 (2014) 130–144142
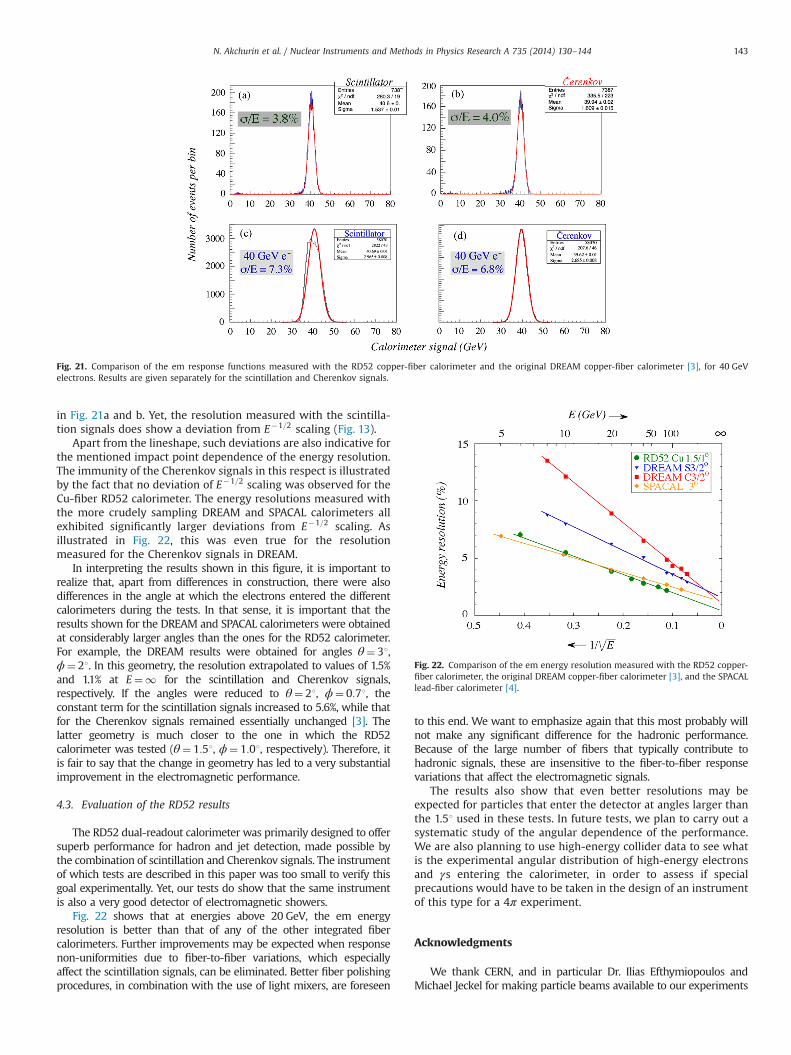
in Fig. 21a and b. Yet, the resolution measured with the scintilla-tion signals does show a deviation from E�1=2 scaling (Fig. 13).
Apart from the lineshape, such deviations are also indicative forthe mentioned impact point dependence of the energy resolution.The immunity of the Cherenkov signals in this respect is illustratedby the fact that no deviation of E�1=2 scaling was observed for theCu-fiber RD52 calorimeter. The energy resolutions measured withthe more crudely sampling DREAM and SPACAL calorimeters allexhibited significantly larger deviations from E�1=2 scaling. Asillustrated in Fig. 22, this was even true for the resolutionmeasured for the Cherenkov signals in DREAM.
In interpreting the results shown in this figure, it is important torealize that, apart from differences in construction, there were alsodifferences in the angle at which the electrons entered the differentcalorimeters during the tests. In that sense, it is important that theresults shown for the DREAM and SPACAL calorimeters were obtainedat considerably larger angles than the ones for the RD52 calorimeter.For example, the DREAM results were obtained for angles θ¼ 31,ϕ¼ 21. In this geometry, the resolution extrapolated to values of 1.5%and 1.1% at E¼1 for the scintillation and Cherenkov signals,respectively. If the angles were reduced to θ¼ 21, ϕ¼ 0:71, theconstant term for the scintillation signals increased to 5.6%, while thatfor the Cherenkov signals remained essentially unchanged [3]. Thelatter geometry is much closer to the one in which the RD52calorimeter was tested (θ¼ 1:51, ϕ¼ 1:01, respectively). Therefore, itis fair to say that the change in geometry has led to a very substantialimprovement in the electromagnetic performance.
4.3. Evaluation of the RD52 results
The RD52 dual-readout calorimeter was primarily designed to offersuperb performance for hadron and jet detection, made possible bythe combination of scintillation and Cherenkov signals. The instrumentof which tests are described in this paper was too small to verify thisgoal experimentally. Yet, our tests do show that the same instrumentis also a very good detector of electromagnetic showers.
Fig. 22 shows that at energies above 20 GeV, the em energyresolution is better than that of any of the other integrated fibercalorimeters. Further improvements may be expected when responsenon-uniformities due to fiber-to-fiber variations, which especiallyaffect the scintillation signals, can be eliminated. Better fiber polishingprocedures, in combination with the use of light mixers, are foreseen
to this end. We want to emphasize again that this most probably willnot make any significant difference for the hadronic performance.Because of the large number of fibers that typically contribute tohadronic signals, these are insensitive to the fiber-to-fiber responsevariations that affect the electromagnetic signals.
The results also show that even better resolutions may beexpected for particles that enter the detector at angles larger thanthe 1.51 used in these tests. In future tests, we plan to carry out asystematic study of the angular dependence of the performance.We are also planning to use high-energy collider data to see whatis the experimental angular distribution of high-energy electronsand γs entering the calorimeter, in order to assess if specialprecautions would have to be taken in the design of an instrumentof this type for a 4π experiment.
Acknowledgments
We thank CERN, and in particular Dr. Ilias Efthymiopoulos andMichael Jeckel for making particle beams available to our experiments
Fig. 21. Comparison of the em response functions measured with the RD52 copper-fiber calorimeter and the original DREAM copper-fiber calorimeter [3], for 40 GeVelectrons. Results are given separately for the scintillation and Cherenkov signals.
Fig. 22. Comparison of the em energy resolution measured with the RD52 copper-fiber calorimeter, the original DREAM copper-fiber calorimeter [3], and the SPACALlead-fiber calorimeter [4].
N. Akchurin et al. / Nuclear Instruments and Methods in Physics Research A 735 (2014) 130–144 143

in the H8 beam. We gratefully acknowledge Eileen Hahn and ErikRamberg of Fermilab who took care of the aluminization of theCherenkov fibers used in one of the copper modules. This study wascarried out with financial support of the United States Department ofEnergy, under contract DE-FG02-12ER41783, and by Italy's IstitutoNazionale di Fisica Nucleare and Ministero dell'Istruzione, dell'Univer-sità e della Ricerca.
References
[1] R. Wigmans, Calorimetry, Energy Measurement in Particle Physics, Interna-tional Series of Monographs on Physics, vol. 107, Oxford University Press, 2000.
[2] N. Akchurin, et al., Nucl. Instr. and Meth. A 537 (2005) 537.[3] N. Akchurin, et al., Nucl. Instr. and Meth. A 536 (2005) 29.[4] D. Acosta, et al., Nucl. Instr. and Meth. A 308 (1991) 481.[5] N. Akchurin, et al., Nucl. Instr. and Meth. A 548 (2005) 336.[6] N. Akchurin, et al., Nucl. Instr. and Meth. A 533 (2004) 305.[7] N. Akchurin, R. Wigmans, Rev. Sci. Instr. 74 (2003) 2955.[8] R. Wigmans, in: C. Grupen, I. Buvat (Eds.), Handbook of Particle Detection and
Imaging, vol. 1, Springer Verlag, 2011, pp. 497–517.
N. Akchurin et al. / Nuclear Instruments and Methods in Physics Research A 735 (2014) 130–144144