Embed Size (px)
Citation preview
The Electoral Effect of Credit Claiming for Pork Barrel Projects in Congress
Kenneth N. Bickers University of Colorado
Diana Evans
Trinity College
Robert M. Stein Rice University
Robert D. Wrinkle
University of Texas-Pan American
For presentation at the Workshop on Elections and Distribution, Yale University, Oct. 26-27, 2007. An earlier version of this paper was presented at the annual meeting of the American Political Science Association, Chicago, IL, Aug. 30 – Sept. 2, 2007

2

3
Abstract
This study examines the electoral connection between members of Congress and their constituents through credit claiming for traditional pork barrel projects, defined as categorical and discretionary grant awards, and legislative earmarks to congressional districts. Previous research on the electoral impact of pork has employed federal spending in congressional districts as the measure of pork; often implicit in that work is the assumption that members claim credit for that spending and therefore receive electoral benefits. We argue that it is important directly to measure credit claiming, which is central to the theory of the electoral benefits to be derived from pork. We collect from members’ websites data on legislators’ credit claiming for earmarks and federal grants. Using individual level survey data from the 2006 Cooperative Congressional Election Study we examine the impact of credit claiming for distributive benefits on voters’ electoral support for incumbent House members in the 2006 election. We find that credit claiming did not unconditionally endear members to their constituents. The effects of pork on voters’ support for the incumbent were frequently negative and mediated by both the voter’s and the candidate’s party. However, those effects were not always as expected: Republican voters tended to reward Democrats for earmarks, while voters of both parties sometimes punished incumbents for credit claiming for grants.

4
The Election Effects of Credit Claiming for Pork Barrel Projects in Congress Pork barrel politics is heavily ingrained in our national politics. The conventional wisdom is that those members of Congress most able to procure spending programs in their districts are rewarded at the ballot box with reelection and a larger margin of victory. The research literature has supported this belief starting with Mayhew’s seminal work (1974) and followed by over 30 years of research that has documented a connection albeit often qualified between federal benefits targeted to individual Congressional districts and electoral support for incumbents (Fiorina 1977; 1981; Rundquist and Griffith, 1976; Ray 1980; Johannes and McAdams 1981; McAdams and Johannes 1988; Fiorina 1981; Evans Yiannakis 1981; Cain, Ferejohn and Fiorina 1987; Parker, 1986; Stein and Bickers 1994, 1995; Alvarez and Schousen 1993; Alvarez and Saving 1997; King 1991; Owens and Wade 1984; Serra and Cover 1992). However, others have not found a connection between pork barrel benefits and election outcomes (Feldman and Jondrow 1984; Frisch 1998). Given the weight of the evidence in favor of the electoral connection in various forms, why is another study of pork barrel politics needed?
Previous research on the electoral impact of pork has employed federal spending in congressional districts as the measure of pork. The literature has largely (and often implicitly) assumed that members claim credit for that spending and proceeds to investigate both the patterns of pork distribution and its electoral effects. However, the theoretical literature assumes that credit claiming is key to the electoral benefits that incumbents obtain from pork. Most notably, credit claiming is at the center of Mayhew’s analysis of members’ incentives to seek particularized benefits for their constituents in the first place. The purpose, of course, is to enhance their chances for reelection: “Credit claiming is highly important to congressmen, with the consequence that much of congressional life is a relentless search for opportunities to engage in it” (Mayhew 1974: 53). Yet given the controversy surrounding earmarks in recent years, it is not altogether clear that incumbents will always claim credit broadly across the district; rather, in some cases they may target private communications to some recipients. We can no longer assume credit claiming is universal for all things coming into a congressional district. Moreover, if we extrapolate from the scholarship cited above on the electoral effects of pork barrel spending, we cannot assume that all credit claiming is efficacious.
There is a second major advantage of using members’ own credit claiming as the measure of pork: this measure allows us to measure separately the impact of earmarks and grants, described below. Research that uses federal spending in members’ districts mixes and effectively buries the less numerous earmarks in the mass of categorical grants. Similarly, research that uses earmarks only as the measure of pork (typically, the Pig Book, published by Citizens Against Government Waste, or CAGW), does not measure the effect of federal discretionary grants.
5
This study examines the electoral connection between members of Congress and their constituents from two perspectives: credit claiming for traditional pork barrel projects, by which we mean categorical and discretionary grant awards, and legislative earmarks to congressional districts. Earmarks are spending provisions written into appropriations bills or, more frequently, the reports accompanying those bills, directing agencies to allocate moneys to specific recipients (Law and Tonon; 2006; Andres 1995; Brach and Wachs 2005; Evans 2004).1 In the last twenty years the character and scope of the federal ‘pork barrel’ has changed. The most significant and widely publicized change has been the rise of earmarks, which are usually awarded at the request of the legislators themselves. Earmarks are contrasted with categorical grant-in-aid programs that are competitively awarded by federal agencies on the basis of merit, need or previously designated criteria, without the direct involvement of a representative. However, earmarks are not a new legislative phenomenon. In the 18th and 19th centuries, earmarks were extremely popular and common. Better known as ‘private’ bills Congress would frequently enact spending programs that distributed benefits to single individuals and small numbers of individuals (see Skocpol 1992). In recent years, although funding for many categorical assistance programs2 has either remained constant or declined (U.S. Census 2004), the number and cost of legislative earmarks have grown significantly (CRS 2006; CAGW 2007). The Pig Book, an annual compilation of pork in appropriations bills, shows that between FY 1996 and FY 2006, the number of earmarked projects increased by a dramatic 940%, although the increase in the cost of earmarks during that period was much less - 80% in constant dollars. Andres (1995) hypothesizes that earmarks are more frequent during periods of split than unitary control of the executive and legislative branches of government. He reasons that during periods of unitary control of government “Congress can count on the administration for help in realizing distributional goals through means other than just passing laws (1995:209),” including approval of their categorical grant applications. “The situation is completely different under divided government. A lack of responsiveness by the administration for a member’s distributional priorities begets frustration, and frustration begets earmarks (1995:209).”3 However, although earmarking 1 Researchers and journalists have offered several definitions of earmarks. The essential attributes of an earmark are that Congress, through the appropriation process, designates all three of the following elements of an appropriation item including: a spending program or project, a funding amount, a single recipient and, a specific department, agency and/or bureau to implement the appropriation (see Brach and Wachs 2004:2). 2 The major exceptions are entitlement grants for Medicare and Medicaid which have experienced significant increases in outlays driven by a growing population of eligible recipients and new services (e.g., prescription drug benefits). 3 Munson (1993) suggests a similar hypothesis when he quotes a House Appropriations Committee member during a period of divided government: “I used to plead endlessly for grants from the agencies, but I’ve since learned that it’s far quicker and less complicated to approach the cardinal (subcommittee chair) for an earmark request (1993:67-68).”
6
grew dramatically between 1996 and 2000 when control of Congress and the executive was divided, it continued to grow during the more recent period of unified government.
Using individual level survey data from the 2006 Cooperative Congressional Election Study we match respondents with data about the flow of federal assistance and legislative earmarks to their respective congressional districts. In particular, we focus on House members’ credit claiming for distributive benefits to their constituents. Credit claiming information is obtained from House members’ press releases for the 109th Congress (i.e., 2005 and 2006). Our central question is whether constituents’ support for their incumbent representatives varies with credit claiming for these two forms of federal outlays to House districts.
Our paper proceeds with a brief discussion of the two types of pork barrel
spending, categorical and formula based assistance programs and appropriation earmarks. In section two we discuss the extant literature on the electoral connection and offer an explanation for how the electoral connection might operate differently for categorical and formula programs on one the hand and legislative earmarks on the other. Section three provides a description our research design and measures. Section four reports our findings. We conclude with a discussion of our findings and the need for additional research in section five.
The Two Faces of Pork Barrel Spending
The pork barrel describes government spending programs that are intended to benefit constituents of an incumbent officeholder in return for their political support, either in the form of campaign contributions or votes. The essential attribute of a pork barrel project is that benefits that are concentrated in a particular area (e.g., congressional district) while costs are spread among all taxpayers. A key characteristic of such projects is that they are so particularized that changing or removing one district’s benefit would have no impact on the benefits received by other districts (Shepsle and Weingast 1981: 96). A typical example is an earmark included in the FY 2004 agriculture appropriations bill: $3,690,000 for the Nutrient Management Laboratory in Marshfield, Wisconsin. Legislators are known to exchange votes (i.e., logroll) for these types of ‘distributive’ spending programs, anticipating that each incumbent benefits from the adoption and allocation of their own distributive spending program.
Historically, pork barrel spending has taken two forms: the appropriations
earmark and the categorical grant award. The earmark is centered in the appropriations process and consists of instructions to agencies to allocate moneys directly to specific recipients, usually for specific purposes. Earmarks are typically included not in the appropriations bill itself but in the accompanying committee report. On the other hand, categorical grants are authorized and appropriated by Congress for multiple years and
However, Andres and Munson offer only anecdotal evidence to support their hypothesis about the likelihood a congressional representative will seek an appropriation earmark.

7
provide distributive funding to predefined classes of recipients.4 In the case of categorical aid programs potential recipients apply to a designated federal agency for assistance on the basis of criteria prescribed in existing legislation. A review process conducted within an agency is undertaken and awards (usually fewer than there are applications) are made.
The politics of categorical aid programs has been discussed extensively in the
literature (Arnold 1979; Anagnoson 1982; Stein 1979; Bickers and Stein 1994; 1997). Where categorical aid programs require agency review the focus shifts from Congressional debates to the agencies, where legislators lobby the agencies for favorable award decisions (Arnold 1979; 1990; Anagnoson 1982).
Appropriations earmarks are centered in Congress. Those who have studied the
politics of earmarks (Evans 2004; 1994; Savage 1999) note that the trading of votes for policy in the appropriations committees and their subcommittees often results in oversized coalitions that support an array of particularized distributive benefits. Scholars who have studied earmarks in specific policy venues (e.g., transportation and higher education) have identified several factors that influence the incidence and nature of earmarking including the role of committee chairs (for example, Savage 1991; Evans 1994, 2004), state size (Lee 2002; Oppenheimer and Lee 1999), and partisanship (for example, Balla, Lawrence, Maltzman, and Sigelman 2002).
Previous Research on the Electoral Connection
Stories abound in the popular press about the passage of laws that bestow pork on legislative districts. The presumption is that this form of behavior is widespread and produces dividends at the ballot box. For this there is some scholarly evidence, as noted above. However, the relationship between pork and electoral support appears to be mediated by a number of variables. We focus here on several such effects: the “moveability” of the voter’s choice, interest group membership, and the partisanship of both the voter and the incumbent.
Hillygus and Jackman (2003) demonstrate that some voters, i.e, independents,
undecideds and partisans who initially support candidates of the 'other' party, will be susceptible to incumbent campaign messages, messages which, as we show, include credit claiming for new grant awards and earmarks. We call these voters “moveables” and expect that they are more susceptible to credit claiming (a type of campaign effect that Hillygus and Jackman did not test) given their weak prior candidate choices or the inconsistency between their partisan and candidate preferences. Moreover, we suspect that these voters are targeted to receive incumbents’ campaign messages, especially about
4 In addition to categorical and formula based assistance programs the federal government also provides assistance in the form of loans, guaranteed loans, direct payments to individuals, insurance, and the use of federal government property (U.S. Catalog of Federal Domestic Assistance.)
8
'good things' happening in the district. Thus, we expect to find greater effects of credit claiming among moveables (i.e., mismatched voters, independents and undecideds) than among voters whose initial candidate choice is aligned with their own partisanship.
Stein and Bickers (1994) find that members of interest groups and those who are
attentive to politics are significantly more likely to support the reelection of House members who ‘bring home the bacon. This is because interest group leaders communicate legislators’ service to their own members; hence, those members are more likely to be aware of benefits received and vote on the basis of those benefits.
There are numerous indications that the effect of pork barrel benefits on
incumbents’ electoral performance is mediated by party identification and/or ideology of both incumbents and voters. Sellers (1997) finds that the procurement of federal assistance is electorally beneficial only for those legislators who are fiscally consistent i.e., “where their votes on federal spending are consistent with their credit claiming for pork flowing into their districts.” Sellers analyzes the impact of federal spending at both the aggregate and individual levels, finding that:
In districts receiving substantial pork fiscally liberal incumbents perform better electorally than fiscal conservatives. In low-pork districts fiscal conservatives perform better (Sellers 1997:1024). Other scholars have found similar effects for Democratic v. Republican
legislators, with Democrats benefiting more from federal spending than Republicans (Alvarez and Saving 1997; Alvarez and Schousen 1993). Sidman and Mak (2006) find that conservative Republican voters punish Republican incumbents for higher levels of federal spending in the district, while liberal Democratic voters reward Republican incumbents for such spending. On the other hand, they find that Democratic incumbents have little chance of gaining Republican support or losing Democratic support regardless of how little or how much pork they provide.
In much earlier work, Cain, Ferejohn and Fiorina (1987: 184) found that voters
were more likely to reward Democratic incumbents for both district benefits, including pork, and service to individual constituents (casework). (Johannes and McAdams 1981 and McAdams and Johannes 1988 found such rewards only for pork barrel benefits, not casework.) Moreover, survey respondents were more likely answer affirmatively to the following question, “Do you remember anything special that your U.S. representative has done for this district…..”, if that incumbent was a Democrat. Voters were also more likely to positively evaluate Democratic incumbents for obtaining pork barrel benefits (Cain, Ferejohn and Fiorina 1987: 125, 140). Why were Democrats more likely than Republicans to be remembered for their service to the district? There are two possible answers to that question: Democrats got more benefits for their constituents; or Democrats got the same volume of benefits as Republicans but did more public credit claiming for them so that more constituents were aware of the benefits. Their data as presented do not allow an answer to that question.
9
It is worth noting that a significant and positive relationship between within-district aid allocations and electoral behavior may be observed, but only for certain types of federal aid programs. Bickers and Stein (2000) demonstrate a partisan bias in the type of federal assistance members seek for their district, independent of district attributes, need and demand. Republican representatives tend to seek and benefit at the ballot box from contingent liability programs that support loans, guaranteed loans and other subsidies to small business and individuals. Democrats seek and benefit from more capital-intensive federal assistance programs and assistance to individuals for social services. It is possible that a positive relationship between federal assistance and electoral support for the incumbent is observed only when Republican (Democratic) pork is procured for Republican (Democratic) constituents. Similarly the relationship between federal assistance and electoral competitiveness might be observed only when the content of program benefits is matched with the partisan and policy preferences of different constituents within the district (also see Alvarez and Saving 1997). It might be that a partisan correlate of the electoral impact of pork is spurious and a function of the content of the benefit received. We plan to test this hypothesis in future work. Most of the research described above measures pork barrel spending using data on federal spending in members’ districts (Bickers and Stein 1991). There is little research on the electoral benefits of earmarking (for an exception, see Frisch 19985). The belief is that members engage in legislative earmarking in order to benefit their constituents and in turn their own opportunities for reelection. Lee (2003) suggests that House members might be more inclined to credit claim for earmarks than grants because they garner greater electoral advantage from the former. She reasons that “because House districts (unlike states) are not administrative units in the federal system, House members cannot effectively claim credit for most grant-in-aid funds. Instead, their best credit-claiming opportunities lie in earmarked projects….” (2003:714). By contrast, as far as constituents are concerned earmarks are an exercise in raw legislative power. Members encourage their constituents to believe that their efforts and theirs alone produced that new bridge or research facility; that impression may not be far from the truth. Discretionary grants are indeed different from earmarks. Members may have had little to do with the application; they may or may not have intervened with the responsible agency. However, the member’s office is allowed to announce the grant, and so they likely get some credit. But in their press releases, they often must share credit, at least implicitly, with the group that received the grant. Moreover, as Lee (2003) argues, a significant majority of grant recipients are other governmental units, usually states, counties, municipal governments and special districts. These recipients are represented
5 In an aggregate-level analysis of earmarks for which members of the 103rd Congress claimed credit, Frisch found no relationship between earmarks and members’ electoral margins.
10
by other elected officials, with ambition for reelection and higher office. Consequently, there is likely to be competition in credit claiming for many grants.6 Do constituents view pork with the same contempt as watchdog groups? Recall that Mayhew’s (1974) electoral connection hypothesis argues that legislators take credit for the good things they do in the district in order to reap the electoral benefits of federal largesse. If an earmark is something a member might not want to claim credit for publicly, then its electoral value may be diminished.7 On the other hand, the conventional political wisdom is consistent with Mayhew’s analysis: both constituents and members of Congress excoriate earmarks as pork only when they are in someone else’s district. If that is true, anti-pork campaigns might result in a variation on Richard Fenno’s familiar paradox: we hate Congress for being so wasteful but love our own representatives for meeting our district’s needs so effectively. If that is the case, then members receive electoral benefits from the earmarks for which they claim public credit. Thus, given the likely existence of competitors for credit for federal grants and the more unqualified credit that members can claim for earmarks, we expect members to receive greater electoral benefits from earmarks than from grants. Hypotheses The literature suggests several hypotheses about the electoral advantages of categorical grant programs and legislative earmarks:
H1 Credit claiming for earmarks and grants is likely to have a positive effect on voters’ support for the incumbent.
H2 The electoral benefits of credit claiming for earmarks will exceed those of grant awards. H3 Earmarks and grants are likely to have a greater effect on moveables (mismatched voters, independents and undecideds) than on voters whose initial candidate choice is aligned with their own partisanship H4. Interest group members are more likely to be influenced by credit claiming for pork barrel benefits.
H5 Republican incumbents are less likely than Democrats to gain electoral benefits from pork.
6 Yet Levitt and Snyder (1997) show there are significant externalities from district specific grant awards that electorally benefit all members of the state’s congressional delegation. This might suggest that credit claiming is a cooperative rather than competitive activity among a state’s House delegation. 7 Clearly the recipients and beneficiaries of concentrated earmarks can reciprocate with individual campaign contributions.
11
H6 Republican voters are less likely than Democrats to reward incumbents for providing pork.
Research Design and Measures To test the electoral benefits of earmarks and categorical grant awards we need a database that provides us with the frequency with which members claim credit and the dollar value of those claims for each type of distributive benefit. We also need a measure of voters’ support for the incumbent officeholder. Our main independent variable is claims of credit by incumbent House members for categorical aid assistance and appropriations earmarks procured for their respective districts. Data on the incidence and frequency of credit claims were collected from the on-line press releases of each representative for a sample of congressional districts (N=67) for the years 2005 and 2006 (i.e., 109th Congress).8 Communications from members of Congress to their constituents have been shown to increase the likelihood that constituents can correctly identify members’ votes on key issues (Lipinski 2003). We use press releases as proxies for all communications between members and their constituents. We do not assume that all members’ press releases are equally likely to be reported by the local media. Indeed, the extent to which the local media cover members of Congress apparently varies according to the congruence between the media market and congressional district lines, among other variables (Schaffner and Sellers 2003; Vinson 2002). Nevertheless, Daniel Lipinski’s interviews with House members and their staff indicated that members convey the same messages in all settings and media, including mass mailings, personal appearances, and mass media coverage (2004: 12-13).9 Therefore, we assume that if members bother to put out a press release claiming credit for a project, they communicate that achievement in other venues as well. We use press releases because they happen to be a particularly accessible source of those messages. Members’ press releases for 2005 and 2006 were coded for the following information:
• Description of aid award or earmark i.e., policy content. • The dollar amount of the grant award or earmark.
8 Our full sample consists of 67 congressional districts in 11 states (Colorado, Connecticut, Illinois, Indiana, Michigan, Minnesota, New Jersey, New York, North Carolina, Ohio, and Pennsylvania). The sample was drawn to maximize the number of competitive congressional districts (i.e., winning margin < 60%) as well as 7 incumbents who lost the election. Fifty-five percent of the districts were represented by Republicans, as compared to fifty-three percent of the House of Representatives as a whole. 9 Moreover, Schaffner notes that reporters for local newspapers do not actively report on the local representatives; rather, they rely on members’ own press releases and other member-generated information or wire copy (2006: 493).
12
• Recipient of aid award or earmark. • Granting agency or appropriations subcommittee. • Stage in the legislative process at which credit for an earmark was
claimed. • Date of the press release.10
In the case of earmarks, credit claiming occurs at several points in the congressional session. Members may repeatedly credit claim as an appropriations bill moves through the legislative process. Consequently, we often observe two or more credit claims for the same earmark.11 Each claim is counted as a unique opportunity to communicate with the member’s constituents and convey the message that they are working for them and have the necessary clout to bring home the bacon. We examine the impact of both the total number of such benefits and the total dollar value of the benefits claimed by the member. Thus, there are four measures of pork barrel benefits for which members claim credit: the number of grants, the dollar value of grants, the number of earmarks, and the dollar value of earmarks. Individual-level data are taken from the Cooperative Congressional Election Study (CCES) first conducted during the 2006 midterm congressional election. CCES is a 38,443 person national stratified sample survey conducted before and after the November 2006 mid-term congressional election.12 A portion of the survey consists of a
10 Coders were instructed to download all press releases issued in 2005 and 2006 by each representative in the sample and to examine them for announcements of federal grants and appropriations earmarks for the representative’s district. In addition to earmarks awarded in appropriations bills, highway projects in the 2005 highway reauthorization bill were included, as those earmarks are as binding as appropriations earmarks. Otherwise, distributive benefits mentioned in connection with authorization bills or budget bills were not included, as those are contingent on the actions of the Appropriations Committees or other stages in the appropriations process. 11 This strategy is clearly advantageous for House members who do not ultimately succeed in obtaining an earmark for their district. In these instances members might at least succeed in obtaining credit for their efforts on behalf of the district.
12 The survey was administered in two waves. In the pre-election phase, respondents answer two-thirds of the questionnaire. This segment of the survey asks about general political attitudes, various demographic factors, assessment of roll call voting choices, and political information. The pre-election phase was administered late September to late October and rolled out in three distinct time-periods, the end of September, the middle of October, and the end of October. Spacing of interviews across these intervals allows researchers to gauge the effects of campaign information and events on the state and district electorates. The post-election survey queried respondents on whether and how they voted and their campaign experiences. The post-election survey was fielded during the week after the November 6, 2006 election.
13
common set of questions asked of all 38,443 people (the Common Content); the remainder of the questionnaire consists of Team Content designed by individual teams and asked of a subset of 1,000 people. (We use questions from the Common Content only.) To select the respondents, a representative national sample was chosen from the Polimetrix Polling Point panel using sample matching.13 For our own sample, we selected the respondents surveyed in the states and congressional districts in our sample of House members. The total number of observations in our sample is 5,392. The mean number of respondents in the congressional districts in our sample is 84.12 with a standard deviation of 16.41. In addition to standard demographics, the CCES asked respondents for their partisan identification and ideological preferences, their participation in the 2006 midterm election, job approval rating of their incumbent House member and their vote choice in the House election in 2006. The pre-election survey also queried respondents about their interest group affiliations and past political participation (i.e., frequency of voting and campaign activity), among many other questions. 13 A random sub sample of size 36,501 was drawn from the 2004 American Community Study (ACS), conducted by the U.S. Bureau of the Census, which is a probability sample of size 1,194,354 with a response rate of 93.1% (participation in the ACS is mandatory). For each respondent in the selected ACS sub sample, the closest matching active PollingPoint panelist was selected using the following measure of distance: d(x,y). Following matching, the sample marginals were raked to the ACS marginals for age, race, gender, and education: Age 18-29 21.15%
30-44 29.85 45-64 32.93 65 plus 16.08
Race White 70.27% Black 11.04 Asian 4.46 Other 1.76 Hispanic 12.48
Education HS or less 46.63% Some College 28.56 College Grad 16.11 Post Graduate 8.71 Sex Male 48.2% Female 51.8
Raking was performed using iterative proportional fitting. The final weights were trimmed to lie between .33 and 3. For more information on sample matching see: Rivers, Douglas. 2006. “Sample Matching: Representative Sampling from Internet Panels” Polimetrix White Paper Series.
14
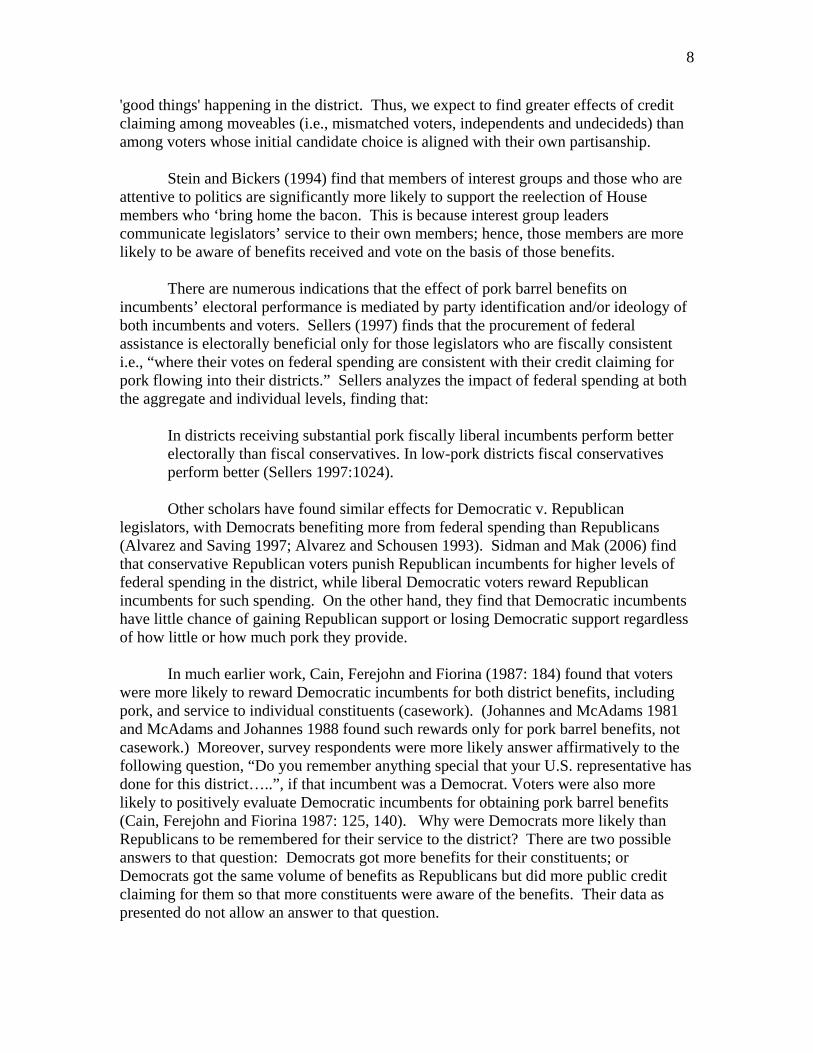
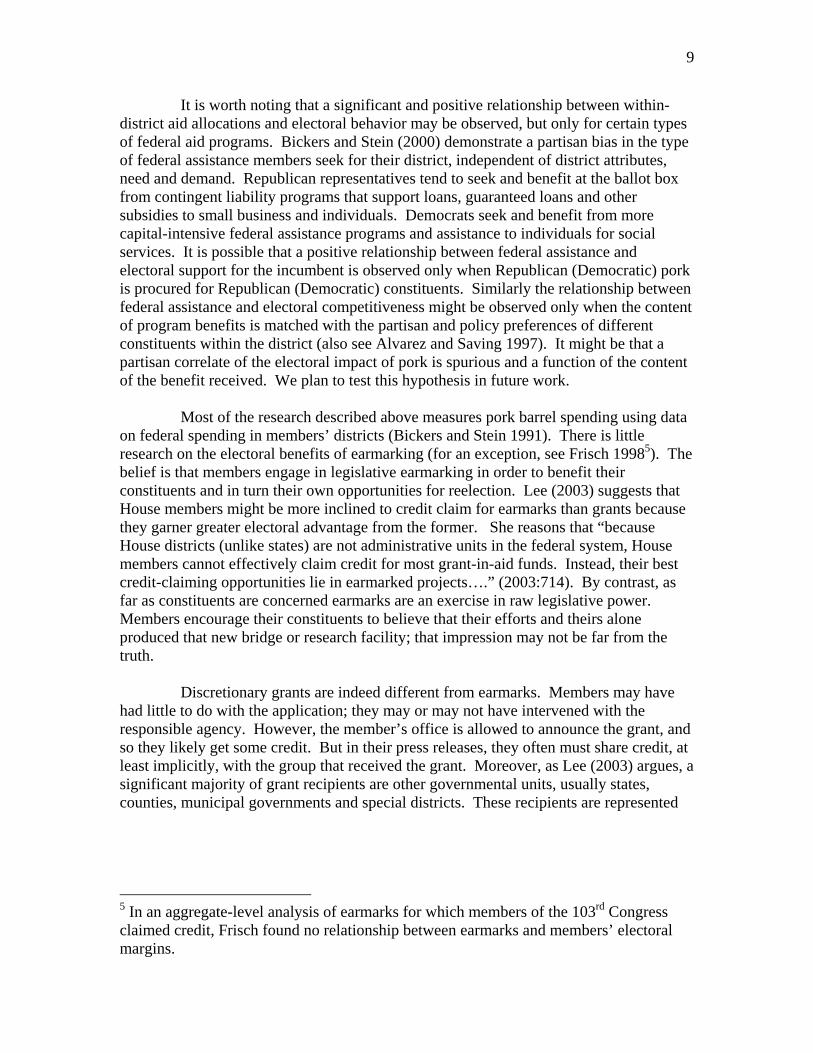
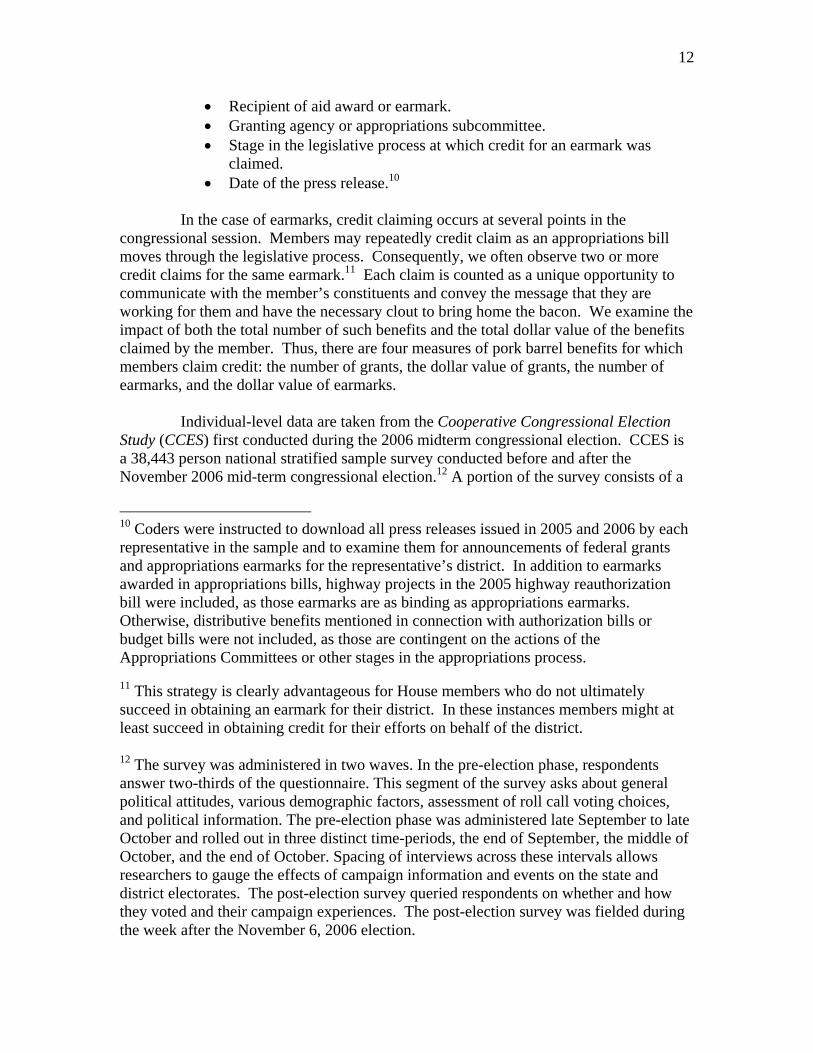
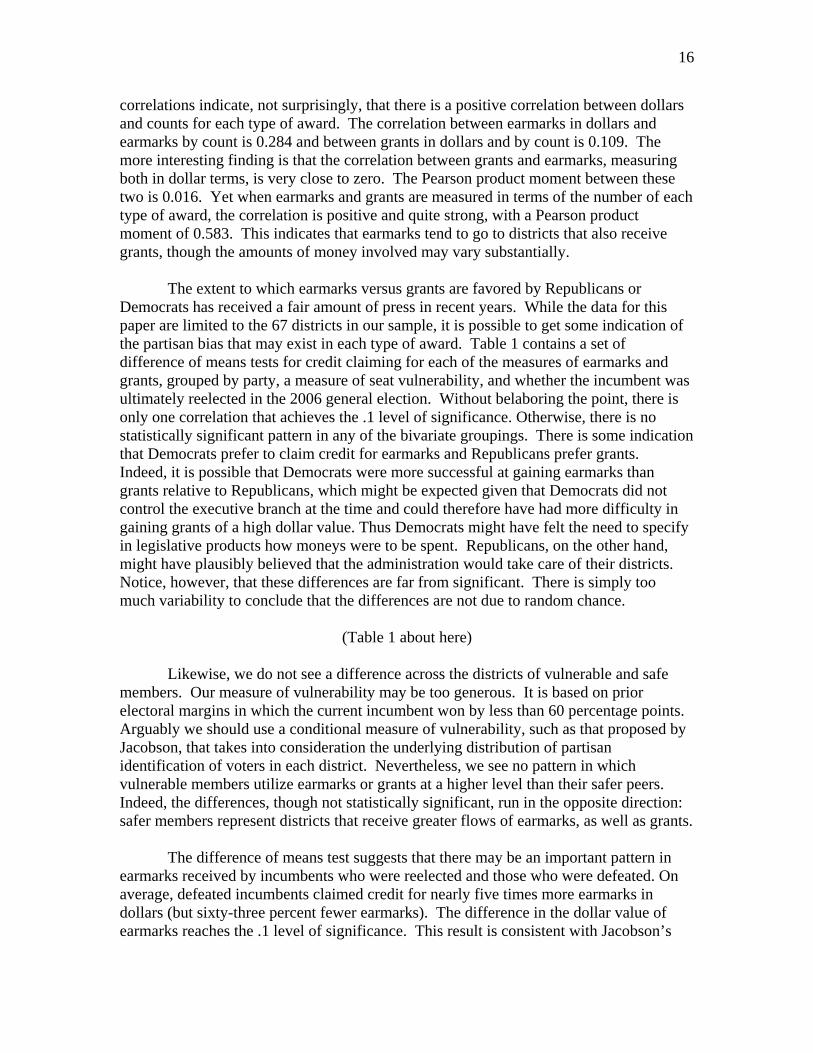
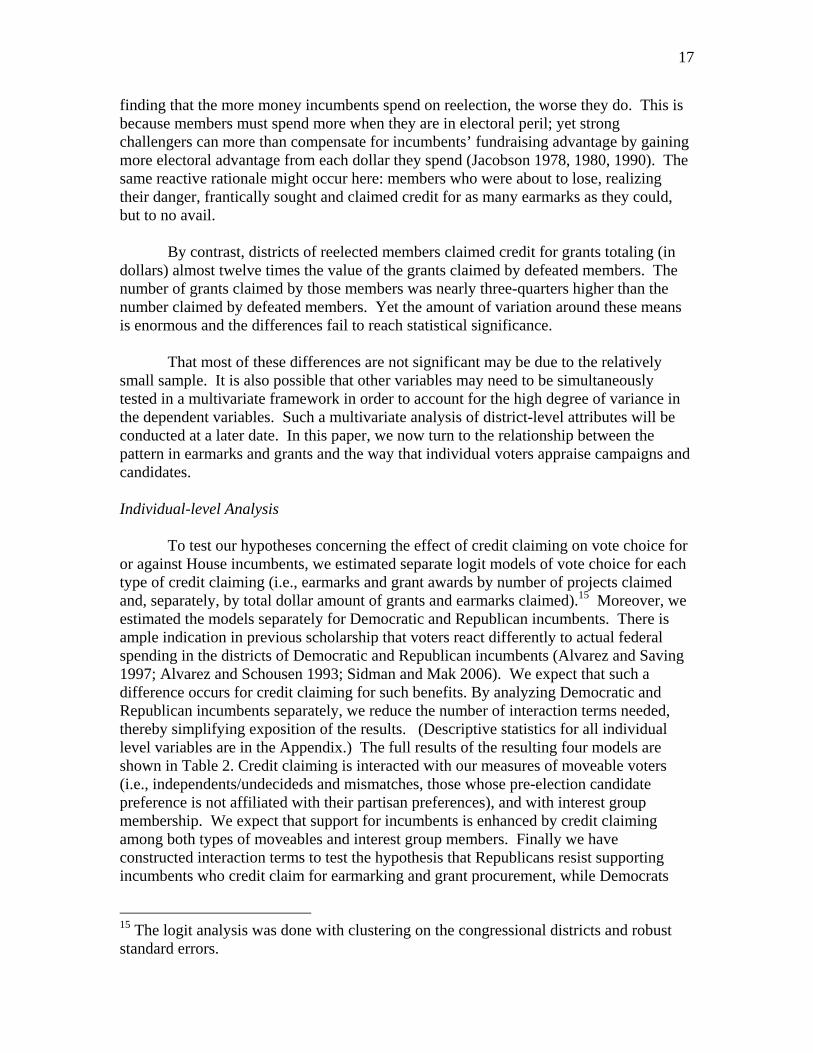
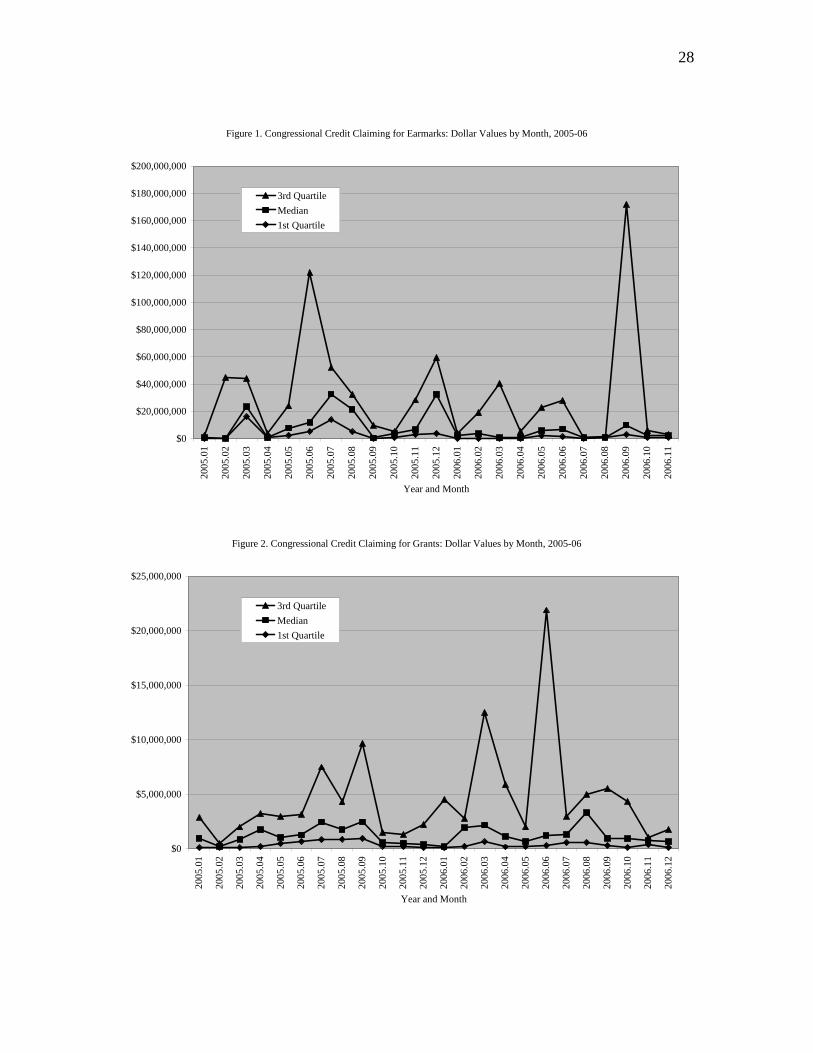
In addition to credit claiming by House incumbents, our independent variables include the party of the incumbent, the party of the voter, interest group membership, the seniority of the incumbent, and two measures of moveable voters. Interest group member is a dummy variable that takes the value of 1 if the respondent is a member of any of 10 groups mentioned in the survey. The ‘moveability’ of the voter is measured as two dummy variables. One, independent/undecided, is a dummy variable that takes the value of 1 for voters who (in the pre-election survey) identify as independents (not leaning toward either party) or undecided about their candidate vote choice. Mismatch takes the value of 1 for voters who, in the pre-election survey, do not support the candidate affiliated with their partisan preference. Moveables are thought to be most susceptible to credit claiming by incumbents. Finally, GOP voters (a dummy variable that takes the value of 1 for voters who identify as or lean toward Republicans, 0 for all others) are expected to resist credit claiming by incumbents and even to electorally punish those who they perceive as engaging in profligate federal spending. This effect could be magnified for Republican incumbents who are likely to otherwise preach fiscal restraint. Conversely, Democratic voters (a similar dummy variable for Democrats) are expected to reward incumbents for credit claiming. We also include the seniority of the incumbent (the number of years he/she had served as of 2006), a measure that likely captures otherwise unmeasured aspects of members’ performance, including their overall legislative effectiveness, prominence, and visibility in the district. Seniority is expected to be positively related to voter support for incumbents. Pork barrel benefits are expected to influence voters to vote for the incumbent who provided them. Therefore, our dependent variable is a dummy variable that indicates whether the respondent to the CCES survey voted for the incumbent or not. Results District-level Patterns Before modeling the effect of credit claiming on constituents’ support for incumbent representatives, we first analyze credit claiming at the district level. Key to this analysis is the pattern of earmarks and grants for which members claim credit in their press releases. Specifically, we focus on how credit-claiming for such awards varies across congressional districts and over time. The pattern of the two types of allocations is at least partly distinct. Figures 1 and 2 display, respectively earmarks and grants in dollars to the 67 congressional districts in our sample by month over the 2005-06 period. The figures display the median amounts, along with first and third quartile amounts, in each month. Most noteworthy is the relative front-loading of credit claiming for earmarks (Figure 1). Most of the major peaks of earmarked dollars fall in the first year. The highest peaks in 2005 likely reflect the passage of the five-year highway reauthorization,14 whose earmarks were included in the data. (Those earmarks are in all relevant respects equivalent to appropriations earmarks, as noted in footnote 10.)
14 The Safe, Accountable, Flexible, Efficient Transportation Equity Act: A Legacy for Users (SAFETEA-LU).
15
Members claimed credit for highway earmarks at two stages in the process: on March 10, when the bill passed the House, and on July 28, when the conference report passed the House. As this was a five-year authorization, the highway bill contained far more projects (6,371) than the typical annual appropriations bill. These peaks are the usual points at which members take credit for earmarks in these press releases: when a bill initially passes the House and when the conference report passes the House. By contrast, the peaks in 2006 are, with one notable exception (September), lower because only two appropriations conference reports passed the House; the remainder of the appropriations bills were included in a continuing resolution passed in 2007. In both years, the appropriations bills initially passed the House in May and June. That pattern, along with the timing of the highway bill, appears to account for the early credit claiming. In 2005, most of the appropriations conference reports were passed between October and December, when we see jumps in credit claiming. In Sept. 2006, when the dollar value of credit claiming reached its two-year peak, the House passed the defense appropriations conference report.
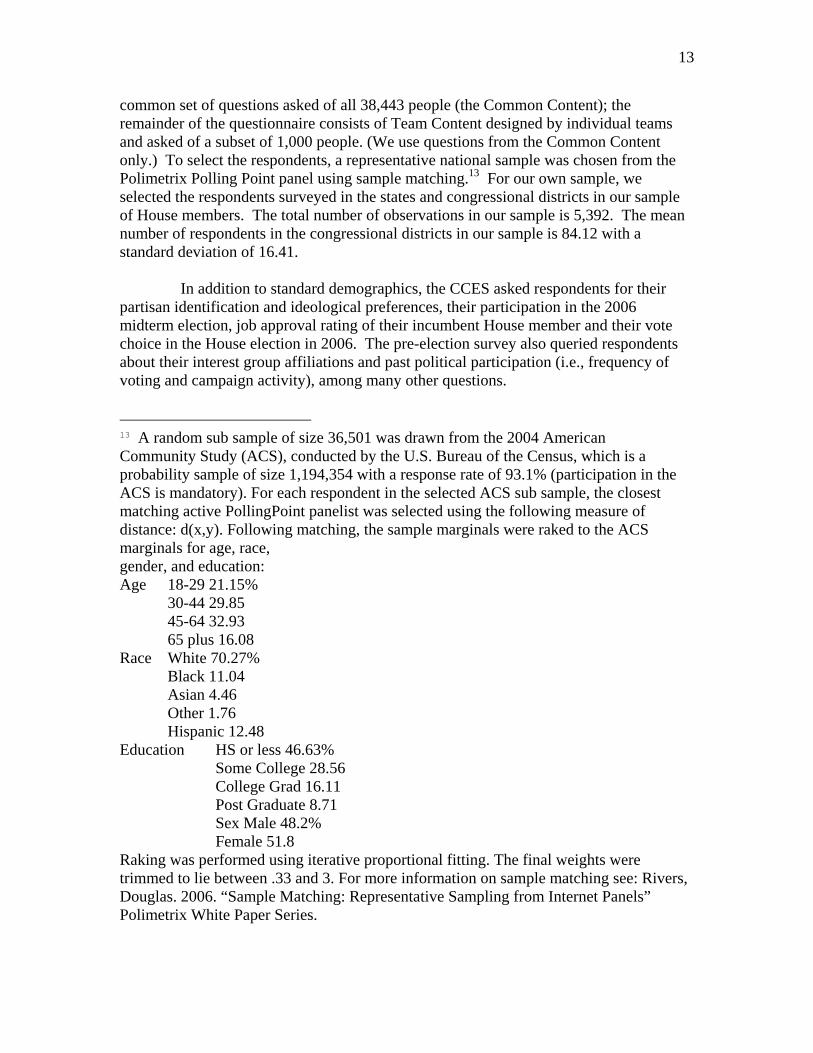
The pattern of credit claiming for grant amounts is strikingly different (Figure Two). Based upon a visual inspection, there appears to be a slight upward trend over the 24 month period. Also noteworthy, however, is the difference in the scale between these two figures. The highest third quartile peak in earmarks (Figure 1) is 172 million dollars; another third quartile peak is 122 million dollars. Indeed, the median value of earmarks ranges between 23.5 million dollars and 32.7 million dollars during three of the 24 months. By contrast, the highest third quartile peak among grant awards is 21.9 million dollars. Median grant allocations never exceed 3.3 million dollars.
(Figure 1 and Figure 2 about here)
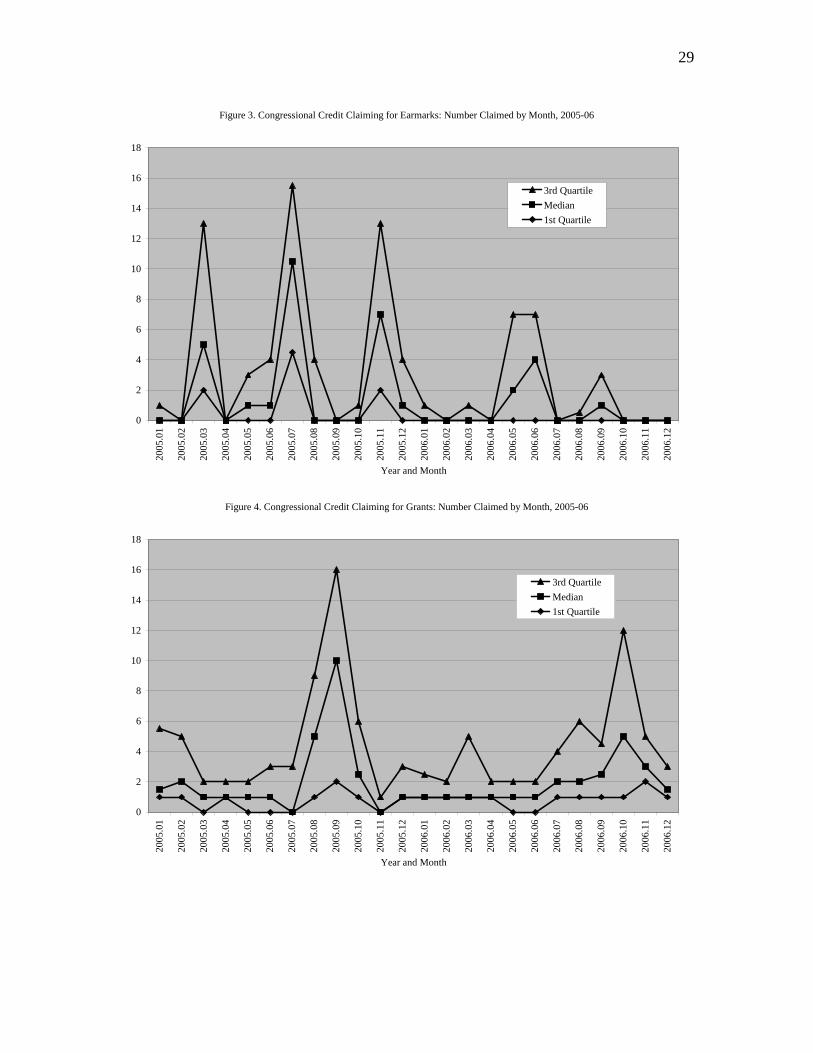
The pattern of credit claiming for earmark and grants is similar when we focus on
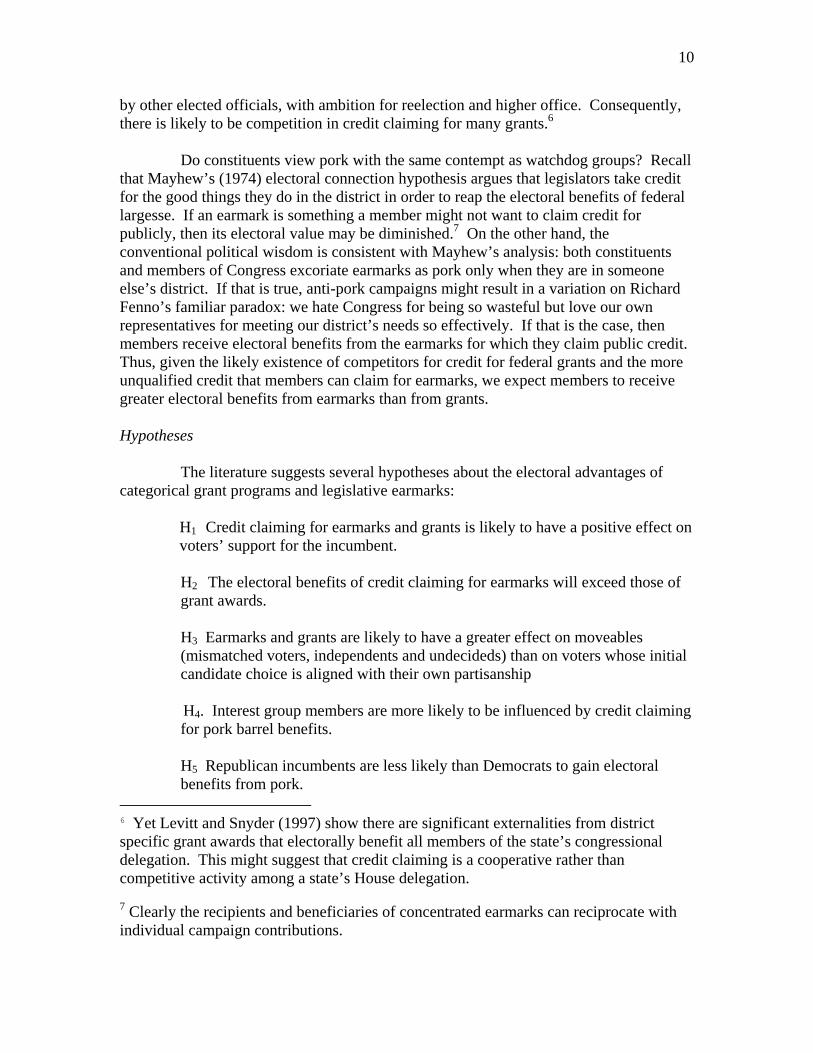
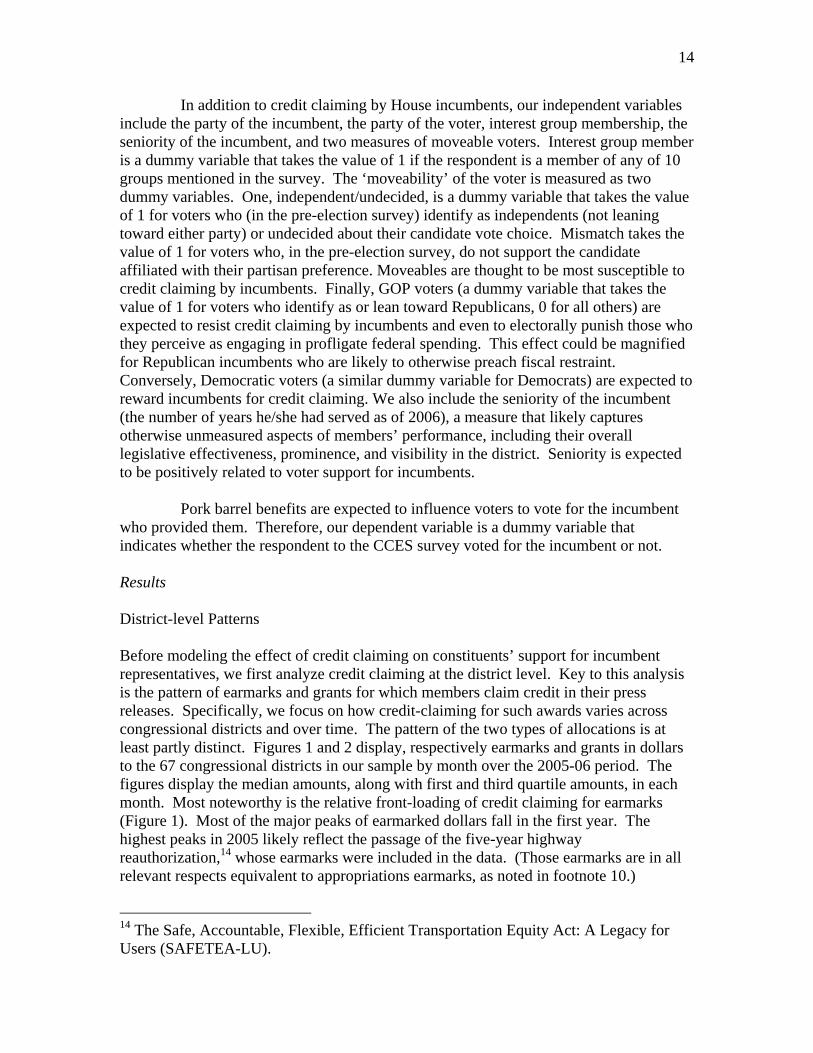
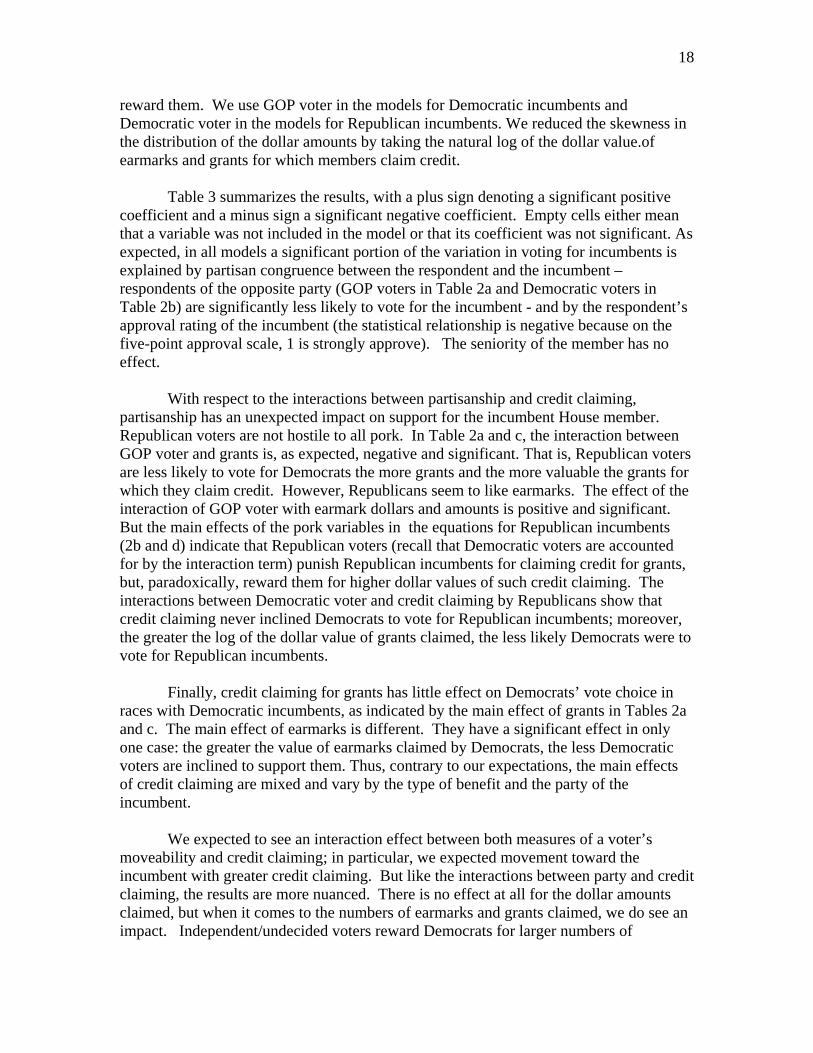
the number of earmarks and grant awards. Figure 3 displays medians and quartiles for the count of earmarks claimed per district in each month. The major peaks all fall in the first year, when the highway bill passed. Another way to look at this is to focus on the lower quartile counts. During the first year of the Congress, the first quartile counts were frequently larger than the third quartile counts from the second year. In fact, in no month during the second year of the Congress is the first quartile count above zero. By contrast, the pattern for the count of grant awards is much steadier (Figure 4). The median count is at least one grant per district in every month except for two; in nine months the median count is two or more per district. The pattern of spikes is also somewhat more spread out. The major discernible regularity appears to be that there are more grant awards in the second half of each year than in the first half.
(Figure 3 and Figure 4 about here)
Is there a tradeoff between which districts receive earmarks and which ones receive grant awards? Or do the two types of awards tend to move together? To answer this pair of questions, we calculated a correlation matrix of credit claiming for earmarks and grants, measured both in dollars and count of awards. Pearson product moment
16
correlations indicate, not surprisingly, that there is a positive correlation between dollars and counts for each type of award. The correlation between earmarks in dollars and earmarks by count is 0.284 and between grants in dollars and by count is 0.109. The more interesting finding is that the correlation between grants and earmarks, measuring both in dollar terms, is very close to zero. The Pearson product moment between these two is 0.016. Yet when earmarks and grants are measured in terms of the number of each type of award, the correlation is positive and quite strong, with a Pearson product moment of 0.583. This indicates that earmarks tend to go to districts that also receive grants, though the amounts of money involved may vary substantially.
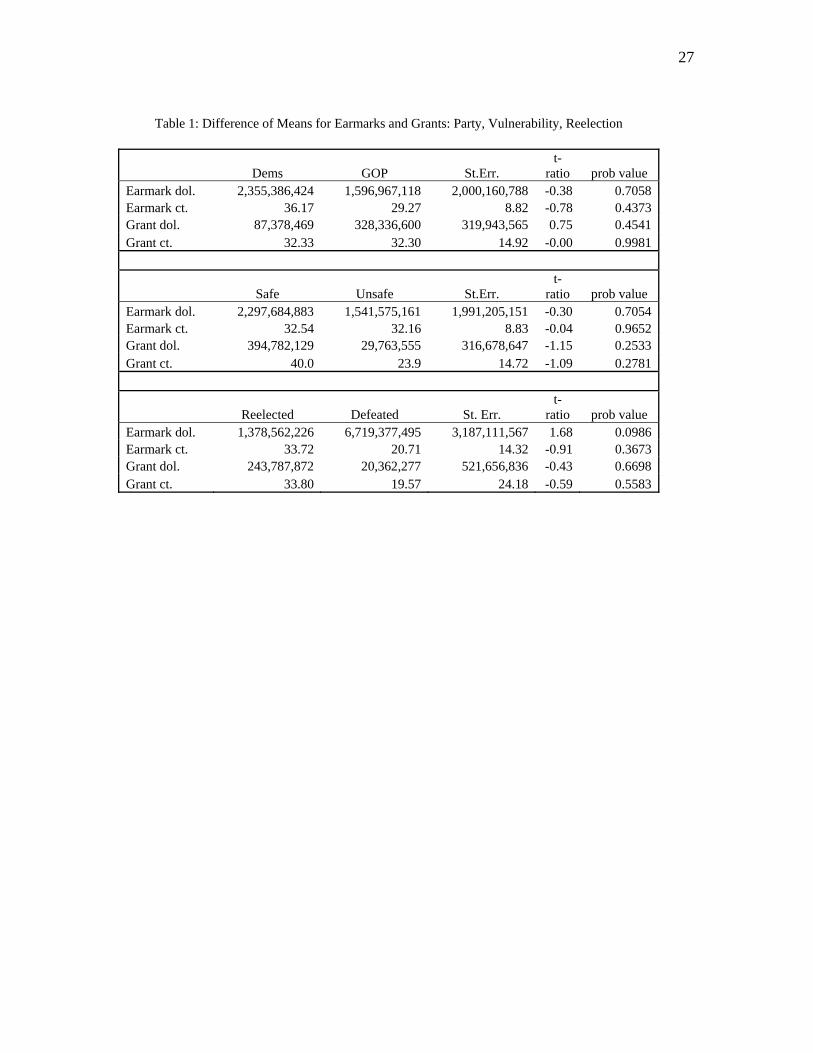
The extent to which earmarks versus grants are favored by Republicans or Democrats has received a fair amount of press in recent years. While the data for this paper are limited to the 67 districts in our sample, it is possible to get some indication of the partisan bias that may exist in each type of award. Table 1 contains a set of difference of means tests for credit claiming for each of the measures of earmarks and grants, grouped by party, a measure of seat vulnerability, and whether the incumbent was ultimately reelected in the 2006 general election. Without belaboring the point, there is only one correlation that achieves the .1 level of significance. Otherwise, there is no statistically significant pattern in any of the bivariate groupings. There is some indication that Democrats prefer to claim credit for earmarks and Republicans prefer grants. Indeed, it is possible that Democrats were more successful at gaining earmarks than grants relative to Republicans, which might be expected given that Democrats did not control the executive branch at the time and could therefore have had more difficulty in gaining grants of a high dollar value. Thus Democrats might have felt the need to specify in legislative products how moneys were to be spent. Republicans, on the other hand, might have plausibly believed that the administration would take care of their districts. Notice, however, that these differences are far from significant. There is simply too much variability to conclude that the differences are not due to random chance.
(Table 1 about here)
Likewise, we do not see a difference across the districts of vulnerable and safe
members. Our measure of vulnerability may be too generous. It is based on prior electoral margins in which the current incumbent won by less than 60 percentage points. Arguably we should use a conditional measure of vulnerability, such as that proposed by Jacobson, that takes into consideration the underlying distribution of partisan identification of voters in each district. Nevertheless, we see no pattern in which vulnerable members utilize earmarks or grants at a higher level than their safer peers. Indeed, the differences, though not statistically significant, run in the opposite direction: safer members represent districts that receive greater flows of earmarks, as well as grants.
The difference of means test suggests that there may be an important pattern in
earmarks received by incumbents who were reelected and those who were defeated. On average, defeated incumbents claimed credit for nearly five times more earmarks in dollars (but sixty-three percent fewer earmarks). The difference in the dollar value of earmarks reaches the .1 level of significance. This result is consistent with Jacobson’s
17
finding that the more money incumbents spend on reelection, the worse they do. This is because members must spend more when they are in electoral peril; yet strong challengers can more than compensate for incumbents’ fundraising advantage by gaining more electoral advantage from each dollar they spend (Jacobson 1978, 1980, 1990). The same reactive rationale might occur here: members who were about to lose, realizing their danger, frantically sought and claimed credit for as many earmarks as they could, but to no avail.
By contrast, districts of reelected members claimed credit for grants totaling (in dollars) almost twelve times the value of the grants claimed by defeated members. The number of grants claimed by those members was nearly three-quarters higher than the number claimed by defeated members. Yet the amount of variation around these means is enormous and the differences fail to reach statistical significance.
That most of these differences are not significant may be due to the relatively small sample. It is also possible that other variables may need to be simultaneously tested in a multivariate framework in order to account for the high degree of variance in the dependent variables. Such a multivariate analysis of district-level attributes will be conducted at a later date. In this paper, we now turn to the relationship between the pattern in earmarks and grants and the way that individual voters appraise campaigns and candidates.
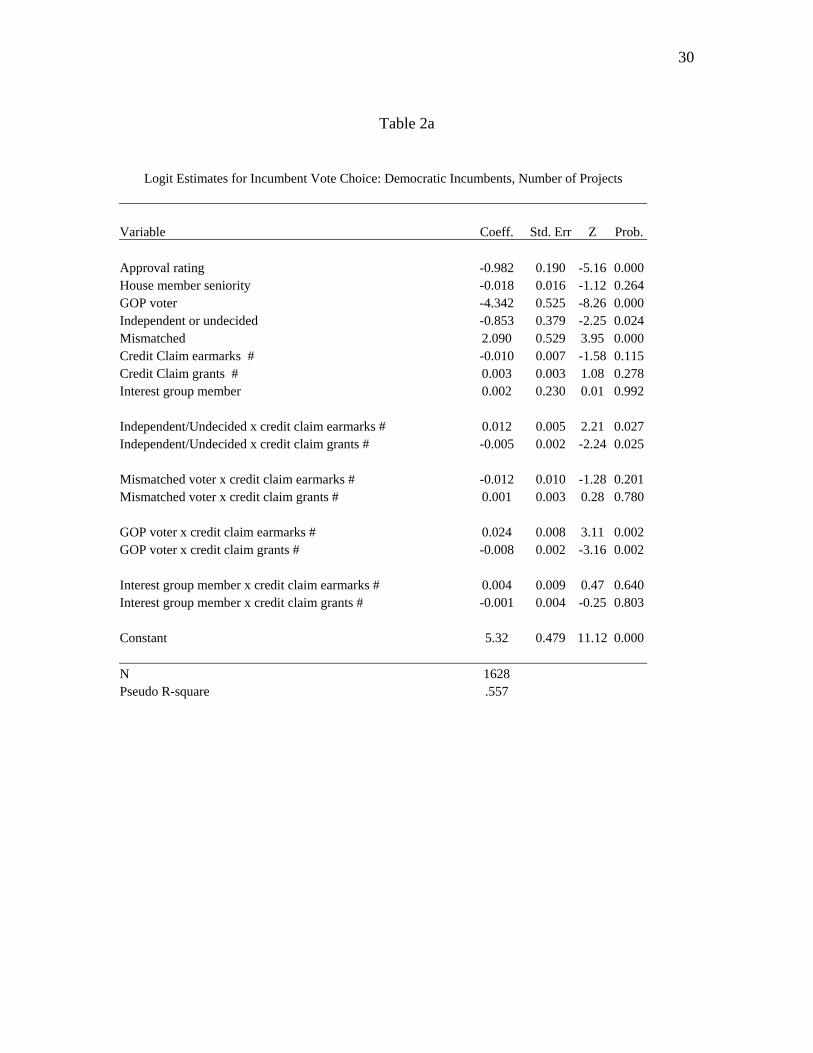
Individual-level Analysis To test our hypotheses concerning the effect of credit claiming on vote choice for or against House incumbents, we estimated separate logit models of vote choice for each type of credit claiming (i.e., earmarks and grant awards by number of projects claimed and, separately, by total dollar amount of grants and earmarks claimed).15 Moreover, we estimated the models separately for Democratic and Republican incumbents. There is ample indication in previous scholarship that voters react differently to actual federal spending in the districts of Democratic and Republican incumbents (Alvarez and Saving 1997; Alvarez and Schousen 1993; Sidman and Mak 2006). We expect that such a difference occurs for credit claiming for such benefits. By analyzing Democratic and Republican incumbents separately, we reduce the number of interaction terms needed, thereby simplifying exposition of the results. (Descriptive statistics for all individual level variables are in the Appendix.) The full results of the resulting four models are shown in Table 2. Credit claiming is interacted with our measures of moveable voters (i.e., independents/undecideds and mismatches, those whose pre-election candidate preference is not affiliated with their partisan preferences), and with interest group membership. We expect that support for incumbents is enhanced by credit claiming among both types of moveables and interest group members. Finally we have constructed interaction terms to test the hypothesis that Republicans resist supporting incumbents who credit claim for earmarking and grant procurement, while Democrats
15 The logit analysis was done with clustering on the congressional districts and robust standard errors.
18
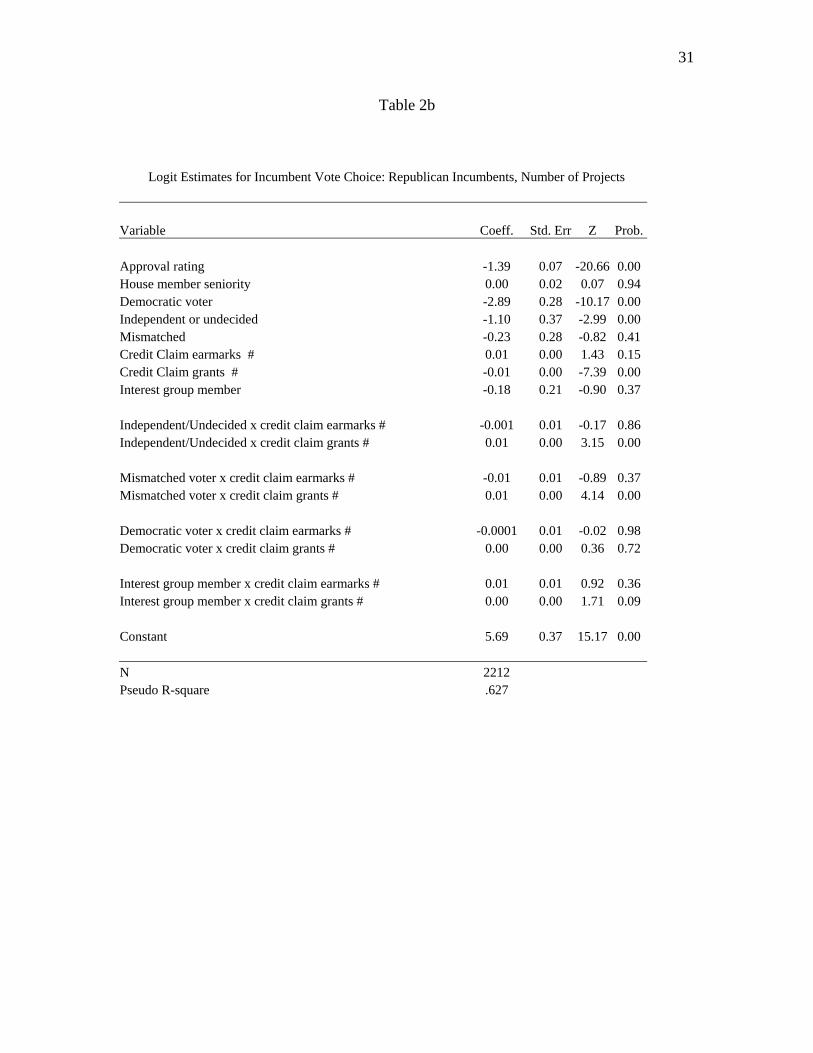
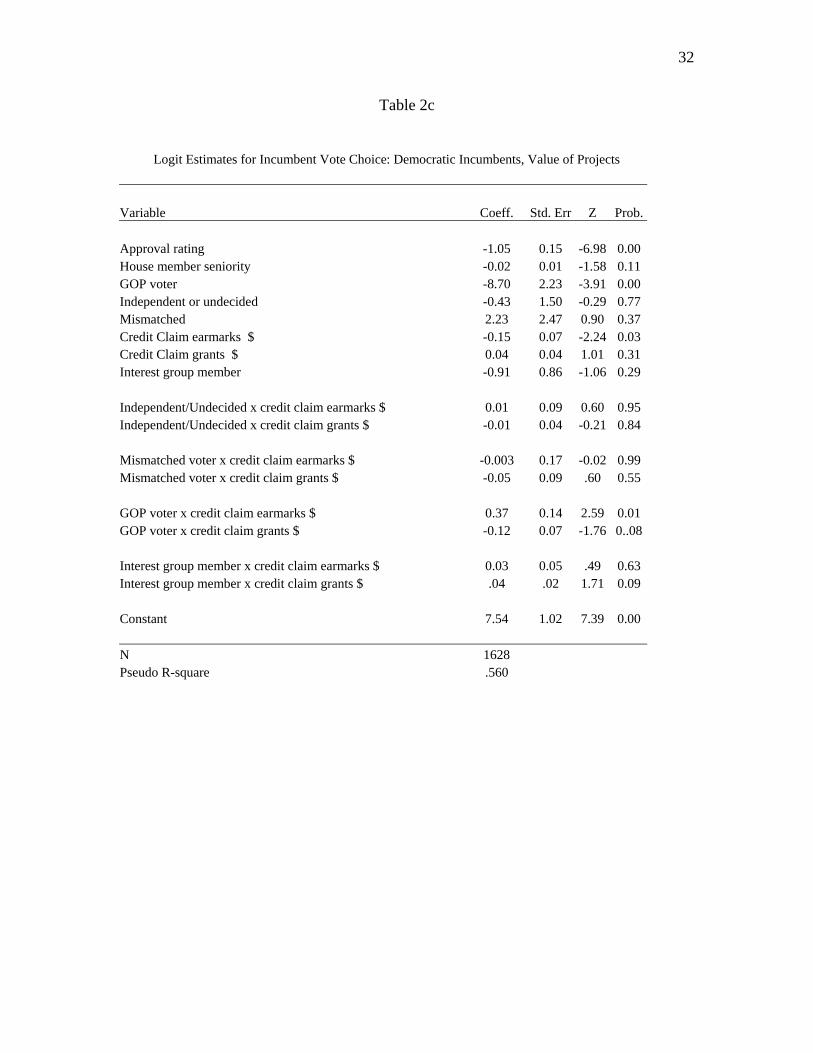
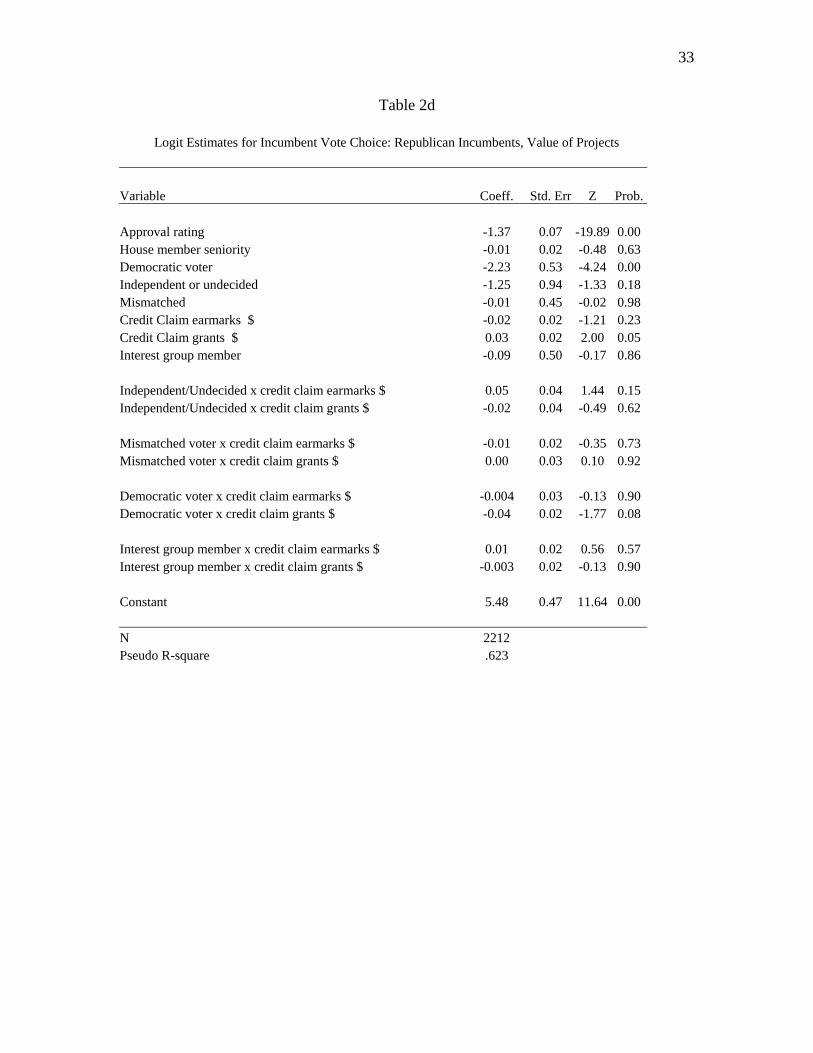
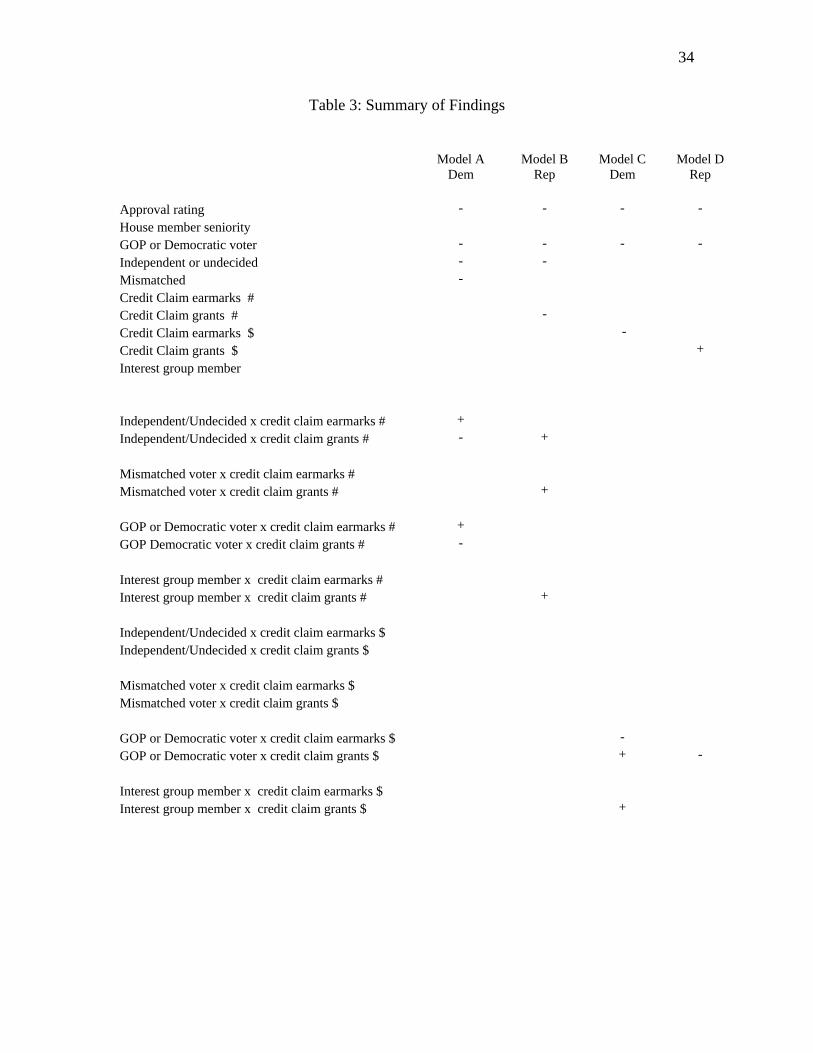
reward them. We use GOP voter in the models for Democratic incumbents and Democratic voter in the models for Republican incumbents. We reduced the skewness in the distribution of the dollar amounts by taking the natural log of the dollar value.of earmarks and grants for which members claim credit. Table 3 summarizes the results, with a plus sign denoting a significant positive coefficient and a minus sign a significant negative coefficient. Empty cells either mean that a variable was not included in the model or that its coefficient was not significant. As expected, in all models a significant portion of the variation in voting for incumbents is explained by partisan congruence between the respondent and the incumbent – respondents of the opposite party (GOP voters in Table 2a and Democratic voters in Table 2b) are significantly less likely to vote for the incumbent - and by the respondent’s approval rating of the incumbent (the statistical relationship is negative because on the five-point approval scale, 1 is strongly approve). The seniority of the member has no effect. With respect to the interactions between partisanship and credit claiming, partisanship has an unexpected impact on support for the incumbent House member. Republican voters are not hostile to all pork. In Table 2a and c, the interaction between GOP voter and grants is, as expected, negative and significant. That is, Republican voters are less likely to vote for Democrats the more grants and the more valuable the grants for which they claim credit. However, Republicans seem to like earmarks. The effect of the interaction of GOP voter with earmark dollars and amounts is positive and significant. But the main effects of the pork variables in the equations for Republican incumbents (2b and d) indicate that Republican voters (recall that Democratic voters are accounted for by the interaction term) punish Republican incumbents for claiming credit for grants, but, paradoxically, reward them for higher dollar values of such credit claiming. The interactions between Democratic voter and credit claiming by Republicans show that credit claiming never inclined Democrats to vote for Republican incumbents; moreover, the greater the log of the dollar value of grants claimed, the less likely Democrats were to vote for Republican incumbents.
Finally, credit claiming for grants has little effect on Democrats’ vote choice in races with Democratic incumbents, as indicated by the main effect of grants in Tables 2a and c. The main effect of earmarks is different. They have a significant effect in only one case: the greater the value of earmarks claimed by Democrats, the less Democratic voters are inclined to support them. Thus, contrary to our expectations, the main effects of credit claiming are mixed and vary by the type of benefit and the party of the incumbent.
We expected to see an interaction effect between both measures of a voter’s
moveability and credit claiming; in particular, we expected movement toward the incumbent with greater credit claiming. But like the interactions between party and credit claiming, the results are more nuanced. There is no effect at all for the dollar amounts claimed, but when it comes to the numbers of earmarks and grants claimed, we do see an impact. Independent/undecided voters reward Democrats for larger numbers of
19
earmarks but punish them for larger numbers of grants; in Democratic districts, they react to pork like Republicans in those districts. Yet independent and undecided voters reward Republicans for grants, suggesting that such voters prefer the sorts of grants Republicans obtain. Grants and earmarks have little effect on mismatched voters with the single exception of Republican incumbents’ grant volume, which they reward.
Finally, we fail to find much evidence to support the hypothesis that the vote choice of interest group members is more susceptible to the influence of credit claiming than non-interest group members. The sole exception relates to Republican incumbents’ grant volume, which interest group members have some tendency to reward. With respect to our hypotheses, the first two receive only qualified support. The first, that earmarks and grants have a positive effect on support for the incumbent, is only true with some groups of voters and types of credit claiming, e.g., Republican voters’ positive reaction to earmarks provided by Democratic incumbents. In other cases, credit claiming helps with some incumbents with some voters (e.g., Republican incumbents and independent/undecided voters) but in other cases it appears to backfire, as several groups of voters punish members for their efforts (for example, Democratic voters punish Republicans for higher dollar values of grants). Likewise, H5, and H6, that Republican incumbents are less likely to benefit from and Republican voters are less likely to reward credit claiming, receive mixed support. Both types of incumbents benefit and suffer depending on the type of voter; moreover, Republican voters are not at all averse to earmarks. Here it is worth noting that a great many of the earmarks claimed in this Congress came from the highway bill. These earmarks are favored by members of both parties in Congress; highway building is not a partisan issue. Thus, it is not so surprising that Republican voters react similarly.
We found qualified support for H2, that the electoral benefits of earmarks exceed those of grants, as in all but one case, the significant effects for earmarks were positive, whereas the opposite was often the case for grants.
We also hypothesized that the effects of credit claiming for pork are likely to be mediated by the match (or lack thereof) between incumbents and early voter preferences and by a voter’s status as independent or undecided (H3). Mismatched voters are positively influenced only by Republicans’ credit claiming for grants. Independents and undecideds are in two cases influenced to vote for incumbents and in one case to vote against by credit claiming. Interest group members (H4) were positively affected in only one case (Republican incumbents’ claiming for numbers of grants). Nevertheless, credit claiming for pork does affect voters’ support for incumbents. However, those effects are mediated by the party of the member and the voter and are, in some cases, negative. Conclusions
20
In this research, we have introduced two innovations: first, we have used credit claiming for distributive benefits rather than the benefits themselves as our key independent variable, as we argue that members’ credit claiming converts dollars to credit (or blame) with voters. Second, we have measured separately credit claiming for two distinctive types of federal benefits - grants and earmarks. This research strategy has paid off: we have found that different voters react to each type of credit claiming differently. Moreover, voters are as ready to punish as to reward members for gaining pork barrel benefits for their districts.
From some voters’ perspective, 2006 may have been a bad year to claim credit for either grants or earmarks. Great notoriety surrounded the conviction of Republican House member Randy Cunningham (Calif.) and lobbyists who traded contributions and outright bribes in return for earmarks for their clients. That publicity was used by Democrats to help make the case that congressional Republicans had been irretrievably corrupted by their twelve years in power. When that message was combined with the ridicule heaped on Sen. Ted Stevens’s notorious “bridge to nowhere” and other such projects, earmarks became synonymous in popular accounts with the corruption of incumbency. Democratic voters did in fact react more negatively to pork than Republican voters. Yet it is possible that the failure of pork barrel benefits uniformly to benefit incumbents was a result of short term national forces which robbed the pork barrel of its magic. These forces may not recur in the near future. On the other hand, it is possible that these results indicate important underlying patterns. In particular, it may be the case that Republican and Democratic incumbents claim credit for different types of grants and that those grants in some way antagonize voters of the opposite party.
Consequently, we plan to investigate the impact of pork barrel benefits over time with the intention of establishing whether the effects we found were general or are in fact particular only to those elections in which pork barrel politics becomes a national issue.
In addition, we plan to extend this analysis of the 2006 election to include data on the actual grant and earmark awards to members’ districts. With these data, we can determine whether credit claiming is necessary for members to receive an electoral benefit from pork or whether there is some other process by which legislators are benefited (if they are benefited at all) by federal spending in their districts, such as a diffuse sense that the status quo is favorable and one need not rock the boat by turning incumbents out of office. With these data we will also be able to determine whether there is systematic variation among members in the extent to which they claim credit; e.g., do Republicans claim credit for less or more or different benefits than Democrats?
We did not include in our model a measure of the impact of the war in Iraq on voters’ decisions. To the extent that incumbents were defeated on the basis of this issue, it is likely because voters deviated from their usual voting patterns. Therefore, some of the Iraq war effect is likely picked up by the “moveable” variables. In future analysis we plan to estimate a two-stage model to test for this effect.

21
Appendix: Descriptive statistics
Variable N Mean Std. Dev Min Max
Vote for incumbent 3851 0.57 0.49 0 1 Approval Rating 5372 2.86 1.44 1 5 Interest group membership 5392 0.40 0.49 0 1 Seniority 5392 10.49 6.87 2 32 Mismatch 5392 0.54 0.23 0 1 Independent/Undecided Voters 5392 0.14 0.34 0 1 Party of the incumbent 5392 .57 .49 0 1 GOPvoter 5392 0.41 0.49 0 1 Democratic voter 5392 0.46 0.50 0 1 Interest group member 5392 0.40 0.49 0 1 Credit Claim Grants # 5392 31.61 60.62 0 347 Credit Claim Earmarks # 5392 32.15 35.43 0 136 Log Credit Claim Grants $ 5392 13.93 5.99 0 23.07 Credit Claim Earmarks $ 5392 15.99 6.45 0 24.57
22
References
Alvarez, R. Michael, and Jason L. Saving. 1997. Deficits, Democrats, and Distributive Benefits: Congressional Elections and the Pork Barrel in the 1980s.
Political Research Quarterly 50:809-831. Anagnoson, J. Theodore. 1982. Federal Grant Agencies and Congressional Election
Campaigns. American Journal of Political Science 26:547-561 Andres, Gary J. 1995. Pork Barrel Spending On the Wane? P.S.: Political Science and
Politics 28:207-211. Ansolabehere, Stephen. 2006. Cooperative Congressional Election Study – Common Content. Palo Alto, CA: Polimetrix, Inc. Anton, Thomas J., Jerry P. Cawley and Kevin L. Kramer. 1980. Moving Money: An
Empirical Analysis of Federal Expenditure Patterns. Cambridge, MA: Oelgeschlager, Guinn and Hain. Arnold, Douglas. 1979. Congress and the Bureaucracy: A Theory of Influence. New
Haven: Yale University Press ________. 1990. The Logic of Congressional Action. New Haven: Yale University Press. Balla, Steven J., Eric D. Lawrence, Forrest Maltzman and Lee Sigelman. 2002. "Partisanship, Blame Avoidance and the Distribution of Legislative Pork," American Journal of Political Science 46(3): 515-526. Bickers, Kenneth N., and Robert M. Stein. 1996. The Electoral Dynamics of the Federal
Pork Barrel. American Journal of Political Science 40:1300-1326. _______. 1994. "Congressional Elections and the Pork Barrel," Journal of Politics, 56:377-399 _______.1997. “Building Majority Coalitions for Sub-majority Benefit Distributions,” Public Choice 91:229-249.. ________. 2000. The Changing Structure of Federal Aid and the Politics of the
Electoral Connection,@ Paper presented at the annual meeting of the American Political Science Association, Washington, D.C.
________. 1991. "U. S. Domestic Assistance Programs Data Base," Mimeo. Bloomington: Indiana University. Bond, Jon R., Gary Covington and Richard Fleisher. 1985. "Explaining challenger
Quality in Congressional Elections," Journal of Politics 47: 510-529.

23
Brach, Ann., and Martin Wachs. 2005. Earmarking in the U.S. Department of Transportation Research Programs. Transportation Research A, 39(6), 501-52
Cain, Bruce, John Ferejohn and Morris Fiorina. 1987. The Personal Vote: Constituency
Service and Electoral Independence. Cambridge: Harvard University Press. Citizens against Government Waste http://www.cagw.org/site/PageServer?pagename=homepage Congressional Research Service, “Earmarks in Appropriations Acts FY 1994, FY 1996,
FY 1998, FY 2000, FY 2004, FY 2005.” Evans, Diana. 1994. “Policy and Pork: The Use of Pork Barrel Projects to Build Policy
Coalitions in the House of Representatives.” American Journal of Political Science 38: 894-917.
____________. 2004. Greasing the Wheels: Using Pork Barrel Politics to Build Majority Coalitions in Congress. New York: Cambridge University Press.
Feldman, Paul and James Jandrow. 1984. "Congressional elections and Local Federal Spending," American Journal of Political Science 28(1): 147-165. Fiorina, Morris P. 1977. "An Outline for a Model of Party choice," American Journal of Political Science 21(3): 601-686. Fiorina, Morris P. 1981. Some Problems in Studying the Effects of Resource Allocation
in Congressional Elections. American Journal of Political Science 25: 543-567. Frisch, Scott A. 1998. The Politics of Pork: A Study of Congressional Appropriation Earmarks. NY: Garland.. Hillygas, D. Sunshine, and Simon Jackman. 2003. “Voter Decision Making in Election
2000: Campaign Effects, Partisan Activation and the Clinton Legacy,” American Journal of Political Science 47: 583-596.
Jacobson, Gary C. 1978. “The Effects of Campaign Spending in Congressional Elections,” American Political Science Review 72: 469-91. ________. 1990. “The Effects of Campaign Spending in House Elections: New Evidence for Old Arguments,” American Journal of Political Science 34:334-362. ________. 1980. Money in Congressional Elections (New Haven, CT: Yale University Press).

24
Johannes, John R. and John C. McAdams. 1981. "The Congressional Incumbency Effect: Is it Casework, Policy Compatibility, or Something Else? An Examination of the 1978 Election," American Journal of Political Science 25(3): 512-542. King, Gary. 1991. “Constituency Service and Incumbency Advantage,” British Journal
of Political Science 21(1): 19-128. Law, Marc T., and Tonon, Joseph M. 2006. The Strange Budgetary Politics of
Agricultural Research Earmarks. Public Budgeting & Finance, 26: 1-21. Lee, Frances. 2000. Senate Representation and Coalition Building in Distributive
Politics. American Political Science Review, 94:50-72 ____________. 2002. Coalition Building in Transportation Policy: The Politics of
Geography in the U.S. House of Representatives. Presented at the annual meeting of the Midwest Political Science Association, Chicago, IL.
Lee, Frances E. and Bruce I. Oppenheimer. 1999. Sizing Up the Senate: The Unequal
Consequences of Equal Representation, Chicago: University of Chicago Press. Levitt, Steven D., and James M. Snyder, Jr. 1995. Political Parties and the Distribution of Federal Outlays. American Journal of Political Science, 39: 958-980. ___________. 1997. “The Impact of Federal Spending on House Election Outcomes,” Journal of Political Economy 105: 30-53. Lipinski, Daniel. 2003. “The Effect of Messages Communicated by Members of
Congress: The Impact of Publicizing Votes,” Legislative Studies Quarterly 26(1):81-100.
Lipinski, Daniel. 2004. Congressional Communication: Content and Consequences. Ann
Arbor: University of Michigan Press. Mayhew, David R. 1974. Congress: The Electoral Connection. New Haven: Yale University Press. McAdams, John C. and John R. Johannes. "Congressmen, Perquisites and Elections,"
Journal of Politics 50(2): 412-439. Munson, Richard. 1993. The Cardinals of Capitol Hill. New York: Grove Press. Owens, John R. and Larry L. Wade. 1984. "Federal spending in Congressional
Districts," Western Political Quarterly 37(3): 404-423. Parker, Glenn. 1986. Homeward Bound: Explaining Changes in Congressional Behavior. Pittsburgh: University of Pittsburgh Press.
25
Ray, Bruce A. 1980. “Congressional Promotion of District Interests: Does Power on the
Hill Really Make the Difference?” In Political Benefits, ed. Barry S. Rundquist, Lexington, MA: Lexington Books.
Rundquist, Barry S. and David E. Griffith, 1976. “An Interrupted Time Series Test of the
Distributive Theory of Military Policy-Making.” Western Political Quarterly 29: 620-626.
Savage, James D. 1991. Saints and Cardinals in Appropriations Committee and the Fight Against Distributive Politics. Legislative Studies Quarterly 56: 329-348. ___________. 1999. Funding Science in America. New York: Cambridge University Press. Schaffner, Brian F. 2006. “Local News Coverage and the Incumbency Advantage in the
U.S. House.” Legislative Studies Quarterly 31:491-512. Schaffner, Brian F. and Patrick J. Sellers. 2003. “The Structural Determinants of Local
Congressional News Coverage,” Political Communication 20:41-57. Sellers, Patrick J. 1997. AFiscal Consistency and Federal District Spending.@ American
Journal of Political Science 41:1024-1041.
Sidman, Andrew H. and Maxwell H.H. Mak. 2006 “Pork, Awareness, and Ideological
Consistency: The Effects of Distributive Benefits on Vote Choice,” presented at the annual meeting of the Midwest Political Science Association, April 20-23.
Skocpol, Theda. 1992. Protecting Soldiers and Mothers: The Political Origins of Social
Policy in the United States, Cambridge, MA: The Belknap Press of Harvard University Press.
Sellers, Patrick J. 1997. Fiscal Consistency and Federal District Spending. American Journal of Political Science 41: 1024-1041. Serra, George and Albert D. Cover. 1992. "The Electoral Consequences of Perquisite Use: The Casework Case," Legislative Studies Quarterly 17(2): 233-245. Shepsle, Kenneth A. and Barry R. Weingast. 1981. "Political Preferences for the Pork Barrel: A Generalization," American Journal of Political Science 25(1): 96-111. Stein, Robert M. 1979. “Federal Categorical Aid: Equalization and the Application Process,” Western Political Quarterly, 32: 396-408.
26
Stein, Robert M., and Kenneth N. Bickers. 1994. Congressional Elections and the Pork Barrel. Journal of Politics 56: 377-399. __________. 1995. Perpetuating the Pork Barrel: Policy Subsystems and American Democracy. New York: Cambridge University Press. U.S. Bureau of the Census. 2004. Federal Assistance Awards Data System, Washington: U.S. Government Printing Office. Vinson, C. Danielle. 2002 Through Local Eyes: Local Media Coverage of Congress and Its Members Cresskil, NJ: Hampton. Yiannakis, Diana Evans,. 1981. "The Grateful Electorate: Casework and Congressional
Elections." American Journal of Political Science. 25(3): 568 - 580.
27
Table 1: Difference of Means for Earmarks and Grants: Party, Vulnerability, Reelection
Dems GOP St.Err. t-
ratio prob value Earmark dol. 2,355,386,424 1,596,967,118 2,000,160,788 -0.38 0.7058 Earmark ct. 36.17 29.27 8.82 -0.78 0.4373 Grant dol. 87,378,469 328,336,600 319,943,565 0.75 0.4541 Grant ct. 32.33 32.30 14.92 -0.00 0.9981
Safe Unsafe St.Err. t-
ratio prob value Earmark dol. 2,297,684,883 1,541,575,161 1,991,205,151 -0.30 0.7054 Earmark ct. 32.54 32.16 8.83 -0.04 0.9652 Grant dol. 394,782,129 29,763,555 316,678,647 -1.15 0.2533 Grant ct. 40.0 23.9 14.72 -1.09 0.2781
Reelected Defeated St. Err. t-
ratio prob value Earmark dol. 1,378,562,226 6,719,377,495 3,187,111,567 1.68 0.0986 Earmark ct. 33.72 20.71 14.32 -0.91 0.3673 Grant dol. 243,787,872 20,362,277 521,656,836 -0.43 0.6698 Grant ct. 33.80 19.57 24.18 -0.59 0.5583
28
Figure 1. Congressional Credit Claiming for Earmarks: Dollar Values by Month, 2005-06
$0
$20,000,000
$40,000,000
$60,000,000
$80,000,000
$100,000,000
$120,000,000
$140,000,000
$160,000,000
$180,000,000
$200,000,000
2005
.01
2005
.02
2005
.03
2005
.04
2005
.05
2005
.06
2005
.07
2005
.08
2005
.09
2005
.10
2005
.11
2005
.12
2006
.01
2006
.02
2006
.03
2006
.04
2006
.05
2006
.06
2006
.07
2006
.08
2006
.09
2006
.10
2006
.11
Year and Month
3rd QuartileMedian1st Quartile
Figure 2. Congressional Credit Claiming for Grants: Dollar Values by Month, 2005-06
$0
$5,000,000
$10,000,000
$15,000,000
$20,000,000
$25,000,000
2005
.01
2005
.02
2005
.03
2005
.04
2005
.05
2005
.06
2005
.07
2005
.08
2005
.09
2005
.10
2005
.11
2005
.12
2006
.01
2006
.02
2006
.03
2006
.04
2006
.05
2006
.06
2006
.07
2006
.08
2006
.09
2006
.10
2006
.11
2006
.12
Year and Month
3rd QuartileMedian1st Quartile
29
Figure 3. Congressional Credit Claiming for Earmarks: Number Claimed by Month, 2005-06
0
2
4
6
8
10
12
14
16
1820
05.0
1
2005
.02
2005
.03
2005
.04
2005
.05
2005
.06
2005
.07
2005
.08
2005
.09
2005
.10
2005
.11
2005
.12
2006
.01
2006
.02
2006
.03
2006
.04
2006
.05
2006
.06
2006
.07
2006
.08
2006
.09
2006
.10
2006
.11
2006
.12
Year and Month
3rd QuartileMedian1st Quartile
Figure 4. Congressional Credit Claiming for Grants: Number Claimed by Month, 2005-06
0
2
4
6
8
10
12
14
16
18
2005
.01
2005
.02
2005
.03
2005
.04
2005
.05
2005
.06
2005
.07
2005
.08
2005
.09
2005
.10
2005
.11
2005
.12
2006
.01
2006
.02
2006
.03
2006
.04
2006
.05
2006
.06
2006
.07
2006
.08
2006
.09
2006
.10
2006
.11
2006
.12
Year and Month
3rd QuartileMedian1st Quartile
30
Table 2a
Logit Estimates for Incumbent Vote Choice: Democratic Incumbents, Number of Projects
Variable Coeff. Std. Err Z Prob. Approval rating -0.982 0.190 -5.16 0.000 House member seniority -0.018 0.016 -1.12 0.264 GOP voter -4.342 0.525 -8.26 0.000 Independent or undecided -0.853 0.379 -2.25 0.024 Mismatched 2.090 0.529 3.95 0.000 Credit Claim earmarks # -0.010 0.007 -1.58 0.115 Credit Claim grants # 0.003 0.003 1.08 0.278 Interest group member 0.002 0.230 0.01 0.992 Independent/Undecided x credit claim earmarks # 0.012 0.005 2.21 0.027 Independent/Undecided x credit claim grants # -0.005 0.002 -2.24 0.025 Mismatched voter x credit claim earmarks # -0.012 0.010 -1.28 0.201 Mismatched voter x credit claim grants # 0.001 0.003 0.28 0.780 GOP voter x credit claim earmarks # 0.024 0.008 3.11 0.002 GOP voter x credit claim grants # -0.008 0.002 -3.16 0.002 Interest group member x credit claim earmarks # 0.004 0.009 0.47 0.640 Interest group member x credit claim grants # -0.001 0.004 -0.25 0.803 Constant 5.32 0.479 11.12 0.000 N 1628 Pseudo R-square .557
31
Table 2b
Logit Estimates for Incumbent Vote Choice: Republican Incumbents, Number of Projects
Variable Coeff. Std. Err Z Prob. Approval rating -1.39 0.07 -20.66 0.00 House member seniority 0.00 0.02 0.07 0.94 Democratic voter -2.89 0.28 -10.17 0.00 Independent or undecided -1.10 0.37 -2.99 0.00 Mismatched -0.23 0.28 -0.82 0.41 Credit Claim earmarks # 0.01 0.00 1.43 0.15 Credit Claim grants # -0.01 0.00 -7.39 0.00 Interest group member -0.18 0.21 -0.90 0.37 Independent/Undecided x credit claim earmarks # -0.001 0.01 -0.17 0.86 Independent/Undecided x credit claim grants # 0.01 0.00 3.15 0.00 Mismatched voter x credit claim earmarks # -0.01 0.01 -0.89 0.37 Mismatched voter x credit claim grants # 0.01 0.00 4.14 0.00 Democratic voter x credit claim earmarks # -0.0001 0.01 -0.02 0.98 Democratic voter x credit claim grants # 0.00 0.00 0.36 0.72 Interest group member x credit claim earmarks # 0.01 0.01 0.92 0.36 Interest group member x credit claim grants # 0.00 0.00 1.71 0.09 Constant 5.69 0.37 15.17 0.00 N 2212 Pseudo R-square .627
32
Table 2c
Logit Estimates for Incumbent Vote Choice: Democratic Incumbents, Value of Projects
Variable Coeff. Std. Err Z Prob. Approval rating -1.05 0.15 -6.98 0.00 House member seniority -0.02 0.01 -1.58 0.11 GOP voter -8.70 2.23 -3.91 0.00 Independent or undecided -0.43 1.50 -0.29 0.77 Mismatched 2.23 2.47 0.90 0.37 Credit Claim earmarks $ -0.15 0.07 -2.24 0.03 Credit Claim grants $ 0.04 0.04 1.01 0.31 Interest group member -0.91 0.86 -1.06 0.29 Independent/Undecided x credit claim earmarks $ 0.01 0.09 0.60 0.95 Independent/Undecided x credit claim grants $ -0.01 0.04 -0.21 0.84 Mismatched voter x credit claim earmarks $ -0.003 0.17 -0.02 0.99 Mismatched voter x credit claim grants $ -0.05 0.09 .60 0.55 GOP voter x credit claim earmarks $ 0.37 0.14 2.59 0.01 GOP voter x credit claim grants $ -0.12 0.07 -1.76 0..08 Interest group member x credit claim earmarks $ 0.03 0.05 .49 0.63 Interest group member x credit claim grants $ .04 .02 1.71 0.09 Constant 7.54 1.02 7.39 0.00 N 1628 Pseudo R-square .560
33
Table 2d
Logit Estimates for Incumbent Vote Choice: Republican Incumbents, Value of Projects
Variable Coeff. Std. Err Z Prob. Approval rating -1.37 0.07 -19.89 0.00 House member seniority -0.01 0.02 -0.48 0.63 Democratic voter -2.23 0.53 -4.24 0.00 Independent or undecided -1.25 0.94 -1.33 0.18 Mismatched -0.01 0.45 -0.02 0.98 Credit Claim earmarks $ -0.02 0.02 -1.21 0.23 Credit Claim grants $ 0.03 0.02 2.00 0.05 Interest group member -0.09 0.50 -0.17 0.86 Independent/Undecided x credit claim earmarks $ 0.05 0.04 1.44 0.15 Independent/Undecided x credit claim grants $ -0.02 0.04 -0.49 0.62 Mismatched voter x credit claim earmarks $ -0.01 0.02 -0.35 0.73 Mismatched voter x credit claim grants $ 0.00 0.03 0.10 0.92 Democratic voter x credit claim earmarks $ -0.004 0.03 -0.13 0.90 Democratic voter x credit claim grants $ -0.04 0.02 -1.77 0.08 Interest group member x credit claim earmarks $ 0.01 0.02 0.56 0.57 Interest group member x credit claim grants $ -0.003 0.02 -0.13 0.90 Constant 5.48 0.47 11.64 0.00 N 2212 Pseudo R-square .623
34
Table 3: Summary of Findings
Model A
Dem Model B
Rep Model C
Dem Model D
Rep Approval rating - - - - House member seniority GOP or Democratic voter - - - - Independent or undecided - - Mismatched - Credit Claim earmarks # Credit Claim grants # - Credit Claim earmarks $ - Credit Claim grants $ + Interest group member Independent/Undecided x credit claim earmarks # + Independent/Undecided x credit claim grants # - + Mismatched voter x credit claim earmarks # Mismatched voter x credit claim grants # + GOP or Democratic voter x credit claim earmarks # + GOP Democratic voter x credit claim grants # - Interest group member x credit claim earmarks # Interest group member x credit claim grants # + Independent/Undecided x credit claim earmarks $ Independent/Undecided x credit claim grants $ Mismatched voter x credit claim earmarks $ Mismatched voter x credit claim grants $ GOP or Democratic voter x credit claim earmarks $ - GOP or Democratic voter x credit claim grants $ + - Interest group member x credit claim earmarks $ Interest group member x credit claim grants $ +


![Pandering and pork-barrel politics · pork / =∗ >/ (∗)+ >(=∗ ∗= =, ()= < ≥ ()+≥(. / /. / ∗ ∗ ()= ⎧ ⎪⎨ ⎪⎩ ()>) ()∈ ) (∗,)> . ≡ /)]](https://img.pdfslide.us/doc/110x75/5f953f35c33d70257c62d34e/pandering-and-pork-barrel-politics-pork-a-a-a-a-.jpg)